mapping of summer agricultural crops in … of summer agricultural crops in the alto paraguai basin...
TRANSCRIPT

MAPPING OF SUMMER AGRICULTURAL CROPS IN THE ALTOPARAGUAI BASIN THROUGH EVI/MODIS TIME SERIES
Clóvis CECHIM JÚNIOR1
João Francisco Gonçalves ANTUNES2
Jerry Adriani JOHANN3
Júlio César Dalla Mora ESQUERDO4
Abstract
The main land use and land cover (LULC) changes that a given area passes overthe time can be evaluated by using spatial-temporal analysis of satellites images. Then,it is possible to identify the LULC changes, as well as the main causes of environmentalimpacts. The objective of this paper was to analyze the LULC changes of the mainagricultural lands cultivated in the Alto Paraguai Basin (BAP). This paper focused on thesummer crops (soybean and corn) and the analysis of agricultural expansion. The results,considering a16-year comparison, showed an increase of 40.60% in the expansion ofagricultural areas. The evaluation of the accuracy showed the efficiency of the methodologyof agricultural mapping, presenting a Kappa Index of 0.85 for the 2000/2001 and 0.86for the 2015/2016 crop seasons.
Key words: Remote sensing. Image processing. Time series. River basin.
Resumo
Mapeamento de culturas agrícolas de verão na Bacia do Alto Paraguaipor meio de séries temporais de EVI/MODIS
As principais alterações do uso e cobertura da terra que uma determinada áreapassa ao longo do tempo podem ser avaliadas por meio de análises espaço-temporaisde imagens de satélites. Com isto, é possível identificar alterações no uso e coberturada terra, bem como os principais causadores de impactos ambientais. O objetivo destetrabalho foi analisar as alterações do uso e cobertura da terra das principais áreasagrícolas cultivadas na Bacia do Alto Paraguai (BAP), sendo o foco deste trabalho asculturas de verão (soja e milho), tendo como finalidade analisar a expansão agrícola.Foram analisados dois anos-safras num período de 16 anos e os resultados mostraramum aumento de 40,6% da participação da agricultura anual na BAP. A avaliação daacurácia mostrou a eficiência da metodologia de mapeamento da agricultura,apresentando Índice Kappa de 0,85 no ano-safra 2000/2001 e 0,86 no ano-safra 2015/2016.
Palavras-chave: Sensoriamento remoto. Processamento de imagens. Sériestemporais. Bacia hidrográfica.
1 Universidade Estadual do Oeste do Paraná - UNIOESTE, Mestre, R. Universitária, 2069 - CaixaPostal 711, 85819-110 - Cascavel - PR, Brasil. E-mail: [email protected]
2 Embrapa Informática Agropecuária, Pesquisador, Av. André Tosello, 209 - Caixa Postal 6041,13083-886 - Campinas - SP, Brasil. E-mail: [email protected]
3 Universidade Estadual do Oeste do Paraná - UNIOESTE, Professor, R. Universitária, 2069 -Caixa Postal 711, 85819-110 - Cascavel - PR, Brasil. E-mail: [email protected]
4 Embrapa Informática Agropecuária, Pesquisador, Av. André Tosello, 209 - Caixa Postal 6041,13083-886 - Campinas - SP, Brasil. E-mail: [email protected]
GEOGRAFIA, Rio Claro, v. 42, n. 3, Especial - GeoPantanal 6, p. 129-143, set./dez. 2017

130 GEOGRAFIAMapping of summer agricultural crops in the Alto Paraguai
Basin through EVI/MODIS time series
INTRODUCTION
The states of Mato Grosso and Mato Grosso do Sul encompass the Alto ParaguaiBasin (BAP), where the Pantanal is located, one of the most important and mostconserved biomes in Brazil. The Pantanal has low aptitude for agricultural use, but itspreservation depends on the type of land use and land cover (LULC) in the river basin(LIMA et al., 2009).
The states of Mato Grosso and Mato Grosso do Sul show great importance in thenational scenario due to their agricultural and livestock aptitude. Due to Brazil�s territorialextension, Brazil has agricultural areas for a greater agricultural expansion, being oneof them favorable for the production of biofuels (GARDINI, 2007).
The report produced by the Food and Agriculture Organization of the UnitedNations (FAO), exemplifies the vision of land use in the Cerrado region of the BAP. Inthe scenario addressed, Brazil has increasingly benefited from low food productioncosts for livestock farming and is likely to remain a major producer of raw materials.The combination of land abundance and recent advances in infrastructure have beenconverting formerly remote areas, such as the state of Mato Grosso and the Cerrado,in the central zone of the country. These two regions have the lowest soybean andcorn production costs (FAO, 2009).
However, the demand for new agricultural areas should lead to increased pressureon natural resources. The search for new arable land and even changes in the landuse must be made within a sustainable concept of development in order not to aggravateeven more the environmental imbalances of anthropic origin (LIMA et al., 2009).
The Pantanal and its surroundings are characterized by a rich biodiversity, whichfaces serious threats with the expansion of the agricultural frontier (IRIGARAY et al.,2011), being classified as the most threatened savannah in the planet (MITTERMEIERet al., 2004).
The change in land use is associated with the expansion of extensive livestockand high grain yield. In the BAP, the slaughterhouse industries intensified theirperformance, bringing the concept of agribusiness to the new economic contributionof the state of Mato Grosso (IRIGARAY et al., 2011). In Mato Grosso do Sul, mainly inthe municipality of São Gabriel do Oeste, between 1984 and 2013, there was a relativeincrease of 25 to 30% in grain production (soybean and corn), 24% in pasture and adrop of 29% considering the native forest (BULLER et al., 2015, 2016).
Over the last few years, the Brazilian Pantanal region has undergonetransformations that, from orbital remote sensing data, can be quantified due to thedimensions of the areas covered by high temporal and low spatial resolution sensors,which images are distributed free of charge.
One of the image processing techniques used in land use change analysis andagricultural monitoring is the calculation of vegetation indexes, which can be derivedfrom the MODIS (Moderate Resolution Imaging Spectroradiometer) sensor. Its highperiodicity allows to analyze spatially and temporally the evolution of agriculturalareas, as well as to carry out mappings and estimates of areas used for agriculture(JOHANN et al., 2012; COUTINHO et al., 2012; ARVOR et al., 2012; BROWN et al.,2013; ALVES et al., 2014; SOUZA et al., 2015; GRZEGOZEWSKI et al., 2016).
In order to verify the land use changes in agricultural areas, it was adopted themethodology of summer crops mapping proposed by Johann et al. (2012) in the stateof Paraná. The proposed method uses the MODIS data, taking into account a period ofmaximum and minimum vegetative vigor in time-series of Enhanced Vegetation Index(EVI) images, from the analysis of sowing dates, vegetative peak dates and harvestof crop areas.
131Cechim Júnior, C. / Antunes, J. F. G. /Johann, J. A. / Esquerdo, J. C. D. M.v. 42, n. 3, set./dez. 2017
In this context, the aim of this study was to analyze the temporal dynamics ofthe main cultivated annual crops (soybean and corn) in the BAP by mapping andestimates of cultivated area from EVI/MODIS images between the 2000/2001 and2015/2016 crop seasons.
MATERIALS AND METHODS
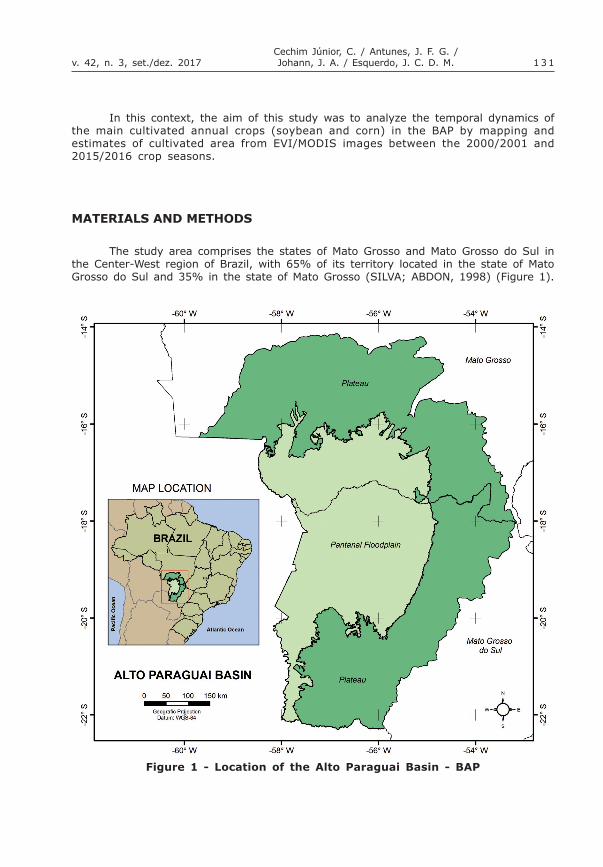
The study area comprises the states of Mato Grosso and Mato Grosso do Sul inthe Center-West region of Brazil, with 65% of its territory located in the state of MatoGrosso do Sul and 35% in the state of Mato Grosso (SILVA; ABDON, 1998) (Figure 1).
Figure 1 - Location of the Alto Paraguai Basin - BAP

132 GEOGRAFIAMapping of summer agricultural crops in the Alto Paraguai
Basin through EVI/MODIS time series
The time-series of vegetation indexes was derived from the MODIS sensor,onboard the TERRA satellite. The images were obtained from the MODIS ProductsDatabase, a repository available by the Brazilian Agricultural Research Corporation(Embrapa) (ESQUERDO et al., 2010).
Gamon et al. (1995) emphasize that the NDVI (Normalized Difference VegetationIndex), proposed by Rouse et al. (1973), may show saturation in the period of maximumvegetative development of agricultural crops. This makes it insensitive to the increaseof the vegetal biomass, even when there is increase of the density of the crop canopy.In this way, we used the EVI proposed by Huete et al. (1997) because it is lesssusceptible to saturation and more sensitive to structure variation, canopy architectureand plant aspect (HUETE et al., 2002).
The 37 images 16-day compositions EVI of each crop season (2000/2001 and2015/2016) were mosaics and clipped to the BAP. Then, these mosaics of images fromdifferent dates were stacked, resulting in a 3D cube of EVI images, where the �x� and�y� axes show the geographic coordinates and the �z� axis the temporal data (ABADEet al., 2015). This allowed the generation of the spectral-temporal profiles of EVIthroughout each crop season.
After that, the Flat Bottom Smoother filter (WARDLOW et al., 2006) was appliedto this cube of EVI images (WARDLOW et al., 2006) in order to filter cloud noise, asshown in the EVI temporal profile (Figure 2) obtained from a field with agriculturalculture, when the beginning of crop development was found on November 1st, 2015and the end on March 5th, 2016. The average temporal profile in the watershed indicatesthat the sowing of the summer agricultural crops starts in August and can be extendeduntil November, with a vegetative peak having occurred between November/2015 andMarch/2016.
Figure 2 - EVI temporal profile of agricultural crops in the 2015/2016crop season enhanced by Flat Bottom Smoother filtration
To define the range of images used to generate the minimum and maximumEVI compositions in the period of study, based on Johann et al. (2012), the VegetationTemporal Analysis System (SATVeg), developed by Embrapa, was used. It consists ina Web tool that allows to visualize and to obtain spectral-temporal data of vegetationindexes from MODIS images (EMBRAPA INFORMÁTICA AGROPECUÁRIA, 2015).

133Cechim Júnior, C. / Antunes, J. F. G. /Johann, J. A. / Esquerdo, J. C. D. M.v. 42, n. 3, set./dez. 2017
Agricultural crop plots distributed throughout the BAP (Figure 3) were selected todefine the minimum EVI values, between 13/08/year1 and 17/11/year1, and themaximum EVI values, between 01/11/year1 and 22/03/year2 (Figure 2).
Johann et al. (2012) proposed this procedure of agricultural crops mapping,aiming to contemplate the variability of sowing season in the different regions of thestate of Paraná. Thus, the minimum EVI period (lower EVI values among the imagesused) contemplates the pre-planting phase and the initial development of agriculturalcrops within the BAP. The maximum EVI period (highest EVI values among the imagesused) considers the maximum vegetative development of the agricultural crops orvegetative peak (final development, flowering and production formation) within theBAP area. This stage was operationalized through an image data extraction systemdeveloped in IDL (Interactive Data Language) (ESQUERDO et al., 2011).
The ENVI program was used to generate an RGB composition, following theproposition made by Johann et al. (2012). Thus, the maximum EVI image of each cropseason was set in the R (red) channel and the minimum EVI image in the G (green)and B (blue) channels, generating a colored composition, where red areas (Figure 4)represent the agricultural crops in the BAP, and the other colors refer to other targets(Figure 4).
The RGB composition with the original EVI values was then converted from 16into 8 bits, with scales gray levels (GL) values ranging from 0 to 255, in order tonormalize them for each crop season (JOHANN et al., 2012). In order to separate andto extract the red areas (Figure 4), a system developed in IDL language was used toobtain data of this RGB composition in gray levels (GL). The cut-off thresholds (0 to255 GL) for each of the RGB channels and the studied harvest years were determinedby simulation. Thus, the pixels defined according to these thresholds were extracted,resulting in the mapping of agricultural crops in BAP.
Figure 3 - Acquisition of MODIS pixels to evaluate the sowing and harvestperiod from the temporal profile of agricultural crops using SATVeg

134 GEOGRAFIAMapping of summer agricultural crops in the Alto Paraguai
Basin through EVI/MODIS time series
As a post-classification procedure, the removal of isolated pixels was carriedout. Preliminarily, the map images were converted from raster into vector format,using the Albers projection. Then, all the polygons were selected and dismemberedindependently. Thus, for each polygon, the area was determined and later, all isolatedpolygons with values smaller than 6.25 ha (1 pixel) were excluded.
To verify the mapping accuracy, the overall accuracy index (OA), the Kappaconcordance index (KI), omission errors (OE) and inclusion errors (IE) were used(CONGALTON, 1991; Congalton and Green, 1999).
The determination of sample points at a 95% confidence level was done accordingto Barbetta (2007) and 400 points were defined as the minimum sample set to evaluatethe accuracy of the generated maps. As reference data for checking the results of theclassifications, Landsat/TM/OLI images and the EVI temporal profiles of sample wereused through the SATVeg.
The last stage consisted in the extraction of the total mapped area of theagricultural crops in the BAP, using a routine developed in the IDL language (ESQUERDOet al., 2011). The crop area estimations were compared with the official crop areaobtained from Brazilian Institute of Geography and Statistics (IBGE, 2016). Statisticalindicators, such as the Spearman correlation coefficient (rs), the mean error (ME) [Eq.1] and the Willmott�s refined concordance index (dr) [Eq. 2] (WILLMOTT et al., 2012),
Figure 4 - RGB composition of maximum and minimum EVI images(A) 2000/2001 crop season; (B) 2015/2016 crop season

135Cechim Júnior, C. / Antunes, J. F. G. /Johann, J. A. / Esquerdo, J. C. D. M.v. 42, n. 3, set./dez. 2017
that measures the accuracy of the estimated values in relation to those observed,measuring the dispersion of the correlation around the line 1:1, were used.
(1)
(2)
where: Ei = estimated summer crop area in the municipality; Oi = summer crop areaobserved in the municipalities; = average summer crop area observed in themunicipalities; n = number of municipalities.
RESULTS AND DISCUSSION
For the generation of the 2000/2001 and 2015/2016 crop maps (Figure 5),among the several simulations performed on GL thresholds in the RGB compositionchannels, the best result was found considering thresholds greater than 150 in the Rchannel and less than 140 in the G and B channels.
Figure 5 - Crop maps using MODIS data in BAP(A) 2000/2001 crop season; (B) 2015/2016 crop season

136 GEOGRAFIAMapping of summer agricultural crops in the Alto Paraguai
Basin through EVI/MODIS time series
The results of the spatial distributions of crop lands in BAP showed a greaterpredominance in the Southwest region of the state of Mato Grosso and the centralregion of the state of Mato Grosso do Sul, mainly in the agricultural belt of São Gabrieldo Oeste (BULLER et al., 2015, 2016). Both regions are located on the plateau portionof BAP (Figure 5). Considering the 2000/2001 crop season (Figure 5A), a cultivatedarea of 1,347,393 ha was obtained and for the 2015/2016 crop season (Figure 5B), atotal of 1,894,456 ha, which represented an agricultural expansion of approximately40.6% (Figure 6). Similar results were obtained by Coutinho et al. (2016) in the mappingof annual croplands in the BAP through NDVI/MODIS time-series classification, once agrowth of approximately 40% in grain agriculture with diffusion to other regions of theplateau in the period between 2001 and 2013 was obtained. This expansion is relatedto the growth of Brazilian grain exports as well as the increase of protein production inanimal confinement systems (cattle and swine).
Taking into account the study of WWF-Brazil and SOS Pantanal (2015) on landuse and land cover mapping at BAP, which encompasses annual, perennial and semi-perennial crops, using Landsat/TM, Resource-Sat/LISS III and Landsat/OLI, there wasan increase in the participation of agricultural areas in BAP plateau from 20,164 km2 to21,590 km2 between 2002 and 2008 corroborating with the growth observed in themapping of this study with the MODIS sensor.
The methodology used in this study does not consider perennial and semi-perennial crops (such as sugarcane), since it is designed to map annual crops, mainlysoybean, corn and cotton.
The great advantage of the methodology used here is the low cost, speed andobjectivity, allowing the spatialization of croplands and the knowledge of the temporalevolution of crops in the BAP.

137Cechim Júnior, C. / Antunes, J. F. G. /Johann, J. A. / Esquerdo, J. C. D. M.v. 42, n. 3, set./dez. 2017
The maps accuracy analysis showed a Kappa Index (Table 1) of 0.85 (2000/2001) and 0.86 (2015/2016), which according to the classification proposed by Landisand Koch (1977), indicates an excellent thematic quality (KI ≥ 0.81). Regarding theoverall accuracy, according to FOODY (2002), it is desirable that a classificationachieves success rates higher than 85%, which was obtained in the presented mapsproduced by the RGB method in the BAP, with OA of 92.5% (2000/2001) and 93.0%(2015/2016).
Areas that were not mapped as agricultural crops (Table 1) include forestremnants, scrublands, sugarcane and pasturelands, in addition to other cultivatedcrops that are present on a smaller scale in BAP.
Figure 6 - Expansion of agricultural areas in the BAP betweenthe 2000/2001 and 2015/2016 crop seasons

138 GEOGRAFIAMapping of summer agricultural crops in the Alto Paraguai
Basin through EVI/MODIS time series
The inclusion errors (IE) of 1.7% found for the �agricultural crops� class,considering the 2000/2001 crop season, occurred mainly due to confusions withpasturelands, followed by areas of forest remnants and scrublands. This suggests thatthe methodology misclassifies these areas as croplands. The same classification errorwas found for the 2015/2016 crop season with IE of 1.1% (Table 1). Considering thesamples drawn on the �other targets� class, the IE were approximately 12% for thetwo studied crop seasons (Table 1). These errors are represented by croplands, whichare not mapped by this methodology; however, most of these classification errorsinclude sugarcane croplands.
The omission errors (OE) found for the �agricultural crops� class were 13.5%and 13.0%, respectively, for the 2000/2001 and 2015/2016 crop seasons (Table 1).This corroborates with Coutinho et al. (2012) in the mapping of the annual agriculturalactivity carried out in the state of Mato Grosso do Sul. These authors verified that thepixel contamination, caused by different land use and land cover classes, promotes amixture of the spectral values, which consequently mischaracterizes the pattern ofNDVI temporal profile in annual croplands.
Another factor that can contribute to increase the OE refers to the occurrence ofsmall croplands, with areas bellow the MODIS pixel size of 6.25 ha (250 x 250 m),which, according to Wardlow and Egbert (2008), makes difficult the selection of pixelsin the croplands boundaries during the classification process. Similar results were alsofound in the mapping of summer crop areas in the state of Paraná, compared toofficial statistical data (JOHANN et al., 2012; SOUZA et al., 2015; GRZEGOZEWSKI etal., 2016).
These are the main problems found concerning the mapping methods based onMODIS time-series data, especially in regions where the land structure and the spatialdistribution pattern of agricultural activities define a mosaic occupation veryheterogeneous (COUTINHO et al., 2012).
Considering the �other target� class, the OE were only 1.5% (2000/2001 cropseason) and 1.0% (2015/2016), what means that the confusion was low for non-agricultural lands.
The spectral confusion between agricultural crops, pastures and forest remnantscan be attributed to the similarity of the temporal profile, since the BAP vegetation is
Table 1 - Confusion matrix for determination of accuracy rates of theagricultural crops mapping in the BAP for 2000/2001
and 2015/2016 crop seasons
OA = Overall Accuracy; KI = Kappa Index.
139Cechim Júnior, C. / Antunes, J. F. G. /Johann, J. A. / Esquerdo, J. C. D. M.v. 42, n. 3, set./dez. 2017
composed by a great variety of plants that compose landscapes of cerrado and forest,formations of high complexity of endemic species (GOODLAND; FERRI, 1979).
Based on the accuracy evaluation, it was verified that in 2000/2001, someareas that were occupied by pastures in 2015/2016 began to be occupied by agriculturalcrops in greater proportion (soybean and corn), as observed from the analysis donewith Landsat images as auxiliary data. This finding corroborates with previous resultsof land use and land cover changes in BAP between 2002 and 2008 which increased inthe plateau, with the conversion of 1.019 km2 of pasturelands to croplands (WWF-Brazil et al., 2009).
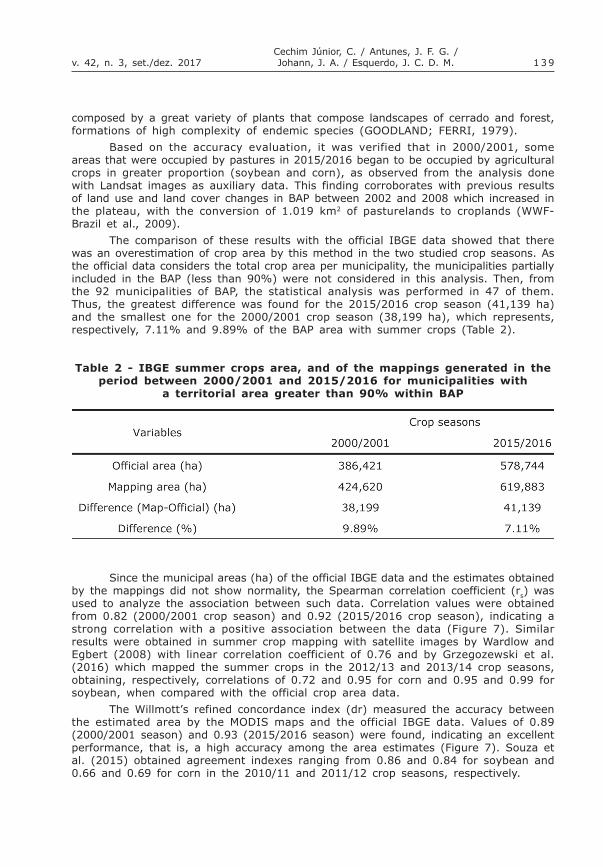
The comparison of these results with the official IBGE data showed that therewas an overestimation of crop area by this method in the two studied crop seasons. Asthe official data considers the total crop area per municipality, the municipalities partiallyincluded in the BAP (less than 90%) were not considered in this analysis. Then, fromthe 92 municipalities of BAP, the statistical analysis was performed in 47 of them.Thus, the greatest difference was found for the 2015/2016 crop season (41,139 ha)and the smallest one for the 2000/2001 crop season (38,199 ha), which represents,respectively, 7.11% and 9.89% of the BAP area with summer crops (Table 2).
Since the municipal areas (ha) of the official IBGE data and the estimates obtainedby the mappings did not show normality, the Spearman correlation coefficient (rs) wasused to analyze the association between such data. Correlation values were obtainedfrom 0.82 (2000/2001 crop season) and 0.92 (2015/2016 crop season), indicating astrong correlation with a positive association between the data (Figure 7). Similarresults were obtained in summer crop mapping with satellite images by Wardlow andEgbert (2008) with linear correlation coefficient of 0.76 and by Grzegozewski et al.(2016) which mapped the summer crops in the 2012/13 and 2013/14 crop seasons,obtaining, respectively, correlations of 0.72 and 0.95 for corn and 0.95 and 0.99 forsoybean, when compared with the official crop area data.
The Willmott�s refined concordance index (dr) measured the accuracy betweenthe estimated area by the MODIS maps and the official IBGE data. Values of 0.89(2000/2001 season) and 0.93 (2015/2016 season) were found, indicating an excellentperformance, that is, a high accuracy among the area estimates (Figure 7). Souza etal. (2015) obtained agreement indexes ranging from 0.86 and 0.84 for soybean and0.66 and 0.69 for corn in the 2010/11 and 2011/12 crop seasons, respectively.
Table 2 - IBGE summer crops area, and of the mappings generated in theperiod between 2000/2001 and 2015/2016 for municipalities with
a territorial area greater than 90% within BAP

140 GEOGRAFIAMapping of summer agricultural crops in the Alto Paraguai
Basin through EVI/MODIS time series
The data analysis compared by the statistical metric (SM) indicated that theestimate of cultivated area obtained by the mapping was overestimated between 812.75ha (2000/2001) and 875.29 ha (2015/2016) (Figure 7). Thus, there was a trend ofoverestimation of summer crops cultivated area in the maps when compared to theofficial IBGE data. Grzegozewski et al. (2016) observed the same for soybean andcorn crops. This fact may be related to soybean cultivation in larger areas, while corncultivation may occur in areas smaller than the MODIS pixel size. This can also happenfor rice and cotton crops, which are present in a lesser extent in BAP (IBGE, 2016).
CONCLUSIONS
The use of multitemporal EVI/MODIS spectral data allowed the mapping andestimation of cultivated area of the main summer crops in BAP.
The use of the time-series MODIS vegetation index data in the generation ofminimum and maximum EVI compositions reduced the variability in the planting dates,allowing quickness in the mapping of agricultural areas by the RGB methodology,allowing at the same time the reproduction of the same period of images and cuts forother crop seasons.
Considering the two studied crop seasons, the OE were higher than the IE,which are represented by forest and pasture areas due to the spectral confusion ofthese targets with agricultural crops.
The analysis of the multitemporal evolution in the evaluated period indicatedthat there was a significant expansion of 40.6% in the area of summer agriculturalcrops in the BAP between the first and last season studied.
The use of the adopted methodology has the greatest advantage of being fastand efficient in the estimation of cultivated areas of summer crops, which allows inadvance its determination of the harvesting season, with its proven efficiency bystatistical methods, although the technique can be further improved in the future.
Figure 7 - Relationship between harvested area (ha) of summer cropswith MODIS mapping and the official data of IBGE, (A) 2000/2001
crop seasons; (B) 2015/2016 crop seasons

141Cechim Júnior, C. / Antunes, J. F. G. /Johann, J. A. / Esquerdo, J. C. D. M.v. 42, n. 3, set./dez. 2017
REFERENCES
ABADE, N. A.; JÚNIOR CARVALHO, O. A.; GUIMARÃES, R. F.; OLIVEIRA, S. N.Comparative analysis of MODIS time-series classification using support vector machinesand methods based upon Cerrado-Caatinga Boundary. Remote Sensing, v.7, p.12160-12191, 2015.
ALVES, C. D.; FLORENZANO, T. G.; ALVES, D. S.; PEREIRA, M. N. Mapping land usecover changes in a region of sugarcane expansion using TM and MODI data. RevistaBrasileira de Cartografia, n. 66/2, p. 337-347, 2014.
ARVOR, D.; MEIRELLES, M.; DUBREUIL, V.; BÉGUÉ, A.; SHIMABUKURO, Y. E. Analyzingthe agricultural transition in Mato Grosso, Brazil, using satellite-derived indices. AppliedGeography, v. 32, p.702-713, 2012.
BARBETTA, P. A. Estatística aplicada às ciências sociais. 316 p. Florianópolis:UFSC, 2007.
BROWN, J. C.; KASTENS, J. H.; COUTINHO, A. C.; VICTORIA, D. BISHOP, C. R.Classifying multiyear agricultural land use data from Mato Grosso using time-seriesMODIS vegetation index data. Remote Sensing of Enviroment, v. 130, p.39-50,2013.
BULLER, L. S.; BAYMA-SILVA, G.; ZANETTI, M, R.; ORTEGA, E.; MORAES, A.; GOULART,T.; BERGIER, I. Historical land-use changes in Gabriel do Oeste at the upper Taquaririver basin. The Handbook of Environmental Chemistry, v.5, p. 191-208, 2015.
BULLER, L. S.; BAYMA-SILVA, G.; ORTEGA, E.; BERGIER, I. Soil loss a negativeexternality in the emergy accounting: case study of an agricultural commoditiesmunicipality in the Brazilian Savannah. Journal of Environmental Accounting andManagement, v.4, n. 2, p. 129-147, 2016.
CONGALTON, R. G. A review of assessing the accuracy of classifications of remotelysensed data. Remote Sensing of Environment, v.37, p.35-46, 1991.
CONGALTON, R. G.; GREEN, K. Assessing the accuracy of remotely senseddata: principles and practices. 160 p. Boca Raton: Crc Press, 1999.
COUTINHO, A. C.; ESQUERDO, J. C. D. M.; OLIVEIRA, L. S.; LANZA, D. A. Avaliaçãode metodologia para o mapeamento e monitoramento da agricultura brasileira. In:SIMPÓSIO DE GEOTECNOLOGIA NO PANTANAL, 2012, Bonito. Anais� p. 364-372.Bonito: Embrapa Informática Agropecuária/INPE, 2012.
COUTINHO, A. C.; BISHOP, C.; ESQUERDO, J. C. D. M.; KASTENS, J. H.; BROWN, J. C.Dinâmica da agricultura na Bacia do Alto Paraguai. In: SIMPÓSIO DE GEOTECNOLOGIANO PANTANAL, 2016, Cuiabá. Anais� p. 623-332. Cuiabá: Embrapa InformáticaAgropecuária/INPE, 2016.
EMBRAPA INFORMÁTICA AGROPECUÁRIA. Sistema de Análise Temporal daVegetação (SATVeg). 2015. Disponível em: <https://www.satveg.cnptia.embrapa.br/satveg/login.html>. Acesso em: 10 jun. 2016.
ESQUERDO, J. C. D. M.; ANTUNES, J. F. G.; ANDRADE, J. C. de. Desenvolvimentodo banco de produtos MODIS na Base Estadual Brasileira. (Comunicado Técnico,100) - Campinas: Embrapa Informática Agropecuária, 7 p, 2010.
ESQUERDO, J. C. D. M.; ZULLIO JUNIOR, J.; ANTUNES, J. F. G. Use of NDVI/AVHRRtime series profiles for soybean crop monitoring in Brazil. International Journal ofRemote Sensing, v. 32, p. 3711-3727, 2011.

142 GEOGRAFIAMapping of summer agricultural crops in the Alto Paraguai
Basin through EVI/MODIS time series
FAO - Organización de las Naciones Unidas para la Alimentación y la Agricultura. Elestado mundial de la agricultura y la alimentación. FAO: Roma, 2009. p. 23.Disponível em: <http://www.fao.org/catalog/inter-s.htm>. Acesso em: 3 jul. 2016.
FOODY, G. M. Status of land cover classification accuracy assessment. Remote Sensingof Environment, v. 80, n. 1, p.185-201, 2002.
GAMON, J. A.; FIELD, C. D.; GOULDEN, M. L.; GRIFFIN, K. L.; HARTLEY, A. E.; JOEL,G.; PEÑUELAS, J.; VALENTINI, R. Relationships between NDVI, canopy structure, andphotosynthesis in three Californian vegetation types. Ecological Applications, v. 5,p.28-41, 1995.
GARDINI, A. Novas fronteiras agrícolas da cana. Revista Eletrônica de JornalismoCientifico. [s.l.] 2007. Disponível em: <http://www.comciencia.br/comciencia/handler.php?section=8&edicao=23&id=253>. Acesso em: 03 jul. 2016.
GOODLAND, R. J. A.; FERRI, M. G. Ecologia do Cerrado. São Paulo: USP, 1979. 193p.
GRZEGOZEWSKI, D. M.; JOHANN, J. A.; URIBE-OPAZO, M. A.; MERCANTE, E.;COUTINHO, A. C. Mapping soya bean and corn crops in the State of Paraná, Brazil,using EVI images from the MODIS sensor. International Journal of Remote Sensing,v. 37, n. 6, p. 1257-1275, 2016.
HUETE, A.; DIDAN, K.; MIURA, T.; RODRIGUEZ, E. Overview of the radiometric andbiophysical performance of the MODIS vegetation indices. Remote Sensing ofEnvironment, v. 83, n. 1-2, p. 195-213, 2002.
HUETE, A.; LIU, H. Q.; BATCHILY, K.; LEWEEN, W. A comparison of vegetation indicesover a global set of TM images for EOS-MODIS. Remote Sensing of Environment,n. 59, p. 440-451, 1997.
IBGE - Instituto Brasileiro de Geografia e Estatística. Banco de Dados Agregados:Sistema IBGE de Recuperação Automática - SIDRA. 2016. Disponível em: <http://www.sidra.ibge.gov.br>. Acesso em: 12 dez. 2016.
IRIGARAY, C. T.; SILVA, C. J.; MEDEIROS, H. Q.; GIRARD, P.; FAVA, G. C.; MACIEL, J.C.; NOVAIS SOBRINHO, L. G.; GALLO, R. L. O Pantanal Matogrossense enquantopatrimônio nacional no contexto das mudanças climáticas. In: SILVA, S. T.,CUREAU, S.; LEUZINGER, M. (Org.). Mudança do Clima. Desafios jurídicos,econômicos e socioambientais. São Paulo: Fiuza, 2011.
JOHANN, J. A.; ROCHA, J. V.; DUFT, D. G.; LAMPARELLI, R. A. C. Estimativa de áreascom culturas de verão no Paraná, por meio de imagens multitemporais EVI/MODIS.Pesquisa Agropecuária Brasileira, v. 47, n. 9, p. 1295-1306. 2012.
LANDIS, J. R.; KOCH, G. G. The measurement of observer agreement for categoricaldata. Biometrics, v.33, p. 159-174, 1977.
LIMA, A.; AGUIAR, D. A.; RUDORFF, B. F. T.; SHIMABUKURO, Y. E.; ADAMI, M. Dinâmicaespaço-temporal e caracterização ambiental do cultivo da cana-de-açúcar na BaciaPantaneira. Geografia (Rio Claro), v. 34, n. 1, p. 193-202, 2009.
MITTERMEIER, R. A.; GIL, P. R., HOFFMAN; M., PILGRIM, J.; BROOKS, T.; MITTERMEIER,C. G.; LAMOREUX, J.; FONSECA, G. A. B. Hotspots revisited: earth�s biologicallyrichest and most endangered terrestrial ecoregions. 640 p. Mexico City: CEMEX &Agrupacion Sierra Madre, 2004.
ROUSE, J. W.; HAAS, R. H.; SCHELL, J. A.; DEERING, D. W. Monitoring vegetationsystems in the Great Plains with ERTS. In: EARTH RESOURCES TECHNOLOGY SATELLITESYPOSIUM, v.1., 1973, Washington. Proceedings� Wahington: NASA. v.1, p. 309-317, 1973.

143Cechim Júnior, C. / Antunes, J. F. G. /Johann, J. A. / Esquerdo, J. C. D. M.v. 42, n. 3, set./dez. 2017
SILVA, J. dos S. V. da; ABDON, M. de M. Delimitação do Pantanal brasileiro e suas sub-regiões. Pesquisa Agropecuária Brasileira, Brasília, v. 33, Num. Esp., p. 1703-1711, 1998.
SOUZA, C. H. W.; E. MERCANTE; J. A. JOHANN; R. A. C. LAMPARELLI; M. A. Uribe-Opazo. Mapping and discrimination of soya bean and corn crops using spectro-temporalprofiles of vegetation indices. International Journal of Remote Sensing, v.36,n.7, p. 1809-1824, 2015.
WARDLOW, B. D.; KASTENS, J. H.; Egbert, S. L. Using USDA Crop Progress Data andMODIS Time-Series NDVI for Regional-Scale Evaluation of Greenup Onset Date.Photogrammetric Engineering and Remote Sensing, v. 72, n. 11, p. 1225-1234,2006.
WARDLOW, B. D.; Egbert, S. L. Large-area crop mapping using time-series MODIS250m NDVI data: an assessment for the U.S Central Great Plains. Remote Sensingof Environment, v. 112, p. 1096-1116, 2008.
WILLMOTT, C. J.; ROBERSON, S. M.; MATSUURA, K. A. E. A refined index of modelperformance. International Journal Climatology, v. 32, p. 2088-2094, 2012.
WWF-Brasil; SOS Pantanal. Monitoramento das alterações da cobertura vegetale uso do Solo na Bacia do Alto Paraguai - Porção Brasileira - Período deAnálise: 2012 a 2014. Brasília, 2015.
WWF-Brasil; AVINA Brasil Sul & Pantanal; CI-Brasil; ECOA; Instituto SOS Pantanal.Monitoramento das alterações da cobertura vegetal e uso do Solo na Baciado Alto Paraguai - Porção Brasileira - Período de Análise: 2002 a 2008.Brasília, 2009.
