mapping evapotranspiration and drought at local to...
TRANSCRIPT

Mapping Evapotranspiration and Drought at Local to Continental Scales Using Thermal Remote Sensing
Mapping Evapotranspiration and Drought at Local to Continental Scales Using Thermal Remote Sensing
M.C. Anderson, W.P. KustasUSDA-ARS, Hydrology and Remote SensingLaboratory
J.M NormanUniversity of Wisconsin - Madison
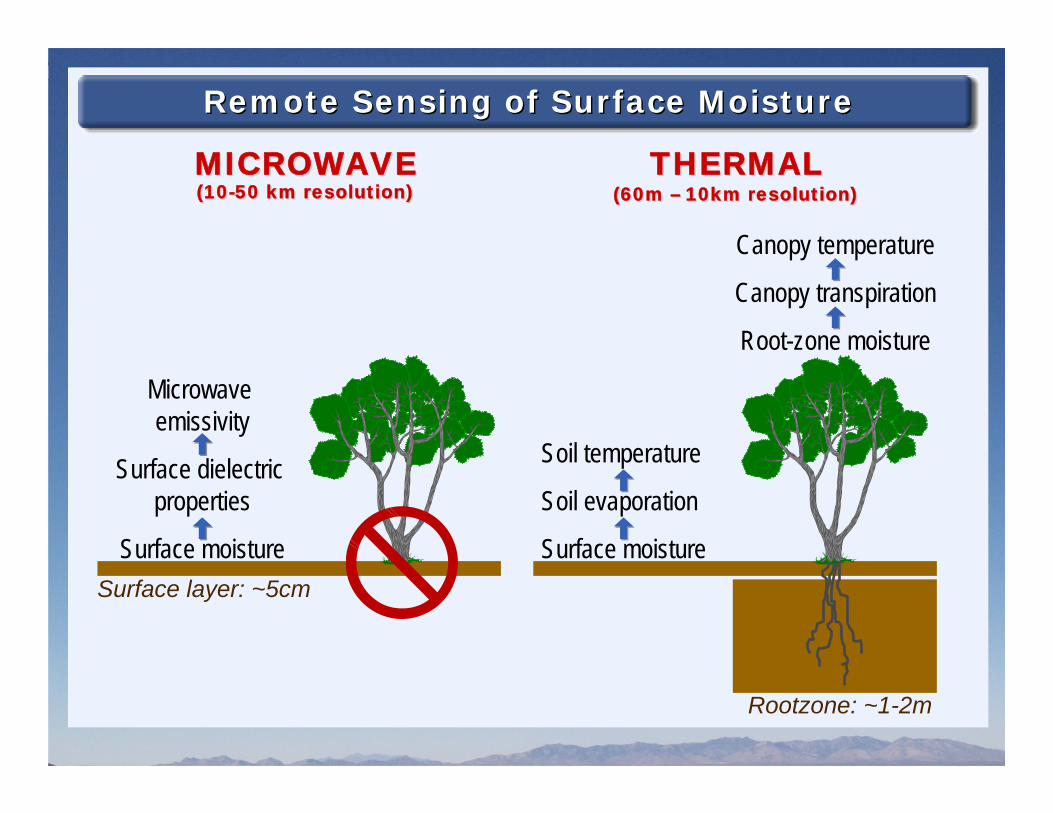
Remote Sensing of Surface MoistureRemote Sensing of Surface Moisture
Microwave emissivity
Surface dielectric properties
Surface moistureSurface layer: ~5cm
MICROWAVEMICROWAVE
Canopy temperature
Canopy transpiration
Root-zone moisture
(10-50 km resolution)(10-50 km resolution)
Soil temperature
Soil evaporation
Surface moisture
THERMALTHERMAL(60m – 10km resolution)(60m – 10km resolution)
Rootzone: ~1-2m

Satellite Thermal Imaging SystemsSatellite Thermal Imaging Systems
ASTERLandsat
Once every 8-16 days
90–120 mFine
VIIRSAVHRRATSR
MODISAVHRRATSR
2-4 times daily1 kmModerate
CrISGOESMSG
AIRSGOESMSG
15 min5-20 kmCoarse
FutureSources
CurrentSources
Temporal Resolution
Spatial Resolution
PixelScale
Table from S. Hook

… evapotranspiration… evapotranspirationAPPLICATIONSAPPLICATIONS
ALEXI – Atmosphere-Land Exchange Inverse ModelALEXI – Atmosphere-Land Exchange Inverse Model
(Anderson et al, 1997)(Anderson et al, 1997)
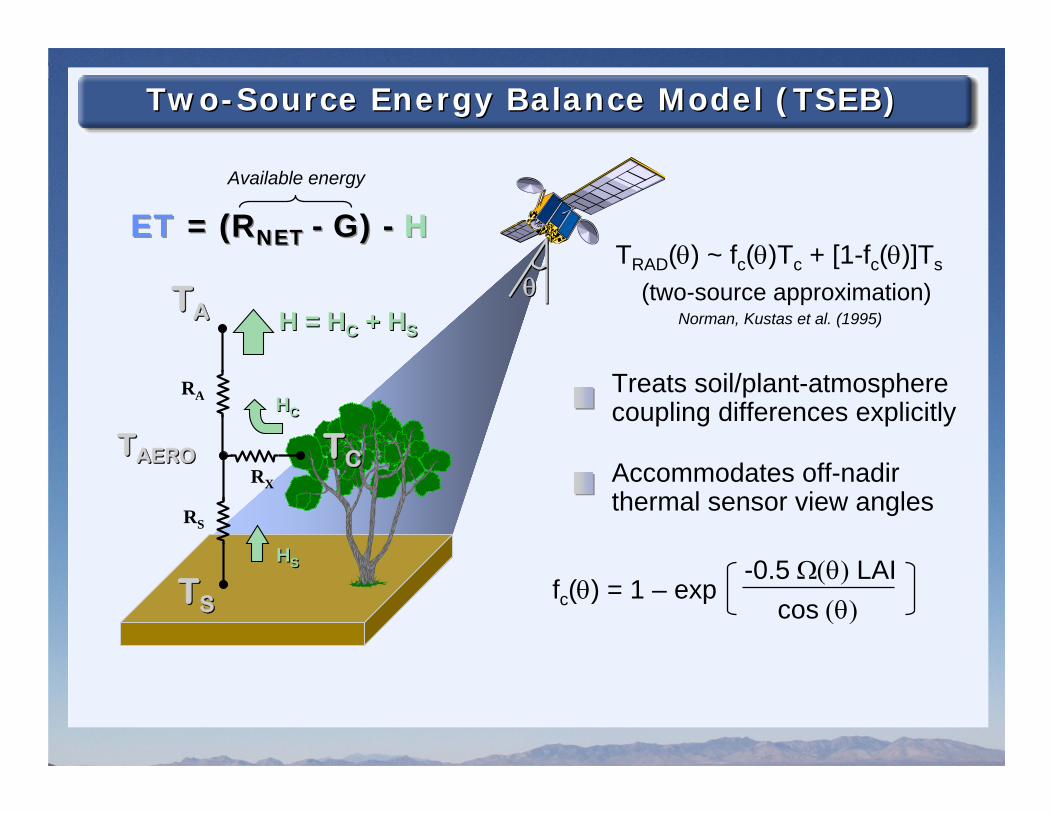
TRAD(θ) ~ fc(θ)Tc + [1-fc(θ)]Ts
(two-source approximation)Norman, Kustas et al. (1995)
Accommodates off-nadirthermal sensor view angles
Treats soil/plant-atmosphere coupling differences explicitly
Two-Source Energy Balance Model (TSEB)Two-Source Energy Balance Model (TSEB)
θθ
HSHS
HCHC
H = HC + HSH = HC + HS
RS
RA
RX
TATA
TCTC
TSTS
TAEROTAERO
fc(θ) = 1 – exp -0.5 Ω(θ) LAI
cos (θ)
ET = (RNET - G) - HET = (RNET - G) - HAvailable energy
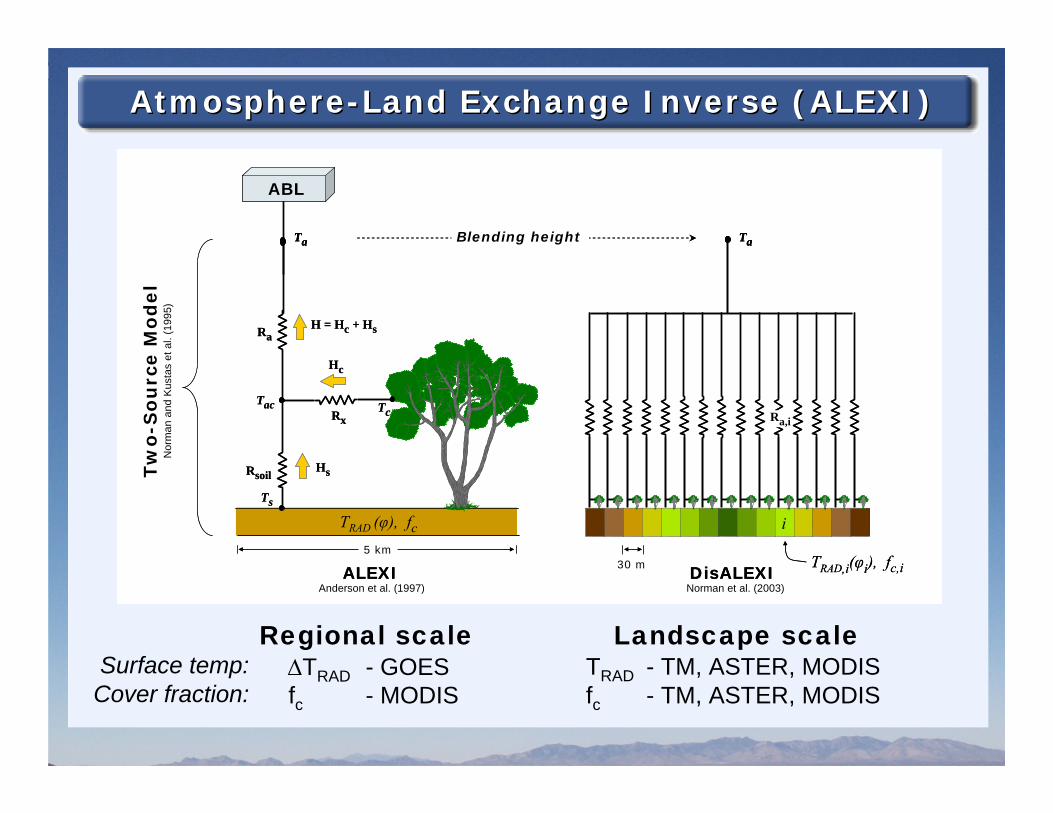
Atmosphere-Land Exchange Inverse (ALEXI)Atmosphere-Land Exchange Inverse (ALEXI)
Regional scaleΔTRAD - GOESfc - MODIS
Landscape scaleTRAD - TM, ASTER, MODISfc - TM, ASTER, MODIS
Rsoil
TcTac
Hs
Ts
RaH = Hc + Hs
Rx
Hc
Ta
ABL
Ta
ALEXI DisALEXI5 km
30 m
TRAD (φ), fc
TRAD,i(φi), fc,i
i
Ra,i
Blending height
Rsoil
TcTac
Hs
Ts
RaH = Hc + Hs
Rx
Hc
TaTa
ABL
Ta Ta
ALEXI DisALEXI5 km
30 m
TRAD (φ), fc
TRAD,i(φi), fc,i
i
Ra,i
Blending height
Surface temp:Cover fraction:
Nor
man
and
Kus
tas
et a
l. (1
995)
Tw
o-S
ou
rce M
od
el
Anderson et al. (1997) Norman et al. (2003)
30
35
40
45
100
200
300
400
500
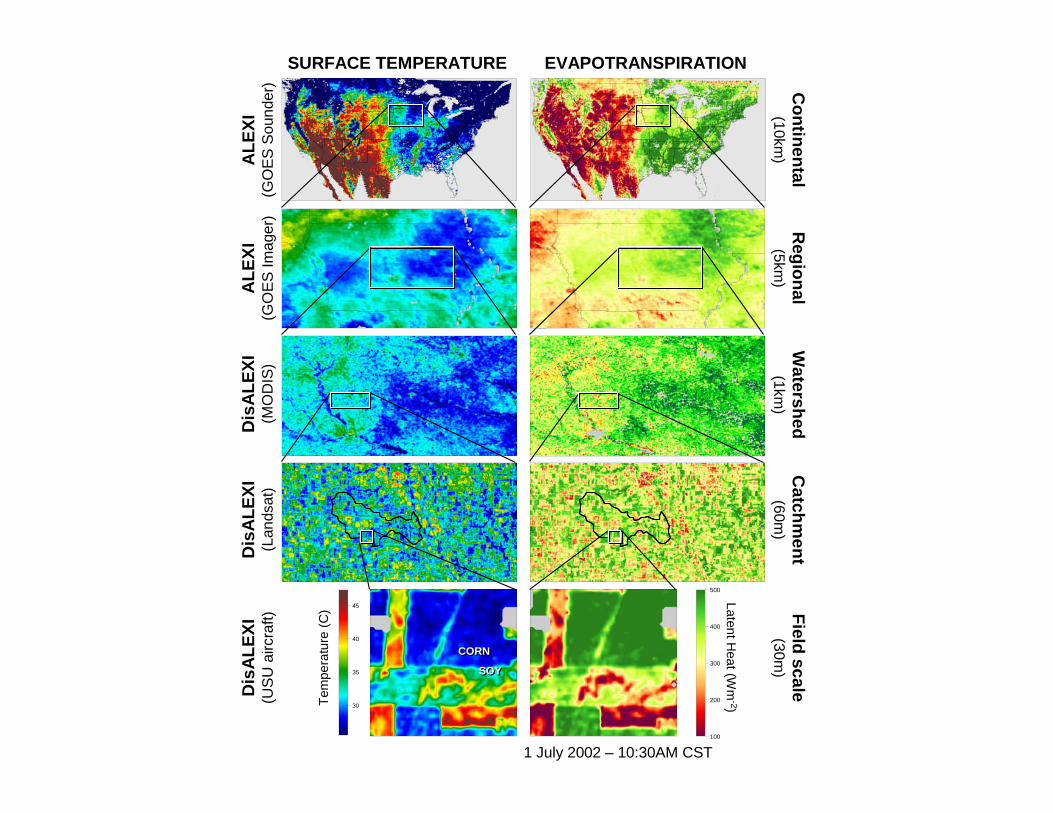
1 July 2002 – 10:30AM CST
Dis
ALE
XI(L
ands
at)
Dis
ALE
XI(U
SU
airc
raft)
Catchm
ent(60m
)Field scale
(30m)
CORNCORN
SOYSOY
SURFACE TEMPERATURE EVAPOTRANSPIRATION
ALE
XI(G
OE
S Im
ager
) Regional(5km
)A
LEXI
(GO
ES S
ound
er) C
ontinental(10km
)
Tem
pera
ture
(C)
Latent Heat (W
m-2)
Dis
ALE
XI(M
OD
IS)
Watershed
(1km)
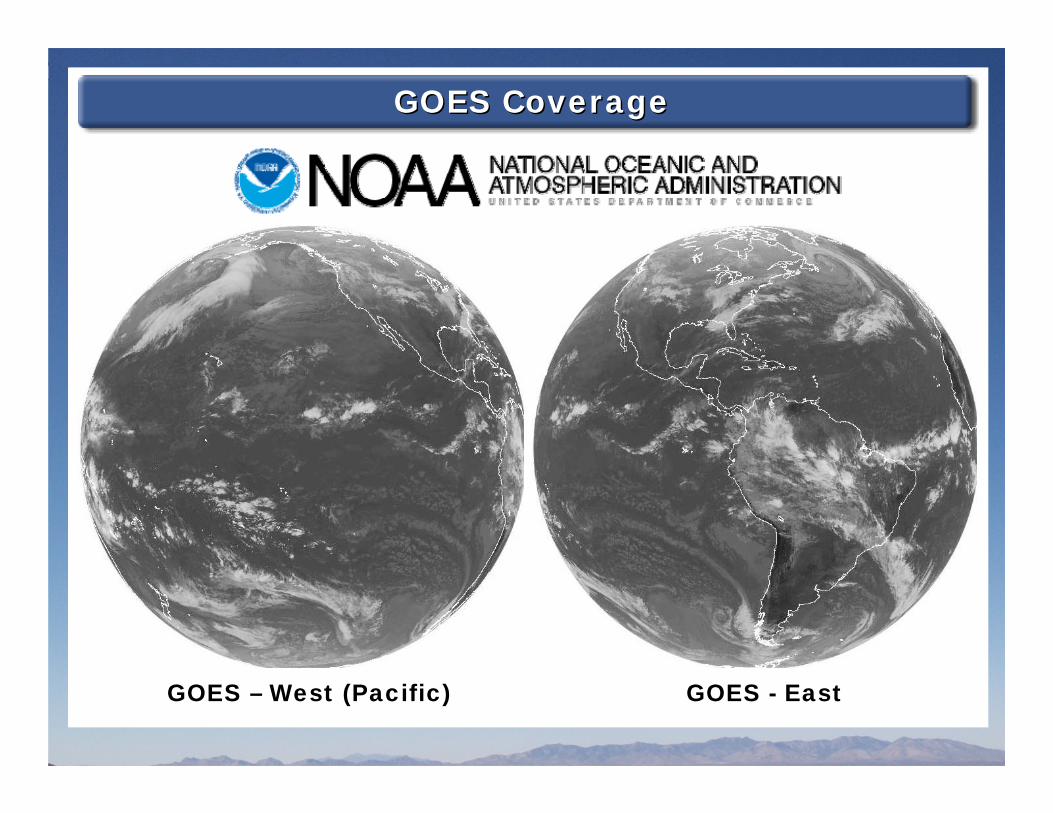
GOES CoverageGOES Coverage
GOES – West (Pacific)
Copyright 2008 EUMETSATCopyright 2008 EUMETSAT
GOES - East
AP
RA
PR
MA
YM
AY
JUN
JUN
JUL
JUL
AU
GA
UG
SE
PS
EP
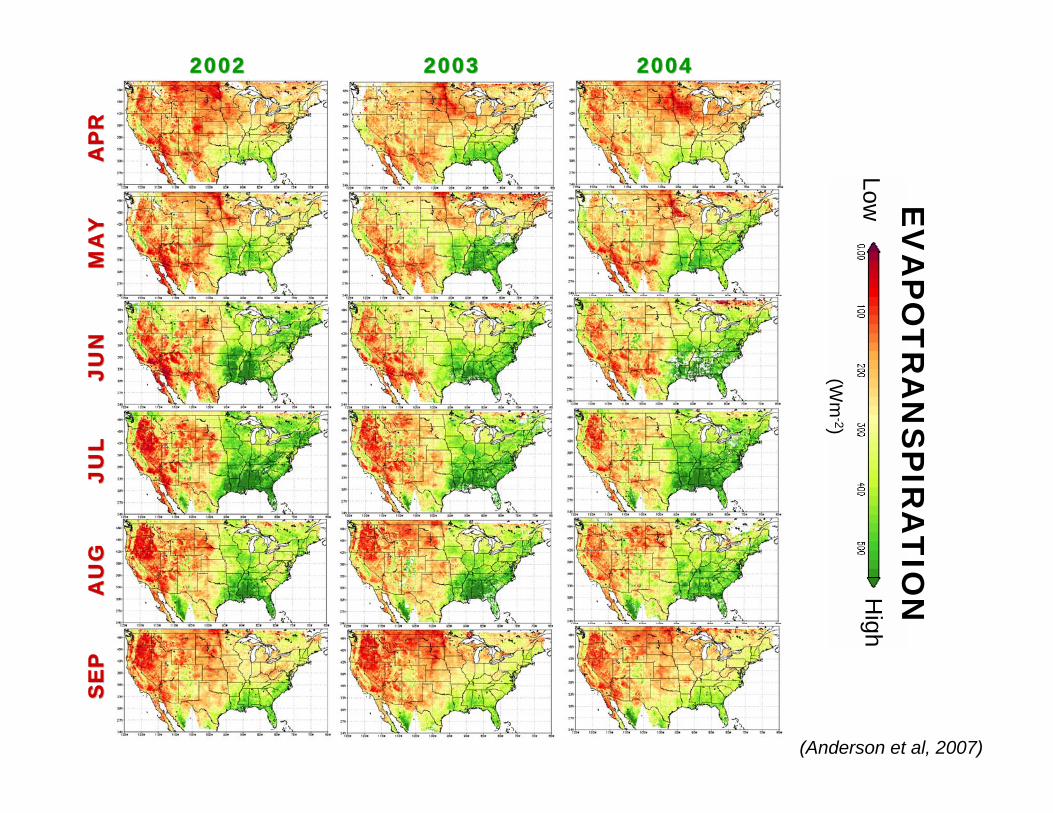
20022002 20032003 20042004
(Wm
-2)
EV
AP
OT
RA
NS
PIR
AT
ION
LowH
igh
(Anderson et al, 2007)
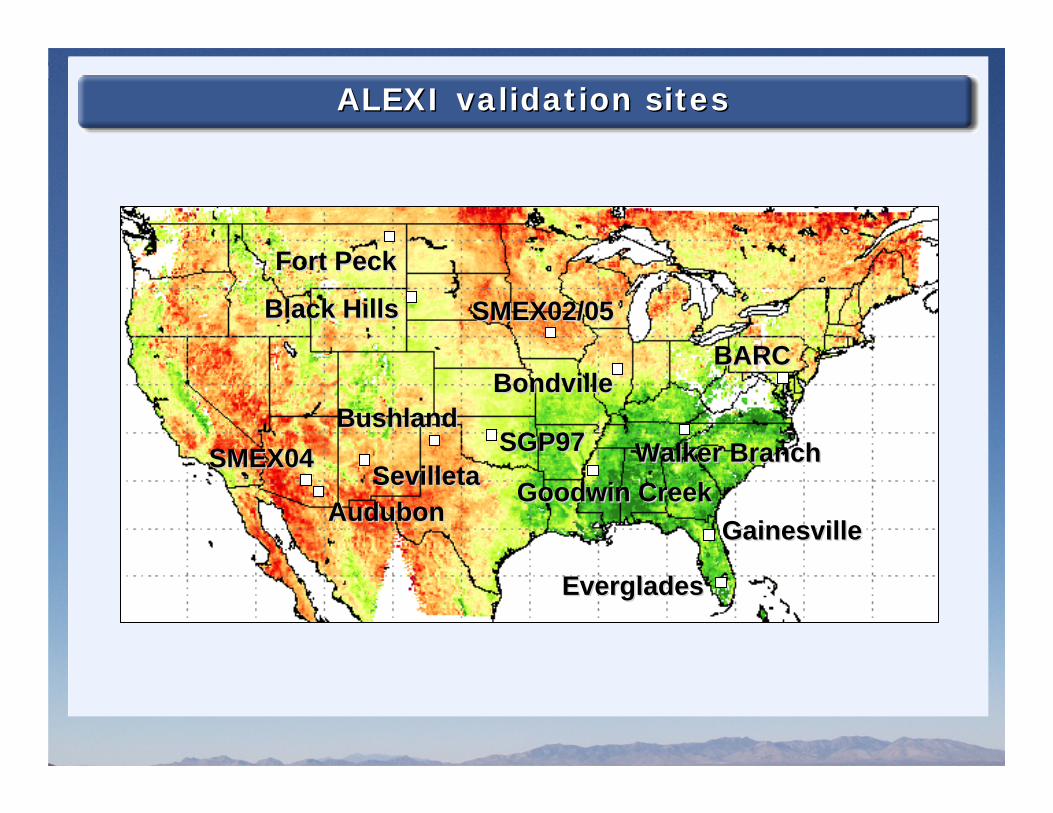
ALEXI validation sitesALEXI validation sites
SMEX02/05SMEX02/05
SGP97SGP97
BondvilleBondville
Fort PeckFort Peck
Walker BranchWalker Branch
AudubonAudubon Goodwin CreekGoodwin CreekGainesvilleGainesville
EvergladesEverglades
SevilletaSevilletaSMEX04SMEX04BushlandBushland
Black HillsBlack Hills
BARCBARC

Clear-sky fluxes using Landsat thermal (60m)Clear-sky fluxes using Landsat thermal (60m)
• rangeland• pasture• corn• soybean…
0
200
400
600
800
0 200 400 600 800
Tower flux (Wm-2)
Mod
eled
flux
(Wm
-2)
RNETHG
RMSD: 33 Wm-2 (10%)
(Anderson et al, 2007)

… drought & stress monitoring… drought & stress monitoring
ESI = 1 –ESI = 1 –AETAETPETPET
APPLICATIONSAPPLICATIONS
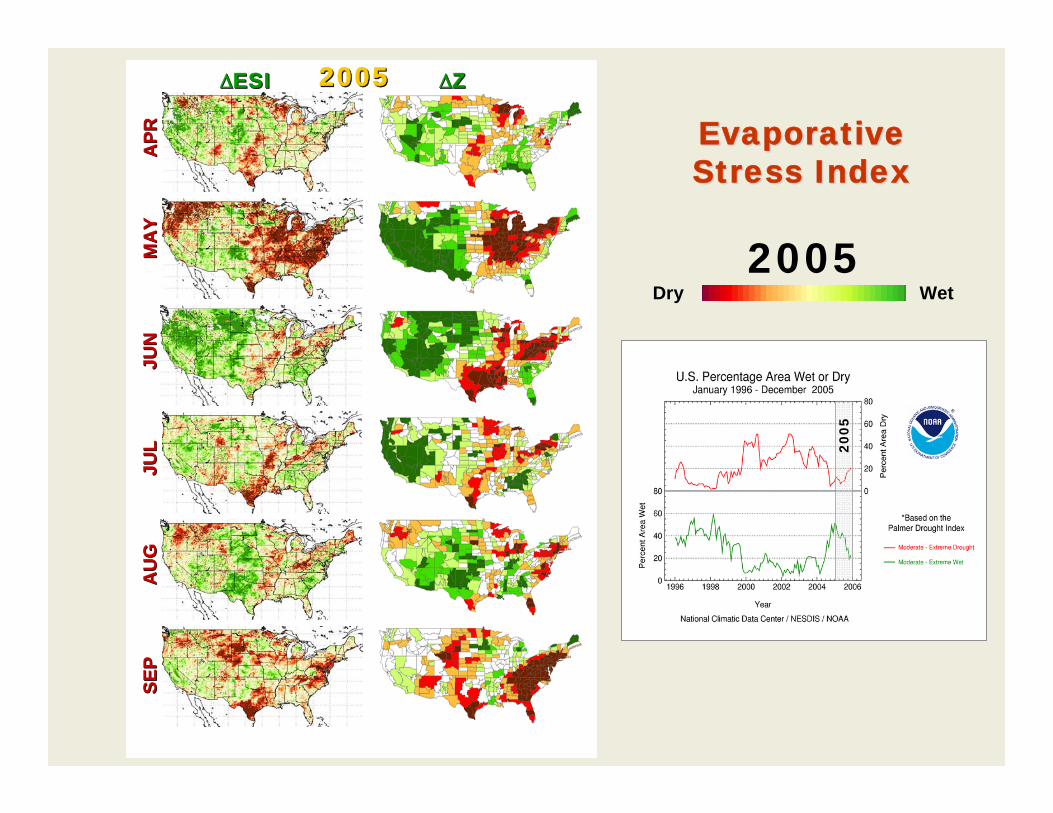
Evaporative Stress IndexEvaporative Stress Index

0
10
20
30
40
50
1995 1996 1997 1998 1999 2000 2001 2002 2003 2004 2005 2006
Date
Cum
ulat
ive
area
l per
cent
age
Climatological Study: 2002-2005Climatological Study: 2002-2005
Extreme dryExtreme dryExtreme wetExtreme wet
2002 2003 2004Palmer Drought Index - NCDC
• 2002: extreme-severe drought conditions covering 40% of the US in July• 2003: some improvement (10-25% extreme-severe drought coverage) • 2004: extreme drought coverage falls < 5% due to increased late rainfall• 2005: wetter than average in western US, drought in east
2005

20022002 20032003 20042004 20052005A
PRAPR
MA
YM
AY
JUN
JUN
JUL
JUL
AU
GA
UG
SEP
SEP
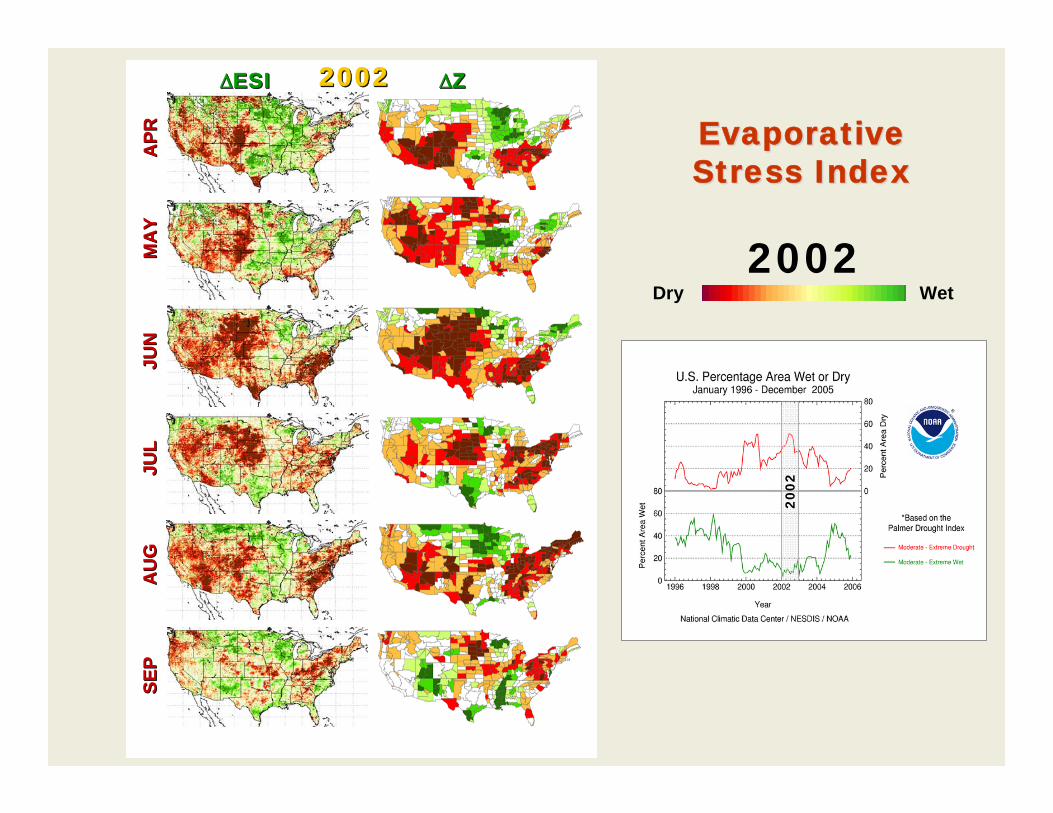
DRY WETMONTHLY ESI ANOMALIESMONTHLY ESI ANOMALIES
APRAPR
MA
YM
AY
JUN
JUN
JUL
JUL
AU
GA
UG
SEP
SEP
ΔΔESIESI ΔΔZZ20022002
2002WetDry
EvaporativeStress IndexEvaporativeStress Index
2002

APRAPR
MA
YM
AY
JUN
JUN
JUL
JUL
AU
GA
UG
SEP
SEP
ΔΔESIESI ΔΔZZ20032003
2003WetDry
EvaporativeStress IndexEvaporativeStress Index
2003

APRAPR
MA
YM
AY
JUN
JUN
JUL
JUL
AU
GA
UG
SEP
SEP
ΔΔESIESI ΔΔZZ20042004
2004WetDry
EvaporativeStress IndexEvaporativeStress Index
2004
APRAPR
MA
YM
AY
JUN
JUN
JUL
JUL
AU
GA
UG
SEP
SEP
ΔΔESIESI ΔΔZZ20052005
2005WetDry
EvaporativeStress IndexEvaporativeStress Index
2005
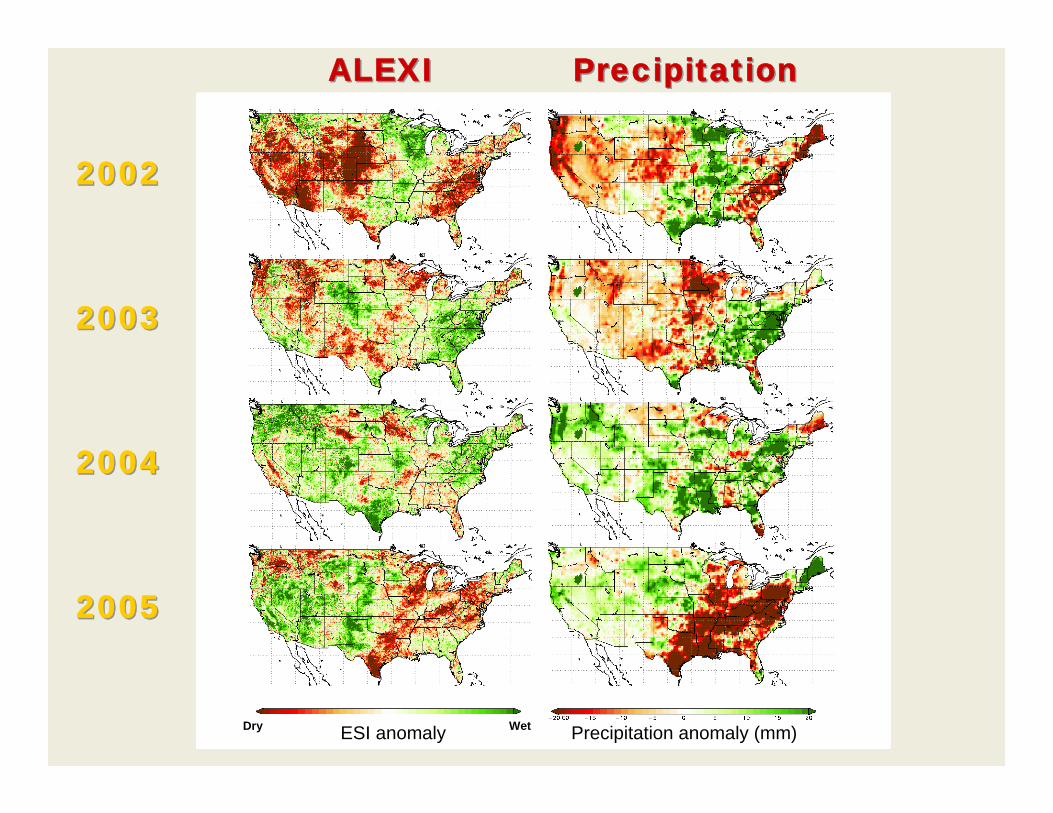
20022002
20032003
20042004
ALEXIALEXI PrecipitationPrecipitation
ESI anomaly Precipitation anomaly (mm)Dry Wet
20052005

Multi-scale Drought MonitoringMulti-scale Drought Monitoring
GOES Evaporative Stress IndexGOES Evaporative Stress Index
Palmer Z IndexPalmer Z IndexAnomalyAnomaly
JUNE 2002JUNE 2002
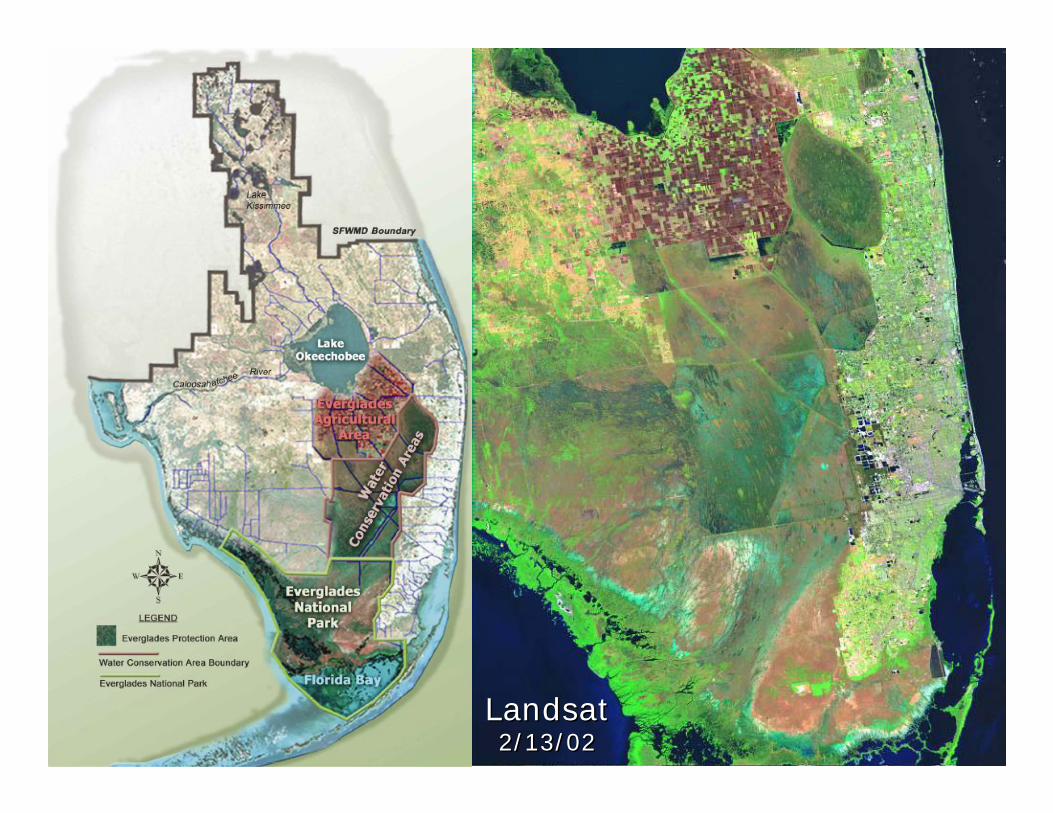
Landsat2/13/02
Landsat2/13/02

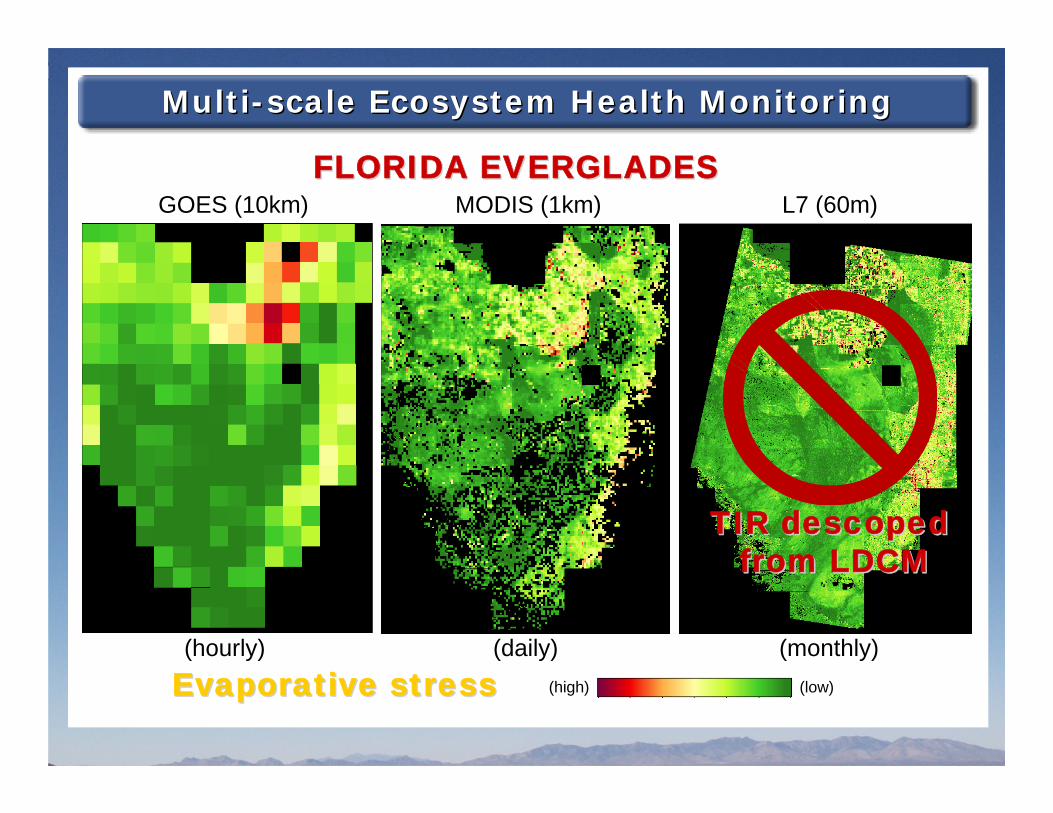
Multi-scale Ecosystem Health MonitoringMulti-scale Ecosystem Health Monitoring
MODIS (1km) L7 (60m)
(hourly) (daily) (monthly)
FLORIDA EVERGLADESFLORIDA EVERGLADESGOES (10km)
(Wm-2)EvapotranspirationEvapotranspiration
Multi-scale Ecosystem Health MonitoringMulti-scale Ecosystem Health Monitoring
MODIS (1km) L7 (60m)
(hourly) (daily) (monthly)
FLORIDA EVERGLADESFLORIDA EVERGLADESGOES (10km)
Evaporative stressEvaporative stress (low)(high)
TIR descopedfrom LDCM
TIR descopedfrom LDCM

Impending data gap in high-resolution TIRImpending data gap in high-resolution TIR
ASTERLandsat
Once every 8-16 days
90–120 mFine
VIIRSAVHRRATSR
MODISAVHRRATSR
2-4 times daily1 kmModerate
CrISGOESMSG
AIRSGOESMSG
15 min5-20 kmCoarse
FutureSources
CurrentSources
Temporal Resolution
Spatial Resolution
PixelScale
Table from S. Hook
HyspIRI-TIR?HyspIRI-TIR?
… soil moisture mapping… soil moisture mappingAPPLICATIONSAPPLICATIONS
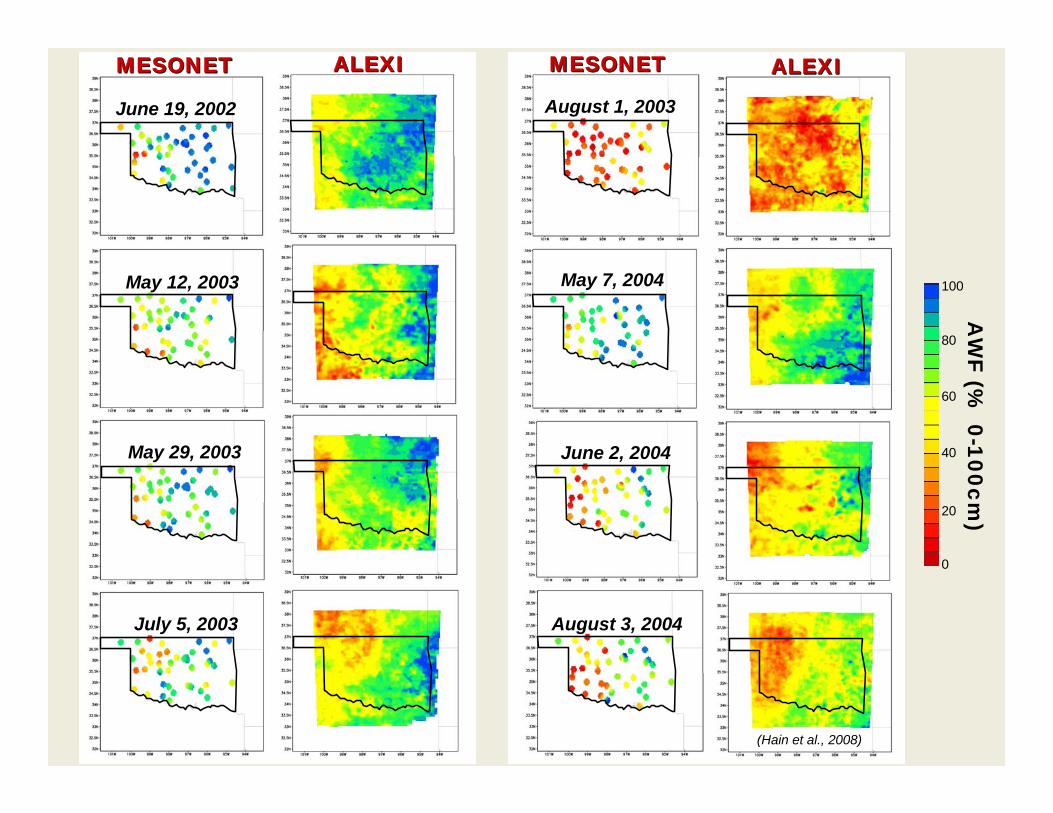
AW
F (% 0-100cm
)
May 12, 2003
May 29, 2003
July 5, 2003
August 1, 2003
May 7, 2004
June 2, 2004
August 3, 2004
June 19, 2002
ALEXIALEXIMESONETMESONET ALEXIALEXIMESONETMESONET
(Hain et al., 2008)
0
100
80
60
20
40
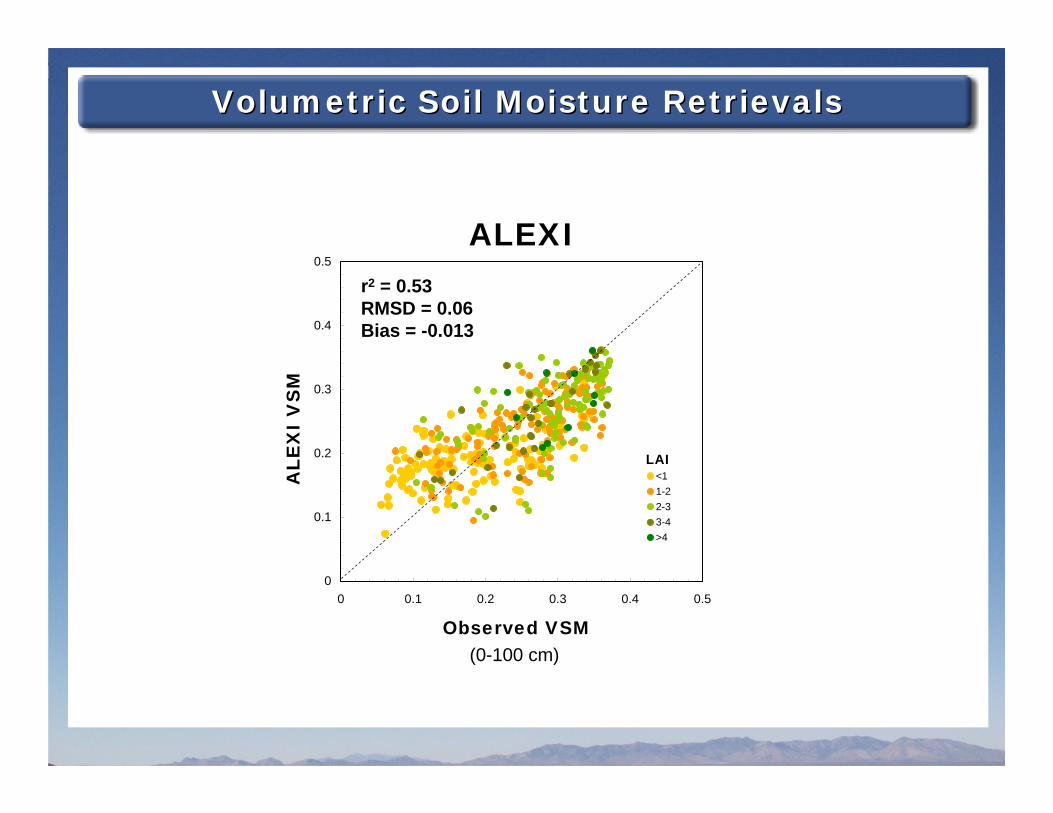
Volumetric Soil Moisture RetrievalsVolumetric Soil Moisture Retrievals
0
0.1
0.2
0.3
0.4
0.5
0 0.1 0.2 0.3 0.4 0.5
Observed AWF
ALE
XI A
WF
<11-22-33-4>4
LAI
r2 = 0.53RMSD = 0.06Bias = -0.013
ALEXI
Observed VSM
ALE
XI
VS
M
(0-100 cm)
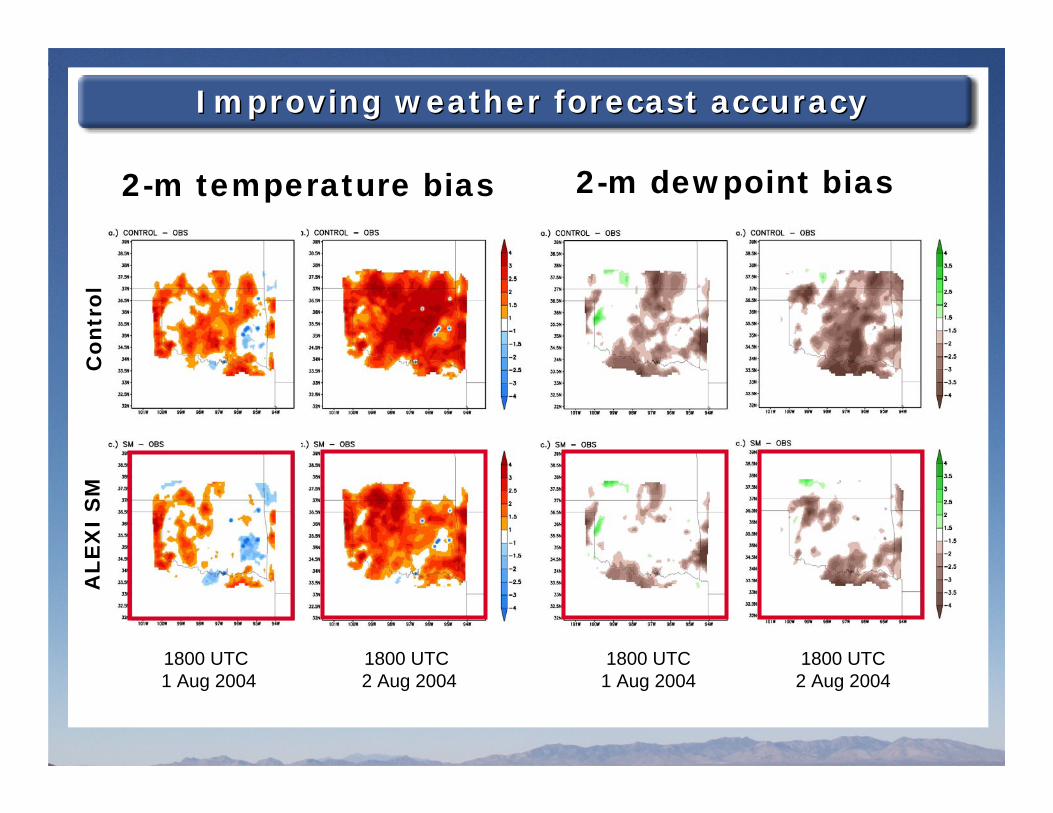
Improving weather forecast accuracyImproving weather forecast accuracy
1800 UTC 1 Aug 2004
1800 UTC 2 Aug 2004
1800 UTC 1 Aug 2004
1800 UTC 2 Aug 2004
2-m temperature bias 2-m dewpoint bias
Con
trol
ALE
XI
SM

Assimilation into hydrologic modelsAssimilation into hydrologic models
Assimilating thermal-basedET/PET
Assimilating surface temperature directly
No Assimilation Assimilation
Crow et al., RSE 2007

THERMAL REMOTE SENSING DATAHAVE GREAT UTILITY:
… ET mapping… drought monitoring… soil moisture mapping
THERMAL REMOTE SENSING DATAHAVE GREAT UTILITY:
… ET mapping… drought monitoring… soil moisture mapping
CONCLUSIONSCONCLUSIONS
NEED TO MAINTAIN MULTI-SCALE THERMAL DATA SOURCES
NEED TO MAINTAIN MULTI-SCALE THERMAL DATA SOURCES
[email protected]@ars.usda.gov

ALEXI_EUROPE and _AFRICA (coming soon)ALEXI_EUROPE and _AFRICA (coming soon)
METEOSAT COVERAGE
0o Operational
Copyright 2008 EUMETSATCopyright 2008 EUMETSAT
Indian Ocean

METEOSAT ApplicationMETEOSAT Application
0.6
0.7
0.8
0.9
1
0
100
200
300
400
500
600
EvapotranspirationEvapotranspiration
ESIESI (low)
(high)
LEBRIJA, SPAINLEBRIJA, SPAIN
0.0
0.2
0.4
0.6
0.8
1.0
0.0 0.2 0.4 0.6 0.8 1.0
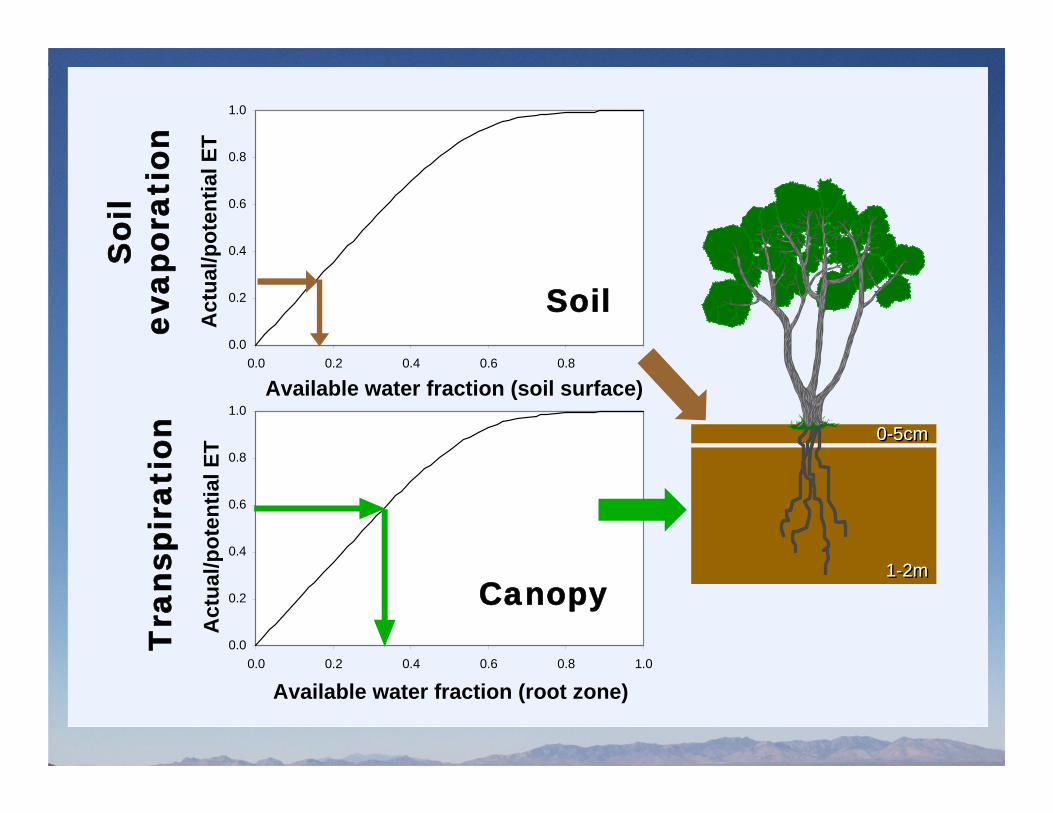
Available water fraction
Act
ual/p
oten
tial E
T
Tra
nspi
rati
on
Canopy
Available water fraction (root zone)
Act
ual/p
oten
tial E
T
0.0
0.2
0.4
0.6
0.8
1.0
0.0 0.2 0.4 0.6 0.8 1.0
Available water fraction
Act
ual/p
oten
tial E
T
Soi
lev
apor
atio
n
Soil
Act
ual/p
oten
tial E
T
Available water fraction (soil surface)
0-5cm0-5cm
1-2m1-2m