map of microfinance distribution in india
TRANSCRIPT
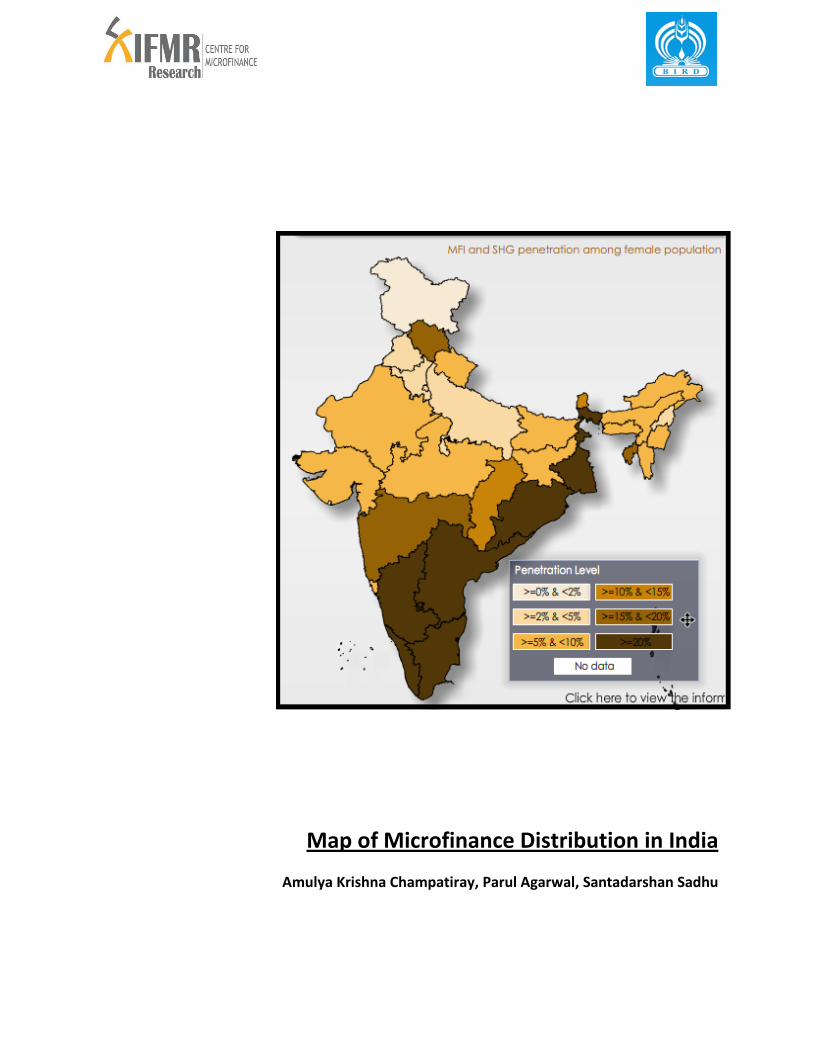
Map of Microfinance Distribution in India
Amulya Krishna Champatiray, Parul Agarwal, Santadarshan Sadhu

1
EXECUTIVE SUMMARY
Project Scope and Data
Map of Microfinance Distribution in India project gathered general institutional information,
district-wise outreach and portfolio details, product offering details, and business
correspondence details from 103 MFIs across India. Similar data was collected through
secondary sources for the preceding three years (2007-2009). State level data regarding
savings amount and loans outstanding regarding the SHG-linkage program was also collected
from publicly available sources such as the Micro Credit Innovation Department and NABARD
(MCID) for the last three years (2008-2010). This data was used to visually display growth in
microfinance penetration over the last four years. Finally, demographic and socioeconomic
data of the states, union territories and districts were collected to enhance the microfinance
penetration analysis.
Findings
General Findings
Over 24 million clients were being served by the 103 MFIs with Rs. 19,676 crores loans
outstanding as of March 2010. For-profit MFIs account for 90% of total client outreach and
loans outstanding. Nearly 81 million people were being served by the SHG-linkage program
with Rs. 6,199 crores of savings deposits and Rs. 28,048 crores loans outstanding as of March
2010.
Regional Penetration Imbalance
The majority of microfinance services are in the Southern region, which accounts for 52% of all
microfinance clients and 54% of all microfinance loan portfolios. The Northeastern, Northern,
and Central regions have very underdeveloped microfinance sectors, accounting for 2%, 6%,
and 6% of client outreach respectively.
SHGs show a similar regional imbalance, with the Southern region accounting for 52% of client
outreach and 68% of loan portfolios, while the Northeastern, Northern, and Central regions
account for 3%, 9%, and 3% of client outreach and 2%, 8%, and 2% of loan portfolio
respectively.
2
Sector Growth
The number of districts served by these MFIs increased dramatically each year in all regions.
The number of clients served by the MFIs increased dramatically as well, with the greatest
increase occurring in the Southern and Eastern regions. The SHG-linkage program grew at a
fast pace as well, showing a growth rate of 22% from 2009 to 2010.
Product Diversity
Productive loans are the most popular product offered by MFIs. Approximately 30% of MFIs
offer consumption/emergency loans, and 15% offer housing loans. Approximately 15% of MFIs
registered as cooperatives, societies, and trusts offer savings products as well. Nearly 60% of
MFIs offer life insurance, and 10% of MFIs offer either cattle insurance, health insurance, or
accidental insurance. Two MFIs are offering remittance products and two MFIs offer pension
products.
Conclusion and Further Research
Map of Microfinance Distribution in India has collected MFI and SHG data to analyze
penetration over time by region and state, drilling down the district level. The data collected by
Map of Microfinance Distribution in India has taken a detailed stock of operation and outreach
of MFIs and presents interesting findings. Further data collection should be conducted from
more MFIs and SHG sources to improve district and state level data so that the coverage of the
map could be widened.
3
CONTENTS
Acknowledgement
Part I
Background
Methodology
Part II
Client Outreach and Portfolio
Regional Spread of Microfinance
Microfinance Penetration Across Various Population Groups
Growth in the Sector
Penetration against Per-Capita Income and Poorest District
Product Diversity
Conclusion
References

4
List of Graphs and Tables
Figure 1: Client outreach by MFIs as per their legal form
Figure 2: Distribution of loan portfolio among MFIs as per their legal form
Figure 3: Region wise client outreach
Figure 4: Region wise loan portfolio
Figure 5: Distribution of MFI branches across the regions
Figure 6: SHG (credit linked) - region wise client outreach
Figure 7: SHG (credit linked) - region wise loan portfolio
Figure 8: MFI penetration across regions
Figure 9: SHG (credit linked) penetration across region
Figure 10: MFI and SHG penetration across regions
Figure 11: Regional growth of MFI in terms of client outreach
Figure 12: Regional growth of MFI in terms of client outreach
Figure 13: Regional growth in the SHG Bank linkage programme: 2009-2010
Figure 14: Penetration vs. Income Bucket
Figure 15: Average Loan vs. Income Bucket
Figure 16: Average loan size across region
Table
Table 1: Region wise number of districts served by MFIs
5
List of Annexure
Annexure 1: Top five states by MFI Penetration
Annexure 2: Top five states by SHG (Credit Linked) Penetration
Annexure 3: Top thirty districts by MFI Penetration
Annexure 4: Top ten districts as per Compound Annual Growth Rate (2008-2010)
Annexure 5: List of Poorest Districts
Annexure 6: Methods of Back-Calculation
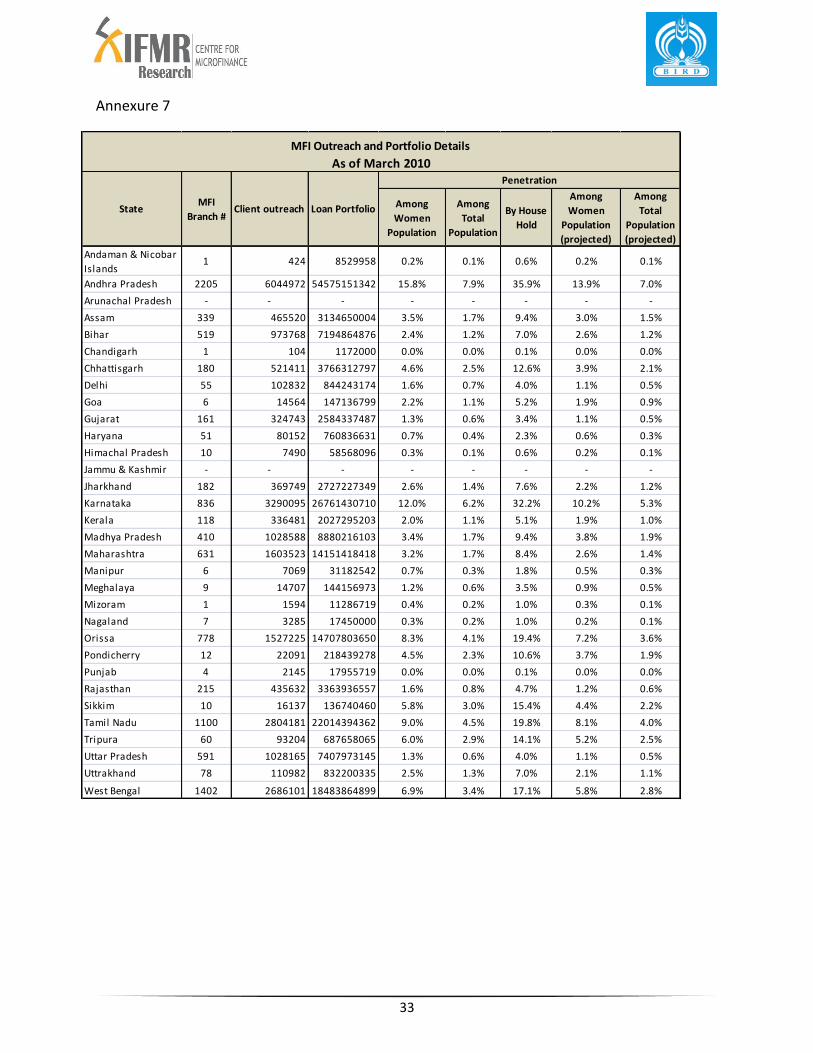
Annexure 7: State Wise MFI Outreach and Portfolio Details
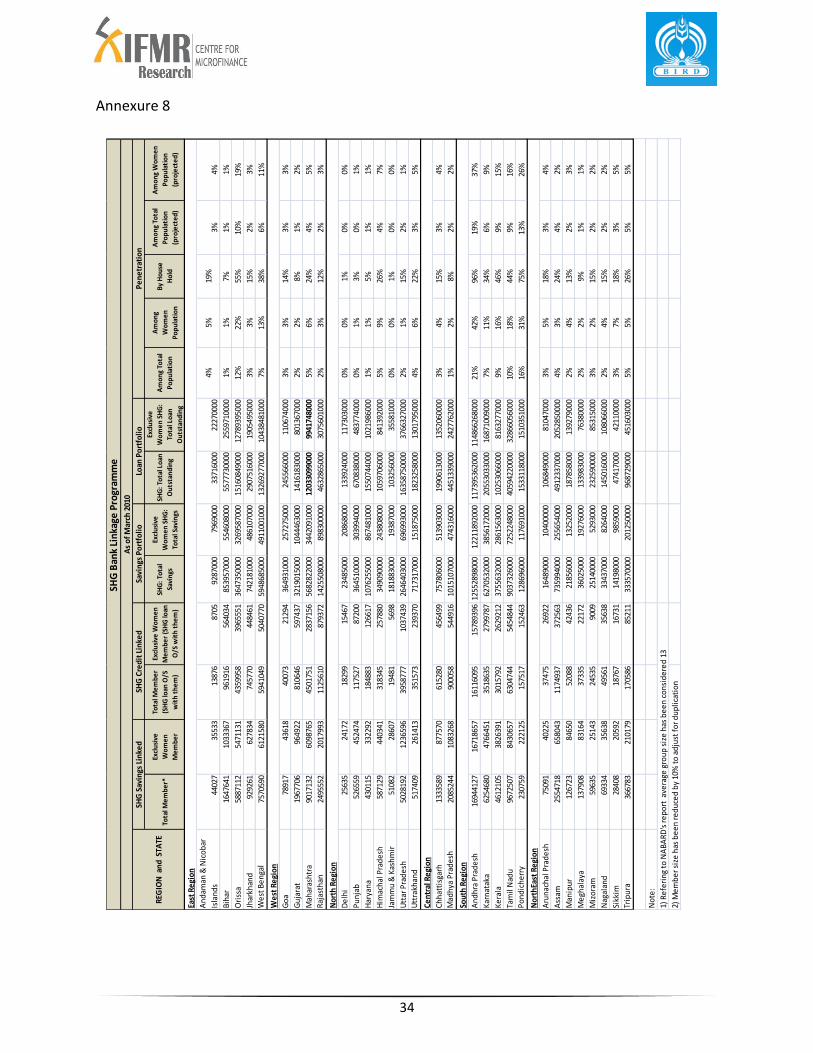
Annexure 8: Details of SHG Bank Linkage Programme
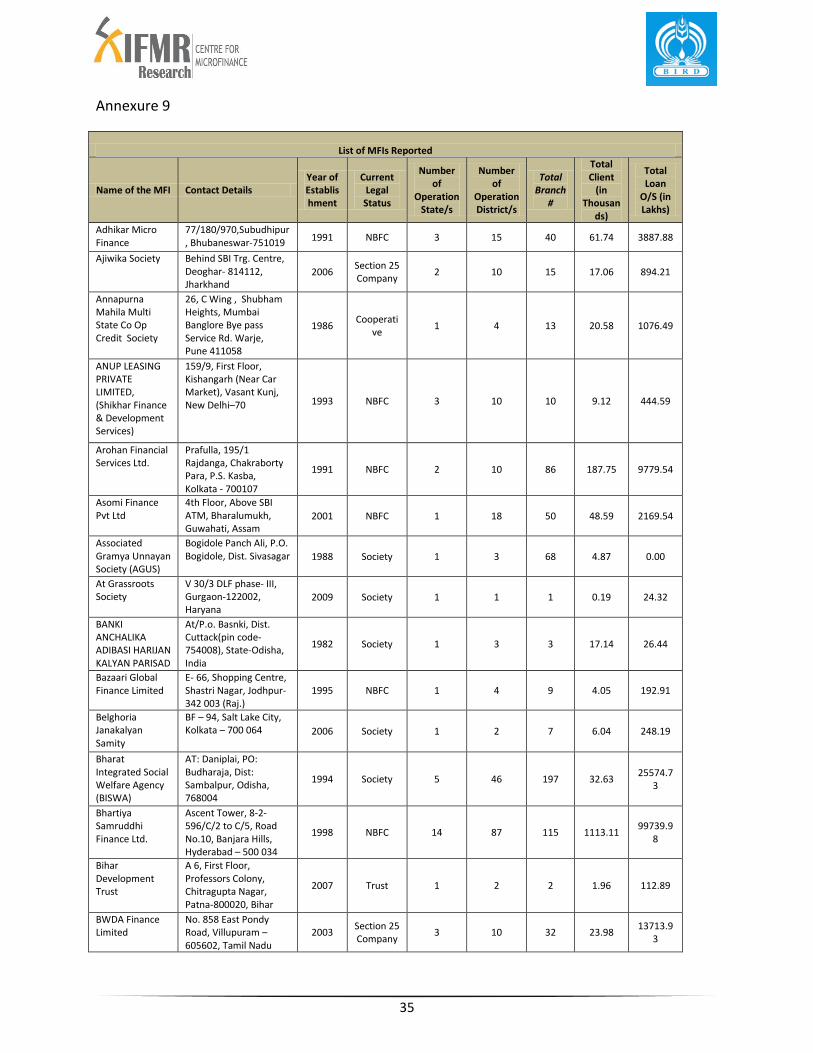
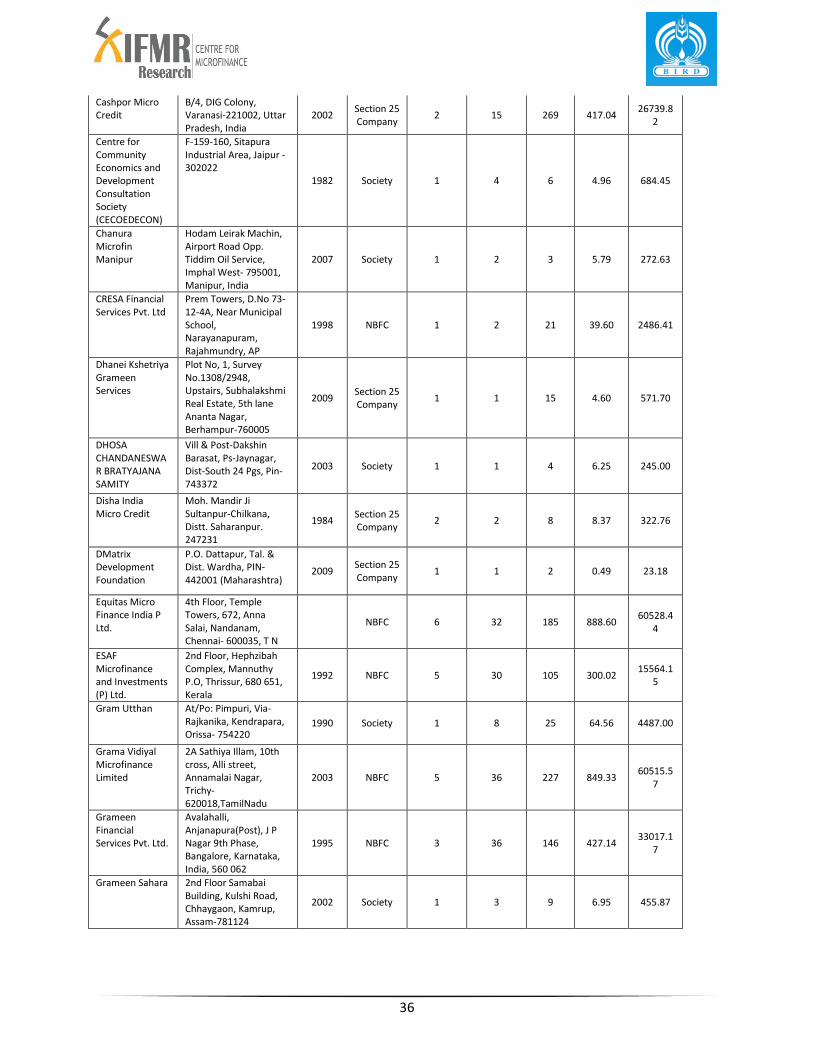
Annexure 9: Details of MFIs Reported
6
ACKNOWLEDGEMENT
Our sincere thanks to 103 organizations for contributing data for the ‘Map of Microfinance
Distribution in India;’ without their valuable participation it may not be possible to fulfil the
objectives of the project. Our sincere thanks due to Micro Credit Innovation Department-
NABARD for contributing data on SHG Bank linkage programme. Our thanks are also due to
various organizations and sector experts those have provided inputs and contact details of
MFIs. We look forward their kind support in centre’s future endeavours too. We are also
grateful to Rajendra Prasad Ravuri, IRS and his team, for their enormous contribution in making
the online map possible.
The work has been made possible by support from Bankers’ Institute of Rural Development at
NABARD. Our sincere thank to BIRD for their encouragement and continuous support to
Centre’s endeavour. We thank to Justin Oliver, Kenny Kline and rest of the Centre for
Microfinance team members for their valuable comments and inputs.
7
BACKGROUND
Microfinance has emerged as an important tool for providing financial services to the poor.
Though its efficiency and effectiveness are debatable, the microfinance sector in India has
expanded rapidly over the past few years, providing access to credit to a large number of
individuals who were hardly served by the banks and other formal financial institutions. The
sector is at a critical juncture where an understanding of growth and penetration dynamics can
assist policymakers, practitioners, researchers and other stakeholders when formulating
policies and executing plans to expand access to financial services. The Map of Microfinance
Distribution in India, developed by the Centre for Micro Finance, IFMR Research, is an attempt
to strengthen this understanding by providing a visual tool for assessing the spread of financial
services for India’s poor. The Map of Microfinance Distribution in India shows which models
are active in each state and districts, the areas that are not yet served by the microfinance
institutions, and penetration of microfinance in various districts of India.
METHODOLOGY
Data to be included in the Map was collected from a variety of sources at various levels. A
questionnaire was designed to gather primary data regarding operations from microfinance
institutions (MFIs) in India. This questionnaire gathered information spanning four categories:
general institutional information, district-wide outreach and portfolio details, products offered,
and business correspondence details. Ninety-eight MFIs1 responded to the request as of March
2010. Additionally, data regarding five other large MFIs which did not share their data was
collected from secondary sources. All together, these 103 MFIs cover 91% of the total client
outreach in 2010.2
1 300 plus MFIs were approached by CMF
2 Total MFI client outreach data is collected from the State of the Sector Report 2010
8
Similar data for the preceding three years (2007-2009) was also collected and consolidated
from various secondary sources3. However, secondary data for all MFIs was available only at
the state level. To arrive at an approximation of district-wise client outreach and portfolio from
this secondary data, a method of back-calculation and estimation was adopted where the
information from secondary data was augmented with the district outreach information of
20104 These estimated figures can be used to study gain an insight on the growth of the sector
over the past 3 years. This data has been used to generate interactive maps which show
microfinance penetration each year, as well as the penetration growth from year to year.
The SHG-Bank Linkage programme serves a large number of poor clients in India and has also
witnessed extensive growth over the last few years. Information regarding savings-linked and
credit-linked SHGs was collected at the state level from publicly available sources5, published by
the Micro Credit Innovation Department of NABARD (Statements III-A, III-B and III-C for Savings-
Linked SHGs and from Statements V-A, V-B and V-C for the Credit-Linked SHGs). This
information was collected for 2008, 2009 and 2010. This data includes the number of SHGs, as
well as the corresponding savings and loans outstanding that SHGs have with commercial
banks, Regional Rural Banks and Cooperatives. This data was grouped by Commercial Bank,
Regional Rural Bank, and Cooperative for each state.6
3 Source: Sa-Dhan published Bharat Microfinance Report 2009
4 For a detailed example, please refer to the Appendix
5 For the SHG programme, district level data was not publicly available at the NABARD and other sources, and
hence the SHG penetration is measured at the state level. 6 Consolidated information was also available in the same report in Statements II-A, II-B and II-C but they were not
used because these statements did not mention women SHG details rather only total number of SHGs. Comparing consolidated data that was prepared from detailed statements with consolidated data (as stated by NABARD in it’s report), it was realized that in some cases there exist mismatches in values obtained for some North-eastern States and states of Andhra Pradesh and Karnataka for credit-linked SHGs for 2009. But because it was difficult to correct for this disparity, detailed data was chosen over the consolidated one. Apart from this, some banks seemed to have reported the number of credit-linked SHGs in excess of savings-linked SHGs. This happened for the 2008 data for the states of Kerala, Maharashtra, Nagaland and Arunachal Pradesh. In such cases, total number of savings-linked SHGs were taken to be the same as number of credit-linked SHGs as was mentioned in the data. The amount of savings and loan outstanding were, however, kept unchanged.
9
Additionally, selected demographic and socio-economic data of all the states, union territories
and districts of India also gathered from various secondary sources to enrich penetration7 and
outreach analysis. This data includes population (male, female and total), annual per capita
income for 2000-2001 (at constant prices of 1993-94), percentage of population Below Poverty
Line (BPL) in the year of 2000-2001, Human Development Index (HDI) of 2001 and Gender-
related Development Index (GDI) of 2001. Additionally, a list of 210 poorest districts8 of India
was prepared to identify microfinance penetration in these districts.
The Map of Microfinance Distribution in India can be used to assess the state-wide and district-
wide penetration of microfinance in India, and to explore penetration across various
demographic and socio-economic strata.
7In our study microfinance penetration India is measured across five base variables: female population, total
population, number of households (as per 2001 census), projected female and total population for 2010 (the projected population were arrived at using estimated district-wise decennial population growth rates given by indiastat.com). Also, it could explore to look at microfinance penetration by MFIs, SHG Bank Linkage programme and also an aggregated penetration of MFI and SHGs. 8 Planning Commission’s list of 100 backward districts for RSVY programme | India’s 69 most backward districts:
Report of Bibek Debroy of the Rajiv Gandhi Institute for Contemporary Studies, New Delhi, and Laveesh Bhandari of Indicus Analytics | Districts Covered by the PACS Programme | India’s most backward districts: List of 1997 Sarma Committee | KBK region of Orissa
10
CLIENT OUTREACH AND LOAN PORTFOLIO
The data shows that as of March 2010, 24 million9 clients were served by the 103 MFIs included
in the study, (with a total outstanding loan portfolio of INR 19,676 crores) and 81 million10 (77%
women) people were served by the Self Help Group bank linkage programme (SBLP)and 56
million members (80% women) had a SHG loan outstanding. The total saving deposits of SHG
members was INR 6,199 crores with banks and the total loan portfolio was INR 28,048 crores.
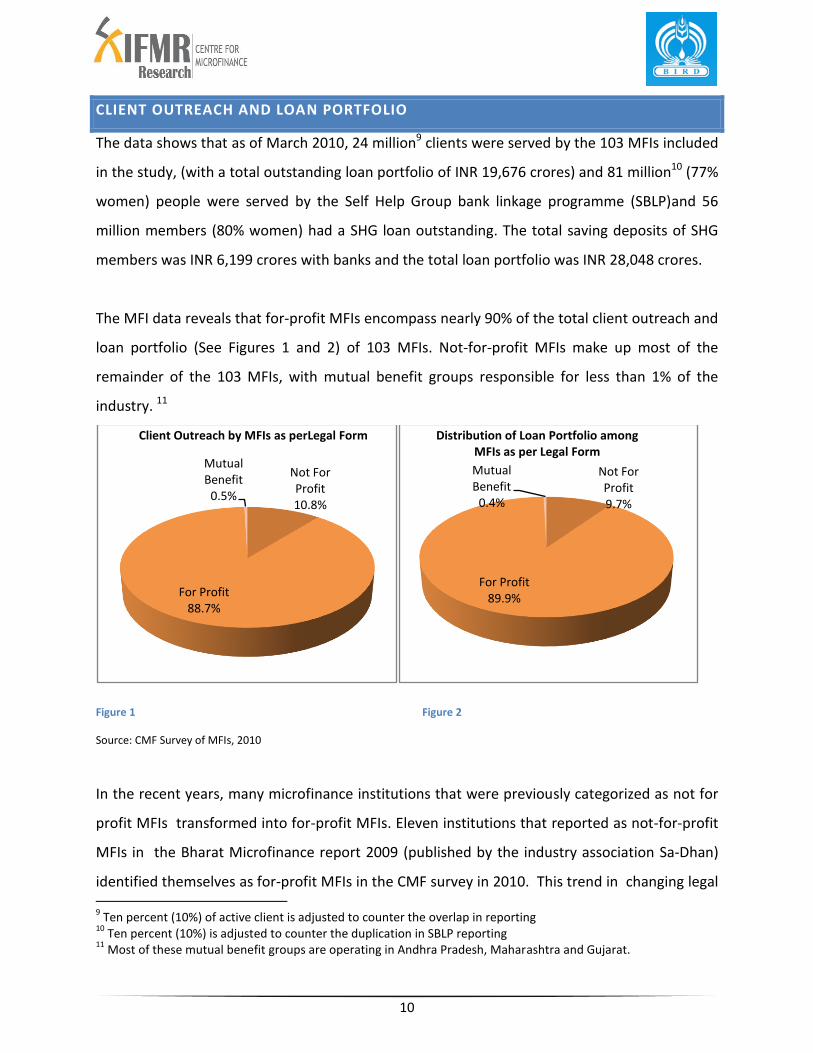
The MFI data reveals that for-profit MFIs encompass nearly 90% of the total client outreach and
loan portfolio (See Figures 1 and 2) of 103 MFIs. Not-for-profit MFIs make up most of the
remainder of the 103 MFIs, with mutual benefit groups responsible for less than 1% of the
industry. 11
Figure 1 Figure 2
Source: CMF Survey of MFIs, 2010
In the recent years, many microfinance institutions that were previously categorized as not for
profit MFIs transformed into for-profit MFIs. Eleven institutions that reported as not-for-profit
MFIs in the Bharat Microfinance report 2009 (published by the industry association Sa-Dhan)
identified themselves as for-profit MFIs in the CMF survey in 2010. This trend in changing legal 9 Ten percent (10%) of active client is adjusted to counter the overlap in reporting
10 Ten percent (10%) is adjusted to counter the duplication in SBLP reporting
11 Most of these mutual benefit groups are operating in Andhra Pradesh, Maharashtra and Gujarat.
Not For Profit 10.8%
For Profit88.7%
Mutual Benefit
0.5%
Client Outreach by MFIs as perLegal Form
Not For Profit 9.7%
For Profit89.9%
Mutual Benefit
0.4%
Distribution of Loan Portfolio among MFIs as per Legal Form
11
status may indicate that many of the not-for-profit MFIs are responding to heightened
competition in the sector by transforming into for-profit organizations in order to gain access
to the capital markets and to attract private equity investment.
REGIONAL SPREAD OF MICROFINANCE
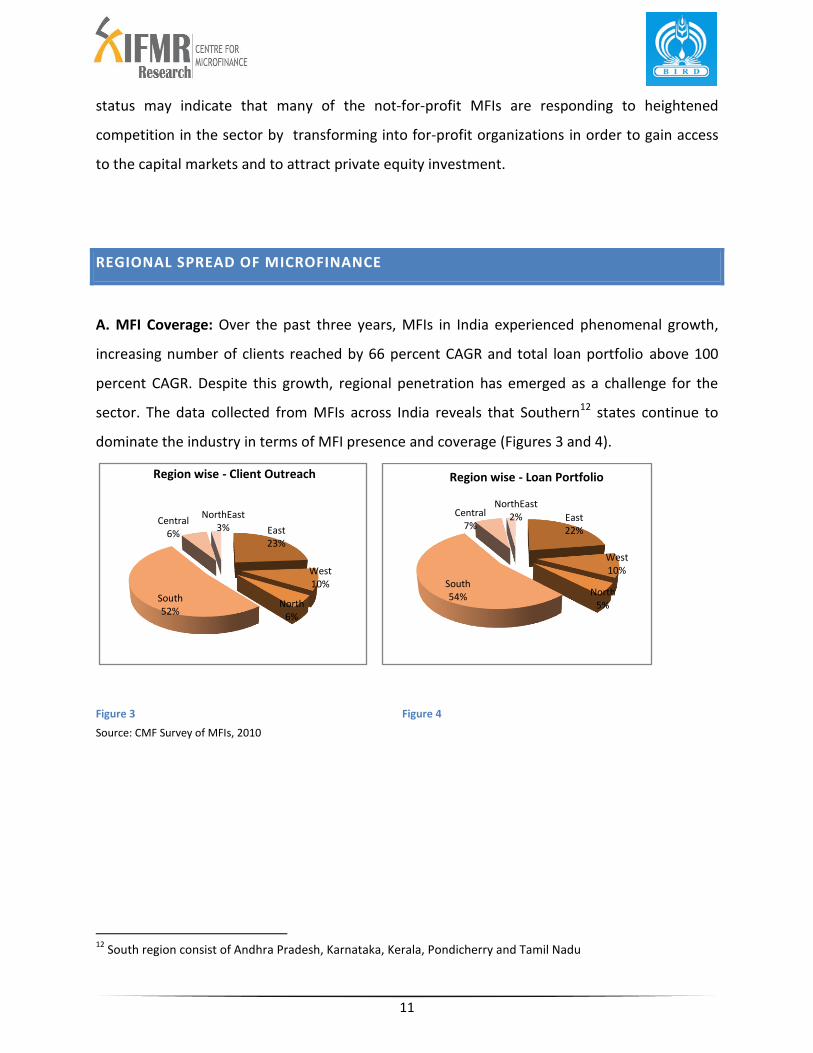
A. MFI Coverage: Over the past three years, MFIs in India experienced phenomenal growth,
increasing number of clients reached by 66 percent CAGR and total loan portfolio above 100
percent CAGR. Despite this growth, regional penetration has emerged as a challenge for the
sector. The data collected from MFIs across India reveals that Southern12 states continue to
dominate the industry in terms of MFI presence and coverage (Figures 3 and 4).
Source: CMF Survey of MFIs, 2010
12
South region consist of Andhra Pradesh, Karnataka, Kerala, Pondicherry and Tamil Nadu
East 22%
West10%
North5%
South54%
Central7%
NorthEast2%
Region wise - Loan Portfolio
East 23%
West10%
North6%
South52%
Central6%
NorthEast3%
Region wise - Client Outreach
Figure 3
re 3
Figure 4
12
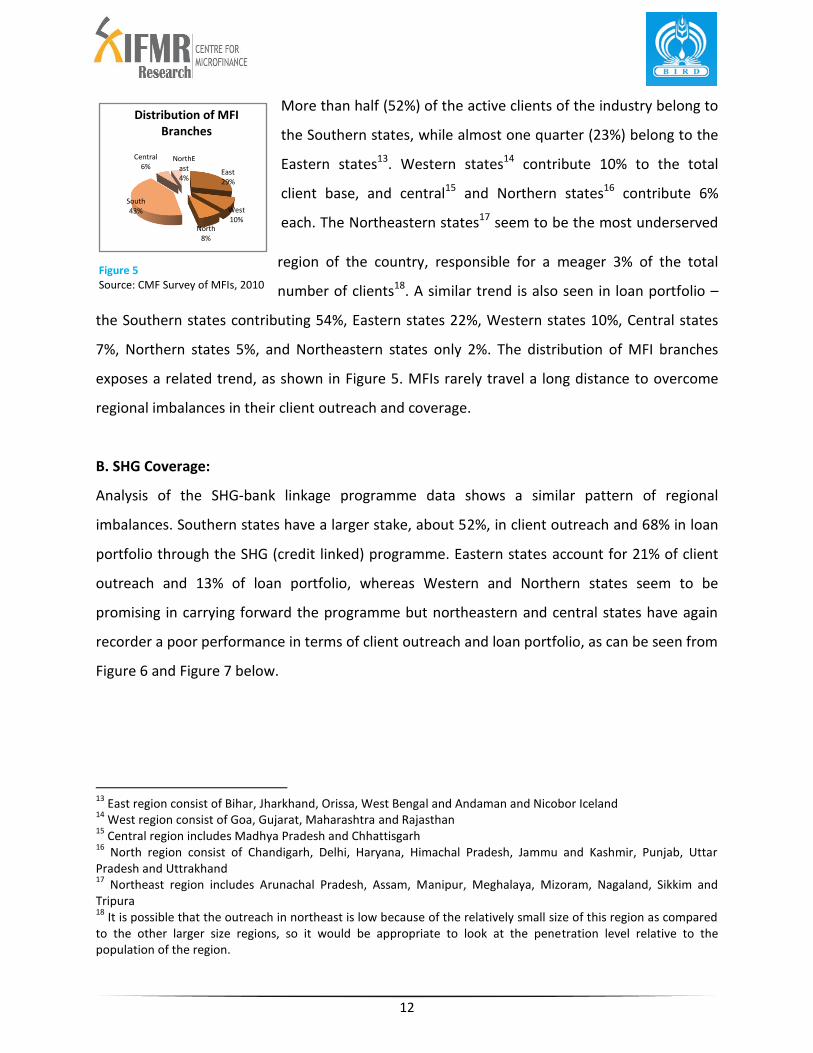
More than half (52%) of the active clients of the industry belong to
the Southern states, while almost one quarter (23%) belong to the
Eastern states13. Western states14 contribute 10% to the total
client base, and central15 and Northern states16 contribute 6%
each. The Northeastern states17 seem to be the most underserved
region of the country, responsible for a meager 3% of the total
number of clients18. A similar trend is also seen in loan portfolio –
the Southern states contributing 54%, Eastern states 22%, Western states 10%, Central states
7%, Northern states 5%, and Northeastern states only 2%. The distribution of MFI branches
exposes a related trend, as shown in Figure 5. MFIs rarely travel a long distance to overcome
regional imbalances in their client outreach and coverage.
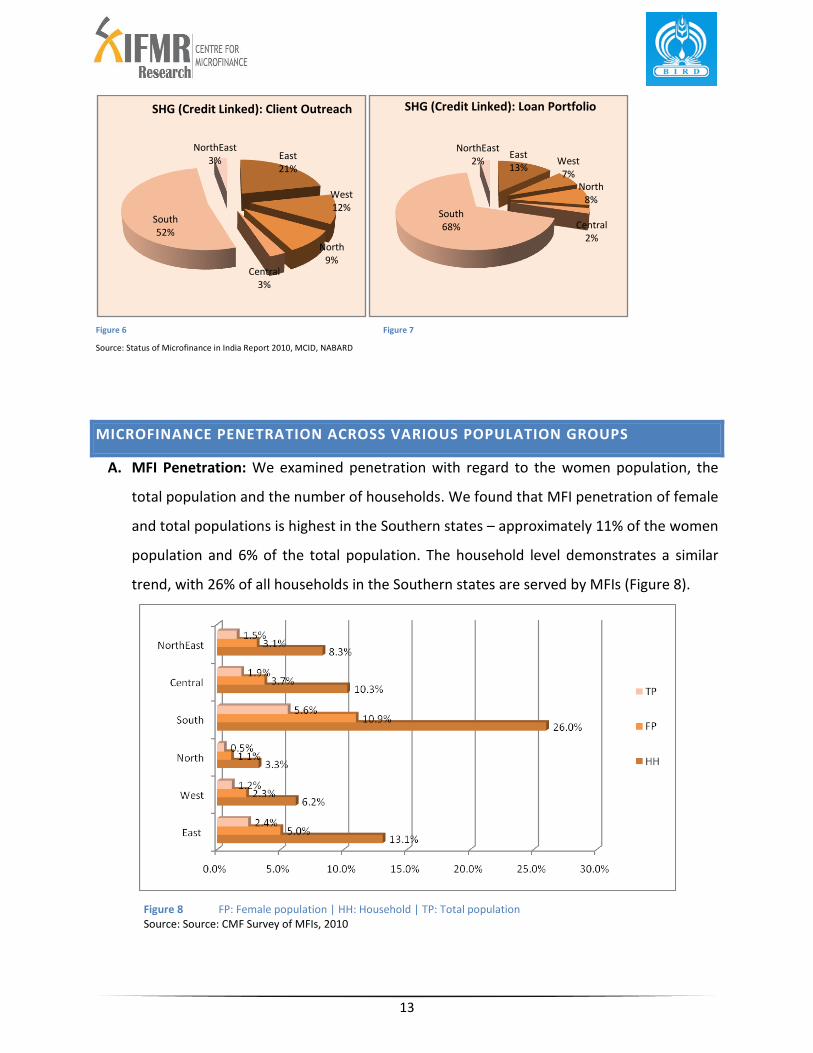
B. SHG Coverage:
Analysis of the SHG-bank linkage programme data shows a similar pattern of regional
imbalances. Southern states have a larger stake, about 52%, in client outreach and 68% in loan
portfolio through the SHG (credit linked) programme. Eastern states account for 21% of client
outreach and 13% of loan portfolio, whereas Western and Northern states seem to be
promising in carrying forward the programme but northeastern and central states have again
recorder a poor performance in terms of client outreach and loan portfolio, as can be seen from
Figure 6 and Figure 7 below.
13
East region consist of Bihar, Jharkhand, Orissa, West Bengal and Andaman and Nicobor Iceland 14
West region consist of Goa, Gujarat, Maharashtra and Rajasthan 15
Central region includes Madhya Pradesh and Chhattisgarh 16
North region consist of Chandigarh, Delhi, Haryana, Himachal Pradesh, Jammu and Kashmir, Punjab, Uttar Pradesh and Uttrakhand 17
Northeast region includes Arunachal Pradesh, Assam, Manipur, Meghalaya, Mizoram, Nagaland, Sikkim and Tripura 18
It is possible that the outreach in northeast is low because of the relatively small size of this region as compared to the other larger size regions, so it would be appropriate to look at the penetration level relative to the population of the region.
East 29%
West10%
North8%
South43%
Central6%
NorthEast4%
Distribution of MFI Branches
Figure 5 Source: CMF Survey of MFIs, 2010
13
Figure 6 Figure 7
Source: Status of Microfinance in India Report 2010, MCID, NABARD
MICROFINANCE PENETRATION ACROSS VARIOUS POPULATION GROUPS
A. MFI Penetration: We examined penetration with regard to the women population, the
total population and the number of households. We found that MFI penetration of female
and total populations is highest in the Southern states – approximately 11% of the women
population and 6% of the total population. The household level demonstrates a similar
trend, with 26% of all households in the Southern states are served by MFIs (Figure 8).
Figure 8 FP: Female population | HH: Household | TP: Total population Source: Source: CMF Survey of MFIs, 2010
East21%
West12%
North9%
Central3%
South52%
NorthEast3%
SHG (Credit Linked): Client Outreach
East13%
West7%
North8%
Central2%
South68%
NorthEast2%
SHG (Credit Linked): Loan Portfolio
14
Eastern states show less penetration, where women and total population show 5% and 2%
penetration respectively, and households show 13% penetration. The central and Northeastern
states show similar penetration of female population, however a larger percentage (10%) of the
households of the central states are served by MFIs than the Northeastern states (8%). The
Western and Northern states show lower penetration in the female population and of
households.
Some Southern states show especially high penetration. Andhra Pradesh shows 16% of female
population and 36% of all household are served by the MFIs. Similarly, in Karnataka, 12% of
female population and 32% of all households are covered, while in Tamil Nadu 9% of female
population and 20% of all households are served by MFIs.
Orissa and West Bengal are the key contributors for the Eastern States, with 8% and 7%
penetration of women population in Orissa and West Bengal respectively. Approximately 20%
of households in Orissa and 17% of households in West Bengal are served by the MFIs.
Jharkhand and Bihar are found to be poor performers in terms of MFI penetration, showing
only 3% women population and 1% of total population penetration.

15
B. SHG Penetration: SHG (credit linked) penetration is also highest in the Southern states,
where SHGs serve 24% of women population, 13% of the total population, and 61% of all
households (Figure 9).
In the Eastern states, –approximately 9% of the women population, 5% of the total population,
and 28% of households are members of SHGs. The Northeastern and Western states have
similar SHG penetration: 3% of the women population and about 22% of all households in the
Northeastern region are being served by SHGs, and 4% of the women population and about
17% of all households in the Western region are served by SHGs. However, SHG penetration
among the women population is less than 3% in the central states and only 1% in the Northern
states, though we see about 9% of households in central states and 12% households in
Northern states are members of SHG (Figure 9).
Figure 9 : SHG (Credit Linked) Penetration across Region
SHG_TP_C: SHG (credit linked) penetration among total population | SHG_FP_C: SHG (credit linked) penetration among
female population | SHG_HH_C: SHG (credit linked) penetration by household
Source: Status of Microfinance in India Report 2010, MCID-NABARD
0% 20% 40% 60% 80%
East
West
North
Central
South
NorthEast
5%
3%
2%
2%
13%
4%
9%
4%
1%
3%
24%
3%
28%
17%
12%
10%
61%
22%
SHG_HH_C
SHG_FP_C
SHG_TP_C
16
Andhra Pradesh, Kerala and Tamil Nadu are the key contributors to the penetration of SHGs for
the Southern States. About 90% of households of Andhra Pradesh have an SHG loan
outstanding, and 42% of the female population and 21% of the total population are served by
the SHG Bank linkage programme. Approximately 46% of the households in Kerala and 44% of
the households in Tamil Nadu have an SHG loan outstanding, and 16% of the female population
in Kerala and 18% of the female population in Tamil Nadu is served by the SHG Bank linkage
programme.
Orissa and West Bengal are the key contributors to the SHG movement of the Eastern states,
where 55% households of Orissa and 38% households of West Bengal have loan outstanding
under SHG programme. Among the other Eastern states, SHG (credit linked) penetration in
Bihar is only 7% of the households. In the Northeast, performance of Meghalaya is similar to
that of Bihar (covering around 9% of the households). In Northern states, 26% of households in
Himachal Pradesh and 22% households in Uttrakhand have access to SHG programme. Other
than Uttar Pradesh, the Northern states show low SHG penetration.
In the central states, Chhattisgarh has a better coverage (with 15% households having SHG
loans) as compared to Madhya Pradesh which has a much smaller level (8%) of penetration.
Among the Western states, penetration in Gujarat is much lower than the region’s average –
only 8% of households in Gujarat have SHG loans while 17% of all household in the Western
states have an SHG loan outstanding.
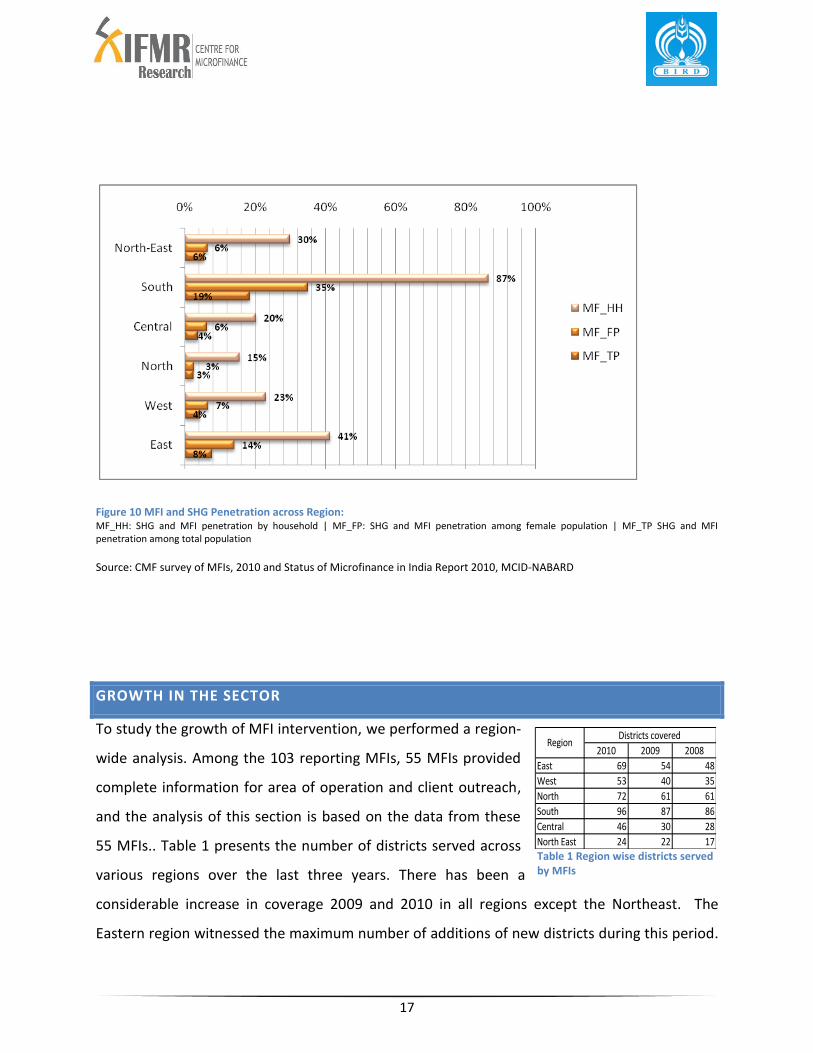
C. Penetration by SHG and MFI: SHGs and MFIs together represent the total microfinance
penetration. The Southern states show the highest penetration, followed by the Eastern
states. A clear picture emerges from the consolidated data as presented in Figure 10: though
the Southern and Eastern states show high microfinance penetration, Northern and central
states are lagging behind.
17
Figure 10 MFI and SHG Penetration across Region:
MF_HH: SHG and MFI penetration by household | MF_FP: SHG and MFI penetration among female population | MF_TP SHG and MFI penetration among total population
Source: CMF survey of MFIs, 2010 and Status of Microfinance in India Report 2010, MCID-NABARD
GROWTH IN THE SECTOR
To study the growth of MFI intervention, we performed a region-
wide analysis. Among the 103 reporting MFIs, 55 MFIs provided
complete information for area of operation and client outreach,
and the analysis of this section is based on the data from these
55 MFIs.. Table 1 presents the number of districts served across
various regions over the last three years. There has been a
considerable increase in coverage 2009 and 2010 in all regions except the Northeast. The
Eastern region witnessed the maximum number of additions of new districts during this period.
Table 1 Region wise districts served by MFIs
2010 2009 2008
East 69 54 48
West 53 40 35
North 72 61 61
South 96 87 86
Central 46 30 28
North East 24 22 17
RegionDistricts covered
18
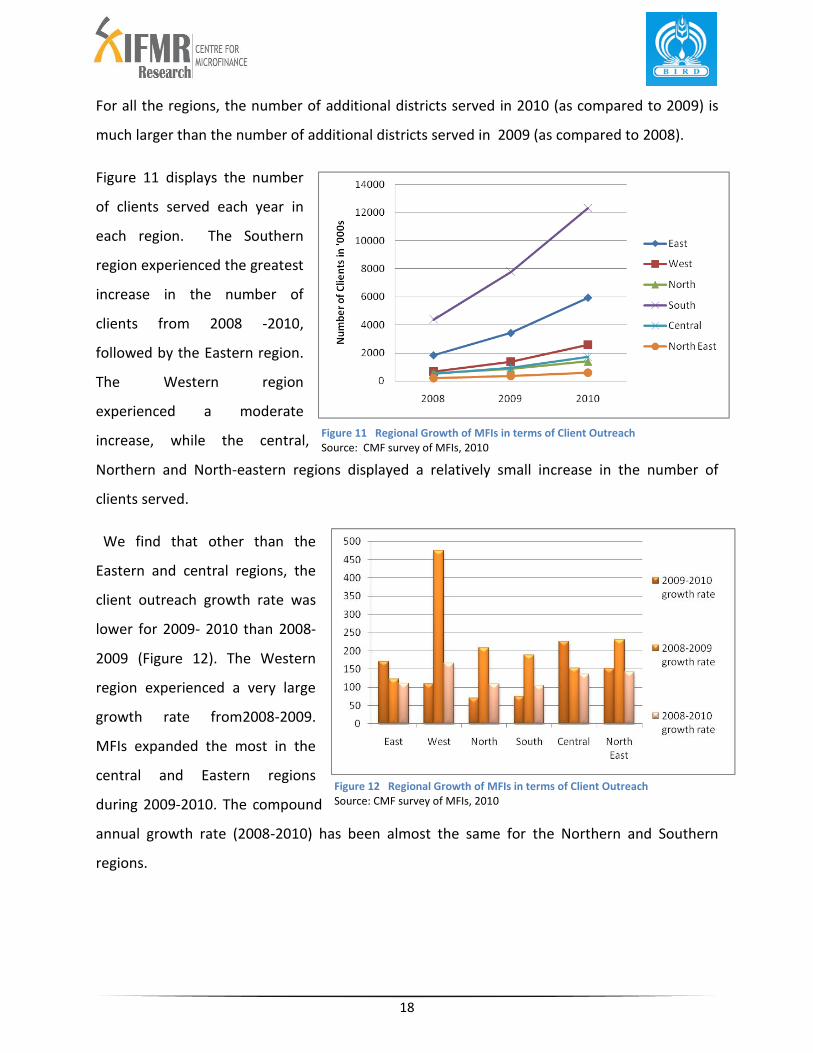
For all the regions, the number of additional districts served in 2010 (as compared to 2009) is
much larger than the number of additional districts served in 2009 (as compared to 2008).
Figure 11 displays the number
of clients served each year in
each region. The Southern
region experienced the greatest
increase in the number of
clients from 2008 -2010,
followed by the Eastern region.
The Western region
experienced a moderate
increase, while the central,
Northern and North-eastern regions displayed a relatively small increase in the number of
clients served.
We find that other than the
Eastern and central regions, the
client outreach growth rate was
lower for 2009- 2010 than 2008-
2009 (Figure 12). The Western
region experienced a very large
growth rate from2008-2009.
MFIs expanded the most in the
central and Eastern regions
during 2009-2010. The compound
annual growth rate (2008-2010) has been almost the same for the Northern and Southern
regions.
Figure 12 Regional Growth of MFIs in terms of Client Outreach Source: CMF survey of MFIs, 2010
Figure 11 Regional Growth of MFIs in terms of Client Outreach Source: CMF survey of MFIs, 2010
19
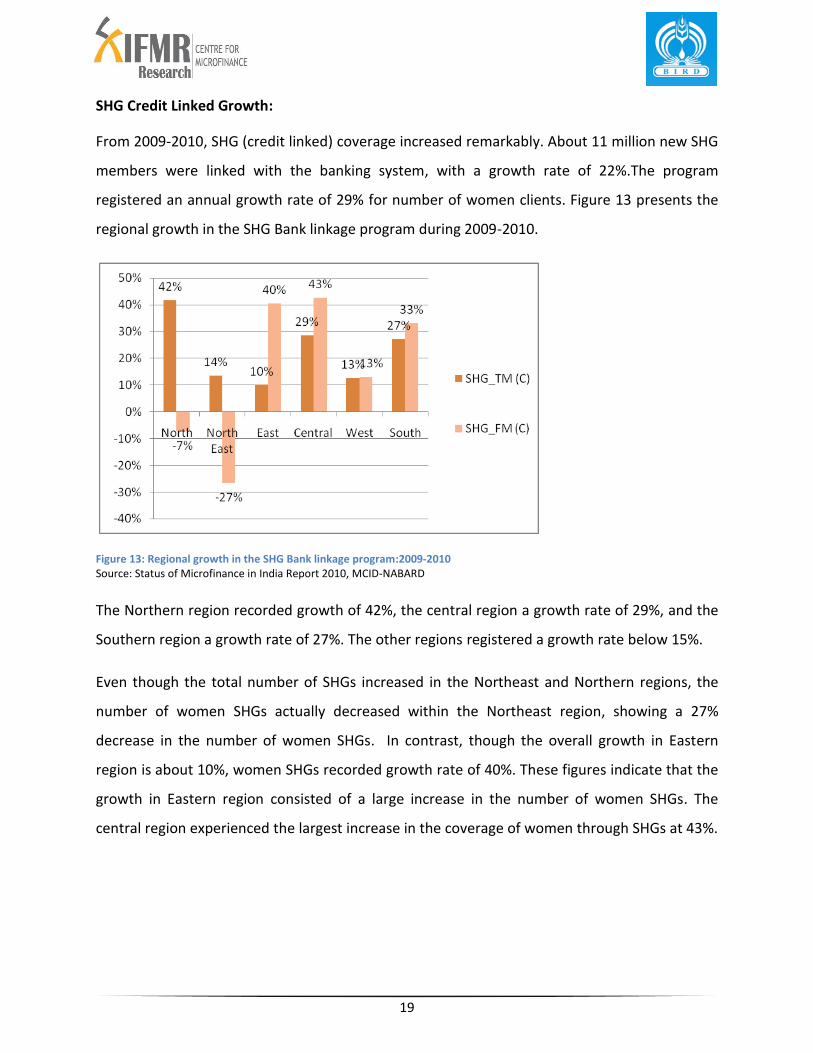
SHG Credit Linked Growth:
From 2009-2010, SHG (credit linked) coverage increased remarkably. About 11 million new SHG
members were linked with the banking system, with a growth rate of 22%.The program
registered an annual growth rate of 29% for number of women clients. Figure 13 presents the
regional growth in the SHG Bank linkage program during 2009-2010.
Figure 13: Regional growth in the SHG Bank linkage program:2009-2010 Source: Status of Microfinance in India Report 2010, MCID-NABARD The Northern region recorded growth of 42%, the central region a growth rate of 29%, and the
Southern region a growth rate of 27%. The other regions registered a growth rate below 15%.
Even though the total number of SHGs increased in the Northeast and Northern regions, the
number of women SHGs actually decreased within the Northeast region, showing a 27%
decrease in the number of women SHGs. In contrast, though the overall growth in Eastern
region is about 10%, women SHGs recorded growth rate of 40%. These figures indicate that the
growth in Eastern region consisted of a large increase in the number of women SHGs. The
central region experienced the largest increase in the coverage of women through SHGs at 43%.
20
PENETRATION AGAINST PER-CAPITA INCOME AND POOREST DISTRICT
Microfinance is expected to serve regions and people who are in need. Has the microfinance
sector, particularly MFIs, met this expectation? We will look at this question by observing
penetration with respect to per-capita income of all the Indian districts and by looking at the
penetration in the poorest districts.
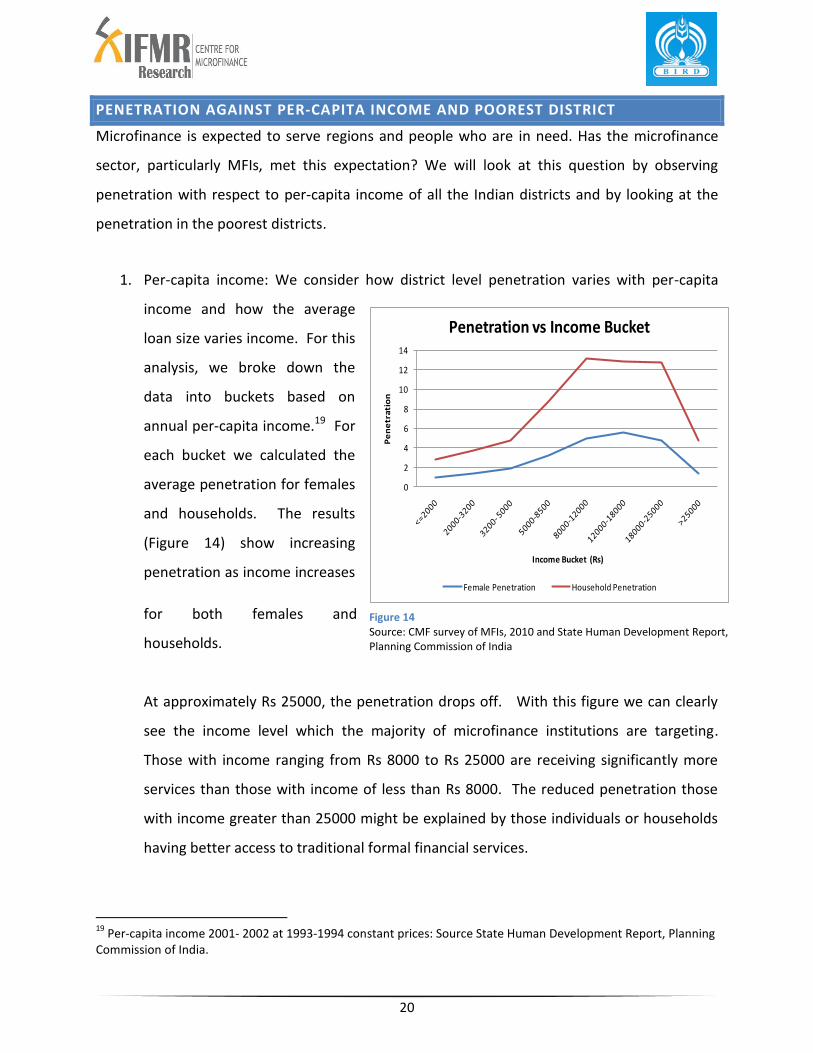
1. Per-capita income: We consider how district level penetration varies with per-capita
income and how the average
loan size varies income. For this
analysis, we broke down the
data into buckets based on
annual per-capita income.19 For
each bucket we calculated the
average penetration for females
and households. The results
(Figure 14) show increasing
penetration as income increases
for both females and
households.
At approximately Rs 25000, the penetration drops off. With this figure we can clearly
see the income level which the majority of microfinance institutions are targeting.
Those with income ranging from Rs 8000 to Rs 25000 are receiving significantly more
services than those with income of less than Rs 8000. The reduced penetration those
with income greater than 25000 might be explained by those individuals or households
having better access to traditional formal financial services.
19
Per-capita income 2001- 2002 at 1993-1994 constant prices: Source State Human Development Report, Planning Commission of India.
0
2
4
6
8
10
12
14
Pe
ne
tra
tio
n
Income Bucket (Rs)
Penetration vs Income Bucket
Female Penetration Household Penetration
Figure 14 Source: CMF survey of MFIs, 2010 and State Human Development Report, Planning Commission of India
21
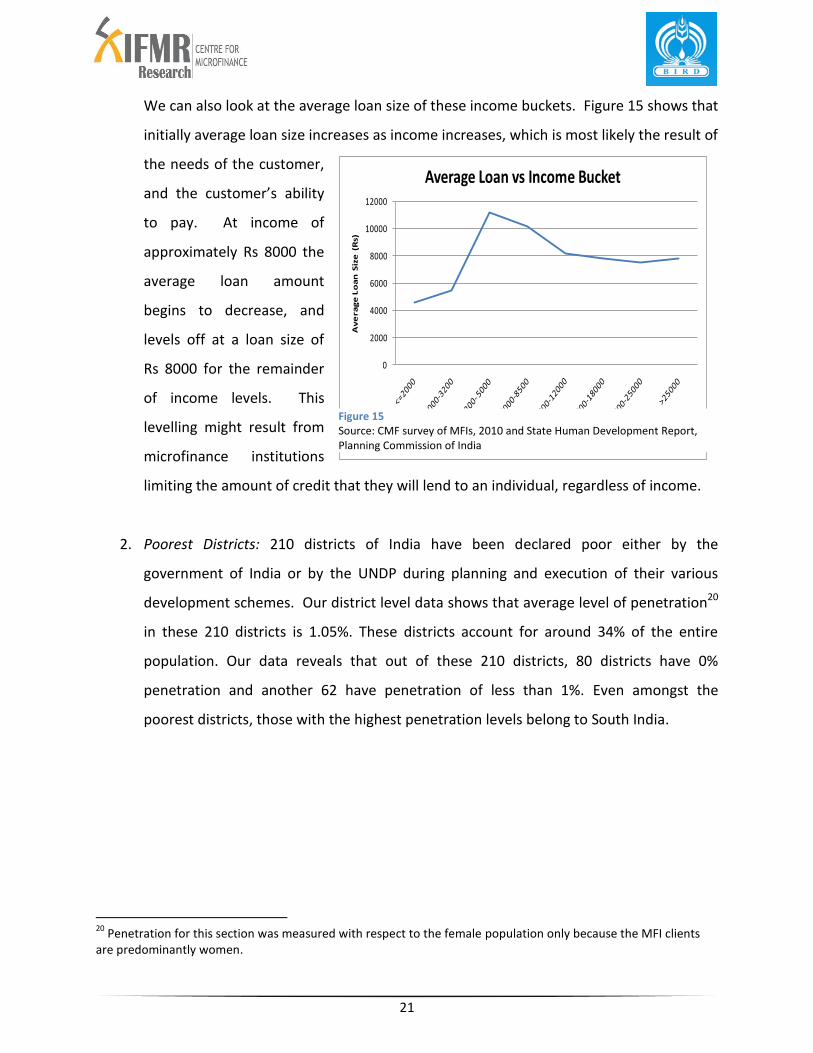
We can also look at the average loan size of these income buckets. Figure 15 shows that
initially average loan size increases as income increases, which is most likely the result of
the needs of the customer,
and the customer’s ability
to pay. At income of
approximately Rs 8000 the
average loan amount
begins to decrease, and
levels off at a loan size of
Rs 8000 for the remainder
of income levels. This
levelling might result from
microfinance institutions
limiting the amount of credit that they will lend to an individual, regardless of income.
2. Poorest Districts: 210 districts of India have been declared poor either by the
government of India or by the UNDP during planning and execution of their various
development schemes. Our district level data shows that average level of penetration20
in these 210 districts is 1.05%. These districts account for around 34% of the entire
population. Our data reveals that out of these 210 districts, 80 districts have 0%
penetration and another 62 have penetration of less than 1%. Even amongst the
poorest districts, those with the highest penetration levels belong to South India.
20
Penetration for this section was measured with respect to the female population only because the MFI clients are predominantly women.
0
2000
4000
6000
8000
10000
12000
Av
era
ge
Lo
an
Siz
e (
Rs)
Income Bucket (Rs)
Average Loan vs Income Bucket
Figure 15 Source: CMF survey of MFIs, 2010 and State Human Development Report, Planning Commission of India
22
PRODUCT DIVERSITY
We also collected information regarding the type of products offered. The data shows MFIs are
offering a variety of products, though the ‘productive loan’21 is common across the industry
irrespective of legal form or operation model. About 30% MFIs offer consumption or
emergency loans, and about 15% offering housing, education or individual loans. Some other
credit products offered by MFIs include water & sanitation loans, solar energy loans,
infrastructure loans, gold loans, debt repayment, insurance, and loan to educational
institutions.
About 15% of all MFIs registered as cooperatives and local area bank are allowed to offer
savings products. The most common savings product is the periodic compulsory savings.
Another common product is life insurance, offered by about 60% of MFIs. Cattle insurance,
health insurance and accidental insurance are other popular insurance products, offered by
about 10% of MFIs. A large number of MFIs are also engaged in serving their clients with non-
financial products and services. These services range from basic handholding, capacity building
to providing market linkages, and other livelihood support services.
Some MFIs also offer micro-pensions and remittances. These products have not yet scale-up to
reach majority significant number of the poor. Only two MFIs offer micro-pension products, and
only two others offer remittance services.
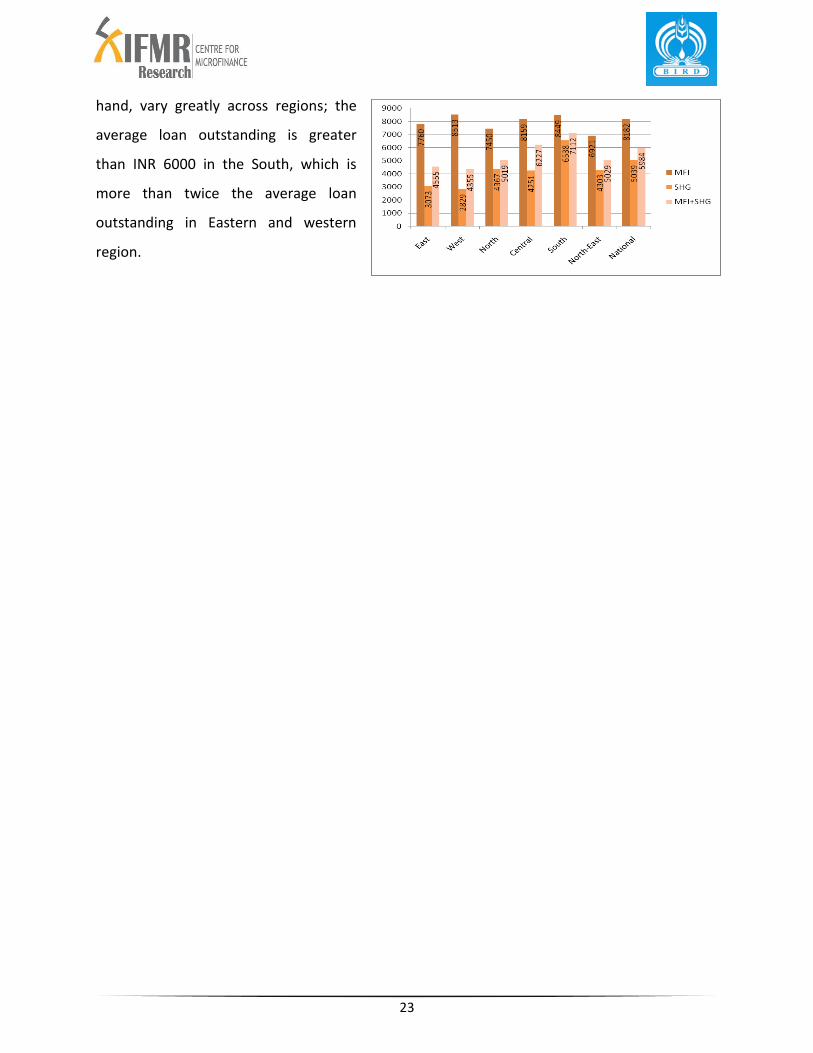
Comparison of average loan size shows that the average loan size originated by MFIs is almost
twice of the average loan size originated by SHGs (Figure 16).
The operational practices MFIs follow are similar across regions; the average MFI loan falls
within a narrow range of INR 7000 to INR 8500 in all regions. Average SHG loans, on the other
21
Productive loan: loans offer to start new income generating activities or to promote existing livelihood sources
23
hand, vary greatly across regions; the
average loan outstanding is greater
than INR 6000 in the South, which is
more than twice the average loan
outstanding in Eastern and western
region.

24
CONCLUSION
The Map of Microfinance Distribution in India visually represents the performance of the
microfinance sector at the national, state, regional, and district level. The data shows evidence
of extraordinary achievement in terms of growth in the penetration of the sector. At the same
time, a vast majority of the districts with poor socioeconomic status are underserved or un-
served. There exists a wide disparity in regional performance, with the Southern and Eastern
states showing significantly higher penetration than other regions.
The ‘Map’ provides an overall snapshot of microfinance outreach and penetration in districts
and states of India and documented the expansion of micro finance via the SHG and JLG (MFI)
models in India over the last several years. It is expected that it will assist practitioners,
policymakers and researchers to gain a clearer understanding of the overall role played by
micro finance institutions in India. Also, policymakers and practitioners can use inputs from
map to make informed decisions about the need for expansion of financial services to the poor,
and can allocate resources to address the areas remain underserved.
25
REFERENCES
1. Bharat Microfinance Report for the secondary data about MFIs.
2. Census data online, indiastat.com and Human Development reports by planning commission for state-wise and district-wise demographic and socio-economic data.
3. State of the Sector report for the adjustment factors.
4. ‘Status of Microfinance in India Report 2008-2010’ by NABARD for the SHG data.
5. Individual state websites for secondary data on districts.
6. ‘India Top 50 Microfinance Institutions’ by CRISIL for secondary data on some MFIs.
7. NEDFI databank for some secondary data on the north-eastern states and districts.
26
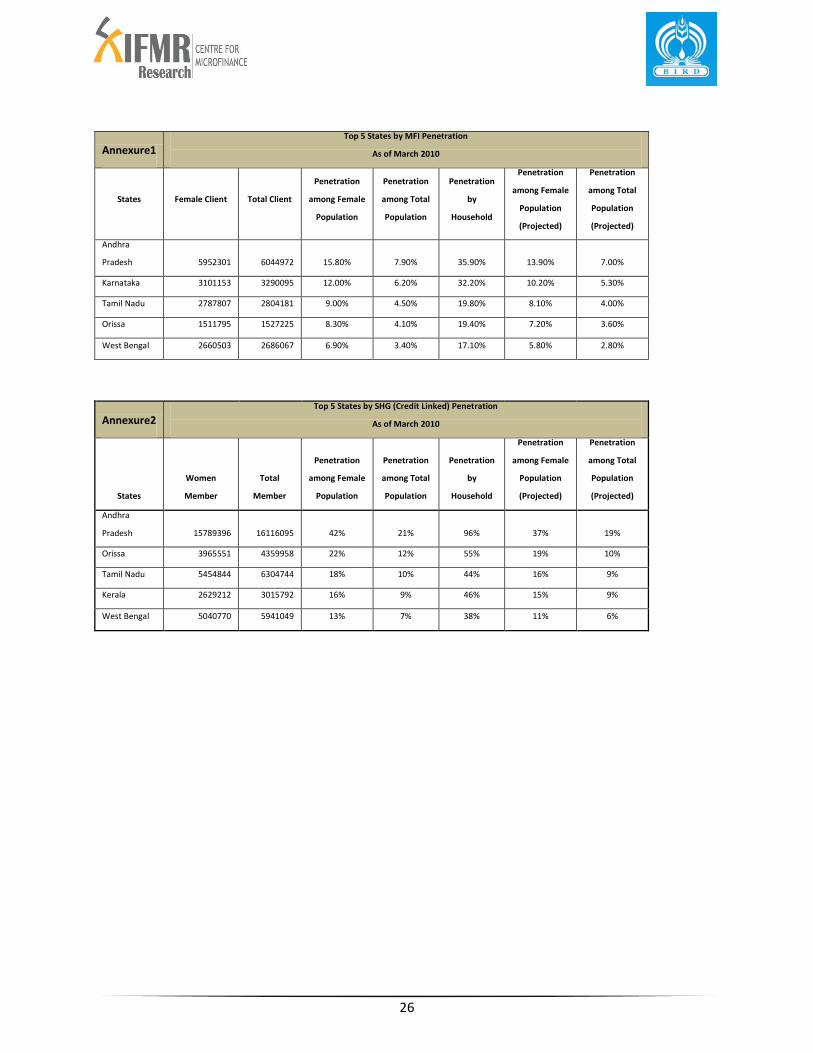
Annexure1
Top 5 States by MFI Penetration
As of March 2010
States Female Client Total Client
Penetration
among Female
Population
Penetration
among Total
Population
Penetration
by
Household
Penetration
among Female
Population
(Projected)
Penetration
among Total
Population
(Projected)
Andhra
Pradesh 5952301 6044972 15.80% 7.90% 35.90% 13.90% 7.00%
Karnataka 3101153 3290095 12.00% 6.20% 32.20% 10.20% 5.30%
Tamil Nadu 2787807 2804181 9.00% 4.50% 19.80% 8.10% 4.00%
Orissa 1511795 1527225 8.30% 4.10% 19.40% 7.20% 3.60%
West Bengal 2660503 2686067 6.90% 3.40% 17.10% 5.80% 2.80%
Annexure2
Top 5 States by SHG (Credit Linked) Penetration
As of March 2010
States
Women
Member
Total
Member
Penetration
among Female
Population
Penetration
among Total
Population
Penetration
by
Household
Penetration
among Female
Population
(Projected)
Penetration
among Total
Population
(Projected)
Andhra
Pradesh 15789396 16116095 42% 21% 96% 37% 19%
Orissa 3965551 4359958 22% 12% 55% 19% 10%
Tamil Nadu 5454844 6304744 18% 10% 44% 16% 9%
Kerala 2629212 3015792 16% 9% 46% 15% 9%
West Bengal 5040770 5941049 13% 7% 38% 11% 6%
27
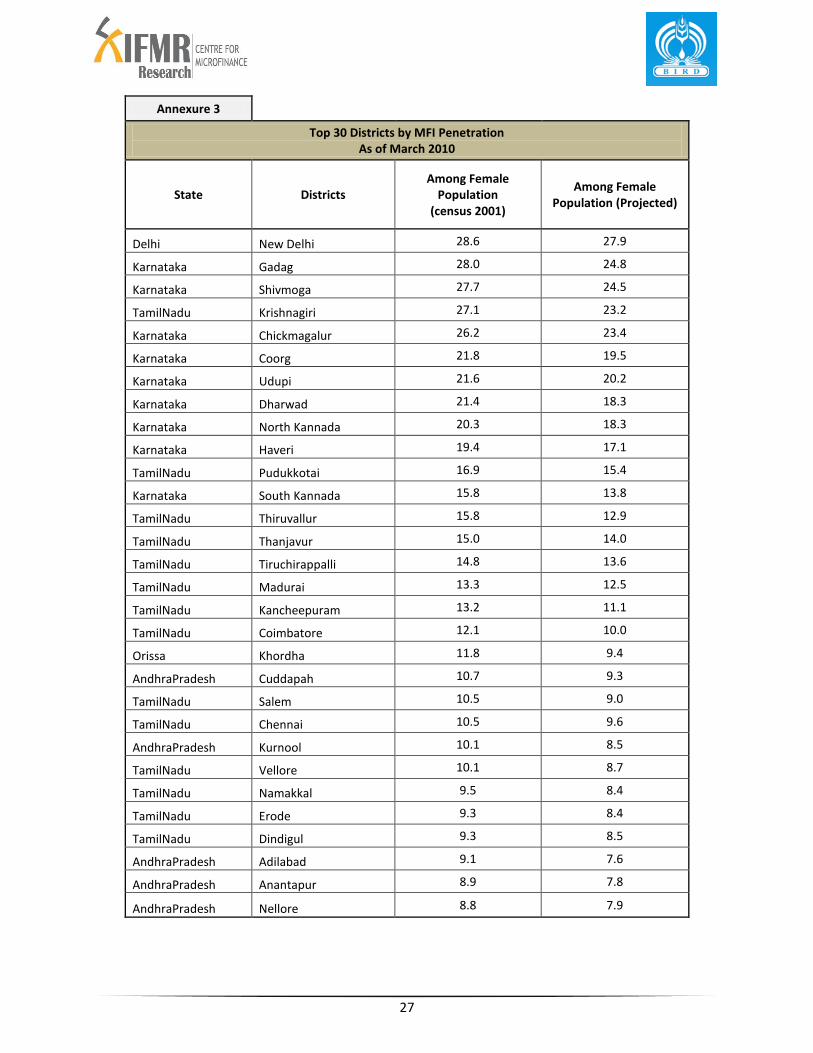
Annexure 3
Top 30 Districts by MFI Penetration As of March 2010
State Districts Among Female
Population (census 2001)
Among Female Population (Projected)
Delhi New Delhi 28.6 27.9
Karnataka Gadag 28.0 24.8
Karnataka Shivmoga 27.7 24.5
TamilNadu Krishnagiri 27.1 23.2
Karnataka Chickmagalur 26.2 23.4
Karnataka Coorg 21.8 19.5
Karnataka Udupi 21.6 20.2
Karnataka Dharwad 21.4 18.3
Karnataka North Kannada 20.3 18.3
Karnataka Haveri 19.4 17.1
TamilNadu Pudukkotai 16.9 15.4
Karnataka South Kannada 15.8 13.8
TamilNadu Thiruvallur 15.8 12.9
TamilNadu Thanjavur 15.0 14.0
TamilNadu Tiruchirappalli 14.8 13.6
TamilNadu Madurai 13.3 12.5
TamilNadu Kancheepuram 13.2 11.1
TamilNadu Coimbatore 12.1 10.0
Orissa Khordha 11.8 9.4
AndhraPradesh Cuddapah 10.7 9.3
TamilNadu Salem 10.5 9.0
TamilNadu Chennai 10.5 9.6
AndhraPradesh Kurnool 10.1 8.5
TamilNadu Vellore 10.1 8.7
TamilNadu Namakkal 9.5 8.4
TamilNadu Erode 9.3 8.4
TamilNadu Dindigul 9.3 8.5
AndhraPradesh Adilabad 9.1 7.6
AndhraPradesh Anantapur 8.9 7.8
AndhraPradesh Nellore 8.8 7.9
28
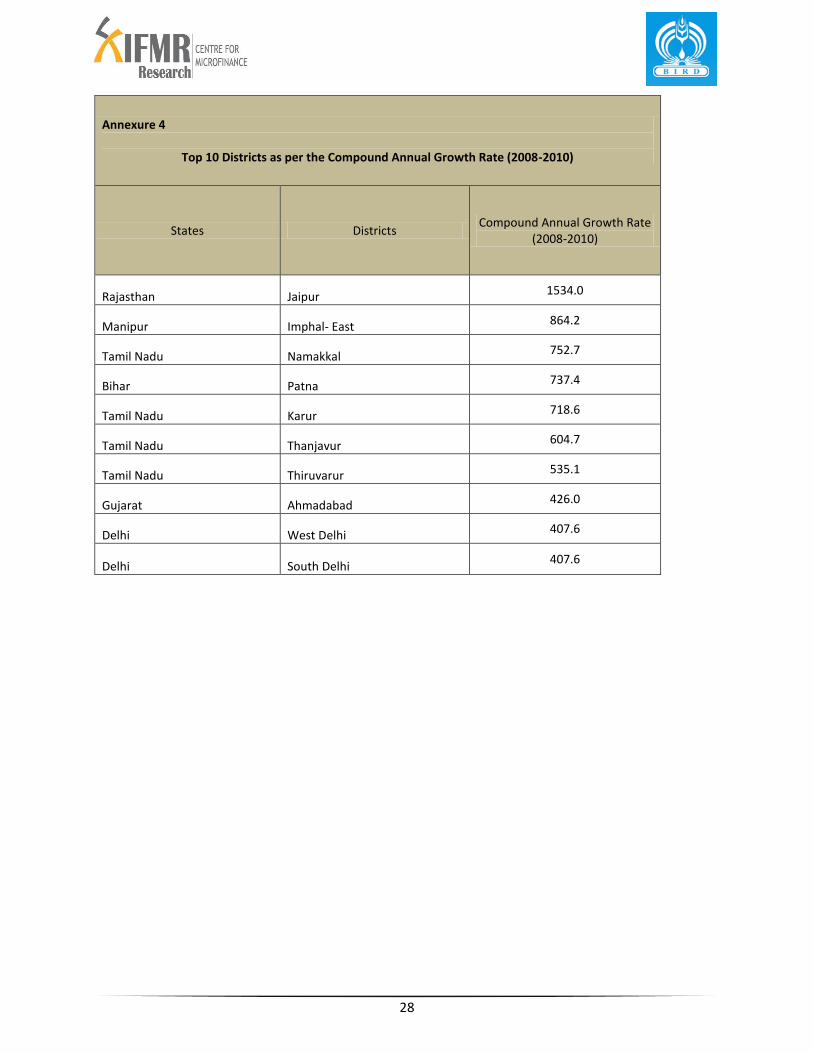
Annexure 4
Top 10 Districts as per the Compound Annual Growth Rate (2008-2010)
States Districts Compound Annual Growth Rate
(2008-2010)
Rajasthan Jaipur 1534.0
Manipur Imphal- East 864.2
Tamil Nadu Namakkal 752.7
Bihar Patna 737.4
Tamil Nadu Karur 718.6
Tamil Nadu Thanjavur 604.7
Tamil Nadu Thiruvarur 535.1
Gujarat Ahmadabad 426.0
Delhi West Delhi 407.6
Delhi South Delhi 407.6
29
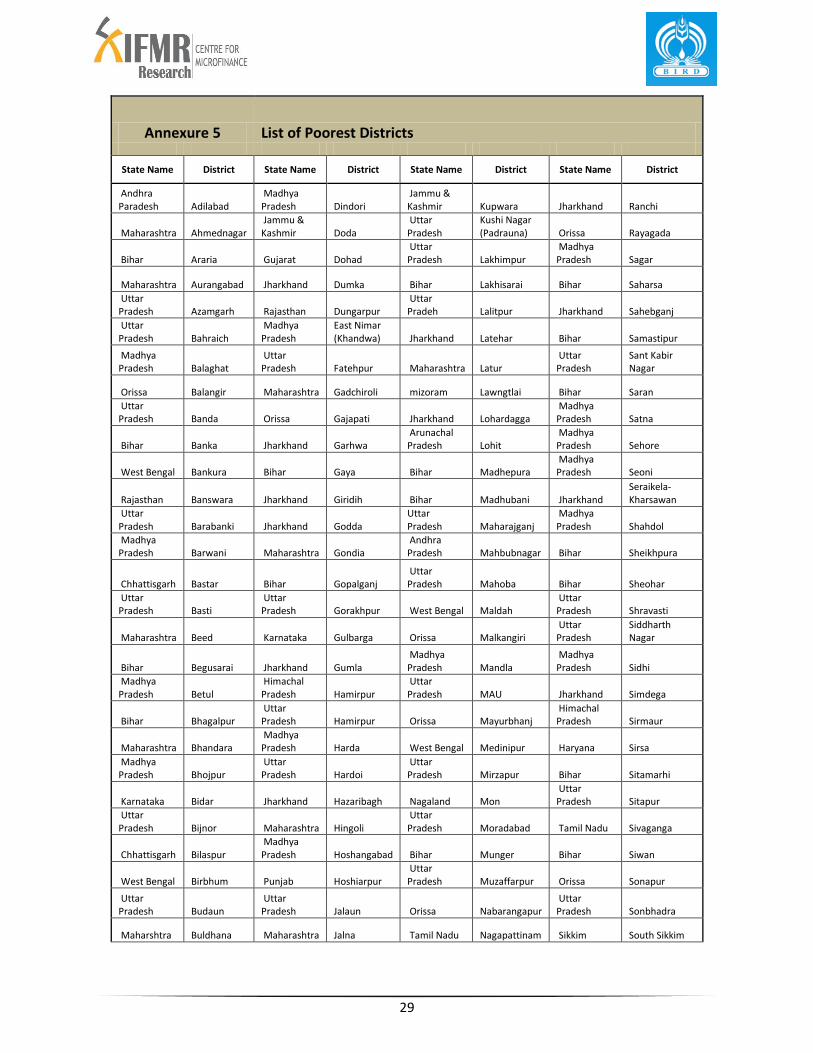
Annexure 5 List of Poorest Districts
State Name District State Name District State Name District State Name District
Andhra Paradesh Adilabad
Madhya Pradesh Dindori
Jammu & Kashmir Kupwara Jharkhand Ranchi
Maharashtra Ahmednagar Jammu & Kashmir Doda
Uttar Pradesh
Kushi Nagar (Padrauna) Orissa Rayagada
Bihar Araria Gujarat Dohad Uttar Pradesh Lakhimpur
Madhya Pradesh Sagar
Maharashtra Aurangabad Jharkhand Dumka Bihar Lakhisarai Bihar Saharsa
Uttar Pradesh Azamgarh Rajasthan Dungarpur
Uttar Pradeh Lalitpur Jharkhand Sahebganj
Uttar Pradesh Bahraich
Madhya Pradesh
East Nimar (Khandwa) Jharkhand Latehar Bihar Samastipur
Madhya Pradesh Balaghat
Uttar Pradesh Fatehpur Maharashtra Latur
Uttar Pradesh
Sant Kabir Nagar
Orissa Balangir Maharashtra Gadchiroli mizoram Lawngtlai Bihar Saran
Uttar Pradesh Banda Orissa Gajapati Jharkhand Lohardagga
Madhya Pradesh Satna
Bihar Banka Jharkhand Garhwa Arunachal Pradesh Lohit
Madhya Pradesh Sehore
West Bengal Bankura Bihar Gaya Bihar Madhepura Madhya Pradesh Seoni
Rajasthan Banswara Jharkhand Giridih Bihar Madhubani Jharkhand Seraikela-Kharsawan
Uttar Pradesh Barabanki Jharkhand Godda
Uttar Pradesh Maharajganj
Madhya Pradesh Shahdol
Madhya Pradesh Barwani Maharashtra Gondia
Andhra Pradesh Mahbubnagar Bihar Sheikhpura
Chhattisgarh Bastar Bihar Gopalganj Uttar Pradesh Mahoba Bihar Sheohar
Uttar Pradesh Basti
Uttar Pradesh Gorakhpur West Bengal Maldah
Uttar Pradesh Shravasti
Maharashtra Beed Karnataka Gulbarga Orissa Malkangiri Uttar Pradesh
Siddharth Nagar
Bihar Begusarai Jharkhand Gumla Madhya Pradesh Mandla
Madhya Pradesh Sidhi
Madhya Pradesh Betul
Himachal Pradesh Hamirpur
Uttar Pradesh MAU Jharkhand Simdega
Bihar Bhagalpur Uttar Pradesh Hamirpur Orissa Mayurbhanj
Himachal Pradesh Sirmaur
Maharashtra Bhandara Madhya Pradesh Harda West Bengal Medinipur Haryana Sirsa
Madhya Pradesh Bhojpur
Uttar Pradesh Hardoi
Uttar Pradesh Mirzapur Bihar Sitamarhi
Karnataka Bidar Jharkhand Hazaribagh Nagaland Mon Uttar Pradesh Sitapur
Uttar Pradesh Bijnor Maharashtra Hingoli
Uttar Pradesh Moradabad Tamil Nadu Sivaganga
Chhattisgarh Bilaspur Madhya Pradesh Hoshangabad Bihar Munger Bihar Siwan
West Bengal Birbhum Punjab Hoshiarpur Uttar Pradesh Muzaffarpur Orissa Sonapur
Uttar Pradesh Budaun
Uttar Pradesh Jalaun Orissa Nabarangapur
Uttar Pradesh Sonbhadra
Maharshtra Buldhana Maharashtra Jalna Tamil Nadu Nagapattinam Sikkim South Sikkim

30
Bihar Buxar West Bengal Jalpaiguri Bihar Nalanda West Bengal South Twenty Four Parganas
Himachal Pradesh Chamba Jharkhand Jamtara Maharashtra Nanded Orissa Sundargarh
Uttarakhand Chamoli Bihar Jamui Maharashtra Nandurbar Bihar Supaul
Uttarakhand Champawat Uttar Pradesh Jaunpur
Madhya Pradesh Narsimhapur Chhattisgarh Surguja
Maharashtra Chandrapur Bihar Jehanabad Bihar Nawada Manipur Tamenglong
Arunachal Pradesh Changlang
Madhya Pradesh Jhabua Assam
North Cachar Hills Uttarakhand Tehri Garhwal
Jharkhand Chatra Rajasthan Jhalawar Sikkim North Sikkim Gujarat The Dangs
Madhya Pradesh Chhatarpur
Uttar Pradesh Jhansi Orissa Nuapada
Uttar Pradesh Tikamgarh
Madhya Pradesh Chhindwara
Uttar Pradesh
Jyotiba Phoole Nagar Maharshtra Osmanabad
Arunachal Pradesh Tirap
Karnataka Chitradurga Haryana Kaithal Jharkhand Pakur Tamil Nadu Tiruvannamalai
Madhya Pradesh Chitrakoot Orissa Kalahandi Kerala Palakkad
Madhya Pradesh Umaria
Andhra Pradesh Chittoor Orissa Kandhamal Jharkhand Palamu
Uttar Pradesh Unnao
Tamil Nadu Cuddalore Chhattisgarh Kanker Gujarat Panch Mahals Arunachal Pradesh
Upper Subansiri
West Bengal Dakshin Dinajpur
Uttar Pradesh
Kanpur Dehat
Madhya Pradesh Panna West Bengal Uttar Dinajpur
Madhya Pradesh Damoh Assam
Karbi Anglong Maharashtra Parbhani Bihar Vaishali
Chhattisgarh Dantewada Bihar Katihar Bihar Pashchim Champaran
Madhya Pradeah Vidisha
Bihar Darbhanga Uttar Pradesh Kaushambi
Uttar Pradesh Pilibhit
Andhra Pradesh Vizianagaram
West Bengal Darjiling Chhattisgarh Kawardha Uttar Pradesh Pratapgarh
Andhra Pradesh Warangal
Karnataka Davangere Orissa Kendujhar Jammu & Kashmir Punch Kerala Wayanad
Jharkhand Deoghar Bihar Khagaria Bihar Purba Champaran Meghalaya West Garo Hills
Tripura Dhalai Bihar Kishanganj Bihar Purnia Madhya Pradesh
West Nimar (Khargone)
Madhya Pradesh Dhar West Bengal Koch Bihar West Bengal Puruliya Sikkim West Sikkim
Assam Dhemaji Jharkhand Koderma Uttar Pradesh Raebareli Jharkhand
West Singhbhum
Maharashtra Dhule Assam Kokrajhar Madhya Pradesh Raisen Maharashtra Yavatmal
Tamil Nadu Dindigul Chhattisgarh Koriya Chhattisgarh Rajnandgaon
31
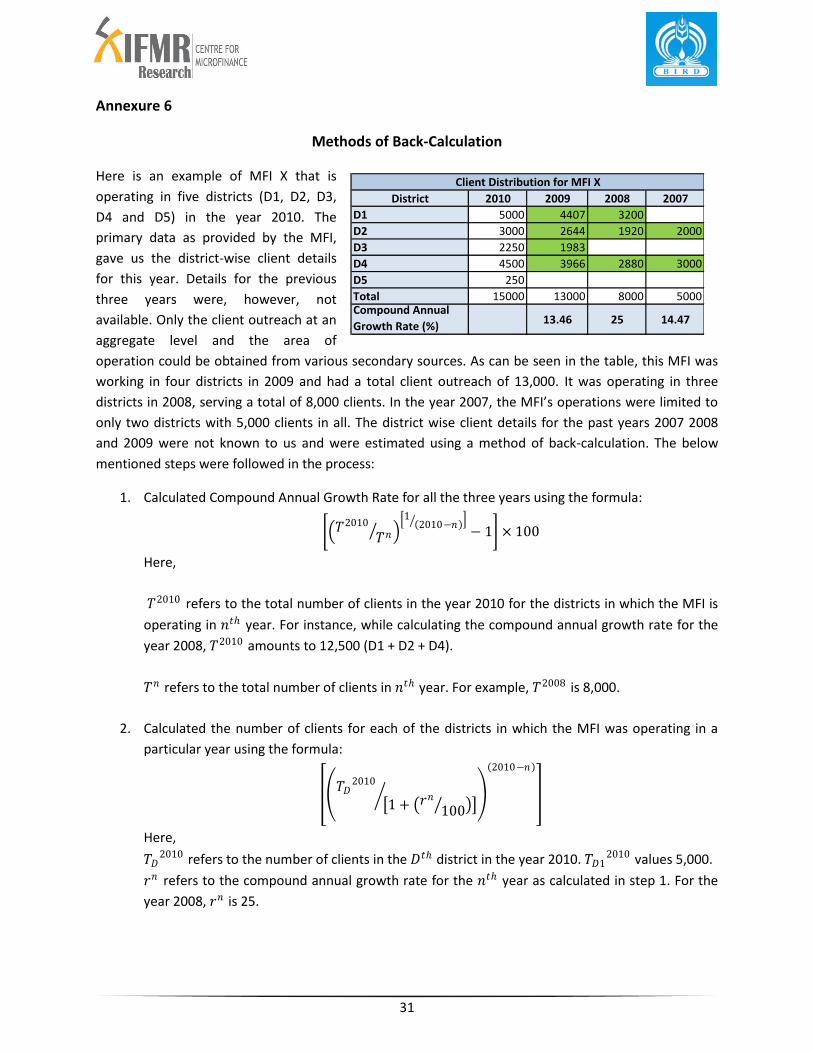
Annexure 6
Methods of Back-Calculation
Here is an example of MFI X that is
operating in five districts (D1, D2, D3,
D4 and D5) in the year 2010. The
primary data as provided by the MFI,
gave us the district-wise client details
for this year. Details for the previous
three years were, however, not
available. Only the client outreach at an
aggregate level and the area of
operation could be obtained from various secondary sources. As can be seen in the table, this MFI was
working in four districts in 2009 and had a total client outreach of 13,000. It was operating in three
districts in 2008, serving a total of 8,000 clients. In the year 2007, the MFI’s operations were limited to
only two districts with 5,000 clients in all. The district wise client details for the past years 2007 2008
and 2009 were not known to us and were estimated using a method of back-calculation. The below
mentioned steps were followed in the process:
1. Calculated Compound Annual Growth Rate for all the three years using the formula:
𝑇2010
𝑇𝑛 1 2010−𝑛
− 1 × 100
Here,
𝑇2010 refers to the total number of clients in the year 2010 for the districts in which the MFI is
operating in 𝑛𝑡ℎ year. For instance, while calculating the compound annual growth rate for the
year 2008, 𝑇2010 amounts to 12,500 (D1 + D2 + D4).
𝑇𝑛 refers to the total number of clients in 𝑛𝑡ℎ year. For example, 𝑇2008 is 8,000.
2. Calculated the number of clients for each of the districts in which the MFI was operating in a
particular year using the formula:
𝑇𝐷
2010
1 + 𝑟𝑛
100
2010−𝑛
Here,
𝑇𝐷2010 refers to the number of clients in the 𝐷𝑡ℎ district in the year 2010. 𝑇𝐷1
2010 values 5,000.
𝑟𝑛 refers to the compound annual growth rate for the 𝑛𝑡ℎ year as calculated in step 1. For the
year 2008, 𝑟𝑛 is 25.
District 2010 2009 2008 2007
D1 5000 4407 3200
D2 3000 2644 1920 2000
D3 2250 1983
D4 4500 3966 2880 3000
D5 250
Total 15000 13000 8000 5000Compound Annual
Growth Rate (%)13.46 25 14.47
Client Distribution for MFI X
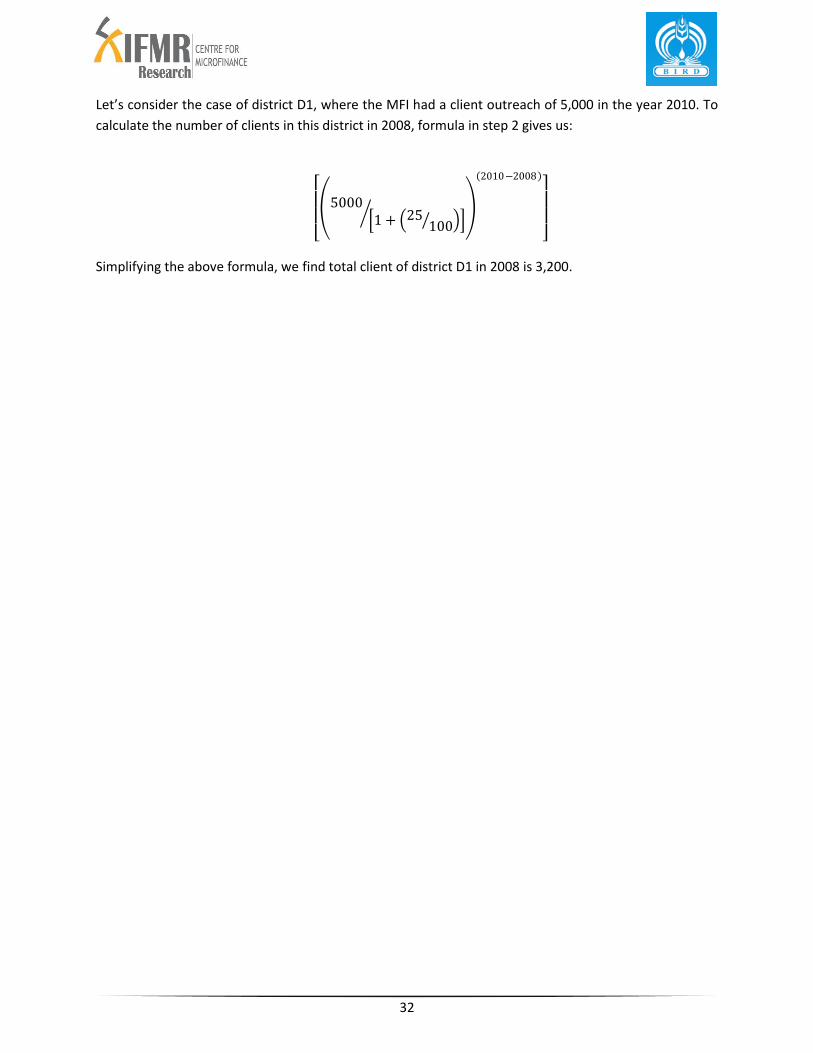
32
Let’s consider the case of district D1, where the MFI had a client outreach of 5,000 in the year 2010. To
calculate the number of clients in this district in 2008, formula in step 2 gives us:
5000 1 + 25
100
2010−2008
Simplifying the above formula, we find total client of district D1 in 2008 is 3,200.
33
Annexure 7
Among
Women
Population
Among
Total
Population
By House
Hold
Among
Women
Population
(projected)
Among
Total
Population
(projected)
Andaman & Nicobar
Islands1 424 8529958 0.2% 0.1% 0.6% 0.2% 0.1%
Andhra Pradesh 2205 6044972 54575151342 15.8% 7.9% 35.9% 13.9% 7.0%
Arunachal Pradesh - - - - - - - -
Assam 339 465520 3134650004 3.5% 1.7% 9.4% 3.0% 1.5%
Bihar 519 973768 7194864876 2.4% 1.2% 7.0% 2.6% 1.2%
Chandigarh 1 104 1172000 0.0% 0.0% 0.1% 0.0% 0.0%
Chhattisgarh 180 521411 3766312797 4.6% 2.5% 12.6% 3.9% 2.1%
Delhi 55 102832 844243174 1.6% 0.7% 4.0% 1.1% 0.5%
Goa 6 14564 147136799 2.2% 1.1% 5.2% 1.9% 0.9%
Gujarat 161 324743 2584337487 1.3% 0.6% 3.4% 1.1% 0.5%
Haryana 51 80152 760836631 0.7% 0.4% 2.3% 0.6% 0.3%
Himachal Pradesh 10 7490 58568096 0.3% 0.1% 0.6% 0.2% 0.1%
Jammu & Kashmir - - - - - - - -
Jharkhand 182 369749 2727227349 2.6% 1.4% 7.6% 2.2% 1.2%
Karnataka 836 3290095 26761430710 12.0% 6.2% 32.2% 10.2% 5.3%
Kerala 118 336481 2027295203 2.0% 1.1% 5.1% 1.9% 1.0%
Madhya Pradesh 410 1028588 8880216103 3.4% 1.7% 9.4% 3.8% 1.9%
Maharashtra 631 1603523 14151418418 3.2% 1.7% 8.4% 2.6% 1.4%
Manipur 6 7069 31182542 0.7% 0.3% 1.8% 0.5% 0.3%
Meghalaya 9 14707 144156973 1.2% 0.6% 3.5% 0.9% 0.5%
Mizoram 1 1594 11286719 0.4% 0.2% 1.0% 0.3% 0.1%
Nagaland 7 3285 17450000 0.3% 0.2% 1.0% 0.2% 0.1%
Orissa 778 1527225 14707803650 8.3% 4.1% 19.4% 7.2% 3.6%
Pondicherry 12 22091 218439278 4.5% 2.3% 10.6% 3.7% 1.9%
Punjab 4 2145 17955719 0.0% 0.0% 0.1% 0.0% 0.0%
Rajasthan 215 435632 3363936557 1.6% 0.8% 4.7% 1.2% 0.6%
Sikkim 10 16137 136740460 5.8% 3.0% 15.4% 4.4% 2.2%
Tamil Nadu 1100 2804181 22014394362 9.0% 4.5% 19.8% 8.1% 4.0%
Tripura 60 93204 687658065 6.0% 2.9% 14.1% 5.2% 2.5%
Uttar Pradesh 591 1028165 7407973145 1.3% 0.6% 4.0% 1.1% 0.5%
Uttrakhand 78 110982 832200335 2.5% 1.3% 7.0% 2.1% 1.1%
West Bengal 1402 2686101 18483864899 6.9% 3.4% 17.1% 5.8% 2.8%
MFI Outreach and Portfolio Details
Penetration
Client outreach Loan PortfolioMFI
Branch #
As of March 2010
State
34
Annexure 8
Tota
l Me
mb
er*
Excl
usi
ve
Wo
me
n
Me
mb
er
Tota
l Me
mb
er
(SH
G lo
an O
/S
wit
h t
he
m)
Excl
usi
ve W
om
en
Me
mb
er
(SH
G lo
an
O/S
wit
h t
he
m)
SHG
: To
tal
Savi
ngs
Excl
usi
ve
Wo
me
n S
HG
:
Tota
l Sav
ings
SHG
: To
tal L
oan
Ou
tsta
nd
ing
Excl
usi
ve
Wo
me
n S
HG
:
Tota
l Lo
an
Ou
tsta
nd
ing
Am
on
g To
tal
Po
pu
lati
on
Am
on
g
Wo
me
n
Po
pu
lati
on
By
Ho
use
Ho
ld
Am
on
g To
tal
Po
pu
lati
on
(pro
ject
ed
)
Am
on
g W
om
en
Po
pu
lati
on
(pro
ject
ed
)
An
dam
an &
Nic
ob
ar
Isla
nd
s44
027
3553
313
876
8705
9287
000
7969
000
3371
6000
2227
0000
4%5%
19%
3%4%
Bih
ar16
4764
110
3336
796
1916
5640
3485
3957
000
5546
0800
055
7773
0000
2559
7100
001%
1%7%
1%1%
Ori
ssa
5887
112
5471
131
4359
958
3965
551
3647
3500
0032
6958
7000
1516
0849
000
1278
9395
000
12%
22%
55%
10%
19%
Jhar
khan
d92
9261
6278
3474
5770
4484
6174
2181
000
4861
0700
029
0751
6000
1905
4950
003%
3%15
%2%
3%
We
st B
en
gal
7570
590
6121
580
5941
049
5040
770
5948
6850
0049
1100
1000
1326
9277
000
1043
8481
000
7%13
%38
%6%
11%
Go
a78
917
4361
840
073
2129
436
4931
000
2572
7500
024
5566
000
1106
7400
03%
3%14
%3%
3%
Gu
jara
t19
6770
696
4922
8106
4659
7437
3219
0150
0010
4446
3000
1416
1830
0080
1367
000
2%2%
8%1%
2%
Mah
aras
htr
a90
1713
260
9876
545
0175
128
3715
656
8282
2000
3442
0910
0012
0330
9900
099
4174
8000
5%6%
24%
4%5%
Raj
asth
an24
9555
220
1799
311
2561
087
9372
1425
5080
0089
8300
000
4632
8650
0030
7560
1000
2%3%
12%
2%3%
De
lhi
2563
524
172
1829
915
467
2348
5000
2086
8000
1339
2400
011
7303
000
0%0%
1%0%
0%
Pu
nja
b52
6559
4524
7411
7527
8720
036
4510
000
3039
9400
067
0838
000
4837
7400
00%
1%3%
0%1%
Har
yan
a43
0115
3322
9218
4883
1266
1710
7625
5000
8674
8100
015
5074
4000
1021
9860
001%
1%5%
1%1%
Him
ach
al P
rad
esh
5871
2944
0341
3183
4525
7880
3490
9000
024
3808
000
1059
7060
0084
1392
000
5%9%
26%
4%7%
Jam
mu
& K
ash
mir
5108
228
607
1948
156
9818
1883
000
1938
7000
1032
5600
035
5810
000%
0%1%
0%0%
Utt
ar P
rad
esh
5028
192
1236
596
3958
777
1037
439
2646
4030
0069
6993
000
1635
8750
000
3766
3270
002%
1%15
%2%
1%
Utt
rakh
and
5174
0926
1413
3515
7323
9370
7173
1700
015
1875
000
1823
2580
0013
0179
5000
4%6%
22%
3%5%
Ch
hat
tisg
arh
1333
589
8775
7061
5280
4564
9975
7806
000
5139
0300
019
9061
3000
1352
0600
003%
4%15
%3%
4%
Mad
hya
Pra
de
sh20
8524
410
8326
890
0058
5449
1610
1510
7000
4743
1600
044
5133
9000
2427
7620
001%
2%8%
2%2%
An
dh
ra P
rad
esh
1694
4127
1671
8657
1611
6095
1578
9396
1255
2898
000
1221
1892
000
1173
9536
2000
1148
6626
8000
21%
42%
96%
19%
37%
Kar
nat
aka
6254
680
4766
451
3518
635
2799
787
6270
5320
0038
5617
2000
2055
3033
000
1687
1009
000
7%11
%34
%6%
9%
Ke
rala
4612
105
3826
391
3015
792
2629
212
3755
6320
0028
6156
3000
1025
3066
000
8163
2770
009%
16%
46%
9%15
%
Tam
il N
adu
9672
507
8430
657
6304
744
5454
844
9037
3260
0072
5224
8000
4059
4220
000
3286
6056
000
10%
18%
44%
9%16
%
Po
nd
ich
err
y23
0759
2221
2515
7517
1524
6312
8696
000
1176
9100
015
3311
8000
1510
3510
0016
%31
%75
%13
%26
%
Aru
nac
hal
Pra
de
sh75
091
4022
537
475
2692
216
4890
0010
4000
0010
6849
000
8104
7000
3%5%
18%
3%4%
Ass
am25
5471
865
8043
1174
937
3725
6373
5994
000
2556
5400
049
1233
7000
2052
8500
004%
3%24
%4%
2%
Man
ipu
r12
6723
8465
052
088
4243
621
8560
0013
2520
0018
7858
000
1392
7900
02%
4%13
%2%
3%
Me
ghal
aya
1379
0883
164
3733
522
172
3602
5000
1927
6000
1339
8300
076
3800
002%
2%9%
1%1%
Miz
ora
m59
635
2514
324
535
9009
2514
0000
5293
000
2325
9000
085
3150
003%
2%15
%2%
2%
Nag
alan
d69
334
3563
849
561
3563
833
4370
0082
6400
014
5016
000
1080
6600
02%
4%15
%2%
2%
Sikk
im28
408
2059
218
767
1673
114
1980
0098
5900
047
4170
0042
1100
003%
7%18
%3%
5%
Trip
ura
3667
8321
0179
1705
8685
211
3335
7000
020
1250
000
9687
2900
045
1603
000
5%5%
26%
5%5%
No
te:
1) R
efe
rin
g to
NA
BA
RD
's r
ep
ort
ave
rage
gro
up
siz
e h
as b
ee
n c
on
sid
ere
d 1
3
2) M
em
be
r si
ze h
as b
ee
n r
ed
uce
d b
y 10
% t
o a
dju
st f
or
du
pli
cati
on
As
of
Mar
ch 2
010
No
rth
East
Re
gio
n
SHG
Ban
k Li
nka
ge P
rogr
amm
e
REG
ION
an
d S
TATE
SHG
Sav
ings
Lin
ked
SHG
Cre
dit
Lin
ked
Sa
vin
gs P
ort
foli
o
Loan
Po
rtfo
lio
Pe
ne
trat
ion
East
Re
gio
n
We
st R
egi
on
No
rth
Re
gio
n
Ce
ntr
al R
egi
on
Sou
th R
egi
on
35
Annexure 9
List of MFIs Reported
Name of the MFI Contact Details Year of Establishment
Current Legal Status
Number of
Operation State/s
Number of
Operation District/s
Total Branch
#
Total Client
(in Thousan
ds)
Total Loan
O/S (in Lakhs)
Adhikar Micro Finance
77/180/970,Subudhipur, Bhubaneswar-751019
1991 NBFC 3 15 40 61.74 3887.88
Ajiwika Society Behind SBI Trg. Centre, Deoghar- 814112, Jharkhand
2006 Section 25 Company
2 10 15 17.06 894.21
Annapurna Mahila Multi State Co Op Credit Society
26, C Wing , Shubham Heights, Mumbai Banglore Bye pass Service Rd. Warje, Pune 411058
1986 Cooperati
ve 1 4 13 20.58 1076.49
ANUP LEASING PRIVATE LIMITED, (Shikhar Finance & Development Services)
159/9, First Floor, Kishangarh (Near Car Market), Vasant Kunj, New Delhi–70 1993 NBFC 3 10 10 9.12 444.59
Arohan Financial Services Ltd.
Prafulla, 195/1 Rajdanga, Chakraborty Para, P.S. Kasba, Kolkata - 700107
1991 NBFC 2 10 86 187.75 9779.54
Asomi Finance Pvt Ltd
4th Floor, Above SBI ATM, Bharalumukh, Guwahati, Assam
2001 NBFC 1 18 50 48.59 2169.54
Associated Gramya Unnayan Society (AGUS)
Bogidole Panch Ali, P.O. Bogidole, Dist. Sivasagar 1988 Society 1 3 68 4.87 0.00
At Grassroots Society
V 30/3 DLF phase- III, Gurgaon-122002, Haryana
2009 Society 1 1 1 0.19 24.32
BANKI ANCHALIKA ADIBASI HARIJAN KALYAN PARISAD
At/P.o. Basnki, Dist. Cuttack(pin code-754008), State-Odisha, India
1982 Society 1 3 3 17.14 26.44
Bazaari Global Finance Limited
E- 66, Shopping Centre, Shastri Nagar, Jodhpur- 342 003 (Raj.)
1995 NBFC 1 4 9 4.05 192.91
Belghoria Janakalyan Samity
BF – 94, Salt Lake City, Kolkata – 700 064 2006 Society 1 2 7 6.04 248.19
Bharat Integrated Social Welfare Agency (BISWA)
AT: Daniplai, PO: Budharaja, Dist: Sambalpur, Odisha, 768004
1994 Society 5 46 197 32.63 25574.7
3
Bhartiya Samruddhi Finance Ltd.
Ascent Tower, 8-2-596/C/2 to C/5, Road No.10, Banjara Hills, Hyderabad – 500 034
1998 NBFC 14 87 115 1113.11 99739.9
8
Bihar Development Trust
A 6, First Floor, Professors Colony, Chitragupta Nagar, Patna-800020, Bihar
2007 Trust 1 2 2 1.96 112.89
BWDA Finance Limited
No. 858 East Pondy Road, Villupuram – 605602, Tamil Nadu
2003 Section 25 Company
3 10 32 23.98 13713.9
3
36
Cashpor Micro Credit
B/4, DIG Colony, Varanasi-221002, Uttar Pradesh, India
2002 Section 25 Company
2 15 269 417.04 26739.8
2
Centre for Community Economics and Development Consultation Society (CECOEDECON)
F-159-160, Sitapura Industrial Area, Jaipur - 302022
1982 Society 1 4 6 4.96 684.45
Chanura Microfin Manipur
Hodam Leirak Machin, Airport Road Opp. Tiddim Oil Service, Imphal West- 795001, Manipur, India
2007 Society 1 2 3 5.79 272.63
CRESA Financial Services Pvt. Ltd
Prem Towers, D.No 73-12-4A, Near Municipal School, Narayanapuram, Rajahmundry, AP
1998 NBFC 1 2 21 39.60 2486.41
Dhanei Kshetriya Grameen Services
Plot No, 1, Survey No.1308/2948, Upstairs, Subhalakshmi Real Estate, 5th lane Ananta Nagar, Berhampur-760005
2009 Section 25 Company
1 1 15 4.60 571.70
DHOSA CHANDANESWAR BRATYAJANA SAMITY
Vill & Post-Dakshin Barasat, Ps-Jaynagar, Dist-South 24 Pgs, Pin-743372
2003 Society 1 1 4 6.25 245.00
Disha India Micro Credit
Moh. Mandir Ji Sultanpur-Chilkana, Distt. Saharanpur. 247231
1984 Section 25 Company
2 2 8 8.37 322.76
DMatrix Development Foundation
P.O. Dattapur, Tal. & Dist. Wardha, PIN- 442001 (Maharashtra)
2009 Section 25 Company
1 1 2 0.49 23.18
Equitas Micro Finance India P Ltd.
4th Floor, Temple Towers, 672, Anna Salai, Nandanam, Chennai- 600035, T N
NBFC 6 32 185 888.60 60528.4
4
ESAF Microfinance and Investments (P) Ltd.
2nd Floor, Hephzibah Complex, Mannuthy P.O, Thrissur, 680 651, Kerala
1992 NBFC 5 30 105 300.02 15564.1
5
Gram Utthan At/Po: Pimpuri, Via-Rajkanika, Kendrapara, Orissa- 754220
1990 Society 1 8 25 64.56 4487.00
Grama Vidiyal Microfinance Limited
2A Sathiya Illam, 10th cross, Alli street, Annamalai Nagar, Trichy-620018,TamilNadu
2003 NBFC 5 36 227 849.33 60515.5
7
Grameen Financial Services Pvt. Ltd.
Avalahalli, Anjanapura(Post), J P Nagar 9th Phase, Bangalore, Karnataka, India, 560 062
1995 NBFC 3 36 146 427.14 33017.1
7
Grameen Sahara 2nd Floor Samabai Building, Kulshi Road, Chhaygaon, Kamrup, Assam-781124
2002 Society 1 3 9 6.95 455.87
37
Growing Opportunity Finance (India) Pvt. Ltd.
No.12, Ramasamy Street, T. Nagar, Chennai 600 017
1996 NBFC 2 8 13 63.27 2815.64
Guidance Society For Labour Orphans & Women
Sowlore, K.Pudur Post , Thirupattur Tk, Vellore District
1996 Society 1 1 6 7.33 462.23
Hand in Hand 90A Chengalpattu Road, Nasarathpet Village, Little Kancheepuram, Kancheepuram District 631 503, Tamil Nadu,
2002 Trust 3 18 100 92.38 4048.32
HINDUSTHAN CO-OP. CREDIT SOC. LTD. (Microfinance Division)
6, Hirabai Compound, Ambedkar Nagar, Jarimari, Kurla Andheri Road, Kurla (W), Mumbai – 400072
1987 Cooperati
ve 1 8 6 4.27 1083.33
Human Development Agency
Uripok Cheirap Mamang Imphal, Manipur- 795001
2003 Society 1 2 2 1.13 15.82
Human Development Centre
Vill. : Mastikari, P.O. : Dakshin Barasat, Dist. : South 24-Parganas, Pin. : 743372, West Bengal
1986 Society 1 3 7 13.32 430.94
IDF Financial Services Private Limited (FSPL)
No 147, First Floor, 1st Main, 11C Cross, West of Chord Road- II Stage, Behind GD Naidu Hall, Bangalore 560 086
2004 NBFC 1 10 5 10.22 5770.82
Indian Association for Savings and Credit (IASC)
726/B, Second Floor, Sri Venky Complex, Cross Cut Road (Near Fly Over), Coimbatore- 641042, Tamil Nadu
1998 Section 25 Company
2 6 24 78.87 2761.11
Indira Priya Darsini Women's Welfare Association
Door No; 11-88, Nethaji Road, Jadcherla (Post), Mahabubnagar District, Andhra Pradesh, Pin; 509301
1998 Society 1 1 1 3.57 278.00
Indur Intideepam Mutually Aided Thrift & Credit Co-operatives’ Federation Ltd. (IIMF)
H.No:5-67, Village: Dharmaram (B), Mandal :Dichpally, Nizamabad-503 230, District Nizamabad
2002 Cooperati
ve 1 2 19 24.67 2714.45
Kotalipara Development Society
Santanir, Arabindapally, Noapara, Barasat, North 24 Pgs, Kolkata-700124
1991 Society 1 9 89 70.02 2305.28
Krishna Bhima Samruddhi Local Area Bank
# 7-4-58/1 ,P.C.Towers , Venkateswara Colony,Mahabubnagar-509002(AP),India
1999 NBFC 2 3 14 61.77 7768.35
Liberal Association for Movement of People
28/1B/1,Bosepukur Road , Kolkata 700042
1979 NBFC 3 7 41 57.48 642.27
Lok Biradari Trust
14/2, Snehlataganj, Indore – 452003 (M.P.) 1989 Trust 1 4 5 4.72 262.23
38
Manidham Grameen Savings cum Credit Services (MGSCS)
NO: 5, Sathiyamurthi Street, Suvalpettai, Arakkonam, Vellore
Section 25 Company
1 5 24 32.06 582.51
Margdarshak Development Services
B-905, CID Colony, Mahanagar, Lucknow-226006
2006 Section 25 Company
1 4 13 11.85 785.67
Mimoza Enterprises Finance Pvt. Ltd.
35/2/9, Kishan Garh, Opp. D-3 Church, Vasant Kunj, New Delhi-110070
2006 NBFC 6 24 27 52.35 3350.99
Mitr Executive Office: 23 Soutwest Block, Kala Kuan Main Road, Near Devyani Hospital, Alwar Rajasthan 301001
2008 Society 1 1 2 2.70 153.70
Multiple Finance Pvt. Ltd. (WE THE PEOPLE Group)
102, D211, Laxmansingh Complex I, Munirka, New Delhi, PIN 110067
2005 NBFC 2 3 2 1.65 19.63
NANO FINANCIAL SERVICES INDIA PRIVATE LIMITED (formerly AADARSHA WELFARE SOCIETY)
H.No. 6-3-1099/1/14 & 15, Flat No. 301, Lake Melody Apartments, Near Katriya Hotel, Raj Bhavan Road, Somajiguda, Hyderabad- 500082
1994 NBFC 2 3 13 21.51 1672.71
Nav Bharat Jagriti Kendra
Coordination Office, Amritnagar, PO:- Korrah, District:- Hazaribagh, Jharkhand- 825301
1971 Society 2 7 14 9.91 585.88
New Life 12-B, Athiyaman Towers, 2nd Cross, Kambar Street, Kumaran Nagar, Trichy-17
1993 Society 1 8 8 16.76 71.43
Nidan Microfinance Foundation
Bihar Office: 304,3rd Floor, Maury Tower, C Block, Maurya Lok Complex, Patna 840001
1996 Section 25 Company
2 4 7 2.96 323.48
Nightingale Charitable Society
D.R. Pathak Bhawan, Natun Sarania, Chandmari, Guwahati-3
1997 Society 1 1 4 11.30 463.00
Nirmaan Bharati Samajik And Arthik Vikas Sangathan
B-991, Mandir Marg Sector A, Mahanagar, Lucknow 226007, UP, India
2006 Section 25 Company
3 7 16 82.94 2092.13
Organization for Development of Economic Self-Help (ODESH)
Khangabok Bazar, Thoubal District, Manipur- 795138
2001 Society 1 1 1 0.93 23.37
OUTREACH No.109, Coles Road, Frazer Town, Bangalore- 560005
1993 Society 3 7 7 7.80 184.81
PAHAL Village Sultan Nagri, Near Railway Station, Gola Barrage Road, Kathgodam, Nainital, Uttrakhand
1988 Society 2 5 9 1.71 81.51

39
PRAYAS (Organization for Sustainable Development)
Prayas, 60, Maruti nagar, Anjar, Kutchh -370110, Gujarat
1997 Trust 1 3 6 6.02 235.09
PROCHESTA Sonadhar Senapati Path, House No – 2, 2nd Floor, Goswami Service Station, Silpukhuri, Guwahati – 781 003
1998 Society 1 14 6 2.98 132.15
Pudhuaaru Financial Services Private Limited
II Floor No. 66/2999, No.1, Trichy Main Road, Thanjavur, Tamil Nadu -613 007
1993 NBFC 1 1 50 42.43 3804.71
Rajasthan Shram Sarathi Association
38 Mangalam Complex, Siphon Colony, Off Bedla Road, Udaipur-313004, Rajasthan
2007 Section 25 Company
1 2 2 0.57 18.97
Rashtriya Gramin Vikas Nidhi Credit & Savings Programme
House No.2, Padma Path, Bye Lane No.8, R.G. Baruah Road, Zoo Road Tiniali, Guwahati 781 024, Assam, India
1990 Society 2 20 67 101.39 5655.31
Rural Education and Action Development (READ)
1926 Sakthi Vinayagar Street, Vilandai, Andimadam 621-801, Perambalur District, Tamil Nadu
1994 Society 1 2 4 4.78 165.21
Sahastradhara Kshetriya Grameen Services
38A, Jogiyana Athurwala Post office, Opposite, Jolly Grant Airport, Bhaniawala, District Dehradun, Uttarakhand, 248 144
2009 Section 25 Company
1 1 15 4.21 402.31
Samarthan Weakling Development Foundation
Rajbari, Mihijam, Jamtara
2007 Section 25 Company
1 1 2 1.29 73.77
Samruddhi Welfare Development Foundation
Flat No.2, Pooja Heritage, Plot No.46 Anand Park, Lane No.3, Aundh, Pune - 411 007
2009 Section 25 Company
1 1 0 0.06 22.87
Sanghamithra Rural Financial Services
No. 612, 1st ‘C’ Main Road, Domlur Layout, Bangalore- 560 071
1995 Section 25 Company
3 22 60 118.81 13324.9
1
SANGHATITHA MAHILA MACS FEDERATION LTD
H.No:1-7-1107, Road No: 01, Advocates Colony, Balasamudram, Hanamkonda, Warangal -506001, Andhra Pradesh
2005 Cooperati
ve 1 1 26 16.49 145.73
Sarbu Gram Sewa Sangh
Vill. 1 No. Barajan, P.O.- Machkhowa, Dist:- Dhemaji
1998 Society 1 2 2 0.06 6.05
Sarvodaya Nano Finance Limited
279, Avvai Shanmugam Salai, Royapettah, Chennai-600014
1996 NBFC 6 22 113 147.12 8560.82
Satin Creditcare Network Limited
Corporate Office: 5th Floor, Kundan Bhawan, Azadpur Commercial Complex, Delhi - 110033
1990 NBFC 8 45 97 165.91 16886.5
6
40
Semam Microfinance Investment Literacy & Empowerment Ltd (SMILE)
No. 4/22, Dr. Natesan Road, (Opposite Police Training College), Ashok Nagar, Chennai-600083
1999 NBFC 1 12 99 214.28 14240.2
3
Shramik Bharti 392 Vikas Nagar, Kanpur - 208024
1986 Society 1 2 9 16.14 544.00
Shree Kshetra Dharmasthala Rural Development Project®.
Dharmashree Building, Dharmasthala. Pin 574216 1982 Society 1 9 34 1252.91
68909.78
Shree Mundra Ujjas Mahila Savings & Credit cooperative Society Li. (MUNDRA)
Kushal Manch, 12,Nootan Colony, Opp. Santosimata Temple, Bhuj-Kutch- 370001
2008 Cooperati
ve 1 1 1 2.00 38.07
Shree Pachhim kutchh Mahila Savings & Credit cooperative Society Li. ( Nakhtrana)
Kushal Manch, 12,Nootan Colony, Opp. Santosimata Temple, Bhuj-Kutch- 370001
2008 Cooperati
ve 1 1 1 2.30 43.29
Social Action For Appropriate Transformation And Advancement In rural Areas ( SATRA)
Dhanai Bora Chowk, Sipajhar, P.O + P.S. – Sipajhar, Dist: Darrang (Assam), PIN : 784145 2002 Society 1 4 3 5.63 151.90
Society for Pragti Bharat
Dev Villa, Bank Colony, Civil Lines, Lalitpur, U.P.
1997 Society 1 1 1 0.00 0.00
Sonata Finance Private Limited
1/ 1 Rai Bahadur Ram Charan Das Road, Balrampur House, Allahabad (U.P.) - 211002
1995 NBFC 2 15 66 85.90 5652.03
Sri. Bhargavi Mahila Sakthi Mutually Aided Cooperative Thrift and credit society Ltd.
Machilipatnam, D.No. 21/357-1, Janasakthi Nagar, Bhaskarapuram – 521001
2002 Cooperati
ve 1 1 4 13.92 13.39
Star MicroFin Service Society (SMSS)
# 17-178-17/1, Beside Telephone Exchange, Velugodu – 518 533, Kurnool District, Andhra Pradesh, Soth India
2002 Society 1 2 11 29.61 2139.68
SUPPORT D.V.C. Colony, (Near Hanuman Mandir), Hazaribagh, Pin Code- 825301, Jharkhand
1998 Trust 1 2 3 1.65 80.82
Surguja Gramotthan Samaj sevi Sanstha
Near Pratappur Naka, Ambikapur, Dist Surguja, Chhattisgarh 497001
1997 Society 1 1 1 0.40 2.00
SURYODAY MICRO FINANCE PVT LTD
Sham-Shakuntal Heights 4th Floor, 161A/3A Modibaug, Ganeshkhind Road, Shivaji Nagar, Pune-411016, Maharashtra
2008 NBFC 3 4 14 24.68 1562.43
41
Swadhaar FinServe Pvt Ltd
5/39, Shree Om Co-Operative Society, Anand Nagar, LIG Nehru Road, Opp Beatuex, Santacruz (E), Mumbai - 400 055
2007 NBFC 2 6 27 27.39 1956.42
Swayamshree Micro Credit Services
M-75, Samanta Vihar, Bhubaneswar, Khurda, Orissa, India
2003 Section 25 Company
1 19 19 42.58 2263.60
The Payakaraopeta Women’s MACS Ltd
Siva Surya Apartments, Flat No 3&4, Main Road, Payakaraopeta, Visakhapatnam Dist-531126
1997 Cooperati
ve 1 3 8 36.74 3169.00
The Saath Savings & Credit Coop. Soc. Ltd.
O/102, Nandanvan 5, Nr. Prernatirth Derasar, Jodhpur, Ahmedabad – 380015
2002 Cooperati
ve 1 1 6 3.47 223.24
Tribal Microfinance Institute of Nagaland
Post Box No. 94, H/No. 174, Imkonglenden Colony, Dimapur, Nagaland- 797112
2000 Society 1 7 7 3.65 174.50
TRIDENT MICROFIN PRIVATE LIMITED
D.No : 11-8-15, MIG - 33, Shree Sai Arcade, 1st & 2nd Floors, Saroornagar, Hyderabad - 500 035
2007 NBFC 3 15 60 174.87 13866.0
7
Trust Microfin Network
3/455, Vishal Khand, Gomti Nagar, Lucknow – 226010 (U.P.)
2005 Trust 4 12 45 50.26 2155.20
Ujjivan Financial Services Private Limited
#93, Jakkasandra Extension, Sarjapur Main Cross Road, 1st Block, Koramangala, Bangalore 560034
2005 NBFC 13 76 230 620.62 37075.1
1
VAMA (BAL-MAHILA VIKAS SAMITI)
9-C, Maharana Pratap Nagar, Lashkar, Gwalior -474009
1988 Society 1 1 2 3.92 290.98
Village Financial Services Private Limited
“Village Tower”; F -15, Geetanjali Park; 18/3A, Kumud Ghoshal Road; Ariadaha; Kolkata - 700057
2006 NBFC 1 12 59 368.04 21274.5
4
Vivekananda Sevakendra –O- Sishu Uddyan
Vill: Ullon, P.O: Ramlochan Pur Dist : South 24 Pgs. West Bengal, India ,
1983 Society 1 1 15 6.62 462.42
Welfare Organization for Multipurpose Mass Awareness Network (WOMAN)
70,Vth cross Bharathinagar,Puthur, Trichy-17, 17,Trichy main Road,Keeranur, Pudukottai dist.
1992 Society 1 6 15 124.18 1362.47
Welfare Services Ernakulam (WESCO Credit)
Welfare Services Ernakulam, Vyttila (PO), Ponnurunni, Ernakulam Dist, Kerala – 682 019
Before 1970
Society 1 4 5 37.75 1284.52
Womens Empowerment & Microcredit Services (WEMCS)
A/202, Sangeeta Saswatam Apartment, Near Shyamal Hospital, Mourya path, Bailey Road, Khajpura Patna-12.Bihar
2008 Section 25 Company
1 2 2 0.97 45.71