manufactured housing finance: new insights from the home
TRANSCRIPT

CONSUMER FINANCIAL PROTECTION BUREAU | MAY 2021
Manufactured Housing Finance: New Insights from the Home Mortgage Disclosure Act Data
Consumer Financial Protection Bureau’s Offices of Research
and Mortgage Markets

1 CONSUMER FINANCIAL PROTECTION BUREAU
This is another in an occasional series of publications from the Consumer Financial Protection
Bureau’s (CFPB) Office of Research, in collaboration with the Office of Mortgage Markets. These
publications are intended to further the CFPB’s objective of providing an evidence-based
perspective on consumer financial markets, consumer behavior, and regulations to inform the
public discourse. See 12 U.S.C. §5493(d).1
1 This Data Point was prepared by Jessica Russell, Nora O’Reilly, Karl Schneider, Nicolas Melton, Nick Schwartz, and
Sam Leitner.

2 CONSUMER FINANCIAL PROTECTION BUREAU
Table of contents Table of contents ..............................................................................................................2
2. Introduction & Key Findings ....................................................................................3
3. Background and Data ...............................................................................................7
3.1 Manufactured housing............................................................................... 7
3.2 Data ........................................................................................................... 11
4. Sales and Financing ................................................................................................15
4.1 Applications and originations ..................................................................15
4.2 Geography of manufactured housing lending ........................................ 18
4.3 Loan characteristics of manufactured housing loans..............................21
4.4 HOEPA ..................................................................................................... 25
5. Borrowers and Lenders ..........................................................................................30
5.1 Borrower demographics .......................................................................... 30
5.2 Borrower creditworthiness: chattel and mortgage................................. 33
5.3 Owned vs. Leased Land ........................................................................... 33
5.4 Manufactured housing lenders ............................................................... 43
6. Conclusion and Future Research .........................................................................48
Appendix: Comparison of HMDA to Other MH Data Sources .................................50

3 CONSUMER FINANCIAL PROTECTION BUREAU
2. Introduction & Key Findings Manufactured housing (MH) accounts for about six percent of occupied housing stock in the
U.S. and is the largest source of unsubsidized affordable housing in the country. Unlike
traditional site-built homes, manufactured homes are built in a factory according to national
standards and then transported to the site of use. They can be placed on land that is owned or
leased by the homeowner. Whether the homeowner owns the underlying land plays a key role in
whether the manufactured home is titled as personal (chattel) property or real property, a
distinction which in turn affects many aspects of the home financing and can have major
implications for the homeowner in terms of cost and security of tenure.
The CFPB is interested in manufactured housing because of its status as an important source of
low-income housing, because its consumers are often financially vulnerable, and because of the
unique consumer protection concerns its financing market raises. The CFPB’s 2014 report on
manufactured housing found that manufactured-home owners tend to live in rural areas, to be
older, and to have lower incomes and net worth than site-built homeowners. In terms of race
and ethnicity, the analysis found that Black and African American and Asian borrowers are
under-represented in manufactured housing relative to site-built, whereas Hispanic whites,
non-Hispanic whites, and American Indian and Alaska Native borrowers are overrepresented.
While manufactured homes typically cost less than site-built homes, manufactured-home
owners typically pay higher interest rates than site-built homeowners and have fewer consumer
protections.2
This Data Point article provides insights into manufactured housing finance using Home
Mortgage Disclosure Act (HMDA) data, which have loan-level information on a variety of
pricing, underwriting, and applicant characteristics as reported by financial institutions.3 Many
of the analyses in this report are made possible by the new and revised fields that are available
in HMDA data beginning in 2018, including two fields that are specific to manufactured housing
and provide insight about landownership and chattel lending.
This report uses the new HMDA data to explore the differences between mortgage loans for site-
built homes, mortgage loans for manufactured homes (hereafter referred to as “MH
2 “Manufactured-housing consumer finance in the Uni ted States.” CFPB. September 2014 (2014 CFPB Report).
https://files.consumerfinance.gov/f/201409_cfpb_report_manufactured-housing.pdf
3 For more information on HMDA data see http://www.consumerfinance.gov/data-research/hmda/. To see if a
specific loan or an institution has to report under HMDA, see https://www.consumerfinance.gov/documents/7052/HMDA_Data_Disclosure_Policy_Guidance.Executive_Summary.FINAL.12212018.pdf.

4 CONSUMER FINANCIAL PROTECTION BUREAU
mortgages”), and chattel loans for manufactured homes. Chattel loans are loans for
manufactured housing that are secured solely by the manufactured home and not land, while
MH mortgage loans are secured by the manufactured home and land.4 Most of the analyses
focus on home purchases rather than refinances, given the paucity of MH refinancing lending.
Findings include:
• The majority of applications for manufactured housing loans do not result
in an origination. Only 27 percent of manufactured home loan applications resulted in
the loan being financed, compared to 74 percent of applications for site-built homes.
These differences remain even after controlling for credit score. Applications for
manufactured homes were more likely to be denied and also more likely to be incomplete
than applications for site-built homes, and rates of denial and incompletion were higher
still for chattel loan applications.
• Although mortgage interest rates fell in 2019, less than four percent of
chattel originations were for refinances, whereas about 31 percent of MH
mortgage and 44 percent of site-built mortgages were for standard or cash-out
refinancing. While smaller loans are less likely to benefit from refinancing because the
savings from a lower interest rate may not offset the costs of origination, more research
is needed to understand whether more MH consumers could benefit from refinancing.
• Manufactured housing lenders appear to have adjusted their pricing in
response to changes to the implementation of the Home Ownership and
Equity Protection Act (HOEPA) rule in 2014. After the new rule went into effect in
2014, a significant number of manufactured housing loans were priced just below the
HOEPA thresholds, suggesting that the market was sensitive to the new threshold and
priced loans accordingly. These changes in pricing have continued and can be seen in the
2019 data. Meanwhile, loan volume and origination rates increased in the years
following the rule change.
• Around 42 percent of manufactured housing loans are chattel loans, which
are loans secured by the home but not the land. While this estimate is lower than
estimates from other data sources, underlying differences between datasets help explain
the disparities.
4 See Paragraph 4(a)(29) within https://www.consumerfinance.gov/policy-
compliance/rulemaking/regulations/1003/4/#a-28.

5 CONSUMER FINANCIAL PROTECTION BUREAU
• Over 60 percent of manufactured housing borrowers directly own the land
where their home is located, meaning they may be eligible for a MH
mortgage. However, 17 percent of these borrowers take out a chattel loan.
The 2014 CFPB report had estimated that 65 percent of landowners get chattel financing
based on a proxy for financing type in the American Housing Survey (AHS). The CFPB
has concluded that this proxy was imperfect and therefore the statistic from the 2014
report is not valid.
• Hispanic, Black and African American, American Indian and Alaska Native,
and elderly borrowers are more likely than other consumers to take out
chattel loans, even after controlling for land ownership. Determining the reasons for
these differences is a vital area of future research. Black and African American borrowers
are the only racial group that are underrepresented in manufactured housing lending
overall compared to site-built, but overrepresented in chattel lending compared to site-
built.
• Landowners face tradeoffs between chattel loans and MH mortgages, and
this report analyzes to what extent some of these tradeoffs can be measured using the
HMDA data. Chattel loans are often considered to have lower upfront costs and shorter
closing times, but this analysis concludes that closing times are in fact similar, though it
cannot draw conclusions about upfront costs. Additionally, landowners who opt for
chattel loans have somewhat stronger credit characteristics—similar median credits
scores and incomes and better loan-to-value and debt-to-income ratios—than
landowners who get mortgages, which suggests that chattel borrowers’ credit profiles
would not have prevented them from getting a mortgage. However, borrowers may
encounter difficulty getting mortgages with small loan amounts. Other reasons for
getting chattel loans include not wanting to encumber the land, lowering their property
taxes, being influenced by the fact that manufactured housing is personal property by
default in many states, being unaware of the downsides of chattel loans or potentially
being steered to a chattel loan by a lender, dealer or retailer.
• The market for MH lending—and chattel in particular—is more
concentrated than the market for mortgages on site-built homes. The top five
lenders made more than 40 percent of home purchase manufactured housing loans,
including nearly 75 percent of chattel loans and 18 percent of MH mortgages. The four
largest MH originators are specialty lenders that cater to MH consumers and offer
primarily chattel loans. Many of the remaining top 15 lenders are banks and nonbanks
that only offer mortgages and for whom MH loans are a small share of their business. In
the past decade, nonbank lenders have played an increasing role in the manufactured

6 CONSUMER FINANCIAL PROTECTION BUREAU
housing lending market, while banks have decreased their activity or exited the market
altogether.
• Texas is often in the focal point of manufactured housing research because
of the comparatively rich data available on MH, it has a significantly higher
proportion of chattel lending than the U.S. as a whole. Manufactured housing
density varies between states, with rural and southern areas often having higher
concentrations of manufactured housing. Texas has a high volume of manufactured
housing and a high percentage of manufactured housing loans that are chattel. Texas has
been studied using detailed public data available in Texas Manufactured Home
Ownership records, but the Texas manufactured housing environment is likely not
representative of national trends, particularly in financing. Additionally, the Texas
homeownership records are often missing lien information for homes titled as real
property, which leads to undercounting MH mortgages.

7 CONSUMER FINANCIAL PROTECTION BUREAU
3. Background and Data
3.1 Manufactured housing
Manufactured homes are factory-built housing constructed after June 15, 1976 in accordance
with the U.S. Department of Housing and Urban Development’s Manufactured Home
Construction and Safety Standards code (HUD Code). Manufactured homes are at least 320
square feet and are built on a permanent chassis before being transported to a site for
placement. Homes that fit these criteria are marked with a HUD label that signals compliance
with HUD codes.
Manufactured homes are distinct from RVs and park-model homes, which are generally treated
as motor vehicles, not housing. They are also different from modular homes. Modular home
sections are built in a factory, like manufactured homes, but they must comply with the same
regional, state, or local codes as traditional site-built homes, while manufactured homes must
comply with the national HUD Code. Lastly, manufactured homes are not the same as mobile
homes or trailers, even though the terms are sometimes used interchangeably. Mobile homes
and trailers refer to factory-built housing constructed before June 15, 1976 and do not meet the
HUD standards for manufactured housing.5 Throughout the paper, we refer to manufactured
housing and manufactured homes synonymously.
There are approximately 6.7 million occupied manufactured homes in the U.S., accounting for
approximately six percent of U.S. housing stock.6 This rate varies by region and housing density,
with manufactured housing making up 13 percent of all occupied homes in rural and small town
communities.7 Over half of manufactured homes are located in the South.8 Over 70 percent of
5 For more information about what constitutes manufactured housing, see
https://www.hud.gov/program_offices/housing/rmra/mhs/faqs.
6 American Community Survey, 2019 5- Year Estimates. https://data.census.gov/cedsci/table?q=ACSDT1Y2019.B25024&tid=ACSDT5Y2019.B25024&hidePreview=true
7 The Housing Assistance Council defines rural areas as Census tracts with fewer than 16 housing units per square
mile and small towns as Census tracts with 16 -64 housing units per square mile and a low degree of commuting to a metropolitan core area. See additional methodology here: http://www.ruralhome.org/storage/documents/policy_comments/dts/TECHNICAL_DOCUMENTATION_HAC_Rural__Small_Town_Definition.pdf. For a map of manufactured housing by county, see the Housing Assistance Council’s July 2020 Rural Research Brief http://www.ruralhome.org/storage/documents/rrbriefs/Manufactured_Housing_RRB.pdf.
8 American Community Survey, 2019 5-Year Estimates. https://data.census.gov/cedsci/table?q=ACSDT1Y2019.B25032&t=Housing&g=0100000US_0200000US3&tid=ACSDT1Y2019.B25032&moe=false&hidePreview=true
8 CONSUMER FINANCIAL PROTECTION BUREAU
occupied manufactured homes are owner-occupied, and this report focuses on manufactured
homeowners rather than home-renters.9 However, this report includes both homeowners who
own the land their home is located on and homeowners who rent the underlying land. An
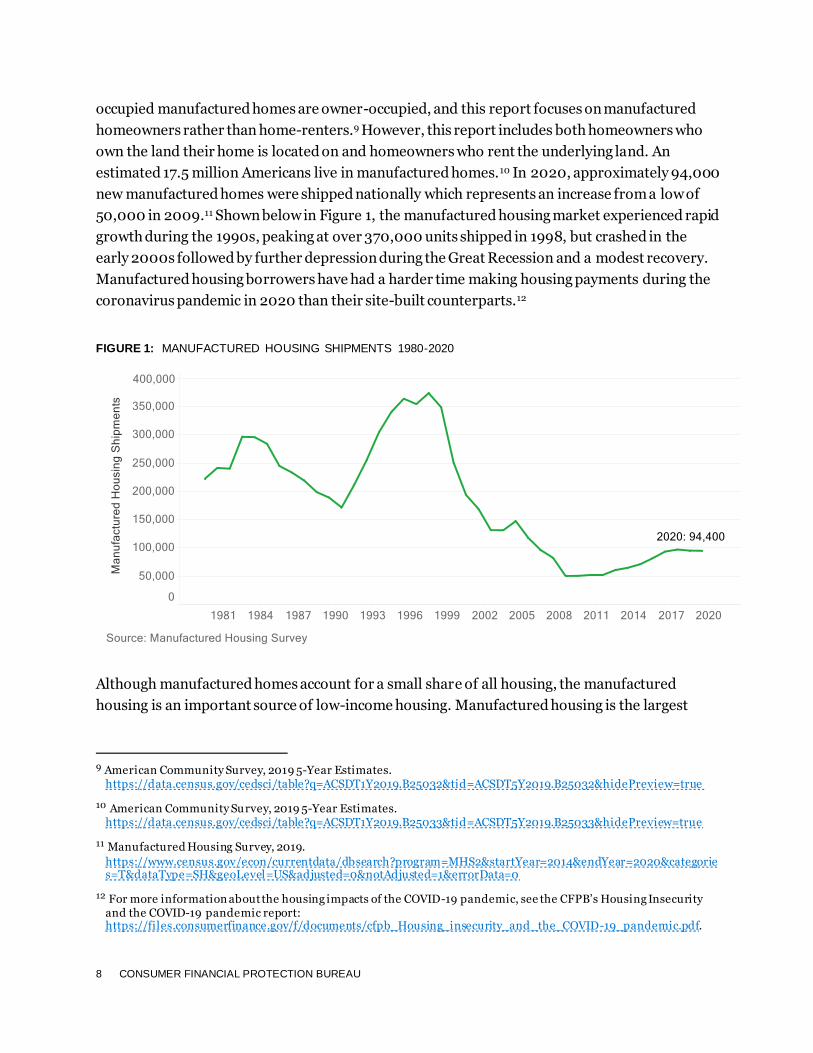
estimated 17.5 million Americans live in manufactured homes.10 In 2020, approximately 94,000
new manufactured homes were shipped nationally which represents an increase from a low of
50,000 in 2009.11 Shown below in Figure 1, the manufactured housing market experienced rapid
growth during the 1990s, peaking at over 370,000 units shipped in 1998, but crashed in the
early 2000s followed by further depression during the Great Recession and a modest recovery.
Manufactured housing borrowers have had a harder time making housing payments during the
coronavirus pandemic in 2020 than their site-built counterparts.12
FIGURE 1: MANUFACTURED HOUSING SHIPMENTS 1980-2020
Although manufactured homes account for a small share of all housing, the manufactured
housing is an important source of low-income housing. Manufactured housing is the largest
9 American Community Survey, 2019 5-Year Estimates.
https://data.census.gov/cedsci/table?q=ACSDT1Y2019.B25032&tid=ACSDT5Y2019.B25032&hidePreview=true
10 American Community Survey, 2019 5-Year Estimates. https://data.census.gov/cedsci/table?q=ACSDT1Y2019.B25033&tid=ACSDT5Y2019.B25033&hidePreview=true
11 Manufactured Housing Survey, 2019.
https://www.census.gov/econ/currentdata/dbsearch?program=MHS2&startYear=2014&endYear=2020&categories=T&dataType=SH&geoLevel=US&adjusted=0¬Adjusted=1&errorData=0
12 For more information about the housing impacts of the COVID-19 pandemic, see the CFPB’s Housing Insecurity and the COVID-19 pandemic report: https://files.consumerfinance.gov/f/documents/cfpb_Housing_insecurity_and_the_COVID-19_pandemic.pdf.
9 CONSUMER FINANCIAL PROTECTION BUREAU
source of unsubsidized affordable housing in the country.13 A report from HUD found
manufactured housing to be a low-cost housing alternative and “good value” for low income
households.14 More recently, a study from the Urban Institute showed that manufactured
housing is less expensive per square foot than either existing site-built homes or new site-built
homes.15 Despite being 35 to 47 percent less expensive per square foot than new or existing site-
built homes, the number of new manufactured homes shipped each year is down significantly
from the late 1990s, as mentioned in the previous paragraph. Authors of the same study argued
that restrictive zoning, restrictive or unavailable financing, and lower appreciation than that for
site-built housing are the main reasons why manufactured housing production has remained
low.
Manufactured homes are placed on either land owned by the manufactured-home owner, on
land owned by someone else without rent, or on rented land, including on leased lots within
manufactured home communities. Once placed, manufactured homes are typically not moved
from their original site. Typically, the land in a manufactured housing community is owned by a
landlord, but in a small number of communities, the land is owned by a cooperative of
homeowners as a resident-owned community (ROC).16
The financing of manufactured housing raises unique consumer protection concerns. Whether
borrowers own the land on which their manufactured housing is located plays a key role in
whether the manufactured home is titled as personal (chattel) property or real property, a
distinction which in turn affects the type and pricing of the loan that the homeowner is able to
receive.17 The difference in title type is important for the homebuyer since financing costs are
higher and consumer protections are weaker for manufactured homes titled as personal
property than for homes titled as real property.18 Specifically, chattel loans are not covered by
either the Real Estate Settlement Procedures Act (RESPA) or the Coronavirus Aid, Relief, and
13 “Factory-Built Housing for Affordability, Efficiency, and Resilience .” HUD. Winter/Spring 2020.
https://www.huduser.gov/portal/periodicals/em/WinterSpring20/highlight1.html
14 Boehm and Schlottmann. “Is Manufactured Housing a Good Alternative for Low-Income Families?” U.S.
Department of Housing and Urban Development. December 2004. https://www.huduser.gov/publications/pdf/ismanufacturedhousingagoodalternativeforlow-incomefamiliesevidencefromtheamericanhousingsurvey.pdf
15 Goodman, Golding, McCargo, and Ganesh. “Manufactured homes could e ase the affordable housing crisis. So why are so few being made?” Ubran.org. Urban Institute. 29 January 2018. https://www.urban.org/urban-wire/manufactured-homes-could-ease-affordable-housing-crisis-so-why-are-so-few-being-made
16 For more information about ROCs, see https://rocusa.org/whats-a-roc/what-is-a-roc-how-is-it-different/.
17 Goodman and Ganesh, “Four ways financing differs for manufactured homes ,” 27 July 2018. https://www.urban.org/urban-wire/four-ways-financing-differs-manufactured-homes
18 Goodman and Ganesh, “Challenges to Obtaining Manufactured Home Financing ,” 27 June 2018. https://www.urban.org/research/publication/challenges-obtaining-manufactured-home-financing
10 CONSUMER FINANCIAL PROTECTION BUREAU
Economic Security (CARES) Act. In the case of default, manufactured housing mortgages are
eligible for the same foreclosure protections as traditional site-built homes, whereas chattel
properties are not protected and instead go through repossession, a process with less consumer
protections and less opportunity for the borrower to remain in the home, depending on the state
and local protections.19 Many chattel homeowners pay rent for the land their home is located on,
and therefore are vulnerable to both repossession by the lender and rent-hikes or eviction by the
owner of the land.20 This report reviews differences in borrower characteristics and pricing for
chattel and MH mortgage loans and outlines some of the advantages and disadvantages of each
type of financing.
Whether the homeowner owns the land also affects the home’s appreciation. Previous studies
provide some evidence that manufactured homes can appreciate just as much as site-built
homes if the consumer owns the land, though there is more volatility in appreciation for
manufactured homes.21 However, manufactured housing where the consumer does not own the
land generally does not promote wealth-building via homeownership.22
The 2014 CFPB Report on manufactured housing finance offered many insights into the history
and state of the manufactured housing market and regulatory environment in 2014, and into
manufactured housing consumers. The report explored the reasons for the manufactured
housing market collapse in the early 2000s and the subsequent depressed inventory and
contraction of the secondary market. The CFPB found that, though manufactured homes
typically cost less than site-built homes, manufactured-home owners typically pay higher
interest rates than site-built homeowners. The CFPB also found that manufactured-home
owners tend to live in rural areas, to be older, and to have lower incomes and net worth than
site-built homeowners. In terms of race and ethnicity, the analysis found that Black and African
19 For example, for more information on the legal landscape of manufactured housing personal property
repossessions, see section 1.4.12 “Special Issues in Manufactured Home Repossessions” of the National Consumer Law Center’s (NCLC) treatise Repossessions: https://library.nclc.org/repo/010412-0.
20 For example, see discussion in Sheelah Kolhatkar’s “What happens when investment firms acquire trailer parks?”
from March 2021. https://www.newyorker.com/magazine/2021/03/15/what-happens-when-investment-firms-acquire-trailer-parks
21Boehm and Schlottmann, “Is Manufactured Housing a Good Alternative for Low-Income Families?” U.S.
Department of Housing and Urban Development. December 2004. https://www.huduser.gov/publications/pdf/ismanufacturedhousingagoodalternativeforlow-incomefamiliesevidencefromtheamericanhousingsurvey.pdf ; Goodman, Golding, Bai, and Strochak, “New evidence shows manufactured homes appreciate as well as site-built homes,” 13 September 2018. https://www.urban.org/urban-wire/new-evidence-shows-manufactured-homes-appreciate-well-site-built-homes
22 Boehm and Schlottmann conclude that generally, “manufactured housing where the lot is not owned with the unit
is not an investment in any sense.” Boehm and Schlottmann, “Is Manufactured Housing a Good Alternative for Low-Income Families?” December 2004. https://www.huduser.gov/publications/pdf/ismanufacturedhousingagoodalternativeforlow-incomefamiliesevidencefromtheamericanhousingsurvey.pdf

11 CONSUMER FINANCIAL PROTECTION BUREAU
American and Asian residents are under-represented in manufactured housing relative to site-
built, whereas Hispanic whites, non-Hispanic whites, and American Indian and Alaska Native
residents are overrepresented. The 2014 report emphasized the potential importance of
manufactured housing as a source of affordable housing and highlighted the difference in legal
treatment of manufactured housing and site-built housing.
3.2 Data
This Data Point makes use of the new data points in HMDA to expand understanding of
manufactured housing along dimensions for which there previously has been no systematic
data, such as the share of borrowers who own their land and take out a chattel loan. The Data
Point employs existing research using the AHS and the Manufactured Housing Survey (MHS)
but does not conduct any original analysis using these two datasets. We compare HMDA to
commonly cited Texas Manufactured Housing Ownership Records (THOR)23, but don’t use the
THOR data in our main analyses because the Texas Manufactured Housing Division confirmed
that the records cannot be used to reliably estimate the proportion of manufactured home loans
that are secured by real versus personal property. A detailed discussion of the THOR data and
analyses based on address matches with HMDA are in the Appendix. Additionally, as described
in Section 3.2, MH financing varies by geography and many patterns in Texas are not
representative of the United States as a whole.
Home Mortgage Disclosure Act (HMDA)24
The Home Mortgage Disclosure Act requires many financial institutions to maintain, report, and
publicly disclose loan-level information about their lending activity for loans secured by a
consumer dwelling. As part of the Dodd-Frank Wall Street Reform and Consumer Protection Act
of 2010 (Dodd-Frank Act), Congress amended HMDA to, among other things, expand the
number of data points required to be collected and reported and give the CFPB authority to
require additional data points to be collected and reported. The CFPB issued a final rule
23 “THOR” is the acronym used throughout the paper for convenience. The Manufactured Housing Division did not
have a specific acronym that it used for the manufactured home ownership records.
24This report relies primarily on 2019 HMDA data, and the analysis in this report generally relies on medians and
bucketing to mitigate the impact of these outliers on the underlying analyses. The public 2019 HMDA data can be found here: https://www.consumerfinance.gov/about-us/newsroom/ffiec-announces-availability-2019-data-mortgage-lending/.

12 CONSUMER FINANCIAL PROTECTION BUREAU
implementing these and other changes in October 2015. Most of the rule’s provisions took effect
on January 1, 2018 and affected data to be collected starting in 2018.25
Two of the new data points are specific to manufactured housing and provide information about
chattel lending and whether the consumer owns or leases the land. Some lenders are exempt
from reporting certain HMDA data points, including the manufactured housing data points,
following the amendment to HMDA by the Economic Growth, Regulatory Relief, and Consumer
Protection Act in 2018.
• Manufactured Home Secured Property Type identifies whether a manufactured home
loan is a personal property loan, meaning secured by the manufactured home and not
land (chattel) or secured by the manufactured home and the land (mortgage).
• Manufactured Home Land Property Interest indicates if the land on which a
manufactured housing unit is located is directly owned, indirectly owned, or if the
borrower has an unpaid or paid lease.
o Direct ownership means the borrower owns the land on which the manufactured
housing unit is located.
o Indirect ownership can occur when the borrower is a member of a ROC acting as
a housing cooperative where the members of the community collectively own the
land where the manufactured housing is located.
o Paid leasehold typically indicates the borrower is paying rent for the property.
o Unpaid leasehold indicates the borrower is not making rent payments and
includes loans where the manufactured home is located on land owned by a
family member without a written lease and no agreement to rent payments.
While HMDA provides robust data on manufactured housing loan originations, it has some
limitations. It does not include data on cash sales and thus the conclusions drawn from the data
cannot be applied to the overall manufactured housing market. Additionally, unlike some
datasets related to manufactured housing, HMDA does not distinguish between new and
existing homes, which can be of particular significance for MH borrowers because of the
transportation and setup costs required for new (and some used) home purchases. Lastly,
HMDA data are limited to applications and originations; they do not provide any information
about loan performance or default risk.
25 See Home Mortgage Disclosure (Regulation C), 80 FR 66128 (Oct. 28, 2015).
13 CONSUMER FINANCIAL PROTECTION BUREAU
Reconciling HMDA with Other Sources of MH Data
Table 1 compares the new HMDA data points with results from commonly used manufactured
housing datasets, filtered to make them as comparable as possible to the two new HMDA MH
data points. Each of the datasets is described in more detail in the Appendix.
At first glance, HMDA estimates of chattel properties appear significantly lower than those from
other datasets. However, underlying differences between these datasets can help explain the
disparities. MHS data, for example, are based on shipments of new manufactured homes and
include cash sales, while HMDA data contain both new and used housing and do not capture
cash transactions. While we can’t compare the datasets directly, it seems likely that both provide
reasonable estimates for the populations that they are measuring, especially in light of evidence
that new homes appear far more likely than used homes to be financed with chattel loans.26
HMDA results appear more similar to results from THOR, even without accounting for the fact
that THOR data undercounts loans secured by real property.27 For landownership, HMDA
estimates are comparable to those from other datasets.
26 See Figure 22 in the Appendix. 27 About 89 percent of HMDA chattel loans in Texas had a lien recorded in THOR, compared to only 47 percent of
MH mortgages.

14 CONSUMER FINANCIAL PROTECTION BUREAU
TABLE 1: COMPARISON OF MANUFACTURED HOUSING DATA SOURCES
Data Source Population % Chattel National
% Chattel Texas
% Land Ownership
HMDA, 2019
• 2019 originations
• New and used homes
• Home purchase financed
42% 66% 64%
AHS, 2019
• Homes owned in 2019 but financed at any point in time
• New and used homes
• Home purchase financed
-- -- 73%
MHS, 2019
• Units shipped and placed in 2019
• New homes
• Financed and cash sales
76% -- --
THOR, 2019 • 2019 changes in ownership
• New and used homes • Home purchase financed
-- 78% 28 --
UNC/Freddie Mac’s MH Survey and Report on Loan Shopping Experiences
• Data is based on survey responses, sample for survey is based on THOR
• 2015-2018 purchases
• New and used homes
• Home purchase financed
-- 73% 61%
(TX only)
28 In THOR, some manufactured homes that were financed do not have a lien, a limitation of the dataset explained in
further detail in the Appendix. Because of this, the “financed” population based of the presence of a lien does not accurately represent those who finance manufactured housing in Texas.

15 CONSUMER FINANCIAL PROTECTION BUREAU
4. Sales and Financing This section focuses on trends in sales and characteristics of financing for manufactured housing
loans. Analyses address patterns in loan applications and originations and then delve into the
characteristics, pricing, and affordability of manufactured housing loans. This section also
includes an analysis of the impact of HOEPA on the sales and financing of manufactured
housing.
With the exception of some analyses of refinancing rates in Section 3.1, the rest of this analysis
in this report focuses on manufactured housing home purchase loans. It only includes 1-4
family, owner-occupied, first-lien properties and it excludes open-end lines of credit, loan
purchases between financial institutions, and loans designated primarily for a business or
commercial purpose.29 The report is accompanied by a set of Excel tables with the data for all
the charts and tables found in this report, to facilitate accessibility and further research.
4.1 Applications and originations
Financial institutions reported approximately 420,000 applications for home purchase loans for
manufactured homes, which is about eight percent of all home purchase applications in the 2019
HMDA data.30
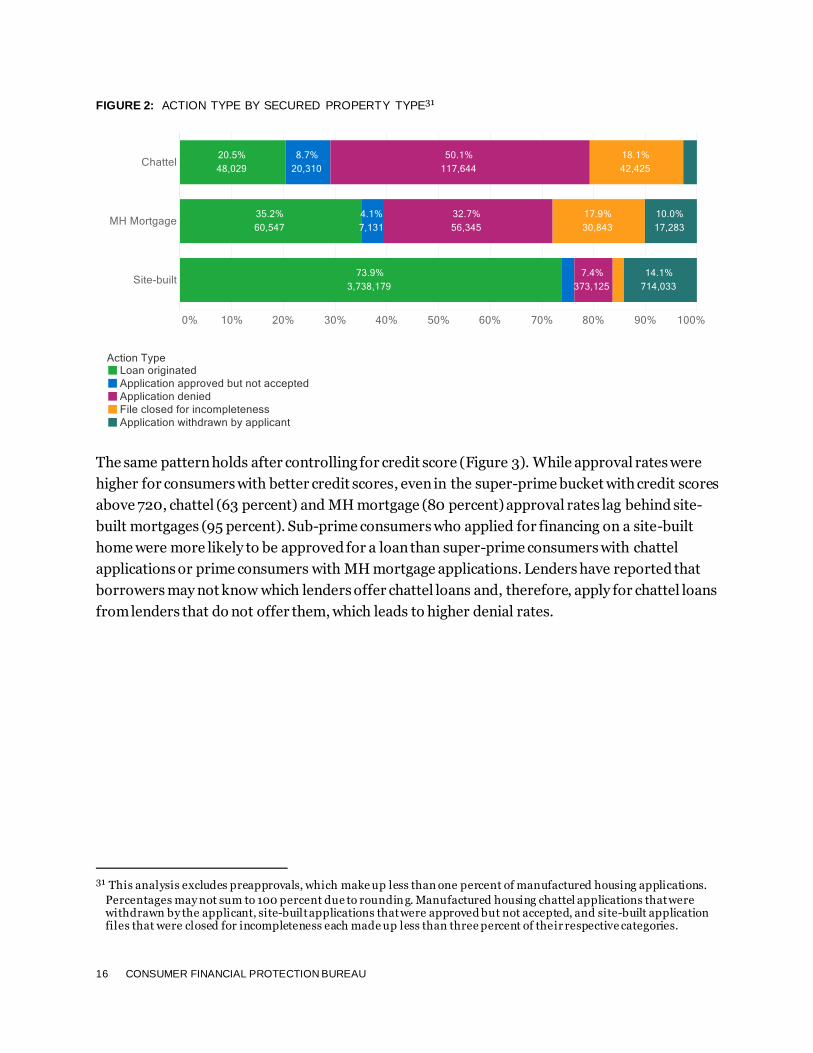
Figure 2 shows that a minority (27 percent) of consumers who applied for a loan to buy a
manufactured home succeeded in obtaining financing. Of those who did not obtain financing,
the majority were denied and a smaller share either did not complete their application or turned
down financing. An estimated 42 percent of all manufactured housing home purchase
applications were denied, including 50 percent of chattel applications and 33 percent of
mortgage applications. In comparison, only 7 percent of site-built applications were denied.
29 To designate this population in the HMDA data, the following codes were used: “Total Units” equal to 1,2,3 or 4,
“Occupancy Type” equal to 1, “Lien Status” equal to 1, “Open -End Line of Credit” not equal to 1, “Action Taken” not equal to 6, and “Business or Commercial Purpose” not equal to 1.
30 Adding the chattel and MH mortgage applications does not equal total manufactured housing applications—there
are also applications that are either exempt or NA for the manufactured home secured property type field. Throughout the report, these records are dropped from the dataset when the analysis breaks out chattel and MH mortgage designations, but are included in the analyses pertaining to total manufactured housing.
16 CONSUMER FINANCIAL PROTECTION BUREAU
FIGURE 2: ACTION TYPE BY SECURED PROPERTY TYPE31
The same pattern holds after controlling for credit score (Figure 3). While approval rates were
higher for consumers with better credit scores, even in the super-prime bucket with credit scores
above 720, chattel (63 percent) and MH mortgage (80 percent) approval rates lag behind site-
built mortgages (95 percent). Sub-prime consumers who applied for financing on a site-built
home were more likely to be approved for a loan than super-prime consumers with chattel
applications or prime consumers with MH mortgage applications. Lenders have reported that
borrowers may not know which lenders offer chattel loans and, therefore, apply for chattel loans
from lenders that do not offer them, which leads to higher denial rates.
31 This analysis excludes preapprovals, which make up less than one percent of manufactured housing applications.
Percentages may not sum to 100 percent due to rounding. Manufactured housing chattel applications that were withdrawn by the applicant, site-built applications that were approved but not accepted, and site-built application files that were closed for incompleteness each made up less than three percent of their respective categories.

17 CONSUMER FINANCIAL PROTECTION BUREAU
FIGURE 3: APPROVAL RATE BY SECURED PROPERTY TYPE AND CREDIT SCORE32
Figure 4 shows the origination volume for site-built and manufactured housing from 2004-
2019. In both markets, home purchase originations declined in the wake of the Great Recession,
hit a low in 2011, and have been increasing in the years since. Over this time period, between 2.3
percent and 3.7 percent of home purchase loans were for manufactured housing.
32 Approval rate is calculated by calculating the total number of loans originated and applications that were approved
and not accepted and dividing it by total loans originated, applications approved and not accepted, and applica tions that were denied.

18 CONSUMER FINANCIAL PROTECTION BUREAU
FIGURE 4: SITE-BUILT AND MANUFACTURED HOUSING HOME PURCHASE ORIGINATIONS, 2004—201933
4.2 Geography of manufactured housing lending
Manufactured housing accounts for approximately three percent of home purchase loan
originations nationwide in the 2019 HMDA data, or 115,000 loans, though this rate varies by
state, with the highest concentrations of manufactured housing in Mississippi, Louisiana, and
West Virginia.
Figure 5 shows the proportion of total home purchase, owner-occupied, first-lien originations
that are manufactured housing by state.34 Table 16 in the accompanying data tables includes
33 The data behind this visualization is from Table 1 of the 2019 HMDA Data Point, found here:
https://www.consumerfinance.gov/data-research/research-reports/data-point-2019-mortgage-market-activity-and-trends/.
34 This is calculated by dividing the number of manufacturing housing home purchase loans by the total number of home purchase loans in 2019.

19 CONSUMER FINANCIAL PROTECTION BUREAU
data for the proportion of originations that are manufactured housing as well a breakdown of
the number of loans by manufactured housing secured property type.
FIGURE 5: MANUFACTURED HOUSING AS A PROPORTION OF HOME PURCHASE ORIGINATIONS IN 2019
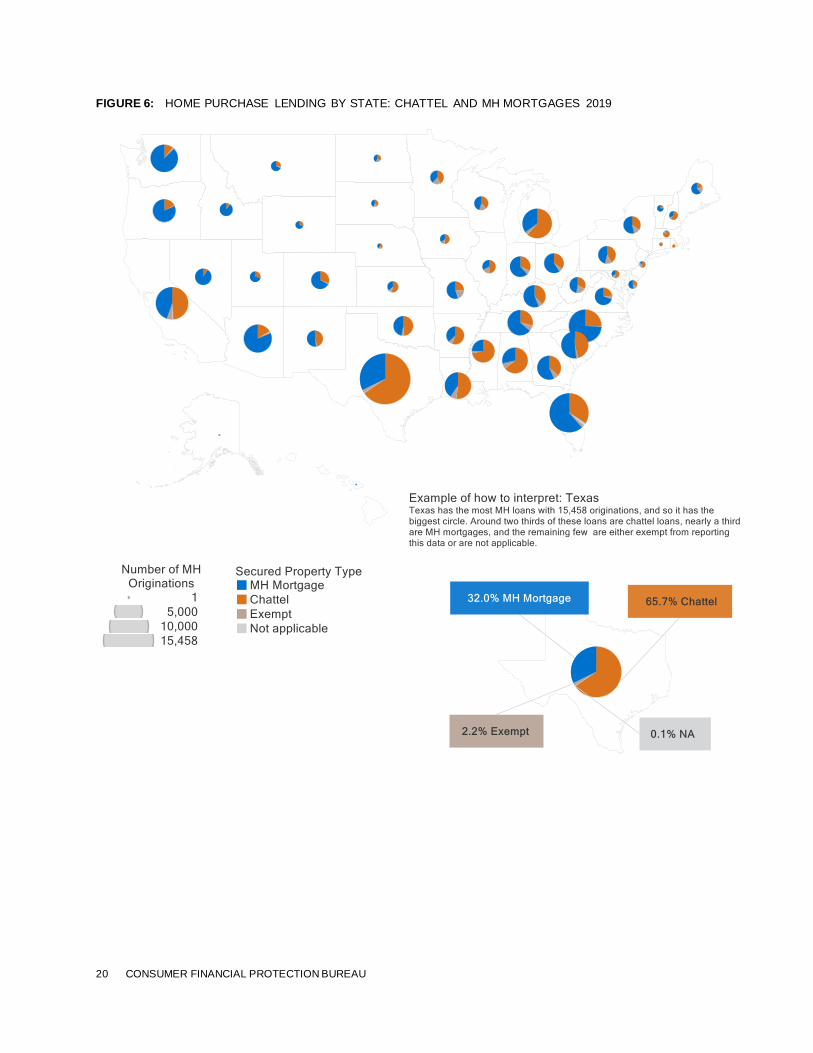
Figure 6 illustrates the proportion of manufactured housing home purchase loans that are
chattel across the country in 2019, demonstrating that chattel lending varies significantly by
region. For example, in Texas 65.7 percent of manufactured housing home purchase loans are
chattel, compared to only 10.6 percent in Washington, and both states have a sizable number of
manufactured homes. Chattel lending can even vary significantly within region—the rate is 46.1
percent in New Mexico but only 16.6 percent in neighboring Arizona. See Figure 6 for an
example of how to interpret the map. Section 4.3 further examines some of the state-level trends
in chattel lending.
20 CONSUMER FINANCIAL PROTECTION BUREAU
FIGURE 6: HOME PURCHASE LENDING BY STATE: CHATTEL AND MH MORTGAGES 2019

21 CONSUMER FINANCIAL PROTECTION BUREAU
4.3 Loan characteristics of manufactured housing loans
Compared to mortgages for site-built homes, MH mortgages tend to have smaller loan amounts,
higher interest rates, fewer refinances, and less of a secondary market, patterns that are even
more acute for chattel loans. Additionally, chattel loans have shorter loan terms than mortgages
for either MH or site-built homes.
Site-built and manufactured housing mortgage loans vary significantly in their loan purpose,
while chattel loans are overwhelmingly home-purchase loans. In response to falling interest
rates during 2019, many consumers refinanced their loans. However, manufactured
homeowners were less likely to take advantage of the lower rates through refinancing. Chattel
loans had a much higher percentage of originations (95.9 percent) devoted to home purchases
than either mortgage or site-built originations, and significantly fewer refinance originations
then these other types of loans at 2.5 percent, as shown in Table 2. Smaller loans are less likely
to benefit from refinancing because the savings from a lower interest rate may not offset the
costs of origination, which may partially explain why chattel loans are rarely refinanced.
However, more research is needed to understand whether consumers with small loan amounts
could benefit from refinancing and whether that matches consumers’ expectations at
origination. MH mortgage loan purposes more closely resemble the loan purpose of site-built
loan purposes.35
TABLE 2: LOAN PURPOSE OF SITE-BUILT AND MANUFACTURED HOUSING ORIGINATIONS BY
SECURED PROPERTY TYPE
LOAN PURPOSE
MANUFACTURED
HOUSING: CHATTEL
LOANS (%)
MANUFACTURED
HOUSING: MORTGAGE
LOANS (%)
SITE-BUILT (%)
HOME PURCHASE 95.9 66.4 53.9
HOME IMPROVEMENT 0.3 1.2 0.9
REFINANCING 2.5 18.0 25.9
CASH-OUT REFINANCING 0.9 12.8 18.3
OTHER PURPOSE 0.5 1.6 1.0
Table 3 shows that chattel loans are nearly all conventional, despite being potentially eligible for
Federal Housing Administration (FHA) or Department of Veterans Affairs (VA) loans.36 Higher
35 Statistics for Loan Purpose and Loan Type exclude those coded as “not applicable”.
36 There was little demand in 2012 for the Ginnie Mae MH program. See 2014 CFPB Report, p . 38.
22 CONSUMER FINANCIAL PROTECTION BUREAU
percentages of mortgage manufactured housing originations were FHA-insured and VA
guaranteed, and a lower percentage were conventional loans. Table 3 also shows the current
distribution of purchasers among originated home purchase loans within the 2019 HMDA
Dataset. Mortgage manufactured housing loans feature a much higher percentage of Ginnie Mae
purchased originations (included in FHA, USDA, and VA) opposed to their site-built
counterparts, offsetting a slightly lower share of Freddie Mac purchased loans. Both chattel and
mortgage manufactured housing loans were less likely to be sold at all than site-built
originations.
This table shows that the secondary market for chattel loans is small, as currently conventional
chattel loans are not generally eligible for purchasing by Fannie Mae and Freddie Mac.37 Fannie
Mae and Freddie Mac’s proposed pilot program for purchasing chattel loans could potentially
change this—however, as of May 2021 the pilot program is on pause.38
37 For more information regarding the purchasing market rules for manufactured housing specific to GSEs, see the
table on page 6 of Fannie Mae’s Duty to Serve Report: https://www.fhfa.gov/PolicyProgramsResearch/Programs/Documents/FannieMaeDTSPlan_2018-2021.pdf.
38 For more information regarding this pilot program, reference Fannie Mae’s Duty to Serve Manufactured Housing Report: https://www.fhfa.gov/PolicyProgramsResearch/Programs/Documents/FannieMaeDTSPlan_2018 -2021.pdf.

23 CONSUMER FINANCIAL PROTECTION BUREAU
TABLE 3: LOAN TYPE AND PURCHASER OF SITE-BUILT AND MANUFACTURED HOUSING ORIGINATIONS
BY SECURED PROPERTY TYPE39
LOAN TYPE & PURCHASER
MANUFACTURED
HOUSING: CHATTEL
LOANS (%)
MANUFACTURED
HOUSING: MORTGAGE
LOANS (%)
SITE-BUILT (%)
CONVENTIONAL: FANNIE MAE 0.2 12.2 15.5
CONVENTIONAL: FREDDIE MAC 0.0 4.9 13.6
CONVENTIONAL: PRIVATE
PURCHASER40 OR OTHER41 18.0 6.3 21.6
CONVENTIONAL: NOT SOLD 80.9 24.6 15.9
FHA 0.7 39.4 20.1
VA 0.2 11.6 10.6
RHS OR FSA 0.0 1.0 2.6
Loan amounts for home purchases are generally lower for manufactured housing compared to
site-built homes, as shown in Table 4, reflecting the lower prices of the homes that secure the
loans. Loan amounts are higher for manufactured housing mortgage loans than chattel loans in
part because they may also include the cost of the land the unit is sited on.
TABLE 4: LOAN AMOUNTS OF HOME PURCHASE SITE-BUILT AND MANUFACTURED HOUSNG
ORIGINATIONS BY SECURED PROPERTY TYPE
CHARACTERISTIC
MANUFACTURED
HOUSING: CHATTEL
LOAN ($)
MANUFACTURED
HOUSING: MORTGAGE
LOAN ($)
SITE-BUILT LOAN
($)
25TH PERCENTILE 40,500 90,330 162,011
MEDIAN 58,672 127,056 236,624
75TH PERCENTILE 80,785 172,812 342,678
39 Rural Housing Service (RHS) and Farm Service Agency (FSA) loans are insured by the United States Department of
Agriculture (USDA).
40 Private Purchaser within this table combines four of the Type of Purchaser categories from HMDA: 1 ) Private
securitizer, 2) Commercial bank, savings bank, or savings association, Life in surance company, 3) Credit union, mortgage company, or finance company 4) Affiliate institution.
41 The incidence of loan sales tends to decline for loans originated toward the end of the year, as lenders report a loan
as sold only if the sale occurs within the same year as origination. As a result, full-year HMDA data may overestimate the percent of loans not sold. In this table, "Other" also includes the "Other" HMDA Type of Purchaser category as well as a small number of loans (less than 200) that were re ported as conventional and purchased by Ginnie Mae or Farmer Mac.
24 CONSUMER FINANCIAL PROTECTION BUREAU
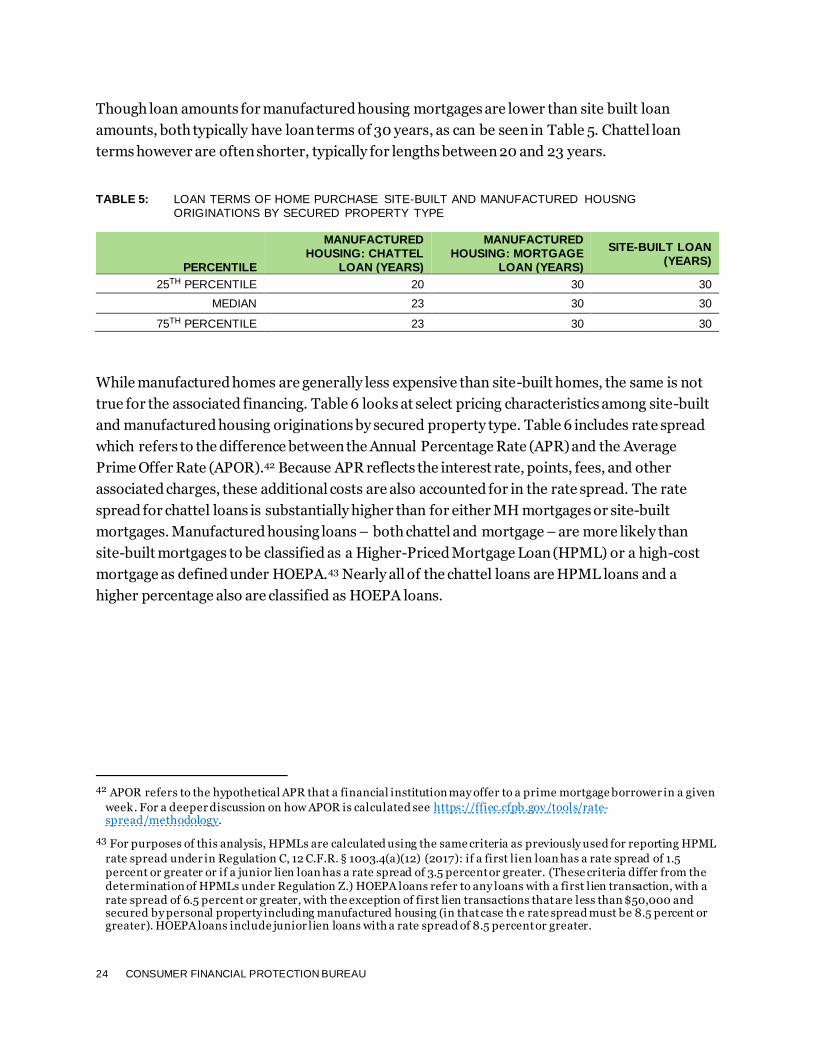
Though loan amounts for manufactured housing mortgages are lower than site built loan
amounts, both typically have loan terms of 30 years, as can be seen in Table 5. Chattel loan
terms however are often shorter, typically for lengths between 20 and 23 years.
TABLE 5: LOAN TERMS OF HOME PURCHASE SITE-BUILT AND MANUFACTURED HOUSNG
ORIGINATIONS BY SECURED PROPERTY TYPE
PERCENTILE
MANUFACTURED
HOUSING: CHATTEL
LOAN (YEARS)
MANUFACTURED
HOUSING: MORTGAGE
LOAN (YEARS)
SITE-BUILT LOAN
(YEARS)
25TH PERCENTILE 20 30 30
MEDIAN 23 30 30
75TH PERCENTILE 23 30 30
While manufactured homes are generally less expensive than site-built homes, the same is not
true for the associated financing. Table 6 looks at select pricing characteristics among site-built
and manufactured housing originations by secured property type. Table 6 includes rate spread
which refers to the difference between the Annual Percentage Rate (APR) and the Average
Prime Offer Rate (APOR).42 Because APR reflects the interest rate, points, fees, and other
associated charges, these additional costs are also accounted for in the rate spread. The rate
spread for chattel loans is substantially higher than for either MH mortgages or site-built
mortgages. Manufactured housing loans – both chattel and mortgage – are more likely than
site-built mortgages to be classified as a Higher-Priced Mortgage Loan (HPML) or a high-cost
mortgage as defined under HOEPA.43 Nearly all of the chattel loans are HPML loans and a
higher percentage also are classified as HOEPA loans.
42 APOR refers to the hypothetical APR that a financial institution may offer to a prime mortgage borrower in a given
week. For a deeper discussion on how APOR is calculated see https://ffiec.cfpb.gov/tools/rate-spread/methodology.
43 For purposes of this analysis, HPMLs are calculated using the same criteria as previously used for reporting HPML
rate spread under in Regulation C, 12 C.F.R. § 1003.4(a)(12) (2017): if a first lien loan has a rate spread of 1.5 percent or greater or if a junior lien loan has a rate spread of 3.5 percent or greater. (These criteria differ from the determination of HPMLs under Regulation Z.) HOEPA loans refer to any loans with a first lien transaction, with a rate spread of 6.5 percent or greater, with the exception of first lien transactions that are less than $50,000 and secured by personal property including manufactured housing (in that case th e rate spread must be 8.5 percent or greater). HOEPA loans include junior lien loans with a rate spread of 8.5 percent or greater.

25 CONSUMER FINANCIAL PROTECTION BUREAU
TABLE 6: PRICING CHARACTERISTICS OF SITE-BUILT AND MANUFACTURED HOUSING ORIGINATIONS
BY SECURED PROPERTY TYPE
CHARACTERISTIC
MANUFACTURED
HOUSING: CHATTEL
LOANS
MANUFACTURED
HOUSING: NON-
CHATTEL LOANS
SITE-BUILT
MEDIAN INTEREST RATE 8.6% 4.9% 4.1%
MEDIAN RATE SPREAD 5.2 1.6 0.4
% HPML 93.8% 52.4% 11.1%
% HOEPA 0.7% 0.2% 0.1%
To further analyze mortgage pricing, section 3.4 explores the impacts of HOEPA on the
manufactured housing market.
4.4 HOEPA
Under the Home Ownership and Equity Protection Act, certain mortgage loans that have APRs
or fees above specified levels (i.e., HOEPA loans or high-cost mortgages) are subject to
additional consumer protections, such as special disclosures and restrictions on loan features. In
2010, the Dodd-Frank Act expanded the scope of HOEPA coverage to include purchase-money
mortgages, among other changes. In 2013, the CFPB issued its final rule implementing the
HOEPA changes , and the new requirements went into effect January 10, 2014 (HOEPA Rule).
A key provision of the HOEPA Rule included additional disclosure requirements for mortgage
originators that report under HMDA.44 The HOEPA Rule applies to first-lien loans with a rate
spread45 of 6.5 percent or greater, with the exception of first-lien transactions that are less than
$50,000 and secured by personal property including manufactured housing. For those first-lien
loans that are less than $50,ooo and secured by personal property, or for junior-lien loans, the
rate spread must be 8.5 percent or greater to trigger the additional reporting requirements.
A key question on the impact of HOEPA on manufactured housing loans is what would happen
to borrowers above the HOEPA thresholds who would have received loans prior to the HOEPA
44 The HOEPA Rule applied to applications for which a creditor or lender received an application on January 10, 2014
or later meaning that this first impacted borrowers that took out loans in 2014 HMDA da ta. For more information on the HOEPA Rule see: https://files.consumerfinance.gov/f/documents/bcfp_hoepa_small-entity_compliance-guide.pdf
45 As noted in the previous section, rate spread refers to the difference between the Annual Percentage Rate (APR)
and the Average Prime Offer Rate (APOR). APOR refers to the hypothetical APR that a financial institution may offer to a prime mortgage borrower in a gi ven week. For a deeper discussion on how APOR is calculated see https://ffiec.cfpb.gov/tools/rate-spread/methodology. Because APR reflects the interest rate, points, fees, and other associated charges, these additional costs are also accounted for in the rate spread.
26 CONSUMER FINANCIAL PROTECTION BUREAU
Rule taking effect. There are two potential impacts—one being a loss in access to credit among
those HOEPA borrowers who would have received MH loans prior to the HOEPA Rule and now
did not as a result of the additional costs associated with the HOEPA Rule. Another potential
impact is that borrowers are still approved for their loan and get a lower interest rate as a result
of the HOEPA rule.
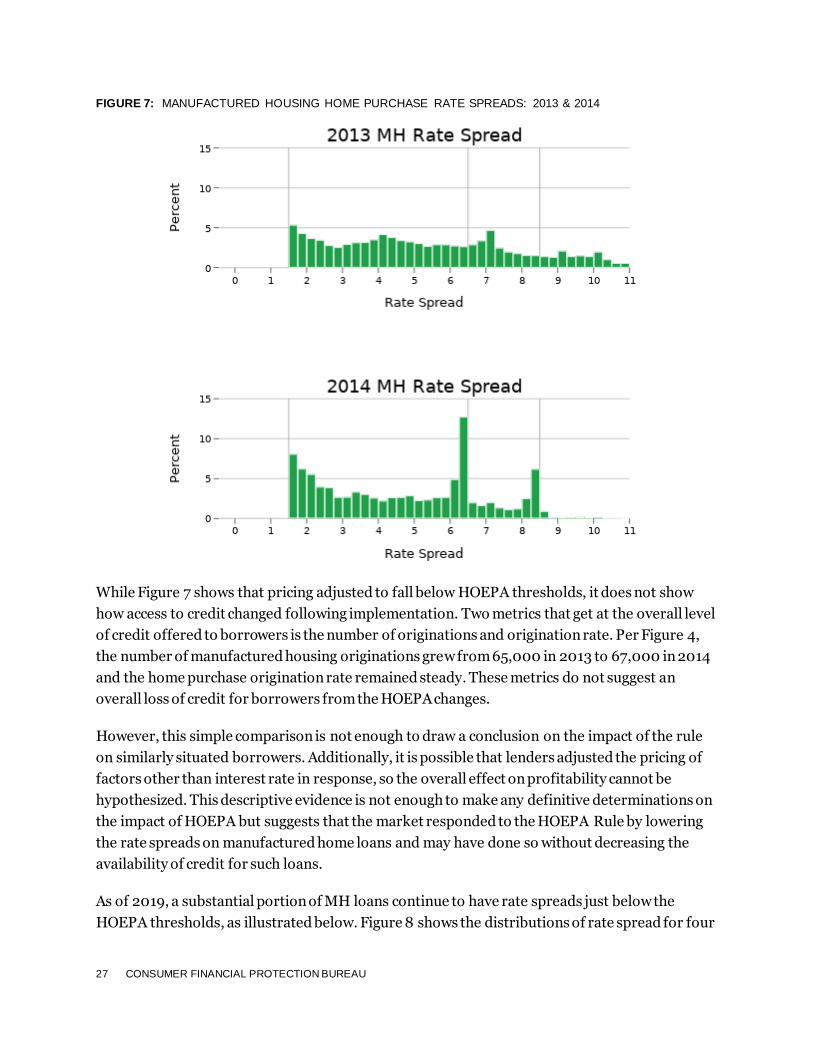
Figure 7 attempts to tease out the impact the HOEPA Rule has had on rate spread in the
manufactured housing marketplace by showing manufactured housing rate spreads for 2013
and 2014 with reference lines at 6.5 percent and 8.5 percent rate spreads. In 2013, 13 percent of
loans had a rate spread of 8.5 percent or higher, while in 2014, 2.0 percent of loans had a rate
spread of 8.5 percent or higher. There was significant bunching in the rate spread bucket
immediately below both the 6.5 and 8.5 percent threshold.46 The bunching suggests that lenders
responded to the HOEPA changes by adjusting their pricing to fall right below the thresholds.
46 Prior to 2018, HMDA data only featured rate spreads for loans with spreads above 1.5 percent. Among
manufactured housing loans in the 2013 HMDA data, approximately 65 percent of manufactured housing loans had a reported rate spread, and thus these median rate spread statistics do not fully take into account loans with rate spreads less than 1.5 percent.
27 CONSUMER FINANCIAL PROTECTION BUREAU
FIGURE 7: MANUFACTURED HOUSING HOME PURCHASE RATE SPREADS: 2013 & 2014
While Figure 7 shows that pricing adjusted to fall below HOEPA thresholds, it does not show
how access to credit changed following implementation. Two metrics that get at the overall level
of credit offered to borrowers is the number of originations and origination rate. Per Figure 4,
the number of manufactured housing originations grew from 65,000 in 2013 to 67,000 in 2014
and the home purchase origination rate remained steady. These metrics do not suggest an
overall loss of credit for borrowers from the HOEPA changes.
However, this simple comparison is not enough to draw a conclusion on the impact of the rule
on similarly situated borrowers. Additionally, it is possible that lenders adjusted the pricing of
factors other than interest rate in response, so the overall effect on profitability cannot be
hypothesized. This descriptive evidence is not enough to make any definitive determinations on
the impact of HOEPA but suggests that the market responded to the HOEPA Rule by lowering
the rate spreads on manufactured home loans and may have done so without decreasing the
availability of credit for such loans.
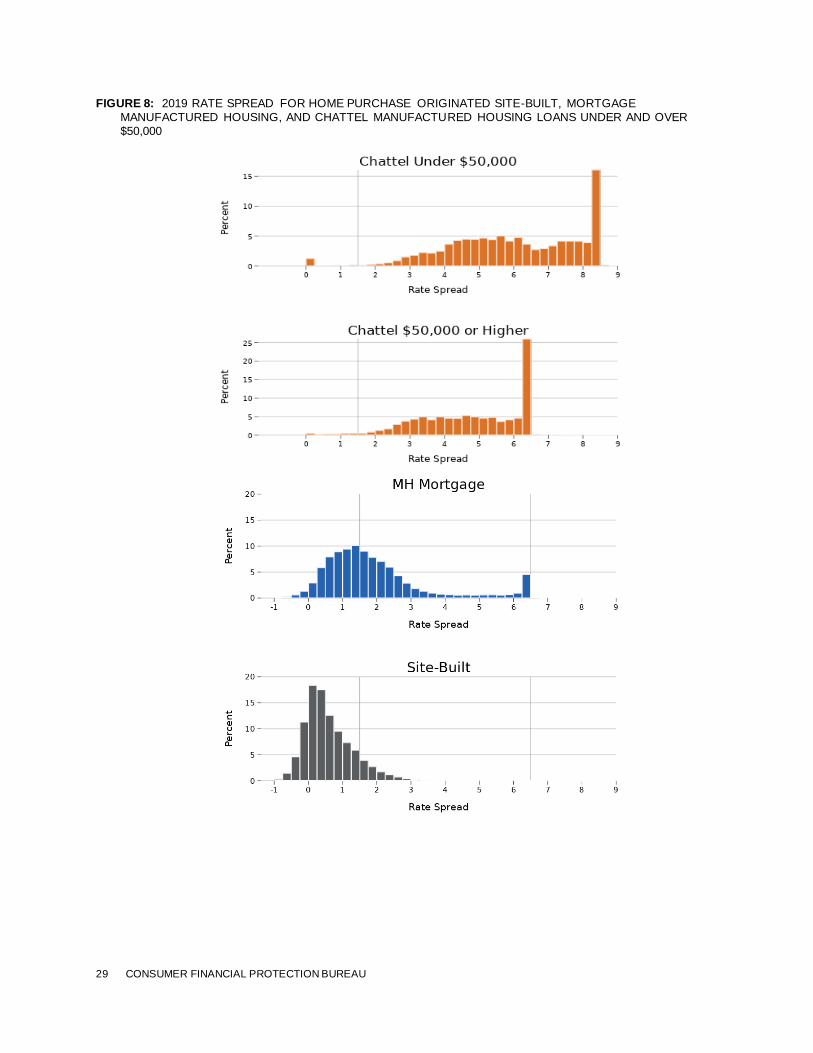
As of 2019, a substantial portion of MH loans continue to have rate spreads just below the
HOEPA thresholds, as illustrated below. Figure 8 shows the distributions of rate spread for four

28 CONSUMER FINANCIAL PROTECTION BUREAU
different types of originated loans from the 2019 HMDA data: site-built homes, chattel loans for
manufactured homes for over and under $50,000, and mortgage loans for manufactured
homes. There are vertical lines drawn at HPML and HOEPA thresholds.47 The HOEPA threshold
at 8.5 percent applies to first lien chattel loans of under $50,000, while the threshold at 6.5
percent applies to the other three groups of loans. Mortgages for site-built homes have rate
spreads well below the HOEPA thresholds, while loans for manufactured homes are often priced
so that the rate spread falls just below the HOEPA threshold. Nearly 5 percent of MH mortgages,
26 percent of chattel loans over $50,000, and 16 percent of chattel loans under $50,000 have
rate spreads that were below the HOEPA threshold but within 25 basis points.
47 The percentages for HOEPA and HPML refer to the percentage of ori ginations that fall within these pricing
categories.
29 CONSUMER FINANCIAL PROTECTION BUREAU
FIGURE 8: 2019 RATE SPREAD FOR HOME PURCHASE ORIGINATED SITE-BUILT, MORTGAGE
MANUFACTURED HOUSING, AND CHATTEL MANUFACTURED HOUSING LOANS UNDER AND OVER
$50,000

30 CONSUMER FINANCIAL PROTECTION BUREAU
5. Borrowers and Lenders This section focuses on the characteristics of the borrowers, lenders, and loans that make up the
manufactured housing market.
Analysis of borrowers focuses on their demographics, creditworthiness, and selection of a
chattel or mortgage loan. Of particular significance in the manufactured housing market is how
borrowers finance their home depending on whether they own or lease the land it is sited on.
This section analyzes how land ownership and financing decisions affect overall loan costs. It
focuses in particular on borrowers who own their land and take out a chattel loan despite being
eligible for a mortgage.
This section also analyzes manufactured housing originators and purchasers to understand who
finances manufactured housing loans and how this has changed over time, particularly since the
Great Recession.
5.1 Borrower demographics
The composition of race and ethnicity of borrowers differs significantly between site-built and
manufactured housing and between chattel and mortgage loans for manufactured housing.
Figure 9 shows the classification of ethnicity and race among the borrowers taking out
manufactured housing loans in comparison to loans for site-built homes.48 In terms of
manufactured housing financing overall, non-Hispanic whites, Hispanic whites, and American
Indian and Alaska Natives make up a larger share of manufactured housing borrowing than site-
built housing, while Black and African Americans and Asians make up a smaller share of
manufactured housing borrowing relative to site-built.
In comparison to site-built and chattel loans, non-Hispanic whites make up a larger share of
MH mortgage borrowers. Asians, Native Hawaiians, and Pacific Islanders make up a smaller
share of both chattel and mortgage borrowers than site-built borrowers. However, much of the
differences in the racial composition of borrowers corresponds with a higher percentage of
48 In the HMDA data, race and ethnicity are reported for the applicant and co-applicant. Ethnicity is reported as
either “Hispanic or Latino” or “Not Hispanic or Latino”. Race is reported as “American Indian or Alaska Native”, “Asian”, “Black or African American”, “Native Hawaiian or Other Pacific Islander”, or white and borrowers can select multiple races. Entities can also report "Not provide”" or “Not applicable” for each field. In this analysis, the fields are combined to create a single field for race and ethnicity; the methodology is explained later on.

31 CONSUMER FINANCIAL PROTECTION BUREAU
manufactured housing originations occurring in rural areas—where there is a higher percentage
of non-Hispanic whites and a lower percentage of Asians.49
Distinguishing between chattel and MH mortgage borrowing, Hispanic white, Black and African
American, and American Indian and Alaska Native borrowers make up larger shares of chattel
loan borrowers than among MH mortgage loan borrowers or among site-built loan borrowers.
Therefore, Black and African American borrowers are the only racial group that are
underrepresented (though only slightly) in manufactured housing lending overall compared to
site-built, but overrepresented in chattel lending compared to site-built. These varying
concentrations indicate that experiences with financing manufactured housing can differ by race
and ethnicity.
FIGURE 9: ETHNICITY AND RACE OF BORROWERS OF SITE-BUILT AND MANUFACTURED HOUSING
ORIGINATIONS (PERCENT)50
49 Pew Research Center, May 2018, “What Unites and Divides Urban, Suburban and Rural Communities”.
https://www.pewresearch.org/social-trends/2018/05/22/what-unites-and-divides-urban-suburban-and-rural-communities/
50 If an applicant reports two races and one is white, that applicant is categorized under the minority race. Otherwise, the applicant is categorized under the first race reported.
The applicant is categorized as “Hispanic white” if the applicant reports Hispanic and white or if the applicant reports Hispanic and race is not provided. The application is designated as “Non -Hispanic white” if the applicant reports Non-Hispanic and white or if the applicant reports white and ethnicity is not provided.

32 CONSUMER FINANCIAL PROTECTION BUREAU
Figure 10 shows that borrowers 24 years old or younger and borrowers 55 and over are
overrepresented in manufactured housing when compared to site-built borrowers.
FIGURE 10:AGE OF BORROWERS OF SITE-BUILT AND MANUFACTURED HOUSING ORIGINATIONS
The applicant is categorized as “joint” if one applicant was reported as white and the other was reported as one or
more minority races or if the application is designated as white with one Hispanic applicant and one non -Hispanic applicant. If the applicant reports two or more minority races or there are two applicants and each reports a different minority race, the application is designated as two or more minority races.
"Missing" refers to applicants in which the race of the applicant(s) has not been reported or is not applicable, unless the ethnicity is reported as Hispanic, in which case the application is categorized under “Hispanic white”.
American Indian and Alaskan Native, Native Hawaiian and Pacific Islander, and multi-minority applicants are grouped together in this visualization due to their relatively small populations. However, it is important to note that American Indian and Alaskan Native applicants make up nearly 60 percent this group. Within the American Indian or Alaska Native population, there are 819 chattel borrowers, 564 MH mortgage borrowers, and 17,242 site-built borrowers, representing 1.7 percent, .9 percent, and .5 percent respectively of each loan category. Within the Native Hawaiian and Pacific Islander population, there are 92 chattel borrowers, 72 MH mortgage borrowers, and 7,363 site-built borrowers, representing .2 percent, .1 percent, and .2 percent respectively of each loan category. Within the multi-minority population, there are 74 chattel borrowers, 48 MH mortgage borrowers, and 5,578 site-built borrowers, representing .2 percent, .1 percent, and .1 percent respectively of each loan category. This disaggregated data can also be found in the accompanying tables.

33 CONSUMER FINANCIAL PROTECTION BUREAU
5.2 Borrower creditworthiness: chattel and mortgage
Borrowers of site-built mortgages have higher median income and credit score than
manufactured housing borrowers, as shown in Table 7 below. Among manufactured-home
borrowers, chattel and mortgage borrowers have similar median incomes, though mortgage
borrowers have a slightly higher median credit score and higher debt-to-income ratio (DTI).
Median Combined Loan-To-Value Ratios (CLTVs) are highest on mortgage manufactured home
loans and lowest for chattel loans.51
TABLE 7: BORROWER CHARACTERISTICS OF SITE-BUILT AND MANUFACTURED HOUSING HOME
PURCHASE ORIGINATIONS BY SECURED PROPERTY TYPE
CHARACTERISTIC
(MEDIAN)
MANUFACTURED
HOUSING: CHATTEL
LOANS
MANUFACTURED
HOUSING: MORTGAGE
LOANS
SITE-BUILT
CREDIT SCORE 676 691 739
INCOME $52,000 $53,000 $83,000
CLTV 87.0 96.5 95
DTI 35.7 38.9 38.7
5.3 Owned vs. Leased Land
As discussed in Section 2.1, manufactured homes can be owned separately from the land on
which they are located, which affects both the way in which a manufactured home is titled and
how it is financed.
Borrowers who own their land can either finance their home purchase with a chattel loan or a
mortgage, whereas those who do not own their land are typically only able to finance with a
chattel loan.52 In general, chattel loans have higher interest rates and fewer consumer
51 CLTV refers to the ratio of the total amount of debt that is secured by the property to the value of the property, see
variable number 34 in the HMDA Guide. DTI refers to the ratio of the applicant’s total monthly debt to the total monthly income., see variable description of number 33 in the HMDA guide, se e https://www.ffiec.gov/hmda/pdf/2018guide.pdf.
52 Arizona, Colorado, Iowa, New Hampshire, North Dakota, Oregon, Texas, Vermont, Washington and Wisconsin
allow manufactured homes on leased land to be titled as real property if a variety of conditions are met, including provisions about lease term and foundation type , see https://www.nclc.org/images/pdf/manufactured_housing/Titling_Reform-How_States_Can_Encourage_GSE_Invest_Manuf_Homes.pdf.

34 CONSUMER FINANCIAL PROTECTION BUREAU
protections than mortgages. However, consumers who get chattel loans avoid putting the
underlying land at risk in the event that they default on the loan, and some landowners express
a desire to avoid encumbering their land.53 This section examines some of the other plausible
reasons that consumers who own their land may get chattel loans instead of MH mortgages,
such as borrowers’ credit characteristics, closing times, and closing costs. Knowing the
proportion of direct owners that have chattel loans and understanding why they took out chattel
loans as opposed to MH mortgages is important to the CFPB, particularly if consumers are not
educated about the downsides of chattel loans or if they are potentially being steered into a
chattel loan even in cases where a mortgage would be better suited to the consumer’s situation.
As mentioned in Section 2.2, the new information on Manufactured Home Land Property
Interest in HMDA data point shine light on this issue.
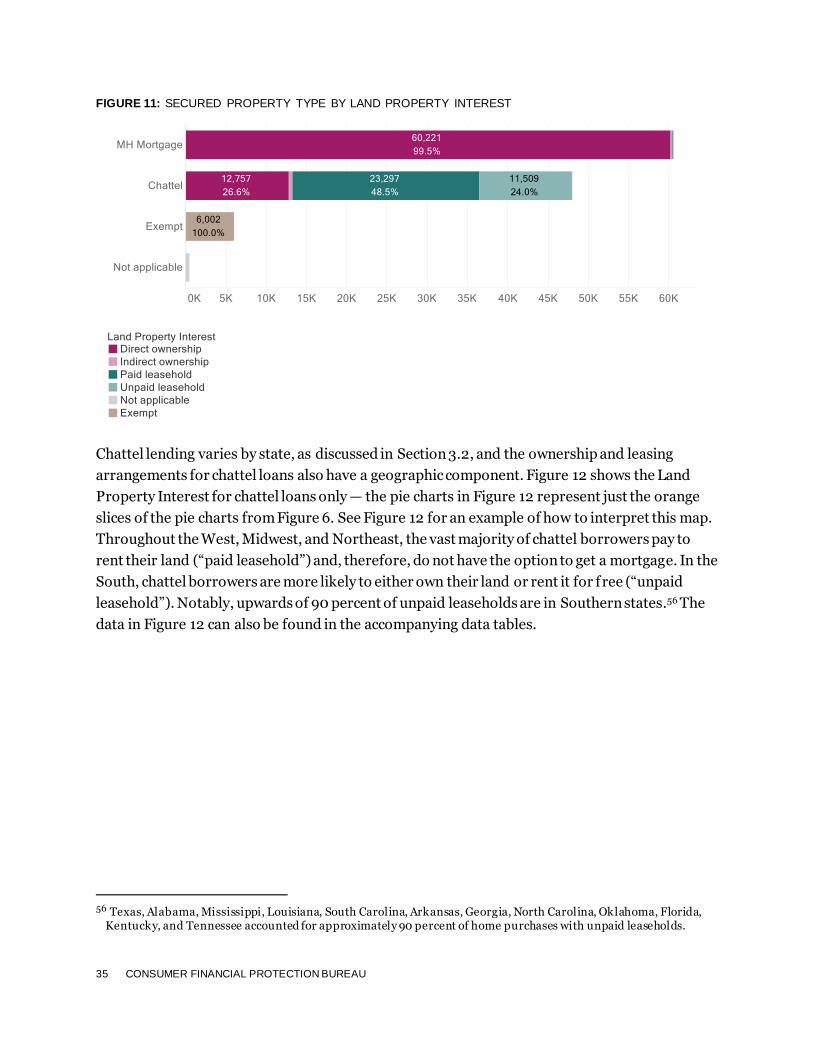
As expected, consumers’ land ownership affects their financing outcomes as seen in Figure 11.
Nearly all consumers who purchased a manufactured home with mortgage financing were direct
owners of the underlying land, and a small fraction were members of ROCs communities or
similar indirect owners. Among those with chattel loans, almost half (49 percent) rented the
land, while another 24 percent leased the land for free. Discussions with industry indicate that
many consumers who do not pay rent are leasing from family members in either formal or
informal agreements. HMDA data indicate that these arrangements may play an important role
for manufactured housing consumers. Lastly, 27 percent of consumers who received chattel
loans owned their land, even though they may have been eligible for mortgage financing.54
Figure 11 also shows that around 6,000 loans, or five percent of manufactured housing loans,
are exempt from reporting both the manufactured home secured property type and the
manufactured home land property interest.55 Based on pricing, purpose, amounts, term length,
and other characteristics, these loans appear to be a mix of chattel loans and manufactured
housing mortgages.
53 “The Loan Shopping Experiences of Manufactured Homeowners: Survey Report,” Freddie Mac and the Center for
Community Capital at the University of North Carolina. https://sf.freddiemac.com/content/_assets/resources/pdf/report/manufactured-homeowners-survey-and-report-on-loan-shopping-experiences.pdf
54 Though the analysis in this paper only includes owner-occupied (primary) residences, it is worth noting that over
half of investment properties (occupancy type = 3) with direct owners have chattel loans, compared to only about 17 percent of primary residences (occupancy type =1) and 15 percent of secondary residences (occupancy type = 2).
55 Under the Economic Growth, Regulatory Relief, and Consumer Protection Act (EGRRCPA), certain depository institutions and insured credit unions are exempted from reporting some HMDA data, including the two manufactured housing data points, for certain transactions.
35 CONSUMER FINANCIAL PROTECTION BUREAU
FIGURE 11: SECURED PROPERTY TYPE BY LAND PROPERTY INTEREST
Chattel lending varies by state, as discussed in Section 3.2, and the ownership and leasing
arrangements for chattel loans also have a geographic component. Figure 12 shows the Land
Property Interest for chattel loans only — the pie charts in Figure 12 represent just the orange
slices of the pie charts from Figure 6. See Figure 12 for an example of how to interpret this map.
Throughout the West, Midwest, and Northeast, the vast majority of chattel borrowers pay to
rent their land (“paid leasehold”) and, therefore, do not have the option to get a mortgage. In the
South, chattel borrowers are more likely to either own their land or rent it for free (“unpaid
leasehold”). Notably, upwards of 90 percent of unpaid leaseholds are in Southern states.56 The
data in Figure 12 can also be found in the accompanying data tables.
56 Texas, Alabama, Mississippi, Louisiana, South Carolina, Arkansas, Georgia, North Carolina, Oklahoma, Florida,
Kentucky, and Tennessee accounted for approximately 90 percent of home purchases with unpaid leaseholds.

36 CONSUMER FINANCIAL PROTECTION BUREAU
FIGURE 12: LAND PROPERTY INTEREST FOR CHATTEL BORROWERS
The remainder of this section looks in depth at the borrowers who own their land and, therefore,
may have a choice between financing with a mortgage or a chattel loan. In the context of this
report, the term “landowner” refers to those who reported “Direct Ownership” for the field
“Manufactured Home Land Property Interest” in HMDA—it does not include those who report
“Indirect Ownership.” The analyses examine the prevalence of chattel loans for all borrowers
who own their land, break out the data by race and age, and provide metrics on borrowers’
credit characteristics and on the loans’ interest rates, upfront costs, and closing times.
37 CONSUMER FINANCIAL PROTECTION BUREAU
In addition to these loan characteristics, landowners’ decisions about financing options may be
influenced by other financial and behavioral factors as well. In some states, tax rates are lower
on personal property than real property, which anecdotal evidence suggests is a factor for some
borrowers. Lenders have stated that some consumers own their land or family land and prefer
not to encumber it with a mortgage, and findings from UNC/Freddie Mac survey of MH
borrowers also indicate that many Texas borrowers that choose chattel have a strong desire not
to encumber the land.57 Additionally, consumers may not be aware of their options or the
tradeoffs between the two types of loans, such as the differences in consumer protections during
foreclosure or repossession. Others may be influenced by the fact that manufactured homes are
titled as personal property by default in many states.58
The 2019 HMDA data indicate that 17 percent of all landowning manufactured housing
borrowers take out chattel loans. This result is lower than estimates from previous research,
including the 2014 CFPB Report where the CFPB used AHS data to estimate that 65 percent of
all borrowers who own their land and who took out a loan to buy a manufactured home between
2001 and 2010 financed the purchase with a chattel loan. As noted in Section 2.2, AHS does not
have specific fields tracking chattel versus mortgage financing. Therefore, the CFPB used a
proxy to estimate the percent of chattel borrowers. Specifically, the CFPB used mobile home
foundation type and annual real estate tax as a proxy for financing type to estimate the chattel
population. Generally, the CFPB labeled records that reported a “permanent foundation” as
“mortgage” and labeled records with all other foundation types as “chattel”.59 However, later
analysis of MHS found that real and personal property in MHS have a variety of foundation
types. Based on this, the CFPB concludes that the foundation type variable in AHS is an
imperfect proxy for secured property type, and ultimately the estimates about the proportion of
lending that is chattel from the 2014 report are not valid.
After adding the data points about manufactured housing in 2018, HMDA became the only
national level dataset that directly tracks financing type. These new HMDA data allow
researchers to study financing behavior in manufactured housing without having to make the
assumptions required in past studies.
57 Full report here: https://sf.freddiemac.com/resources/manufactured-homeowners-survey-and-report-on-loan-
shopping-experiences
58 For further discussion on some of the tradeoffs, see the National Consumer Law Cent er’s report “Titling Home as Real Property.” https://www.nclc.org/images/pdf/manufactured_housing/cfed -titling-homes.pdf.
59 This proxy is used because in most cases, manufactured homes must be permanently affixed to the land in order to
be eligible for traditional mortgage financing, though the definition of “permanently affixed to the land” is defined differently by each state. For further insight into how titling requirements for real property differ by state, see the National Consumer Law Center’s report “Titling Homes as Real Property.” https://www.nclc.org/images/pdf/manufactured_housing/cfed-titling-homes.pdf

38 CONSUMER FINANCIAL PROTECTION BUREAU
5.3.1 Landowners
As shown previously in Figure 11, around 13,000 of the approximately 73,000 total direct
owners took out a chattel loan, indicating that most direct owners take out a MH mortgage.
Table 8 considers manufactured-home borrowers who owned their land and compare those who
got chattel loans to those who got mortgages. One possible explanation for borrowers who own
land and take out chattel loans is a lack of creditworthiness to qualify for mortgage loans, but
these tables seem to offer contradictory evidence, as many landowners who get chattel loans
have similar if not slightly better credit profiles than landowners who get MH mortgages.
However, borrowers may encounter difficulty getting mortgages with small loan amounts.
Chattel borrowers have a median loan term of 23 years, which is much shorter than loan terms
for mortgage borrowers. A plurality of MH mortgage borrowers have loan terms of 30 years—
typical of mortgages. Shorter loan terms, all else equal, result in higher monthly payments. Loan
amounts are lower for chattel loans, which likely reflects the fact that chattel loans do not
include the value of the underlying land.
TABLE 8: BORROWER CHARACTERISTICS: DIRECT OWNERS
CHARACTERISTIC (MEDIAN)
MANUFACTURED HOUSING:
CHATTEL LOANS
MANUFACTURED HOUSING:
MORTGAGE LOANS
APPLICANT CREDIT SCORE 688 691
COMBINED LTV 90.8 96.5
DEBT-TO-INCOME RATIO 35.5 39.0
APPLICANT INCOME $55,000 $53,000
LOAN TERM (YEARS) 23 30
LOAN AMOUNT $70,731 $127,200
Figures 13, 14, and 15 report the volume and percentage of direct landowners that took out a
chattel loan across groups of credit scores, ages, and race and ethnicity. The proportions are
created by dividing the number of chattel loans by the total number of manufactured housing
home purchase originations for which the borrower directly owned the land. Among direct
owners, those in the deep subprime and subprime buckets are more likely to take out chattel
loans than the near prime and prime borrowers.

39 CONSUMER FINANCIAL PROTECTION BUREAU
FIGURE 13:SECURED PROPERTY TYPE FOR DIRECT OWNERS BY CREDIT SCORE60
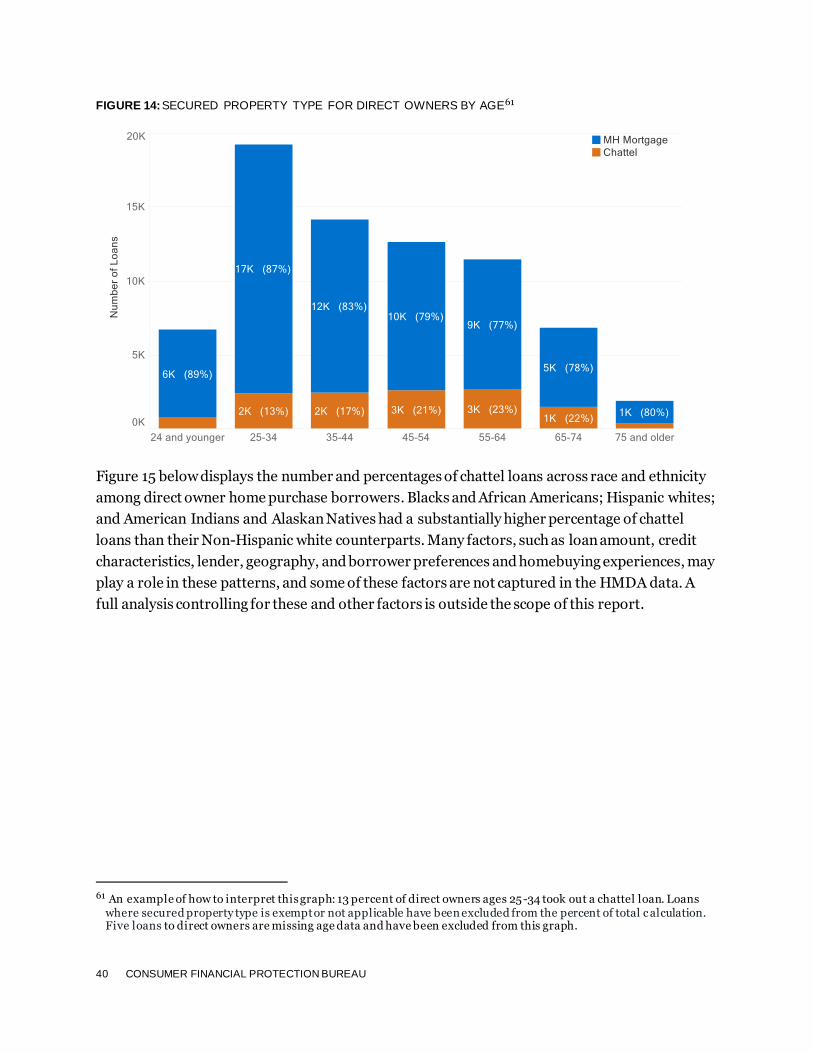
Figure 14 shows that older direct owner borrowers are more likely to take out chattel loans than
younger borrowers.
60 An example of how to interpret this graph: 34 percent of direct owners with a credit score of 579 or lower took out a
chattel loan. Loans where secured property type is exempt or not applicable have been excluded f rom the percent of total calculation.
40 CONSUMER FINANCIAL PROTECTION BUREAU
FIGURE 14:SECURED PROPERTY TYPE FOR DIRECT OWNERS BY AGE61
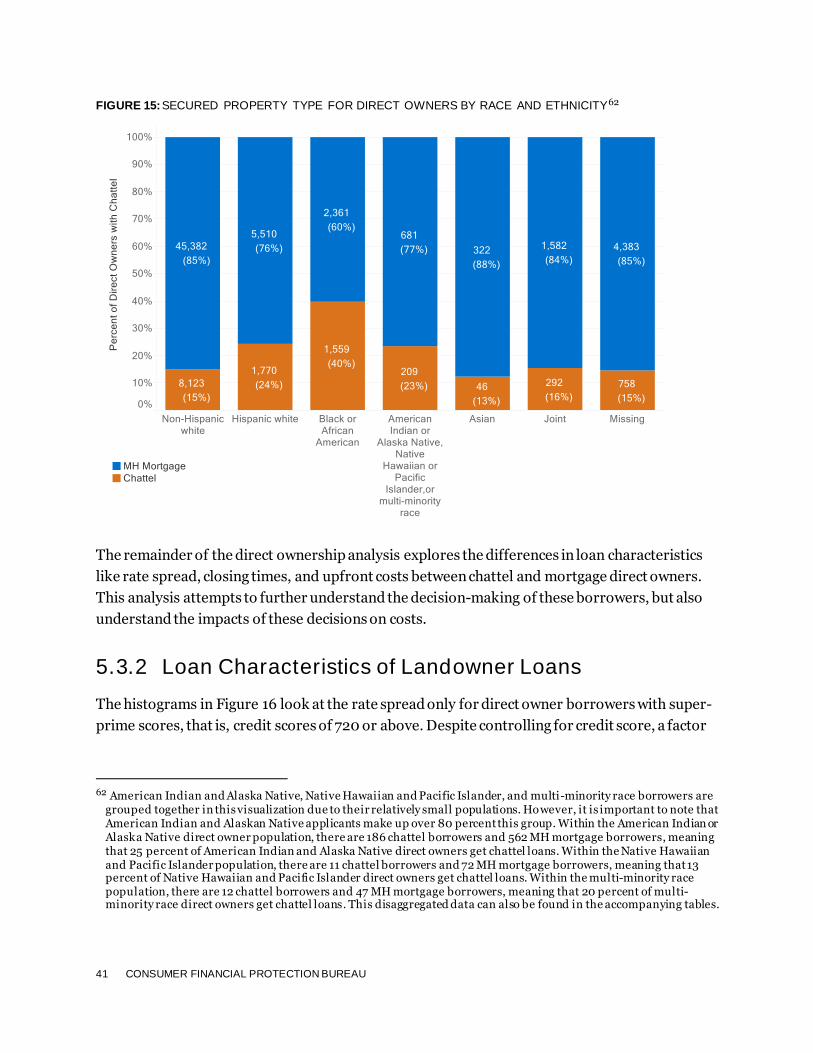
Figure 15 below displays the number and percentages of chattel loans across race and ethnicity
among direct owner home purchase borrowers. Blacks and African Americans; Hispanic whites;
and American Indians and Alaskan Natives had a substantially higher percentage of chattel
loans than their Non-Hispanic white counterparts. Many factors, such as loan amount, credit
characteristics, lender, geography, and borrower preferences and homebuying experiences, may
play a role in these patterns, and some of these factors are not captured in the HMDA data. A
full analysis controlling for these and other factors is outside the scope of this report.
61 An example of how to interpret this graph: 13 percent of direct owners ages 25-34 took out a chattel loan. Loans
where secured property type is exempt or not applicable have been excluded from the percent of total c alculation. Five loans to direct owners are missing age data and have been excluded from this graph.
41 CONSUMER FINANCIAL PROTECTION BUREAU
FIGURE 15:SECURED PROPERTY TYPE FOR DIRECT OWNERS BY RACE AND ETHNICITY62
The remainder of the direct ownership analysis explores the differences in loan characteristics
like rate spread, closing times, and upfront costs between chattel and mortgage direct owners.
This analysis attempts to further understand the decision-making of these borrowers, but also
understand the impacts of these decisions on costs.
5.3.2 Loan Characteristics of Landowner Loans
The histograms in Figure 16 look at the rate spread only for direct owner borrowers with super-
prime scores, that is, credit scores of 720 or above. Despite controlling for credit score, a factor
62 American Indian and Alaska Native, Native Hawaiian and Pacific Islander, and multi-minority race borrowers are
grouped together in this visualization due to their relatively small populations. However, it is important to note that American Indian and Alaskan Native applicants make up over 80 percent this group. Within the American Indian or Alaska Native direct owner population, there are 186 chattel borrowers and 562 MH mortgage borrowers, meaning that 25 percent of American Indian and Alaska Native direct owners get chattel loans. Within the Native Hawaiian and Pacific Islander population, there are 11 chattel borrowers and 72 MH mortgage borrowers, meaning that 13 percent of Native Hawaiian and Pacific Islander direct owners get chattel loans. Within the multi-minority race population, there are 12 chattel borrowers and 47 MH mortgage borrowers, meaning that 20 percent of multi-minority race direct owners get chattel loans. This disaggregated data can also be found in the accompanying tables.

42 CONSUMER FINANCIAL PROTECTION BUREAU
within pricing, the same pattern remains for higher rate spreads among those who take out a
chattel loan in contrast with a mortgage loan.
FIGURE 16: RATE SPREAD FOR MANUFACTURED HOUSING HOME PURCHASE ORIGINATIONS, CHATTEL
AND MORTGAGE SUPER-PRIME DIRECT OWNER BORROWERS
Part of the explanation for higher loan costs for borrowers with similar credit scores could be
differences in collateral being secured by chattel loans versus mortgages.
One explanation offered by industry for direct owners taking out chattel loans is that chattel
loans are generally faster than mortgage loans. Table 9 looks at the number of days between the
application date and closing date that can illustrate this potential difference in timing. These
data show evidence of similar closing times at the 25th percentile for both types of loans but the
median and 75th percentiles show mortgage processing times were shorter than chattel
processing times. This table offers mixed evidence regarding the comparatively lower
transaction costs in the form of processing times for chattel loans. However, this table does not
account for differences in closing times that could result from the logistics of transporting and
placing a home.

43 CONSUMER FINANCIAL PROTECTION BUREAU
TABLE 9: DAYS BETWEEN APPLICATION DATE AND CLOSING DATE: CHATTEL AND MH MORTGAGE
DIRECT OWNER BORROWERS
25th Percentile Median 75th Percentile
Chattel Loans 35 57 92
MH Mortgage Loans 35 47 72
Lenders have indicated that chattel loans often have lower closing costs than mortgages.
However, we do not attempt to verify this claim using the HMDA data because the “total loan
costs” data point collected about mortgage loans is not directly comparable to the “total points
and fees” data point collected about chattel loans.
Total loan costs for manufactured housing mortgages are generally higher across all loan
amounts than total points and fees for chattel loans, but the two fields are calculated differently
based on different regulations. Generally, total loan costs in HMDA match the amounts
disclosed to the consumer on the Closing Disclosure as specified in the TILA-RESPA Integrated
Disclosure Rule. However, chattel loans do not use these disclosures and instead report total
points and fees, as defined under the Ability-to-Repay Rule.
Total loan costs generally encompass a broader set of fees than total loan costs. Both data points
typically include origination charges such as origination and application fees. However, total
points and fees may exclude bona discount points. Third-party fees (e.g., appraisal, settlement
services, and title insurance fees) are typically included in total loan costs, but they may be
excluded from points and fees if certain conditions are met.
5.4 Manufactured housing lenders
HMDA offers insights into the major lenders in the manufactured housing market, the degree of
specialization, and the existence (or lack) of a secondary market. HMDA only captures the
behavior of the lenders, but the manufactured housing market is made up of lenders, dealers,
homebuilders, and more. In some cases, associated companies control all three of these aspects
of the manufactured housing sale.

44 CONSUMER FINANCIAL PROTECTION BUREAU
In 2019, more than 2,300 lenders reported originating home-purchase loans for manufactured
housing.63 However, a large portion of the lending, especially for chattel loans, is concentrated
among relatively few lenders. The top 15 lenders, shown in Figure 17, account for approximately
50 percent of the overall manufactured housing market, including over 80 percent of chattel
lending and approximately 35 percent of MH mortgage lending. The top five lenders made more
than 40 percent of home purchase manufactured housing loans, including nearly 75 percent of
chattel loans and 18 percent of MH mortgages.64 The top two lenders, 21st Mortgage and
Vanderbilt, are both subsidiaries of Clayton Homes65 and make up a combined 30 percent of the
manufactured housing market, including 56 percent of chattel lending and 13 percent of MH
mortgage lending. Given the market share of these firms, some market trends reflect the
practices of most institutions, while others may be driven by practices of a few of the largest
companies.
The largest players in the market are specialized lenders whose primary business relates to
manufactured housing. They often market themselves as manufactured housing lenders and do
little to no lending for site-built homes. As shown in Figure 17, for each of the top four lenders
more than 75 percent of their home purchase lending was for manufactured housing (as
opposed to site-built).
Alternatively, another tier of lenders includes several large financial institutions, including well-
known lenders like Wells Fargo Bank and Guild Mortgage Company, for whom manufactured
housing is only a small part of their business. These lenders typically offer mortgages and may
not offer chattel loans.
63 Under the HMDA rule applicable to the 2019 HMDA data, an institution was not required to report HMDA data
unless it originated at least 25 covered closed-end loans in each of the two preceding calendar years or at least 500 covered open-end lines of credit in each of the two preceding calendar years, and it meets other applicable coverage requirements. Some lenders choose to optionally report.
64 In the 2014 CFPB Report, the CFPB reported that, based on conv ersations with industry participants, chattel
lending was concentrated among five lenders: 21st Mortgage, Vanderbilt Mortgage, Triad Financial Services, U.S. Bank, and San Antonio Federal Credit Union. These accounted for over 52 percent of the manufacture d-home purchase-money mortgages reported in the 2012 HMDA data, which the report explained was likely understating these institutions’ share of the chattel market, as HMDA captures both mortgages and chattel loans. The new HMDA data point on secured property type allowed the CFPB to calculate this share, and supports the assertion that the 2012 estimate was an underestimate. U.S. Bank has since exited the chattel lending market, and San Antonio Federal Credit Union became Credit Human.
65 Clayton Homes is involved in manufacturing, selling, financing, leasing, and insuring manufactured homes through its brands and subsidiaries, see https://www.claytonhomes.com/subsidiaries.

45 CONSUMER FINANCIAL PROTECTION BUREAU
FIGURE 17:TOP 15 MANUFACTURED HOUSING LENDERS BY VOLUME AND MH AS A PERCENTAGE OF ALL
LENDING
Table 10 uses the framework discussed above to classify lenders into three groups, based on
their degree of specialization in manufactured housing:66
1. Manufactured Housing Specialty Lender: Over 75 percent of lending is manufactured
housing.
2. Mixed Lender: Between 25-75 percent of lending is manufactured housing.
3. Traditional Lender: Less than 25 percent of lending is manufactured housing.
66 This methodology is similar to that used by the Urban Institute, see
https://www.urban.org/sites/default/files/publication/98687/challenges_to_obtaining_manufactured_home_financing_0.pdf.

46 CONSUMER FINANCIAL PROTECTION BUREAU
Chattel lending is far more common among lenders that specialize in manufactured housing
lending than among primarily site-built lenders, many of which do not offer chattel loans. This
includes lending to landowners— over half of landowners that borrow from lenders that
specialize in manufactured housing receive chattel loans, compared to around 11 percent for
mixed lenders and only 2 percent of site-built lenders.
TABLE 10: LENDERS, LOANS, AND FINANCING BY LENDER CATEGORY
Lender
Category
Number of
MH Lenders
Number of
MH Loans
Percent of
Loans that
are Chattel
Percent of
Direct Owners
with Chattel
Number of
Direct Owners
with Chattel
Manufactured
Housing
Specialty
Lenders
45 52,765 79.8% 53.5% 11,348
Mixed Lenders 288 8,788 31.8% 11.3% 947
Traditional
Lenders 2,052 53,444 5.8% 2.0% 462
Figure 18 shows the evolution of the number of home purchase manufactured housing loans by
institution type. Institutions are categorized as affiliates, banks, credit unions, and independent
mortgage companies.67 Throughout the time period depicted, independents and banks
dominated the MH lending space. During the Great Recession, independents’ loan volume
declined at a much faster rate than banks and began increasing their volume of MH lending
after 2011. From 2017 to 2019, independents increased their lending substantially from 55,000
loans to 80,000 loans. Banks had a steadier sustained decline in lending until 2012, when bank
lending roughly stabilized. Credit unions have increased MH lending since 2007, while affiliate
lending declined substantially, with a large drop-off during the Great Recession and no rebound.
67 Institutions are categorized using a combination of agency code and other lender codes. Affiliate is defined as a
company that controls, is controlled by, or is under common control with a financial institution. Independent mortgage companies (or non-banks/non-depositories): Independent mortgage companies are non-depository institutions that typically focus on mortgage lending and typically borrow from various warehouse lenders to finance mortgage loans prior to their sale in the secondary market. Independents, for example, include 21st Mortgage and Vanderbilt Mortgage which are non-bank entities.

47 CONSUMER FINANCIAL PROTECTION BUREAU
FIGURE 18:MANUFACTURED HOUSING HOME PURCHASE ORIGINATIONS BY INSTITUTION TYPE: 2007-
201968
68 The financial institutions are broadly categorized into depository institutions (DIs) and nondepository institutions
(non-DIs). Dis include banks, thrifts and credit unions. Non-DIs include mortgage companies affiliated with DIs and independent mortgage companies.
48 CONSUMER FINANCIAL PROTECTION BUREAU
6. Conclusion and Future Research
Manufactured housing is an important source of affordable housing and MH consumers are
often financially vulnerable. The two new manufactured housing data points available in HMDA
data have helped fill significant gaps in the understanding of manufactured housing finance that
the CFPB faced in the 2014 report on manufactured housing. These data points also have helped
tie together the landscape of manufactured housing datasets and research to more accurately
assess the issues facing manufactured housing borrowers. In particular, the findings provide
context for understanding the implications of research using data limited to manufactured
housing finance in Texas.
Informed by these new data, this Data Point explores differences between manufactured
housing chattel loans, manufactured housing mortgages, and site-built mortgages along a
variety of dimensions. We find that patterns in land ownership and titling vary substantially
across geography, race and ethnicity, and type of lender.
Analysis of HMDA finds that approximately 42 percent (48,029) of manufactured home
purchase loans in HMDA are chattel. For the majority of these loans (72 percent), the consumer
does not own the land and is ineligible for a mortgage. Compared to mortgages, chattel loans
have higher interest rates, shorter loan terms, lower loan amounts, fewer consumers
protections, and are rarely refinanced. Hispanic, Black and African American, American Indian
and Alaska Native, and elderly borrowers are more likely than other consumers to take out
chattel loans, even after controlling for land ownership. Additionally, the chattel market is more
concentrated than the mortgage market, with the top five MH lenders accounting for nearly 75
percent of home purchase chattel loans recorded in HMDA.
Approximately 64 percent of manufactured-home owners also own the underlying land and, as a
result, may be eligible for a manufactured housing mortgage. This paper finds that the majority
of landowners who finance their MH purchase got a mortgage and only about 17 percent take
out a chattel loan. Thus, while future research should continue to investigate the motivations
and experiences of this population, it should also expand to focus on other subsets of
manufactured housing borrowers highlighted by HMDA, such as indirect owners in ROCs,
borrowers living on family land, and those in tribal areas.
Additional research should also go beyond the origination data in HMDA to examine the
servicing market. Analyses could include loan performance metrics for manufactured homes,
particularly in light of the challenges raised by the coronavirus pandemic.
49 CONSUMER FINANCIAL PROTECTION BUREAU
Lastly, this report touches on some of the differences in experiences and outcomes for MH
borrowers by race and ethnicity. The Bureau has an interest in promoting racial equity and
further research should be done to understand how policymakers, consumer advocates,
industry, researchers, and others can promote racial equity and financial well-being for
manufactured-home owners and residents. For example, analysis of pricing and borrower race
and ethnicity by lender is beyond the scope of this paper and necessitates a separate analysis
due to the complex factors that affect pricing and the potential implications of a pricing and race
and ethnicity analysis. Additionally, more research is needed to understand how to promote
sustainable homeownership and wealth building for consumers with small loan amounts.
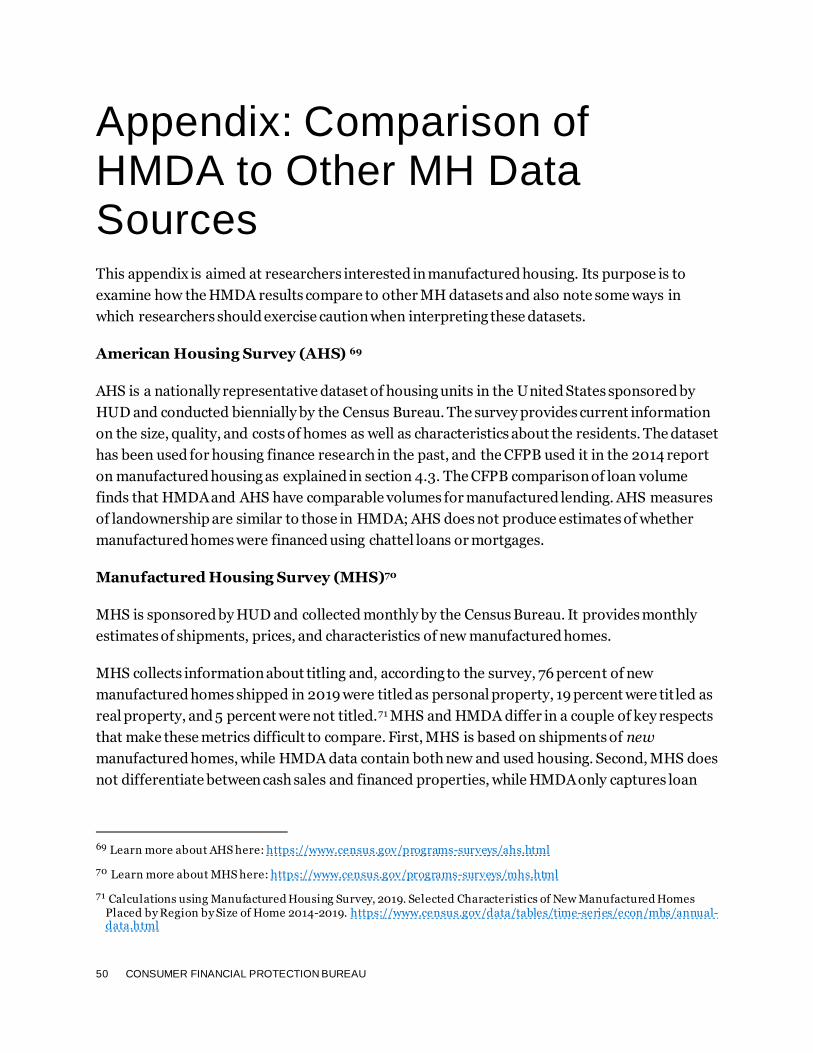
50 CONSUMER FINANCIAL PROTECTION BUREAU
Appendix: Comparison of HMDA to Other MH Data Sources This appendix is aimed at researchers interested in manufactured housing. Its purpose is to
examine how the HMDA results compare to other MH datasets and also note some ways in
which researchers should exercise caution when interpreting these datasets.
American Housing Survey (AHS) 69
AHS is a nationally representative dataset of housing units in the United States sponsored by
HUD and conducted biennially by the Census Bureau. The survey provides current information
on the size, quality, and costs of homes as well as characteristics about the residents. The dataset
has been used for housing finance research in the past, and the CFPB used it in the 2014 report
on manufactured housing as explained in section 4.3. The CFPB comparison of loan volume
finds that HMDA and AHS have comparable volumes for manufactured lending. AHS measures
of landownership are similar to those in HMDA; AHS does not produce estimates of whether
manufactured homes were financed using chattel loans or mortgages.
Manufactured Housing Survey (MHS)70
MHS is sponsored by HUD and collected monthly by the Census Bureau. It provides monthly
estimates of shipments, prices, and characteristics of new manufactured homes.
MHS collects information about titling and, according to the survey, 76 percent of new
manufactured homes shipped in 2019 were titled as personal property, 19 percent were tit led as
real property, and 5 percent were not titled.71 MHS and HMDA differ in a couple of key respects
that make these metrics difficult to compare. First, MHS is based on shipments of new
manufactured homes, while HMDA data contain both new and used housing. Second, MHS does
not differentiate between cash sales and financed properties, while HMDA only captures loan
69 Learn more about AHS here: https://www.census.gov/programs-surveys/ahs.html
70 Learn more about MHS here: https://www.census.gov/programs-surveys/mhs.html
71 Calculations using Manufactured Housing Survey, 2019. Selected Characteristics of New Manufactured Homes Placed by Region by Size of Home 2014-2019. https://www.census.gov/data/tables/time-series/econ/mhs/annual-data.html

51 CONSUMER FINANCIAL PROTECTION BUREAU
information and does not cover cash sales. A comparison of HMDA data and THOR data shows
that, at least in Texas, chattel loans are more likely to be secured by newly constructed homes,
while MH mortgages are more likely to be secured by used homes.72 This may partially explain
the differences between HMDA and MHS in regard to titling, though understanding these
differences could be an area of further research.
MHS does not provide information about whether the homebuyer owned or leased the land on
which the manufactured home is placed.
Texas Manufactured Home Ownership Records (THOR)
The Texas Department of Housing and Community Affairs, through its Manufactured Housing
Division, maintains public records of manufactured housing ownership in Texas dating back to
1982. The data are updated daily, and each record represents an ownership certificate for a
manufactured home. The records include information on ownership, location, structure, liens,
real or personal property status, and more.
While THOR is a robust dataset, researchers should be aware of its limitations. Analysis of
THOR data and consultation with the Texas Manufactured Housing Division have identified
several key points about the THOR data and manufactured housing in Texas:
• THOR is an administrative database used for ownership records and may be
missing records. Each record in THOR is created upon a manufactured homeowner
submitting a “Statement of Ownership.” These statements are only required to be
submitted when a licensed retailer is selling the home. When manufactured homes are
sold during consumer-to-consumer sales, brought in from another state, or obtained
through a variety of additional circumstances, they often are not recorded via a
Statement of Ownership and thus are not present in the THOR data. According to the
Texas Manufactured Housing Division, this results in an unknown quantity of records
being left out of THOR.
• In Texas, as in many states, manufactured housing is classified as personal
property by default.73 Though some manufactured homes are converted to
real property, the conversion is not always recorded in the THOR records.
Homeowners can title their manufactured home as real property by electing “real
property” on the Statement of Ownership, paying the requisite fees, and having the title
72 Details of the analysis are provided in the Appendix.
73 National Consumer Law Center “Titling Homes as Real Property.” October 2014. https://www.nclc.org/images/pdf/manufactured_housing/cfed-titling-homes.pdf

52 CONSUMER FINANCIAL PROTECTION BUREAU
recorded with the county clerk. Once the title is recorded, the THOR database is updated
to indicate that the manufactured home has had the appropriate paperwork filed and the
deed has been perfected. Sometimes, homeowners choose not to submit an updated
Statement of Ownership with the new titling: these are the cases that lead to real
properties being mislabeled as personal property in the records, rendering the records
unreliable for determining real versus personal property. Jurisdiction over real property
lies with the county, while jurisdiction over personal property is held by the Texas
Manufactured Housing Division.
• Liens on real property are often not recorded in THOR, meaning that
researchers cannot determine which real property transactions were
financed versus which were bought outright. Importantly, the process for
recording a lien in Texas varies based on whether a manufactured home is real or
personal property. Liens on personal property are recorded on the Statement of
Ownership and are legally enforceable. Liens for real properties must be recorded with
the county clerk, so recording them on the Statement of Ownership is optional. As a
result, many financed purchases of real properties appear in THOR with no lien
information and are thus indistinguishable from cash sales.
HMDA and THOR are both loan-level datasets and cover many of the same manufactured
housing transactions in Texas, though THOR includes cash sales which are excluded from
HMDA. The CFPB has access to the non-public version of HMDA that includes the address of
the property used to secure a loan, which was used to match to the address disclosed in the
THOR data. The following analyses use a combined dataset based on home purchase
originations in Texas from 2019 HMDA, supplemented with matched records from THOR. 74
Records from THOR that did not match to HMDA are excluded.
Overall, 85 percent of HMDA records had an address match in THOR. The match rate was
higher for chattel loans than mortgages.
74 The match analysis is performed without the filters that are used in the rest of this report (outlined at the beginning
of section 4) in order to compare a larger volume of HMDA loans. Therefore, the volume of HMDA loans in Texas in Figures 19-23 is larger than the volume analyzed in Figures 5, 6, and 12.

53 CONSUMER FINANCIAL PROTECTION BUREAU
FIGURE 19:ADDRESS MATCH RESULTS FOR HMDA AND THOR BY HMDA SECURED PROPERTY TYPE
Additionally, while 89 percent of chattel loans in HMDA had a lien record in THOR, the same
was true for only 48 percent of mortgages, illustrating that lenders are significantly less likely to
record a lien in THOR on real property than chattel property. As a result, the lienholder
information in THOR is not a reliable for indicating whether a property is financed.
FIGURE 20:LIENHOLDER (THOR) BY SECURED PROPERTY TYPE (HMDA)
The HMDA-THOR match also demonstrates that both datasets generally classify transactions
the same way in regard to the titling—the vast majority of matched mortgages are certified as
real property while the vast majority of matched chattel loans are certified as personal property.
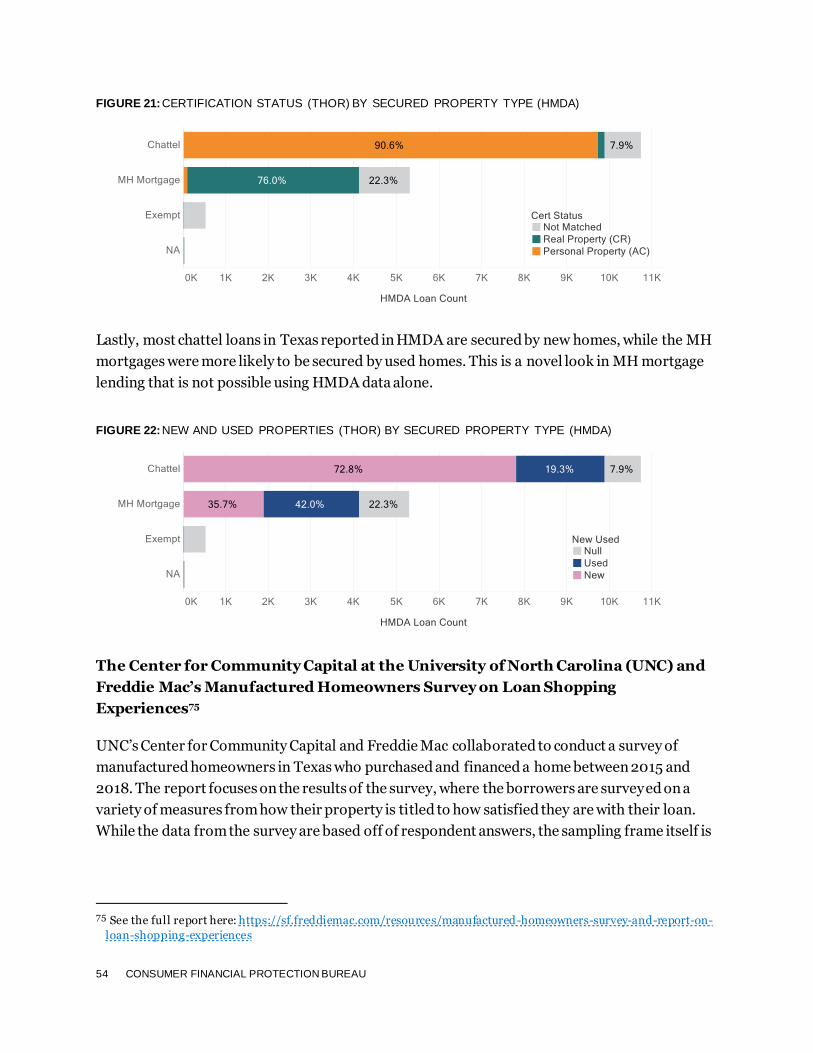
54 CONSUMER FINANCIAL PROTECTION BUREAU
FIGURE 21:CERTIFICATION STATUS (THOR) BY SECURED PROPERTY TYPE (HMDA)
Lastly, most chattel loans in Texas reported in HMDA are secured by new homes, while the MH
mortgages were more likely to be secured by used homes. This is a novel look in MH mortgage
lending that is not possible using HMDA data alone.
FIGURE 22:NEW AND USED PROPERTIES (THOR) BY SECURED PROPERTY TYPE (HMDA)
The Center for Community Capital at the University of North Carolina (UNC) and
Freddie Mac’s Manufactured Homeowners Survey on Loan Shopping
Experiences75
UNC’s Center for Community Capital and Freddie Mac collaborated to conduct a survey of
manufactured homeowners in Texas who purchased and financed a home between 2015 and
2018. The report focuses on the results of the survey, where the borrowers are surveyed on a
variety of measures from how their property is titled to how satisfied they are with their loan.
While the data from the survey are based off of respondent answers, the sampling frame itself is
75 See the full report here: https://sf.freddiemac.com/resources/manufactured-homeowners-survey-and-report-on-
loan-shopping-experiences

55 CONSUMER FINANCIAL PROTECTION BUREAU
based on the lienholders, property type, and physical address provided in the THOR data. Due
to the reasons outline above, the survey may inherit the same limitations as the THOR data.