manufacture and characterisation of piezoelectric ...opus.bath.ac.uk/41957/1/2014_asc.pdf · ......
TRANSCRIPT

Manufacture and characterisation of piezoelectric broadband energy
harvesters based on asymmetric bistable laminates P. Harris, C. R. Bowen, D. N. Betts and H. A. Kim
Department of Mechanical Engineering, University of Bath, Bath, BA2 7AY, UK * Corresponding Author: [email protected]
ABSTRACT
Piezoelectric energy harvesters that convert mechanical vibration into electrical
energy are potential power sources for systems such as autonomous wireless sensor networks or safety monitoring devices. However, ambient vibrations generally exhibit multiple time-dependent frequencies, which can include components at relatively low frequencies. This can make typical linear systems inefficient or unsuitable; particularly if the resonant frequency of the device differs from the frequency range of the vibrations it is attempting to harvest. To broaden the frequency response of energy harvesters, a variety of researchers have introduced elastic non-linearity; for example by designing bistable harvesters with two energy wells. Researchers have considered inducing bistability through magnetic interactions, axial loading, and buckling of hinge-like components. An alternative method has been recently considered where a piezoelectric element is attached to bistable laminate plates with two plies of [0/90]T layup to induce large amplitude oscillations. Such harvesting structures have been shown to exhibit high levels of power extraction over a wide range of frequencies. In this paper we will manufacture and characterise the energy harvesting capability of bistable asymmetric laminates coupled to piezoelectric materials. Cantilever configurations will be explored and harvested power levels as a function of load impedance, vibration frequency and amplitude will be assessed. Harvested power levels, natural frequencies and mode shapes will be compared with linear cantilevers of similar geometry and stiffness to assess the benefits of using bistable configurations.
_____________

Peter Harris, Chris Bowen, H Alicia Kim Department of Mechanical Engineering, University of Bath, Bath BA2 7AY, UK INTRODUCTION
Devices for the conversion of vibrational energy to electrical power have
received increasing interest in the past decade, with a particular application of autonomous low power devices such as wireless sensor nodes. A variety of methods have been considered including electrostatic generation [1], electromagnetic induction [2] and the piezoelectric effect [3].
The piezoelectric effect has a number of advantages including ease of integration within a system, higher strain energy densities compared to electrostatic and electromagnetic systems, and a purely solid-state conversion between electrical and mechanical energy [4]. In many cases piezoelectric energy harvesting devices have been designed to operate close to a resonant frequency to optimise the power generation, for example simple linear cantilevered beam configurations [5]. An alternative approach is to exploit nonlinear dynamics, such as bistability, to improve the power harvesting capability. For example, the dynamic modes of nonlinear systems have been observed to produce power across a broadband range of frequencies [6].
a b
c

Figure 1. (a) First stable state of [0/90]T laminate with Macro Fibre Composite piezoelectric patch (b) second state (c) corresponding strain energy profile.
A common nonlinear piezoelectric energy harvesting device is a bistable cantilever system where the bistability is induced using an external arrangements of magnets. An alternative method presented by Erturk, et al. employs a piezoelectric element attached to the surface of a composite laminate with an asymmetric stacking sequence [3]. Such an approach is aimed at exploiting the inherent bistability arising from anisotropic thermal properties of fibre composites. Figure 1a and b shows the two stable equilibrium states of a square bistable [0/90]T carbon fibre reinforced polymer (CFRP) laminate with a Macro Fibre Composite (MFC) piezoelectric element attached to its centre. Figure 1c shows the double-well strain energy profile for the range of curvatures of a bistable composite where the two minima represent the two stable equilibria, State 1 and State 2 (inset of Figure 1c) and the saddle point in the centre shows the unstable equilibrium and the energy hill that needs to be traversed to ‘snap-through’ from one state to the other.
Bistable laminates have been extensively studied for morphing or adaptive structure concepts [7, 8, 9] since snap-through between stable states can result in a large deflection. For harvesting applications, a conformable piezoelectric element is attached to the laminate surface to generate electrical energy by the direct piezoelectric effect when the structure is repeatedly deformed as a result of mechanical vibrations. The onset of the snap-through mechanism is thought to lead to large and rapid variation in strain leading to high power outputs achieved over a broad frequency range [3]. Experimentally, such harvesting devices have been shown to exhibit high levels of power extraction over a wide range of frequencies; for example, approximately 30mW was achieved for an acceleration forcing level of 2.0 g [3], and there are opportunities for further optimisation to increase the power output [10]. However, what is less clear is how the power output compares quantitatively between linear and bistable energy harvesting devices.
The aim of this paper is to present the comparative investigation of linear and bistable energy harvesters. We select a cantilevered beam configuration of the same dimensions made from carbon fibre-epoxy laminates. The linear beam has a symmetrical stacking sequence and the bistable beam has an asymmetrical stacking sequence of the same plies. The following sections will outline the further details of the experimental set up and discuss the modal characteristics and the power harvesting capability of the two beam configurations.
EXPERIMENTAL
Two cantilevered beams were made using unidirectional CFRP, HexPly M21 (Hexcel) with a Young's modulus (E11) of 178GPa and shear modulus (G12) of 5.2GPa [11]. The ply layup for the linear beam was [90/0/0/90]T, as shown in figure 2a, and the bistable beam was [0/0/90/90]T, as shown in figure 2b where 0° is along the span of the beams. The beam dimensions were 280mm long and 60mm wide and the ply thickness was between 0.185 and 0.195 mm after curing. To ensure the clamped end of the bistable cantilever remained flat in its two stable states, two additional plies were added at one end to make the clamped region symmetric [0/0/90/90/0/0]T, figure 2b.

Figure 2. Laminate lay-ups (a) linear [90/0/0/90]T, (b) bistable [0/0/90/90]T. The cantilevers were
clamped at the left hand side.
In order to convert mechanical vibrations of the laminate beams into electrical
energy a MFC piezoelectric element (M8528-P2, Smart Materials) of dimensions 105mm × 34mm was bonded to the surface of the laminate at 35mm from the root. The MFC is based on a lead zirconate titanate (PZT) ferroelectric ceramic which is polarised through its thickness with a manufacturer’s specified capacitance of 172nF [12]. Figure 3a shows a cross section of the MFC bonded onto the CFRP showing the piezoelectric fibre in the MFC, the upper and lower electrodes to collect the harvested charge and the bond layer. Figure 3b shows a top-down view of the MFC attached to the CFRP where the piezoelectric fibres and the upper mesh electrode can be observed.
The first 30mm of the beams were bolted between two aluminum plates to induce the clamped boundary condition, as shown in figure 4a which also shows the overall dimensions. The energy harvester (i.e. the laminate-MFC combination) was mounted to an electrodynamic shaker (LDS V455) as in figure 4b. When undertaking frequency sweeps at constant peak acceleration for power generation, the shaker signal was generated in LabVIEW (National Instruments NI-USB-6211 DAQ) which sets the signal amplitude to achieve a desired g-level. This is achieved by initially measuring the velocity, and then calculating the acceleration of the central shaker attachment for a parameter sweep of drive frequency (10-200Hz) and shaker input voltage (0.05-5.0V) and generating a calibration table for any chosen g-level. The shaker input in terms of drive frequency and input voltage is achieved via a power amplifier (Europower EP1500).
a
b
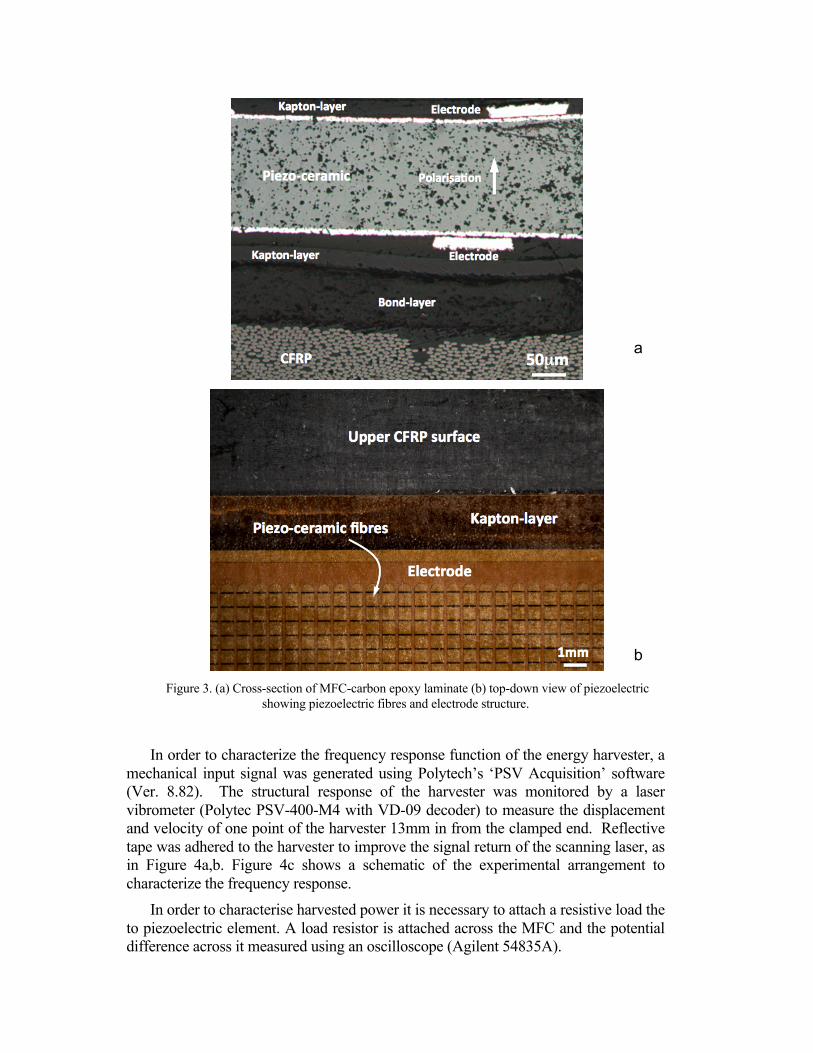
Figure 3. (a) Cross-section of MFC-carbon epoxy laminate (b) top-down view of piezoelectric
showing piezoelectric fibres and electrode structure.
In order to characterize the frequency response function of the energy harvester, a
mechanical input signal was generated using Polytech’s ‘PSV Acquisition’ software (Ver. 8.82). The structural response of the harvester was monitored by a laser vibrometer (Polytec PSV-400-M4 with VD-09 decoder) to measure the displacement and velocity of one point of the harvester 13mm in from the clamped end. Reflective tape was adhered to the harvester to improve the signal return of the scanning laser, as in Figure 4a,b. Figure 4c shows a schematic of the experimental arrangement to characterize the frequency response.
In order to characterise harvested power it is necessary to attach a resistive load the to piezoelectric element. A load resistor is attached across the MFC and the potential difference across it measured using an oscilloscope (Agilent 54835A).
a
b
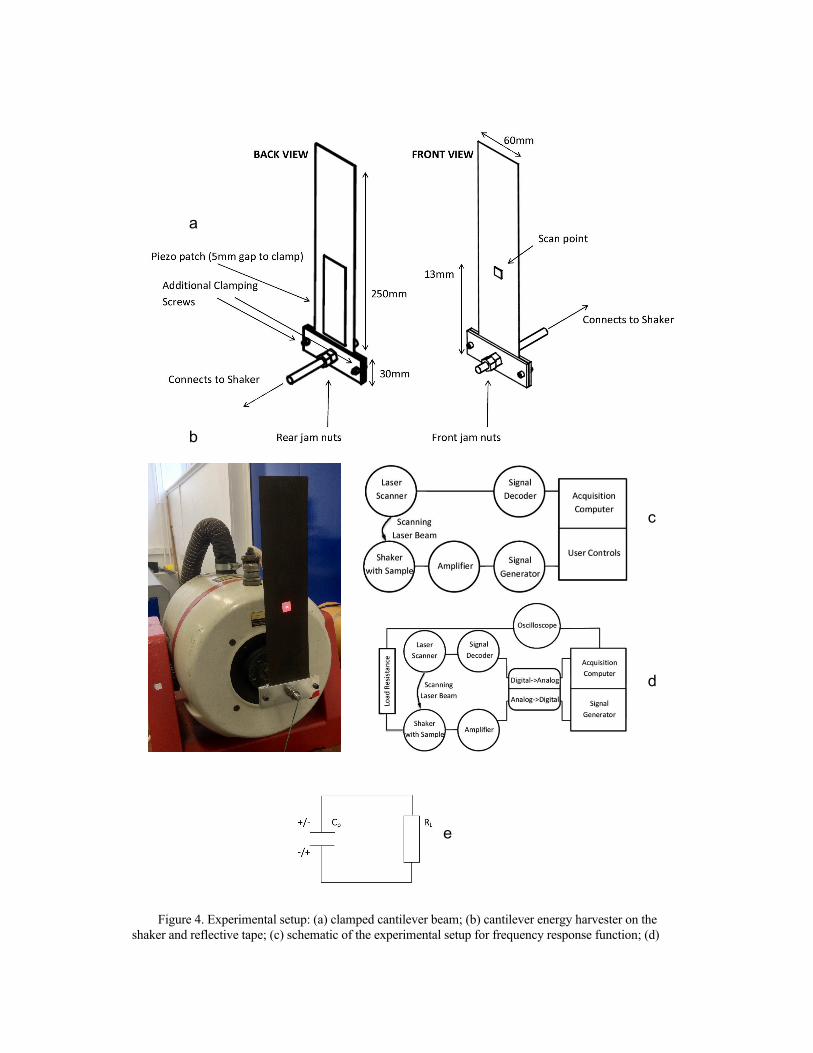
Figure 4. Experimental setup: (a) clamped cantilever beam; (b) cantilever energy harvester on the shaker and reflective tape; (c) schematic of the experimental setup for frequency response function; (d)
a
b
c
d
e

experimental schematic for power versus frequency, g-level and load resistance; (e) energy harvesting circuit.
The optimal load resistance (RL) for maximum power is achieved by matching the load impedance to the capacitative load of the piezoelectric (CP=172nF); this is achieved at to the condition 2π.f. RL.CP=1, where f is the frequency. For the initial phase of testing a single load resistance was used which for the linear harvester RL=21kΩ (2nd bending mode at 43Hz) and for the bistable RL=36kΩ (1st bending mode at 26Hz). Figure 4d shows a schematic of the experimental arrangement for power characterization and figure 4e shows the harvester electrical circuit diagram. Specific test procedures are detailed where relevant throughout the paper.
RESULTS
Dynamic Modes of Linear and Bistable Cantilever Beams
The frequency response function of the energy harvesters were initially characterized. A frequency range from 1Hz to 200Hz which covers a typical frequency range of a bridge with traffic and ground transport was analyzed [13]. To characterise the response of the linear and bistable beams, they were both subjected to the same perturbation input, and their free vibration response recorded in the time domain and subsequently transformed into the frequency domain using a fast Fourier transform. The perturbation was a burst ‘chirp’ signal which swept through frequencies of 310 Hz to 340 Hz in approximately 0.32s. From the start of the chirp, the scanner was set to delay measurement for 0.55s, giving the laminate 0.23s to transition into a free response and the shaker’s shank to come to a complete stop. From the time measurement began, velocity data was collected for 6.4 seconds with a sampling frequency of 1.28 kHz. The shaker was driven with a constant voltage of 3.5V resulting in an RMS acceleration of 47g and a maximal value of over 70g. Snap-through of the bistable beam during chirp characterisation was not observed.
Figure 5 shows the fast Fourier transform (FFT) of the velocity measurements at the scan point of figure 4a,b of the linear and bistable cantilevered beams from 1-200Hz. As the velocity measurement is taken in the centre of the width, torsional or rolling modes around the axis along the span of the beam will not be identified. Figure 6 illustrates the bending modes and Table I summarises the resonant modes; the displacement of the third mode was too small to be observed visually. Within the experimental range of 1-200Hz, three resonant modes were observed for the linear beam while two modes were observed for the bistable beam. Noting that we measured the velocity at the location just off the centre of the beam, the amplitudes of the modes are consistent with the corresponding mode shapes.
As shown in figure 5, the frequency at which the bistable encounters the different bending mode orders is consistently higher than those of the linear harvester. This is due to higher stiffness of the bistable cantilever which is attributable to the fact that the bistable harvester has an extra two layers in the clamping region and the asymmetric
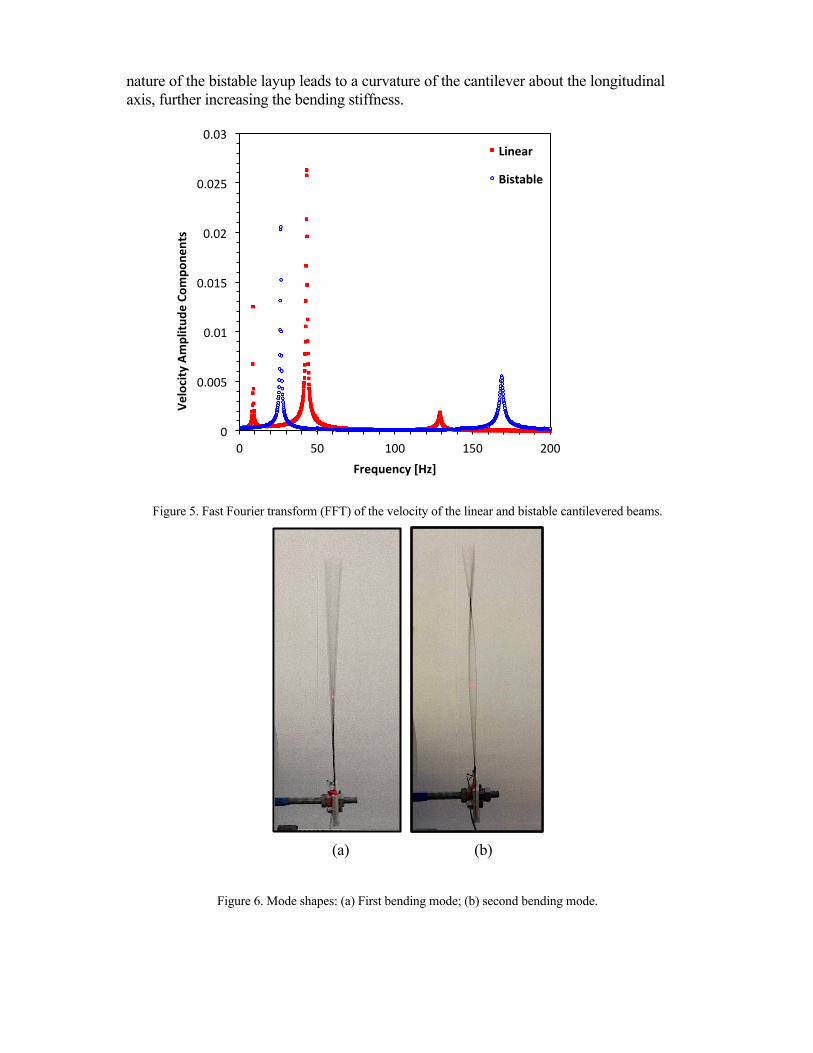
nature of the bistable layup leads to a curvature of the cantilever about the longitudinal axis, further increasing the bending stiffness.
Figure 5. Fast Fourier transform (FFT) of the velocity of the linear and bistable cantilevered beams.
(a) (b)
Figure 6. Mode shapes: (a) First bending mode; (b) second bending mode.
0
0.005
0.01
0.015
0.02
0.025
0.03
0 50 100 150 200
Velocity Amplitu
de Com
pone
nts
Frequency [Hz]
Linear
Bistable

Table I. Mode shapes and associated frequencies for linear and bistable harvester.
Mode Mode shape Linear beam Bistable beam
1st bending
9Hz 26Hz
2nd bending
43Hz 176Hz
3rd bending
129Hz > 200Hz (not observed)
Investigation of Power and Frequency
To demonstrate the differences between high and low excitation for both of the harvesters, sweeps from 15Hz to 200Hz were carried out at 1g and 6g acceleration for both the linear and bistable energy harvester. To highlight in detail the regions of maximal power output near the natural frequencies, detailed frequency sweeps with an increment 0.2Hz were undertaken as shown in figures 7b,c and figure 8b,c for the linear and bistable system respectively. The lower bound of frequencies when performing sweeps such as these is 15Hz due to the electric current limitations of amplifier powering the shaker system. Measurements were undertaken by both increasing frequency (‘up-sweep’) and decreasing frequency (‘down-sweep’) to further characterise any nonlinear behaviour. Upon changing to each frequency, 0.2s was allowed for the hearvester to attain a steady-state response before the velocity data was recorded for 4.8 seconds. From the set of data at each frequency, the peak velocity value and an RMS voltage were measured. The harvesting power for a specific frequency and g-level was calculated using equation (1).
(1)
P = Vrms2
R
0
5
10
15
20
25
15 40 65 90 115 140 165 190
Power [m
W]
Frequency [Hz]
1g Up-‐sweep
1g Down-‐sweep
6g Up-‐sweep
6g Down-‐sweep
0
2
4
6
8
10
12
14
35 40 45 50
Power [m
W]
Frequency [Hz]
1g Up-‐sweep 1g Down-‐sweep 6g Up-‐sweep 6g Down-‐sweep
a b
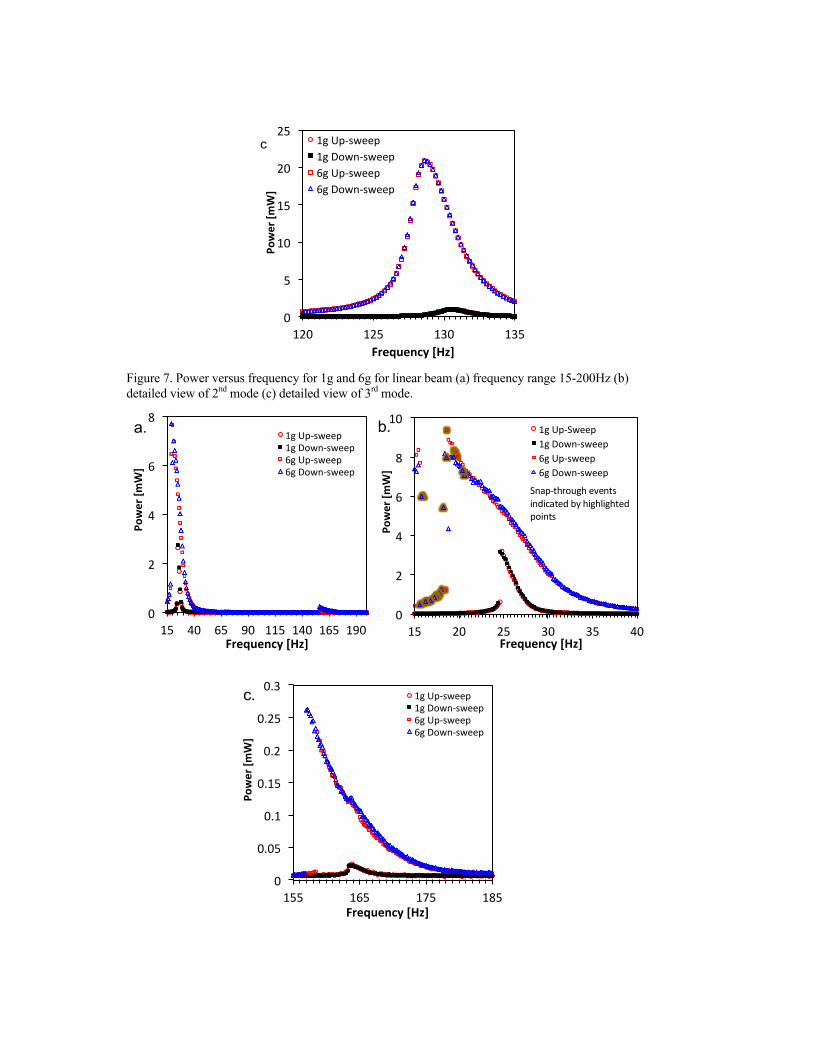
Figure 7. Power versus frequency for 1g and 6g for linear beam (a) frequency range 15-200Hz (b) detailed view of 2nd mode (c) detailed view of 3rd mode.
0
5
10
15
20
25
120 125 130 135
Power [m
W]
Frequency [Hz]
1g Up-‐sweep 1g Down-‐sweep 6g Up-‐sweep 6g Down-‐sweep
c
0
2
4
6
8
15 40 65 90 115 140 165 190
Power [m
W]
Frequency [Hz]
1g Up-‐sweep 1g Down-‐sweep 6g Up-‐sweep 6g Down-‐sweep
0
2
4
6
8
10
15 20 25 30 35 40
Power [m
W]
Frequency [Hz]
1g Up-‐Sweep 1g Down-‐sweep 6g Up-‐sweep 6g Down-‐sweep
0
0.05
0.1
0.15
0.2
0.25
0.3
155 165 175 185
Power [m
W]
Frequency [Hz]
1g Up-‐sweep 1g Down-‐sweep 6g Up-‐sweep 6g Down-‐sweep
Snap-‐through events indicated by highlighted points
a. b.
c.

Figure 8. Power versus frequency and 1g and 6g for bistable beam (a) frequency range 15-200Hz (b) detailed view of 1st mode (c) detailed view of 2nd mode.
We see that for the linear harverster, there is a small decrease in the the natural frequency, less than 2Hz, for the 2nd and 3rd bending modes when the excitation is increased from 1g to 6g (see figures 7b and 7c). The small decrease in natrual frequency with increasing excitiation is likely due to some softening (nonlinearities) inherent to the CFRP material [14, 15]. The stiffness of the piezoelectric (PZT ceramic) is also non-linear [16]. For the bistable energy harvester, there is a a difference in power output between the upward and downward frequency sweeps at higher g-level (see figures 8b,c). This is particularly apparent for the 1st bending mode at 6g in figure 8b, where the curve becomes asymmetric and leans towards lower frequencies (‘horning’) due to ‘softening’ at higher excitation levels and is a characteristic of non-linear systems [17].
Figure 9. Maximum power output at modes over a range of input acceleration for linear beam (a) second
mode (b) first mode. Maximum power output at modes over a range of input acceleration for bistable beam (c) first mode (d) second mode.
c
0
2
4
6
8
10
12
14
0 1 2 3 4 5 6
Peak Pow
er Outpu
t 2nd
Mod
e [m
W]
Peak AcceleraDon [factor of g]
Up-‐sweep
Down-‐sweep
0
5
10
15
20
25
0 1 2 3 4 5 6
Peak Pow
er Outpu
t 3rd M
ode [m
W]
Peak AcceleraDon [factor of g]
Up-‐sweep
Down-‐sweep
0
1
2
3
4
5
6
7
8
9
0 1 2 3 4 5 6
Peak Pow
er Outpu
t 1st M
ode [m
W]
Peak AcceleraDon [factor of g]
Up-‐sweep
Down-‐sweep
a
0
0.05
0.1
0.15
0.2
0.25
0.3
0 1 2 3 4 5 6
Peak Pow
er Outpu
t 2nd
Mod
e [m
W]
Peak AcceleraDon [factor of g]
Up-‐sweep
Down-‐sweep
b
c d
Snap through

Figure 9a, and 9b show the increase of peak power for the 2nd and 3rd modes of the linear respectively. The relationship between peak power and excitation level is approximately linear. A small degree of nonlinear behavior in the power versus excitation level is observed in the linear harvester; this may be due to the fact that CFRP and PZT exhibits a small degree of non-linear behavior [14, 15, 16]. Based on a linear relationship of peak power against the excitation level for the data in figure 9a and 9b, an R2 value of 0.979 and 0.993 is calculated for the second and third bending modes. However, a quadratic relationship leads to R2 values of 0.999 for both cases. Thus, the power increase over the range is slightly greater than expected by a linear approximation and any softening of the CFRP-MFC harvester leads to higher strain in the MFC, resulting in higher power output.
Figures 9c and 9d show the increase of peak power for the 1st and 2nd modes of the bistable harvester respectively at increasing excitation (g-level). The relationship between the excitation level, the degree of softening and the hysteretic behaviour of the harverster’s power output is more complex than the linear system. With reference to the first bending mode, at 1g the up-sweep and down-sweep values are almost coincident since at low excitation levels the bistable harvester exhibits almost linear behaviour. At increasing excitation level the structure exhibits nonlinear behaviour (‘softening’), as seen in figure 8b. In this case there is an area of instability underneath the ‘overhang’ in figure 8b where limited power data are recorded. The is due to the fact that on the up-sweep, the state of the system tends to stay on the lower fold until sufficient energy is achieved for the system to switch to the upper fold. During the down-sweep the system tends to stay on the higher of the two-folds and stays at a higher state of excitation for a greater duration until energy dissipation causes a jump down to the lower fold; this can be seen in figure 8c. The increase of the degree of softening at higher excitation levels explains why the peak power outputs diverge for both the up-sweep and down-sweep.
Greater softening leads to a greater degree of horning, and therefore the frequency
range of the unstable region is increased. Consequently, the system will remain on the lower fold for longer on the up-sweep and tends to stay on the upper fold for longer on the down-sweep, leading to a greater divergence. However, at high levels of excitation, especially when there are ‘snap-through’ events, see figure 8b for example, the position and tendency of the system to jump from one fold to another is highly sensitive which combine to bring the peak powers closer together; see for example data for 5g and above in figure 9a.
Investigation of Power Output and Load Resistance The measurements in the previous sections were undertaken for a fixed load
resistance corresponding to impedance matching of the capacitative impedance of the piezoelectric MFC to the load resistance. In this section the load resistance is varied to examine the change in optimal resistance with excitation level due to the shift of peak power frequency (e.g. as in figure 8b). For measurement of the harvested power both harvesters were connected to an electrical circuit with a load resistor as shown in Figure 4e.

Since ferroelectric ceramics are highly insulating the piezoelectric patch behaves approximately as a capacitor (CP) with a capacitance of 172nF. During vibration of the harvester the resulting deformation in alternating directions as a response to vibrational excitation causes charges of alternating polarity to accumulate on the electrodes with each reversal of the curvature of the beam. This accumulation of alternate charges translates to an AC voltage signal, dissipating the energy across the resistor (RL). This resistor represents the load of the electrical system which could be a sensor, or other such electrical component receiving the harvested energy. To maximise the power output, the value of the resistor is chosen to accommodate the harvester’s natural frequency, and the value of the capacitance within the circuit. The power output is at a maximum when:
𝑅! =!
!!.!.!! (2)
Thus, for the linear harvester a value of 21kΩ was chosen in the previous section to coincide with the 2nd bending mode at 43Hz, and for the bistable, and 36kΩ to coincide with the first bending mode at 26Hz. To demonstrate the influence of load resistance on harvested power, as changes in peak frequency due to softening, as in figure 8b and 8c, additional power characterisation as undertaken at a range of load resistance (1kΩ to 1000kΩ).
For power characterisation the harvesters were excited by a sinusoidal mechanical input where the peak acceleration was maintained at a specified value from 1g to 6g in increments of 1g. Higher g tests were avoided due to potential fatigue of the CFRP and MFC element. At each acceleration level, the experimental procedure was the same as mentioned previously for power measurement.
Figure 10. Bistable harvester peak power output over range of load impedance at (a) 1g peak acceleration and (b) 6g peak acceleration.
0
0.5
1
1.5
2
2.5
3
1000 10000 100000 1000000
Power Outpu
t [mW]
Resistance [Ohm]
0 1 2 3 4 5 6 7 8 9
1000 10000 100000 1000000
Power Outpu
t [mW]
Resistance [Ohm]
b a

Figure 10 shows the dependence of the peak power output of the bistable harvester with respect to the load resistance at 1g and 6g. Data for the linear harvester are not shown since it is the bistable system that exhibits the largest degree of softening.
The resistances were varied from 1kΩ, approaching short circuit conditions where the piezoelectric discharges rapidly, to 1MΩ, approaching open circuit conditions where the piezoelectric discharges slowly. It can be clearly observed that the power generation is highly dependent on load resistance. With increasing excitation, there is a softening of the bistable, causing the natural frequency to shift lower, in accordance to 𝜔! = √!
!, where k relates to the stiffness of
the mechanical system, m to its mass, and ωn to the natural frequency. Figure 10a shows that at 1g, the optimal resistance is 40kΩ. At 6g excitation input, figure 10b shows that the optimal resistance value has changed to 36kΩ. Thus, it is seen that ideally, the resistance of the harvesting system would be changed actively depending on the input’s characteristics.
COMPARISON OF BROAD-BAND RESPONSE
In practical applications the frequency of the excitation can change significantly
with respect to time, meaning that a meaningful comparison requires more than just a comparison of peak power outputs and that the broadness of the power generation capability must be quantified. To this end, two measures will be used. Firstly, will be the frequencies on either side of the maximum at which the power output level reduces to half the maximum value, an approach that has been used to determine the broad-band nature of harvesters; for example Lei et al. used a Full Width Half Maximum (FWHM) to define bandwidth [18, 19]. The second approach is similar to the previous method in that first the interval over which the magnitude drops to a tenth of the maximal value will be determined. This value will then form the bounds of an integral with which the area of the graph will be plotted with greater area implying that more power is being generated for wider frequencies. This value of one-tenth is used to attempt to capture within the bounds of the integral the entirety of the peak’s shape. Table II summarises these three measures for the different modes at excitation levels of 1g and 6g. The integral method could not be used on the 2nd bending mode of the bistable at 1g because the voltages generated could not be reliably measured at power levels one tenth of the maximal value.

Table II. Figures of merit for the modal orders and harvester types
Linear Bistable Mode 2 Mode 3 Mode 1 Mode 2 g-level
Peak power [mW] 0.842 0.989 3.20 0.024 1 1/2 Power bandwidth [Hz] 1 2.6 1.4 3.2
Power-freq integral 0.001 0.003 0.006 N/A Peak power [mW] 12.7 20.8 9.36 0.228 6
1/2 Power bandwidth [Hz] 2 3.6 7 5.4 Power-freq integral 0.034 0.092 0.068 0.001
Table II shows that at an excitation level of 1g, the bistable harvester in Mode 1 generates higher power, at greater bandwidth than the linear harvester. While the power of Mode 2 of the bistable is small, it is a relatively broad response; also shown in figure 8c. At a 6g excitation level, the peak power for the Mode 2 and Mode 3 of the linear harvester is highest and exceeds the power for the Mode 1 and Mode 2 of the bistable harvester, but only over a narrow frequency range (see ½ power bandwidth in Table II and figure 7a). At the high 6g-level, Mode 1 of the bistable produces the widest ½ Power bandwidth (see Table II and figure 8a) indicating the potential for such an approach for increase the broadband response.
CONCLUSIONS
This paper has examined both linear and bistable cantilever CFRP beams coupled to piezoelectric materials for energy harvesting applications. In comparing the energy harvesting performance of a linear harvester against that of a bistable nonlinear harvester, it has been seen that at low frequency and low excitation, the bistable has higher power output over a broader range of frequencies. The linear harvester has the potential to produce a higher peak power, but at a comparatively narrow bandwidth with respect to the bistable system. The similarity of the harvesters was imposed by matching the physical characteristics of dimension and piezoelectric patch placement as closely as possible, but further testing where the dynamic response are matched could prove useful. The load resistance should be matched with the capacitive load of the piezoelectric element to produce peak power levels. With increasing excitation levels softening of the bistable system leads to the peak power being produced at lower levels of frequency, necessitating some form of active tuning of the load resistance.
In this paper the change from a linear to a bistable harvester has been achieved by simply changing from a symmetric layup of [90/0/0/90]T to an unsymmetric layup [0/0/90/90]T to enable a comparison between the two cases. Tailoring of the laminate lay-up, cantilever geometry and materials employed (CFRP and piezoelectric) provides a variety of routes to tailor the non-linear characteristics to harvest specific vibration energies.

ACKNOWLEDGEMENT The research leading to these results has received funding from the European Research Council under the European Union's Seventh Framework Programme (FP/2007-2013) / ERC Grant Agreement no. 320963 on Novel Energy Materials, Engineering Science and Integrated Systems (NEMESIS). Dr. H. Alicia Kim acknowledges support from the Engineering and Physical Science Research Council (EPSRC) for Project Reference: EP/J014389/1 REFERENCES
1. Mitcheson, P. D., P. Miao, B. H. Stark, E. M. Yeatman, A. S. Holmes, and T. C. Green. 2004. “MEMS Electrostatic Micro-Power Generator for Low Frequency Operation,” Sensors and Actuators A: Physical. 2(115):523-529.
2. Glynne-Jones, P., M. J. Tudor, S. P. Beeby, and N. M. White. 2004. “An electromagnetic, vibration-powered generator for intelligent sensor systems,” Sensors and Actuators A. 110(1):344-349.
3. Arrieta A. F., P. Hagedorn, A. Erturk, and D. J. Inman. 2010. “A piezoelectric bistable plate for nonlinear broadband energy harvesting,” Appl. Phys. Lett., 97(10), 104102-1-3.
4. Priya, S. 2007. “Advances in energy harvesting using low profile piezoelectric transducers,” J. of Electroceramics, 19:167-184.
5. Erturk, A., and D. J. Inman. 2009. “An experimentally validated bimorph cantilever model for piezoelectric energy harvesting from base excitations,” Smart Mater. Struct., 18(2):1-18.
6. Erturk, A., J. Hoffmann, and D. J. Inman. 2009 “A piezomagnetoelastic structure for broadband vibration energy harvesting,” Appl. Phys. Lett., 25(94):254102-1-3.
7. Hyer, M. W. 1981. “Calculations of the Room-Temperature Shape of Unsymmetric Laminates,” J. Compos. Mater, 15(4):296-310.
8. Bowen, C. R., D. N. Betts, P. F. Giddings, A. I. T. Salo, and H. A. Kim. 2012. “A Study of Bistable Laminates of Generic Lay-‐Up for Adaptive Structures,” Strain. 3(48):235-240.
9. Dano, M. –L., and M. W. Hyer. 1998. “Thermally-induced deformation behavior of unsymmetric laminates,” Int. J. Solids Struct., 17(35):2101-2120.
10. Betts, D. N., H. A. Kim, C. R. Bowen, and D. J. Inman. 2012. “Optimal configurations of bistable piezo-composites for energy harvesting,” Appl. Phys. Lett.,11(100):114104-1-4.
11. Hexcel, 2010 “HexPly® M21 180°C (350°F) curing epoxy matrix Product Data” Accessed April 2014. www.hexcel.com
12. Smart Materials, Manufacturer’s website, Accessed May 2014. www.smart-material.com 13. Neri, I., F. Travasso, R. Mincigrucci, H. Vocca, F. Orfei, and L. Gammaitoni. 2012. “A real
vibration database for kinetic energy harvesting application,” J. of Intell. Material Sys., 23(18):2095-2101.
14. Hou, J. P., and C. Ruiz. 2000. “Measurement of the properties of woven CFRP T300/914 at different strain rates,” Composites. Sci. & Tech. 15(60):2829-2834.
15. Wolfe, H. F., and C. A. Shroyer. 1994. Large Amplitude Nonlinear Response of Flat Aluminum, and Carbon Fiber Beams. Wright Laboratory Flight Dynamics Directorate, pp. 3-4. Report no. WL-TM-94-3077.
16. Hall, A. D. 2001. “Nonlinearity in piezoelectric ceramics,” J. Mat. Sci.19(36):4575-4601. 17. Wagg, D., and S. Neild. 2010. Nonlinear Vibration with Control. Springer, 73-75, 162-163. 18. Betts, D. N., C. R. Bowen, H. A. Kim, R. A. Guyer, P-Y Le Bas., and D.J. Inman. 2014.
“Modelling the Dynamic Response of Bistable Composite Plates for Piezoelectric Energy Harvesting,” presented at the 55th American Institute of Aeronautics and Astronomics, Conference, 13-17 January, 2014.
19. Lei, A., R. Xu, A. Thyssen, A. C. Stoot, T. L. Christiansen, K. Hansen, R. Lou-Møller, E. V. Thomsen, and K. Birkelund. 2011. “MEMS-based thick film PZT vibrational energy harvester,”presented at 24th IEEE International Conference on Micro Electro Mechanical Systems, January 23-27, 2011.