manual for measuring e-government - tt · the manual for measuring e-government builds on the...
TRANSCRIPT

Manual for measuring e-Government
Printed by the ECA Documents Publishing and Distribution Unit. ISO 14001:2004 certified.

Manual for measuring e-government
Ordering information
To order copies of Manual for measuring e-government by the Economic Commission for Africa, please contact:
Publications:Economic Commission for AfricaP.O. Box 3001Addis Ababa, Ethiopia
Tel: +251 11 544-9900Fax: +251 11 551-4416E-mail: [email protected]: www.uneca.org
© United Nations Economic Commission for Africa, 2014Addis Ababa, Ethiopia
All rights reserved
Material in this publication may be freely quoted or reprinted. Acknowledgement is requested, together with a copy of the publication.
Edited, designed and printed by the ECA Documents Publishing and Distribution Unit (DPU).
iiiManual for measuring e-Government
Contents
Preface ................................................................................................................................vii
Acknowledgements.............................................................................................................viii
Acronyms and abbreviations .................................................................................................ix
Chapter 1. Introduction
Background ..................................................................................................................................1
The objectives of the Manual ........................................................................................................1
What is e-government? .................................................................................................................2
Why measure e-government? ........................................................................................................3
Challenges in e-government measurement ....................................................................................3
Partnership on measuring ICT for development ...........................................................................4
Partnership core information and communication technology indicators ......................................4
Scope and structure of the manual ................................................................................................5
Chapter 2. International and national stakeholders ............................................................. 6
The work of international organizations ........................................................................................6
Stakeholders in the national statistical system ...............................................................................8
Chapter 3. Planning and preparation ................................................................................ 10
Survey planning ..........................................................................................................................10
Budget and management issues ...................................................................................................12
Staff training and selection ..........................................................................................................12
Chapter 4. Statistical standards ......................................................................................... 14
E-government core indicators .....................................................................................................14
Other e-government indicators included in the partnership’s list of core ICT indicators .............27
Conceptual framework for measuring e-government ...................................................................27
Scope ..........................................................................................................................................28
Statistical units ............................................................................................................................31
Classifications .............................................................................................................................35
Weighting ...................................................................................................................................36
Time-related factors ....................................................................................................................37
Manual for measuring e-Governmentiv
Chapter 5. Data sources and collection methods ............................................................... 38
Current approaches to measuring e-government .........................................................................38
Data sources ...............................................................................................................................38
Methods of data collection ..........................................................................................................41
Chapter 6. Question and questionnaire design and content................................................ 44
General principles of question and questionnaire design ............................................................ 44
Model questions ........................................................................................................................ 46
Presentation of the model questions in a questionnaire .............................................................. 59
Reference dates .......................................................................................................................... 60
Who are the respondents? .......................................................................................................... 60
Supplementary data requirements .............................................................................................. 61
Concepts that may be difficult to understand ............................................................................. 61
Measurement topics apart from the core e-government indicators .............................................. 61
Chapter 7. Survey design ................................................................................................... 63
Statistical units ........................................................................................................................... 63
Scope and target population ...................................................................................................... 64
Survey frames ............................................................................................................................ 65
Sample design and selection ....................................................................................................... 66
Website surveys .......................................................................................................................... 73
Chapter 8. Data processing ............................................................................................... 74
Despatch and collection control ................................................................................................. 74
Data entry ................................................................................................................................. 74
Data editing ............................................................................................................................... 75
Estimation ................................................................................................................................. 80
Chapter 9. Data quality ..................................................................................................... 85
Accuracy of estimates ................................................................................................................. 85
Assessing data quality ................................................................................................................. 87
Particular data quality issues for the e-government core indicators ............................................. 88
vManual for measuring e-Government
Chapter 10. Dissemination ............................................................................................... 89
Forms of data dissemination ...................................................................................................... 89
National tabulation plans ........................................................................................................... 89
Metadata reporting and dissemination ....................................................................................... 96
Data collection and dissemination by international organizations .............................................. 97
Reporting core indicator data to international organizations ...................................................... 97
Chapter 11. Conclusion .................................................................................................... 99
Annex 1. Details of country-level e-government surveys .................................................. 100
Annex 2. Partnership on measuring ICT for development – core list of ICT indicators ... 114
Annex 3. Case study: e-government core indicator EG7, Australia................................... 116
References ........................................................................................................................ 123
Manual for measuring e-Governmentvi
List of boxes
Box 1: Task Group on e-Government ....................................................................................1
Box 2: Definitions of e-government.......................................................................................2
Box 3: The Partnership on Measuring ICT for Development ................................................4
Box 4: Institutional unit ......................................................................................................32
Box 5: General government institutional unit .....................................................................33
Box 6: Central government institutional unit ......................................................................33
Box 7: Central government statistical unit used by this manual ...........................................35
Box 8: Logical sequence of model questions ........................................................................60
viiManual for measuring e-Government
List of examples
Example 1: The information society – an e-government perspective .....................................27
Example 2: Central government organizations in Australia ..................................................66
Example 3: The structure of government in the United States of America ............................67
Example 4: Estimation of EG6 for a simple random sample and a stratified random sample 84
Example 5: Precision of an estimate for e-government core indicator (EG6) .........................86
Example 6: Core indicator EG7, Australia, supplementary indicator, by jurisdiction ..........116
Example 7: Core indicator EG7, Australia, main indicator, weighted by population ...........120
Example 8: Statistical standards statement for core indicator EG7, Australia ......................122
Manual for measuring e-Governmentviii
List of tables
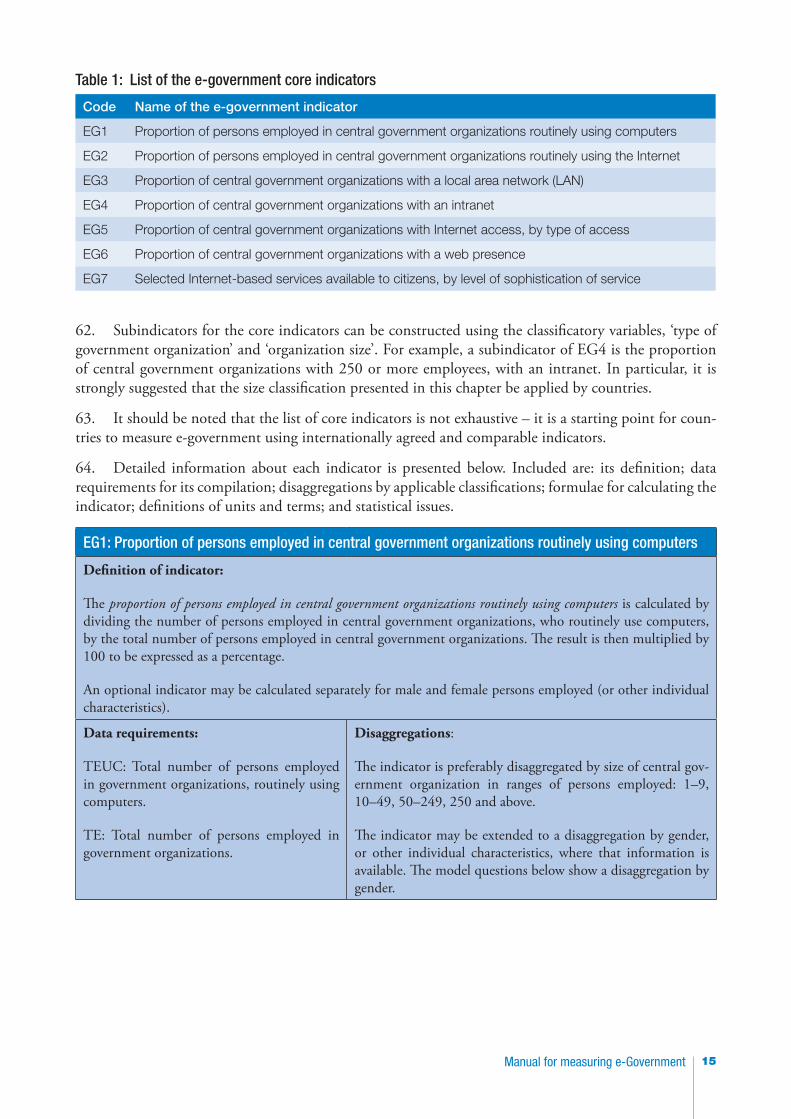
Table 1: List of the e-government core indicators .............................................................. 15
Table 2: Scope expansion possibilities for e-government core indicators ............................. 30
Table 3: Comparison of survey types .................................................................................. 40
Table 4: Comparison of data collection methods ................................................................ 42
Table 5: E-government topics apart from the core indicators .............................................. 62
Table 6: Survey design for surveys of business and government use of ICT ........................ 70
Table 7: Microedits for e-government indicators EG1 to EG6 ............................................ 77
Table 8: Macroedits for e-government indicators ................................................................ 79
Table 9: Example tabulation for core indicators EG1 and EG2 ........................................... 90
Table 10: Example tabulation for core indicators EG3, EG4 and EG6 ................................ 90
Table 11: Example tabulation for core indicator EG5 ......................................................... 90
Table 12: Example tabulation for core indicator EG7, for two jurisdictions ........................ 91
Table 13: Example tabulation for core indicator EG7, weighted by population .................. 93
Table 14: Example comparison for core indicator EG7, all governments, levels 1 and 3 ..... 95
Table 15: Statistical standards statement – indicator metadata ........................................... 96
Table 16: Statistical standards statement – survey metadata ............................................... 96
ixManual for measuring e-Government
Preface
Globally, comparative e-government indicators provide users with a valuable understanding of the status of e-government, both nationally and internationally.
The Manual for measuring e-government builds on the earlier publication – Framework for a set of e-govern-ment core indicators – published in 2012 by the Partnership on Measuring ICT for Development and the United Nations Economic Commission for Africa (ECA).
Both the Manual, and the Framework that preceded it, reflect the importance that was placed on e-gov-ernment by the World Summit on the Information Society, and reinforced by the suggestion from the United Nations Statistical Commission (UNSC) that the Partnership should extend its core list of infor-mation and communications technology (ICT) indicators to include indicators on ICT use in govern-ment (UNSC, 2007).
The main objective of the Manual is to support the efforts of countries to compile the core e-government indicators defined in the Framework. The Manual details data sources, data collection and processing methods, and dissemination schemas for the core indicators. A useful feature is an annex containing a number of examples of country e-government surveys.

Manual for measuring e-Governmentx
Acknowledgements
The Manual for measuring e-government was prepared by Sheridan Roberts of InfoSocietyStats.com, a consultant to the United Nations Economic Commission for Africa (ECA).
The project was initiated by the former ICT, Science and Technology Division (ISTD) of UNECA headed by Ms. Aida Opoku-Mensah as Director. Until the ECA restructuring of ECA in early 2013, under the general guidance of the Director, the project was coordinated by Mr. Makane Faye, Senior Regional Advi-sor and Officer-in-Charge of the e-Application and ICT Policy and Development Sections, with support from ISTD staff, including Matti Sinko, Abebe Chekol and Afework Temtime. Following the ECA re-structuring in 2013, the project was inherited by the New Technologies and Innovation Section (NTIS) of the Special Initiatives Division. Mr Kasirim Nwuke, Chief of NTIS led the finalization of the report under the general guidance of Ms Fatima Denton, Director of the Division.
Various references were consulted in the preparation of this manual, especially publications from the Part-nership on Measuring ICT for Development, the United Nations Department of Economic and Social Affairs (UNDESA), the United Nations Conference on Trade and Development (UNCTAD), the Inter-national Telecommunication Union (ITU), the Organisation for Economic Co-operation and Develop-ment (OECD), the International Monetary Fund (IMF), Eurostat, the US Office of Management and Budget (OMB), the Australian Bureau of Statistics and Statistics Canada.
Special acknowledgement is made to countries that provided information about their e-government sur-veys.
Thanks are also extended to members of the Task Group on e-Government (TGEG) for their input to the drafts of this manual. The Task Group is led by UNECA and comes under the auspices of the Part-nership on Measuring ICT for Development. Participants in the 2013 meeting of the ECA Committee on Development Information, Science and Technology (CODIST) reviewed an early draft and provided useful comments. Thanks are also extended to participants in CODIST and an ECA-organized training workshop in Algiers, Algeria, who provided very useful comments on the early draft. We also thank the Government of Algeria for co-organizing the Workshop with ECA.
xiManual for measuring e-Government
Acronyms and abbreviations
ECA United Nations Economic Commission for AfricaECLAC United Nations Economic Commission for Latin America and the CaribbeanESCAP United Nations Economic and Social Commission for Asia and the PacificESCWA United Nations Economic and Social Commission for Western AsiaEurostat Statistical Office of the European UnionICT Information and communication technologyISIC International Standard Industrial Classification of All Economic ActivitiesITU International Telecommunication UnionLAN Local area networkNPI Non-profit institutionNSO National statistical officeOECD Organisation for Economic Co-operation and DevelopmentOSILAC Observatory for the Information Society in Latin America and the CaribbeanPDA Personal digital assistantSNA System of National AccountsTGEG Task Group on e-GovernmentUIS UNESCO Institute for StatisticsUNCTAD United Nations Conference on Trade and DevelopmentUNDESA United Nations Department of Economic and Social AffairsUNESCO United Nations Educational, Scientific and Cultural OrganizationUNSC United Nations Statistical CommissionURL Uniform resource locatorWSIS World Summit on the Information Society

1Manual for measuring e-Government
Chapter 1. Introduction
Background1. Information and communication technology and its applications offer many opportunities for eco-nomic and human development. Within the framework of the World Summit on the Information Society (WSIS), national governments and other stakeholders are engaged in conceptualizing and deploying ICT applications in support of development.
2. The Geneva phase of WSIS established a set of targets for development of the information society, which included a target to: “Connect all local and central government departments and establish websites and e-mail addresses”. A 2011 publication by the Partnership (2011) suggested a set of e-government indicators to measure this target. Many of the standards developed for those indicators have been adapted for this manual.
3. The UNSC, at its 2007 meeting, asked the Partnership on Measuring ICT for Development to extend the core list of ICT indicators to include indicators on ICT use in government (UNSC, 2007). The Partnership, through its Task Group on e-Government (box 1), has been actively engaged in the development of internationally comparable e-government indicators since 2006. This has proved to be a challenging task because of a number of difficulties associated with e-government measurement; these are discussed in several publications (for example, Partnership, 2011; OECD, 2009) and throughout this manual.
4. More historical information on the development of e-government indicators can be found in Framework for a set of e-government core indicators (Partnership and ECA, 2012).
Box 1: Task Group on e-Government
A Task Group for the development of e-government indicators was established by the Partnership on Measur-ing ICT for Development in 2006. The members of the Task Group are ECA (coordinator), United Nations Economic Commission for Latin America and the Caribbean (ECLAC), United Nations Economic Commis-sion for Asia and the Pacific (ESCAP), United Nations Economic Commission for Western Asia (ESCWA), Eurostat, ITU, OECD, UNCTAD, UNDESA and the World Bank. TGEG has been responsible for devel-oping perspectives on e-government measurement in order to arrive at a conceptually clear, methodologi-cally feasible, and statistically sound set of e-government indicators, which also focus on essential features of e-government in the context of development.
A background description of the e-government activities of TGEG in the context of WSIS is available in the 2010 World Telecommunication/ICT Development Report (ITU, 2010).
The objectives of the Manual5. The Manual for measuring e-government follows and builds on the earlier publication, Framework for a set of e-government core indicators, which provides definitions and statistical standards for a set of globally comparative e-government indicators. The Manual expands on the Framework by providing guidance on data sources, data collection and processing methods, and dissemination schemas for the core indicators.
6. The primary objective of the Manual is to provide countries with the statistical knowledge neces-sary to compile the core e-government indicators in a way that ensures their international comparability.
Manual for measuring e-Government2
Annex 1 contains information about a number of country e-government surveys; this is expected to be helpful in providing ideas for countries considering the collection of e-government data.
What is e-government?7. E-government potentially enhances the social and economic development of countries by enabling improved access to government services. Examples range from better access to information on available services to complete online processing of requests for permits, certificates, payments, etc. Effective use of e-government can also improve the efficiency and effectiveness of the public sector and linkages between government agencies. Examples include the use of computers and networks to improve the personal productivity of government workers, and changes to more efficient business processes associated with a transition to electronic government services. In this context, an emerging imperative is to rethink e-gov-ernment policies and programmes to exploit these capacities.
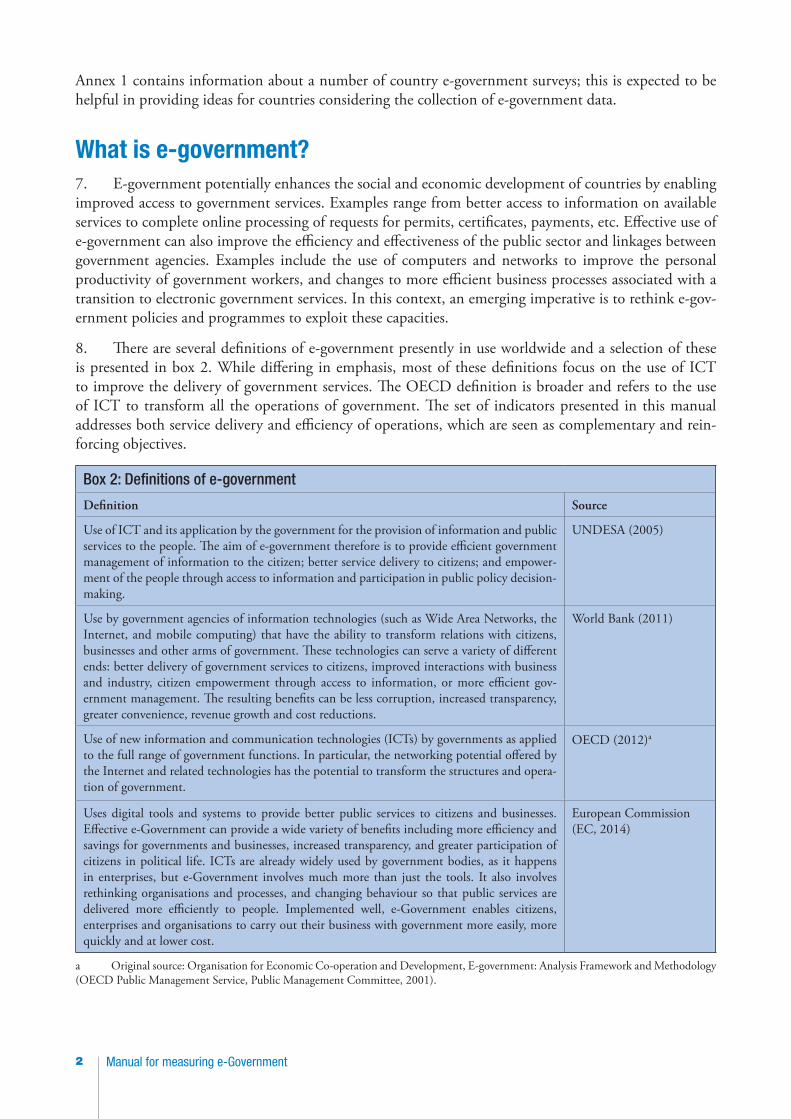
8. There are several definitions of e-government presently in use worldwide and a selection of these is presented in box 2. While differing in emphasis, most of these definitions focus on the use of ICT to improve the delivery of government services. The OECD definition is broader and refers to the use of ICT to transform all the operations of government. The set of indicators presented in this manual addresses both service delivery and efficiency of operations, which are seen as complementary and rein-forcing objectives.
Box 2: Definitions of e-government
Definition Source
Use of ICT and its application by the government for the provision of information and public services to the people. The aim of e-government therefore is to provide efficient government management of information to the citizen; better service delivery to citizens; and empower-ment of the people through access to information and participation in public policy decision-making.
UNDESA (2005)
Use by government agencies of information technologies (such as Wide Area Networks, the Internet, and mobile computing) that have the ability to transform relations with citizens, businesses and other arms of government. These technologies can serve a variety of different ends: better delivery of government services to citizens, improved interactions with business and industry, citizen empowerment through access to information, or more efficient gov-ernment management. The resulting benefits can be less corruption, increased transparency, greater convenience, revenue growth and cost reductions.
World Bank (2011)
Use of new information and communication technologies (ICTs) by governments as applied to the full range of government functions. In particular, the networking potential offered by the Internet and related technologies has the potential to transform the structures and opera-tion of government.
OECD (2012)a
Uses digital tools and systems to provide better public services to citizens and businesses. Effective e-Government can provide a wide variety of benefits including more efficiency and savings for governments and businesses, increased transparency, and greater participation of citizens in political life. ICTs are already widely used by government bodies, as it happens in enterprises, but e-Government involves much more than just the tools. It also involves rethinking organisations and processes, and changing behaviour so that public services are delivered more efficiently to people. Implemented well, e-Government enables citizens, enterprises and organisations to carry out their business with government more easily, more quickly and at lower cost.
European Commission (EC, 2014)
a Original source: Organisation for Economic Co-operation and Development, E-government: Analysis Framework and Methodology (OECD Public Management Service, Public Management Committee, 2001).

3Manual for measuring e-Government
Why measure e-government?9. There is a growing recognition worldwide that effective public sector governance requires the use of ICT to achieve more efficiency in the functioning of government and to improve the delivery of govern-ment services to organizations and individuals.
10. In order to monitor and compare the status of e-government, a set of feasible, relevant and interna-tionally comparable indicators is required. Such indicators are useful inputs to the formulation of policies and strategies for effective e-government.
11. E-government development is at varying stages in countries. Developed economies are relatively advanced in their use of ICT for improving the functioning of public sector and service delivery. Most developing countries are less advanced and in order to improve e-government in these countries, a com-parable measurement framework is important. While data from website surveys are available for most countries, through the efforts of UNDESA (2003, 2004, 2005, 2008b, 2010, 2012, 2014) and the Euro-pean Union (Capgemini, 2006, 2010), comparable e-government indicators from other surveys are very limited.
Challenges in e-government measurement12. Collection of e-government statistical information faces several measurement challenges, including statistical feasibility, relevance, data collection costs, and the burden on respondents.
13. In relation to statistical feasibility, there are particular methodological and conceptual challenges applying to e-government measurement at the international level and, to a lesser extent, the national level. The challenges are addressed throughout the Manual and are outlined as follows:
• Comparable statistical units. For indicators of the form ‘proportion of government organiza-tions with ICT’, it is clear that the ratio will only be comparable across countries if government organization units are fairly similar across countries. As an example, if country A lists 10 central government organizations in its e-government survey and country B lists 100, it is very likely that ratios for central government in country A will be higher because larger entities are more likely to have ICT than smaller ones.
• Structural differences in the functions of government organizations across countries. For instance, in one country, all rail transport might be a function of general government, and in another country it might be a responsibility of business (public or private sector). Government organizations in one country might outsource a client service function, such as employment agency work, to the private sector, while another country retains it as a government func-tion. Most countries have more than one level of government (for example, central, provincial, regional and/or local) and the functions of each level can differ across countries. To the extent that these various structural differences are linked to ICT uptake, country differences will occur.
• Identifying and defining government units at a country level. As surveys of government units are not very common, countries will differ in the quality and consistency of their lists of units (used as a basis for a survey). While there are internationally agreed definitions for govern-ment units, they are not always helpful for indicators of the type ‘proportion of government organizations with ICT’.
14. In relation to continuing relevance, the evolution of ICT has seen a series of revolutions (from mainframes to personal computers, from centralized databases to distributed computing, from star topol-ogies to networks, and from fixed to mobile access). Such rapid advances in technology present a chal-

Manual for measuring e-Government4
lenge for statisticians, who must balance continuing relevance of their output against a need to produce comparable data over time.
15. In order to simplify the data collection task, only central government organizations are included in scope for most of the indicators presented in this manual. It is hoped that countries will extend data col-lection to other levels of government as knowledge improves and resources permit.
Partnership on Measuring ICT for Development16. The TGEG comes under the auspices of the Partnership on Measuring ICT for Development. The set of e-government indicators defined in the Framework is the most recent in a list of core ICT indicators developed and promulgated by the Partnership, which is described in box 3.
Box 3: The Partnership on Measuring ICT for Development
Stemming from the mandate of the WSIS, the Partnership on Measuring ICT for Development is the collaborative initia-tive of a number of international organizations. Its members are: Eurostat; ITU; OECD; UNCTAD; UNDESA; United Nations Environment Programme/Secretariat of the Basel Convention (UNEP/SBC); UNESCO Institute for Statis-tics (UIS); World Bank; United Nations University Institute for Sustainability and Peace (UNU-ISP); and four United Nations Regional Commissions: ECA, ECLAC, ESCAP and ESCWA.
Launched in 2004, the key goal of the Partnership is to develop internationally comparable, relevant and reliable ICT statistics for measuring the information society. Development and maintenance of a core list of ICT indicators is one of its activities, and the development of e-government indicators is undertaken specifically in this context (ITU, 2010).
In 2005, the Partnership launched the first edition of Core ICT Indicators followed by the latest edition published in 2010 (Partnership 2005, 2010). Both publications focused on the feasibility and relevance of these ICT core indicators. The objective was to provide a reliable and accurate understanding of the indicators and the associated statistical standards.
A comprehensive report on the Partnership’s activities was presented to the UNSC at its 2012 meeting (see Partnership, 2012).
Partnership core information and communication technology indicators17. The complete list of core ICT indicators, including those on e-government, is presented in annex 2. The list was endorsed by the UNSC at its 2012 meeting (UNSC, 2012) and covers the following topics:
• ICT infrastructure and access• Access to, and use of, ICT by households and individuals (updated in 2013)• Use of ICT by businesses• The ICT (producing) sector• International trade in ICT goods• ICT in education• E-government.
5Manual for measuring e-Government
Scope and structure of the Manual18. The remainder of the Manual covers the following broad areas:
• Chapter 2. International and national stakeholders: describes the role of international organiza-tions and national stakeholders in the preparation of the e-government core indicators.
• Chapter 3. Planning and preparation: provides a general outline of the stages leading up to the commencement of the data collection phase. It covers survey planning, budget and manage-ment issues, and staff training and selection.
• Chapter 4. Statistical standards: presents the core e-government indicators, EG1 to EG7, and places them in a conceptual framework that includes the statistical standards that apply to the indicators. The standards include scope, statistical units, classifications, weighting and time-related factors, such as reference dates and frequency. The chapter describes some of the meas-urement challenges involved in this field of statistics and suggests solutions to those challenges. A set of supplementary e-government indicators already included in the Partnership list of core ICT indicators is also presented.
• Chapter 5. Data sources and collection methods: looks at potential data sources and data col-lection methods for the e-government core indicators. An overview of current approaches to e-government measurement is also included in the discussion.
• Chapter 6. Question and questionnaire design and content: takes a general look at the principles of question and questionnaire design and provides model questions for the core e-government indicators. The chapter also discusses presentation of the model questions in a questionnaire, reference dates, respondents, supplementary data requirements, concepts that may be difficult to understand, and measurement topics apart from the core e-government indicators.
• Chapter 7. Survey design: looks at survey design issues that are relevant to measuring e-gov-ernment, including statistical units, scope and target populations, survey frames, and sample design and selection. The main focus of the chapter is sample surveys and censuses of govern-ment organizations, with a brief outline of website surveys.
• Chapter 8. Data processing: discusses the range of operations that are applied to data collected via sample surveys or censuses of government organizations. The chapter outlines the stages in data processing (such as data entry, data editing and estimation) as applied to the e-government core indicators.
• Chapter 9. Data quality: examines the important subject of statistical data quality. It describes sampling and non-sampling error, assessment of data quality, and looks at particular data qual-ity issues for the core indicators.
• Chapter 10, Dissemination: presents example tabulation plans for the core indicators. It also discusses metadata reporting and dissemination, data collection and dissemination by interna-tional organizations, and reporting core indicator data to international organizations.
• Chapter 11. Conclusion: provides some final suggestions and hopes for the future of e-govern-ment measurement.
• Annex 1 provides details of existing e-government surveys from a number of countries.• Annex 2 presents all of the Partnership’s core ICT indicators, as at 2013.• Annex 3 provides tabulations of data and metadata for core indicator EG7, using Australia as
a case study. • References includes details of works referred to in the Manual and other useful sources.

Manual for measuring e-Government6
Chapter 2. International and national stakeholders
19. This chapter provides an overview of the role of international and national stakeholders in the preparation of the e-government core indicators. Information is drawn from several sources, including relevant material presented in other core ICT indicator manuals: Manual for the Production of Statistics on the Information Economy, Revised Edition (UNCTAD, 2009) and Manual for Measuring ICT Access and Use by Households and Individuals (ITU, 2009, 2014).
The work of international organizations20. This manual is produced under the auspices of the Partnership on Measuring ICT for Develop-ment, whose members are all international or regional organizations (see box 3 for details). Several Part-nership members are involved in the development, collection, compilation and dissemination of the core ICT indicators listed in annex 2.
21. Various members of the Partnership also have an important role in capacity-building for ICT statis-tics, in which this manual assists.
22. The Partnership’s report, presented at the 2012 UNSC meeting, provides additional information on its activities (Partnership, 2012).
Development of relevant statistical standards23. The standards for ICT statistics have a relatively short history, reflecting the recentness of the ICT phenomenon. The OECD, through its Working Party on Indicators for the Information Society (WPIIS), has been developing standards covering a number of aspects of information society measurement since the late 1990s, including development of concepts and model surveys (OECD, 2011a). Eurostat has also been very active in this field for the last decade or so, through its annual community surveys on ICT usage. The Eurostat and OECD model surveys on ICT use include questions on the use of e-government services (by individuals and businesses).
24. The Partnership on Measuring ICT for Development has an important role in several areas of inter-nationally comparable ICT measurement. As described in chapter 1, the Partnership develops and prom-ulgates a list of internationally comparable core ICT indicators, including the e-government indicators. All the core indicators have associated statistical standards; for the e-government core indicators, these have been published (in Partnership and ECA, 2012) and are expanded on in this manual. Standards for the other indicators were most recently published in Partnership (2010) and ITU (2014).
25. Many of the concepts and technical definitions in the core e-government indicators come from the Partnership’s other core ICT indicators1 – for example, the definition of a computer and routinely in EG1, and the definitions of type of Internet access in EG5.
26. In broader terms, the Manual relies on standards for government statistical units found in the System of National Accounts 2008 (European Commission and others, 2009) and the Government Finance Statistics Manual 2001 (IMF, 2001). Other internationally agreed standards for government surveys can be found in the Frascati Manual (OECD, 2002) for measurement of research and experimental develop-ment (R&D), which was also consulted during the preparation of this manual. Those existing standards for measuring characteristics of government focus on volume measures, such as expenditure, revenue and
1 Some of these, in turn, are derived from existing international standards.

7Manual for measuring e-Government
R&D staff. Compared with the standards in this manual, they are less reliant on the definition of govern-ment organizations as statistical units.
Collection and compilation of core information and communication technology indicator data27. Members of the Partnership collect, compile and distribute core ICT indicators (see annex 2) as follows:
• ITU collects the core indicators on ICT infrastructure and access (A1 to A10) and access to, and use of, ICT by households and individuals (HH1 to HH16). Results are made available through the World Telecommunication/ICT Indicators Database, printed and online publica-tions, and through the ITU ICT Statistics home page.2
• UNCTAD collects the core indicators on use of ICT by businesses (B1 to B12), indicators on the ICT (producing) sector (ICT1 and ICT2), and on international trade in ICT goods (ICT3 and ICT4). Results are made available through the Statistical Portal of UNCTAD (UNCTADSTAT).3
• UIS collects the core indicators on ICT in education (ED1 to ED8 and EDR1). Results are made available through the UIS online Data Centre4 as well as through publications based on the UIS regional data collection strategy.
• ECA, in collaboration with members of the Partnership and national statistical offices (NSOs), will collect the core indicators on e-government (EG1 to EG7). Results will be made available through a publication and the ECA website (www.uneca.org/publications/).
Capacity-building28. Capacity-building can be specific to a topic, such as ICT, or more general. In the latter category, several areas are described in UNCTAD (2009) for business surveys, including legal frameworks, business register development and business survey development. Similar programmes exist for household surveys, including the International Household Survey Network5 and the World Bank’s Living Standards Meas-urement Study (LSMS) Surveys6 (ITU, 2009).
29. Partnership members are engaged in capacity-building in their respective fields. Other manuals on ICT core indicators (UNCTAD, 2009; ITU, 2009, 2014) are integral to these activities. There is a close link between this manual and those manuals, in terms of links between the indicators, use of common standards and definitions, and the existing partnership between international organizations that have developed and collect the indicators. Like the other manuals, this one will be an important component of capacity-building in the field of ICT statistics.
30. As well as preparing manuals and standards, members of the Partnership provide technical assistance and training directly to individual countries. In its report to the UNSC of 2012, the Partnership noted that some regions and countries had not yet benefited from capacity-building and that there is an unmet demand for distance-learning activities and training of trainers at the regional level (Partnership, 2012). Following the completion of this manual, capacity-building workshops are planned (subject to available funding) with the aim of training statisticians and other stakeholders, and refining the Manual’s contents.
2 Available from http://www.itu.int/ITU-D/ict [accessed 31 January 2014].3 Available from http://unctadstat.unctad.org/ReportFolders/reportFolders.aspx [accessed 31 January 2014].4 Available from http://stats.uis.unesco.org/ [accessed 31 January 2014].5 Available from http://www.surveynetwork.org/home/ [accessed 31 January 2014].6 Available from http://www.worldbank.org/LSMS/ [accessed 31 January 2014].
Manual for measuring e-Government8
Stakeholders in the national statistical system31. There are three main stakeholder groups involved in the national statistical system. They are:
• Data producers, including NSOs7 (the main audience for this manual)• Policymakers, especially ministries and regulatory authorities dealing with ICT and telecom-
munications, and other data users (including international organizations)• Data providers (including government agencies for core e-government indicators EG1 to EG6
and national experts for indicator EG7 and possibly other indicators).32. It is very important that coordination mechanisms between (and sometimes within) these groups are established. The Partnership (2012) discussed coordination at the national level, observing that:
The coordination of data collection at the national level needs strengthening. Among the institu-tional challenges to producing ICT statistics and indicators, the most relevant is the establishment of coordination mechanisms between relevant institutions, including national statistical offices, telecommunication regulatory authorities and ministries responsible for ICT policies. Since survey-based ICT statistics is still a relatively new field in many developing countries, the initiative to produce ICT data often originates from a demand by policymakers. Traditionally, telecommunica-tion statistics have been collected by national telecommunication regulators or ministries, based on administrative sources and therefore, it is not always obvious to turn to national statistical offices for the collection of survey data on ICT access and use.
33. In some countries, there may be more than one data collection agency involved in the production of e-government statistics. Where this is the case, it is important that those agencies cooperate to share expertise and avoid duplication.
34. While it is fairly obvious that policymakers should work closely with data collection agencies to ensure the relevance of ICT statistics programmes, other users (for example, from business, the non-profit sector and academia) will also have a valid interest and may be able to make useful contributions based on their expert knowledge and experience. There are numerous benefits of user input, including:
• Production of more relevant data (especially for policy purposes)• Ongoing support for statistical activities (possibly including funding)• Availability of information from existing research and studies (for example, by academia or the
private sector)• Incorporation of the subject matter expertise of data users, which may improve concepts and
definitions.35. Data providers are integral to the statistical system. Without their cooperation, data would be inadequate in terms of either, or both, quality and quantity. It is important that NSOs recognize the contribution of providers and put the necessary effort into gaining their trust and cooperation. At the most obvious level, this entails making the respondents’8 jobs easier for them by providing coherent and understandable survey material, including well-tested questionnaires and instructions (this is further dis-cussed in chapter 6).
36. To the extent possible, small respondents should be periodically relieved of their reporting obliga-tion, by use of rotating and non-overlapping samples.9 As a general rule, it is important to minimize the
7 The term NSO as used in this manual is taken to include all government agencies that collect official statistics. Where a national statistical system is decentralized, there may be several official statistical agencies in a country. NSOs are usually government-funded and are responsible for providing high quality, standardized statistical data to government, industry and the public. They may also be responsible for coordinating the national statistical system.8 For the purposes of this manual, respondents are the organizational representatives completing survey material. 9 This is not always possible, for example, if the core indicator data are collected by a census of government organizations.
9Manual for measuring e-Government
burden on respondents providing data for statistical surveys. The potential benefits to NSOs of doing this include higher response rates and better data quality. This issue is addressed in chapter 9.
37. While many NSOs work in a legal framework that makes provision of statistical data mandatory,10 cooperation may be enhanced if such legislation is used carefully. The legal framework of NSOs will also generally ensure the confidentiality of data provided by individual organizations. It is very important that protection of such statistical data is assured and is communicated to respondents. At a more advanced level, public relations efforts may be needed to ensure cooperation.
10 The legal basis of a large number of NSOs is available from http://unstats.un.org/unsd/dnss/kf/LegislationCountryPractices.aspx [accessed 31 January 2014].

Manual for measuring e-Government10
Chapter 3. Planning and preparation
38. This chapter presents a general outline of planning and preparation for statistical surveys. The major references used in the preparation of this chapter are: Manual for Measuring ICT Access and Use by Households and Individuals (ITU, 2009, 2014); Survey Methods and Practices (Statistics Canada, 2010); Handbook (Australian Bureau of Statistics (ABS), 2012a); and Standards and Guidelines for Statistical Sur-veys (Office of Management and Budget (United States), 2006).
39. While most of the principles presented in this chapter also apply to planning and preparation for collections of administrative data or website surveys, the focus is on the conduct of statistical surveys as they will generally be the most complex and expensive option for data collection.
40. It is assumed that surveys of government units will generally be conducted by NSOs. Where this is not the case, it is suggested that the data collection agency work with the NSO in order to optimize inputs and maximize the quality of output.
Survey planning41. Careful planning and preparation is an obvious prerequisite to survey success and optimal use of resources. As discussed in chapter 2, good consultation with policymakers and other stakeholders will help ensure that the final product is of optimum relevance to their needs. It will also help to build support for the project, which may ultimately assist with fund-raising or publicity.
42. A statistical survey is generally a complex and costly undertaking. Good planning will almost cer-tainly lead to a better result – in terms of data quality, cost and timeliness. Planning will tend to be progressive, with early planning being broad in scope and becoming more detailed over time. Areas to consider in planning a survey are:
• Establish a management and planning structure for the survey project. An example is using an interdisciplinary survey team. Team members may include external representatives from consul-tative bodies or equivalent (see Mechanisms for cooperating..., below).
• Formulate the objectives of the survey. It is important to always have the objectives of the survey in mind and to review them as necessary. They will include how the results will be used and what types of public policy or other decisions rely on the results. It is assumed that the objectives of the survey will be formulated with the input of policymakers and other major users, and will be centred on the most important and measurable needs of policymakers. The objectives will usually determine various aspects of the survey, such as concepts, topics, scope and level of accuracy. Objectives need to be clear – and clearly understood – by the statisticians and data users involved in the survey. They may also be communicated to respondents in some form in order to gain their cooperation – for example, on a questionnaire or in publicity mate-rial. Information on how to formulate a statement of objectives can be found in Statistics Canada (2010).11
• Mechanisms for cooperating with policymakers and other data users. As discussed in chapter 2, close cooperation with policymakers and other data users is strongly recommended in order to improve the relevance of the survey results and to optimize survey questions. Consultative bodies (such as a working group on ICT statistics) may already exist in the area of ICT statistics. If they do not, then they should be considered at the planning stage. Meetings should be held as required and are likely to be more frequent during the establishment of the project.
11 This publication has a complete chapter on survey planning and management, including a planning checklist.
11Manual for measuring e-Government
• Relevance of existing data sources, including those held by the agency undertaking the survey. A review of available data and its usefulness should be undertaken before a new survey is con-templated. For example, some of the information required for the core e-government indicators may be available from the statistical office, administrative sources or national experts. This is further explored in chapter 5.
• Adherence to the statistical standards in this manual as detailed in chapter 4. While this may require some compromise on the part of policymakers, it is of ultimate benefit for several rea-sons, the main one being the possibility for international benchmarking. Establishing defini-tions and lists of statistical units may be an activity undertaken in cooperation with external experts.
• Available budget and other resources. The budget available to conduct a survey may be a con-straining factor that needs to be considered at the planning stage. The possibility of obtaining additional funding from users interested in particular topics should be ascertained early in the process as it might affect the development of the survey. For example, particular states might be prepared to provide funding to extend the survey scope to state government.
• Time frame and timetable. The release of data should generally occur as quickly as possible after the reference date (without compromising data quality), particularly given rapid developments in the area of ICT. Statistical resources, such as staff, may only be available for a limited time and will have costs associated with the time they are employed on the survey. For these reasons, it is very important that the planning stage includes a detailed and realistic timetable of activi-ties involved in the survey cycle.
• Legal and related issues. There could be a range of legal and related issues that need to be con-sidered. These include: legal obligations of the data collection agency (which may include confi-dentiality constraints on data release – for example, a prohibition on release of data identifying individual organizations); responding organizations’ legal obligations (for example, to complete and return a questionnaire); and practices that may not be prescribed in law but are policy of the data collection agency (for example, minimization of respondent burden).
• Survey vehicle. An early decision needs to be taken on the survey vehicle to be used as the choice will affect cost. It is likely that, in most cases, a new stand-alone survey of government units will be the only option for collection of most of the core indicators. This is because surveys of government units are less common than household or business surveys and so the possibility for using existing surveys as a vehicle is less likely. Even where surveys of government already exist, it is quite likely that they will not have the appropriate scope or statistical units. This issue is further explored in chapter 5.
• Survey development. Planning for survey development entails making decisions on all aspects of the survey, including statistical standards, data sources, collection methods, questionnaire design and testing, survey design, data processing systems and output data specifications. Of particular importance at this stage are questionnaire design and testing, and survey design. Results of questionnaire testing may provide information useful for planning and budgeting, for example, a low response rate in a pilot test will provide an indication of the effort required to follow up non-response. These issues are further explored in chapters 4 to 8 and chapter 10. The survey design will determine aspects of reliability such as the level of sampling error. If users require detailed breakdowns by particular characteristics, then this needs to be established at the planning stage as it may have implications for sample size and design (and therefore cost).
• Survey implementation. Planning for conduct of the survey should include plans to develop and test computer and manual systems for all stages of the survey cycle, and consideration of the skills and training required. As this stage is expensive and possibly time-consuming, careful planning and timetabling is likely to be a good investment. The survey implementation stage is further explored in chapters 5 and 8.

Manual for measuring e-Government12
• Post survey processes. These include data tabulation, analysis and dissemination, metadata dis-semination, preservation of survey material, and evaluation. They are very important elements of the survey process, especially as they are the most visible to users. Post survey processes are further explored in chapters 9 and 10.
• Follow-up data collection. As it is common for the release of statistics to trigger further demand for data, planners need to contemplate whether, and when, they are prepared to undertake follow-up data collection. Given the rapid change in the state of ICT, there is likely to be a demand for regular surveys, though the nature of that demand will vary depending on the policy imperatives of individual countries.
43. A likely outcome of the planning phase is that priorities will be reassessed and changes made to aspects of the survey, such as its purpose and objectives, and subsequent stages such as survey design.
Budget and management issues44. It is rarely possible to achieve good results without significant cost, but it is certainly possible to incur significant project costs and yet obtain poor quality results. Having an experienced and knowledge-able project manager, and paying careful attention to planning for every phase before commencing the operational phase, will generally be very cost effective.
45. Costs include wages and salaries, ICT costs and administrative costs. Depending on the costing policy of the organization carrying out the survey, overhead costs (fixed and/or variable) may need to be added on.
46. At the outset, it is necessary to itemize and estimate costs associated with the survey. Budgeting needs to be carried out carefully in order to avoid the most common difficulties, which include:
• Underestimating known costs (for instance, failing to take salary increases into account, the cost of time overruns)
• Omitting unknown costs (for example, costs associated with constructing a survey frame, legal costs)
• Ignoring or underestimating overhead costs (these can be significant and will include direct and indirect overhead costs).
47. Given the likelihood of delays, it is useful to include some extra budget (and other resources, such as staff time) for unforeseen events or delays. Mechanisms to reduce costs should be considered and include using technology to reduce costs, for instance, use of call centres and computer assisted telephone interviewing (CATI) for data collection. In this case, careful consideration of other factors is necessary, for instance, the costs of computer system development and maintenance.
48. In some cases, resources such as skilled staff may be difficult to obtain, even if the budget is suf-ficient. This should be factored in at the planning stage.
49. Often trade-offs are required to fit the survey to the available financial and other resources. Trade-offs could include a reduction in sample size (usually resulting in larger sampling error), removal of some level of detail, or removal of some questions or topics. Ideally, such decisions would be made together with policymakers and other major data users to ensure that their data needs are still adequately addressed.
Staff training and selection50. Staff with diverse skills will be required for different aspects of the survey. Skills relevant to the fol-lowing areas will be required: survey management, survey design, computer systems development, data

13Manual for measuring e-Government
entry, data editing, data imputation and estimation, data analysis, and publication writing. Depending on the data collection technique employed, interviewers may also be required. In many statistical agencies, some of these skills will be centralized, for example, computer programmers and data entry staff may work in distinct departments within the organization.
51. Staff selection and training will run parallel with survey planning, questionnaire design and sample selection. It will often be a phased activity, for instance, staff involved in establishing the survey are likely to be employed first. While specialized staff may be available in an organization, they will usually need to be trained on the specifics of the survey.
52. While many staff involved in a particular survey will already be skilled and will require minimal training, others may need significant training. Of particular importance is the training of interviewers, if they are to be used. An important cause of bias is the poor handling of respondents by interviewers, for instance, asking leading questions or suggesting some judgement of responses (by their tone of voice or facial expression). A focus of training, briefings and survey material, should be the avoidance of bias. Ele-ments of training may include classroom training, interviewer manuals, and field work in the presence of experienced interviewers or supervisory staff.
53. Given that some questions on ICT access and use are somewhat technical, it could be advantageous to employ people who are more attuned to ICT, for instance, young adults and people with proven ICT skills. Clearly, it is also important to provide training in the ICT concepts and terms used in question-naires.
54. The ability to manage and motivate staff is a very valuable skill. Motivated staff members are likely to be more productive, to contribute to the survey knowledge base, and to remain longer with the project. Some actions that may improve motivation include:12
• Provide staff with a sense of ownership of the project, for instance, staff may have valuable ideas for the operational phases of the survey and will be more committed to a quality result if they have had some involvement in documentation and the setting of procedures.
• Communicate with staff about all aspects of the operation that are relevant to them; mecha-nisms for communication are likely to be facilitated by ICT – for example, setting up electronic notice boards (though, by themselves, these are likely to be insufficient).
• Acknowledge good work, even if only in very simple ways, such as timely praise.• Delegate authority to staff as appropriate.
55. The performance of all staff should be monitored closely, especially in the early stages of the survey. Any instances of underperformance, or behaviours that might introduce statistical bias, need to be addressed promptly.
56. A most important prerequisite for training is the availability of training or procedure manuals for each broad class of staff – for example, interviewers (if used), data entry staff and data editors. Such manu-als should be prepared before the survey commences and may continue to be useful references during the survey. Training manuals should clearly explain the purpose of the survey and be explicit about the tasks to be performed by staff.
12 Adapted from PARIS 21 Document Series # 4, National Strategies for the Development of Statistics (NSDS): Some Issues in Design and Implementation Planning. Available from http://www.paris21.org/sites/default/files/p21implementguide-en.pdf [accessed 1 February 2014].
Manual for measuring e-Government14
Chapter 4. Statistical standards
57. This chapter presents the core e-government indicators, EG1 to EG7, and places them in a meas-urement framework that includes the statistical standards associated with the indicators. It describes some of the measurement challenges involved in this field of statistics and suggests solutions to those challenges.
58. The chapter also presents a set of four supplementary demand-side e-government indicators that are part of the Partnership’s list of core ICT indicators (Partnership, 2010; ITU, 2014). The indicators are measures of use of government services by individuals and businesses.
E-government core indicators59. E-government indicators and associated statistical standards should have a number of characteris-tics, including:
• Statistical feasibility• Designed to enable international comparability• Substantively relevant• Consistent, thereby enabling reliable evidence of change over time• Understandable and accessible to policymakers and other data users.
60. Perhaps the most challenging of these characteristics are international comparability and relevance. The first is a question of standards and methodology and is directly addressed in this manual. The second relates to the alignment of long-term development objectives of e-government measurement with techno-logical change and societal needs. A trade-off between relevance and consistency may need to be made by data collection agencies and their main users.
61. The e-government core indicators are listed in table 1. For the purposes of this manual, they are classified into four broad areas:
• Use of ICT by persons employed in government organizations. Indicators EG1 and EG2 are presented as the proportion of persons employed in government organizations using technol-ogy.
• Availability of ICT to government organizations. Indicators EG3 to EG5 are presented as the proportion of central government organizations with (or using) technology. Employment-weighted versions of EG3 to EG5 are also defined and recommended.
• Use of ICT by government organizations. Indicator EG6 is presented as the proportion of cen-tral government organizations with a web presence. An employment-weighted version of EG6 is also defined and recommended.
• Supply of e-government services to citizens (via publicly accessible websites). Indicator EG7 deals with selected Internet-based services offered by central and state government organiza-tions.
15Manual for measuring e-Government
Table 1: List of the e-government core indicators
Code Name of the e-government indicator
EG1 Proportion of persons employed in central government organizations routinely using computers
EG2 Proportion of persons employed in central government organizations routinely using the Internet
EG3 Proportion of central government organizations with a local area network (LAN)
EG4 Proportion of central government organizations with an intranet
EG5 Proportion of central government organizations with Internet access, by type of access
EG6 Proportion of central government organizations with a web presence
EG7 Selected Internet-based services available to citizens, by level of sophistication of service
62. Subindicators for the core indicators can be constructed using the classificatory variables, ‘type of government organization’ and ‘organization size’. For example, a subindicator of EG4 is the proportion of central government organizations with 250 or more employees, with an intranet. In particular, it is strongly suggested that the size classification presented in this chapter be applied by countries.
63. It should be noted that the list of core indicators is not exhaustive – it is a starting point for coun-tries to measure e-government using internationally agreed and comparable indicators.
64. Detailed information about each indicator is presented below. Included are: its definition; data requirements for its compilation; disaggregations by applicable classifications; formulae for calculating the indicator; definitions of units and terms; and statistical issues.
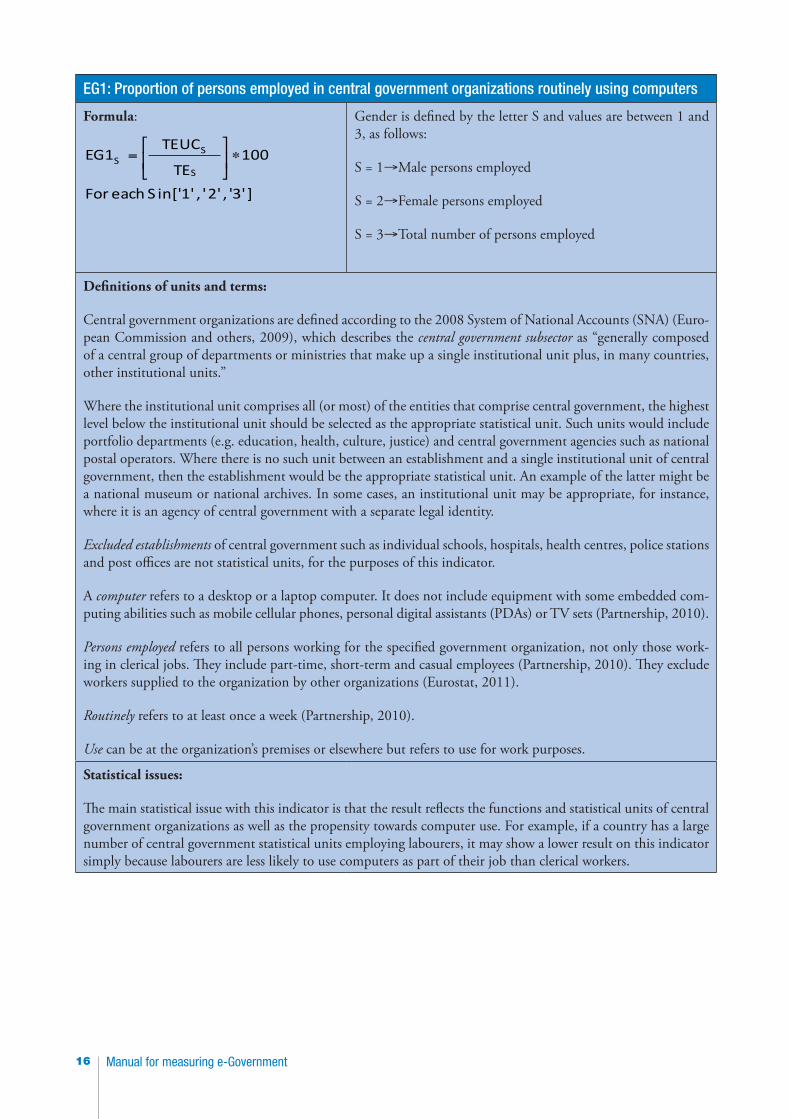
EG1: Proportion of persons employed in central government organizations routinely using computers
Definition of indicator:
The proportion of persons employed in central government organizations routinely using computers is calculated by dividing the number of persons employed in central government organizations, who routinely use computers, by the total number of persons employed in central government organizations. The result is then multiplied by 100 to be expressed as a percentage.
An optional indicator may be calculated separately for male and female persons employed (or other individual characteristics).
Data requirements:
TEUC: Total number of persons employed in government organizations, routinely using computers.
TE: Total number of persons employed in government organizations.
Disaggregations:
The indicator is preferably disaggregated by size of central gov-ernment organization in ranges of persons employed: 1–9, 10–49, 50–249, 250 and above.
The indicator may be extended to a disaggregation by gender, or other individual characteristics, where that information is available. The model questions below show a disaggregation by gender.
Manual for measuring e-Government16
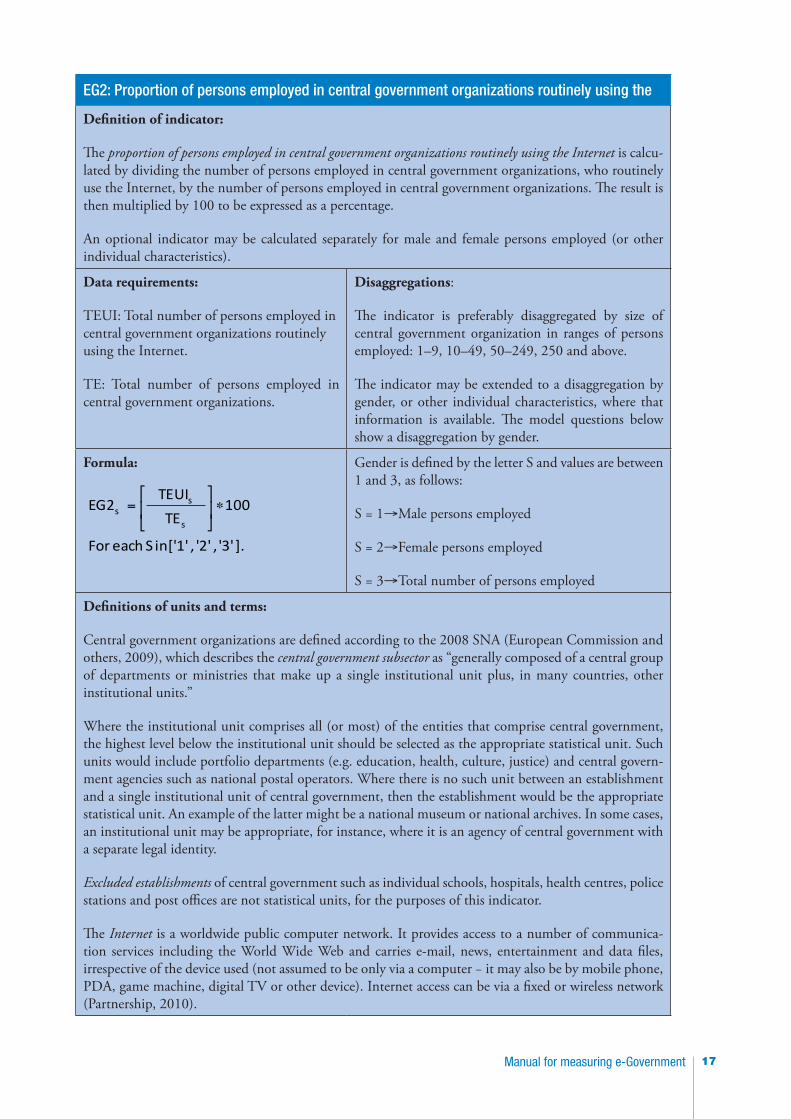
EG1: Proportion of persons employed in central government organizations routinely using computers
Formula:
]'3' ,2' ' ,['1' in S each For
100 TE
TEUC EG1
S
SS ∗= ⎥
⎦
⎤⎢⎣
⎡
Gender is defined by the letter S and values are between 1 and 3, as follows:
S = 1→Male persons employed
S = 2→Female persons employed
S = 3→Total number of persons employed
Definitions of units and terms:
Central government organizations are defined according to the 2008 System of National Accounts (SNA) (Euro-pean Commission and others, 2009), which describes the central government subsector as “generally composed of a central group of departments or ministries that make up a single institutional unit plus, in many countries, other institutional units.”
Where the institutional unit comprises all (or most) of the entities that comprise central government, the highest level below the institutional unit should be selected as the appropriate statistical unit. Such units would include portfolio departments (e.g. education, health, culture, justice) and central government agencies such as national postal operators. Where there is no such unit between an establishment and a single institutional unit of central government, then the establishment would be the appropriate statistical unit. An example of the latter might be a national museum or national archives. In some cases, an institutional unit may be appropriate, for instance, where it is an agency of central government with a separate legal identity.
Excluded establishments of central government such as individual schools, hospitals, health centres, police stations and post offices are not statistical units, for the purposes of this indicator.
A computer refers to a desktop or a laptop computer. It does not include equipment with some embedded com-puting abilities such as mobile cellular phones, personal digital assistants (PDAs) or TV sets (Partnership, 2010).
Persons employed refers to all persons working for the specified government organization, not only those work-ing in clerical jobs. They include part-time, short-term and casual employees (Partnership, 2010). They exclude workers supplied to the organization by other organizations (Eurostat, 2011).
Routinely refers to at least once a week (Partnership, 2010).
Use can be at the organization’s premises or elsewhere but refers to use for work purposes.
Statistical issues:
The main statistical issue with this indicator is that the result reflects the functions and statistical units of central government organizations as well as the propensity towards computer use. For example, if a country has a large number of central government statistical units employing labourers, it may show a lower result on this indicator simply because labourers are less likely to use computers as part of their job than clerical workers.
17Manual for measuring e-Government
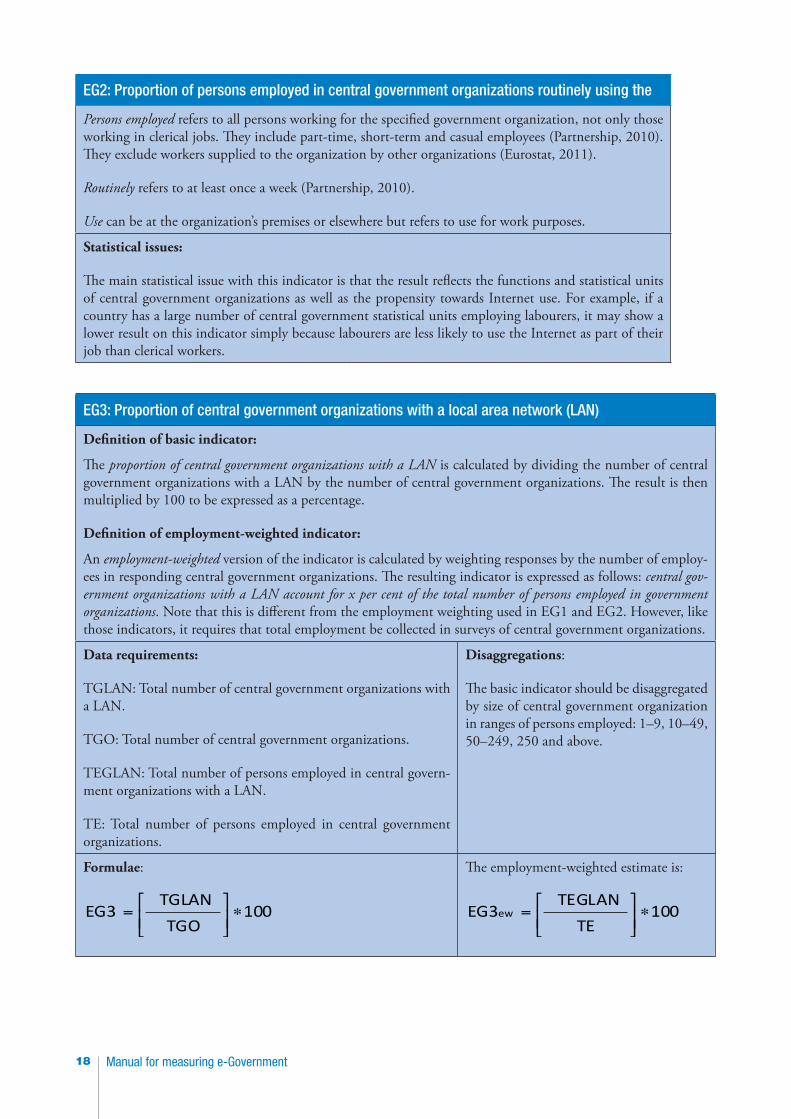
EG2: Proportion of persons employed in central government organizations routinely using the
Definition of indicator:
The proportion of persons employed in central government organizations routinely using the Internet is calcu-lated by dividing the number of persons employed in central government organizations, who routinely use the Internet, by the number of persons employed in central government organizations. The result is then multiplied by 100 to be expressed as a percentage.
An optional indicator may be calculated separately for male and female persons employed (or other individual characteristics).
Data requirements:
TEUI: Total number of persons employed in central government organizations routinely using the Internet.
TE: Total number of persons employed in central government organizations.
Disaggregations:
The indicator is preferably disaggregated by size of central government organization in ranges of persons employed: 1–9, 10–49, 50–249, 250 and above.
The indicator may be extended to a disaggregation by gender, or other individual characteristics, where that information is available. The model questions below show a disaggregation by gender.
Formula:
].'3','2' ,['1' in S each For
100 TE
TEUI EG2
s
ss ∗= ⎥
⎦
⎤⎢⎣
⎡
Gender is defined by the letter S and values are between 1 and 3, as follows:
S = 1→Male persons employed
S = 2→Female persons employed
S = 3→Total number of persons employed
Definitions of units and terms:
Central government organizations are defined according to the 2008 SNA (European Commission and others, 2009), which describes the central government subsector as “generally composed of a central group of departments or ministries that make up a single institutional unit plus, in many countries, other institutional units.”
Where the institutional unit comprises all (or most) of the entities that comprise central government, the highest level below the institutional unit should be selected as the appropriate statistical unit. Such units would include portfolio departments (e.g. education, health, culture, justice) and central govern-ment agencies such as national postal operators. Where there is no such unit between an establishment and a single institutional unit of central government, then the establishment would be the appropriate statistical unit. An example of the latter might be a national museum or national archives. In some cases, an institutional unit may be appropriate, for instance, where it is an agency of central government with a separate legal identity.
Excluded establishments of central government such as individual schools, hospitals, health centres, police stations and post offices are not statistical units, for the purposes of this indicator.
The Internet is a worldwide public computer network. It provides access to a number of communica-tion services including the World Wide Web and carries e-mail, news, entertainment and data files, irrespective of the device used (not assumed to be only via a computer − it may also be by mobile phone, PDA, game machine, digital TV or other device). Internet access can be via a fixed or wireless network (Partnership, 2010).
Manual for measuring e-Government18
EG2: Proportion of persons employed in central government organizations routinely using the
Persons employed refers to all persons working for the specified government organization, not only those working in clerical jobs. They include part-time, short-term and casual employees (Partnership, 2010). They exclude workers supplied to the organization by other organizations (Eurostat, 2011).
Routinely refers to at least once a week (Partnership, 2010).
Use can be at the organization’s premises or elsewhere but refers to use for work purposes.
Statistical issues:
The main statistical issue with this indicator is that the result reflects the functions and statistical units of central government organizations as well as the propensity towards Internet use. For example, if a country has a large number of central government statistical units employing labourers, it may show a lower result on this indicator simply because labourers are less likely to use the Internet as part of their job than clerical workers.
EG3: Proportion of central government organizations with a local area network (LAN)
Definition of basic indicator:
The proportion of central government organizations with a LAN is calculated by dividing the number of central government organizations with a LAN by the number of central government organizations. The result is then multiplied by 100 to be expressed as a percentage.
Definition of employment-weighted indicator:
An employment-weighted version of the indicator is calculated by weighting responses by the number of employ-ees in responding central government organizations. The resulting indicator is expressed as follows: central gov-ernment organizations with a LAN account for x per cent of the total number of persons employed in government organizations. Note that this is different from the employment weighting used in EG1 and EG2. However, like those indicators, it requires that total employment be collected in surveys of central government organizations.
Data requirements:
TGLAN: Total number of central government organizations with a LAN.
TGO: Total number of central government organizations.
TEGLAN: Total number of persons employed in central govern-ment organizations with a LAN.
TE: Total number of persons employed in central government organizations.
Disaggregations:
The basic indicator should be disaggregated by size of central government organization in ranges of persons employed: 1–9, 10–49, 50–249, 250 and above.
Formulae:
100 TGO
TGLAN EG3 ∗= ⎥⎦
⎤⎢⎣
⎡
The employment-weighted estimate is:
100 TE
TEGLAN EG3ew ∗= ⎥⎦
⎤⎢⎣
⎡
19Manual for measuring e-Government
EG3: Proportion of central government organizations with a local area network (LAN)
Definitions of units and terms:
Central government organizations are defined according to the 2008 SNA (European Commission and others, 2009), which describes the central government subsector as “generally composed of a central group of departments or ministries that make up a single institutional unit plus, in many countries, other institutional units.”
Where the institutional unit comprises all (or most) of the entities that comprise central government, the highest level below the institutional unit should be selected as the appropriate statistical unit. Such units would include portfolio departments (e.g. education, health, culture, justice) and central government agencies such as national postal operators. Where there is no such unit between an establishment and a single institutional unit of central government, then the establishment would be the appropriate statistical unit. An example of the latter might be a national museum or national archives. In some cases, an institutional unit may be appropriate, for instance, where it is an agency of central government with a separate legal identity.
Excluded establishments of central government such as individual schools, hospitals, health centres, police sta-tions and post offices are not statistical units, for the purposes of this indicator.
Where the ICT characteristics of subunits vary (e.g. between a head office and regional offices), either all units should be surveyed (apart from excluded establishments), or the response should reflect the situation applying to the majority of persons employed.
A LAN refers to a network connecting computers within a localized area such as a single building, department or site; it may be wireless (Partnership, 2010).
Statistical issues:
A major statistical issue with this indicator is the units comparability issue discussed in this chapter. The impact of this issue can be reduced by adherence to the standards described in this manual, including tabulation of output by size of organization and employment weighting.
EG4: Proportion of central government organizations with an intranet
Definition of basic indicator:
The proportion of central government organizations with an intranet is calculated by dividing the number of central government organizations with an intranet by the number of central government organizations. The result is then multiplied by 100 to be expressed as a percentage.
Definition of employment-weighted indicator:
An employment-weighted version of the indicator is calculated by weighting responses by the number of persons employed in responding central government organizations. The resulting indicator is expressed as follows: central government organizations with an intranet account for x per cent of the total number of persons employed in central government organizations. Note that this is different from the employment weighting used in EG1 and EG2. However, like those indicators, it requires that total employment be collected in surveys of central government organizations.
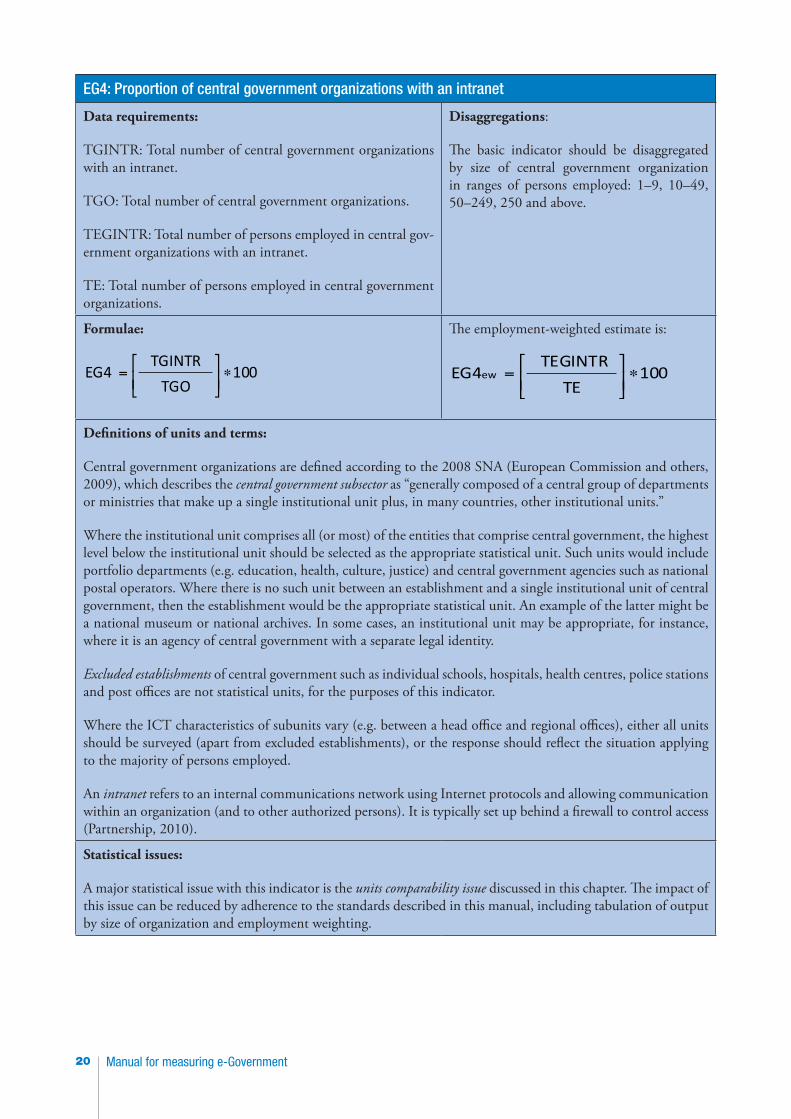
Manual for measuring e-Government20
EG4: Proportion of central government organizations with an intranet
Data requirements:
TGINTR: Total number of central government organizations with an intranet.
TGO: Total number of central government organizations.
TEGINTR: Total number of persons employed in central gov-ernment organizations with an intranet.
TE: Total number of persons employed in central government organizations.
Disaggregations:
The basic indicator should be disaggregated by size of central government organization in ranges of persons employed: 1–9, 10–49, 50–249, 250 and above.
Formulae:
100 TGO
TGINTR EG4 ∗= ⎥⎦
⎤⎢⎣
⎡
The employment-weighted estimate is:
100 TE
TEGINTR EG4ew ∗= ⎥⎦
⎤⎢⎣
⎡
Definitions of units and terms:
Central government organizations are defined according to the 2008 SNA (European Commission and others, 2009), which describes the central government subsector as “generally composed of a central group of departments or ministries that make up a single institutional unit plus, in many countries, other institutional units.”
Where the institutional unit comprises all (or most) of the entities that comprise central government, the highest level below the institutional unit should be selected as the appropriate statistical unit. Such units would include portfolio departments (e.g. education, health, culture, justice) and central government agencies such as national postal operators. Where there is no such unit between an establishment and a single institutional unit of central government, then the establishment would be the appropriate statistical unit. An example of the latter might be a national museum or national archives. In some cases, an institutional unit may be appropriate, for instance, where it is an agency of central government with a separate legal identity.
Excluded establishments of central government such as individual schools, hospitals, health centres, police stations and post offices are not statistical units, for the purposes of this indicator.
Where the ICT characteristics of subunits vary (e.g. between a head office and regional offices), either all units should be surveyed (apart from excluded establishments), or the response should reflect the situation applying to the majority of persons employed.
An intranet refers to an internal communications network using Internet protocols and allowing communication within an organization (and to other authorized persons). It is typically set up behind a firewall to control access (Partnership, 2010).
Statistical issues:
A major statistical issue with this indicator is the units comparability issue discussed in this chapter. The impact of this issue can be reduced by adherence to the standards described in this manual, including tabulation of output by size of organization and employment weighting.
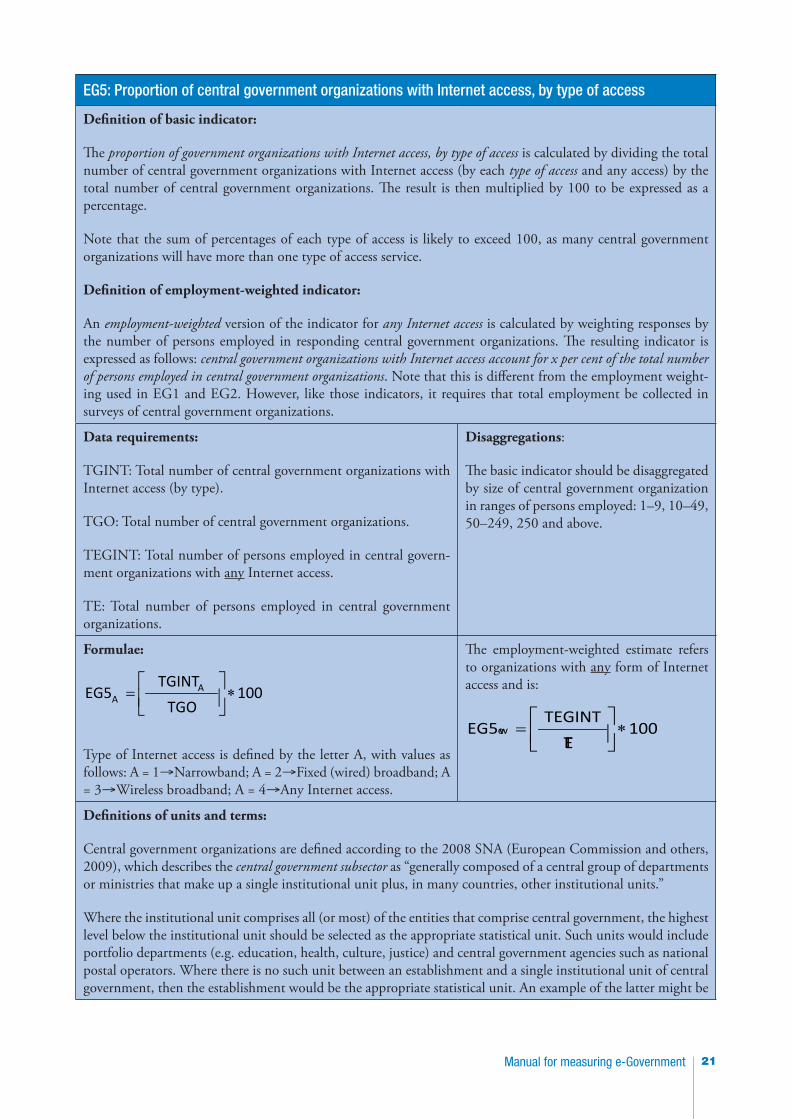
21Manual for measuring e-Government
EG5: Proportion of central government organizations with Internet access, by type of access
Definition of basic indicator:
The proportion of government organizations with Internet access, by type of access is calculated by dividing the total number of central government organizations with Internet access (by each type of access and any access) by the total number of central government organizations. The result is then multiplied by 100 to be expressed as a percentage.
Note that the sum of percentages of each type of access is likely to exceed 100, as many central government organizations will have more than one type of access service.
Definition of employment-weighted indicator:
An employment-weighted version of the indicator for any Internet access is calculated by weighting responses by the number of persons employed in responding central government organizations. The resulting indicator is expressed as follows: central government organizations with Internet access account for x per cent of the total number of persons employed in central government organizations. Note that this is different from the employment weight-ing used in EG1 and EG2. However, like those indicators, it requires that total employment be collected in surveys of central government organizations.
Data requirements:
TGINT: Total number of central government organizations with Internet access (by type).
TGO: Total number of central government organizations.
TEGINT: Total number of persons employed in central govern-ment organizations with any Internet access.
TE: Total number of persons employed in central government organizations.
Disaggregations:
The basic indicator should be disaggregated by size of central government organization in ranges of persons employed: 1–9, 10–49, 50–249, 250 and above.
Formulae:
100 TGO
TGINT EG5 A
A ∗=
Type of Internet access is defined by the letter A, with values as follows: A = 1→Narrowband; A = 2→Fixed (wired) broadband; A = 3→Wireless broadband; A = 4→Any Internet access.
The employment-weighted estimate refers to organizations with any form of Internet access and is:
100 TE
TEGINT EG5ew ∗=
Definitions of units and terms:
Central government organizations are defined according to the 2008 SNA (European Commission and others, 2009), which describes the central government subsector as “generally composed of a central group of departments or ministries that make up a single institutional unit plus, in many countries, other institutional units.”
Where the institutional unit comprises all (or most) of the entities that comprise central government, the highest level below the institutional unit should be selected as the appropriate statistical unit. Such units would include portfolio departments (e.g. education, health, culture, justice) and central government agencies such as national postal operators. Where there is no such unit between an establishment and a single institutional unit of central government, then the establishment would be the appropriate statistical unit. An example of the latter might be
Manual for measuring e-Government22
EG5: Proportion of central government organizations with Internet access, by type of access
a national museum or national archives. In some cases, an institutional unit may be appropriate, for instance, where it is an agency of central government with a separate legal identity.
Excluded establishments of central government such as individual schools, hospitals, health centres, police stations and post offices are not statistical units, for the purposes of this indicator.
Where the ICT characteristics of subunits vary (e.g. between a head office and regional offices), either all units should be surveyed (apart from excluded establishments), or the response should reflect the situation applying to the majority of persons employed.
The Internet is a worldwide public computer network. It provides access to a number of communication services including the World Wide Web and carries e-mail, news, entertainment and data files (Partnership, 2010).
Narrowband includes analogue modem (dial-up via standard phone line), ISDN (integrated services digital network), DSL (digital subscriber line) at advertised download speeds below 256 kbit/s, and mobile phone and other forms of access with an advertised download speed of less than 256 kbit/s. Narrowband mobile phone access services include CDMA 1x (Release 0), GPRS, WAP and i-mode (ITU, 2011).
Fixed (wired) broadband refers to fixed (wired) technologies at advertised download speeds of at least 256 kbit/s, such as DSL, cable modem, high speed leased lines, fibre-to-the-home/building, powerline and other fixed (wired) broadband. It excludes wireless broadband services as defined below (ITU, 2011).
Wireless broadband refers to wireless technologies at advertised download speeds of at least 256 kbit/s, such as satellite broadband, terrestrial fixed wireless (including WiMax) and broadband access via mobile broadband networks (ITU, 2011).
Internet access can be via any device (mobile cellular phone, laptop, PDA, etc.). The Internet connection(s) should be functional, that is, any equipment, software or services needed should be in working condition. Access can be via a fixed or wireless network (Partnership, 2010).
Statistical issues:
A major statistical issue with this indicator is the units comparability issue discussed in this chapter. The impact of this issue can be reduced by adherence to the standards described in this manual, including tabulation of output by size of organization and employment weighting. Another possible statistical issue is the technical nature of the categories and the possibility that respondents will not know what kind of Internet access service(s) they have.
65. Countries may wish to extend EG5 to collect data on the reliability of Internet access. Where Internet access is limited and unpredictable (as in some African countries), the benefit of having access is reduced. Countries in this situation could collect additional information on the reliability of the organi-zation’s Internet access service. The information could be in the form of the number of hours typically available each working day and whether the time(s) of access is (are) generally predictable.
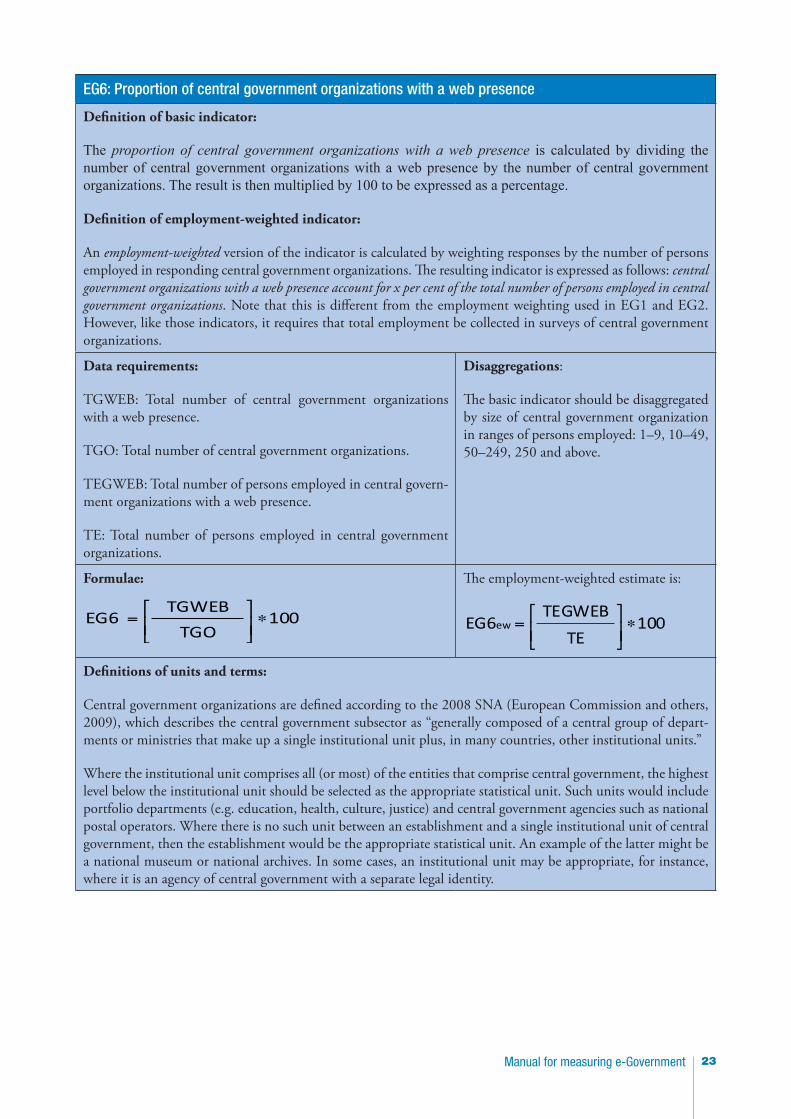
23Manual for measuring e-Government
EG6: Proportion of central government organizations with a web presence
Definition of basic indicator:
The proportion of central government organizations with a web presence is calculated by dividing the number of central government organizations with a web presence by the number of central government organizations. The result is then multiplied by 100 to be expressed as a percentage.
Definition of employment-weighted indicator:
An employment-weighted version of the indicator is calculated by weighting responses by the number of persons employed in responding central government organizations. The resulting indicator is expressed as follows: central government organizations with a web presence account for x per cent of the total number of persons employed in central government organizations. Note that this is different from the employment weighting used in EG1 and EG2. However, like those indicators, it requires that total employment be collected in surveys of central government organizations.
Data requirements:
TGWEB: Total number of central government organizations with a web presence.
TGO: Total number of central government organizations.
TEGWEB: Total number of persons employed in central govern-ment organizations with a web presence.
TE: Total number of persons employed in central government organizations.
Disaggregations:
The basic indicator should be disaggregated by size of central government organization in ranges of persons employed: 1–9, 10–49, 50–249, 250 and above.
Formulae:
100 TGO
TGWEB EG6 ∗= ⎥⎦
⎤⎢⎣
⎡
The employment-weighted estimate is:
100 TE
TEGWEB EG6ew ∗= ⎥⎦
⎤⎢⎣
⎡
Definitions of units and terms:
Central government organizations are defined according to the 2008 SNA (European Commission and others, 2009), which describes the central government subsector as “generally composed of a central group of depart-ments or ministries that make up a single institutional unit plus, in many countries, other institutional units.”
Where the institutional unit comprises all (or most) of the entities that comprise central government, the highest level below the institutional unit should be selected as the appropriate statistical unit. Such units would include portfolio departments (e.g. education, health, culture, justice) and central government agencies such as national postal operators. Where there is no such unit between an establishment and a single institutional unit of central government, then the establishment would be the appropriate statistical unit. An example of the latter might be a national museum or national archives. In some cases, an institutional unit may be appropriate, for instance, where it is an agency of central government with a separate legal identity.
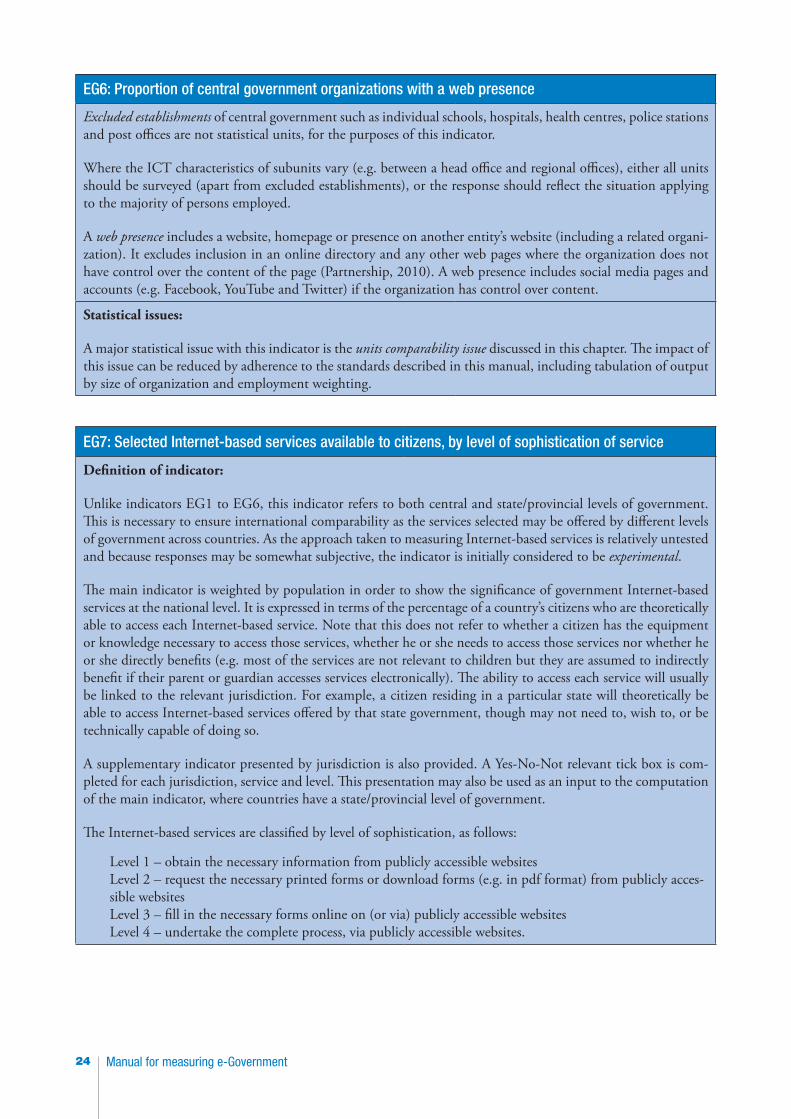
Manual for measuring e-Government24
EG6: Proportion of central government organizations with a web presence
Excluded establishments of central government such as individual schools, hospitals, health centres, police stations and post offices are not statistical units, for the purposes of this indicator.
Where the ICT characteristics of subunits vary (e.g. between a head office and regional offices), either all units should be surveyed (apart from excluded establishments), or the response should reflect the situation applying to the majority of persons employed.
A web presence includes a website, homepage or presence on another entity’s website (including a related organi-zation). It excludes inclusion in an online directory and any other web pages where the organization does not have control over the content of the page (Partnership, 2010). A web presence includes social media pages and accounts (e.g. Facebook, YouTube and Twitter) if the organization has control over content.
Statistical issues:
A major statistical issue with this indicator is the units comparability issue discussed in this chapter. The impact of this issue can be reduced by adherence to the standards described in this manual, including tabulation of output by size of organization and employment weighting.
EG7: Selected Internet-based services available to citizens, by level of sophistication of service
Definition of indicator:
Unlike indicators EG1 to EG6, this indicator refers to both central and state/provincial levels of government. This is necessary to ensure international comparability as the services selected may be offered by different levels of government across countries. As the approach taken to measuring Internet-based services is relatively untested and because responses may be somewhat subjective, the indicator is initially considered to be experimental.
The main indicator is weighted by population in order to show the significance of government Internet-based services at the national level. It is expressed in terms of the percentage of a country’s citizens who are theoretically able to access each Internet-based service. Note that this does not refer to whether a citizen has the equipment or knowledge necessary to access those services, whether he or she needs to access those services nor whether he or she directly benefits (e.g. most of the services are not relevant to children but they are assumed to indirectly benefit if their parent or guardian accesses services electronically). The ability to access each service will usually be linked to the relevant jurisdiction. For example, a citizen residing in a particular state will theoretically be able to access Internet-based services offered by that state government, though may not need to, wish to, or be technically capable of doing so.
A supplementary indicator presented by jurisdiction is also provided. A Yes-No-Not relevant tick box is com-pleted for each jurisdiction, service and level. This presentation may also be used as an input to the computation of the main indicator, where countries have a state/provincial level of government.
The Internet-based services are classified by level of sophistication, as follows:
Level 1 – obtain the necessary information from publicly accessible websites Level 2 – request the necessary printed forms or download forms (e.g. in pdf format) from publicly acces-sible websites Level 3 – fill in the necessary forms online on (or via) publicly accessible websites Level 4 – undertake the complete process, via publicly accessible websites.
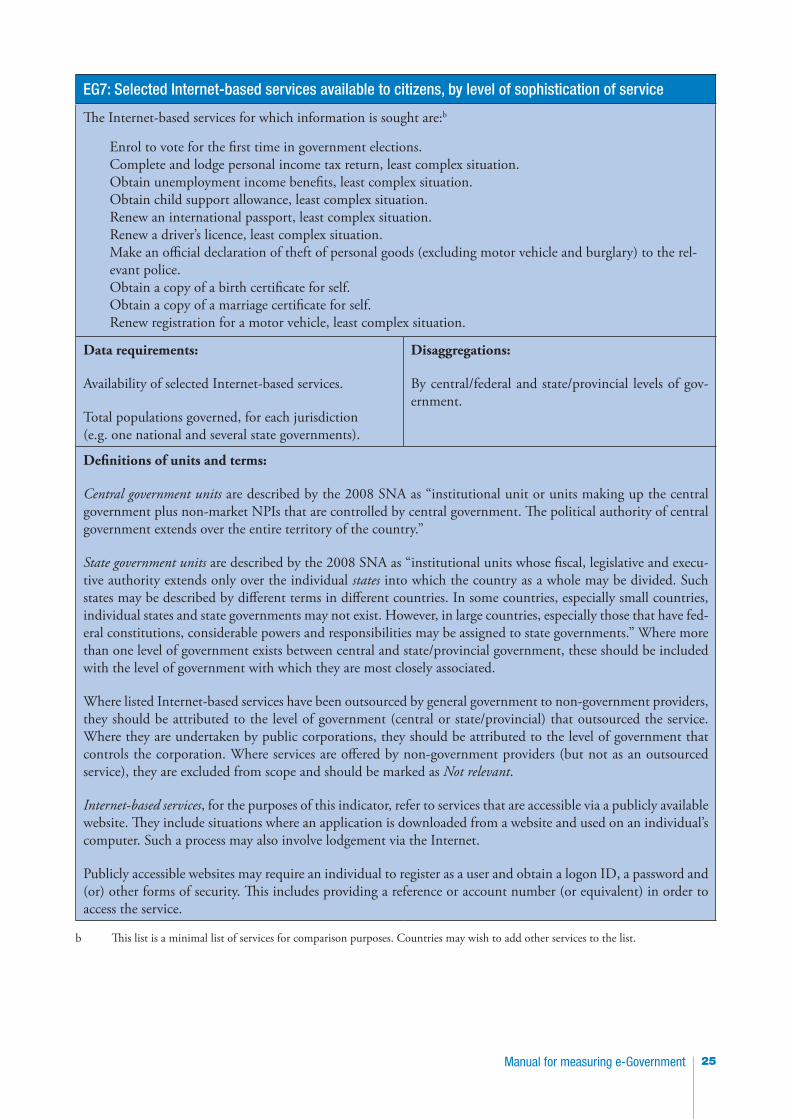
25Manual for measuring e-Government
EG7: Selected Internet-based services available to citizens, by level of sophistication of service
The Internet-based services for which information is sought are:b
Enrol to vote for the first time in government elections. Complete and lodge personal income tax return, least complex situation. Obtain unemployment income benefits, least complex situation. Obtain child support allowance, least complex situation. Renew an international passport, least complex situation. Renew a driver’s licence, least complex situation. Make an official declaration of theft of personal goods (excluding motor vehicle and burglary) to the rel-evant police. Obtain a copy of a birth certificate for self. Obtain a copy of a marriage certificate for self. Renew registration for a motor vehicle, least complex situation.
Data requirements:
Availability of selected Internet-based services.
Total populations governed, for each jurisdiction (e.g. one national and several state governments).
Disaggregations:
By central/federal and state/provincial levels of gov-ernment.
Definitions of units and terms:
Central government units are described by the 2008 SNA as “institutional unit or units making up the central government plus non-market NPIs that are controlled by central government. The political authority of central government extends over the entire territory of the country.”
State government units are described by the 2008 SNA as “institutional units whose fiscal, legislative and execu-tive authority extends only over the individual states into which the country as a whole may be divided. Such states may be described by different terms in different countries. In some countries, especially small countries, individual states and state governments may not exist. However, in large countries, especially those that have fed-eral constitutions, considerable powers and responsibilities may be assigned to state governments.” Where more than one level of government exists between central and state/provincial government, these should be included with the level of government with which they are most closely associated.
Where listed Internet-based services have been outsourced by general government to non-government providers, they should be attributed to the level of government (central or state/provincial) that outsourced the service. Where they are undertaken by public corporations, they should be attributed to the level of government that controls the corporation. Where services are offered by non-government providers (but not as an outsourced service), they are excluded from scope and should be marked as Not relevant.
Internet-based services, for the purposes of this indicator, refer to services that are accessible via a publicly available website. They include situations where an application is downloaded from a website and used on an individual’s computer. Such a process may also involve lodgement via the Internet.
Publicly accessible websites may require an individual to register as a user and obtain a logon ID, a password and (or) other forms of security. This includes providing a reference or account number (or equivalent) in order to access the service.
b This list is a minimal list of services for comparison purposes. Countries may wish to add other services to the list.
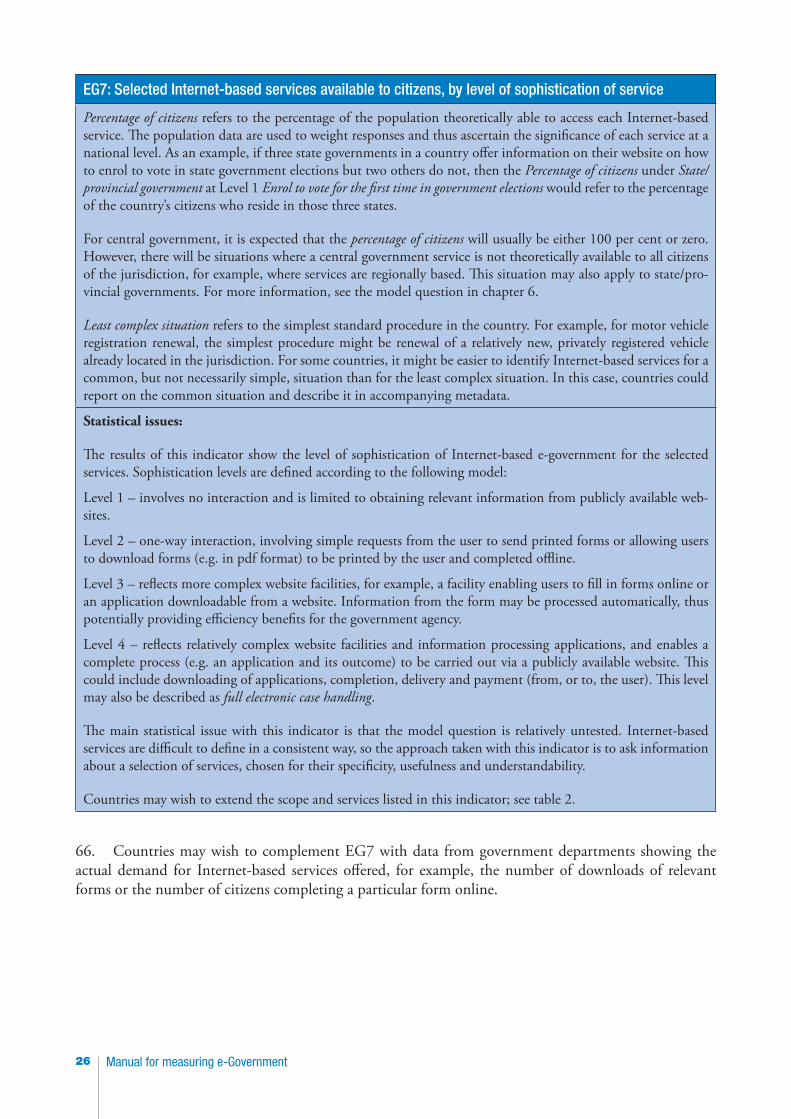
Manual for measuring e-Government26
EG7: Selected Internet-based services available to citizens, by level of sophistication of service
Percentage of citizens refers to the percentage of the population theoretically able to access each Internet-based service. The population data are used to weight responses and thus ascertain the significance of each service at a national level. As an example, if three state governments in a country offer information on their website on how to enrol to vote in state government elections but two others do not, then the Percentage of citizens under State/provincial government at Level 1 Enrol to vote for the first time in government elections would refer to the percentage of the country’s citizens who reside in those three states.
For central government, it is expected that the percentage of citizens will usually be either 100 per cent or zero. However, there will be situations where a central government service is not theoretically available to all citizens of the jurisdiction, for example, where services are regionally based. This situation may also apply to state/pro-vincial governments. For more information, see the model question in chapter 6.
Least complex situation refers to the simplest standard procedure in the country. For example, for motor vehicle registration renewal, the simplest procedure might be renewal of a relatively new, privately registered vehicle already located in the jurisdiction. For some countries, it might be easier to identify Internet-based services for a common, but not necessarily simple, situation than for the least complex situation. In this case, countries could report on the common situation and describe it in accompanying metadata.
Statistical issues:
The results of this indicator show the level of sophistication of Internet-based e-government for the selected services. Sophistication levels are defined according to the following model:
Level 1 – involves no interaction and is limited to obtaining relevant information from publicly available web-sites.
Level 2 – one-way interaction, involving simple requests from the user to send printed forms or allowing users to download forms (e.g. in pdf format) to be printed by the user and completed offline.
Level 3 – reflects more complex website facilities, for example, a facility enabling users to fill in forms online or an application downloadable from a website. Information from the form may be processed automatically, thus potentially providing efficiency benefits for the government agency.
Level 4 – reflects relatively complex website facilities and information processing applications, and enables a complete process (e.g. an application and its outcome) to be carried out via a publicly available website. This could include downloading of applications, completion, delivery and payment (from, or to, the user). This level may also be described as full electronic case handling.
The main statistical issue with this indicator is that the model question is relatively untested. Internet-based services are difficult to define in a consistent way, so the approach taken with this indicator is to ask information about a selection of services, chosen for their specificity, usefulness and understandability.
Countries may wish to extend the scope and services listed in this indicator; see table 2.
66. Countries may wish to complement EG7 with data from government departments showing the actual demand for Internet-based services offered, for example, the number of downloads of relevant forms or the number of citizens completing a particular form online.
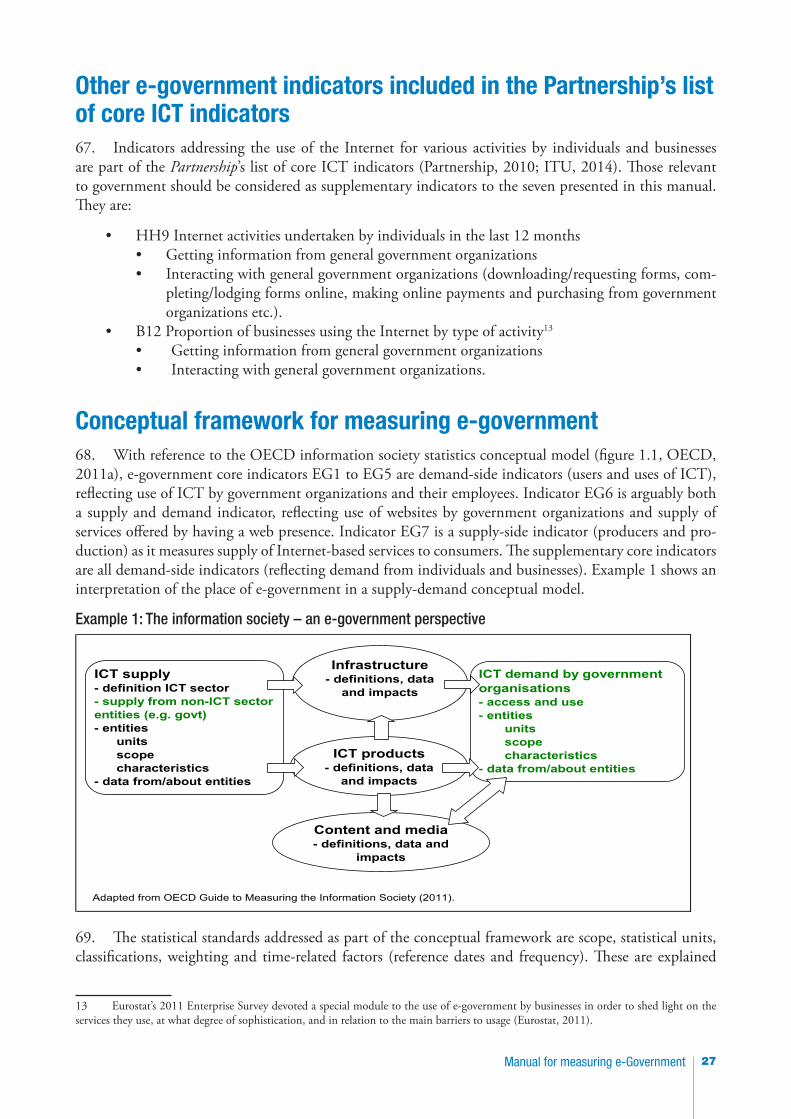
27Manual for measuring e-Government
Other e-government indicators included in the Partnership’s list of core ICT indicators67. Indicators addressing the use of the Internet for various activities by individuals and businesses are part of the Partnership’s list of core ICT indicators (Partnership, 2010; ITU, 2014). Those relevant to government should be considered as supplementary indicators to the seven presented in this manual. They are:
• HH9 Internet activities undertaken by individuals in the last 12 months• Getting information from general government organizations• Interacting with general government organizations (downloading/requesting forms, com-
pleting/lodging forms online, making online payments and purchasing from government organizations etc.).
• B12 Proportion of businesses using the Internet by type of activity13
• Getting information from general government organizations• Interacting with general government organizations.
Conceptual framework for measuring e-government68. With reference to the OECD information society statistics conceptual model (figure 1.1, OECD, 2011a), e-government core indicators EG1 to EG5 are demand-side indicators (users and uses of ICT), reflecting use of ICT by government organizations and their employees. Indicator EG6 is arguably both a supply and demand indicator, reflecting use of websites by government organizations and supply of services offered by having a web presence. Indicator EG7 is a supply-side indicator (producers and pro-duction) as it measures supply of Internet-based services to consumers. The supplementary core indicators are all demand-side indicators (reflecting demand from individuals and businesses). Example 1 shows an interpretation of the place of e-government in a supply-demand conceptual model.
Example 1: The information society – an e-government perspective
Adapted from OECD Guide to Measuring the Information Society (2011).
ICT products- definitions, data
and impacts collection
Infrastructure- definitions, data
and impactsICT supply- definition ICT sector- supply from non-ICT sector entities (e.g. govt)- entities units scope characteristics- data from/about entities- impacts
ICT demand by government organisations- access and use- entities units scope characteristics- data from/about entities- impacts
Content and media- definitions, data and
impacts
69. The statistical standards addressed as part of the conceptual framework are scope, statistical units, classifications, weighting and time-related factors (reference dates and frequency). These are explained
13 Eurostat’s 2011 Enterprise Survey devoted a special module to the use of e-government by businesses in order to shed light on the services they use, at what degree of sophistication, and in relation to the main barriers to usage (Eurostat, 2011).
Manual for measuring e-Government28
below. Indicator definitions and model questions (including definitions of terms) may also be regarded as statistical standards and are included in the Manual.
Scope70. For the purposes of this chapter, scope refers to the types of units referred to by the indicators. In a broader context, scope may include other factors such as geography and time frame. For business ICT use surveys, in particular, unit scope will also include size and industry of activity of the organization. These are not specified for the e-government indicators. In particular, it is not recommended that scope be limited by organization size or industry (though note the use of an industry classification to improve coverage as discussed below and in chapter 7).
Indicators EG1 to EG671. Indicators EG1 to EG6 refer to central government organizations, which constitute a subsector of the general government sector. The latter is defined in SNA 2008 (European Commission and others, 2009) as consisting of all units of central, state or local government; all non-market, non-profit institu-tions (NPIs) that are controlled by government units; and social security funds. The general government sector does not include public corporations, even when all the equity of such corporations is owned by government units. Nor does it include quasi-corporations that are owned and controlled by government units.14 However, unincorporated enterprises owned by government units that are not quasi-corporations remain integral parts of those units and are therefore included in the general government sector.
72. According to the 2008 SNA, the central government subsector consists of the institutional unit or units making up the central government plus non-market NPIs that are controlled by central govern-ment. The SNA describes the characteristics of central government in terms of its authority in areas such as imposition of taxes, national defence, maintenance of law and order, and relations with foreign gov-ernments. It also defines the concept of control in respect of NPIs as the ability to determine the general policy or programme of the NPI, with five indicators of control to be considered. They include control according to enabling instruments (for example, a constitution), contractual agreements, degree of fund-ing, and exposure to financial risk of the NPI. Control may be established using one or more of these criteria and, ultimately, the establishment of control is judgemental in nature.
73. In terms of residency, government units are always considered resident by the SNA. This includes territorial enclaves in the rest of the world, used by the government for diplomatic or other purposes, nor-mally with the formal agreement of the government of the country in which they are physically located.
74. General government also includes social security funds. These may constitute a separate subsector or be included with the level of government (central, state or local) where they operate. The choice of classification of a social security fund depends on whether it is independent of the level of government where it operates.
75. Central banks are usually categorized by the SNA to a subsector of the financial corporations sector. However, in cases where they are not separate institutional units and their functions are carried out by agencies within the central government that are not separate institutional units, they will be included in general government.
14 According to the 2008 SNA, a quasi-corporation is an unincorporated enterprise belonging to a household or government unit that behaves like a corporation and has a complete set of accounts.
29Manual for measuring e-Government
76. The 2008 SNA describes a number of borderline cases, including quasi-corporations, restructuring agencies, special purpose entities, joint ventures and supranational authorities. The likely treatment is as follows:
• Quasi-corporations are unincorporated enterprises that function as if they are corporations; if they are owned by government, they are treated as public corporations and are therefore out of scope of general government.
• Restructuring agencies controlled by government may be general government entities or public corporations depending on the nature of their operations.
• Special purpose entities can be resident or non-resident. In the latter case, they are not part of the general government sector. Resident special purpose entities may be a general government entity or a public corporation depending on the nature of their operations.
• Joint ventures involve the establishment of a corporation, partnership or other institutional unit in which each party legally has joint control over the activities of the unit. If a joint venture operates as a non-market producer, government is in effective control and it is classified as part of general government. Conversely, if the joint venture is a market producer, it is treated as a public or private corporation according to whether or not it is controlled by a government unit.
• Supranational authorities. Some countries may be part of an institutional agreement that involves monetary transfers from the member countries to the associated supranational author-ity and vice versa. The supranational authority also engages in non-market production. As the authority is a non-resident, it is out of scope for the purposes of this manual.
77. The International Standard Industrial Classification of All Economic Activities (ISIC) (UNDESA 2002, 2008a) is the international standard for classifying entities according to their economic activity. NSOs will generally classify units on their business register by ISIC or an equivalent national industrial classification. Where data for the e-government indicators are collected using a survey run by a NSO, the business register may be used as a survey frame (or at least used as a starting point for constructing a frame). As ISIC refers to activities, not types of units, it cannot be used alone to define scope (because some of the activities of government will be outside the ISIC section, Public administration and defence; compulsory social security, and, arguably, non-government units may also have activities covered by this section). In addition, ISIC does not distinguish the activities of central government; these will vary for individual countries (as an example, countries with a level of state (or provincial) government will likely have more limited central government functions).
78. For practical reasons, scope for the e-government indicators EG1 to EG6 does not extend to excluded establishments of government. These are individual establishments such as schools, hospitals, health centres, police stations and post offices. Therefore, such establishments are not included as statisti-cal units for indicators EG1 to EG6. They are also not included in the responses of higher-level units. For example, a central government department of education would be included in a survey of e-government as a statistical unit. However, the schools administered by that department would not be included in the survey, nor is their activity taken into account for indicators EG1 to EG6. These issues are further explored in Statistical units below.
Indicator EG779. Indicator EG7 refers to government more generally and the scope includes both central and state/provincial levels of government. This is necessary because the level of government responsible for the ser-vices included in EG7 will vary between countries. Where any of the listed Internet-based services have been outsourced by general government to non-government providers, they should be attributed to the level of government (central or state/provincial) that outsourced the service. Where they are undertaken
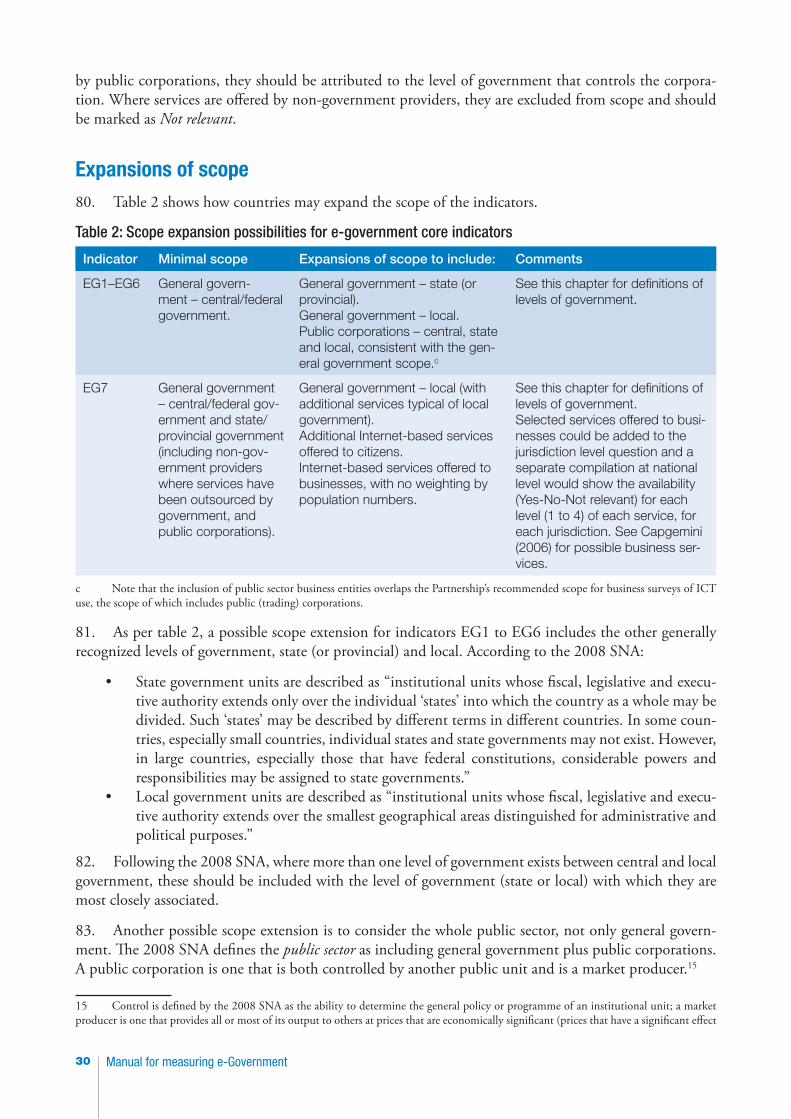
Manual for measuring e-Government30
by public corporations, they should be attributed to the level of government that controls the corpora-tion. Where services are offered by non-government providers, they are excluded from scope and should be marked as Not relevant.
Expansions of scope80. Table 2 shows how countries may expand the scope of the indicators.
Table 2: Scope expansion possibilities for e-government core indicators
Indicator Minimal scope Expansions of scope to include: Comments
EG1–EG6 General govern-ment – central/federal government.
General government – state (or provincial).General government – local.Public corporations – central, state and local, consistent with the gen-eral government scope.c
See this chapter for definitions of levels of government.
EG7 General government – central/federal gov-ernment and state/provincial government (including non-gov-ernment providers where services have been outsourced by government, and public corporations).
General government – local (with additional services typical of local government).Additional Internet-based services offered to citizens.Internet-based services offered to businesses, with no weighting by population numbers.
See this chapter for definitions of levels of government.Selected services offered to busi-nesses could be added to the jurisdiction level question and a separate compilation at national level would show the availability (Yes-No-Not relevant) for each level (1 to 4) of each service, for each jurisdiction. See Capgemini (2006) for possible business ser-vices.
c Note that the inclusion of public sector business entities overlaps the Partnership’s recommended scope for business surveys of ICT use, the scope of which includes public (trading) corporations.
81. As per table 2, a possible scope extension for indicators EG1 to EG6 includes the other generally recognized levels of government, state (or provincial) and local. According to the 2008 SNA:
• State government units are described as “institutional units whose fiscal, legislative and execu-tive authority extends only over the individual ‘states’ into which the country as a whole may be divided. Such ‘states’ may be described by different terms in different countries. In some coun-tries, especially small countries, individual states and state governments may not exist. However, in large countries, especially those that have federal constitutions, considerable powers and responsibilities may be assigned to state governments.”
• Local government units are described as “institutional units whose fiscal, legislative and execu-tive authority extends over the smallest geographical areas distinguished for administrative and political purposes.”
82. Following the 2008 SNA, where more than one level of government exists between central and local government, these should be included with the level of government (state or local) with which they are most closely associated.
83. Another possible scope extension is to consider the whole public sector, not only general govern-ment. The 2008 SNA defines the public sector as including general government plus public corporations. A public corporation is one that is both controlled by another public unit and is a market producer.15
15 Control is defined by the 2008 SNA as the ability to determine the general policy or programme of an institutional unit; a market producer is one that provides all or most of its output to others at prices that are economically significant (prices that have a significant effect
31Manual for measuring e-Government
84. Public corporations can be further classified according to the level of government (central, state or local) and type of entity:
• Non-financial• Financial public corporations other than the central bank• The central bank.16
85. The Frascati Manual (OECD, 2002) includes standards for research and experimental development statistics, including the definition of the government sector and government units. It broadly follows the 1993 SNA, with the difference that higher education is established as a separate sector. Note that public enterprises are included in the business sector. The Frascati Manual defines the government sector as fol-lows:
• “All departments, offices and other bodies which furnish, but normally do not sell to the com-munity, those common services, other than higher education, which cannot otherwise be con-veniently and economically provided, as well as those that administer the state and the eco-nomic and social policy of the community. (Public enterprises are included in the business enterprise sector.)
• NPIs controlled and mainly financed by government, but not administered by the higher edu-cation sector.”
• “Units associated with the higher education sector which mainly serve the government sector should also be included in the government sector.”
Statistical units86. A statistical unit is the entity in respect of which statistics are compiled. There are several challenges in defining and identifying statistical units for surveys of government organizations, especially in a way that enables international comparability (that is, achieving comparable output across countries). In this manual, those challenges have been collectively referred to as the units comparability issue.
87. Issues relating to government organizations as statistical units are also discussed in chapter 7 – Survey design.
The units comparability issue88. Indicators of the type ‘proportion of government organizations with ICT’ (indicators EG3 to EG6) are affected by difficulties with comparison of units.17 For such indicators, it can be very challenging to provide internationally comparable statistics, with the following conditions needing to be satisfied:
• Countries need to consistently use agreed definitions for the entities – these include definitions covering the functions and activities of the entity.
• The defined entities need to be identified and accurately listed by countries according to those agreed definitions.
• Even with consistent definition and good identification, indicators of the form ‘proportion of government organizations with ICT’ may not be comparable across countries because of differ-ent structures and functions of country systems. For example, country A may have identified a small number of large entities of central government, whereas country B might have mainly small entities of this type. In this example, country A is likely to rate more highly on ‘propor-
on the amounts that producers are willing to supply and on the amounts purchasers wish to buy).16 More information may be found in chapter 22 of the 2008 System of National Accounts (European Commission and others, 2009).17 This is true of any indicator of the form ‘proportion of entities with <a characteristic>’ if units are not comparable across countries. At the national level, the problem can affect regional and time series comparisons.
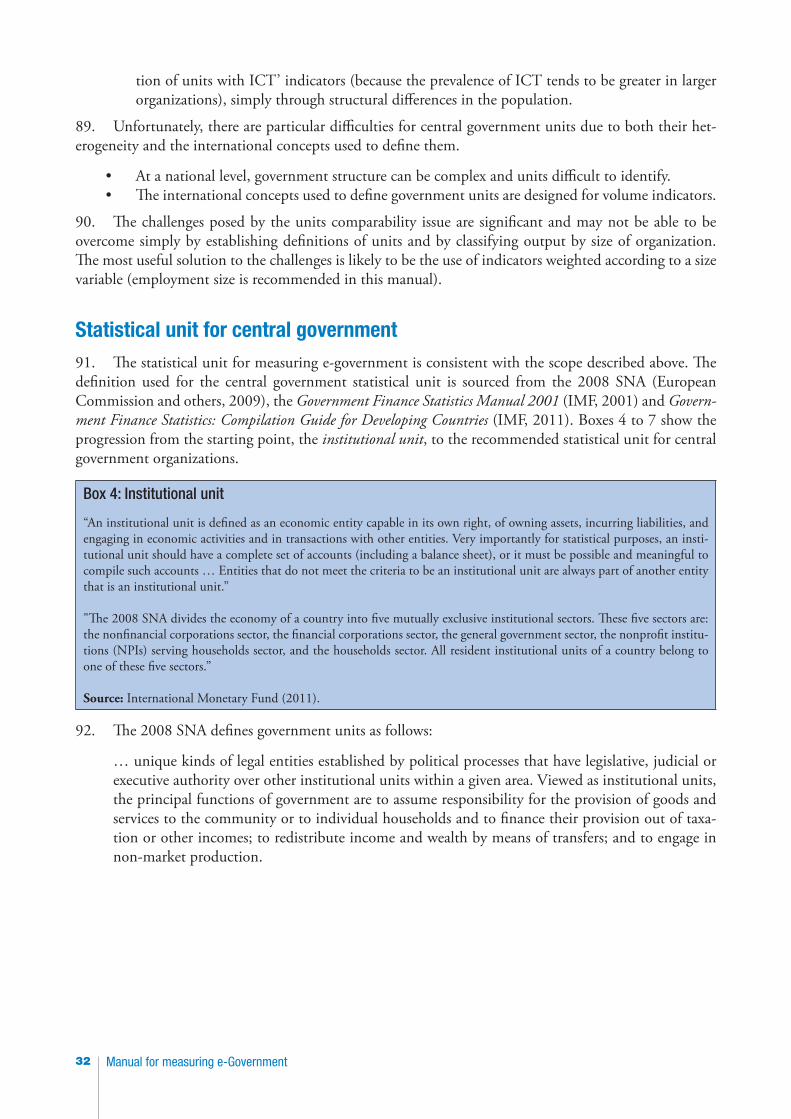
Manual for measuring e-Government32
tion of units with ICT’ indicators (because the prevalence of ICT tends to be greater in larger organizations), simply through structural differences in the population.
89. Unfortunately, there are particular difficulties for central government units due to both their het-erogeneity and the international concepts used to define them.
• At a national level, government structure can be complex and units difficult to identify.• The international concepts used to define government units are designed for volume indicators.
90. The challenges posed by the units comparability issue are significant and may not be able to be overcome simply by establishing definitions of units and by classifying output by size of organization. The most useful solution to the challenges is likely to be the use of indicators weighted according to a size variable (employment size is recommended in this manual).
Statistical unit for central government91. The statistical unit for measuring e-government is consistent with the scope described above. The definition used for the central government statistical unit is sourced from the 2008 SNA (European Commission and others, 2009), the Government Finance Statistics Manual 2001 (IMF, 2001) and Govern-ment Finance Statistics: Compilation Guide for Developing Countries (IMF, 2011). Boxes 4 to 7 show the progression from the starting point, the institutional unit, to the recommended statistical unit for central government organizations.
Box 4: Institutional unit
“An institutional unit is defined as an economic entity capable in its own right, of owning assets, incurring liabilities, and engaging in economic activities and in transactions with other entities. Very importantly for statistical purposes, an insti-tutional unit should have a complete set of accounts (including a balance sheet), or it must be possible and meaningful to compile such accounts … Entities that do not meet the criteria to be an institutional unit are always part of another entity that is an institutional unit.”
"The 2008 SNA divides the economy of a country into five mutually exclusive institutional sectors. These five sectors are: the nonfinancial corporations sector, the financial corporations sector, the general government sector, the nonprofit institu-tions (NPIs) serving households sector, and the households sector. All resident institutional units of a country belong to one of these five sectors.”
Source: International Monetary Fund (2011).
92. The 2008 SNA defines government units as follows:
… unique kinds of legal entities established by political processes that have legislative, judicial or executive authority over other institutional units within a given area. Viewed as institutional units, the principal functions of government are to assume responsibility for the provision of goods and services to the community or to individual households and to finance their provision out of taxa-tion or other incomes; to redistribute income and wealth by means of transfers; and to engage in non-market production.
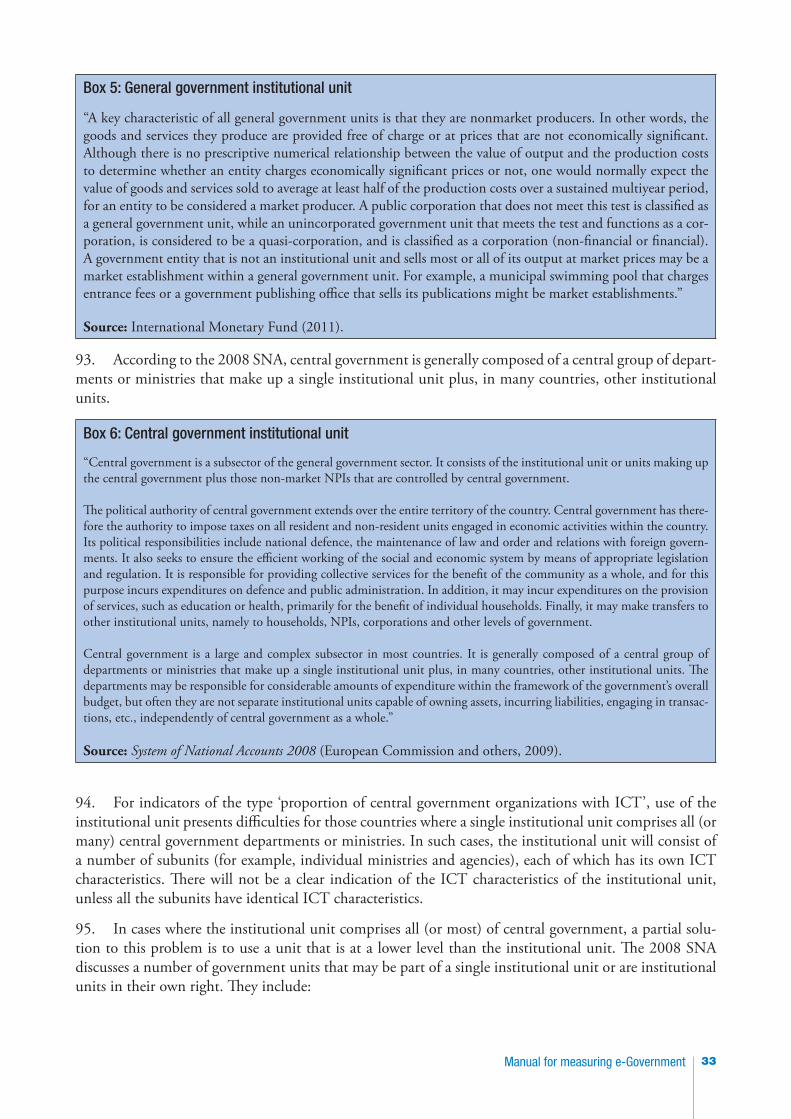
33Manual for measuring e-Government
Box 5: General government institutional unit
“A key characteristic of all general government units is that they are nonmarket producers. In other words, the goods and services they produce are provided free of charge or at prices that are not economically significant. Although there is no prescriptive numerical relationship between the value of output and the production costs to determine whether an entity charges economically significant prices or not, one would normally expect the value of goods and services sold to average at least half of the production costs over a sustained multiyear period, for an entity to be considered a market producer. A public corporation that does not meet this test is classified as a general government unit, while an unincorporated government unit that meets the test and functions as a cor-poration, is considered to be a quasi-corporation, and is classified as a corporation (non-financial or financial). A government entity that is not an institutional unit and sells most or all of its output at market prices may be a market establishment within a general government unit. For example, a municipal swimming pool that charges entrance fees or a government publishing office that sells its publications might be market establishments.”
Source: International Monetary Fund (2011).
93. According to the 2008 SNA, central government is generally composed of a central group of depart-ments or ministries that make up a single institutional unit plus, in many countries, other institutional units.
Box 6: Central government institutional unit
“Central government is a subsector of the general government sector. It consists of the institutional unit or units making up the central government plus those non-market NPIs that are controlled by central government.
The political authority of central government extends over the entire territory of the country. Central government has there-fore the authority to impose taxes on all resident and non-resident units engaged in economic activities within the country. Its political responsibilities include national defence, the maintenance of law and order and relations with foreign govern-ments. It also seeks to ensure the efficient working of the social and economic system by means of appropriate legislation and regulation. It is responsible for providing collective services for the benefit of the community as a whole, and for this purpose incurs expenditures on defence and public administration. In addition, it may incur expenditures on the provision of services, such as education or health, primarily for the benefit of individual households. Finally, it may make transfers to other institutional units, namely to households, NPIs, corporations and other levels of government.
Central government is a large and complex subsector in most countries. It is generally composed of a central group of departments or ministries that make up a single institutional unit plus, in many countries, other institutional units. The departments may be responsible for considerable amounts of expenditure within the framework of the government’s overall budget, but often they are not separate institutional units capable of owning assets, incurring liabilities, engaging in transac-tions, etc., independently of central government as a whole.”
Source: System of National Accounts 2008 (European Commission and others, 2009).
94. For indicators of the type ‘proportion of central government organizations with ICT’, use of the institutional unit presents difficulties for those countries where a single institutional unit comprises all (or many) central government departments or ministries. In such cases, the institutional unit will consist of a number of subunits (for example, individual ministries and agencies), each of which has its own ICT characteristics. There will not be a clear indication of the ICT characteristics of the institutional unit, unless all the subunits have identical ICT characteristics.
95. In cases where the institutional unit comprises all (or most) of central government, a partial solu-tion to this problem is to use a unit that is at a lower level than the institutional unit. The 2008 SNA discusses a number of government units that may be part of a single institutional unit or are institutional units in their own right. They include:
Manual for measuring e-Government34
• Departments or ministries of central government that are part of a single institutional unit• Branch offices or agencies of central government (for example, located in different parts of the
country) that are part of a single institutional unit• Agencies of central government with separate legal identity and substantial autonomy that may
be established to carry out specific functions (such as road construction, or the non-market pro-duction of health or education services); these are separate institutional units if they maintain full sets of accounts.
96. In some cases, these types of units will be equivalent to sites or establishments (“an enterprise, or part of an enterprise, that is situated in a single location and in which only a single productive activity is carried out”). In others, they will be higher-level units, with associated subunits including establishments. It is clear that it is impractical to collect or compile information in respect of all establishments that are part of a central government entity. In many countries, such excluded establishments would include indi-vidual schools, hospitals, health centres, police stations and post offices.
97. It is therefore suggested that, where a single institutional unit comprises all (or much) of central government, the highest level below the institutional unit should be selected as the appropriate statistical unit of central government. Such units would include portfolio departments (for example, education, health, education, culture, justice) and could include central government agencies such as national postal operators. Where there is no such unit between an establishment and a single institutional unit of central government, then the establishment would be the appropriate statistical unit. A possible example of this could be a national institution in a single location, such as a national library, national museum or national archives. In some cases, a whole institutional unit may be an appropriate statistical unit, for instance, where it is an agency of central government with a separate legal identity.
98. The suggested unit may be analogous to the kind-of-activity units (KAU) defined by the 2008 SNA: “A kind-of-activity unit is an enterprise, or a part of an enterprise, that engages in only one kind of productive activity or in which the principal productive activity accounts for most of the value added.” A KAU is a higher-level unit than the establishment level, which is location-based and is defined above.
99. Where the selected unit has one or more subunits that are not excluded establishments and have different ICT characteristics from the selected statistical unit, the response should reflect the situation applying to the majority of persons employed. For example, a particular statistical unit is a government department with Internet access at its head office, where 100 people work. The department has several regional offices, all without Internet access and employing, in total, 150 employees. The response should indicate that the statistical unit does not have Internet access. In situations like this, it could be preferable to survey the unit and its subunits.
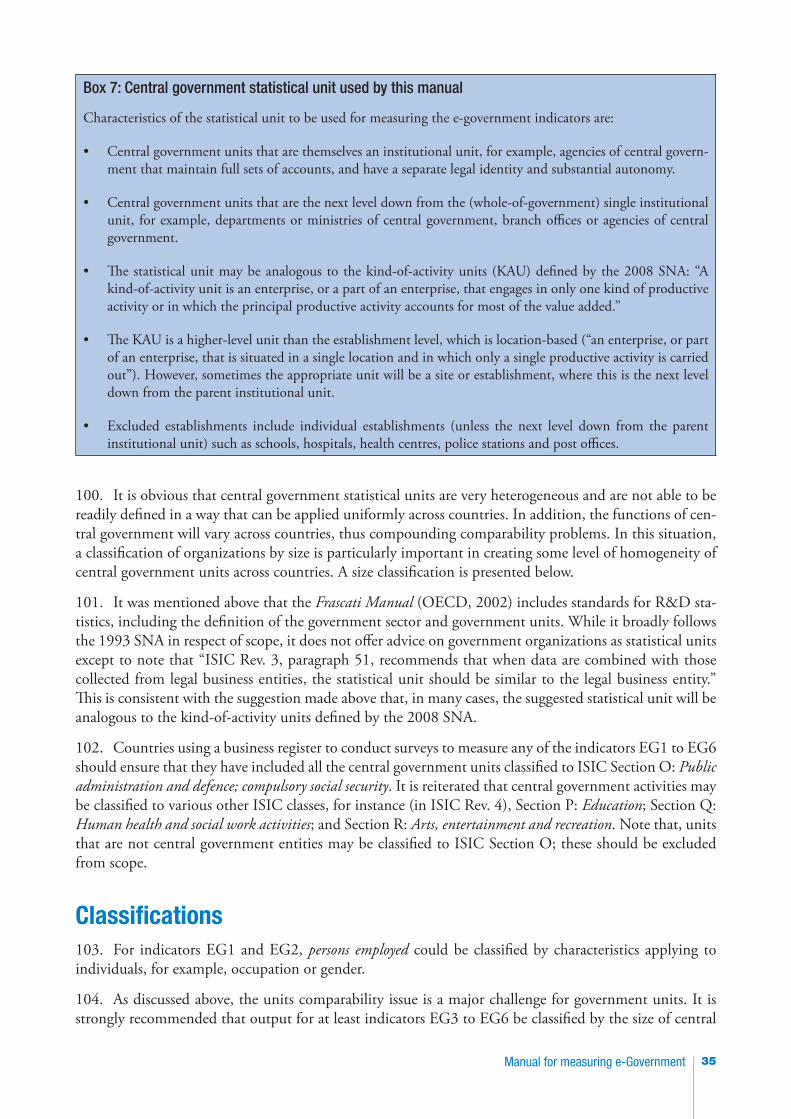
35Manual for measuring e-Government
Box 7: Central government statistical unit used by this manual
Characteristics of the statistical unit to be used for measuring the e-government indicators are:
• Central government units that are themselves an institutional unit, for example, agencies of central govern-ment that maintain full sets of accounts, and have a separate legal identity and substantial autonomy.
• Central government units that are the next level down from the (whole-of-government) single institutional unit, for example, departments or ministries of central government, branch offices or agencies of central government.
• The statistical unit may be analogous to the kind-of-activity units (KAU) defined by the 2008 SNA: “A kind-of-activity unit is an enterprise, or a part of an enterprise, that engages in only one kind of productive activity or in which the principal productive activity accounts for most of the value added.”
• The KAU is a higher-level unit than the establishment level, which is location-based (“an enterprise, or part of an enterprise, that is situated in a single location and in which only a single productive activity is carried out”). However, sometimes the appropriate unit will be a site or establishment, where this is the next level down from the parent institutional unit.
• Excluded establishments include individual establishments (unless the next level down from the parent institutional unit) such as schools, hospitals, health centres, police stations and post offices.
100. It is obvious that central government statistical units are very heterogeneous and are not able to be readily defined in a way that can be applied uniformly across countries. In addition, the functions of cen-tral government will vary across countries, thus compounding comparability problems. In this situation, a classification of organizations by size is particularly important in creating some level of homogeneity of central government units across countries. A size classification is presented below.
101. It was mentioned above that the Frascati Manual (OECD, 2002) includes standards for R&D sta-tistics, including the definition of the government sector and government units. While it broadly follows the 1993 SNA in respect of scope, it does not offer advice on government organizations as statistical units except to note that “ISIC Rev. 3, paragraph 51, recommends that when data are combined with those collected from legal business entities, the statistical unit should be similar to the legal business entity.” This is consistent with the suggestion made above that, in many cases, the suggested statistical unit will be analogous to the kind-of-activity units defined by the 2008 SNA.
102. Countries using a business register to conduct surveys to measure any of the indicators EG1 to EG6 should ensure that they have included all the central government units classified to ISIC Section O: Public administration and defence; compulsory social security. It is reiterated that central government activities may be classified to various other ISIC classes, for instance (in ISIC Rev. 4), Section P: Education; Section Q: Human health and social work activities; and Section R: Arts, entertainment and recreation. Note that, units that are not central government entities may be classified to ISIC Section O; these should be excluded from scope.
Classifications103. For indicators EG1 and EG2, persons employed could be classified by characteristics applying to individuals, for example, occupation or gender.
104. As discussed above, the units comparability issue is a major challenge for government units. It is strongly recommended that output for at least indicators EG3 to EG6 be classified by the size of central
Manual for measuring e-Government36
government organization, thus enabling comparison of similarly sized units across countries.18 The size variable proposed is the number of persons employed by head count and the size ranges are the employ-ment size categories used by the Partnership for businesses (Partnership, 2010). These are: 1–9, 10–49, 50–249 and 250 or more. Head count refers to the number of persons employed, whether full-time, part-time or casual.
105. Where data for indicators EG1 to EG6 are collected by surveys, employment head count data should be collected in the same survey unless highly reliable data on employment by head count are avail-able on countries’ business registers (or other survey frames).
106. A number of classifications applying to government can be found in the Government Finance Sta-tistics Manual 2001 (IMF, 2001). They are classifications of revenue, expenses (economic and functional), assets and liabilities (financial and non-financial), transactions and economic flows. However, none of these are classifications applying to whole units so are not useful for the purposes of the core e-government indicators. The Frascati Manual (OECD, 2002), which also contains international standards for measur-ing government (in this case R&D), does not recommend any particular classification of units, apart from those recommended by the 1993 SNA.
107. If the scope of indicators EG1 to EG6 is extended, output would be classified by jurisdiction and size (for at least EG3 to EG6) and jurisdiction and gender for EG1 and EG2 (if gender information is collected).
Weighting108. Because of the heterogeneity of central government units, it is strongly suggested that indicators be weighted. This removes the effect of unit non-comparability, although it does introduce a weighting effect. The weighting for each indicator has been chosen to be reasonably aligned with the nature of the indicator in order to reduce any weighting effects. The following weightings are recommended:
• For EG1 and EG2, the weighting is a component of the indicator, that is, the proportion of persons employed who routinely use a computer/the Internet. When aggregated to the total population of persons employed, these indicators provide information on the proportion of all persons employed in central government who routinely use computers/the Internet.
• For EG3 to EG6, it is recommended that indicators be weighted according to the number of persons employed; this should be reasonably unbiased for indicators reflecting ICT use by per-sons employed (that is, EG3, EG4 and EG5). For EG6, employment weighting is less related to whether an organization has a website, though arguably, larger organizations are more likely to have websites. The algebraic depiction of employment-weighted estimates is shown in the indicator boxes for EG3 to EG6.
• For EG7, the weighting of the main indicator (population proforma) is a component of the indicator, being the proportion of the relevant population with the theoretical ability to access selected Internet-based government services.
18 Note that the issue does not apply to EG7 and is less critical for EG1 and EG2.
37Manual for measuring e-Government
Time-related factorsReference date109. The indicators refer to the situation at a particular reference date. While it is obviously useful if countries harmonize this date in their data collections, it is considered impractical to recommend that. Therefore, no advice is offered on the selection of a particular reference date. For international reporting of the indicators, countries should include the reference date in a statistical standards statement.
110. Reference dates are referred to in all of the indicators. The dates are left up to countries to deter-mine. They could be at the end of a calendar year or quarter. It could also be the day the survey was com-pleted and therefore could differ slightly between organizations.
Frequency111. Frequency refers to how frequently the indicators are produced by a country. This will be a function of several factors, including resources and the speed of change in the implementation of e-government. While no particular recommendations are made, it is considered that once every two years would be a suitable starting point.
Manual for measuring e-Government38
Chapter 5. Data sources and collection methods
112. This chapter considers data sources and collection methods for the core e-government indicators, starting with a look at current approaches. The major sources used in the preparation of this chapter are ITU (2009), UNCTAD (2009) and metadata for existing e-government surveys (annex 1).
Current approaches to measuring e-government113. Various individual and composite indicators have been developed for assessing the status of e-gov-ernment. The scope of interest includes single countries, regions and global measurement. Some studies assess the use of ICT alone; others measure customer services through services offered via government websites. The latter range from simple services to more sophisticated issues of privacy and electronic voting.
114. Methodologies range from country-level surveys of government organizations, such as those shown in annex 1, to highly complex web-based surveys. The most comprehensive example of the latter is the United Nations e-Government Survey. It covers all United Nations member states and is carried out by UNDESA’s Division for Public Administration and Development Management.
115. Capgemini, on behalf of the European Commission, has published results of e-government bench-marking of European Union member states for a number of years (for example, Capgemini 2006, 2010). The main element of the study is an extensive website survey of organizations’ URLs that tracks services offered by government.
116. Several individual countries collect (or have collected) information on e-government, generally based on statistical surveys of government organizations. The content and standards are diverse. Coun-tries that have conducted e-government surveys (or plan to) include Australia, Brazil, Canada, the Czech Republic, Denmark, Egypt, Finland, Lebanon, Morocco, New Zealand, Nigeria, Norway, Oman, the Russian Federation and Sri Lanka. Annex 1 presents information about these surveys.
Data sources117. For the indicators proposed, different government agencies and different strategies may be used to collect data. For most countries, the most important method is likely to be the use of traditional ques-tionnaire-based surveys of government organizations. Some data may also be available from administra-tive sources or collectible from country-level website surveys (this is especially true of indicator EG7). A comparison of survey types can be found in table 3.
Sample surveys and censuses of government organizations118. Statistical surveys of government units, like business surveys, may be sample surveys or censuses. For many countries, censuses will be chosen because of the small number of government units in a country (compared to businesses, for example) and the difficulty of obtaining information about the whole population on which to base a sample design. If the minimal recommended scope (that is, central government) is used, a census is likely to be particularly beneficial and might be based on two-stage data collection whereby forms are sent to major government portfolio departments, which may then collect information from lower-level statistical units.
39Manual for measuring e-Government
119. Where a wider scope is chosen, sample surveys may be necessary, depending on the size and charac-teristics of the population. For example, some countries have a large number of local government entities that are reasonably homogeneous and are therefore able to be sampled efficiently.
120. The question of whether to conduct a sample survey or a census is also explored in chapter 7 – Survey design.
A particular case: survey modules in existing surveys121. Where existing surveys of government exist, then the core indicator questions could be added to those surveys. However, because surveys of government units are less common than household or busi-ness surveys, generally an existing survey vehicle will not be available. Even where surveys of government organizations do exist, data collected via a module will reflect the statistical characteristics of the survey vehicle (particularly the population frame and statistical units) and is unlikely to comply with the stand-ards in this manual.
122. There may be cost and other advantages to using a suitable survey vehicle where one already exists. In particular, the cost of collecting ICT data via a module in an existing survey is generally marginal to the costs associated with the survey vehicle. For example, staff involved in data processing are already trained and will require only complementary training on ICT questions. A potentially important advantage is that existing data items and classificatory variables can be cross-tabulated against ICT data to produce a richer dataset.
123. A review of country surveys (see annex 1) revealed only one instance of indicators being collected by a survey module in an existing survey.19
Administrative data124. Some countries may have administrative data collections of government that also collect data on ICT usage and Internet-based services. Data from such collections could be used where they comply with the standards in this manual. The great advantage of administrative data is that they are already available, possibly in respect of several years. However, the review of country surveys (see annex 1) revealed no instances of administrative data being used to collect core ICT indicator or similar data.
National experts125. For some countries, the core e-government indicators might be able to be compiled by experts who are knowledgeable in the ICT status of government in their country. This is particularly true of EG7, where it is suggested that data be compiled by website research. For the other indicators, compilation by experts may also be effective, although the standards applying to the indicators need to be understood – especially those pertaining to statistical units.
Website surveys126. The Web can be used to conduct traditional surveys of government organizations. In this case, it is a method of data collection and is dealt with in table 4. This section considers surveys of government websites aimed at measuring the level and availability of e-government services in a country.
19 The Czech Statistical Office Survey of ICT Usage in Public Administration.
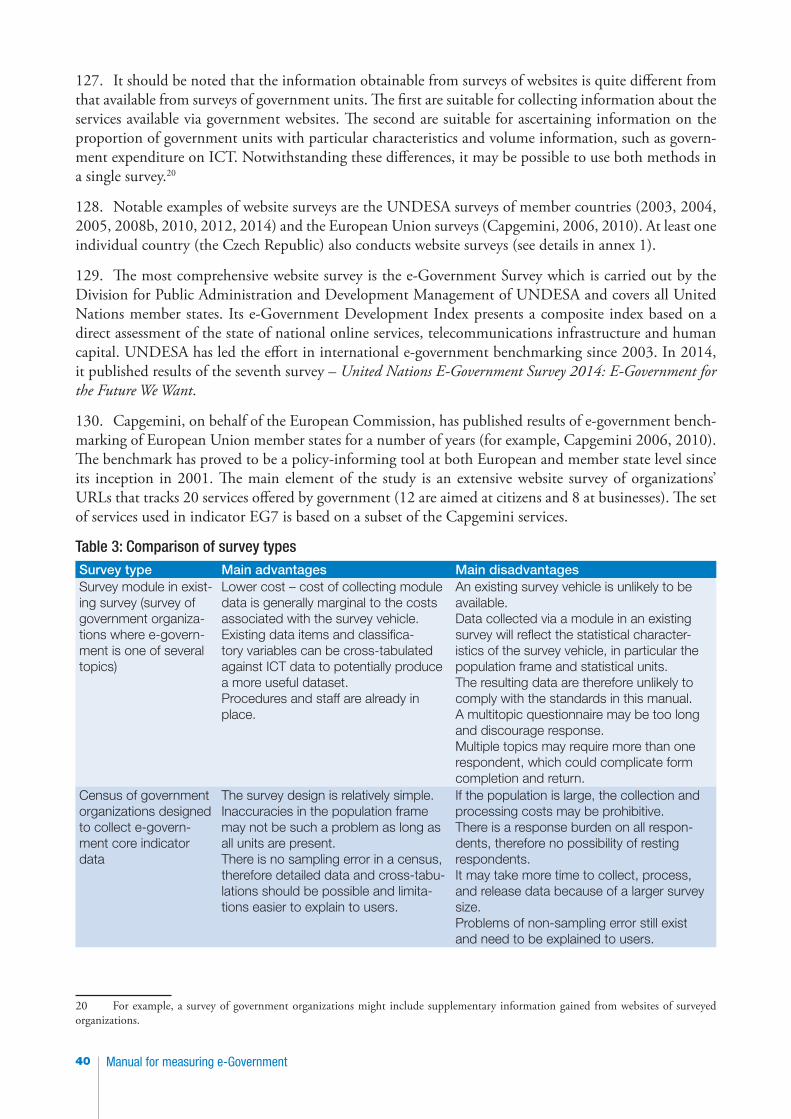
Manual for measuring e-Government40
127. It should be noted that the information obtainable from surveys of websites is quite different from that available from surveys of government units. The first are suitable for collecting information about the services available via government websites. The second are suitable for ascertaining information on the proportion of government units with particular characteristics and volume information, such as govern-ment expenditure on ICT. Notwithstanding these differences, it may be possible to use both methods in a single survey.20
128. Notable examples of website surveys are the UNDESA surveys of member countries (2003, 2004, 2005, 2008b, 2010, 2012, 2014) and the European Union surveys (Capgemini, 2006, 2010). At least one individual country (the Czech Republic) also conducts website surveys (see details in annex 1).
129. The most comprehensive website survey is the e-Government Survey which is carried out by the Division for Public Administration and Development Management of UNDESA and covers all United Nations member states. Its e-Government Development Index presents a composite index based on a direct assessment of the state of national online services, telecommunications infrastructure and human capital. UNDESA has led the effort in international e-government benchmarking since 2003. In 2014, it published results of the seventh survey – United Nations E-Government Survey 2014: E-Government for the Future We Want.
130. Capgemini, on behalf of the European Commission, has published results of e-government bench-marking of European Union member states for a number of years (for example, Capgemini 2006, 2010). The benchmark has proved to be a policy-informing tool at both European and member state level since its inception in 2001. The main element of the study is an extensive website survey of organizations’ URLs that tracks 20 services offered by government (12 are aimed at citizens and 8 at businesses). The set of services used in indicator EG7 is based on a subset of the Capgemini services.
Table 3: Comparison of survey typesSurvey type Main advantages Main disadvantagesSurvey module in exist-ing survey (survey of government organiza-tions where e-govern-ment is one of several topics)
Lower cost – cost of collecting module data is generally marginal to the costs associated with the survey vehicle.Existing data items and classifica-tory variables can be cross-tabulated against ICT data to potentially produce a more useful dataset.Procedures and staff are already in place.
An existing survey vehicle is unlikely to be available.Data collected via a module in an existing survey will reflect the statistical character-istics of the survey vehicle, in particular the population frame and statistical units. The resulting data are therefore unlikely to comply with the standards in this manual.A multitopic questionnaire may be too long and discourage response.Multiple topics may require more than one respondent, which could complicate form completion and return.
Census of government organizations designed to collect e-govern-ment core indicator data
The survey design is relatively simple.Inaccuracies in the population frame may not be such a problem as long as all units are present.There is no sampling error in a census, therefore detailed data and cross-tabu-lations should be possible and limita-tions easier to explain to users.
If the population is large, the collection and processing costs may be prohibitive.There is a response burden on all respon-dents, therefore no possibility of resting respondents.It may take more time to collect, process, and release data because of a larger survey size.Problems of non-sampling error still exist and need to be explained to users.
20 For example, a survey of government organizations might include supplementary information gained from websites of surveyed organizations.
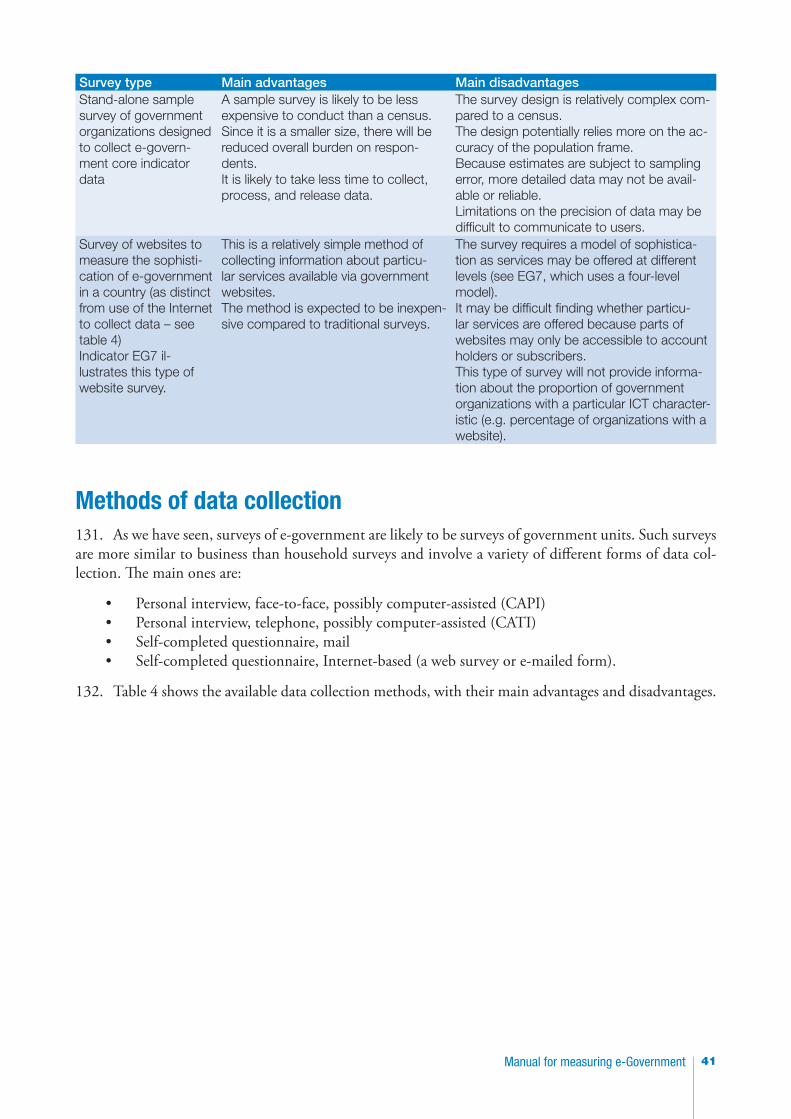
41Manual for measuring e-Government
Survey type Main advantages Main disadvantagesStand-alone sample survey of government organizations designed to collect e-govern-ment core indicator data
A sample survey is likely to be less expensive to conduct than a census.Since it is a smaller size, there will be reduced overall burden on respon-dents.It is likely to take less time to collect, process, and release data.
The survey design is relatively complex com-pared to a census.The design potentially relies more on the ac-curacy of the population frame.Because estimates are subject to sampling error, more detailed data may not be avail-able or reliable.Limitations on the precision of data may be difficult to communicate to users.
Survey of websites to measure the sophisti-cation of e-government in a country (as distinct from use of the Internet to collect data – see table 4)Indicator EG7 il-lustrates this type of website survey.
This is a relatively simple method of collecting information about particu-lar services available via government websites.The method is expected to be inexpen-sive compared to traditional surveys.
The survey requires a model of sophistica-tion as services may be offered at different levels (see EG7, which uses a four-level model).It may be difficult finding whether particu-lar services are offered because parts of websites may only be accessible to account holders or subscribers.This type of survey will not provide informa-tion about the proportion of government organizations with a particular ICT character-istic (e.g. percentage of organizations with a website).
Methods of data collection131. As we have seen, surveys of e-government are likely to be surveys of government units. Such surveys are more similar to business than household surveys and involve a variety of different forms of data col-lection. The main ones are:
• Personal interview, face-to-face, possibly computer-assisted (CAPI)• Personal interview, telephone, possibly computer-assisted (CATI)• Self-completed questionnaire, mail• Self-completed questionnaire, Internet-based (a web survey or e-mailed form).
132. Table 4 shows the available data collection methods, with their main advantages and disadvantages.
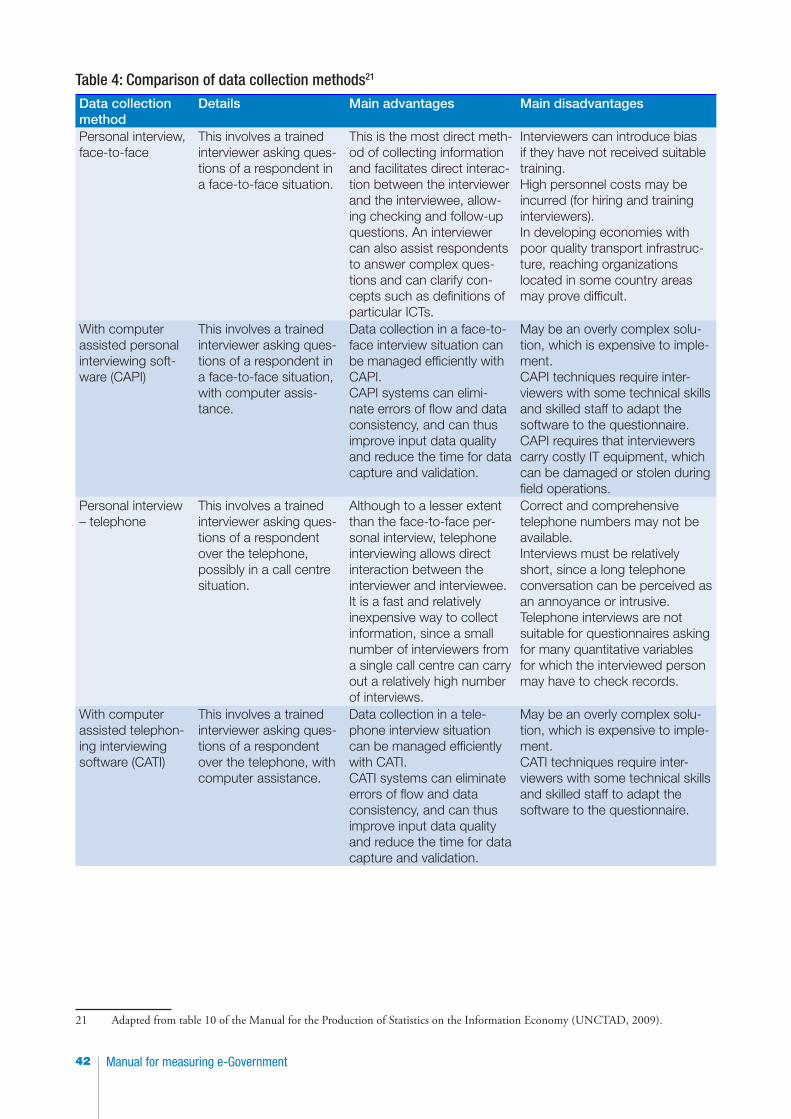
Manual for measuring e-Government42
Table 4: Comparison of data collection methods21
Data collection method
Details Main advantages Main disadvantages
Personal interview, face-to-face
This involves a trained interviewer asking ques-tions of a respondent in a face-to-face situation.
This is the most direct meth-od of collecting information and facilitates direct interac-tion between the interviewer and the interviewee, allow-ing checking and follow-up questions. An interviewer can also assist respondents to answer complex ques-tions and can clarify con-cepts such as definitions of particular ICTs.
Interviewers can introduce bias if they have not received suitable training. High personnel costs may be incurred (for hiring and training interviewers).In developing economies with poor quality transport infrastruc-ture, reaching organizations located in some country areas may prove difficult.
With computer assisted personal interviewing soft-ware (CAPI)
This involves a trained interviewer asking ques-tions of a respondent in a face-to-face situation, with computer assis-tance.
Data collection in a face-to-face interview situation can be managed efficiently with CAPI.CAPI systems can elimi-nate errors of flow and data consistency, and can thus improve input data quality and reduce the time for data capture and validation.
May be an overly complex solu-tion, which is expensive to imple-ment.CAPI techniques require inter-viewers with some technical skills and skilled staff to adapt the software to the questionnaire.CAPI requires that interviewers carry costly IT equipment, which can be damaged or stolen during field operations.
Personal interview – telephone
This involves a trained interviewer asking ques-tions of a respondent over the telephone, possibly in a call centre situation.
Although to a lesser extent than the face-to-face per-sonal interview, telephone interviewing allows direct interaction between the interviewer and interviewee. It is a fast and relatively inexpensive way to collect information, since a small number of interviewers from a single call centre can carry out a relatively high number of interviews.
Correct and comprehensive telephone numbers may not be available.Interviews must be relatively short, since a long telephone conversation can be perceived as an annoyance or intrusive. Telephone interviews are not suitable for questionnaires asking for many quantitative variables for which the interviewed person may have to check records.
With computer assisted telephon-ing interviewing software (CATI)
This involves a trained interviewer asking ques-tions of a respondent over the telephone, with computer assistance.
Data collection in a tele-phone interview situation can be managed efficiently with CATI.CATI systems can eliminate errors of flow and data consistency, and can thus improve input data quality and reduce the time for data capture and validation.
May be an overly complex solu-tion, which is expensive to imple-ment.CATI techniques require inter-viewers with some technical skills and skilled staff to adapt the software to the questionnaire.
21 Adapted from table 10 of the Manual for the Production of Statistics on the Information Economy (UNCTAD, 2009).
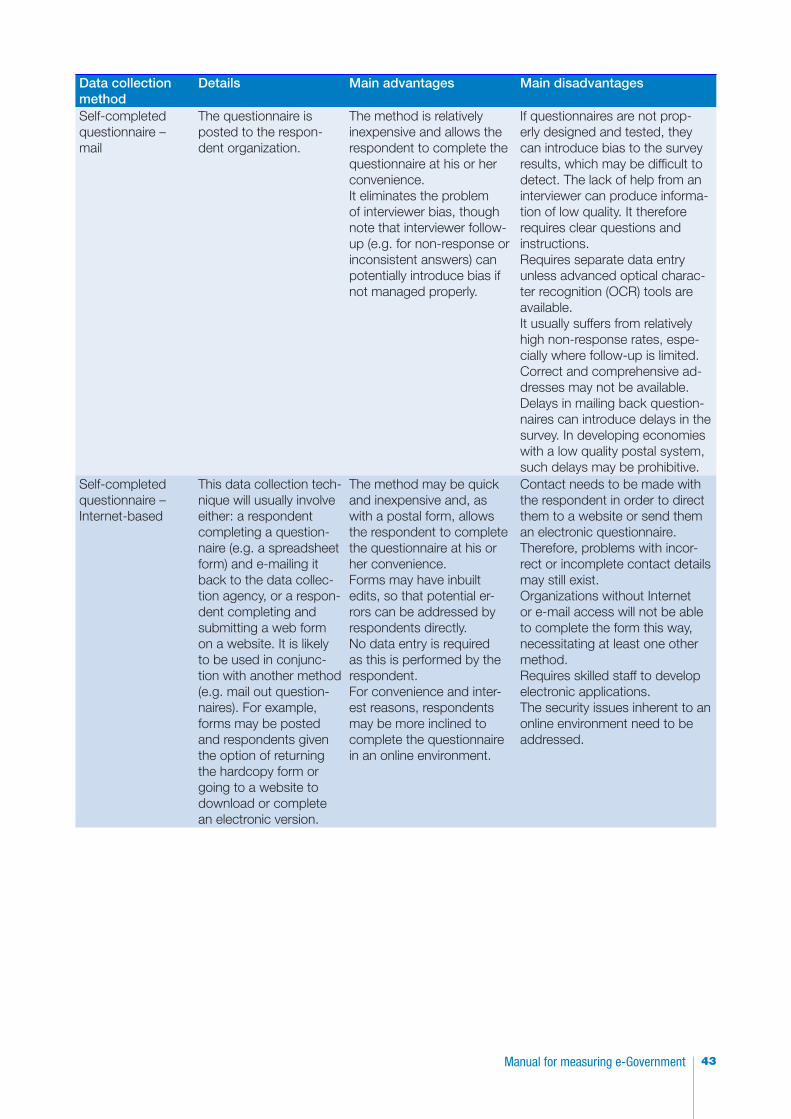
43Manual for measuring e-Government
Data collection method
Details Main advantages Main disadvantages
Self-completed questionnaire – mail
The questionnaire is posted to the respon-dent organization.
The method is relatively inexpensive and allows the respondent to complete the questionnaire at his or her convenience.It eliminates the problem of interviewer bias, though note that interviewer follow-up (e.g. for non-response or inconsistent answers) can potentially introduce bias if not managed properly.
If questionnaires are not prop-erly designed and tested, they can introduce bias to the survey results, which may be difficult to detect. The lack of help from an interviewer can produce informa-tion of low quality. It therefore requires clear questions and instructions.Requires separate data entry unless advanced optical charac-ter recognition (OCR) tools are available. It usually suffers from relatively high non-response rates, espe-cially where follow-up is limited.Correct and comprehensive ad-dresses may not be available.Delays in mailing back question-naires can introduce delays in the survey. In developing economies with a low quality postal system, such delays may be prohibitive.
Self-completed questionnaire – Internet-based
This data collection tech-nique will usually involve either: a respondent completing a question-naire (e.g. a spreadsheet form) and e-mailing it back to the data collec-tion agency, or a respon-dent completing and submitting a web form on a website. It is likely to be used in conjunc-tion with another method (e.g. mail out question-naires). For example, forms may be posted and respondents given the option of returning the hardcopy form or going to a website to download or complete an electronic version.
The method may be quick and inexpensive and, as with a postal form, allows the respondent to complete the questionnaire at his or her convenience.Forms may have inbuilt edits, so that potential er-rors can be addressed by respondents directly.No data entry is required as this is performed by the respondent.For convenience and inter-est reasons, respondents may be more inclined to complete the questionnaire in an online environment.
Contact needs to be made with the respondent in order to direct them to a website or send them an electronic questionnaire. Therefore, problems with incor-rect or incomplete contact details may still exist.Organizations without Internet or e-mail access will not be able to complete the form this way, necessitating at least one other method.Requires skilled staff to develop electronic applications.The security issues inherent to an online environment need to be addressed.

Manual for measuring e-Government44
Chapter 6: Question and questionnaire design and content
133. This chapter provides general information on question and questionnaire design. It presents model questions for the core indicators, EG1 to EG7, and related information – such as how questions might be included in a questionnaire, reference dates, notes on respondents, supplementary data requirements and difficult concepts. Finally, the chapter looks at e-government measurement topics apart from the core e-government indicators.
134. There is no known authority on questionnaire design for government units, therefore the informa-tion in this chapter is based on broad principles applying to all types of questionnaires, in particular those applying to questionnaires designed for businesses.
General principles of question and questionnaire design135. Surveys of government units will generally be fairly similar to business surveys in terms of question-naire design. Information in this section has been taken from several sources, including UNCTAD (2009) and ITU (2009). References are also made to general information on design and testing of business survey questionnaires, including from the United States Census Bureau (2008), the Australian Bureau of Statis-tics (2010) and chapter 5 of Statistics Canada (2010).
136. It can be very difficult to design a questionnaire that collects high quality data efficiently, whilst encouraging respondent participation. The results of poor questionnaire design can be significant in terms of cost and time, as well as data quality. It is therefore very important that design is undertaken carefully and that sufficient time is allowed for thorough testing of draft questions and questionnaires.
137. The format of questionnaires will vary according to the method of data collection. However, most of the general principles presented here apply to both surveys administered by interviewers and self-enu-merated questionnaires. There will be differences of detail between paper-based and electronic surveys. For example, web-based forms:
• Can use links and therefore provide more information while appearing less cluttered• Enable navigation based on responses• May differ in font and style.
138. Issues that need to be taken into consideration when designing questionnaires include:
• Maintain respondents’ interest and motivation to complete the form by:• explaining clearly the objectives of the survey• assuring the confidentiality of responses• providing sufficient time for respondents to receive, complete and return the questionnaire
(if mail-based)• avoiding complicated questions.
• Use appropriate language:• provide definitions and explanations of technical terms• prevent bias due to poor wording of questions• avoid the use of acronyms and abbreviations unless they are defined and well understood• cater for different official languages to avoid misunderstanding of the language used.
• Have a clear logical flow:

45Manual for measuring e-Government
• use filter questions to lead a respondent to relevant questions and allow respondents to skip irrelevant questions
• order questions coherently to assist respondents’ understanding (for example, by grouping into topics).22
• Pay attention to the layout and size of the questionnaire:• use separate sections to distinguish topics• optimize visual display to aid understanding and usability• maintain respondents’ cooperation by having a relatively short questionnaire.
• Include good instructions and prompts to interviewers (where used).
139. A vital element of questionnaire design is testing whether questions work in practice. Individual questions and whole questionnaires should be thoroughly tested before use in a survey. Testing should be done with potential respondents to find out whether the questions can be understood and answered accurately and whether respondents have a common understanding of the meaning of the questions.
140. Question and questionnaire testing can be done in up to three stages:
• Pre-testing individual questions or modules of the questionnaire on a small number of respond-ents (this may occur a number of times). Such testing would generally be qualitative and involve individual potential respondents or focus groups. It might involve asking survey questions and then probing the respondent to ascertain how he or she interpreted the questions and whether the information is readily available for their organization.
• A pilot test of the complete questionnaire involves a larger number of respondents, who are pref-erably selected to be reasonably representative of the population under investigation. Results of pilot testing can provide information useful for a number of purposes, including planning and budgeting, question effectiveness and the flow of questions.
• A large survey may also involve a final dress rehearsal (or field test) that tests all aspects of the survey, including procedures. As well as further testing questions and the questionnaire struc-ture, a dress rehearsal can provide valuable information on costs, the adequacy of training and documentation, and the need for fine-tuning of timetables. It is considered unlikely that surveys of government organizations would require a dress rehearsal.
141. Testing of a set of draft questions at an early stage can also assist planning and budgeting as described in chapter 3. For example, testing might indicate that a poor understanding of ICT concepts would require more follow-up and query action to be undertaken by the data collection agency.
142. The question elements of a questionnaire include:
• Actual questions• Boxes of appropriate size to record responses (for instance, Yes and No tick boxes)• Sufficient space to enter numerical data and text information (for example, number of employed
persons, URL of main web presence)• Instructions and definitions relating to each question or group of questions (for example, defini-
tions of terms, instructions on what to include and exclude).
143. A questionnaire also has a number of essential non-question elements. They may include:
• A front page containing information, such as the name and reference period of the survey, the name of the collection agency, a due date for provision of information, how the questionnaire should be submitted (for example, posted back, completed via a web form), information on the purpose of the survey, how respondents can obtain results of the survey, how to obtain assistance with completing the form, space to provide details of the person completing the form
22 As explained below, these may be conflicting and it may not be possible to achieve both.
Manual for measuring e-Government46
(for example, phone number, e-mail address, signature) and legal obligations (applying to both the collection agency and respondent agencies). While such information can also be provided on a separate document, such as a covering letter or instruction sheet, it is recommended that as much basic information as possible be included on the questionnaire itself. A covering letter may be useful in conveying information such as requests from the agency head or another authoritative figure to support the survey.
• An identifier for each variant of a questionnaire (for example one for central government and one for state government if the questionnaires differ) may be relevant.
• Information about responding organizations would possibly be printed on each form. This could include unique identifiers and name and address information.
• Office use only space might be useful for interviewers, data entry and processing staff to record information.
• General instructions to respondents. These may include instructions on marking boxes (for example, with a tick), type of marking (for example, use black ballpoint pen), how to correct errors (for example, “strikethrough and write the correct answer above the box”).
• Feedback information designed to measure respondent burden (for example, by asking how much time it took to complete the form) and capture information on data provided and prob-lems encountered.
• If optical character recognition (OCR), intelligent character recognition (ICR) or optical mark reading (OMR) software are used to convert responses on a paper questionnaire to a computer record, there may be need for additional information on the form (such as a page identifier) or a particular style of layout.
Model questions144. The boxes below show each of the core indicators with its model question(s), definitions of terms used in the question, reference date and method of data collection. The model questions should be trans-lated into local languages and adapted for other conditions, such as cultural norms. However, in order to respect international comparability, care must be taken that translations do not alter the meaning of the questions or inherent logic of questionnaires used.
145. Countries may wish to vary aspects of the questions, for example, splitting size categories. This is acceptable if data can be re-aggregated to conform to the standards in this manual.
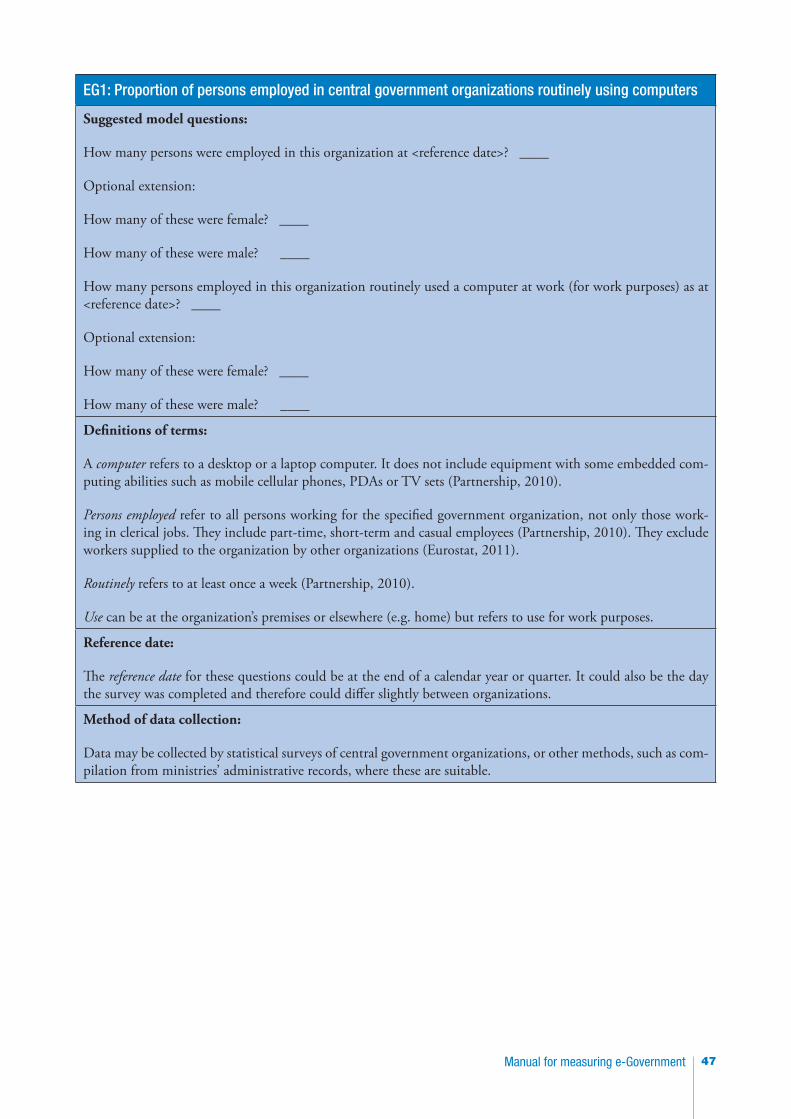
47Manual for measuring e-Government
EG1: Proportion of persons employed in central government organizations routinely using computers
Suggested model questions:
How many persons were employed in this organization at <reference date>? ____
Optional extension:
How many of these were female? ____
How many of these were male? ____
How many persons employed in this organization routinely used a computer at work (for work purposes) as at <reference date>? ____
Optional extension:
How many of these were female? ____
How many of these were male? ____
Definitions of terms:
A computer refers to a desktop or a laptop computer. It does not include equipment with some embedded com-puting abilities such as mobile cellular phones, PDAs or TV sets (Partnership, 2010).
Persons employed refer to all persons working for the specified government organization, not only those work-ing in clerical jobs. They include part-time, short-term and casual employees (Partnership, 2010). They exclude workers supplied to the organization by other organizations (Eurostat, 2011).
Routinely refers to at least once a week (Partnership, 2010).
Use can be at the organization’s premises or elsewhere (e.g. home) but refers to use for work purposes.
Reference date:
The reference date for these questions could be at the end of a calendar year or quarter. It could also be the day the survey was completed and therefore could differ slightly between organizations.
Method of data collection:
Data may be collected by statistical surveys of central government organizations, or other methods, such as com-pilation from ministries’ administrative records, where these are suitable.
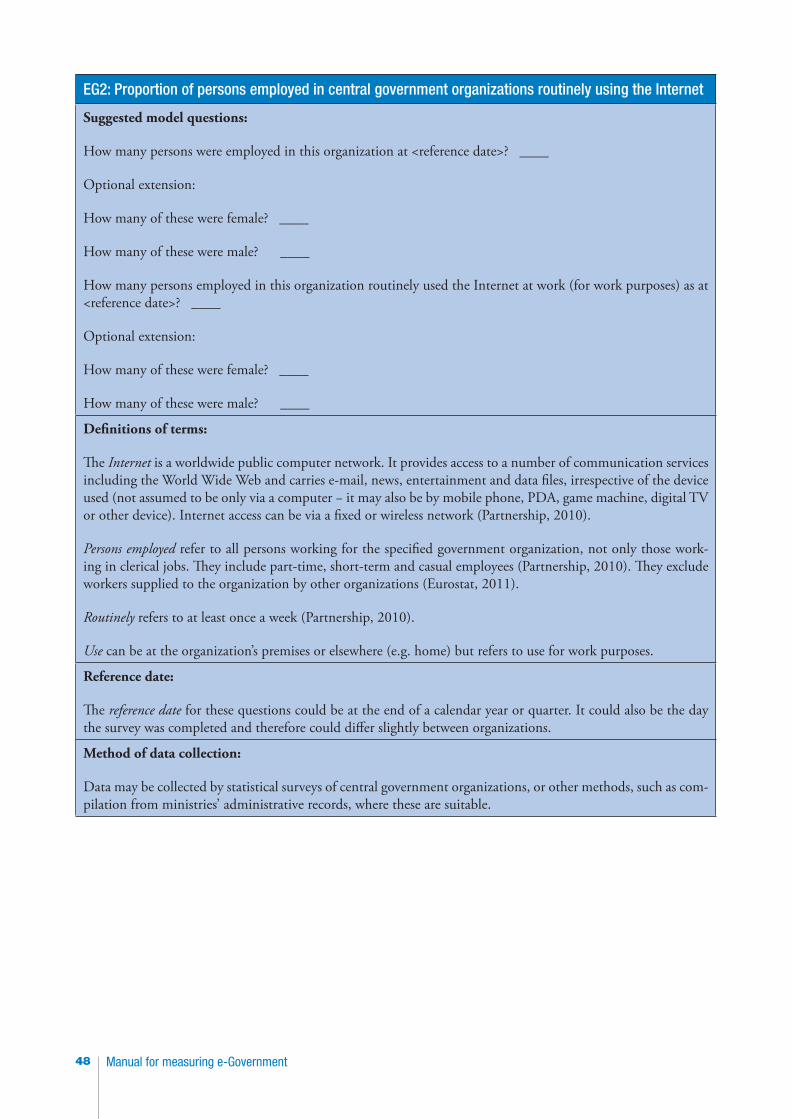
Manual for measuring e-Government48
EG2: Proportion of persons employed in central government organizations routinely using the Internet
Suggested model questions:
How many persons were employed in this organization at <reference date>? ____
Optional extension:
How many of these were female? ____
How many of these were male? ____
How many persons employed in this organization routinely used the Internet at work (for work purposes) as at <reference date>? ____
Optional extension:
How many of these were female? ____
How many of these were male? ____
Definitions of terms:
The Internet is a worldwide public computer network. It provides access to a number of communication services including the World Wide Web and carries e-mail, news, entertainment and data files, irrespective of the device used (not assumed to be only via a computer − it may also be by mobile phone, PDA, game machine, digital TV or other device). Internet access can be via a fixed or wireless network (Partnership, 2010).
Persons employed refer to all persons working for the specified government organization, not only those work-ing in clerical jobs. They include part-time, short-term and casual employees (Partnership, 2010). They exclude workers supplied to the organization by other organizations (Eurostat, 2011).
Routinely refers to at least once a week (Partnership, 2010).
Use can be at the organization’s premises or elsewhere (e.g. home) but refers to use for work purposes.
Reference date:
The reference date for these questions could be at the end of a calendar year or quarter. It could also be the day the survey was completed and therefore could differ slightly between organizations.
Method of data collection:
Data may be collected by statistical surveys of central government organizations, or other methods, such as com-pilation from ministries’ administrative records, where these are suitable.
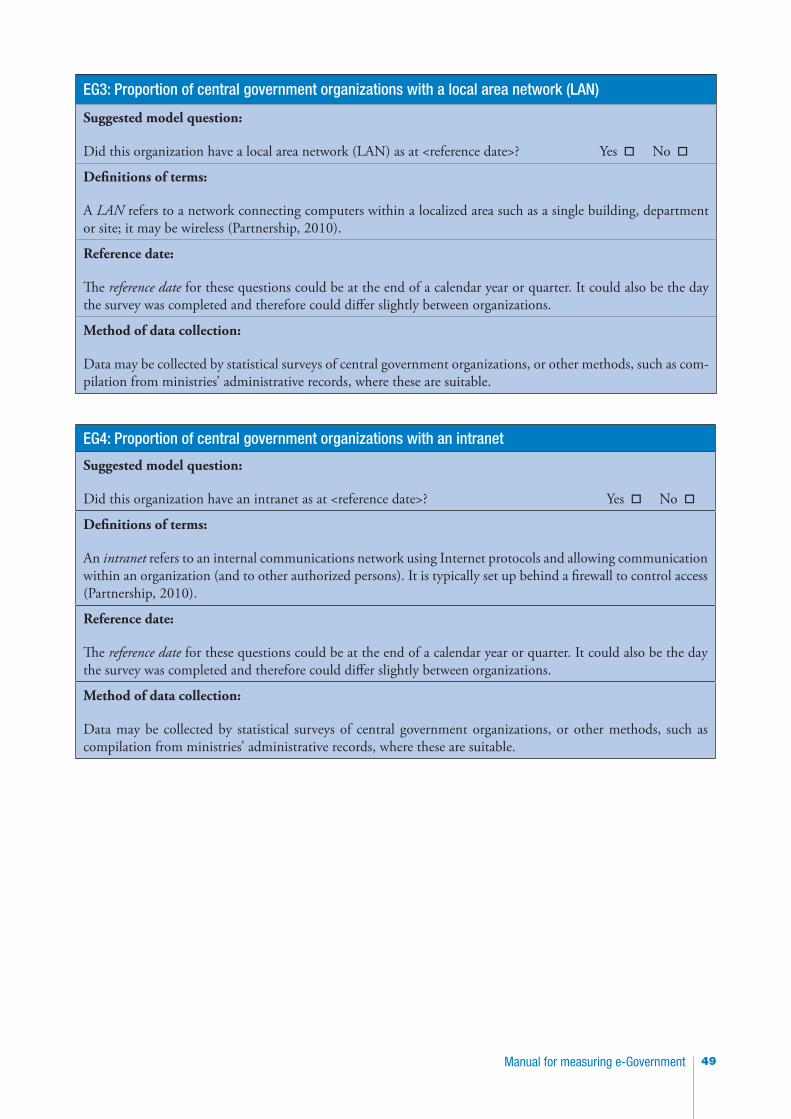
49Manual for measuring e-Government
EG3: Proportion of central government organizations with a local area network (LAN)
Suggested model question:
Did this organization have a local area network (LAN) as at <reference date>? Yes □ No □
Definitions of terms:
A LAN refers to a network connecting computers within a localized area such as a single building, department or site; it may be wireless (Partnership, 2010).
Reference date:
The reference date for these questions could be at the end of a calendar year or quarter. It could also be the day the survey was completed and therefore could differ slightly between organizations.
Method of data collection:
Data may be collected by statistical surveys of central government organizations, or other methods, such as com-pilation from ministries’ administrative records, where these are suitable.
EG4: Proportion of central government organizations with an intranet
Suggested model question:
Did this organization have an intranet as at <reference date>? Yes □ No □
Definitions of terms:
An intranet refers to an internal communications network using Internet protocols and allowing communication within an organization (and to other authorized persons). It is typically set up behind a firewall to control access (Partnership, 2010).
Reference date:
The reference date for these questions could be at the end of a calendar year or quarter. It could also be the day the survey was completed and therefore could differ slightly between organizations.
Method of data collection:
Data may be collected by statistical surveys of central government organizations, or other methods, such as compilation from ministries’ administrative records, where these are suitable.
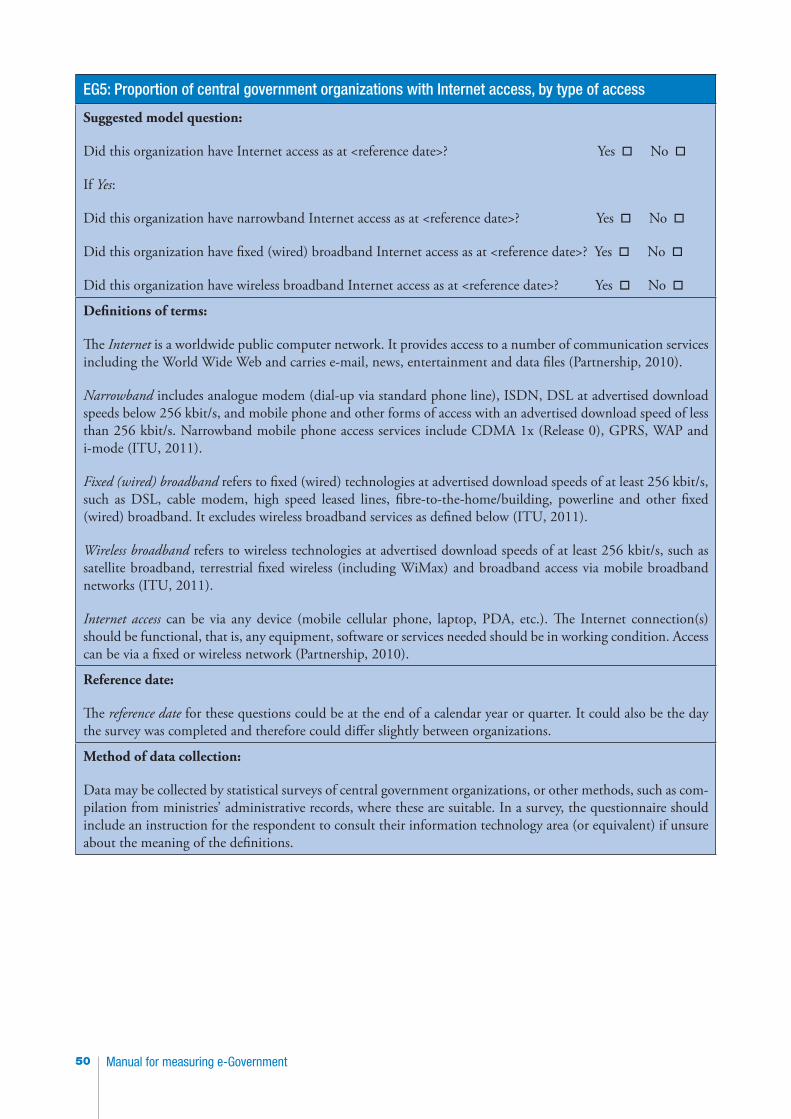
Manual for measuring e-Government50
EG5: Proportion of central government organizations with Internet access, by type of access
Suggested model question:
Did this organization have Internet access as at <reference date>? Yes □ No □
If Yes:
Did this organization have narrowband Internet access as at <reference date>? Yes □ No □
Did this organization have fixed (wired) broadband Internet access as at <reference date>? Yes □ No □
Did this organization have wireless broadband Internet access as at <reference date>? Yes □ No □
Definitions of terms:
The Internet is a worldwide public computer network. It provides access to a number of communication services including the World Wide Web and carries e-mail, news, entertainment and data files (Partnership, 2010).
Narrowband includes analogue modem (dial-up via standard phone line), ISDN, DSL at advertised download speeds below 256 kbit/s, and mobile phone and other forms of access with an advertised download speed of less than 256 kbit/s. Narrowband mobile phone access services include CDMA 1x (Release 0), GPRS, WAP and i-mode (ITU, 2011).
Fixed (wired) broadband refers to fixed (wired) technologies at advertised download speeds of at least 256 kbit/s, such as DSL, cable modem, high speed leased lines, fibre-to-the-home/building, powerline and other fixed (wired) broadband. It excludes wireless broadband services as defined below (ITU, 2011).
Wireless broadband refers to wireless technologies at advertised download speeds of at least 256 kbit/s, such as satellite broadband, terrestrial fixed wireless (including WiMax) and broadband access via mobile broadband networks (ITU, 2011).
Internet access can be via any device (mobile cellular phone, laptop, PDA, etc.). The Internet connection(s) should be functional, that is, any equipment, software or services needed should be in working condition. Access can be via a fixed or wireless network (Partnership, 2010).
Reference date:
The reference date for these questions could be at the end of a calendar year or quarter. It could also be the day the survey was completed and therefore could differ slightly between organizations.
Method of data collection:
Data may be collected by statistical surveys of central government organizations, or other methods, such as com-pilation from ministries’ administrative records, where these are suitable. In a survey, the questionnaire should include an instruction for the respondent to consult their information technology area (or equivalent) if unsure about the meaning of the definitions.
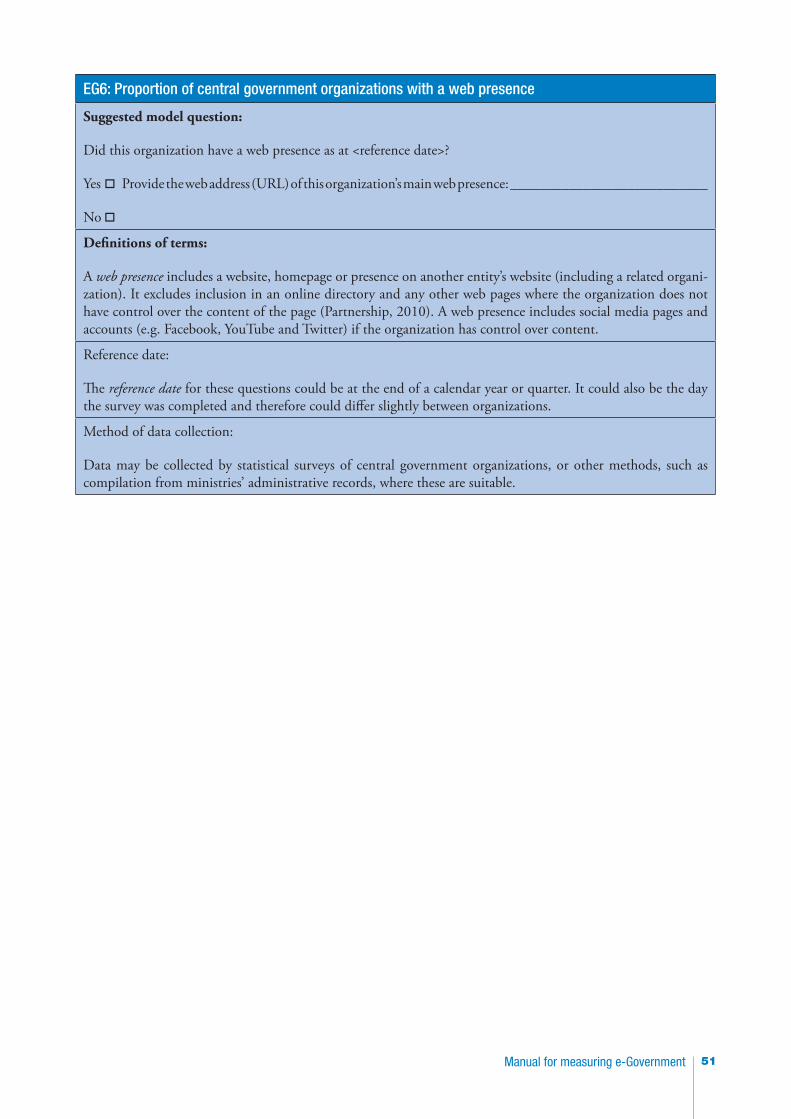
51Manual for measuring e-Government
EG6: Proportion of central government organizations with a web presence
Suggested model question:
Did this organization have a web presence as at <reference date>?
Yes □ Provide the web address (URL) of this organization’s main web presence: ___________________________
No □
Definitions of terms:
A web presence includes a website, homepage or presence on another entity’s website (including a related organi-zation). It excludes inclusion in an online directory and any other web pages where the organization does not have control over the content of the page (Partnership, 2010). A web presence includes social media pages and accounts (e.g. Facebook, YouTube and Twitter) if the organization has control over content.
Reference date:
The reference date for these questions could be at the end of a calendar year or quarter. It could also be the day the survey was completed and therefore could differ slightly between organizations.
Method of data collection:
Data may be collected by statistical surveys of central government organizations, or other methods, such as compilation from ministries’ administrative records, where these are suitable.
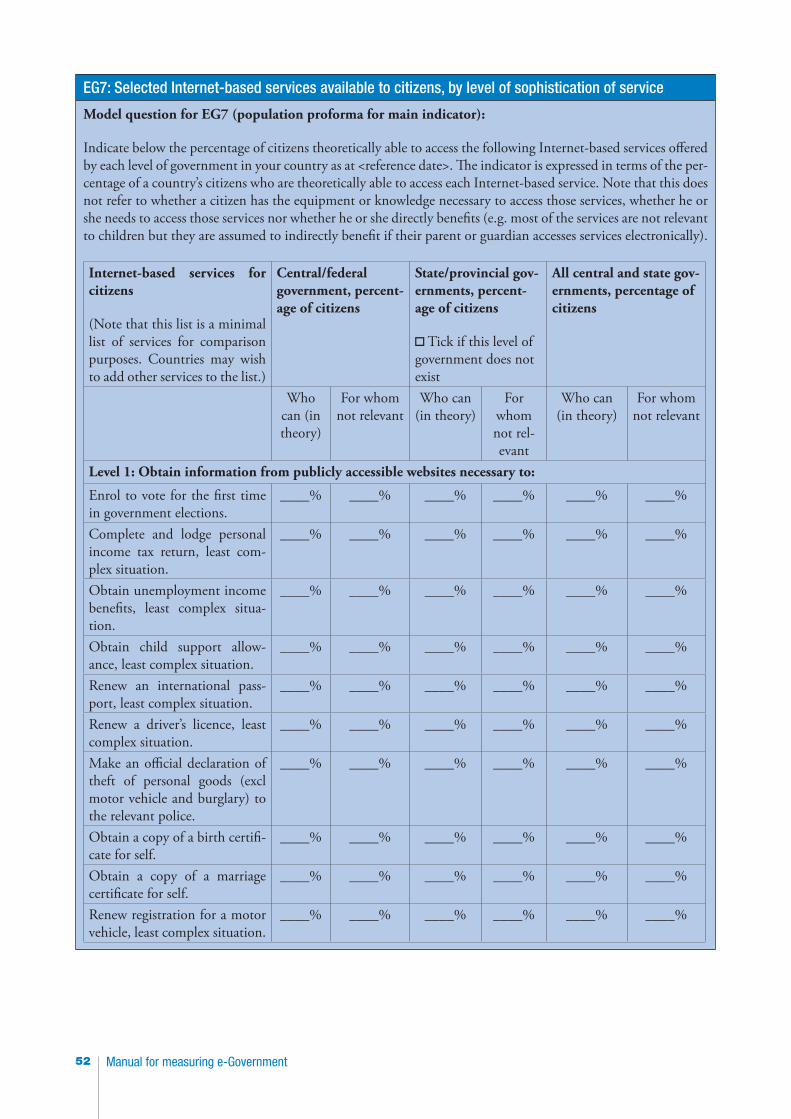
Manual for measuring e-Government52
EG7: Selected Internet-based services available to citizens, by level of sophistication of service
Model question for EG7 (population proforma for main indicator):
Indicate below the percentage of citizens theoretically able to access the following Internet-based services offered by each level of government in your country as at <reference date>. The indicator is expressed in terms of the per-centage of a country’s citizens who are theoretically able to access each Internet-based service. Note that this does not refer to whether a citizen has the equipment or knowledge necessary to access those services, whether he or she needs to access those services nor whether he or she directly benefits (e.g. most of the services are not relevant to children but they are assumed to indirectly benefit if their parent or guardian accesses services electronically).
Internet-based services for citizens
(Note that this list is a minimal list of services for comparison purposes. Countries may wish to add other services to the list.)
Central/federal government, percent-age of citizens
State/provincial gov-ernments, percent-age of citizens
□ Tick if this level of government does not exist
All central and state gov-ernments, percentage of citizens
Who can (in theory)
For whom not relevant
Who can (in theory)
For whom not rel-evant
Who can (in theory)
For whom not relevant
Level 1: Obtain information from publicly accessible websites necessary to:
Enrol to vote for the first time in government elections.
____% ____% ____% ____% ____% ____%
Complete and lodge personal income tax return, least com-plex situation.
____% ____% ____% ____% ____% ____%
Obtain unemployment income benefits, least complex situa-tion.
____% ____% ____% ____% ____% ____%
Obtain child support allow-ance, least complex situation.
____% ____% ____% ____% ____% ____%
Renew an international pass-port, least complex situation.
____% ____% ____% ____% ____% ____%
Renew a driver’s licence, least complex situation.
____% ____% ____% ____% ____% ____%
Make an official declaration of theft of personal goods (excl motor vehicle and burglary) to the relevant police.
____% ____% ____% ____% ____% ____%
Obtain a copy of a birth certifi-cate for self.
____% ____% ____% ____% ____% ____%
Obtain a copy of a marriage certificate for self.
____% ____% ____% ____% ____% ____%
Renew registration for a motor vehicle, least complex situation.
____% ____% ____% ____% ____% ____%
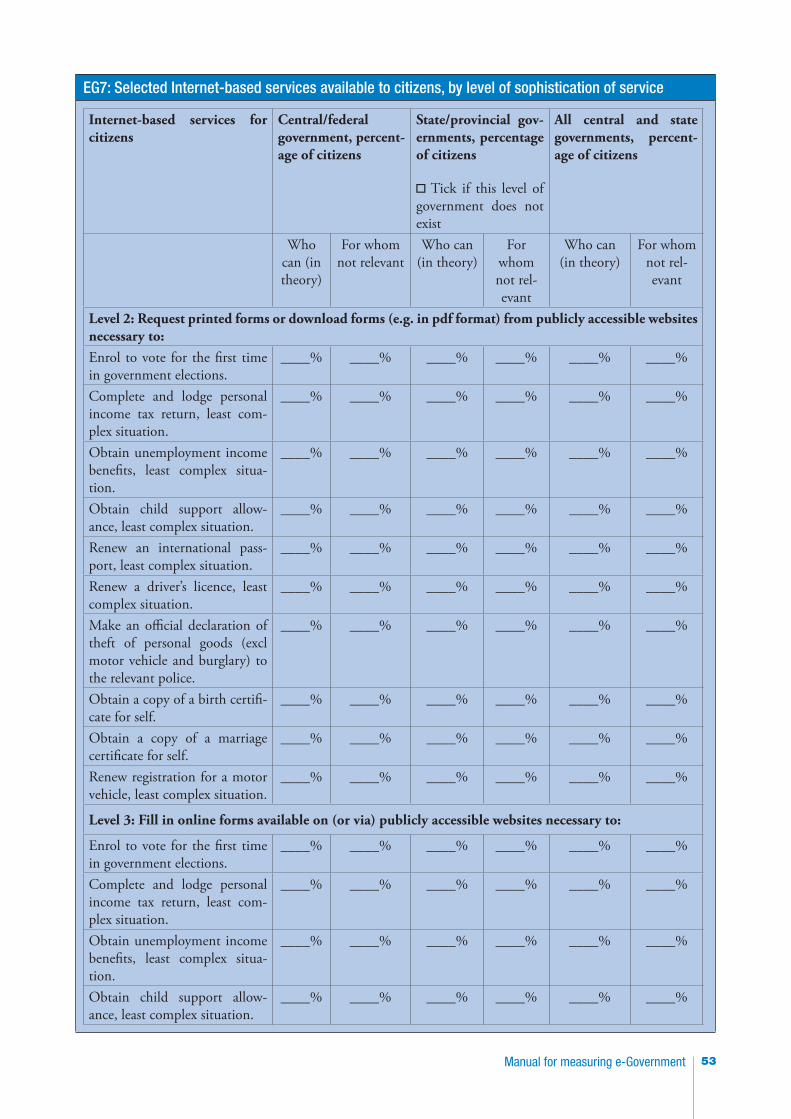
53Manual for measuring e-Government
EG7: Selected Internet-based services available to citizens, by level of sophistication of service
Internet-based services for citizens
Central/federal government, percent-age of citizens
State/provincial gov-ernments, percentage of citizens
□ Tick if this level of government does not exist
All central and state governments, percent-age of citizens
Who can (in theory)
For whom not relevant
Who can (in theory)
For whom not rel-evant
Who can (in theory)
For whom not rel-evant
Level 2: Request printed forms or download forms (e.g. in pdf format) from publicly accessible websites necessary to:Enrol to vote for the first time in government elections.
____% ____% ____% ____% ____% ____%
Complete and lodge personal income tax return, least com-plex situation.
____% ____% ____% ____% ____% ____%
Obtain unemployment income benefits, least complex situa-tion.
____% ____% ____% ____% ____% ____%
Obtain child support allow-ance, least complex situation.
____% ____% ____% ____% ____% ____%
Renew an international pass-port, least complex situation.
____% ____% ____% ____% ____% ____%
Renew a driver’s licence, least complex situation.
____% ____% ____% ____% ____% ____%
Make an official declaration of theft of personal goods (excl motor vehicle and burglary) to the relevant police.
____% ____% ____% ____% ____% ____%
Obtain a copy of a birth certifi-cate for self.
____% ____% ____% ____% ____% ____%
Obtain a copy of a marriage certificate for self.
____% ____% ____% ____% ____% ____%
Renew registration for a motor vehicle, least complex situation.
____% ____% ____% ____% ____% ____%
Level 3: Fill in online forms available on (or via) publicly accessible websites necessary to:
Enrol to vote for the first time in government elections.
____% ____% ____% ____% ____% ____%
Complete and lodge personal income tax return, least com-plex situation.
____% ____% ____% ____% ____% ____%
Obtain unemployment income benefits, least complex situa-tion.
____% ____% ____% ____% ____% ____%
Obtain child support allow-ance, least complex situation.
____% ____% ____% ____% ____% ____%
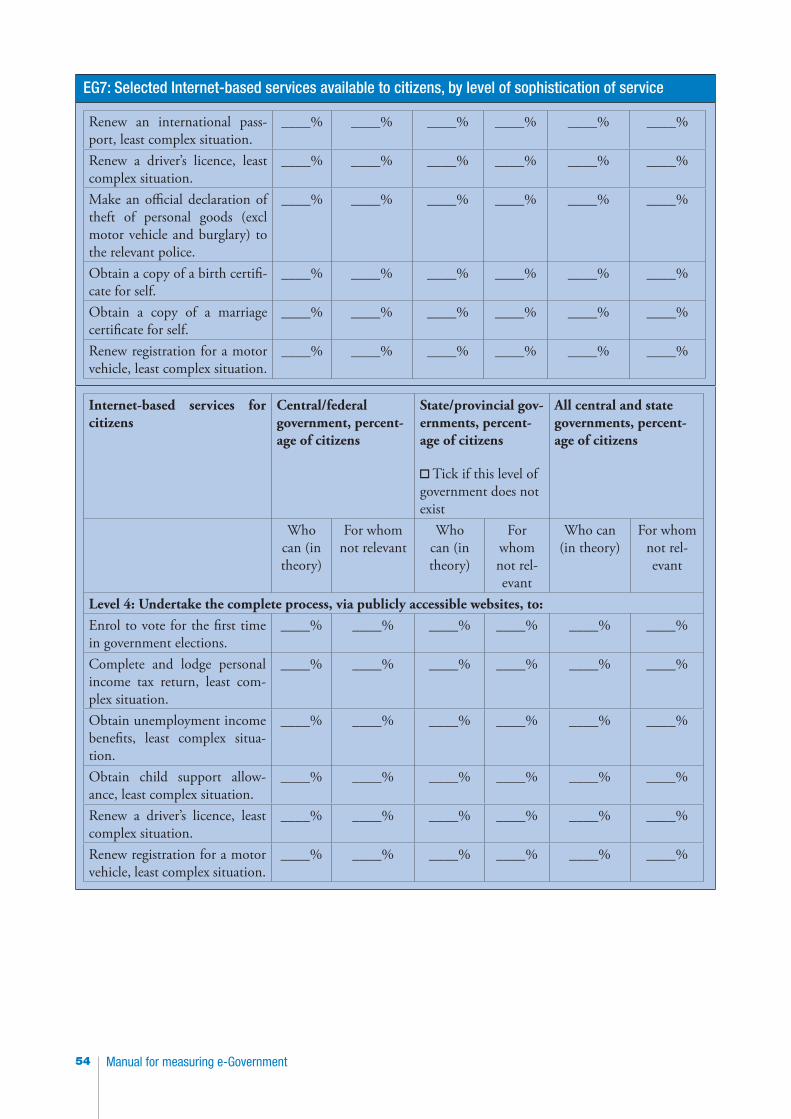
Manual for measuring e-Government54
EG7: Selected Internet-based services available to citizens, by level of sophistication of service
Renew an international pass-port, least complex situation.
____% ____% ____% ____% ____% ____%
Renew a driver’s licence, least complex situation.
____% ____% ____% ____% ____% ____%
Make an official declaration of theft of personal goods (excl motor vehicle and burglary) to the relevant police.
____% ____% ____% ____% ____% ____%
Obtain a copy of a birth certifi-cate for self.
____% ____% ____% ____% ____% ____%
Obtain a copy of a marriage certificate for self.
____% ____% ____% ____% ____% ____%
Renew registration for a motor vehicle, least complex situation.
____% ____% ____% ____% ____% ____%
Internet-based services for citizens
Central/federal government, percent-age of citizens
State/provincial gov-ernments, percent-age of citizens
□ Tick if this level of government does not exist
All central and state governments, percent-age of citizens
Who can (in theory)
For whom not relevant
Who can (in theory)
For whom not rel-evant
Who can (in theory)
For whom not rel-evant
Level 4: Undertake the complete process, via publicly accessible websites, to:Enrol to vote for the first time in government elections.
____% ____% ____% ____% ____% ____%
Complete and lodge personal income tax return, least com-plex situation.
____% ____% ____% ____% ____% ____%
Obtain unemployment income benefits, least complex situa-tion.
____% ____% ____% ____% ____% ____%
Obtain child support allow-ance, least complex situation.
____% ____% ____% ____% ____% ____%
Renew a driver’s licence, least complex situation.
____% ____% ____% ____% ____% ____%
Renew registration for a motor vehicle, least complex situation.
____% ____% ____% ____% ____% ____%
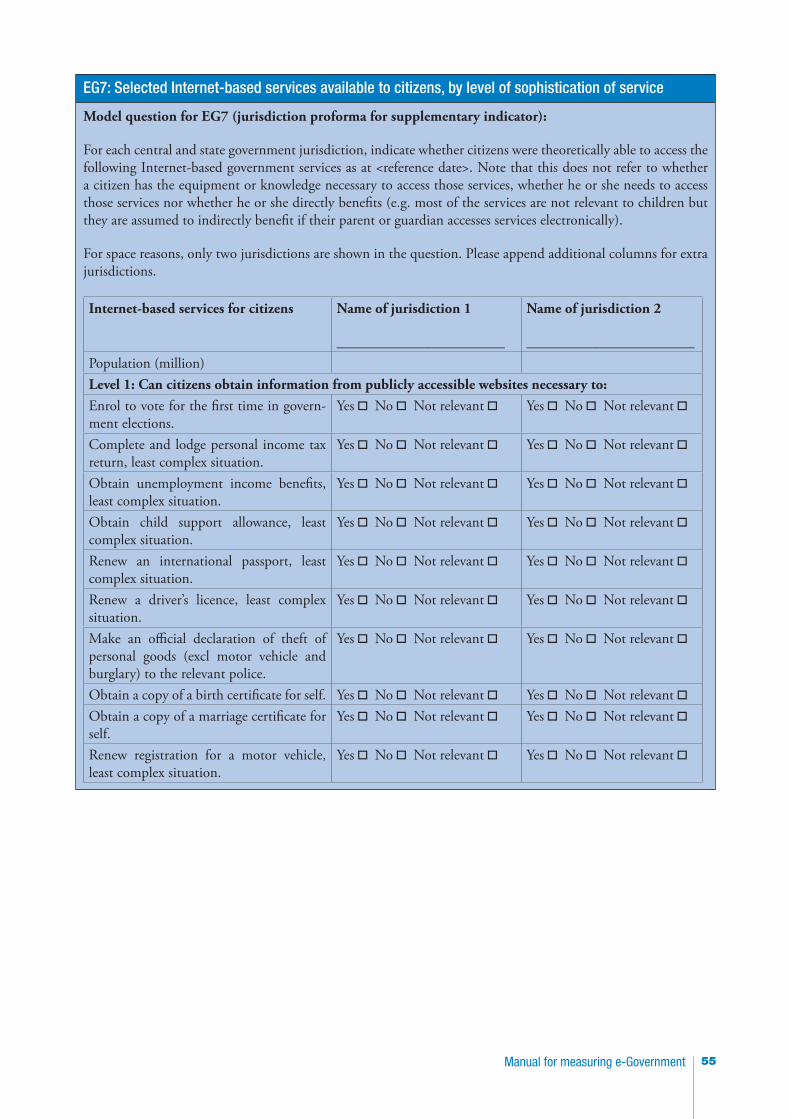
55Manual for measuring e-Government
EG7: Selected Internet-based services available to citizens, by level of sophistication of service
Model question for EG7 (jurisdiction proforma for supplementary indicator):
For each central and state government jurisdiction, indicate whether citizens were theoretically able to access the following Internet-based government services as at <reference date>. Note that this does not refer to whether a citizen has the equipment or knowledge necessary to access those services, whether he or she needs to access those services nor whether he or she directly benefits (e.g. most of the services are not relevant to children but they are assumed to indirectly benefit if their parent or guardian accesses services electronically).
For space reasons, only two jurisdictions are shown in the question. Please append additional columns for extra jurisdictions.
Internet-based services for citizens Name of jurisdiction 1
_______________________
Name of jurisdiction 2
_______________________Population (million)Level 1: Can citizens obtain information from publicly accessible websites necessary to:Enrol to vote for the first time in govern-ment elections.
Yes □ No □ Not relevant □ Yes □ No □ Not relevant □
Complete and lodge personal income tax return, least complex situation.
Yes □ No □ Not relevant □ Yes □ No □ Not relevant □
Obtain unemployment income benefits, least complex situation.
Yes □ No □ Not relevant □ Yes □ No □ Not relevant □
Obtain child support allowance, least complex situation.
Yes □ No □ Not relevant □ Yes □ No □ Not relevant □
Renew an international passport, least complex situation.
Yes □ No □ Not relevant □ Yes □ No □ Not relevant □
Renew a driver’s licence, least complex situation.
Yes □ No □ Not relevant □ Yes □ No □ Not relevant □
Make an official declaration of theft of personal goods (excl motor vehicle and burglary) to the relevant police.
Yes □ No □ Not relevant □ Yes □ No □ Not relevant □
Obtain a copy of a birth certificate for self. Yes □ No □ Not relevant □ Yes □ No □ Not relevant □Obtain a copy of a marriage certificate for self.
Yes □ No □ Not relevant □ Yes □ No □ Not relevant □
Renew registration for a motor vehicle, least complex situation.
Yes □ No □ Not relevant □ Yes □ No □ Not relevant □
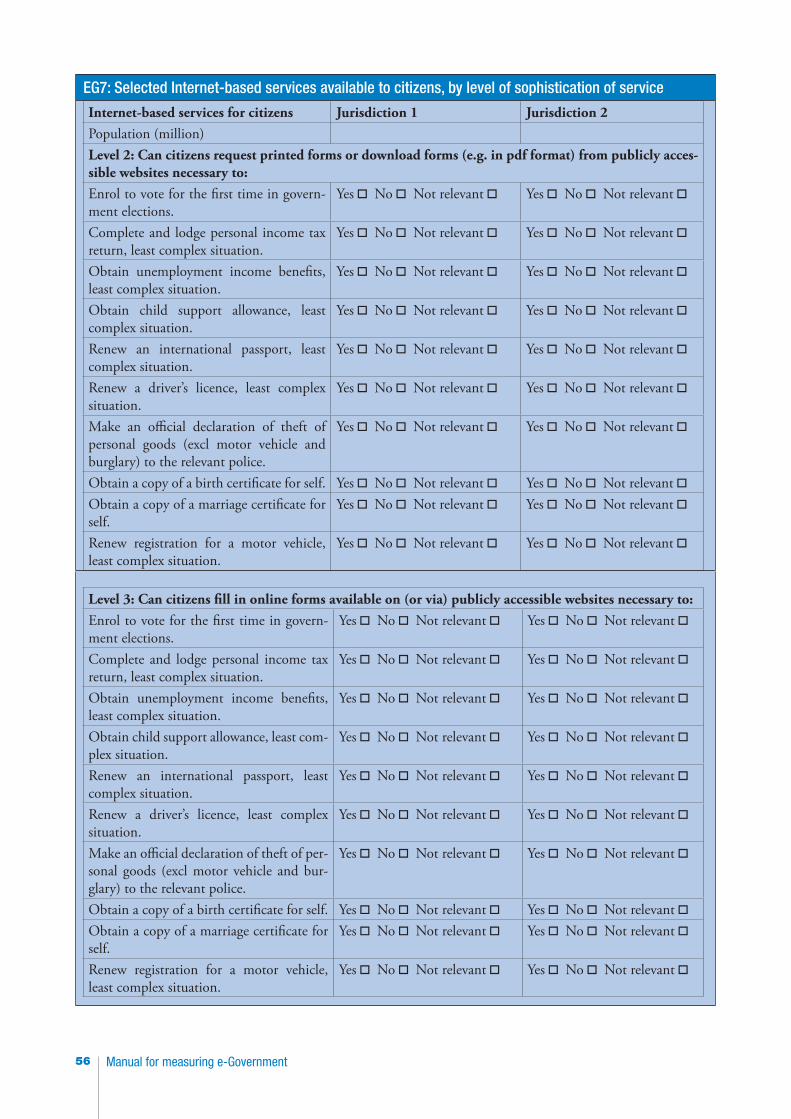
Manual for measuring e-Government56
EG7: Selected Internet-based services available to citizens, by level of sophistication of service
Internet-based services for citizens Jurisdiction 1 Jurisdiction 2Population (million)Level 2: Can citizens request printed forms or download forms (e.g. in pdf format) from publicly acces-sible websites necessary to:Enrol to vote for the first time in govern-ment elections.
Yes □ No □ Not relevant □ Yes □ No □ Not relevant □
Complete and lodge personal income tax return, least complex situation.
Yes □ No □ Not relevant □ Yes □ No □ Not relevant □
Obtain unemployment income benefits, least complex situation.
Yes □ No □ Not relevant □ Yes □ No □ Not relevant □
Obtain child support allowance, least complex situation.
Yes □ No □ Not relevant □ Yes □ No □ Not relevant □
Renew an international passport, least complex situation.
Yes □ No □ Not relevant □ Yes □ No □ Not relevant □
Renew a driver’s licence, least complex situation.
Yes □ No □ Not relevant □ Yes □ No □ Not relevant □
Make an official declaration of theft of personal goods (excl motor vehicle and burglary) to the relevant police.
Yes □ No □ Not relevant □ Yes □ No □ Not relevant □
Obtain a copy of a birth certificate for self. Yes □ No □ Not relevant □ Yes □ No □ Not relevant □Obtain a copy of a marriage certificate for self.
Yes □ No □ Not relevant □ Yes □ No □ Not relevant □
Renew registration for a motor vehicle, least complex situation.
Yes □ No □ Not relevant □ Yes □ No □ Not relevant □
Level 3: Can citizens fill in online forms available on (or via) publicly accessible websites necessary to:Enrol to vote for the first time in govern-ment elections.
Yes □ No □ Not relevant □ Yes □ No □ Not relevant □
Complete and lodge personal income tax return, least complex situation.
Yes □ No □ Not relevant □ Yes □ No □ Not relevant □
Obtain unemployment income benefits, least complex situation.
Yes □ No □ Not relevant □ Yes □ No □ Not relevant □
Obtain child support allowance, least com-plex situation.
Yes □ No □ Not relevant □ Yes □ No □ Not relevant □
Renew an international passport, least complex situation.
Yes □ No □ Not relevant □ Yes □ No □ Not relevant □
Renew a driver’s licence, least complex situation.
Yes □ No □ Not relevant □ Yes □ No □ Not relevant □
Make an official declaration of theft of per-sonal goods (excl motor vehicle and bur-glary) to the relevant police.
Yes □ No □ Not relevant □ Yes □ No □ Not relevant □
Obtain a copy of a birth certificate for self. Yes □ No □ Not relevant □ Yes □ No □ Not relevant □Obtain a copy of a marriage certificate for self.
Yes □ No □ Not relevant □ Yes □ No □ Not relevant □
Renew registration for a motor vehicle, least complex situation.
Yes □ No □ Not relevant □ Yes □ No □ Not relevant □
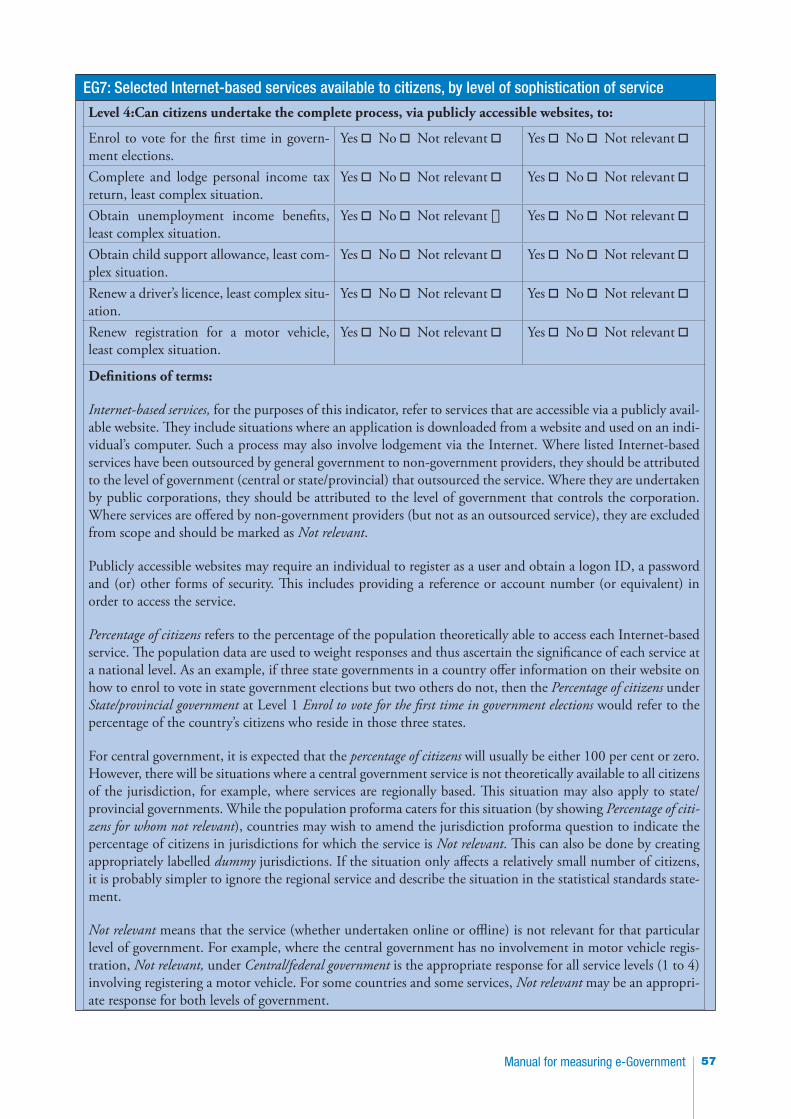
57Manual for measuring e-Government
EG7: Selected Internet-based services available to citizens, by level of sophistication of service
Level 4:Can citizens undertake the complete process, via publicly accessible websites, to:
Enrol to vote for the first time in govern-ment elections.
Yes □ No □ Not relevant □ Yes □ No □ Not relevant □
Complete and lodge personal income tax return, least complex situation.
Yes □ No □ Not relevant □ Yes □ No □ Not relevant □
Obtain unemployment income benefits, least complex situation.
Yes □ No □ Not relevant □ Yes □ No □ Not relevant □
Obtain child support allowance, least com-plex situation.
Yes □ No □ Not relevant □ Yes □ No □ Not relevant □
Renew a driver’s licence, least complex situ-ation.
Yes □ No □ Not relevant □ Yes □ No □ Not relevant □
Renew registration for a motor vehicle, least complex situation.
Yes □ No □ Not relevant □ Yes □ No □ Not relevant □
Definitions of terms:
Internet-based services, for the purposes of this indicator, refer to services that are accessible via a publicly avail-able website. They include situations where an application is downloaded from a website and used on an indi-vidual’s computer. Such a process may also involve lodgement via the Internet. Where listed Internet-based services have been outsourced by general government to non-government providers, they should be attributed to the level of government (central or state/provincial) that outsourced the service. Where they are undertaken by public corporations, they should be attributed to the level of government that controls the corporation. Where services are offered by non-government providers (but not as an outsourced service), they are excluded from scope and should be marked as Not relevant.
Publicly accessible websites may require an individual to register as a user and obtain a logon ID, a password and (or) other forms of security. This includes providing a reference or account number (or equivalent) in order to access the service.
Percentage of citizens refers to the percentage of the population theoretically able to access each Internet-based service. The population data are used to weight responses and thus ascertain the significance of each service at a national level. As an example, if three state governments in a country offer information on their website on how to enrol to vote in state government elections but two others do not, then the Percentage of citizens under State/provincial government at Level 1 Enrol to vote for the first time in government elections would refer to the percentage of the country’s citizens who reside in those three states.
For central government, it is expected that the percentage of citizens will usually be either 100 per cent or zero. However, there will be situations where a central government service is not theoretically available to all citizens of the jurisdiction, for example, where services are regionally based. This situation may also apply to state/provincial governments. While the population proforma caters for this situation (by showing Percentage of citi-zens for whom not relevant), countries may wish to amend the jurisdiction proforma question to indicate the percentage of citizens in jurisdictions for which the service is Not relevant. This can also be done by creating appropriately labelled dummy jurisdictions. If the situation only affects a relatively small number of citizens, it is probably simpler to ignore the regional service and describe the situation in the statistical standards state-ment.
Not relevant means that the service (whether undertaken online or offline) is not relevant for that particular level of government. For example, where the central government has no involvement in motor vehicle regis-tration, Not relevant, under Central/federal government is the appropriate response for all service levels (1 to 4) involving registering a motor vehicle. For some countries and some services, Not relevant may be an appropri-ate response for both levels of government.
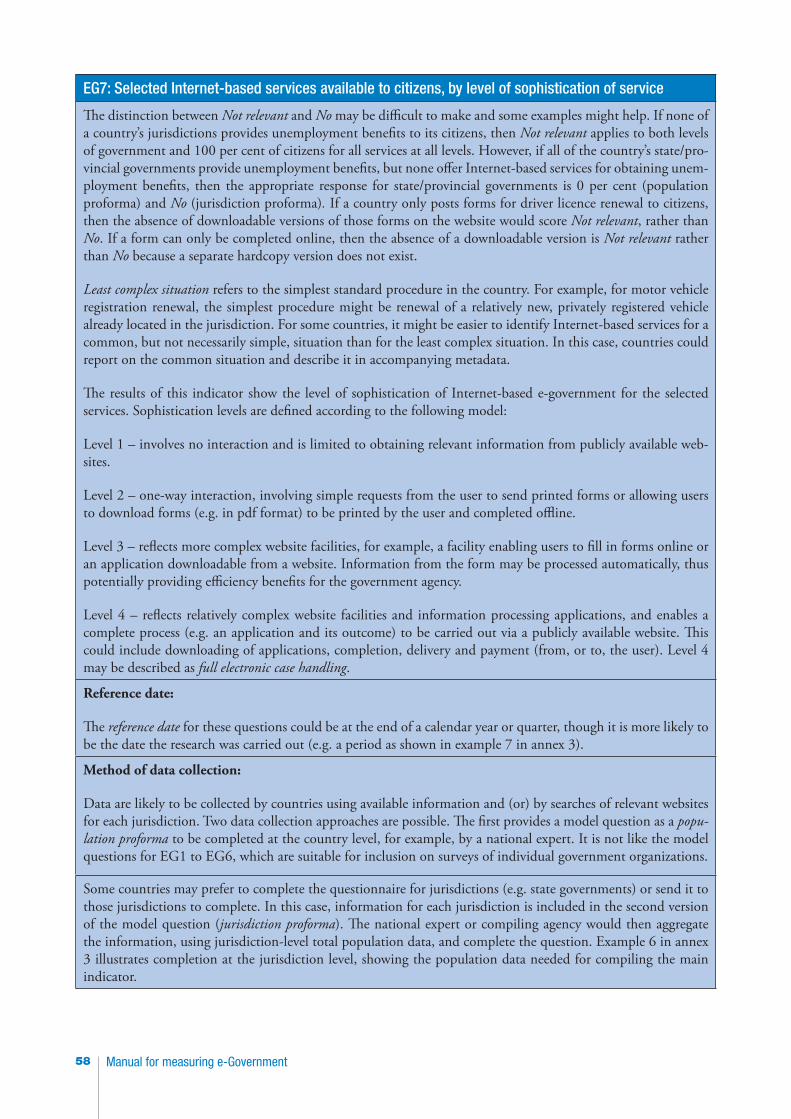
Manual for measuring e-Government58
EG7: Selected Internet-based services available to citizens, by level of sophistication of service
The distinction between Not relevant and No may be difficult to make and some examples might help. If none of a country’s jurisdictions provides unemployment benefits to its citizens, then Not relevant applies to both levels of government and 100 per cent of citizens for all services at all levels. However, if all of the country’s state/pro-vincial governments provide unemployment benefits, but none offer Internet-based services for obtaining unem-ployment benefits, then the appropriate response for state/provincial governments is 0 per cent (population proforma) and No (jurisdiction proforma). If a country only posts forms for driver licence renewal to citizens, then the absence of downloadable versions of those forms on the website would score Not relevant, rather than No. If a form can only be completed online, then the absence of a downloadable version is Not relevant rather than No because a separate hardcopy version does not exist.
Least complex situation refers to the simplest standard procedure in the country. For example, for motor vehicle registration renewal, the simplest procedure might be renewal of a relatively new, privately registered vehicle already located in the jurisdiction. For some countries, it might be easier to identify Internet-based services for a common, but not necessarily simple, situation than for the least complex situation. In this case, countries could report on the common situation and describe it in accompanying metadata.
The results of this indicator show the level of sophistication of Internet-based e-government for the selected services. Sophistication levels are defined according to the following model:
Level 1 – involves no interaction and is limited to obtaining relevant information from publicly available web-sites.
Level 2 – one-way interaction, involving simple requests from the user to send printed forms or allowing users to download forms (e.g. in pdf format) to be printed by the user and completed offline.
Level 3 – reflects more complex website facilities, for example, a facility enabling users to fill in forms online or an application downloadable from a website. Information from the form may be processed automatically, thus potentially providing efficiency benefits for the government agency.
Level 4 – reflects relatively complex website facilities and information processing applications, and enables a complete process (e.g. an application and its outcome) to be carried out via a publicly available website. This could include downloading of applications, completion, delivery and payment (from, or to, the user). Level 4 may be described as full electronic case handling.
Reference date:
The reference date for these questions could be at the end of a calendar year or quarter, though it is more likely to be the date the research was carried out (e.g. a period as shown in example 7 in annex 3).
Method of data collection:
Data are likely to be collected by countries using available information and (or) by searches of relevant websites for each jurisdiction. Two data collection approaches are possible. The first provides a model question as a popu-lation proforma to be completed at the country level, for example, by a national expert. It is not like the model questions for EG1 to EG6, which are suitable for inclusion on surveys of individual government organizations.
Some countries may prefer to complete the questionnaire for jurisdictions (e.g. state governments) or send it to those jurisdictions to complete. In this case, information for each jurisdiction is included in the second version of the model question (jurisdiction proforma). The national expert or compiling agency would then aggregate the information, using jurisdiction-level total population data, and complete the question. Example 6 in annex 3 illustrates completion at the jurisdiction level, showing the population data needed for compiling the main indicator.
59Manual for measuring e-Government
Presentation of the model questions in a questionnaire146. It is possible to order the model questions for EG1 to EG6 in various ways. Two possible orderings are presented here but they are not mutually exclusive. For example, where a large number of questions is included in the survey, a topic ordering may be used, with filter questions at the start of each topic to determine whether that topic is relevant to the responding organization.
By topic147. Questions necessary to compile the core indicators EG1 to EG6 could be ordered by broad topic as follows:
• Routine use of ICT (computers and the Internet) by persons employed – corresponding to core indicators EG1 and EG2
• Availability of ICT (LAN, intranet, Internet access) to government organizations – correspond-ing to core indicators EG3, EG4 and EG5
• Web presence by government organizations – corresponding to core indicator EG6• Additional information required to compile the indicators – employment (preferably split by
gender).
Logical order using filter questions to stream responses148. An alternative to a topic ordering of the questions for EG1 to EG6 is a logical order using a filter question as shown in box 8.
149. The model questions are reasonably independent and therefore the opportunity to use filter ques-tions is limited. For example, while EG1 and EG2 are likely to be related, Internet use without computer access is becoming increasingly common, therefore, respondents should be given the opportunity to answer both of the model questions relating to these indicators. However, EG2 is linked to EG5 (Internet access), so countries may decide that organizations without Internet access do not need to answer the question on employees’ use of the Internet. Responses to model questions for EG3, EG4 and EG5 are also likely to be related but it is recommended that respondents should be asked all the model questions relating to these indicators, with no filtering.
150. Box 8 shows the model questions in a logical order, with a filter question for Internet access.
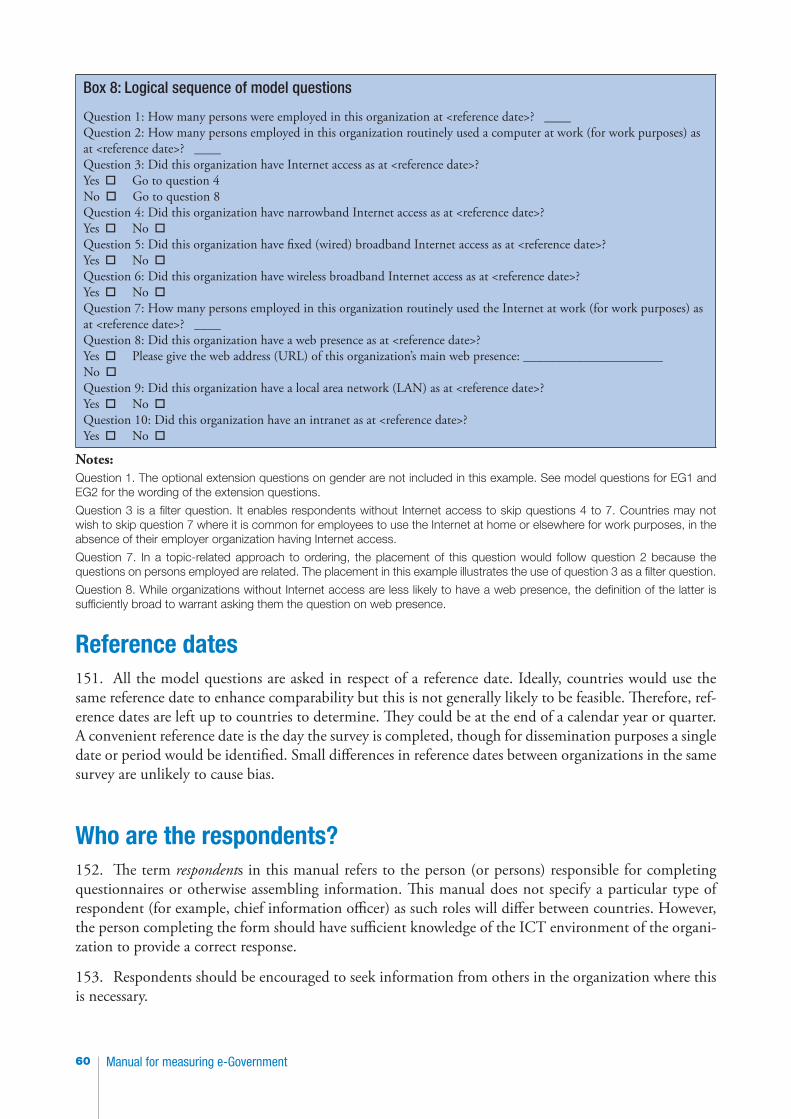
Manual for measuring e-Government60
Box 8: Logical sequence of model questions
Question 1: How many persons were employed in this organization at <reference date>? ____ Question 2: How many persons employed in this organization routinely used a computer at work (for work purposes) as at <reference date>? ____ Question 3: Did this organization have Internet access as at <reference date>? Yes □ Go to question 4 No □ Go to question 8 Question 4: Did this organization have narrowband Internet access as at <reference date>? Yes □ No □ Question 5: Did this organization have fixed (wired) broadband Internet access as at <reference date>? Yes □ No □ Question 6: Did this organization have wireless broadband Internet access as at <reference date>? Yes □ No □ Question 7: How many persons employed in this organization routinely used the Internet at work (for work purposes) as at <reference date>? ____ Question 8: Did this organization have a web presence as at <reference date>? Yes □ Please give the web address (URL) of this organization’s main web presence: _____________________ No □ Question 9: Did this organization have a local area network (LAN) as at <reference date>? Yes □ No □ Question 10: Did this organization have an intranet as at <reference date>? Yes □ No □
Notes:Question 1. The optional extension questions on gender are not included in this example. See model questions for EG1 and EG2 for the wording of the extension questions.
Question 3 is a filter question. It enables respondents without Internet access to skip questions 4 to 7. Countries may not wish to skip question 7 where it is common for employees to use the Internet at home or elsewhere for work purposes, in the absence of their employer organization having Internet access.
Question 7. In a topic-related approach to ordering, the placement of this question would follow question 2 because the questions on persons employed are related. The placement in this example illustrates the use of question 3 as a filter question.
Question 8. While organizations without Internet access are less likely to have a web presence, the definition of the latter is sufficiently broad to warrant asking them the question on web presence.
Reference dates151. All the model questions are asked in respect of a reference date. Ideally, countries would use the same reference date to enhance comparability but this is not generally likely to be feasible. Therefore, ref-erence dates are left up to countries to determine. They could be at the end of a calendar year or quarter. A convenient reference date is the day the survey is completed, though for dissemination purposes a single date or period would be identified. Small differences in reference dates between organizations in the same survey are unlikely to cause bias.
Who are the respondents?152. The term respondents in this manual refers to the person (or persons) responsible for completing questionnaires or otherwise assembling information. This manual does not specify a particular type of respondent (for example, chief information officer) as such roles will differ between countries. However, the person completing the form should have sufficient knowledge of the ICT environment of the organi-zation to provide a correct response.
153. Respondents should be encouraged to seek information from others in the organization where this is necessary.
61Manual for measuring e-Government
Supplementary data requirements154. Where data are collected by a survey, that survey should also collect data on the number of persons employed (on a head count basis by gender, if possible) at the reference date. This is required for size clas-sification, to derive indicators EG1 and EG2, and to derive employment-weighted indicators for EG3 to EG6. Persons employed refers to all persons working for the government organization, not only those working in clerical jobs. They include part-time, short-term and casual employees but exclude workers supplied to the organization by other organizations. Suitable questions have been included in the model questions for EG1 and EG2; these are:
How many persons were employed in this organization at <reference date>? ____ How many of these were female? ____ How many of these were male? ____
Concepts that may be difficult to understand155. It is generally considered that ICT concepts may be difficult for respondents (and some data users) to understand. The model questions include quite detailed definitions and explanations and these must be included on survey material (for example, on questionnaires or separate instructions). While there are benefits of including definitions with the questions they relate to, this can lead to a cluttered question-naire that may deter respondents.
156. For indicator EG5, Proportion of central government organizations with Internet access, by type of access, it might be helpful to include the names of commonly used access services in the instructions.
157. Understanding of difficult concepts and methods of presenting definitions etc. should be tested during the form design process.
Measurement topics apart from the core e-government indicators158. Questions additional to those required to construct the core indicators are likely to be included in country surveys. These will be determined by national priorities, including commonality with other countries, including those of the region.
159. A glance at annex 1 shows a lot of diversity (and some commonality) in the topics collected in countries’ e-government surveys. The publication, Regional Proposal for Core Indicators on e-Government: Methodological Guidelines, prepared by the Observatory for the Information Society in Latin America and the Caribbean (OSILAC, 2010), also includes a number of additional e-government indicators that could be collected.23
160. Table 5 presents a list of selected additional topics, with some examples and comments on statistical issues. For more detail, readers are referred to documentation on individual surveys (shown in annex 1) and OSILAC (2010).
23 Note that the Observatory for the Information Society in Latin America and the Caribbean list is based on an earlier version of the e-government core indicators.
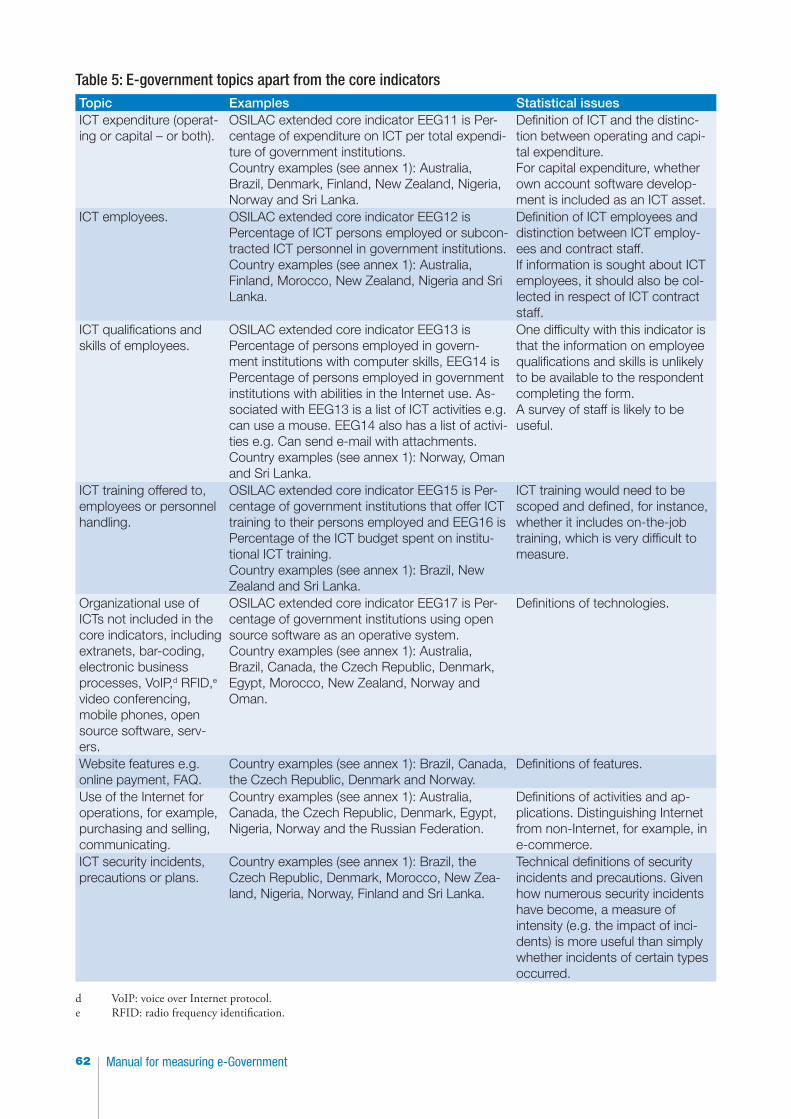
Manual for measuring e-Government62
Table 5: E-government topics apart from the core indicatorsTopic Examples Statistical issuesICT expenditure (operat-ing or capital – or both).
OSILAC extended core indicator EEG11 is Per-centage of expenditure on ICT per total expendi-ture of government institutions.Country examples (see annex 1): Australia, Brazil, Denmark, Finland, New Zealand, Nigeria, Norway and Sri Lanka.
Definition of ICT and the distinc-tion between operating and capi-tal expenditure.For capital expenditure, whether own account software develop-ment is included as an ICT asset.
ICT employees. OSILAC extended core indicator EEG12 is Percentage of ICT persons employed or subcon-tracted ICT personnel in government institutions. Country examples (see annex 1): Australia, Finland, Morocco, New Zealand, Nigeria and Sri Lanka.
Definition of ICT employees and distinction between ICT employ-ees and contract staff. If information is sought about ICT employees, it should also be col-lected in respect of ICT contract staff.
ICT qualifications and skills of employees.
OSILAC extended core indicator EEG13 is Percentage of persons employed in govern-ment institutions with computer skills, EEG14 is Percentage of persons employed in government institutions with abilities in the Internet use. As-sociated with EEG13 is a list of ICT activities e.g. can use a mouse. EEG14 also has a list of activi-ties e.g. Can send e-mail with attachments.Country examples (see annex 1): Norway, Oman and Sri Lanka.
One difficulty with this indicator is that the information on employee qualifications and skills is unlikely to be available to the respondent completing the form.A survey of staff is likely to be useful.
ICT training offered to, employees or personnel handling.
OSILAC extended core indicator EEG15 is Per-centage of government institutions that offer ICT training to their persons employed and EEG16 is Percentage of the ICT budget spent on institu-tional ICT training. Country examples (see annex 1): Brazil, New Zealand and Sri Lanka.
ICT training would need to be scoped and defined, for instance, whether it includes on-the-job training, which is very difficult to measure.
Organizational use of ICTs not included in the core indicators, including extranets, bar-coding, electronic business processes, VoIP,d RFID,e video conferencing, mobile phones, open source software, serv-ers.
OSILAC extended core indicator EEG17 is Per-centage of government institutions using open source software as an operative system. Country examples (see annex 1): Australia, Brazil, Canada, the Czech Republic, Denmark, Egypt, Morocco, New Zealand, Norway and Oman.
Definitions of technologies.
Website features e.g. online payment, FAQ.
Country examples (see annex 1): Brazil, Canada, the Czech Republic, Denmark and Norway.
Definitions of features.
Use of the Internet for operations, for example, purchasing and selling, communicating.
Country examples (see annex 1): Australia, Canada, the Czech Republic, Denmark, Egypt, Nigeria, Norway and the Russian Federation.
Definitions of activities and ap-plications. Distinguishing Internet from non-Internet, for example, in e-commerce.
ICT security incidents, precautions or plans.
Country examples (see annex 1): Brazil, the Czech Republic, Denmark, Morocco, New Zea-land, Nigeria, Norway, Finland and Sri Lanka.
Technical definitions of security incidents and precautions. Given how numerous security incidents have become, a measure of intensity (e.g. the impact of inci-dents) is more useful than simply whether incidents of certain types occurred.
d VoIP: voice over Internet protocol. e RFID: radio frequency identification.
63Manual for measuring e-Government
Chapter 7. Survey design
161. This chapter explores survey design, with a focus on sample surveys of government units, as these are likely to be the most complex option for a data source. As mentioned earlier, surveys of government organizations are likely to be similar to business surveys in most respects. In fact, at least one country – Canada – uses the same survey questionnaire to measure ICT usage by businesses and government organizations.
162. For this reason, information on business survey design is referred to in the chapter, with inputs from the Australian Bureau of Statistics (ABS) (2012b), Eurostat (2011), Statistics Canada (2010) and UNCTAD (2009). However, specific issues relating to government organizations are also explored, with statistical units and construction of survey frames predominant amongst these.
Statistical units163. In order to conduct a survey24 of government organizations, statistical units need to be defined. A statistical unit is the entity in respect of which statistics are compiled and a reporting unit is the entity from which the statistics are collected. The statistical unit and the reporting unit are often the same unit, but where they are different, one reporting unit may provide information for several statistical units. A statistical unit may also be an artefact that is constructed by a statistical agency on some basis (for exam-ple, homogeneity of functions).
164. Government statistical units were defined in chapter 4 – Statistical standards. To recap, the central government statistical unit specified in this manual has the following characteristics:
• It may be a single institutional unit, for example, an agency of central government that main-tains full sets of accounts, and has a separate legal identity and substantial autonomy. However, this level will often be too broad to be useful for our purposes.
• It may be at the next level down from the single (whole-of-government) institutional unit, for example, a department or ministry of central government, a branch office or an agency of cen-tral government. This may provide the level of detail necessary to collect data on ‘proportion of government organizations with ICT’.
• The unit chosen may be analogous to the kind-of-activity units (KAU) defined by the 2008 SNA: “A kind-of-activity unit is an enterprise, or a part of an enterprise, that engages in only one kind of productive activity or in which the principal productive activity accounts for most of the value added.”
• While the KAU is a higher-level unit than the establishment level, which is location-based (“an enterprise, or part of an enterprise, that is situated in a single location and in which only a single productive activity is carried out”), the appropriate unit may be a site or establishment, in cases where this is the next level down from the parent institutional unit.
• Excluded establishments include individual establishments (unless the next level down from the parent institutional unit) such as schools, hospitals, health centres, police stations and post offices.
165. Statistical units also need to be defined for the other levels of government – state and local – where the scope of a country’s survey extends to these levels of government for EG1 to EG6.
24 Noting that a survey may be a sample or a census or a combination of the two (where part of the population is sampled and the rest is completely enumerated).

Manual for measuring e-Government64
166. According to the 2008 SNA, the state government subsector consists of state governments that are separate institutional units plus those non-market NPIs that are controlled by state governments. State government units are defined as follows:
… institutional units whose fiscal, legislative and executive authority extends only over the indi-vidual ‘states’ into which the country as a whole may be divided. Such ‘states’ may be described by different terms in different countries. In some countries, especially small countries, individual states and state governments may not exist. However, in large countries, especially those that have federal constitutions, considerable powers and responsibilities may be assigned to state governments.
167. The 2008 SNA defines the local government subsector as consisting of local governments that are separate institutional units plus those non-market NPIs that are controlled by local governments. Local government units are defined by the 2008 SNA as “institutional units whose fiscal, legislative and execu-tive authority extends over the smallest geographical areas distinguished for administrative and political purposes.”
168. Where more than one level of government exists between central and local government, the 2008 SNA specifies that these should be included with the level of government (state or local) with which they are most closely associated.
169. Where state government is in scope for indicators EG1 to EG6, units can be defined using similar principles applying to central government units. Local government units, if in scope, are likely to be simpler to define as they tend to be more homogeneous (and more numerous) than state and central government units.
The units comparability issue170. Indicators of the type ‘proportion of government organizations with ICT’ are affected by difficulties with comparison of units.25 In this manual, those challenges have been labelled as the units comparability issue, which is discussed in chapter 4.
171. The statistical unit recommended in this manual has been contrived to reduce the units compa-rability issue and thereby maximize comparability. However, the definition may be difficult to apply in practice for several reasons, including its interpretation and the identification of units complying with the definition.
172. The uncertainty around the definition makes it even more important that output for EG3 to EG6 is weighted and classified by employment size. This is discussed in more detail in chapter 4.
Scope and target population173. The scope of government units for the purposes of the core indicators was discussed in chapter 4. However, scope is mentioned again here because of its role in survey design and its relationship to target populations, survey frames and coverage. Scope is a broader concept than units and may cover factors such as time frame and geography. However, neither of these is likely to be a major issue for the e-govern-ment indicators and so will not be considered further.
174. The survey scope defines the target population. Both refer to the statistical units that are ideally represented by the survey and for which data are to be collected and tabulated.
25 This is true of any indicator of the form ‘proportion of entities with <a characteristic>’ if units are not comparable across countries. At the national level, the problem can affect regional and time series comparisons.
65Manual for measuring e-Government
Survey frames175. The survey frame (also known as a population frame or a sampling frame) is a list from which statisti-cal units (or possibly reporting units) of a survey are selected. The survey frame should represent the target population as closely as possible and should have the following characteristics:
• Completeness – it should be as complete as possible with respect to coverage of the target popu-lation.
• Currency – it should be as up-to-date as possible.• Accuracy – information on the frame records should be as accurate as possible.• Supplementary data – the frame records should include data that will assist in sample design if
needed, for example, number of employees.• Contact information – such as a physical or e-mail address – so that a respondent can be identi-
fied and contacted.
176. Sources for survey frame information for surveys of government organizations include:
• A country’s business register. Business registers are generally established and maintained by NSOs and are based on information sources such as tax registers, the results of ongoing unit sur-veys or feedback from sector censuses. Business registers are often organized by industry (ISIC or an equivalent national industrial classification).
• Other registers. These may include listings of government units such as government directories (see example 2 for possible sources).
• A combination of sources. For example, information from the business register might be refined using government directories, and possibly unit surveys.
Business registers as a source177. Unfortunately, it is usually difficult and costly for a country to maintain a reliable business register. Deficiencies often include: missing entries; duplicate entries; out of date entries (for example, inclusion of entities that no longer exist); missing or incorrect information on size and industry; and inadequate institutional sector information (for example, distinguishing general government entities from public corporations).
178. ISIC, and its country equivalents, refer to activities, not types of units, and therefore cannot be used alone to determine government units. Some of the activities of government will be outside the ISIC section, Public administration and defence; compulsory social security, and, arguably, non-government units may also have activities covered by this section. In addition, ISIC does not distinguish the activities of central government; these will vary for individual countries (as an example, countries with a level of state (or provincial) government will likely have more limited central government functions).
179. Nevertheless, countries using a business register (or other survey frame) with industry information as a frame for surveys of government organizations, should ensure that they have covered all the central government units classified to ISIC Section O: Public administration and defence; compulsory social secu-rity. It will be useful also to check entities classified to other likely ISIC classes, for instance (in ISIC Rev. 4), Section P: Education; Section Q: Human health and social work activities; and Section R: Arts, enter-tainment and recreation.
180. Where countries’ business registers (or equivalent registers of government units) have only insti-tutional government units and where these are very high-level units, countries may prefer to use those units as reporting units in preference to compiling a register of all subunits. In such cases, the reporting unit would respond in respect of its subunits (for example, departments or ministries, branch offices and
Manual for measuring e-Government66
agencies, but not excluded establishments such as schools, hospitals, health centres, police stations and post offices).
Coverage181. Coverage is the degree to which the target population units exist on the survey frame (and are therefore able to be represented in the survey). Once the required scope is determined, alternative survey frames can be investigated to identify sources that provide the best (most complete, up-to-date and accu-rate) coverage of the government organizations that are within the scope of the survey.
182. Undercoverage occurs where in-scope units are missing from the frame and are therefore not able to be included in the survey (whether it is a census or sample survey). Undercoverage can be a major source of bias in survey results. Overcoverage, for instance, arising from duplication of entities or the inclusion of entities that no longer exist, may also be a problem for surveys of government organizations. Both under-coverage and overcoverage can also affect expansion factors in the case of samples of units, as the factors are based on information on the frame.
Example 2: Central government organizations in Australia
The broad structure of central government in Australia includes the Governor-General, parliamentary bodies, courts and portfolio bodies. The 2009 List of Australian Government Bodies and Governance Relationships lists 932 Australian Government (i.e. central government) bodies.
The A–Z list of Australian Government Departments and Agencies and the A-Z List of Australian Government Councils, Committees & Boards show the great diversity of central government organizations in Australia. They include advisory groups, agencies, authorities, boards, bureaus, commissions, committees, corporations, coun-cils, courts, departments, facilities, foundations, institutes, offices, panels, reference groups, research centres, secretariats, services, tribunals, trusts, as well as a number that have no particular title. Public corporations are also included in the list.
Each organization is subsidiary to an Australian government portfolio, which has an Australian government department and associated portfolio bodies (including committees, boards and councils). As an example, in 2009, the Portfolio of Education, Employment and Workplace Relations had 47 portfolio bodies, including the Department of Education, Employment and Workplace Relations, three ministerial councils, five joint bodies with state governments, seven advisory bodies, 10 departmental bodies recognized in legislation (e.g. statutory authorities), seven prescribed agencies under the Financial Management and Accountability (FMA) Act, four Commonwealth authorities under the Commonwealth Authorities and Companies (CAC) Act, two Common-wealth companies under the CAC Act, seven other companies and one other entity.
Source: Australian Government Directory, see http://www.directory.gov.au/directory (2012) and Department of Finance and Deregulation (2009 and 2011).
Sample design and selection
Sample survey or census of government organizations?183. While this chapter focuses on sample surveys26 of government organizations, it should be noted that the agencies surveying central government appear to mainly collect data from all units, that is, they conduct a census (or complete enumeration) of government organizations. Annex 1 and table 6 illustrate
26 Sampling is described by Statistics Canada (2010) as “a means of selecting a subset of units from a population for the purpose of collecting information for those units to draw inferences about the population as a whole.”
67Manual for measuring e-Government
this trend. Where the scope is extended to state government, a census may also be appropriate (for exam-ple, see Australia in annex 1). However, where local government is included in the scope, it is likely that sampling of local government units would be involved, as these tend to be more numerous (see example 3 for an illustration).
Example 3: The structure of government in the United States of America
The United States of America conducts a census of government every five years. The results for 2002 showed that the vast majority of governments were local. At 30 June 2002, there were 87,900 government units in the United States. These included the federal government (1 unit), 50 state governments and 87,849 units of local governments.
Of the local government units, 38,971 were general purpose local governments, 3,034 county governments and 35,937 subcounty governments, including 19,431 municipal governments and 16,506 township governments. The remainder, which comprised over one-half of the total, were special purpose local governments, including 13,522 school district gov-ernments and 35,356 special district governments.
In 2007, there were 89,476 local governments and public school systems.
Source: Federal, State & Local Governments homepage (United States Census Bureau, 2012). Available from http://www.census.gov/govs/.
184. Where the population of in-scope government organizations is large, for reasons of both cost and respondent burden, countries may decide to select a representative sample of at least part of the popula-tion rather than conduct a census of all organizations.
185. There are advantages of using a sample rather than taking a census, with the main advantages being:
• Reduced cost for the collection agency• Reduced burden on respondents• Reduced time required to collect, process and release data• The possibility of trading off the number of units with more detail in the questionnaire.
186. However, there are also disadvantages of sampling compared with taking a census, as follows:
• Survey design is far more complex for a sample and potentially relies more on the accuracy of the population frame.
• Since estimates are subject to sampling error, more detailed data (for example, by geographic region or by employment size) may not be reliable.
• In particular, detailed cross-tabulations (for example, by geographic region and employment size) may not be feasible.
• Limitations on the precision of data may be difficult to communicate to users.
187. Where a sample is taken, so that the representativeness of the sampled portion of the popula-tion can be guaranteed, units must be selected at random. Only random sampling allows calculation of estimates of sampling error, that is, the deviation from the true value attributable to the fact that only a sample of the population was included in the survey. Such sampling is known as probability sampling (as opposed to non-probability sampling) and every unit in the population has a known and non-zero prob-ability of selection.
188. Non-probability sampling has advantages in terms of time and cost but relies on the assumption that the sample selection is representative. For this reason, it is not recommended for surveys of govern-ment organizations and will not be further discussed in this manual. ABS (2012b) and Statistics Canada (2010) explain the differences between probability and non-probability sampling.
Manual for measuring e-Government68
189. Forms of probability sampling that are likely to be suitable for government units are simple random sampling, stratified random sampling, systematic random sampling, multistage sampling and longitudi-nal surveys.
Simple random sampling190. A simple random sample is the most basic form of probability sampling and consists of a random selection of n units from the survey frame (generally without replacing them), where there are N units in the target population. With simple random sampling, every unit has equal probability of selection in the sample (n/N).
Stratification191. Random samples of businesses and government units are generally based on the structure of the population of entities (termed stratification). Stratification is the technique of dividing the population into mutually exclusive and relatively homogeneous groups termed strata. The grouping is based on values of stratification variables, such as employment size, that maximize both homogeneity of units within strata and heterogeneity of units between strata (with respect to survey variables). More simply stated, strata consist of units that are as similar as possible to each other and as different as possible from units in other strata. Stratification will generally minimize sampling error associated with estimates for a given sample size.
192. Units may be selected in various ways within strata. However, for business (and government) sur-veys, they will usually be selected at random, with the technique referred to as stratified random sampling. Other forms of selection, such as systematic sampling, within strata are possible.
193. Optimal stratification is based on stratification variables as closely related as possible to the variables being measured. Based on experience with business surveys, it is presumed that size (in terms of number of persons employed), is likely to be related to ICT use by government organizations.27 We can expect that use of size as a stratification variable will both reduce the overall sampling error as well as the error associated with data disaggregated by size. Information on size should therefore be included on the survey frame.28 This manual recommends that data on number of employees also be collected from respondents. This will often prove to be more reliable than frame data on employment.
194. It is expected that some strata will be completely enumerated (that is, all units in those strata are selected). These will generally be strata containing large units, though some strata with a small number of units may also be completely enumerated.
195. More information on stratification can be found in ABS (2012b) and Statistics Canada (2010).
Systematic random sampling196. In systematic random sampling, units are selected from the population at a predefined sampling interval. A sampling interval and a random start are required. Each unit has an equal probability of selec-tion n/N. Systematic random sampling is relatively simple. More information on systematic random sampling can be found in ABS (2012b) and Statistics Canada (2010).
27 For business ICT use surveys, Eurostat (2011) specifies that ‘average number of persons employed’ (in terms of size classes) should be used for the stratification of the sample.28 As noted earlier, information on industry can be used to ensure that the industries that governments are likely to be classified to, should be included. Therefore, the frame should also include industry, though this will probably not need to be included as a stratification variable for surveys of government organizations.
69Manual for measuring e-Government
Multistage sampling197. For surveys where a reporting unit is selected from the survey frame and is then asked to collect information from its subsidiary units, some form of sampling may be needed to select those units (which will generally be statistical units). The agency conducting the survey may or may not have a list of the statistical units. If it does, it may specify which units are to be surveyed by the reporting unit. If not, it may specify a simple form of selection, such as systematic random sampling, for the reporting unit to undertake.
Sampling for time series198. There will often be an interest in measuring changes in e-government status over time. An example for the e-government core indicators is the change in access to broadband Internet access over several periods. The forms of selection discussed above will enable this measure at each point in time but may not measure change over time particularly well. An alternative form of surveying for time series results is a longitudinal survey, where a panel is initially selected and its members are surveyed for each iteration of the survey. Such samples reduce the variability around the estimate of change and may offer other advan-tages such as respondent familiarity with the survey. On the negative side, representativeness is likely to decline over time unless the population is updated for new and ceased units. Respondents may also tire of the survey and cease to respond, or make errors in response.
199. A design that is intermediate between a series of independent samples and a longitudinal survey is one where part of the sample is replaced (rotated out) for each survey. This provides some overlap of respondents between surveys.
Survey design in practice for information and communication technology use surveys200. Table 6 shows the survey design used for various business and government use of ICT surveys. It can be seen that, for business surveys, stratified random sampling dominates.29 Government ICT use sur-veys are mainly censuses of government organizations. For those that use sampling, the main technique is also stratified random sampling.
29 Note that Eurostat (2011) recommends use of stratified random sampling by activity (industry) and employment size for its Community Survey on ICT Usage and e-Commerce in Enterprises.
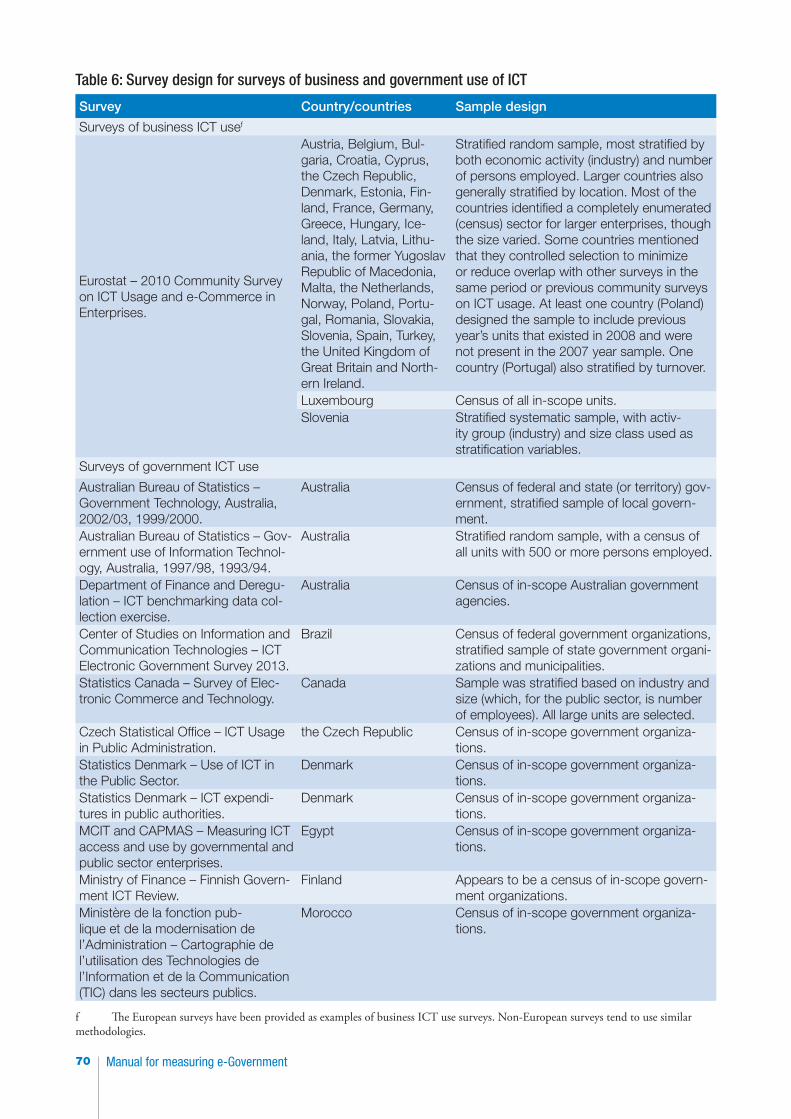
Manual for measuring e-Government70
Table 6: Survey design for surveys of business and government use of ICT
Survey Country/countries Sample design
Surveys of business ICT usef
Eurostat – 2010 Community Survey on ICT Usage and e-Commerce in Enterprises.
Austria, Belgium, Bul-garia, Croatia, Cyprus, the Czech Republic, Denmark, Estonia, Fin-land, France, Germany, Greece, Hungary, Ice-land, Italy, Latvia, Lithu-ania, the former Yugoslav Republic of Macedonia, Malta, the Netherlands, Norway, Poland, Portu-gal, Romania, Slovakia, Slovenia, Spain, Turkey, the United Kingdom of Great Britain and North-ern Ireland.
Stratified random sample, most stratified by both economic activity (industry) and number of persons employed. Larger countries also generally stratified by location. Most of the countries identified a completely enumerated (census) sector for larger enterprises, though the size varied. Some countries mentioned that they controlled selection to minimize or reduce overlap with other surveys in the same period or previous community surveys on ICT usage. At least one country (Poland) designed the sample to include previous year’s units that existed in 2008 and were not present in the 2007 year sample. One country (Portugal) also stratified by turnover.
Luxembourg Census of all in-scope units.Slovenia Stratified systematic sample, with activ-
ity group (industry) and size class used as stratification variables.
Surveys of government ICT use
Australian Bureau of Statistics – Government Technology, Australia, 2002/03, 1999/2000.
Australia Census of federal and state (or territory) gov-ernment, stratified sample of local govern-ment.
Australian Bureau of Statistics – Gov-ernment use of Information Technol-ogy, Australia, 1997/98, 1993/94.
Australia Stratified random sample, with a census of all units with 500 or more persons employed.
Department of Finance and Deregu-lation – ICT benchmarking data col-lection exercise.
Australia Census of in-scope Australian government agencies.
Center of Studies on Information and Communication Technologies – ICT Electronic Government Survey 2013.
Brazil Census of federal government organizations, stratified sample of state government organi-zations and municipalities.
Statistics Canada – Survey of Elec-tronic Commerce and Technology.
Canada Sample was stratified based on industry and size (which, for the public sector, is number of employees). All large units are selected.
Czech Statistical Office – ICT Usage in Public Administration.
the Czech Republic Census of in-scope government organiza-tions.
Statistics Denmark – Use of ICT in the Public Sector.
Denmark Census of in-scope government organiza-tions.
Statistics Denmark – ICT expendi-tures in public authorities.
Denmark Census of in-scope government organiza-tions.
MCIT and CAPMAS – Measuring ICT access and use by governmental and public sector enterprises.
Egypt Census of in-scope government organiza-tions.
Ministry of Finance – Finnish Govern-ment ICT Review.
Finland Appears to be a census of in-scope govern-ment organizations.
Ministère de la fonction pub-lique et de la modernisation de l’Administration – Cartographie de l’utilisation des Technologies de l’Information et de la Communication (TIC) dans les secteurs publics.
Morocco Census of in-scope government organiza-tions.
f The European surveys have been provided as examples of business ICT use surveys. Non-European surveys tend to use similar methodologies.
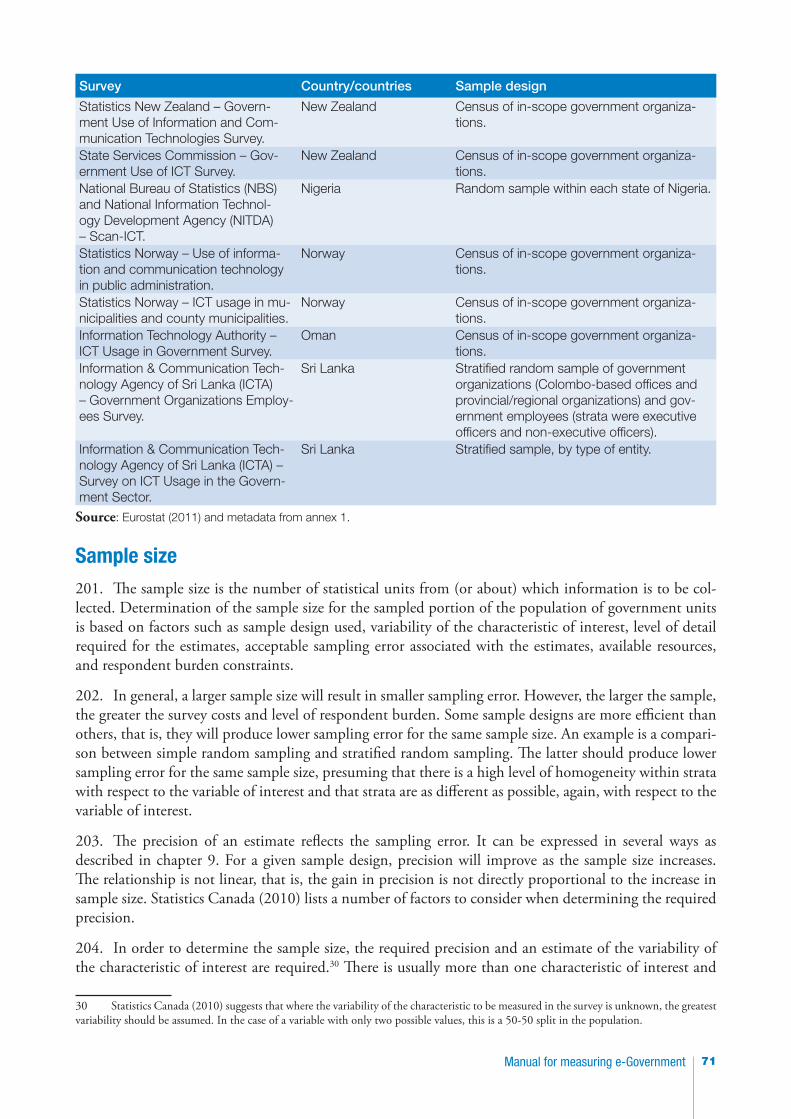
71Manual for measuring e-Government
Survey Country/countries Sample design
Statistics New Zealand – Govern-ment Use of Information and Com-munication Technologies Survey.
New Zealand Census of in-scope government organiza-tions.
State Services Commission – Gov-ernment Use of ICT Survey.
New Zealand Census of in-scope government organiza-tions.
National Bureau of Statistics (NBS) and National Information Technol-ogy Development Agency (NITDA) – Scan-ICT.
Nigeria Random sample within each state of Nigeria.
Statistics Norway – Use of informa-tion and communication technology in public administration.
Norway Census of in-scope government organiza-tions.
Statistics Norway – ICT usage in mu-nicipalities and county municipalities.
Norway Census of in-scope government organiza-tions.
Information Technology Authority – ICT Usage in Government Survey.
Oman Census of in-scope government organiza-tions.
Information & Communication Tech-nology Agency of Sri Lanka (ICTA) – Government Organizations Employ-ees Survey.
Sri Lanka Stratified random sample of government organizations (Colombo-based offices and provincial/regional organizations) and gov-ernment employees (strata were executive officers and non-executive officers).
Information & Communication Tech-nology Agency of Sri Lanka (ICTA) – Survey on ICT Usage in the Govern-ment Sector.
Sri Lanka Stratified sample, by type of entity.
Source: Eurostat (2011) and metadata from annex 1.
Sample size201. The sample size is the number of statistical units from (or about) which information is to be col-lected. Determination of the sample size for the sampled portion of the population of government units is based on factors such as sample design used, variability of the characteristic of interest, level of detail required for the estimates, acceptable sampling error associated with the estimates, available resources, and respondent burden constraints.
202. In general, a larger sample size will result in smaller sampling error. However, the larger the sample, the greater the survey costs and level of respondent burden. Some sample designs are more efficient than others, that is, they will produce lower sampling error for the same sample size. An example is a compari-son between simple random sampling and stratified random sampling. The latter should produce lower sampling error for the same sample size, presuming that there is a high level of homogeneity within strata with respect to the variable of interest and that strata are as different as possible, again, with respect to the variable of interest.
203. The precision of an estimate reflects the sampling error. It can be expressed in several ways as described in chapter 9. For a given sample design, precision will improve as the sample size increases. The relationship is not linear, that is, the gain in precision is not directly proportional to the increase in sample size. Statistics Canada (2010) lists a number of factors to consider when determining the required precision.
204. In order to determine the sample size, the required precision and an estimate of the variability of the characteristic of interest are required.30 There is usually more than one characteristic of interest and
30 Statistics Canada (2010) suggests that where the variability of the characteristic to be measured in the survey is unknown, the greatest variability should be assumed. In the case of a variable with only two possible values, this is a 50-50 split in the population.

Manual for measuring e-Government72
the sample size should be based on the characteristic with the highest variability or the one that is most important (Statistics Canada, 2010). While population size is an important factor in determining sample size for small populations, it becomes less important as the population increases.
205. This manual recommends a classification by size, with categories being ranges of persons employed as follows: 1–9, 10–49, 50–249, 250 and above. The sample design needs to support this level of dissemi-nation, with appropriate sample size and stratification. Eurostat (2011) specifies the level of stratification by industry and size in order to achieve the desired precision.
206. Calculations of sample size should take non-response into account, by selecting a larger sample that accounts for non-response. For example, if the response rate is estimated to be 80 per cent and the sample size for the required level of precision is 500, then the sample size should be increased to 625 (noting that 80 per cent of 625 is 500). However, where the characteristics of responding and non-responding entities differ, this strategy may result in a form of bias called non-response bias. Where resources allow, a better strategy for dealing with non-response is to follow-up those respondents who have not replied and encourage them to cooperate, thus increasing the response rate.
207. Statistics Canada (2010) provides sample size formulae for different types of estimates. For a simple random sample (not adjusted for non-response or population size), the sample size required to estimate a proportion, Pˆ, is:
2
2 )ˆ1(ˆ
ePPzn −
=, where z is the desired level of confidence and e is the desired margin of error.
208. The margin of error is equal to z multiplied by the standard error of the estimate. Where the confi-dence interval around the estimate is 95 per cent, the value of z is 1.96.
209. This formula could be adjusted to reflect population size, a different sample design and non-response, as illustrated above. The adjustment for population size is only necessary for small populations
and increases the value of n by a factor of nNN+ .
210. An adjustment for sample design is calculated relative to the efficiency of a simple random sample and is expressed as deff (the design effect), which for a simple random sample is equal to 1. For a strati-fied random sample, deff is generally less than one (and therefore reduces the value of n). An example of sample size calculation for a stratified random sample with three strata is shown in example 9.2 of Statis-tics Canada (2010).
211. For a stratified random sample, the sample size n must be distributed across the strata. This can be done either by distributing n across strata to minimize the variability or by determining the sample size required in each stratum to conform to the desired precision.
212. Regarding the first method, Eurostat (2011) suggests that an efficient way to spread n over strata in the sample sector is to use the Neyman allocation, which allocates a number of organizations to strata inversely proportional with the estimated standard deviation (SD) of the target variable in these strata. The formula for the sample size, nh, of stratum h is:
∑ ××
×=hh
hhh SN
SNnn
, where Nh is the number of units in stratum h, Sh is the true SD for the target vari-able in stratum h. In practice, the value of Sh will be an estimate, often based on previous surveys.
213. ABS (2012b) and Statistics Canada (2010) provide information on several methods of allocating sample size, including Neyman allocation.
73Manual for measuring e-Government
Website surveys214. It should be reiterated that the kind of information obtainable from surveys of websites is quite different from that available from surveys of government units. While the first are suitable for collecting information about the services available via government websites, the second are suitable for ascertaining information on the proportion of government units with particular characteristics.
215. Website surveys were discussed in chapter 5 – Data sources and collection methods. One of the methods of collecting data for EG7 is to search government websites for information on services offered. It is likely that the approach taken will differ between countries and no particular methodology is pro-posed. However, readers may be interested in examining the approach taken by the Czech Republic (annex 1) and the case study in this manual of the research exercise undertaken to compile EG7 for Aus-tralia (annex 3).
Manual for measuring e-Government74
Chapter 8. Data processing
216. This chapter provides information on the processing of collected survey data. It covers despatch and collection control, data entry, data editing and estimation. Chapter 10 covers dissemination, including tabulation of the core indicator data.
217. References are made in this chapter to ABS (2012b), Eurostat (2011), ITU (2009), Statistics Canada (2010) and UNCTAD (2009).
Despatch and collection control218. Despatch and collection control refers to the processes involved in despatching (sending out) and receiving survey forms. Processes include recording the status of forms (for example, despatched, out-standing, received), generating reminder action for non-respondents, and producing management infor-mation on survey progress. These tasks may be manual or automated, and functionality varies with the type of survey.
219. This part of the data processing cycle includes action to increase survey response rates. As we have seen in earlier chapters, low response rates are likely to increase the level of both sampling and non-sam-pling survey error. Follow-up action directed to respondents who have not responded to the survey can be a very good investment of time and resources. Follow-up procedures include:
• Sending reminder letters and/or e-mails (these can be increasingly demanding, especially if backed up by legislation)
• Telephoning respondents• Meeting respondents in person.31
220. If time permits, respondents should be offered additional time to return their questionnaires if they request it. Such extensions, as well as other communications, need to be recorded and tracked in despatch and collection control systems.
Data entry221. For surveys, data entry may occur at the time of a personal interview, particularly where CAPI or CATI programs are used. It may be performed by the respondent in cases of electronic form completion. Where completed forms are scanned, there is no need for data entry (except to correct scanning errors and codes etc.). Table 4 in chapter 5 provides information on data collection techniques.
222. Data entry commonly occurs as a distinct process (typically from completed self-enumerated forms mailed back to the data collection agency), undertaken by either a specialized data entry unit of the agency or the team conducting the survey.
223. Data entry also includes coding, for example, converting written questions to codes, assigning a classification code (for example, for employment size) and completing office use only fields. These activities are most likely to be performed by the survey processing team.
31 Such procedures are in addition to good questionnaire design and campaigns to encourage response, such as use of covering letters signed by high-profile advocates of the survey (e.g. a Minister of State) and other public relations techniques.
75Manual for measuring e-Government
224. As with other aspects of survey implementation, it is important to minimize non-sampling error from data entry – by good training, ongoing quality control and effective data entry procedures. Keying accuracy can be enhanced by using techniques such as check digits32 and real-time edits.33
225. Some data entry errors may also be discovered during data editing as described below.
Data editing226. Statistical information provided by respondents can contain various types of errors. They include incorrect data, missing data, incorrect classifications and inconsistent responses between questions. As we saw in chapter 6, good question and questionnaire design should reduce error on self-enumerated and interviewer-administered forms.
227. Errors can also arise through data processing occurring after the questionnaire has been completed by the respondent. Such errors include keying or coding errors, as discussed above, scanning errors and changes applied incorrectly by the collection agency (for example, in responding to an error found during editing). In order to minimize such introduced errors, procedures should be comprehensive and well-tested, and quality control ongoing.
228. Despite good survey instruments and data processing procedures, data editing will still be required. There are two broad types of edits, microedits and macroedits. These may be known by other names, such as input and output editing respectively.
Microedits229. Microedits are those edits applied to individual questionnaires. They range from preliminary checks for completeness to responses to computer-generated edit failure messages. Microedits can be classified and described (ITU, 2009), as follows:
• Validity and range edits, for instance, only numbers can be entered in a numerical field, categor-ical variables can only have a predefined value (for example, gender can be coded only as 1 or 2) or reported value is consistent with external data (such as a reasonable organization size range).
• Skip edits verify that the logic of the questionnaire has been followed, for instance, that the correct populations respond to each question. In a CAPI or CATI environment, the program will usually determine the skips, so errors should not occur if the programming has been done correctly.
• Consistency checks determine whether the information in the questionnaire is internally con-sistent, for instance, organizations with Internet access should report a non-zero value for the number of persons employed using the Internet.
• Typographical checks (to find keying errors by the interviewer or data entry operator); these may be difficult to find and may be discovered as a result of other edits or through check-add (or control) totals or check digits.
230. Edit failures can be categorized as fatal or non-fatal, with the former being a definite error and the latter being a likely error. Fatal data errors are those that are logically impossible and will include data components not adding to a total.34 A large number of fatal errors in a set of records should be investi-
32 A check digit is a number or letter in a keyed sequence, the value of which is derived from a function involving the other digits in the sequence. If a data entry error is made, the derived version of the check digit will differ from the actual check digit, thus signalling that a keying error has been made. Check digits are typically used for record identifiers and codes.33 For example, a check-add of components against total of numerical data as data are entered.34 Apart from rounding differences, a mismatch between a total and the sum of its components indicates an error in the total or at least one of the components.
Manual for measuring e-Government76
gated as it may indicate an error in the editing program or an illogical sequence in a questionnaire. Fatal errors need to be resolved before compromised data records are incorporated into any final tabulation of results.35 The resolution could be to amend the values causing the failures or to omit the records in error. Both solutions have implications for the final calculation of estimates.
231. The process of microediting should be optimized to produce good results for reasonable effort. It will often not be feasible to perform and query every non-fatal error. In fact, Statistics Canada (2010) deals with this subject at some length36 and makes the point that excessive editing and data amendment may actually introduce bias, because the assumptions of the editor can take precedence over the trends in actual responses.
232. To resolve an edit failure, editors can:
• Query the respondent – this will often be impractical and will be expensive if done on a large scale.
• Ignore the apparent error – while this may introduce bias, for non-fatal error failures with a very low impact, this may be a reasonable strategy.
• Remove the incorrect data – again, this may introduce bias and, on a large scale, increase sam-pling error.37
• Change the data either using judgement or some form of objective imputation (this is exam-ined later in this chapter) – in either case, this should be done carefully in order not to bias the results.
233. Table 7 presents a number of suggested microlevel edits for e-government data for indicators EG1 to EG6. They could be applied during an interview (either as prompts to the interviewer using a paper form or as part of CATI/CAPI programs), during data entry or following data entry (or both) as a separate editing process. Fatal errors are annotated with (F).
35 Logically, the error will carry through to tabulated data, even though the effect might be very small if the number of fatal errors is small.36 The process is referred to as selective editing.37 This is because it has the effect of reducing sample size.
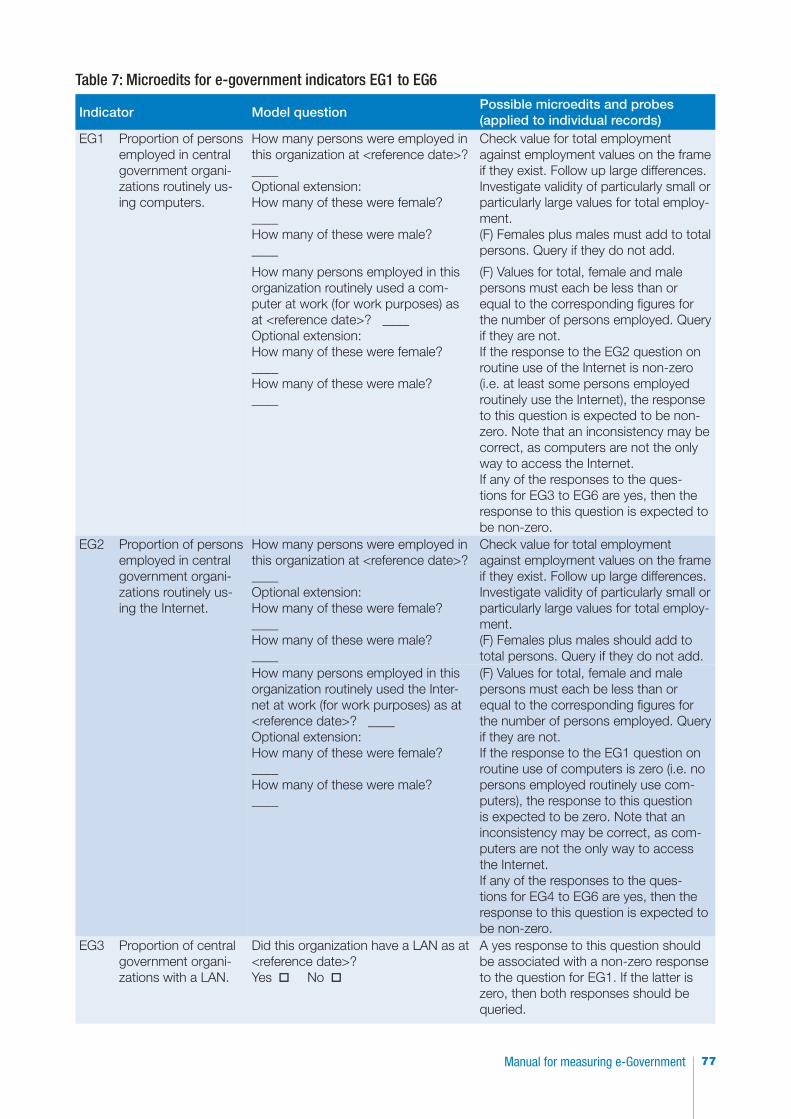
77Manual for measuring e-Government
Table 7: Microedits for e-government indicators EG1 to EG6
Indicator Model questionPossible microedits and probes (applied to individual records)
EG1 Proportion of persons employed in central government organi-zations routinely us-ing computers.
How many persons were employed in this organization at <reference date>? ____ Optional extension: How many of these were female? ____ How many of these were male? ____
Check value for total employment against employment values on the frame if they exist. Follow up large differences.Investigate validity of particularly small or particularly large values for total employ-ment.(F) Females plus males must add to total persons. Query if they do not add.
How many persons employed in this organization routinely used a com-puter at work (for work purposes) as at <reference date>? ____ Optional extension:How many of these were female? ____ How many of these were male? ____
(F) Values for total, female and male persons must each be less than or equal to the corresponding figures for the number of persons employed. Query if they are not.If the response to the EG2 question on routine use of the Internet is non-zero (i.e. at least some persons employed routinely use the Internet), the response to this question is expected to be non-zero. Note that an inconsistency may be correct, as computers are not the only way to access the Internet.If any of the responses to the ques-tions for EG3 to EG6 are yes, then the response to this question is expected to be non-zero.
EG2 Proportion of persons employed in central government organi-zations routinely us-ing the Internet.
How many persons were employed in this organization at <reference date>? ____ Optional extension: How many of these were female? ____ How many of these were male? ____
Check value for total employment against employment values on the frame if they exist. Follow up large differences.Investigate validity of particularly small or particularly large values for total employ-ment.(F) Females plus males should add to total persons. Query if they do not add.
How many persons employed in this organization routinely used the Inter-net at work (for work purposes) as at <reference date>? ____ Optional extension:How many of these were female? ____ How many of these were male? ____
(F) Values for total, female and male persons must each be less than or equal to the corresponding figures for the number of persons employed. Query if they are not.If the response to the EG1 question on routine use of computers is zero (i.e. no persons employed routinely use com-puters), the response to this question is expected to be zero. Note that an inconsistency may be correct, as com-puters are not the only way to access the Internet.If any of the responses to the ques-tions for EG4 to EG6 are yes, then the response to this question is expected to be non-zero.
EG3 Proportion of central government organi-zations with a LAN.
Did this organization have a LAN as at <reference date>?Yes □ No □
A yes response to this question should be associated with a non-zero response to the question for EG1. If the latter is zero, then both responses should be queried.
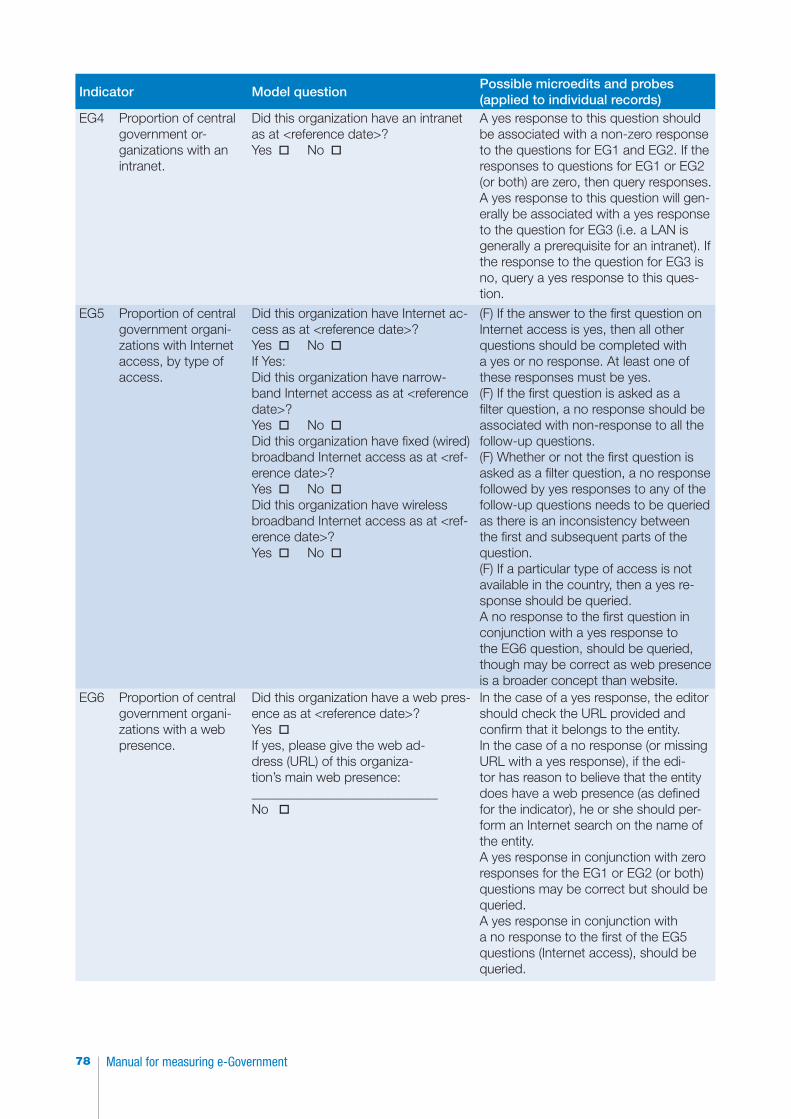
Manual for measuring e-Government78
Indicator Model questionPossible microedits and probes (applied to individual records)
EG4 Proportion of central government or-ganizations with an intranet.
Did this organization have an intranet as at <reference date>?Yes □ No □
A yes response to this question should be associated with a non-zero response to the questions for EG1 and EG2. If the responses to questions for EG1 or EG2 (or both) are zero, then query responses.A yes response to this question will gen-erally be associated with a yes response to the question for EG3 (i.e. a LAN is generally a prerequisite for an intranet). If the response to the question for EG3 is no, query a yes response to this ques-tion.
EG5 Proportion of central government organi-zations with Internet access, by type of access.
Did this organization have Internet ac-cess as at <reference date>?Yes □ No □If Yes:Did this organization have narrow-band Internet access as at <reference date>?Yes □ No □Did this organization have fixed (wired) broadband Internet access as at <ref-erence date>?Yes □ No □Did this organization have wireless broadband Internet access as at <ref-erence date>?Yes □ No □
(F) If the answer to the first question on Internet access is yes, then all other questions should be completed with a yes or no response. At least one of these responses must be yes. (F) If the first question is asked as a filter question, a no response should be associated with non-response to all the follow-up questions. (F) Whether or not the first question is asked as a filter question, a no response followed by yes responses to any of the follow-up questions needs to be queried as there is an inconsistency between the first and subsequent parts of the question.(F) If a particular type of access is not available in the country, then a yes re-sponse should be queried.A no response to the first question in conjunction with a yes response to the EG6 question, should be queried, though may be correct as web presence is a broader concept than website.
EG6 Proportion of central government organi-zations with a web presence.
Did this organization have a web pres-ence as at <reference date>?Yes □ If yes, please give the web ad-dress (URL) of this organiza-tion’s main web presence: ____________________________No □
In the case of a yes response, the editor should check the URL provided and confirm that it belongs to the entity. In the case of a no response (or missing URL with a yes response), if the edi-tor has reason to believe that the entity does have a web presence (as defined for the indicator), he or she should per-form an Internet search on the name of the entity.A yes response in conjunction with zero responses for the EG1 or EG2 (or both) questions may be correct but should be queried.A yes response in conjunction with a no response to the first of the EG5 questions (Internet access), should be queried.
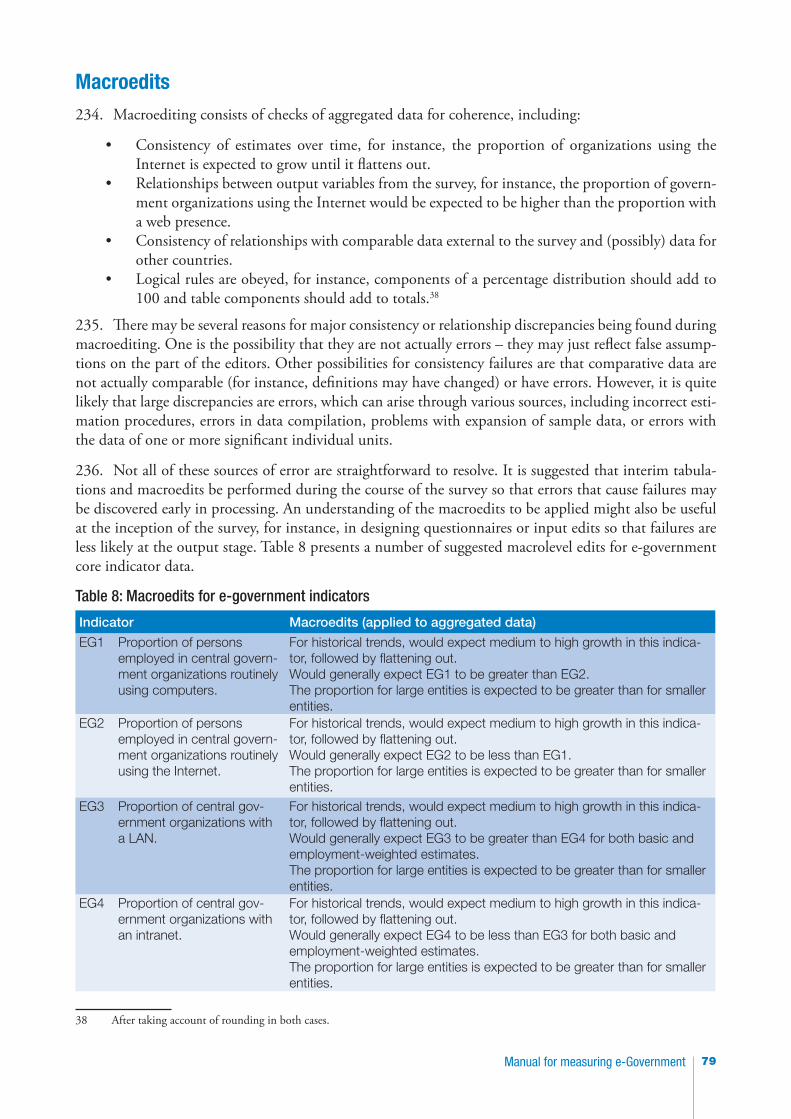
79Manual for measuring e-Government
Macroedits234. Macroediting consists of checks of aggregated data for coherence, including:
• Consistency of estimates over time, for instance, the proportion of organizations using the Internet is expected to grow until it flattens out.
• Relationships between output variables from the survey, for instance, the proportion of govern-ment organizations using the Internet would be expected to be higher than the proportion with a web presence.
• Consistency of relationships with comparable data external to the survey and (possibly) data for other countries.
• Logical rules are obeyed, for instance, components of a percentage distribution should add to 100 and table components should add to totals.38
235. There may be several reasons for major consistency or relationship discrepancies being found during macroediting. One is the possibility that they are not actually errors – they may just reflect false assump-tions on the part of the editors. Other possibilities for consistency failures are that comparative data are not actually comparable (for instance, definitions may have changed) or have errors. However, it is quite likely that large discrepancies are errors, which can arise through various sources, including incorrect esti-mation procedures, errors in data compilation, problems with expansion of sample data, or errors with the data of one or more significant individual units.
236. Not all of these sources of error are straightforward to resolve. It is suggested that interim tabula-tions and macroedits be performed during the course of the survey so that errors that cause failures may be discovered early in processing. An understanding of the macroedits to be applied might also be useful at the inception of the survey, for instance, in designing questionnaires or input edits so that failures are less likely at the output stage. Table 8 presents a number of suggested macrolevel edits for e-government core indicator data.
Table 8: Macroedits for e-government indicators
Indicator Macroedits (applied to aggregated data)
EG1 Proportion of persons employed in central govern-ment organizations routinely using computers.
For historical trends, would expect medium to high growth in this indica-tor, followed by flattening out.Would generally expect EG1 to be greater than EG2.The proportion for large entities is expected to be greater than for smaller entities.
EG2 Proportion of persons employed in central govern-ment organizations routinely using the Internet.
For historical trends, would expect medium to high growth in this indica-tor, followed by flattening out.Would generally expect EG2 to be less than EG1.The proportion for large entities is expected to be greater than for smaller entities.
EG3 Proportion of central gov-ernment organizations with a LAN.
For historical trends, would expect medium to high growth in this indica-tor, followed by flattening out.Would generally expect EG3 to be greater than EG4 for both basic and employment-weighted estimates.The proportion for large entities is expected to be greater than for smaller entities.
EG4 Proportion of central gov-ernment organizations with an intranet.
For historical trends, would expect medium to high growth in this indica-tor, followed by flattening out.Would generally expect EG4 to be less than EG3 for both basic and employment-weighted estimates.The proportion for large entities is expected to be greater than for smaller entities.
38 After taking account of rounding in both cases.
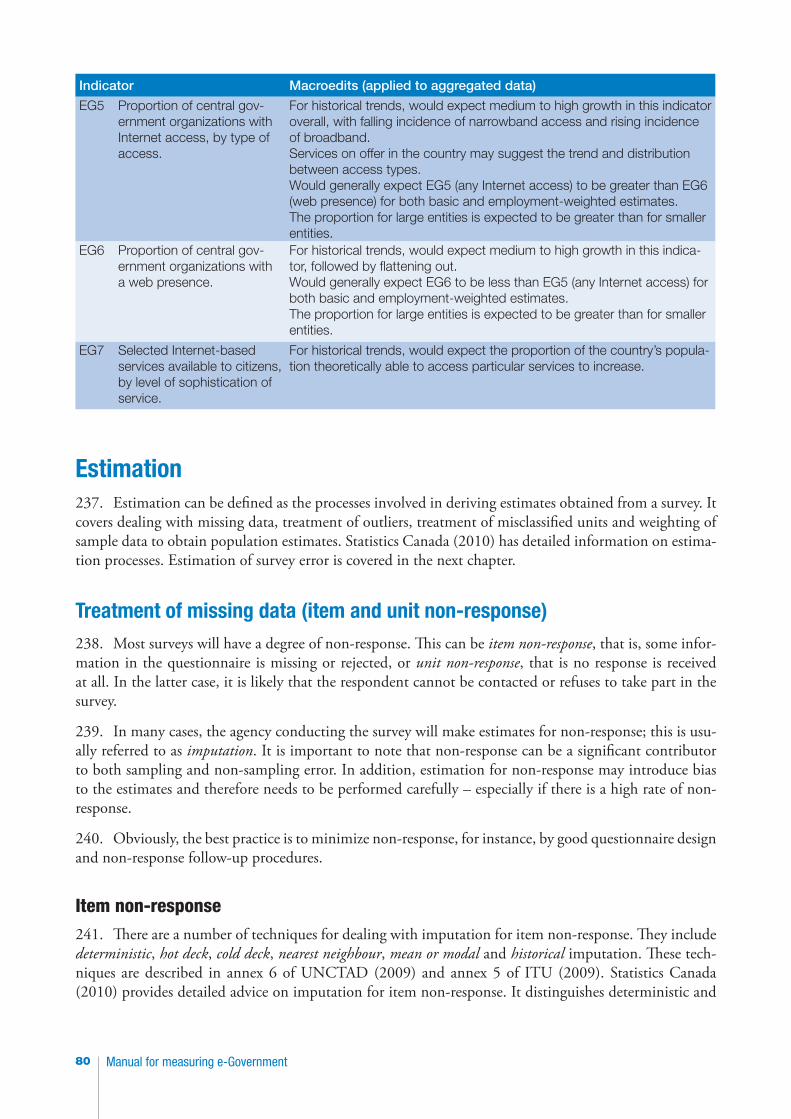
Manual for measuring e-Government80
Indicator Macroedits (applied to aggregated data)
EG5 Proportion of central gov-ernment organizations with Internet access, by type of access.
For historical trends, would expect medium to high growth in this indicator overall, with falling incidence of narrowband access and rising incidence of broadband.Services on offer in the country may suggest the trend and distribution between access types.Would generally expect EG5 (any Internet access) to be greater than EG6 (web presence) for both basic and employment-weighted estimates.The proportion for large entities is expected to be greater than for smaller entities.
EG6 Proportion of central gov-ernment organizations with a web presence.
For historical trends, would expect medium to high growth in this indica-tor, followed by flattening out.Would generally expect EG6 to be less than EG5 (any Internet access) for both basic and employment-weighted estimates.The proportion for large entities is expected to be greater than for smaller entities.
EG7 Selected Internet-based services available to citizens, by level of sophistication of service.
For historical trends, would expect the proportion of the country’s popula-tion theoretically able to access particular services to increase.
Estimation237. Estimation can be defined as the processes involved in deriving estimates obtained from a survey. It covers dealing with missing data, treatment of outliers, treatment of misclassified units and weighting of sample data to obtain population estimates. Statistics Canada (2010) has detailed information on estima-tion processes. Estimation of survey error is covered in the next chapter.
Treatment of missing data (item and unit non-response)238. Most surveys will have a degree of non-response. This can be item non-response, that is, some infor-mation in the questionnaire is missing or rejected, or unit non-response, that is no response is received at all. In the latter case, it is likely that the respondent cannot be contacted or refuses to take part in the survey.
239. In many cases, the agency conducting the survey will make estimates for non-response; this is usu-ally referred to as imputation. It is important to note that non-response can be a significant contributor to both sampling and non-sampling error. In addition, estimation for non-response may introduce bias to the estimates and therefore needs to be performed carefully – especially if there is a high rate of non-response.
240. Obviously, the best practice is to minimize non-response, for instance, by good questionnaire design and non-response follow-up procedures.
Item non-response241. There are a number of techniques for dealing with imputation for item non-response. They include deterministic, hot deck, cold deck, nearest neighbour, mean or modal and historical imputation. These tech-niques are described in annex 6 of UNCTAD (2009) and annex 5 of ITU (2009). Statistics Canada (2010) provides detailed advice on imputation for item non-response. It distinguishes deterministic and
81Manual for measuring e-Government
stochastic imputation techniques, where the former has only one possible imputed value corresponding to the unit data and the latter involves a degree of randomness in determining the imputed value.
242. Deterministic imputation techniques include:
• Deductive (the value is deduced based on other data)• Mean value (the missing value is replaced with the mean value for the imputation class)• Ratio/regression (based on a model that makes use of the relationship that exists between vari-
ables)• Sequential hot deck (uses information from the previous clean donor record in the imputation
class to replace missing or inconsistent values)• Sequential cold deck (uses donors from another source, for example, historical or census data)• Nearest neighbour (uses a donor closest to the recipient in terms of matching variables within
the imputation class).
243. Stochastic imputation techniques involve adding a random residual from an appropriate distribu-tion or model to the imputed value. An example is random hot deck imputation.
244. Imputation guidelines provided by Statistics Canada include:
• Imputed records should be as similar as possible to the original record.• There should be an imputation audit trail, with imputed values flagged and the imputation
methodology identified.• Imputed records should satisfy microedits.• Imputation methods should aim to reduce non-response bias.
245. For business ICT use surveys, Eurostat (2011) describes both hot deck imputation, using donor data from similar units, and historical imputation, using data from a previous response if available. How-ever, Eurostat does not recommend that countries impute for missing data and instead recommends contacting respondents and querying them about the missing data.
246. In cases where a large amount of data from a questionnaire is missing or clearly incorrect, then the unit may be treated as a unit non-response.
Unit non-response247. Unit non-response can introduce bias to survey results in cases where non-responding units are not representative of responding units. It may also increase sampling error because of an effectively smaller sample size.
248. Unit non-response can be dealt with by following up with non-respondents and this is recom-mended where it is possible to do so. In particular, units that make a significant contribution to sample estimates, or are particularly large, should be followed up.
249. A common algebraic method of dealing with non-response involves adjustment of sample design weights to reflect non-response. For example, if a stratum has 10 units out of 100 selected, the design weight factor =100/10=10. However, if only 8 units respond, then the expansion factor can be increased to 100/8=12.5. Note that this technique also works if a stratum is completely enumerated.
250. Where population data are known, population weighting can be used to adjust for non-response. This is equivalent to post-stratification, where survey data are benchmarked against known population totals.
Manual for measuring e-Government82
251. These techniques are described in more detail by Eurostat (2011), Statistics Canada (2010) and UNCTAD (2009).
Treatment of outliers252. An outlier is a sample value that is inconsistent with those of similar units (for example, those in the same stratum). There is a variety of methods of dealing with outliers, one of which is to assume that the inconsistent value represents anomalies in the population and can be accepted on that basis. Other options are to delete the unit, change its value or give it a weight of 1.
253. For the core indicators, EG3 to EG6, outliers are less likely to cause a problem as the only volume measure is employment, and this can be compared against the frame value. Table 7 – Microedits for e-gov-ernment indicators EG1 to EG6 – suggests that this edit be performed and also suggests investigating the validity of particularly small or particularly large reported values for total employment. Where the frame and reported employment values for a particular sample unit are inconsistent, the unit may be treated as misclassified. This is discussed below. For indicators EG1 and EG2, outliers may be problematic, for example, if a selected unit shows an unusually low or high proportion of employees using ICT. Statistics Canada (2010) has detailed information on the treatment of outliers.
Treatment of misclassified units254. In most cases where government units are sampled, stratification will be based on information from the survey frame (employment size is most likely). A common problem for business (and therefore government organization) surveys is that frame errors will cause some units to be allocated to an incorrect stratum (or incorrectly included in, or excluded from, scope). Treatments include:
• Ignoring the misclassification and leaving the unit in its selected stratum with the same stratum weight as other units
• Removing the unit and adjusting stratum weights (this reduces the sample size so should only be done if there is a small number of misclassified units)
• Adjusting the stratum weights to reflect the correct data; see the example in box 17 of UNCTAD (2009).
255. Eurostat (2011) has a useful discussion on treatment of misclassified units in surveys of business use of ICT.
Weighting of data and derivation of estimates256. Weighting up (also called grossing up) is the process of taking sample data and producing estimates for the target population. Population estimates may be calculated using only sample data, or may be a combination of sample data and information from the frame (the number of government organizations or the total number of persons employed in government organizations).
257. There are three calculation methods applying to the core indicators EG1 to EG6:
• Estimates for EG1 and EG2 show the proportion of persons employed routinely using comput-ers/the Internet. These are calculated as the number of persons employed routinely using com-puters/the Internet divided by the total number of persons employed in government organiza-tions. The first, or both estimates, may be calculated from the sample. The second estimate may be derived from the frame.
83Manual for measuring e-Government
• Estimates for EG3 to EG6 (basic indicator) show the proportion of government organizations with a particular characteristic. The calculation is the number of government organizations with a particular characteristic divided by the number of government organizations. The first estimate is calculated from the sample and the second comes from the frame.
• Estimates for EG3 to EG6 (employment-weighted estimate) show the proportion of all persons employed in government organizations with a particular characteristic (for example, having a web presence). The resulting indicator is expressed as follows ‘government organizations with a web presence account for x per cent of the total number of persons employed in government organizations’. The calculation is the number of persons employed in government organizations with the characteristic divided by the total number of persons employed in government organi-zations. The first, or both estimates, may be calculated from the sample. The second estimate may be derived from the frame.
258. Eurostat (2011) describes weighting for business use of ICT surveys and covers the three calculation methods above, assuming a stratified random sample survey design. UNCTAD (2009) provides formulae for the first two calculation methods above.
259. Core indicators EG1 and EG2 are examples where ratio estimation might be appropriate. In this situation, both the numerators (total number of persons employed in government organizations, rou-tinely using computers/the Internet) and the denominator (total number of persons employed in central government organizations) would be estimated from the sample. However, if there is high quality infor-mation from the survey frame on employment, then a proportion estimator is probably appropriate.
260. For proportion variables of the type ‘proportion of government organizations with a particular characteristic’ (for example, EG6, basic indicator), Eurostat recommends weighting by the number of units in strata.
261. Example 4 presents the formulae for producing an estimate for EG6 from both a simple and a stratified random sample.
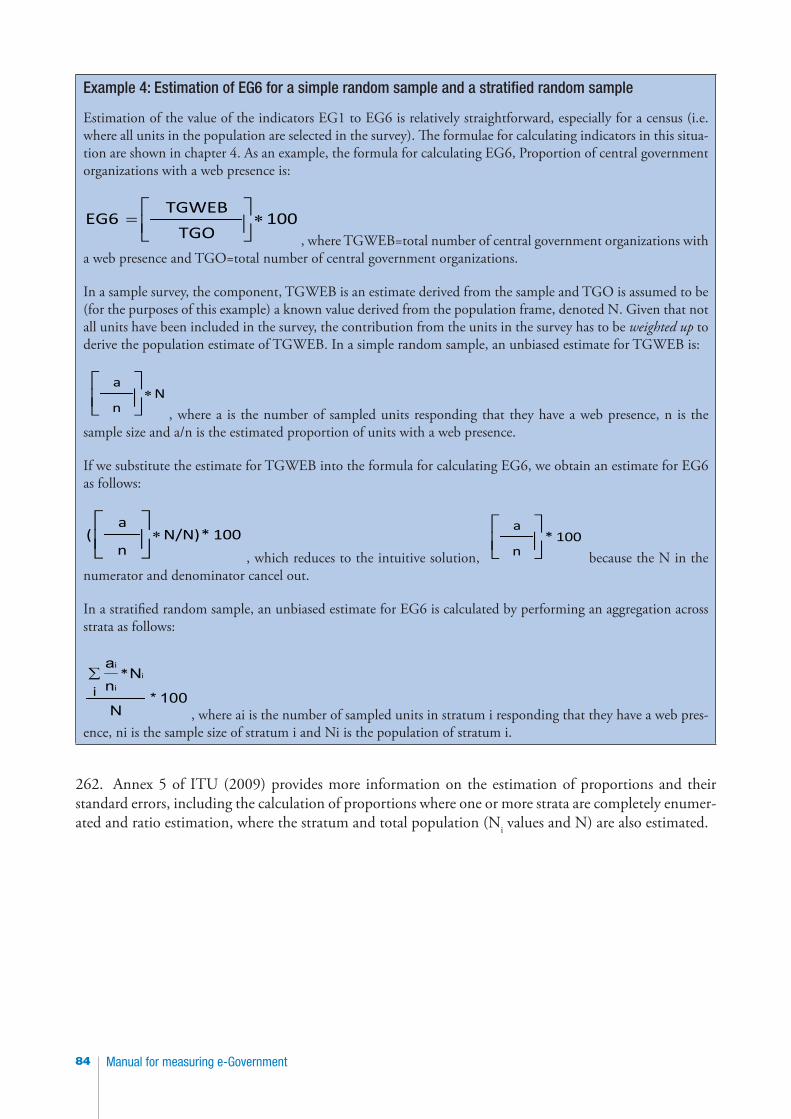
Manual for measuring e-Government84
Example 4: Estimation of EG6 for a simple random sample and a stratified random sample
Estimation of the value of the indicators EG1 to EG6 is relatively straightforward, especially for a census (i.e. where all units in the population are selected in the survey). The formulae for calculating indicators in this situa-tion are shown in chapter 4. As an example, the formula for calculating EG6, Proportion of central government organizations with a web presence is:
100 TGO
TGWEB EG6 ∗=
, where TGWEB=total number of central government organizations with a web presence and TGO=total number of central government organizations.
In a sample survey, the component, TGWEB is an estimate derived from the sample and TGO is assumed to be (for the purposes of this example) a known value derived from the population frame, denoted N. Given that not all units have been included in the survey, the contribution from the units in the survey has to be weighted up to derive the population estimate of TGWEB. In a simple random sample, an unbiased estimate for TGWEB is:
N n
a ∗
, where a is the number of sampled units responding that they have a web presence, n is the sample size and a/n is the estimated proportion of units with a web presence.
If we substitute the estimate for TGWEB into the formula for calculating EG6, we obtain an estimate for EG6 as follows:
100* N/N) n
a ( ∗
, which reduces to the intuitive solution, 100*
n
a
because the N in the numerator and denominator cancel out.
In a stratified random sample, an unbiased estimate for EG6 is calculated by performing an aggregation across strata as follows:
100*N
Nn
a
i
i∑i
* i
, where ai is the number of sampled units in stratum i responding that they have a web pres-ence, ni is the sample size of stratum i and Ni is the population of stratum i.
262. Annex 5 of ITU (2009) provides more information on the estimation of proportions and their standard errors, including the calculation of proportions where one or more strata are completely enumer-ated and ratio estimation, where the stratum and total population (Ni values and N) are also estimated.
85Manual for measuring e-Government
Chapter 9. Data quality
263. This chapter provides general information on data quality and then considers particular data quality issues relating to the core e-government indicators.
264. References are made in this chapter to ABS (2009), Eurostat (2009 and 2011), ITU (2009), Statis-tics Canada (2010) and UNCTAD (2009).
Accuracy of estimates265. Accuracy of estimates reflects both sampling error (precision) and non-sampling error. In practice, there may need to be a trade-off between sampling and non-sampling error. For example, use of smaller sample sizes will generally increase sampling error. However, it may also enable more careful data collec-tion and processing, thus reducing non-sampling error.
266. Accuracy is defined by Eurostat (2009) as follows: “The accuracy of statistical outputs in the general statistical sense is the degree of closeness of estimates to the true values.”
Precision267. The precision of an estimate reflects the sampling error so the concept applies to sample surveys, rather than to censuses. Precision can be expressed as the coefficient of variation (CV), also called relative standard error (RSE). The CV is calculated as the standard error of the estimate divided by the value of the estimate. It may then be multiplied by 100 to convert it to a percentage (for instance, as 3 per cent of the value of the estimate). This method of expressing precision provides scale in relation to the estimate and also enables simple comparison of the sampling error around different estimates and between countries.
268. For estimates that are proportions and are expressed as percentages, the precision may be expressed as the standard error in percentage points. For business ICT use surveys, Eurostat (2011) specifies a stand-ard error of less than or equal to 2 percentage points for the overall population and 5 percentage points for different subgroups of the population (for example, size classes).
269. Sampling error can also be expressed as a confidence interval around an estimate, for example, a 95 per cent confidence interval refers to the probability (95 per cent) that the parameter to be estimated will lie within an interval around the estimate of +/– 2 standard errors.39 This calculation assumes that the estimate conforms with a normal statistical distribution, an assumption that usually applies well to large samples.
270. Example 5 shows the different methods of expressing precision for indicator EG6.
39 This is an approximation; the multiplier is actually 1.96.
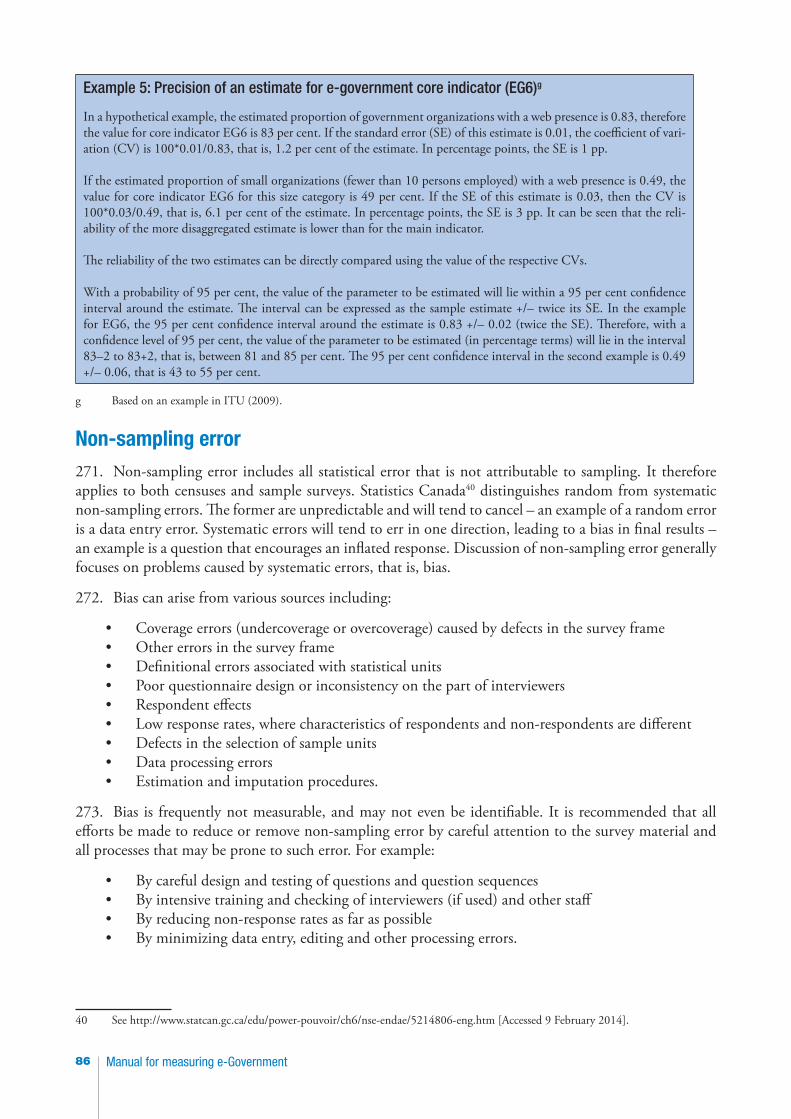
Manual for measuring e-Government86
Example 5: Precision of an estimate for e-government core indicator (EG6)g
In a hypothetical example, the estimated proportion of government organizations with a web presence is 0.83, therefore the value for core indicator EG6 is 83 per cent. If the standard error (SE) of this estimate is 0.01, the coefficient of vari-ation (CV) is 100*0.01/0.83, that is, 1.2 per cent of the estimate. In percentage points, the SE is 1 pp.
If the estimated proportion of small organizations (fewer than 10 persons employed) with a web presence is 0.49, the value for core indicator EG6 for this size category is 49 per cent. If the SE of this estimate is 0.03, then the CV is 100*0.03/0.49, that is, 6.1 per cent of the estimate. In percentage points, the SE is 3 pp. It can be seen that the reli-ability of the more disaggregated estimate is lower than for the main indicator.
The reliability of the two estimates can be directly compared using the value of the respective CVs.
With a probability of 95 per cent, the value of the parameter to be estimated will lie within a 95 per cent confidence interval around the estimate. The interval can be expressed as the sample estimate +/– twice its SE. In the example for EG6, the 95 per cent confidence interval around the estimate is 0.83 +/– 0.02 (twice the SE). Therefore, with a confidence level of 95 per cent, the value of the parameter to be estimated (in percentage terms) will lie in the interval 83–2 to 83+2, that is, between 81 and 85 per cent. The 95 per cent confidence interval in the second example is 0.49 +/– 0.06, that is 43 to 55 per cent.
g Based on an example in ITU (2009).
Non-sampling error271. Non-sampling error includes all statistical error that is not attributable to sampling. It therefore applies to both censuses and sample surveys. Statistics Canada40 distinguishes random from systematic non-sampling errors. The former are unpredictable and will tend to cancel – an example of a random error is a data entry error. Systematic errors will tend to err in one direction, leading to a bias in final results – an example is a question that encourages an inflated response. Discussion of non-sampling error generally focuses on problems caused by systematic errors, that is, bias.
272. Bias can arise from various sources including:
• Coverage errors (undercoverage or overcoverage) caused by defects in the survey frame• Other errors in the survey frame• Definitional errors associated with statistical units• Poor questionnaire design or inconsistency on the part of interviewers• Respondent effects• Low response rates, where characteristics of respondents and non-respondents are different• Defects in the selection of sample units• Data processing errors• Estimation and imputation procedures.
273. Bias is frequently not measurable, and may not even be identifiable. It is recommended that all efforts be made to reduce or remove non-sampling error by careful attention to the survey material and all processes that may be prone to such error. For example:
• By careful design and testing of questions and question sequences• By intensive training and checking of interviewers (if used) and other staff• By reducing non-response rates as far as possible• By minimizing data entry, editing and other processing errors.
40 See http://www.statcan.gc.ca/edu/power-pouvoir/ch6/nse-endae/5214806-eng.htm [Accessed 9 February 2014].
87Manual for measuring e-Government
Assessing data quality274. A high level of data quality is a primary goal of survey statisticians. As this manual has emphasized, data quality should be considered at each stage of the survey process. As financial and skilled resources needed to conduct a survey are always limited, data quality must be maximized within resource con-straints. Appropriate quality control and quality assurance techniques should be practised, as discussed in annex B of Statistics Canada (2010).
275. Data quality can be viewed in terms of several dimensions as follows:41
• Institutional environment – the institutional and organizational factors that influence the effec-tiveness and credibility of the statistical agency (including impartiality, independence and com-mitment to data quality).
• Relevance – the degree to which users’ current and potential needs are met and the alignment of concepts with the real world.
• Accuracy – a function of sampling and non-sampling error, as discussed above.• Timeliness and punctuality – how quickly results are released and whether expected release
dates are met.• Accessibility – how easily data can be obtained by national and international users.• Interpretability – the availability of metadata and other information enabling users to interpret
the results.• Coherence – the degree to which the statistical processes by which related outputs were gener-
ated used the same standards (classifications, definitions, target populations, methods).• Comparability – over time, between jurisdictions and across countries.
276. It is recommended that countries use quality dimensions in planning and conducting surveys of e-government. More specific guidance may be found from the experiences of those statistical organiza-tions that have data quality frameworks based on these or similar dimensions. They include: the Austral-ian Bureau of Statistics (2009) Data Quality Framework; Eurostat (2009) Standard for Quality Reports; and Statistics Canada (2002) Quality Assurance Framework.
Documentation and evaluation277. An important element of data quality is thorough documentation of all stages of the survey. This will start at the planning stage, with descriptions of consultation, budgets, survey methodologies and procedures. Documentation will occur during conduct of the survey, for example, recording changes in sample design during the field phase or changes in expected costs.
278. After the survey is completed, further documentation will describe the collection and present survey data and metadata (as shown in chapter 10).42 Data quality reports produced for internal approval pro-cesses may be more detailed than those for external dissemination and could include information on the results of macroediting (see chapter 8) and an explanation of any divergences from expected findings or long-term trends.
279. In evaluating the success or otherwise of a survey, the views of relevant staff should be obtained as soon as possible after completion of the survey. Evaluation will also compare initial expectations (for example, on resources required) with final outcomes.
41 The list varies slightly across statistical agencies. This list includes all the quality dimensions discussed by the Australian Bureau of Statistics (2009), Eurostat (2009) and Statistics Canada (2010).42 Tables 15 and 16 in chapter 10 present indicator and survey metadata associated with the core e-government indicators. The metadata cover a number of aspects relating to data quality, such as response rate and standard errors.

Manual for measuring e-Government88
Particular data quality issues for the e-government core indicators280. The main data quality issue for the e-government core indicators is ensuring comparability of units, and therefore output, across countries.43 This was discussed earlier (in particular, see chapters 4 and 7) and a large part of this manual is devoted to maximizing comparability across countries, especially by:
• Defining government units in a consistent way• Recommending that output be classified by size of organization, so that units of a particular size
are compared to the same sized units in other countries• Recommending that estimates of EG3 to EG6 be weighted by employment, to reduce the effect
of non-comparability
281. Other particular data quality issues are likely to be similar to those of business surveys of ICT use. They include: understanding by respondents of the technical terms used in a questionnaire, for example, forms of Internet access; and meanings of terms such as intranet and LAN.
282. Statistical issues associated with e-government topics that are not part of the core indicator set are presented in table 5.
43 This may also be an issue at the national level, for instance, when comparing state jurisdictions and making comparisons over time.
89Manual for measuring e-Government
Chapter 10. Dissemination
283. This chapter deals with dissemination of the e-government core indicators. It covers dissemination of data and metadata44 in both national and international contexts. It also provides tabulation plans for all the indicators. Examples showing compilation of data and metadata for EG7 for Australia are presented in annex 3.
Forms of data dissemination284. Data may be released in various media and formats, including:
• Hardcopy publications, summaries or press releases• Electronic publications (for instance, pdf files of hardcopy publications, web publications in
hypertext markup language (html) form)• Web content apart from publications (such as tables,45 press releases)• Social media content (such as Facebook posts, Twitter feeds)• Data files, such as spreadsheets (which may be downloadable from websites, e-mailed to users
or provided on digital media such as CD-ROM).
285. Data may be free or charged, or a combination. For instance, pdf files might be free to download but printed versions, reflecting their cost of production, may be charged for. Hardcopy releases may be provided free to some users, for instance, government departments, but provided at cost to other users. Some agencies provide some free data on their website, but may charge for more detailed data.
286. All released data should be based on a single approved version of the underlying dataset. If revisions are later made, all released data should be subject to revision.
287. Where data are deemed unreliable (usually because of high standard errors), they should be sup-pressed and the reason should be indicated by a symbol in the relevant cell. Where data are suppressed because of confidentiality constraints, this should also be indicated by an appropriate symbol.
National tabulation plans288. Tabulation plans for the core indicators are presented below (tables 9–14), classified according to size per the standards presented in this manual. The example tabulation for core indicators EG1 and EG2 includes the extension to a gender classification. These plans are suitable for national-level dissemination. How to report core indicator data to international organizations is covered later in this chapter.
44 The term ‘metadata’ can be explained as ‘data about data’.45 These may be static or user-generated from an underlying database.
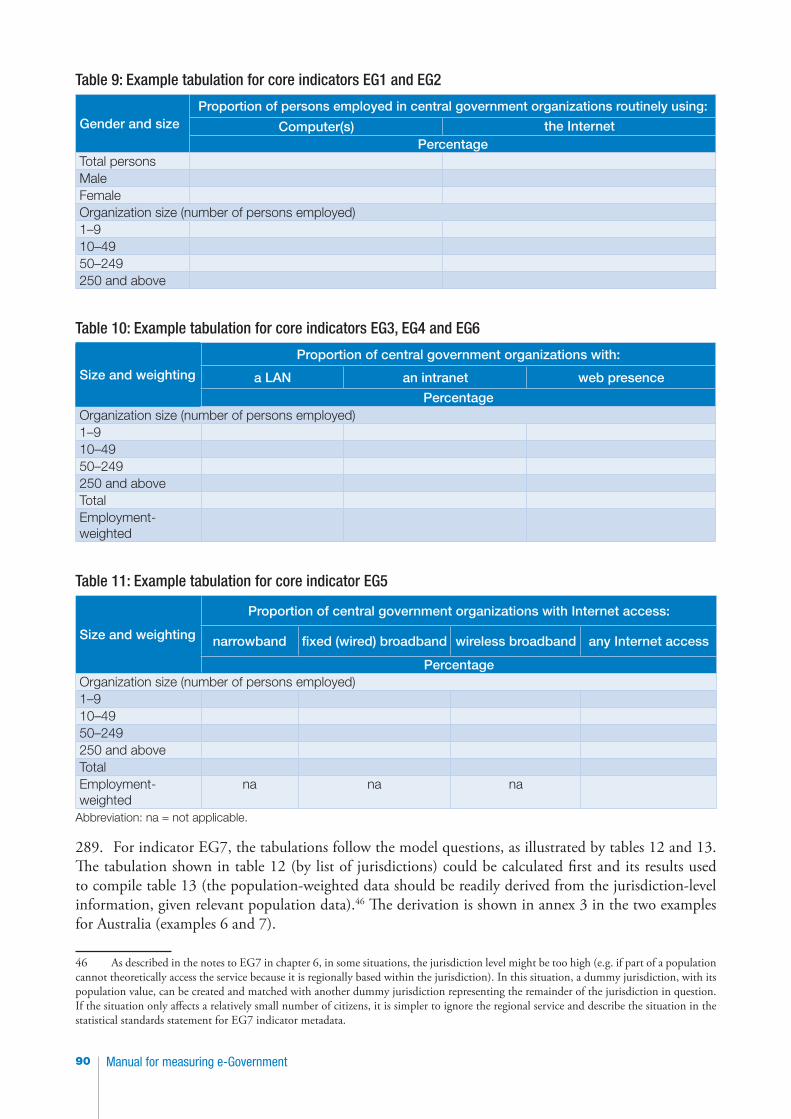
Manual for measuring e-Government90
Table 9: Example tabulation for core indicators EG1 and EG2
Gender and sizeProportion of persons employed in central government organizations routinely using:
Computer(s) the InternetPercentage
Total personsMaleFemaleOrganization size (number of persons employed)1–910–4950–249250 and above
Table 10: Example tabulation for core indicators EG3, EG4 and EG6
Size and weighting
Proportion of central government organizations with:
a LAN an intranet web presence
PercentageOrganization size (number of persons employed)1–910–4950–249250 and aboveTotalEmployment-weighted
Table 11: Example tabulation for core indicator EG5
Size and weighting
Proportion of central government organizations with Internet access:
narrowband fixed (wired) broadband wireless broadband any Internet access
PercentageOrganization size (number of persons employed)1–910–4950–249250 and aboveTotalEmployment-weighted
na na na
Abbreviation: na = not applicable.
289. For indicator EG7, the tabulations follow the model questions, as illustrated by tables 12 and 13. The tabulation shown in table 12 (by list of jurisdictions) could be calculated first and its results used to compile table 13 (the population-weighted data should be readily derived from the jurisdiction-level information, given relevant population data).46 The derivation is shown in annex 3 in the two examples for Australia (examples 6 and 7).
46 As described in the notes to EG7 in chapter 6, in some situations, the jurisdiction level might be too high (e.g. if part of a population cannot theoretically access the service because it is regionally based within the jurisdiction). In this situation, a dummy jurisdiction, with its population value, can be created and matched with another dummy jurisdiction representing the remainder of the jurisdiction in question. If the situation only affects a relatively small number of citizens, it is simpler to ignore the regional service and describe the situation in the statistical standards statement for EG7 indicator metadata.
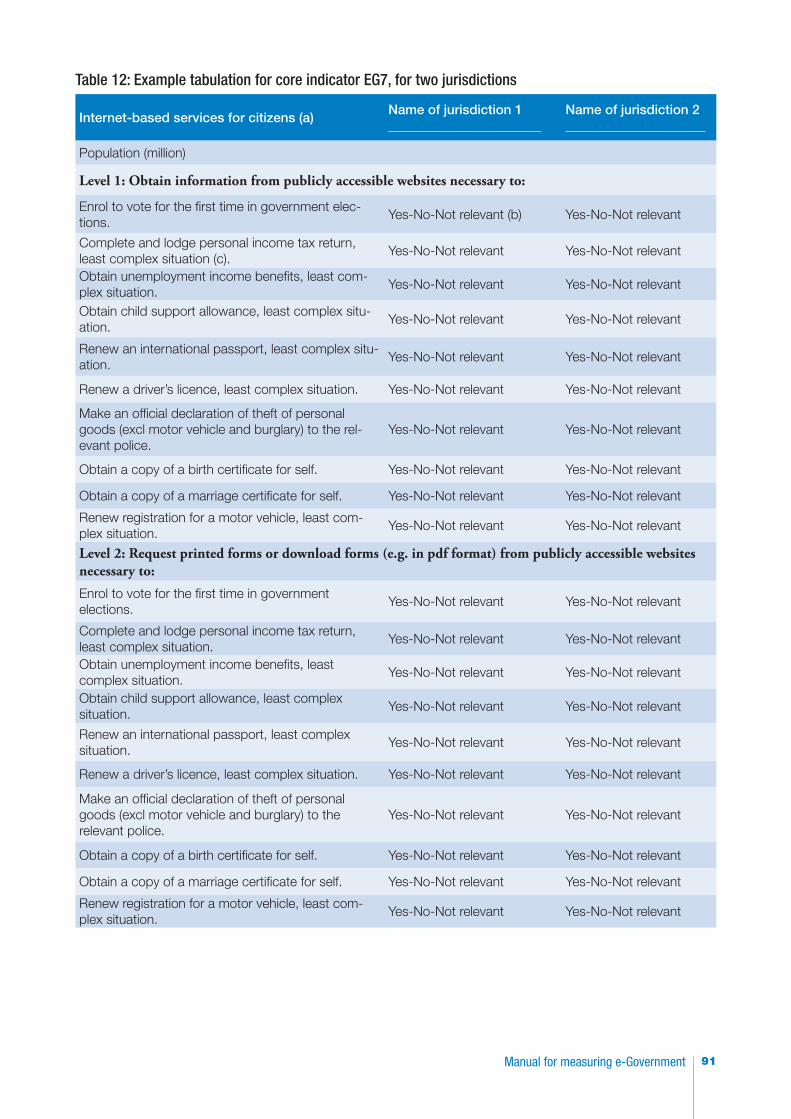
91Manual for measuring e-Government
Table 12: Example tabulation for core indicator EG7, for two jurisdictions
Internet-based services for citizens (a)Name of jurisdiction 1_______________________
Name of jurisdiction 2_____________________
Population (million)
Level 1: Obtain information from publicly accessible websites necessary to:
Enrol to vote for the first time in government elec-tions.
Yes-No-Not relevant (b) Yes-No-Not relevant
Complete and lodge personal income tax return, least complex situation (c).
Yes-No-Not relevant Yes-No-Not relevant
Obtain unemployment income benefits, least com-plex situation.
Yes-No-Not relevant Yes-No-Not relevant
Obtain child support allowance, least complex situ-ation.
Yes-No-Not relevant Yes-No-Not relevant
Renew an international passport, least complex situ-ation.
Yes-No-Not relevant Yes-No-Not relevant
Renew a driver’s licence, least complex situation. Yes-No-Not relevant Yes-No-Not relevant
Make an official declaration of theft of personal goods (excl motor vehicle and burglary) to the rel-evant police.
Yes-No-Not relevant Yes-No-Not relevant
Obtain a copy of a birth certificate for self. Yes-No-Not relevant Yes-No-Not relevant
Obtain a copy of a marriage certificate for self. Yes-No-Not relevant Yes-No-Not relevant
Renew registration for a motor vehicle, least com-plex situation.
Yes-No-Not relevant Yes-No-Not relevant
Level 2: Request printed forms or download forms (e.g. in pdf format) from publicly accessible websites necessary to:
Enrol to vote for the first time in government elections.
Yes-No-Not relevant Yes-No-Not relevant
Complete and lodge personal income tax return, least complex situation.
Yes-No-Not relevant Yes-No-Not relevant
Obtain unemployment income benefits, least complex situation.
Yes-No-Not relevant Yes-No-Not relevant
Obtain child support allowance, least complex situation.
Yes-No-Not relevant Yes-No-Not relevant
Renew an international passport, least complex situation.
Yes-No-Not relevant Yes-No-Not relevant
Renew a driver’s licence, least complex situation. Yes-No-Not relevant Yes-No-Not relevant
Make an official declaration of theft of personal goods (excl motor vehicle and burglary) to the relevant police.
Yes-No-Not relevant Yes-No-Not relevant
Obtain a copy of a birth certificate for self. Yes-No-Not relevant Yes-No-Not relevant
Obtain a copy of a marriage certificate for self. Yes-No-Not relevant Yes-No-Not relevant
Renew registration for a motor vehicle, least com-plex situation.
Yes-No-Not relevant Yes-No-Not relevant
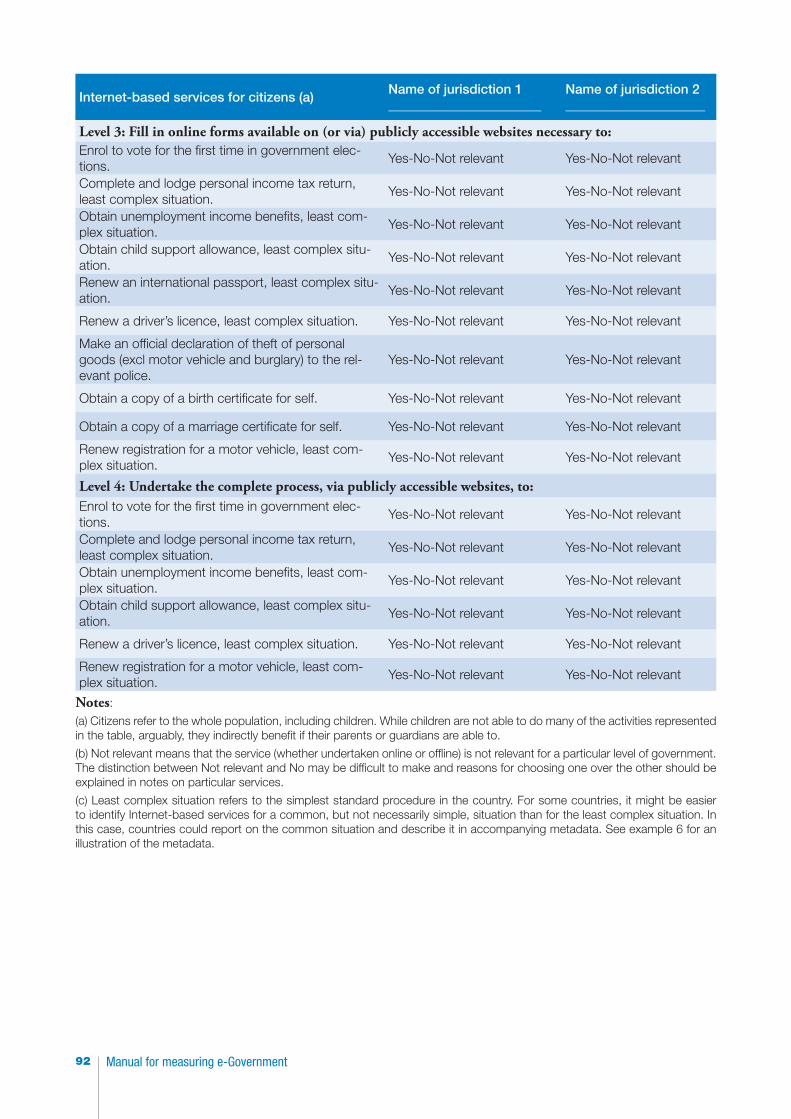
Manual for measuring e-Government92
Internet-based services for citizens (a)Name of jurisdiction 1_______________________
Name of jurisdiction 2_____________________
Level 3: Fill in online forms available on (or via) publicly accessible websites necessary to:Enrol to vote for the first time in government elec-tions.
Yes-No-Not relevant Yes-No-Not relevant
Complete and lodge personal income tax return, least complex situation.
Yes-No-Not relevant Yes-No-Not relevant
Obtain unemployment income benefits, least com-plex situation.
Yes-No-Not relevant Yes-No-Not relevant
Obtain child support allowance, least complex situ-ation.
Yes-No-Not relevant Yes-No-Not relevant
Renew an international passport, least complex situ-ation.
Yes-No-Not relevant Yes-No-Not relevant
Renew a driver’s licence, least complex situation. Yes-No-Not relevant Yes-No-Not relevant
Make an official declaration of theft of personal goods (excl motor vehicle and burglary) to the rel-evant police.
Yes-No-Not relevant Yes-No-Not relevant
Obtain a copy of a birth certificate for self. Yes-No-Not relevant Yes-No-Not relevant
Obtain a copy of a marriage certificate for self. Yes-No-Not relevant Yes-No-Not relevant
Renew registration for a motor vehicle, least com-plex situation.
Yes-No-Not relevant Yes-No-Not relevant
Level 4: Undertake the complete process, via publicly accessible websites, to:Enrol to vote for the first time in government elec-tions.
Yes-No-Not relevant Yes-No-Not relevant
Complete and lodge personal income tax return, least complex situation.
Yes-No-Not relevant Yes-No-Not relevant
Obtain unemployment income benefits, least com-plex situation.
Yes-No-Not relevant Yes-No-Not relevant
Obtain child support allowance, least complex situ-ation.
Yes-No-Not relevant Yes-No-Not relevant
Renew a driver’s licence, least complex situation. Yes-No-Not relevant Yes-No-Not relevant
Renew registration for a motor vehicle, least com-plex situation.
Yes-No-Not relevant Yes-No-Not relevant
Notes:
(a) Citizens refer to the whole population, including children. While children are not able to do many of the activities represented in the table, arguably, they indirectly benefit if their parents or guardians are able to.
(b) Not relevant means that the service (whether undertaken online or offline) is not relevant for a particular level of government. The distinction between Not relevant and No may be difficult to make and reasons for choosing one over the other should be explained in notes on particular services.
(c) Least complex situation refers to the simplest standard procedure in the country. For some countries, it might be easier to identify Internet-based services for a common, but not necessarily simple, situation than for the least complex situation. In this case, countries could report on the common situation and describe it in accompanying metadata. See example 6 for an illustration of the metadata.
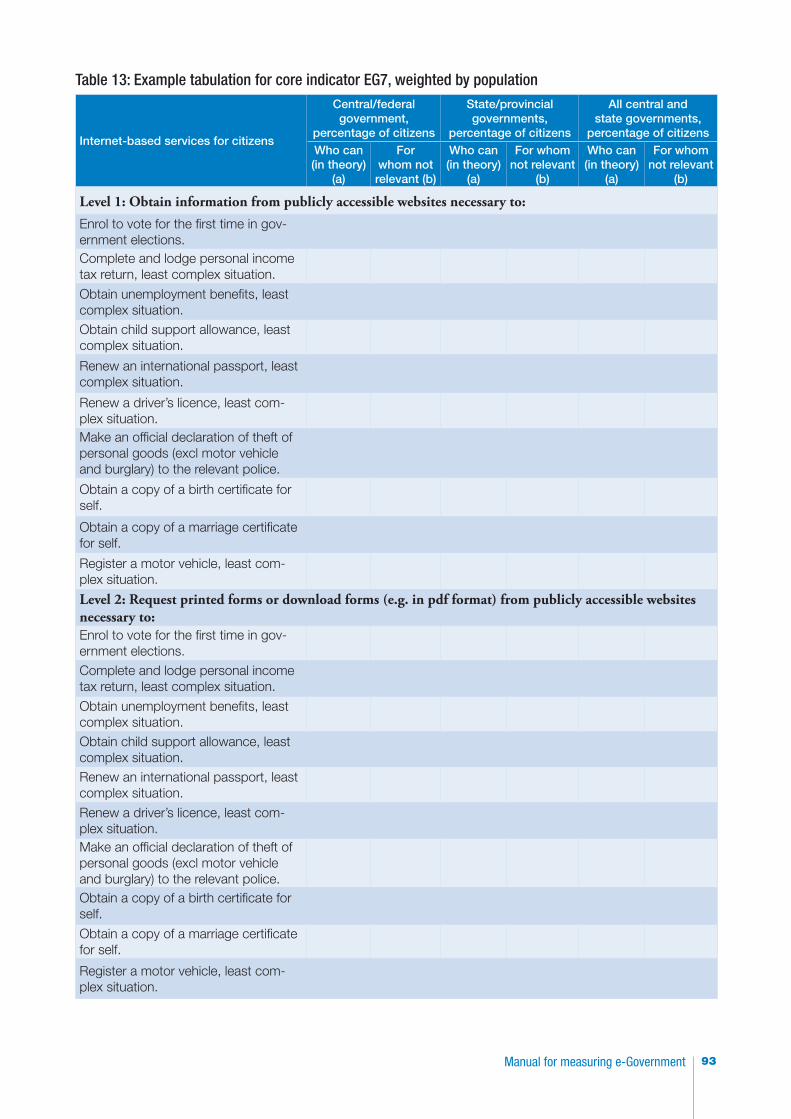
93Manual for measuring e-Government
Table 13: Example tabulation for core indicator EG7, weighted by population
Internet-based services for citizens
Central/federal government,
percentage of citizens
State/provincial governments,
percentage of citizens
All central and state governments,
percentage of citizensWho can (in theory)
(a)
For whom not relevant (b)
Who can (in theory)
(a)
For whom not relevant
(b)
Who can (in theory)
(a)
For whom not relevant
(b)
Level 1: Obtain information from publicly accessible websites necessary to:
Enrol to vote for the first time in gov-ernment elections.Complete and lodge personal income tax return, least complex situation.
Obtain unemployment benefits, least complex situation.Obtain child support allowance, least complex situation.
Renew an international passport, least complex situation.
Renew a driver’s licence, least com-plex situation.Make an official declaration of theft of personal goods (excl motor vehicle and burglary) to the relevant police.
Obtain a copy of a birth certificate for self.
Obtain a copy of a marriage certificate for self.
Register a motor vehicle, least com-plex situation.
Level 2: Request printed forms or download forms (e.g. in pdf format) from publicly accessible websites necessary to:Enrol to vote for the first time in gov-ernment elections.Complete and lodge personal income tax return, least complex situation.
Obtain unemployment benefits, least complex situation.Obtain child support allowance, least complex situation.Renew an international passport, least complex situation.
Renew a driver’s licence, least com-plex situation.Make an official declaration of theft of personal goods (excl motor vehicle and burglary) to the relevant police.Obtain a copy of a birth certificate for self.
Obtain a copy of a marriage certificate for self.
Register a motor vehicle, least com-plex situation.
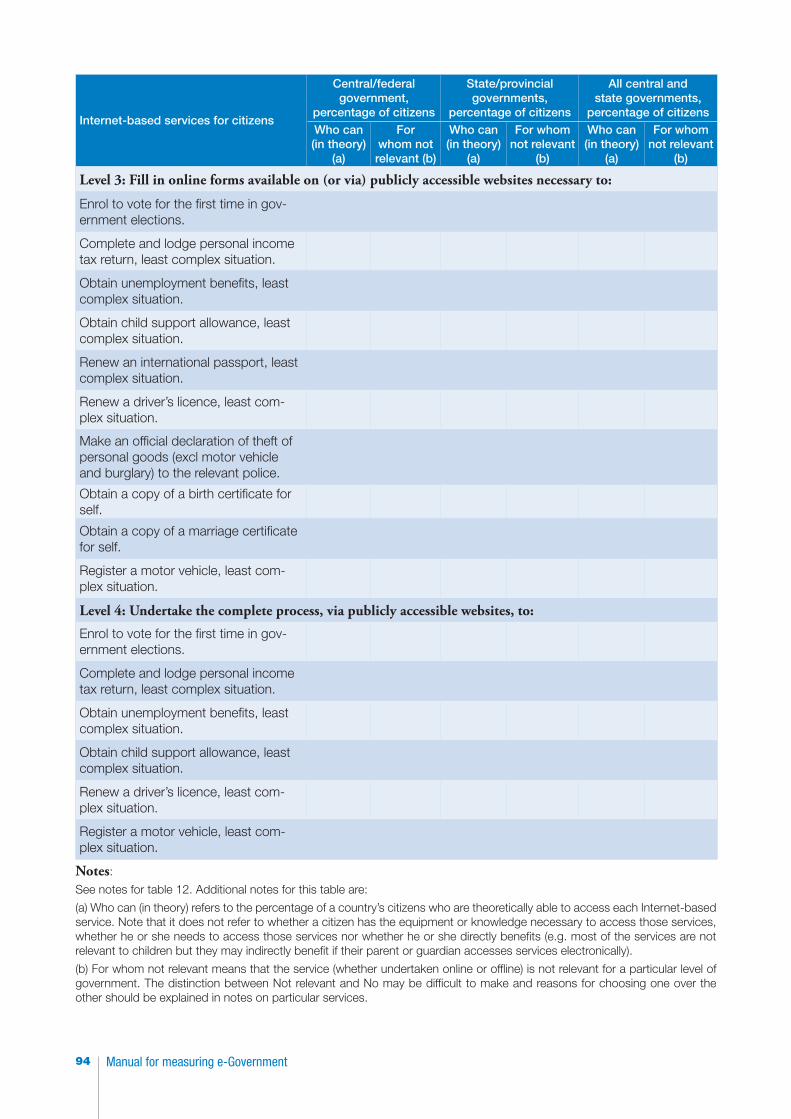
Manual for measuring e-Government94
Internet-based services for citizens
Central/federal government,
percentage of citizens
State/provincial governments,
percentage of citizens
All central and state governments,
percentage of citizensWho can (in theory)
(a)
For whom not relevant (b)
Who can (in theory)
(a)
For whom not relevant
(b)
Who can (in theory)
(a)
For whom not relevant
(b)
Level 3: Fill in online forms available on (or via) publicly accessible websites necessary to:
Enrol to vote for the first time in gov-ernment elections.
Complete and lodge personal income tax return, least complex situation.
Obtain unemployment benefits, least complex situation.
Obtain child support allowance, least complex situation.
Renew an international passport, least complex situation.
Renew a driver’s licence, least com-plex situation.
Make an official declaration of theft of personal goods (excl motor vehicle and burglary) to the relevant police.
Obtain a copy of a birth certificate for self.
Obtain a copy of a marriage certificate for self.
Register a motor vehicle, least com-plex situation.
Level 4: Undertake the complete process, via publicly accessible websites, to:
Enrol to vote for the first time in gov-ernment elections.
Complete and lodge personal income tax return, least complex situation.
Obtain unemployment benefits, least complex situation.
Obtain child support allowance, least complex situation.
Renew a driver’s licence, least com-plex situation.
Register a motor vehicle, least com-plex situation.
Notes:
See notes for table 12. Additional notes for this table are:
(a) Who can (in theory) refers to the percentage of a country’s citizens who are theoretically able to access each Internet-based service. Note that it does not refer to whether a citizen has the equipment or knowledge necessary to access those services, whether he or she needs to access those services nor whether he or she directly benefits (e.g. most of the services are not relevant to children but they may indirectly benefit if their parent or guardian accesses services electronically).
(b) For whom not relevant means that the service (whether undertaken online or offline) is not relevant for a particular level of government. The distinction between Not relevant and No may be difficult to make and reasons for choosing one over the other should be explained in notes on particular services.
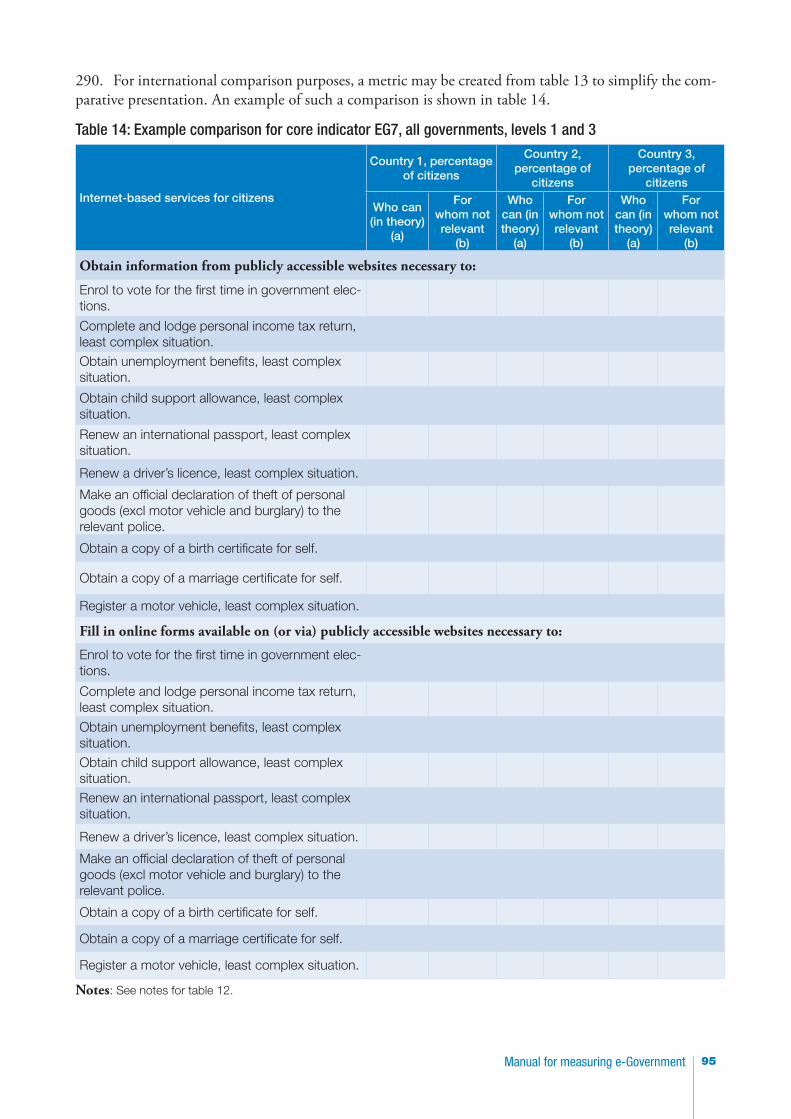
95Manual for measuring e-Government
290. For international comparison purposes, a metric may be created from table 13 to simplify the com-parative presentation. An example of such a comparison is shown in table 14.
Table 14: Example comparison for core indicator EG7, all governments, levels 1 and 3
Internet-based services for citizens
Country 1, percentage of citizens
Country 2, percentage of
citizens
Country 3, percentage of
citizens
Who can (in theory)
(a)
For whom not relevant
(b)
Who can (in theory)
(a)
For whom not relevant
(b)
Who can (in theory)
(a)
For whom not relevant
(b)
Obtain information from publicly accessible websites necessary to:
Enrol to vote for the first time in government elec-tions.
Complete and lodge personal income tax return, least complex situation.Obtain unemployment benefits, least complex situation.
Obtain child support allowance, least complex situation.
Renew an international passport, least complex situation.
Renew a driver’s licence, least complex situation.
Make an official declaration of theft of personal goods (excl motor vehicle and burglary) to the relevant police.
Obtain a copy of a birth certificate for self.
Obtain a copy of a marriage certificate for self.
Register a motor vehicle, least complex situation.
Fill in online forms available on (or via) publicly accessible websites necessary to:
Enrol to vote for the first time in government elec-tions.
Complete and lodge personal income tax return, least complex situation.
Obtain unemployment benefits, least complex situation.Obtain child support allowance, least complex situation.Renew an international passport, least complex situation.
Renew a driver’s licence, least complex situation.
Make an official declaration of theft of personal goods (excl motor vehicle and burglary) to the relevant police.
Obtain a copy of a birth certificate for self.
Obtain a copy of a marriage certificate for self.
Register a motor vehicle, least complex situation.
Notes: See notes for table 12.
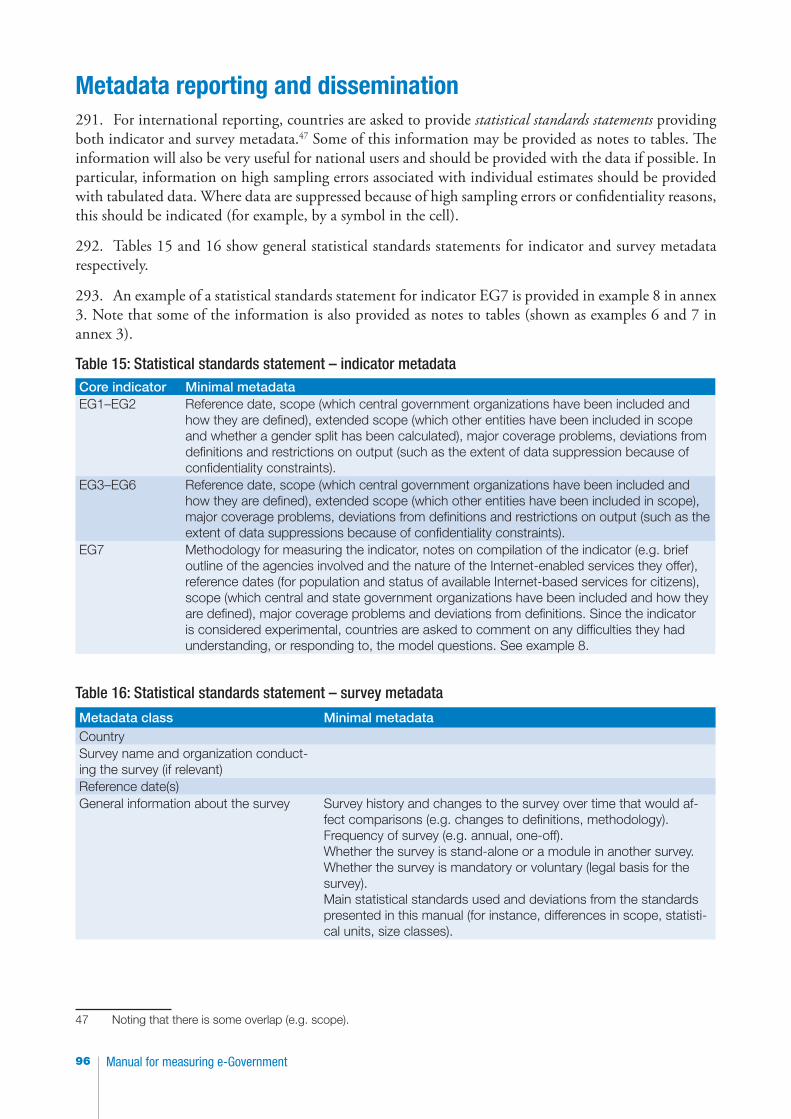
Manual for measuring e-Government96
Metadata reporting and dissemination291. For international reporting, countries are asked to provide statistical standards statements providing both indicator and survey metadata.47 Some of this information may be provided as notes to tables. The information will also be very useful for national users and should be provided with the data if possible. In particular, information on high sampling errors associated with individual estimates should be provided with tabulated data. Where data are suppressed because of high sampling errors or confidentiality reasons, this should be indicated (for example, by a symbol in the cell).
292. Tables 15 and 16 show general statistical standards statements for indicator and survey metadata respectively.
293. An example of a statistical standards statement for indicator EG7 is provided in example 8 in annex 3. Note that some of the information is also provided as notes to tables (shown as examples 6 and 7 in annex 3).
Table 15: Statistical standards statement – indicator metadataCore indicator Minimal metadataEG1–EG2 Reference date, scope (which central government organizations have been included and
how they are defined), extended scope (which other entities have been included in scope and whether a gender split has been calculated), major coverage problems, deviations from definitions and restrictions on output (such as the extent of data suppression because of confidentiality constraints).
EG3–EG6 Reference date, scope (which central government organizations have been included and how they are defined), extended scope (which other entities have been included in scope), major coverage problems, deviations from definitions and restrictions on output (such as the extent of data suppressions because of confidentiality constraints).
EG7 Methodology for measuring the indicator, notes on compilation of the indicator (e.g. brief outline of the agencies involved and the nature of the Internet-enabled services they offer), reference dates (for population and status of available Internet-based services for citizens), scope (which central and state government organizations have been included and how they are defined), major coverage problems and deviations from definitions. Since the indicator is considered experimental, countries are asked to comment on any difficulties they had understanding, or responding to, the model questions. See example 8.
Table 16: Statistical standards statement – survey metadata
Metadata class Minimal metadataCountrySurvey name and organization conduct-ing the survey (if relevant)Reference date(s)General information about the survey Survey history and changes to the survey over time that would af-
fect comparisons (e.g. changes to definitions, methodology).Frequency of survey (e.g. annual, one-off).Whether the survey is stand-alone or a module in another survey.Whether the survey is mandatory or voluntary (legal basis for the survey).Main statistical standards used and deviations from the standards presented in this manual (for instance, differences in scope, statisti-cal units, size classes).
47 Noting that there is some overlap (e.g. scope).
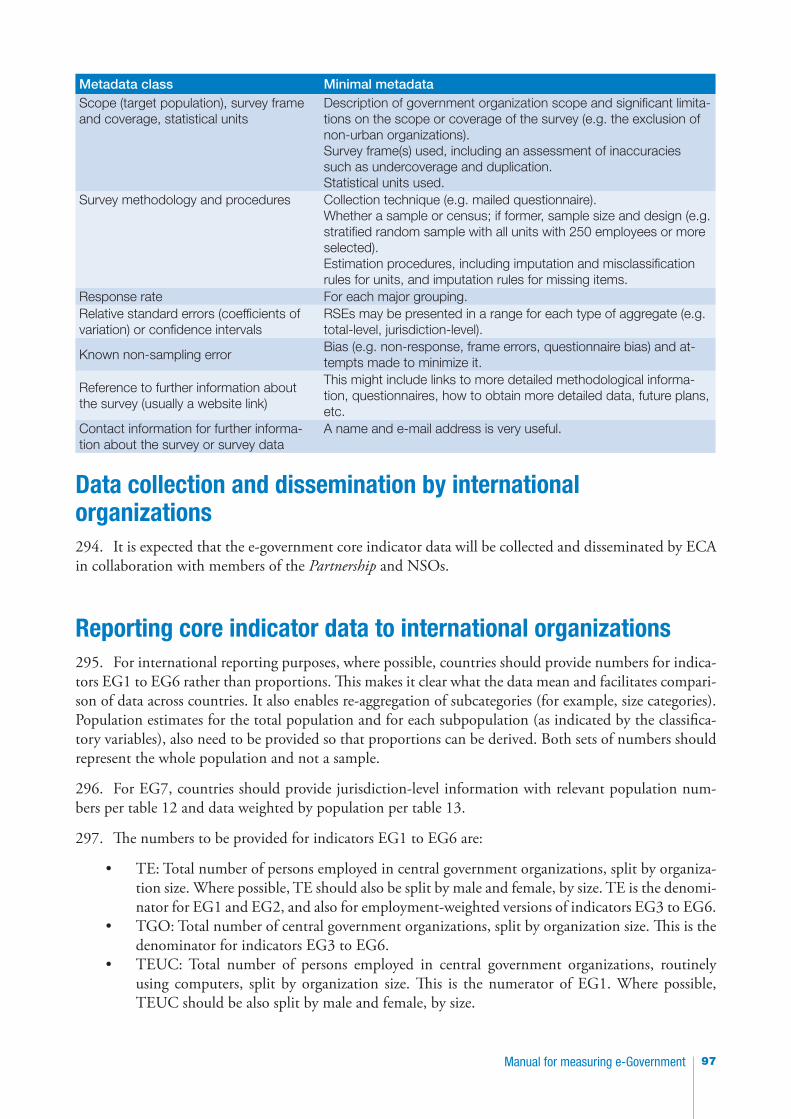
97Manual for measuring e-Government
Metadata class Minimal metadataScope (target population), survey frame and coverage, statistical units
Description of government organization scope and significant limita-tions on the scope or coverage of the survey (e.g. the exclusion of non-urban organizations).Survey frame(s) used, including an assessment of inaccuracies such as undercoverage and duplication.Statistical units used.
Survey methodology and procedures Collection technique (e.g. mailed questionnaire).Whether a sample or census; if former, sample size and design (e.g. stratified random sample with all units with 250 employees or more selected).Estimation procedures, including imputation and misclassification rules for units, and imputation rules for missing items.
Response rate For each major grouping.Relative standard errors (coefficients of variation) or confidence intervals
RSEs may be presented in a range for each type of aggregate (e.g. total-level, jurisdiction-level).
Known non-sampling errorBias (e.g. non-response, frame errors, questionnaire bias) and at-tempts made to minimize it.
Reference to further information about the survey (usually a website link)
This might include links to more detailed methodological informa-tion, questionnaires, how to obtain more detailed data, future plans, etc.
Contact information for further informa-tion about the survey or survey data
A name and e-mail address is very useful.
Data collection and dissemination by international organizations294. It is expected that the e-government core indicator data will be collected and disseminated by ECA in collaboration with members of the Partnership and NSOs.
Reporting core indicator data to international organizations295. For international reporting purposes, where possible, countries should provide numbers for indica-tors EG1 to EG6 rather than proportions. This makes it clear what the data mean and facilitates compari-son of data across countries. It also enables re-aggregation of subcategories (for example, size categories). Population estimates for the total population and for each subpopulation (as indicated by the classifica-tory variables), also need to be provided so that proportions can be derived. Both sets of numbers should represent the whole population and not a sample.
296. For EG7, countries should provide jurisdiction-level information with relevant population num-bers per table 12 and data weighted by population per table 13.
297. The numbers to be provided for indicators EG1 to EG6 are:
• TE: Total number of persons employed in central government organizations, split by organiza-tion size. Where possible, TE should also be split by male and female, by size. TE is the denomi-nator for EG1 and EG2, and also for employment-weighted versions of indicators EG3 to EG6.
• TGO: Total number of central government organizations, split by organization size. This is the denominator for indicators EG3 to EG6.
• TEUC: Total number of persons employed in central government organizations, routinely using computers, split by organization size. This is the numerator of EG1. Where possible, TEUC should be also split by male and female, by size.
Manual for measuring e-Government98
• TEUI: Total number of persons employed in central government organizations routinely using the Internet, split by organization size. This is the numerator of EG2. Where possible, TEUI should be also split by male and female, by size.
• TGLAN: Total number of central government organizations with a LAN, split by organization size. This is the numerator for EG3.
• TEGLAN: Total number of persons employed in central government organizations with a LAN. This is the numerator for the employment-weighted version of EG3.
• TGINTR: Total number of central government organizations with an intranet, split by organi-zation size. This is the numerator for EG4.
• TEGINTR: Total number of persons employed in central government organizations with an intranet. This is the numerator for the employment-weighted version of EG4.
• TGINT: Total number of central government organizations with Internet access, split by organ-ization size. This is the numerator for EG5 and is split by type of Internet access service used (as well as ‘any Internet access’).
• TEGINT: Total number of persons employed in central government organizations with any Internet access. This is the numerator for the employment-weighted version of EG5 and is not split by type of Internet access.
• TGWEB: Total number of central government organizations with a web presence, split by organization size. This is the numerator for EG6.
• TEGWEB: Total number of persons employed in central government organizations with a web presence. This is the numerator for the employment-weighted version of EG6.
99Manual for measuring e-Government
Chapter 11. Conclusion
298. The Manual for measuring e-government joins three other manuals for measuring the core ICT indicators developed and promulgated by the Partnership on Measuring ICT for Development (ITU, 2009, 2014; UNCTAD, 2009; UIS, 200948). The indicators, standards and methodologies presented in this manual focus on the seven core e-government indicators presented in the Framework for a set of e-government core indicators (Partnership and ECA, 2012), which was endorsed by the UNSC at its 2012 meeting (UNSC, 2012).
299. While the primary focus of the Manual is on a small set of core e-government indicators, a number of suggestions have been provided on expanding the scope of the indicators, adding additional classifica-tions, and measuring other topics in surveys of government organizations.
300. It is acknowledged that important areas of e-government measurement are not included in the Framework or the Manual. One of those areas is delivery of government services to mobile telephones (especially where Internet access is limited) and another is measuring the impacts of e-government, both on government organizations and the broader economy and society. As with the other Partnership core ICT indicators, it is expected that the list of e-government indicators and their scope will grow with experience. Countries are encouraged to share their experiences with the Partnership in order to facilitate such development.
301. Countries are asked to consider including the core indicators model questions, along with the defi-nitions and standards in the Manual, when designing or re-designing surveys that collect e-government data. It is acknowledged that countries may be restricted in mounting new surveys to collect indicators EG1 to EG6. However, collection of data for EG7 is likely to be a relatively inexpensive task and coun-tries are therefore asked to trial the model question and provide feedback to the Partnership.
302. As with the other core ICT indicators, the resources of the Partnership will be available to assist in statistical data collection.
48 For a much larger set of indicators than the Partnership indicators on education, see Guide to Measuring Information and Communication Technologies in Education, UNESCO Institute for Statistics (2009).
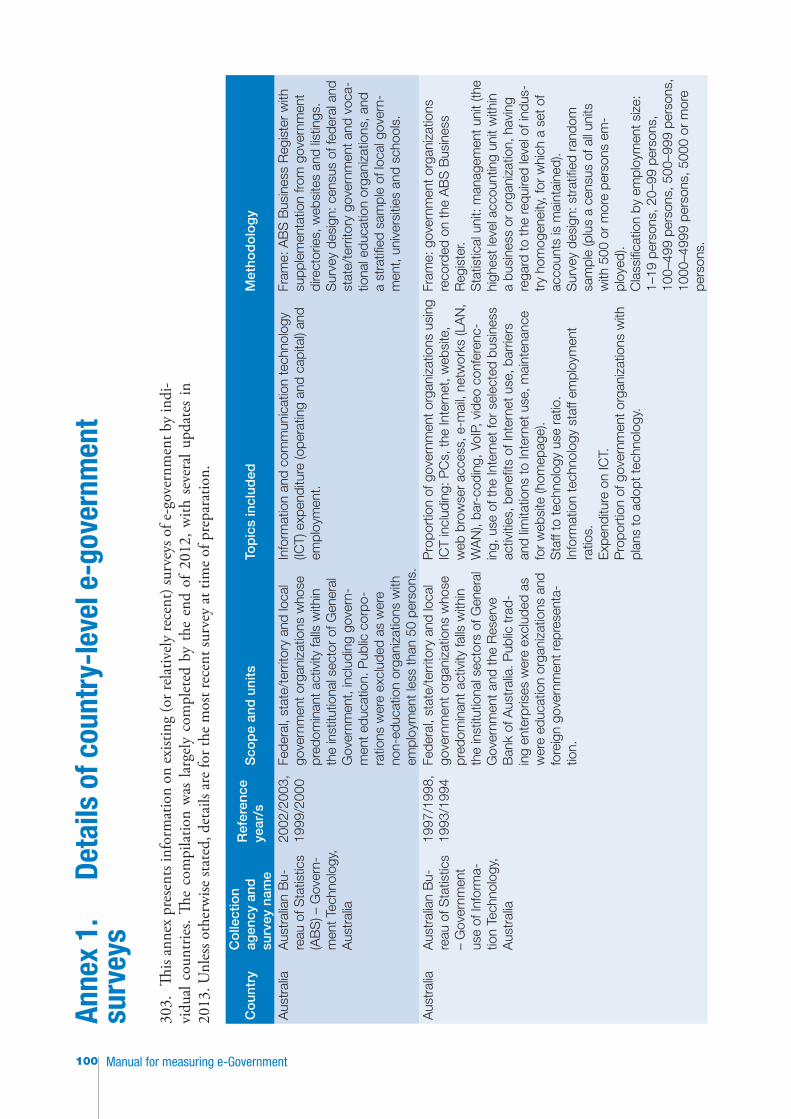
Manual for measuring e-Government100
Anne
x 1.
De
tails
of c
ount
ry-l
evel
e-g
over
nmen
t su
rvey
s
303.
This
anne
x pr
esen
ts in
form
atio
n on
exi
sting
(or r
elat
ivel
y re
cent
) sur
veys
of e
-gov
ernm
ent b
y in
di-
vidu
al c
ount
ries.
The
com
pila
tion
was
larg
ely
com
plet
ed b
y th
e en
d of
201
2, w
ith s
ever
al u
pdat
es in
20
13. U
nles
s oth
erw
ise st
ated
, det
ails
are
for t
he m
ost r
ecen
t sur
vey
at ti
me
of p
repa
ratio
n.
Co
untr
yC
olle
ctio
n ag
ency
and
su
rvey
nam
e
Ref
eren
ce
year
/sS
cop
e an
d u
nits
Top
ics
incl
uded
Met
hod
olo
gy
Aus
tral
iaA
ustr
alia
n B
u-re
au o
f Sta
tistic
s (A
BS
) – G
over
n-m
ent T
echn
olog
y,
Aus
tral
ia
2002
/200
3,
1999
/200
0Fe
dera
l, st
ate/
terr
itory
and
loca
l go
vern
men
t org
aniz
atio
ns w
hose
pr
edom
inan
t act
ivity
falls
with
in
the
inst
itutio
nal s
ecto
r of
Gen
eral
G
over
nmen
t, in
clud
ing
gove
rn-
men
t edu
catio
n. P
ublic
cor
po-
ratio
ns w
ere
excl
uded
as
wer
e no
n-ed
ucat
ion
orga
niza
tions
with
em
ploy
men
t les
s th
an 5
0 pe
rson
s.
Info
rmat
ion
and
com
mun
icat
ion
tech
nolo
gy
(ICT)
exp
endi
ture
(ope
ratin
g an
d ca
pita
l) an
d em
ploy
men
t.
Fram
e: A
BS
Bus
ines
s R
egis
ter
with
su
pple
men
tatio
n fro
m g
over
nmen
t di
rect
orie
s, w
ebsi
tes
and
listin
gs.
Sur
vey
desi
gn: c
ensu
s of
fede
ral a
nd
stat
e/te
rrito
ry g
over
nmen
t and
voc
a-tio
nal e
duca
tion
orga
niza
tions
, and
a
stra
tified
sam
ple
of lo
cal g
over
n-m
ent,
univ
ersi
ties
and
scho
ols.
Aus
tral
iaA
ustr
alia
n B
u-re
au o
f Sta
tistic
s –
Gov
ernm
ent
use
of In
form
a-tio
n Te
chno
logy
, A
ustr
alia
1997
/199
8,
1993
/199
4Fe
dera
l, st
ate/
terr
itory
and
loca
l go
vern
men
t org
aniz
atio
ns w
hose
pr
edom
inan
t act
ivity
falls
with
in
the
inst
itutio
nal s
ecto
rs o
f Gen
eral
G
over
nmen
t and
the
Res
erve
B
ank
of A
ustr
alia
. Pub
lic tr
ad-
ing
ente
rpris
es w
ere
excl
uded
as
wer
e ed
ucat
ion
orga
niza
tions
and
fo
reig
n go
vern
men
t rep
rese
nta-
tion.
Pro
port
ion
of g
over
nmen
t org
aniz
atio
ns u
sing
IC
T in
clud
ing:
PC
s, th
e In
tern
et, w
ebsi
te,
web
bro
wse
r ac
cess
, e-m
ail,
netw
orks
(LA
N,
WA
N),
bar-
codi
ng, V
oIP,
vid
eo c
onfe
renc
-in
g, u
se o
f the
Inte
rnet
for
sele
cted
bus
ines
s ac
tiviti
es, b
enefi
ts o
f Int
erne
t use
, bar
riers
an
d lim
itatio
ns to
Inte
rnet
use
, mai
nten
ance
fo
r w
ebsi
te (h
omep
age)
.S
taff
to te
chno
logy
use
rat
io.
Info
rmat
ion
tech
nolo
gy s
taff
empl
oym
ent
ratio
s.E
xpen
ditu
re o
n IC
T.P
ropo
rtio
n of
gov
ernm
ent o
rgan
izat
ions
with
pl
ans
to a
dopt
tech
nolo
gy.
Fram
e: g
over
nmen
t org
aniz
atio
ns
reco
rded
on
the
AB
S B
usin
ess
Reg
iste
r.S
tatis
tical
uni
t: m
anag
emen
t uni
t (th
e hi
ghes
t lev
el a
ccou
ntin
g un
it w
ithin
a
busi
ness
or
orga
niza
tion,
hav
ing
rega
rd to
the
requ
ired
leve
l of i
ndus
-tr
y ho
mog
enei
ty, f
or w
hich
a s
et o
f ac
coun
ts is
mai
ntai
ned)
.S
urve
y de
sign
: str
atifi
ed r
ando
m
sam
ple
(plu
s a
cens
us o
f all
units
w
ith 5
00 o
r m
ore
pers
ons
em-
ploy
ed).
Cla
ssifi
catio
n by
em
ploy
men
t siz
e:
1–19
per
sons
, 20–
99 p
erso
ns,
100–
499
pers
ons,
500
–999
per
sons
, 10
00–4
999
pers
ons,
500
0 or
mor
e pe
rson
s.
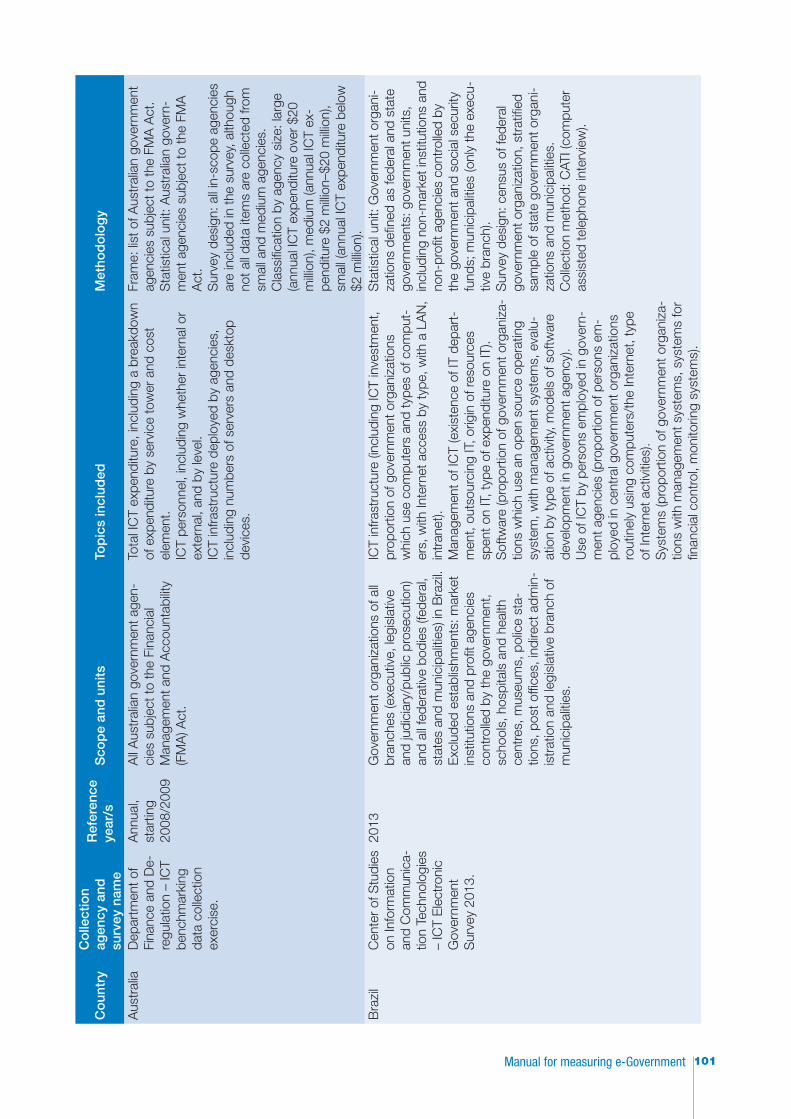
101Manual for measuring e-Government
Co
untr
yC
olle
ctio
n ag
ency
and
su
rvey
nam
e
Ref
eren
ce
year
/sS
cop
e an
d u
nits
Top
ics
incl
uded
Met
hod
olo
gy
Aus
tral
iaD
epar
tmen
t of
Fina
nce
and
De-
regu
latio
n –
ICT
benc
hmar
king
da
ta c
olle
ctio
n ex
erci
se.
Ann
ual,
star
ting
2008
/200
9
All
Aus
tral
ian
gove
rnm
ent a
gen-
cies
sub
ject
to th
e Fi
nanc
ial
Man
agem
ent a
nd A
ccou
ntab
ility
(FM
A) A
ct.
Tota
l IC
T ex
pend
iture
, inc
ludi
ng a
bre
akdo
wn
of e
xpen
ditu
re b
y se
rvic
e to
wer
and
cos
t el
emen
t.IC
T pe
rson
nel,
incl
udin
g w
heth
er in
tern
al o
r ex
tern
al, a
nd b
y le
vel.
ICT
infra
stru
ctur
e de
ploy
ed b
y ag
enci
es,
incl
udin
g nu
mbe
rs o
f ser
vers
and
des
ktop
de
vice
s.
Fram
e: li
st o
f Aus
tral
ian
gove
rnm
ent
agen
cies
sub
ject
to th
e FM
A A
ct.
Sta
tistic
al u
nit:
Aus
tral
ian
gove
rn-
men
t age
ncie
s su
bjec
t to
the
FMA
A
ct.
Sur
vey
desi
gn: a
ll in
-sco
pe a
genc
ies
are
incl
uded
in th
e su
rvey
, alth
ough
no
t all
data
item
s ar
e co
llect
ed fr
om
smal
l and
med
ium
age
ncie
s.C
lass
ifica
tion
by a
genc
y si
ze: l
arge
(a
nnua
l IC
T ex
pend
iture
ove
r $2
0 m
illion
), m
ediu
m (a
nnua
l IC
T ex
-pe
nditu
re $
2 m
illion
–$20
milli
on),
smal
l (an
nual
ICT
expe
nditu
re b
elow
$2
milli
on).
Bra
zil
Cen
ter
of S
tudi
es
on In
form
atio
n an
d C
omm
unic
a-tio
n Te
chno
logi
es
– IC
T E
lect
roni
c G
over
nmen
t S
urve
y 20
13.
2013
Gov
ernm
ent o
rgan
izat
ions
of a
ll br
anch
es (e
xecu
tive,
legi
slat
ive
and
judi
ciar
y/pu
blic
pro
secu
tion)
an
d al
l fed
erat
ive
bodi
es (f
eder
al,
stat
es a
nd m
unic
ipal
ities
) in
Bra
zil.
Exc
lude
d es
tabl
ishm
ents
: mar
ket
inst
itutio
ns a
nd p
rofit
age
ncie
s co
ntro
lled
by th
e go
vern
men
t, sc
hool
s, h
ospi
tals
and
hea
lth
cent
res,
mus
eum
s, p
olic
e st
a-tio
ns, p
ost o
ffice
s, in
dire
ct a
dmin
-is
trat
ion
and
legi
slat
ive
bran
ch o
f m
unic
ipal
ities
.
ICT
infra
stru
ctur
e (in
clud
ing
ICT
inve
stm
ent,
prop
ortio
n of
gov
ernm
ent o
rgan
izat
ions
w
hich
use
com
pute
rs a
nd ty
pes
of c
ompu
t-er
s, w
ith In
tern
et a
cces
s by
type
, with
a L
AN
, in
tran
et).
Man
agem
ent o
f IC
T (e
xist
ence
of I
T de
part
-m
ent,
outs
ourc
ing
IT, o
rigin
of r
esou
rces
sp
ent o
n IT
, typ
e of
exp
endi
ture
on
IT).
Sof
twar
e (p
ropo
rtio
n of
gov
ernm
ent o
rgan
iza-
tions
whi
ch u
se a
n op
en s
ourc
e op
erat
ing
syst
em, w
ith m
anag
emen
t sys
tem
s, e
valu
-at
ion
by ty
pe o
f act
ivity
, mod
els
of s
oftw
are
deve
lopm
ent i
n go
vern
men
t age
ncy)
.U
se o
f IC
T by
per
sons
em
ploy
ed in
gov
ern-
men
t age
ncie
s (p
ropo
rtio
n of
per
sons
em
-pl
oyed
in c
entr
al g
over
nmen
t org
aniz
atio
ns
rout
inel
y us
ing
com
pute
rs/t
he In
tern
et, t
ype
of In
tern
et a
ctiv
ities
).S
yste
ms
(pro
port
ion
of g
over
nmen
t org
aniz
a-tio
ns w
ith m
anag
emen
t sys
tem
s, s
yste
ms
for
finan
cial
con
trol
, mon
itorin
g sy
stem
s).
Sta
tistic
al u
nit:
Gov
ernm
ent o
rgan
i-za
tions
defi
ned
as fe
dera
l and
sta
te
gove
rnm
ents
: gov
ernm
ent u
nits
, in
clud
ing
non-
mar
ket i
nstit
utio
ns a
nd
non-
profi
t age
ncie
s co
ntro
lled
by
the
gove
rnm
ent a
nd s
ocia
l sec
urity
fu
nds;
mun
icip
aliti
es (o
nly
the
exec
u-tiv
e br
anch
).S
urve
y de
sign
: cen
sus
of fe
dera
l go
vern
men
t org
aniz
atio
n, s
trat
ified
sa
mpl
e of
sta
te g
over
nmen
t org
ani-
zatio
ns a
nd m
unic
ipal
ities
.C
olle
ctio
n m
etho
d: C
ATI (
com
pute
r as
sist
ed te
leph
one
inte
rvie
w).
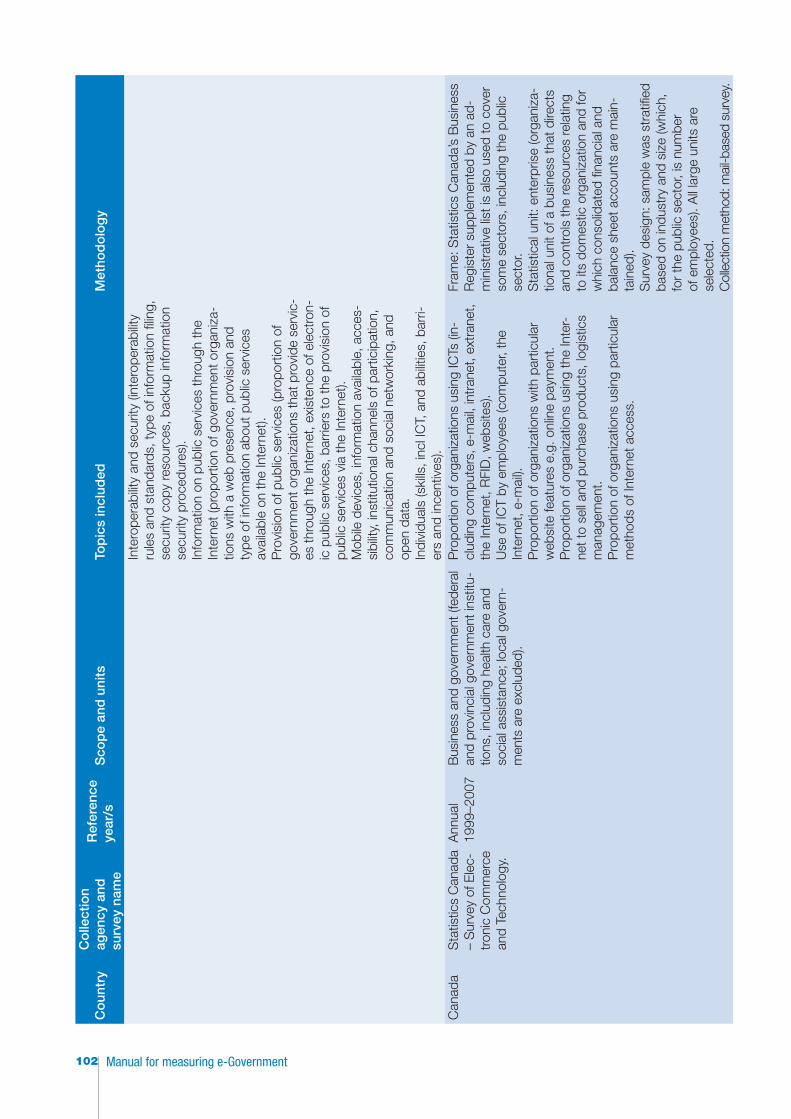
Manual for measuring e-Government102
Co
untr
yC
olle
ctio
n ag
ency
and
su
rvey
nam
e
Ref
eren
ce
year
/sS
cop
e an
d u
nits
Top
ics
incl
uded
Met
hod
olo
gy
Inte
rope
rabi
lity
and
secu
rity
(inte
rope
rabi
lity
rule
s an
d st
anda
rds,
type
of i
nfor
mat
ion
filin
g,
secu
rity
copy
reso
urce
s, b
acku
p in
form
atio
n se
curit
y pr
oced
ures
).In
form
atio
n on
pub
lic s
ervi
ces
thro
ugh
the
Inte
rnet
(pro
port
ion
of g
over
nmen
t org
aniz
a-tio
ns w
ith a
web
pre
senc
e, p
rovi
sion
and
ty
pe o
f inf
orm
atio
n ab
out p
ublic
ser
vice
s av
aila
ble
on th
e In
tern
et).
Pro
visi
on o
f pub
lic s
ervi
ces
(pro
port
ion
of
gove
rnm
ent o
rgan
izat
ions
that
pro
vide
ser
vic-
es th
roug
h th
e In
tern
et, e
xist
ence
of e
lect
ron-
ic p
ublic
ser
vice
s, b
arrie
rs to
the
prov
isio
n of
pu
blic
ser
vice
s vi
a th
e In
tern
et).
Mob
ile d
evic
es, i
nfor
mat
ion
avai
labl
e, a
cces
-si
bilit
y, in
stitu
tiona
l cha
nnel
s of
par
ticip
atio
n,
com
mun
icat
ion
and
soci
al n
etw
orki
ng, a
nd
open
dat
a.In
divi
dual
s (s
kills
, inc
l IC
T, a
nd a
bilit
ies,
bar
ri-er
s an
d in
cent
ives
).C
anad
aS
tatis
tics
Can
ada
– S
urve
y of
Ele
c-tr
onic
Com
mer
ce
and
Tech
nolo
gy.
Ann
ual
1999
–200
7B
usin
ess
and
gove
rnm
ent (
fede
ral
and
prov
inci
al g
over
nmen
t ins
titu-
tions
, inc
ludi
ng h
ealth
car
e an
d so
cial
ass
ista
nce;
loca
l gov
ern-
men
ts a
re e
xclu
ded)
.
Pro
port
ion
of o
rgan
izat
ions
usi
ng IC
Ts (i
n-cl
udin
g co
mpu
ters
, e-m
ail,
intr
anet
, ext
rane
t, th
e In
tern
et, R
FID
, web
site
s).
Use
of I
CT
by e
mpl
oyee
s (c
ompu
ter,
the
Inte
rnet
, e-m
ail).
Pro
port
ion
of o
rgan
izat
ions
with
par
ticul
ar
web
site
feat
ures
e.g
. onl
ine
paym
ent.
Pro
port
ion
of o
rgan
izat
ions
usi
ng th
e In
ter-
net t
o se
ll an
d pu
rcha
se p
rodu
cts,
logi
stic
s m
anag
emen
t.P
ropo
rtio
n of
org
aniz
atio
ns u
sing
par
ticul
ar
met
hods
of I
nter
net a
cces
s.
Fram
e: S
tatis
tics
Can
ada’
s B
usin
ess
Reg
iste
r su
pple
men
ted
by a
n ad
-m
inis
trat
ive
list i
s al
so u
sed
to c
over
so
me
sect
ors,
incl
udin
g th
e pu
blic
se
ctor
.S
tatis
tical
uni
t: en
terp
rise
(org
aniz
a-tio
nal u
nit o
f a b
usin
ess
that
dire
cts
and
cont
rols
the
reso
urce
s re
latin
g to
its
dom
estic
org
aniz
atio
n an
d fo
r w
hich
con
solid
ated
fina
ncia
l and
ba
lanc
e sh
eet a
ccou
nts
are
mai
n-ta
ined
).S
urve
y de
sign
: sam
ple
was
str
atifi
ed
base
d on
indu
stry
and
siz
e (w
hich
, fo
r th
e pu
blic
sec
tor,
is n
umbe
r of
em
ploy
ees)
. All
larg
e un
its a
re
sele
cted
.C
olle
ctio
n m
etho
d: m
ail-b
ased
sur
vey.
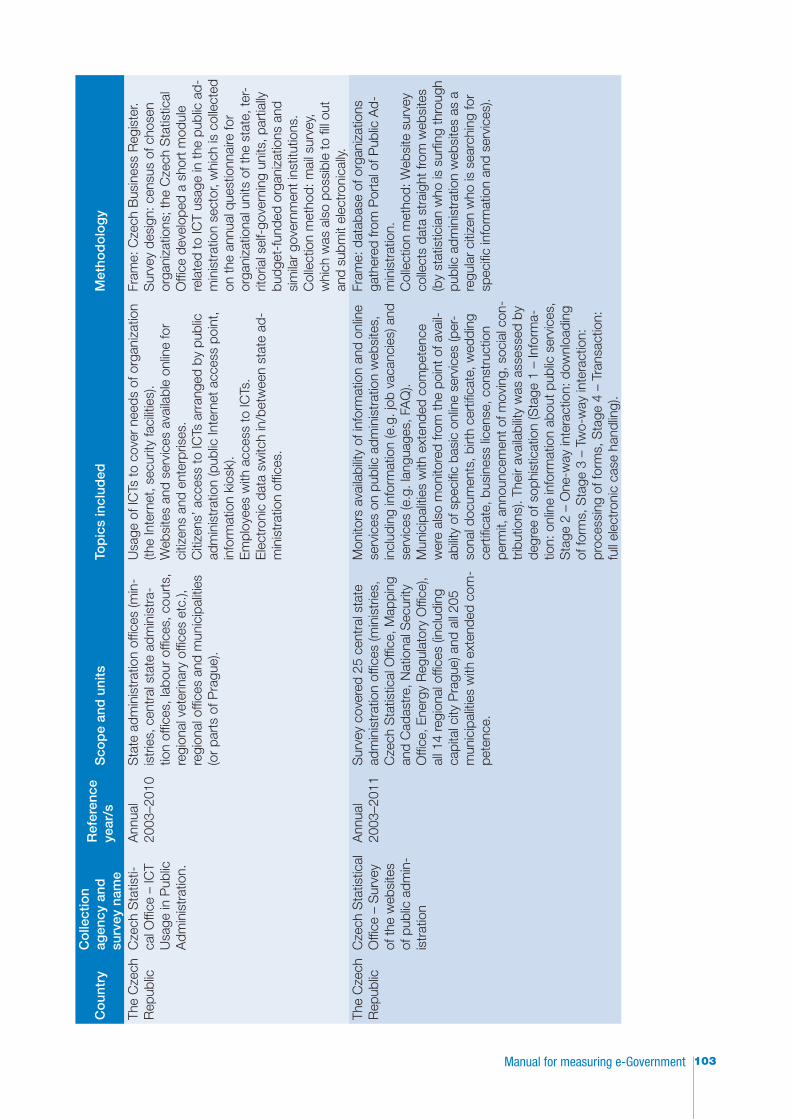
103Manual for measuring e-Government
Co
untr
yC
olle
ctio
n ag
ency
and
su
rvey
nam
e
Ref
eren
ce
year
/sS
cop
e an
d u
nits
Top
ics
incl
uded
Met
hod
olo
gy
The
Cze
ch
Rep
ublic
Cze
ch S
tatis
ti-ca
l Offi
ce –
ICT
Usa
ge in
Pub
lic
Adm
inis
trat
ion.
Ann
ual
2003
–201
0S
tate
adm
inis
trat
ion
offic
es (m
in-
istr
ies,
cen
tral
sta
te a
dmin
istr
a-tio
n of
fices
, lab
our
offic
es, c
ourt
s,
regi
onal
vet
erin
ary
offic
es e
tc.),
re
gion
al o
ffice
s an
d m
unic
ipal
ities
(o
r pa
rts
of P
ragu
e).
Usa
ge o
f IC
Ts to
cov
er n
eeds
of o
rgan
izat
ion
(the
Inte
rnet
, sec
urity
faci
litie
s).
Web
site
s an
d se
rvic
es a
vaila
ble
onlin
e fo
r ci
tizen
s an
d en
terp
rises
.C
itize
ns’ a
cces
s to
ICTs
arr
ange
d by
pub
lic
adm
inis
trat
ion
(pub
lic In
tern
et a
cces
s po
int,
info
rmat
ion
kios
k).
Em
ploy
ees
with
acc
ess
to IC
Ts.
Ele
ctro
nic
data
sw
itch
in/b
etw
een
stat
e ad
-m
inis
trat
ion
offic
es.
Fram
e: C
zech
Bus
ines
s R
egis
ter.
Sur
vey
desi
gn: c
ensu
s of
cho
sen
orga
niza
tions
; the
Cze
ch S
tatis
tical
O
ffice
dev
elop
ed a
sho
rt m
odul
e re
late
d to
ICT
usag
e in
the
publ
ic a
d-m
inis
trat
ion
sect
or, w
hich
is c
olle
cted
on
the
annu
al q
uest
ionn
aire
for
orga
niza
tiona
l uni
ts o
f the
sta
te, t
er-
ritor
ial s
elf-
gove
rnin
g un
its, p
artia
lly
budg
et-f
unde
d or
gani
zatio
ns a
nd
sim
ilar
gove
rnm
ent i
nstit
utio
ns.
Col
lect
ion
met
hod:
mai
l sur
vey,
w
hich
was
als
o po
ssib
le to
fill
out
and
subm
it el
ectr
onic
ally.
The
Cze
ch
Rep
ublic
Cze
ch S
tatis
tical
O
ffice
– S
urve
y of
the
web
site
s of
pub
lic a
dmin
-is
trat
ion
Ann
ual
2003
–201
1S
urve
y co
vere
d 25
cen
tral
sta
te
adm
inis
trat
ion
offic
es (m
inis
trie
s,
Cze
ch S
tatis
tical
Offi
ce, M
appi
ng
and
Cad
astr
e, N
atio
nal S
ecur
ity
Offi
ce, E
nerg
y R
egul
ator
y O
ffice
), al
l 14
regi
onal
offi
ces
(incl
udin
g ca
pita
l city
Pra
gue)
and
all
205
mun
icip
aliti
es w
ith e
xten
ded
com
-pe
tenc
e.
Mon
itors
ava
ilabi
lity
of in
form
atio
n an
d on
line
serv
ices
on
publ
ic a
dmin
istr
atio
n w
ebsi
tes,
in
clud
ing
info
rmat
ion
(e.g
. job
vac
anci
es) a
nd
serv
ices
(e.g
. lan
guag
es, F
AQ
). M
unic
ipal
ities
with
ext
ende
d co
mpe
tenc
e w
ere
also
mon
itore
d fro
m th
e po
int o
f ava
il-ab
ility
of s
peci
fic b
asic
onl
ine
serv
ices
(per
-so
nal d
ocum
ents
, birt
h ce
rtifi
cate
, wed
ding
ce
rtifi
cate
, bus
ines
s lic
ense
, con
stru
ctio
n pe
rmit,
ann
ounc
emen
t of m
ovin
g, s
ocia
l con
-tr
ibut
ions
). Th
eir
avai
labi
lity
was
ass
esse
d by
de
gree
of s
ophi
stic
atio
n (S
tage
1 –
Info
rma-
tion:
onl
ine
info
rmat
ion
abou
t pub
lic s
ervi
ces,
S
tage
2 –
One
-way
inte
ract
ion:
dow
nloa
ding
of
form
s, S
tage
3 –
Tw
o-w
ay in
tera
ctio
n:
proc
essi
ng o
f for
ms,
Sta
ge 4
– T
rans
actio
n:
full
elec
tron
ic c
ase
hand
ling)
.
Fram
e: d
atab
ase
of o
rgan
izat
ions
ga
ther
ed fr
om P
orta
l of P
ublic
Ad-
min
istr
atio
n.C
olle
ctio
n m
etho
d: W
ebsi
te s
urve
y co
llect
s da
ta s
trai
ght f
rom
web
site
s (b
y st
atis
ticia
n w
ho is
sur
fing
thro
ugh
publ
ic a
dmin
istr
atio
n w
ebsi
tes
as a
re
gula
r ci
tizen
who
is s
earc
hing
for
spec
ific
info
rmat
ion
and
serv
ices
).
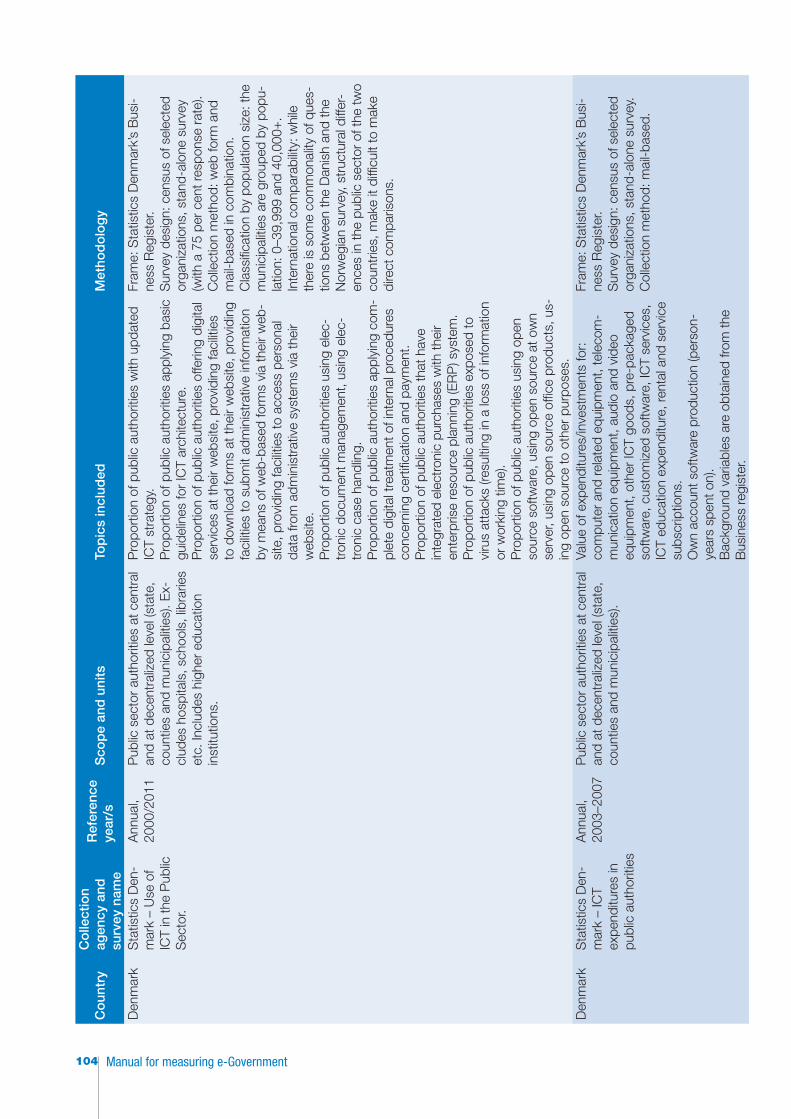
Manual for measuring e-Government104
Co
untr
yC
olle
ctio
n ag
ency
and
su
rvey
nam
e
Ref
eren
ce
year
/sS
cop
e an
d u
nits
Top
ics
incl
uded
Met
hod
olo
gy
Den
mar
kS
tatis
tics
Den
-m
ark
– U
se o
f IC
T in
the
Pub
lic
Sec
tor.
Ann
ual,
2000
/201
1P
ublic
sec
tor
auth
oriti
es a
t cen
tral
an
d at
dec
entr
aliz
ed le
vel (
stat
e,
coun
ties
and
mun
icip
aliti
es).
Ex-
clud
es h
ospi
tals
, sch
ools
, lib
rarie
s et
c. In
clud
es h
ighe
r ed
ucat
ion
inst
itutio
ns.
Pro
port
ion
of p
ublic
aut
horit
ies
with
upd
ated
IC
T st
rate
gy.
Pro
port
ion
of p
ublic
aut
horit
ies
appl
ying
bas
ic
guid
elin
es fo
r IC
T ar
chite
ctur
e.P
ropo
rtio
n of
pub
lic a
utho
ritie
s of
ferin
g di
gita
l se
rvic
es a
t the
ir w
ebsi
te, p
rovi
ding
faci
litie
s to
dow
nloa
d fo
rms
at th
eir
web
site
, pro
vidi
ng
faci
litie
s to
sub
mit
adm
inis
trat
ive
info
rmat
ion
by m
eans
of w
eb-b
ased
form
s vi
a th
eir
web
-si
te, p
rovi
ding
faci
litie
s to
acc
ess
pers
onal
da
ta fr
om a
dmin
istr
ativ
e sy
stem
s vi
a th
eir
web
site
.P
ropo
rtio
n of
pub
lic a
utho
ritie
s us
ing
elec
-tr
onic
doc
umen
t man
agem
ent,
usin
g el
ec-
tron
ic c
ase
hand
ling.
Pro
port
ion
of p
ublic
aut
horit
ies
appl
ying
com
-pl
ete
digi
tal t
reat
men
t of i
nter
nal p
roce
dure
s co
ncer
ning
cer
tifica
tion
and
paym
ent.
Pro
port
ion
of p
ublic
aut
horit
ies
that
hav
e in
tegr
ated
ele
ctro
nic
purc
hase
s w
ith th
eir
ente
rpris
e re
sour
ce p
lann
ing
(ER
P) s
yste
m.
Pro
port
ion
of p
ublic
aut
horit
ies
expo
sed
to
viru
s at
tack
s (re
sulti
ng in
a lo
ss o
f inf
orm
atio
n or
wor
king
tim
e).
Pro
port
ion
of p
ublic
aut
horit
ies
usin
g op
en
sour
ce s
oftw
are,
usi
ng o
pen
sour
ce a
t ow
n se
rver
, usi
ng o
pen
sour
ce o
ffice
pro
duct
s, u
s-in
g op
en s
ourc
e to
oth
er p
urpo
ses.
Fram
e: S
tatis
tics
Den
mar
k’s
Bus
i-ne
ss R
egis
ter.
Sur
vey
desi
gn: c
ensu
s of
sel
ecte
d or
gani
zatio
ns, s
tand
-alo
ne s
urve
y (w
ith a
75
per
cent
resp
onse
rat
e).
Col
lect
ion
met
hod:
web
form
and
m
ail-b
ased
in c
ombi
natio
n.C
lass
ifica
tion
by p
opul
atio
n si
ze: t
he
mun
icip
aliti
es a
re g
roup
ed b
y po
pu-
latio
n: 0
–39,
999
and
40,0
00+
.In
tern
atio
nal c
ompa
rabi
lity:
whi
le
ther
e is
som
e co
mm
onal
ity o
f que
s-tio
ns b
etw
een
the
Dan
ish
and
the
Nor
weg
ian
surv
ey, s
truc
tura
l diff
er-
ence
s in
the
publ
ic s
ecto
r of
the
two
coun
trie
s, m
ake
it di
fficu
lt to
mak
e di
rect
com
paris
ons.
Den
mar
kS
tatis
tics
Den
-m
ark
– IC
T ex
pend
iture
s in
pu
blic
aut
horit
ies
Ann
ual,
2003
–200
7P
ublic
sec
tor
auth
oriti
es a
t cen
tral
an
d at
dec
entr
aliz
ed le
vel (
stat
e,
coun
ties
and
mun
icip
aliti
es).
Valu
e of
exp
endi
ture
s/in
vest
men
ts fo
r:
com
pute
r an
d re
late
d eq
uipm
ent,
tele
com
-m
unic
atio
n eq
uipm
ent,
audi
o an
d vi
deo
equi
pmen
t, ot
her
ICT
good
s, p
re-p
acka
ged
softw
are,
cus
tom
ized
sof
twar
e, IC
T se
rvic
es,
ICT
educ
atio
n ex
pend
iture
, ren
tal a
nd s
ervi
ce
subs
crip
tions
.O
wn
acco
unt s
oftw
are
prod
uctio
n (p
erso
n-ye
ars
spen
t on)
.B
ackg
roun
d va
riabl
es a
re o
btai
ned
from
the
Bus
ines
s re
gist
er.
Fram
e: S
tatis
tics
Den
mar
k’s
Bus
i-ne
ss R
egis
ter.
Sur
vey
desi
gn: c
ensu
s of
sel
ecte
d or
gani
zatio
ns, s
tand
-alo
ne s
urve
y.C
olle
ctio
n m
etho
d: m
ail-b
ased
.
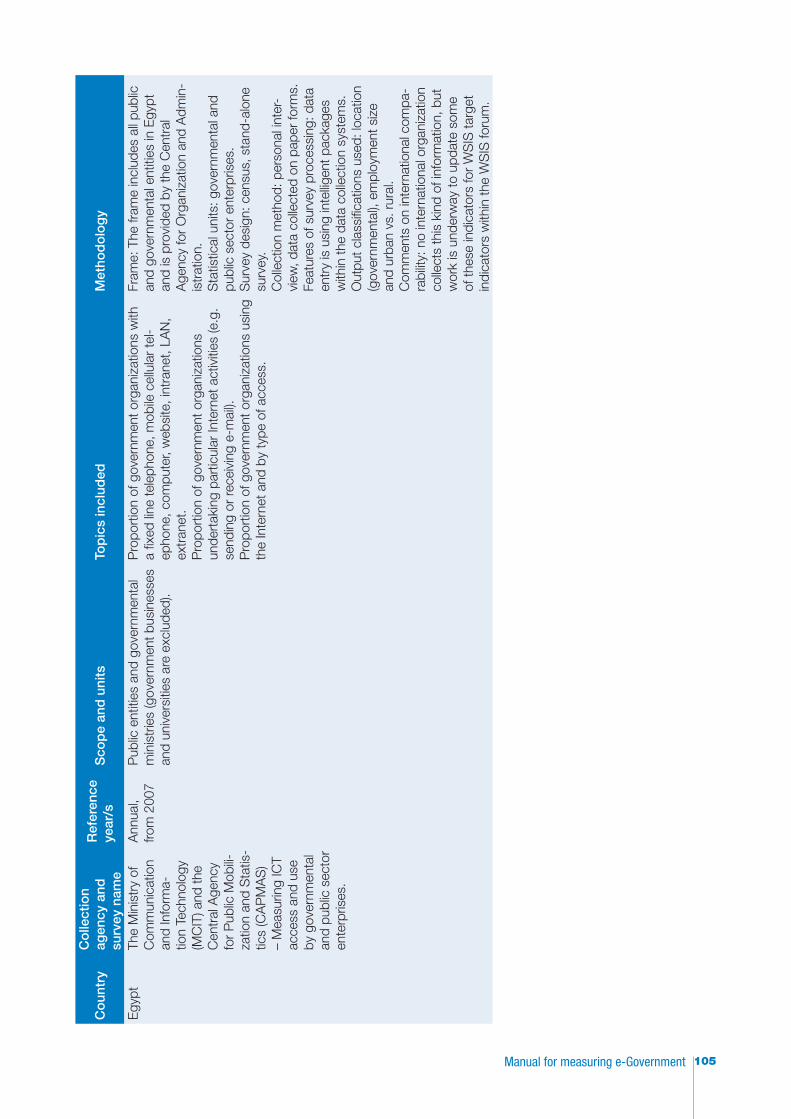
105Manual for measuring e-Government
Co
untr
yC
olle
ctio
n ag
ency
and
su
rvey
nam
e
Ref
eren
ce
year
/sS
cop
e an
d u
nits
Top
ics
incl
uded
Met
hod
olo
gy
Egy
ptTh
e M
inis
try
of
Com
mun
icat
ion
and
Info
rma-
tion
Tech
nolo
gy
(MC
IT) a
nd th
e C
entr
al A
genc
y fo
r P
ublic
Mob
ili-za
tion
and
Sta
tis-
tics
(CA
PM
AS
) –
Mea
surin
g IC
T ac
cess
and
use
by
gov
ernm
enta
l an
d pu
blic
sec
tor
ente
rpris
es.
Ann
ual,
from
200
7P
ublic
ent
ities
and
gov
ernm
enta
l m
inis
trie
s (g
over
nmen
t bus
ines
ses
and
univ
ersi
ties
are
excl
uded
).
Pro
port
ion
of g
over
nmen
t org
aniz
atio
ns w
ith
a fix
ed li
ne te
leph
one,
mob
ile c
ellu
lar
tel-
epho
ne, c
ompu
ter,
web
site
, int
rane
t, LA
N,
extr
anet
.P
ropo
rtio
n of
gov
ernm
ent o
rgan
izat
ions
un
dert
akin
g pa
rtic
ular
Inte
rnet
act
iviti
es (e
.g.
send
ing
or re
ceiv
ing
e-m
ail).
Pro
port
ion
of g
over
nmen
t org
aniz
atio
ns u
sing
th
e In
tern
et a
nd b
y ty
pe o
f acc
ess.
Fram
e: T
he fr
ame
incl
udes
all
publ
ic
and
gove
rnm
enta
l ent
ities
in E
gypt
an
d is
pro
vide
d by
the
Cen
tral
A
genc
y fo
r O
rgan
izat
ion
and
Adm
in-
istr
atio
n.S
tatis
tical
uni
ts: g
over
nmen
tal a
nd
publ
ic s
ecto
r en
terp
rises
.S
urve
y de
sign
: cen
sus,
sta
nd-a
lone
su
rvey
.C
olle
ctio
n m
etho
d: p
erso
nal i
nter
-vi
ew, d
ata
colle
cted
on
pape
r fo
rms.
Feat
ures
of s
urve
y pr
oces
sing
: dat
a en
try
is u
sing
inte
lligen
t pac
kage
s w
ithin
the
data
col
lect
ion
syst
ems.
Out
put c
lass
ifica
tions
use
d: lo
catio
n (g
over
nmen
tal),
em
ploy
men
t siz
e an
d ur
ban
vs. r
ural
.C
omm
ents
on
inte
rnat
iona
l com
pa-
rabi
lity:
no
inte
rnat
iona
l org
aniz
atio
n co
llect
s th
is k
ind
of in
form
atio
n, b
ut
wor
k is
und
erw
ay to
upd
ate
som
e of
thes
e in
dica
tors
for
WS
IS ta
rget
in
dica
tors
with
in th
e W
SIS
foru
m.
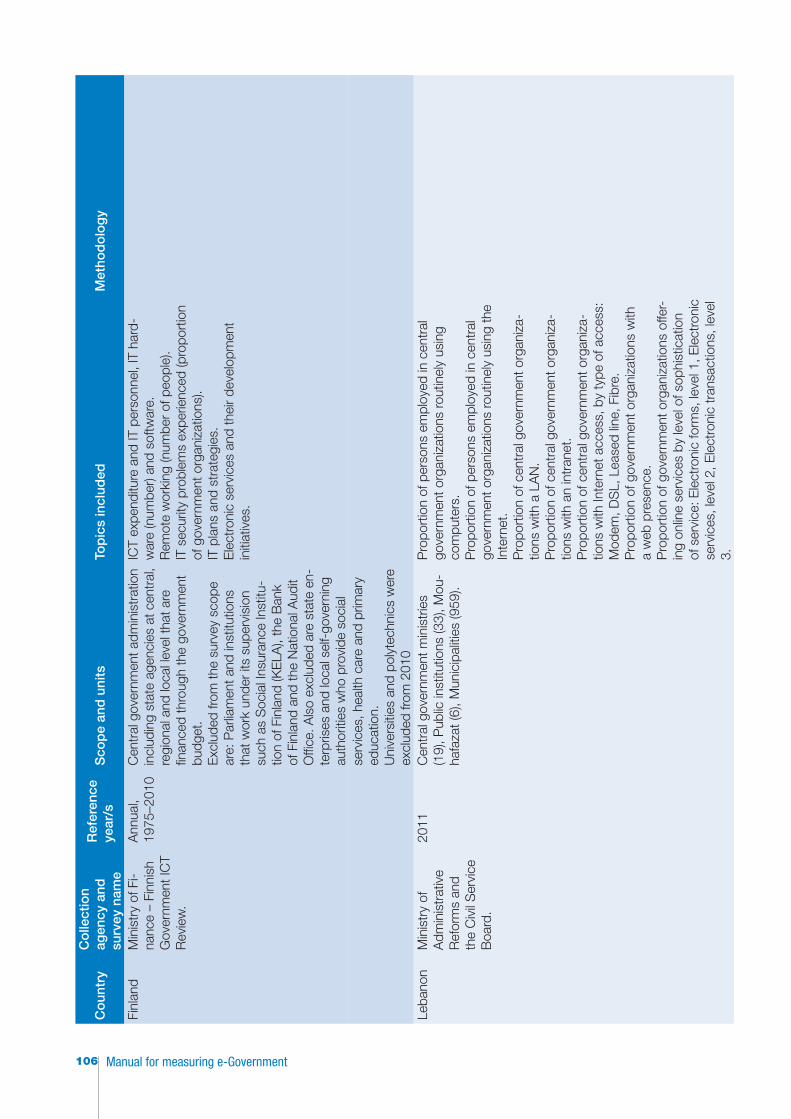
Manual for measuring e-Government106
Co
untr
yC
olle
ctio
n ag
ency
and
su
rvey
nam
e
Ref
eren
ce
year
/sS
cop
e an
d u
nits
Top
ics
incl
uded
Met
hod
olo
gy
Finl
and
Min
istr
y of
Fi-
nanc
e –
Finn
ish
Gov
ernm
ent I
CT
Rev
iew
.
Ann
ual,
1975
–201
0C
entr
al g
over
nmen
t adm
inis
trat
ion
incl
udin
g st
ate
agen
cies
at c
entr
al,
regi
onal
and
loca
l lev
el th
at a
re
finan
ced
thro
ugh
the
gove
rnm
ent
budg
et.
Exc
lude
d fro
m th
e su
rvey
sco
pe
are:
Par
liam
ent a
nd in
stitu
tions
th
at w
ork
unde
r its
sup
ervi
sion
su
ch a
s S
ocia
l Ins
uran
ce In
stitu
-tio
n of
Fin
land
(KE
LA),
the
Ban
k of
Fin
land
and
the
Nat
iona
l Aud
it O
ffice
. Als
o ex
clud
ed a
re s
tate
en-
terp
rises
and
loca
l sel
f-go
vern
ing
auth
oriti
es w
ho p
rovi
de s
ocia
l
ICT
expe
nditu
re a
nd IT
per
sonn
el, I
T ha
rd-
war
e (n
umbe
r) an
d so
ftwar
e.R
emot
e w
orki
ng (n
umbe
r of
peo
ple)
.IT
sec
urity
pro
blem
s ex
perie
nced
(pro
port
ion
of g
over
nmen
t org
aniz
atio
ns).
IT p
lans
and
str
ateg
ies.
Ele
ctro
nic
serv
ices
and
thei
r de
velo
pmen
t in
itiat
ives
.
serv
ices
, hea
lth c
are
and
prim
ary
educ
atio
n.U
nive
rsiti
es a
nd p
olyt
echn
ics
wer
e ex
clud
ed fr
om 2
010
Leba
non
Min
istr
y of
A
dmin
istr
ativ
e R
efor
ms
and
the
Civ
il S
ervi
ce
Boa
rd.
2011
Cen
tral
gov
ernm
ent m
inis
trie
s (1
9), P
ublic
inst
itutio
ns (3
3), M
ou-
hafa
zat (
6), M
unic
ipal
ities
(959
).
Pro
port
ion
of p
erso
ns e
mpl
oyed
in c
entr
al
gove
rnm
ent o
rgan
izat
ions
rout
inel
y us
ing
com
pute
rs.
Pro
port
ion
of p
erso
ns e
mpl
oyed
in c
entr
al
gove
rnm
ent o
rgan
izat
ions
rout
inel
y us
ing
the
Inte
rnet
.P
ropo
rtio
n of
cen
tral
gov
ernm
ent o
rgan
iza-
tions
with
a L
AN
.P
ropo
rtio
n of
cen
tral
gov
ernm
ent o
rgan
iza-
tions
with
an
intr
anet
.P
ropo
rtio
n of
cen
tral
gov
ernm
ent o
rgan
iza-
tions
with
Inte
rnet
acc
ess,
by
type
of a
cces
s:
Mod
em, D
SL,
Lea
sed
line,
Fib
re.
Pro
port
ion
of g
over
nmen
t org
aniz
atio
ns w
ith
a w
eb p
rese
nce.
Pro
port
ion
of g
over
nmen
t org
aniz
atio
ns o
ffer-
ing
onlin
e se
rvic
es b
y le
vel o
f sop
hist
icat
ion
of s
ervi
ce: E
lect
roni
c fo
rms,
leve
l 1, E
lect
roni
c se
rvic
es, l
evel
2, E
lect
roni
c tr
ansa
ctio
ns, l
evel
3.
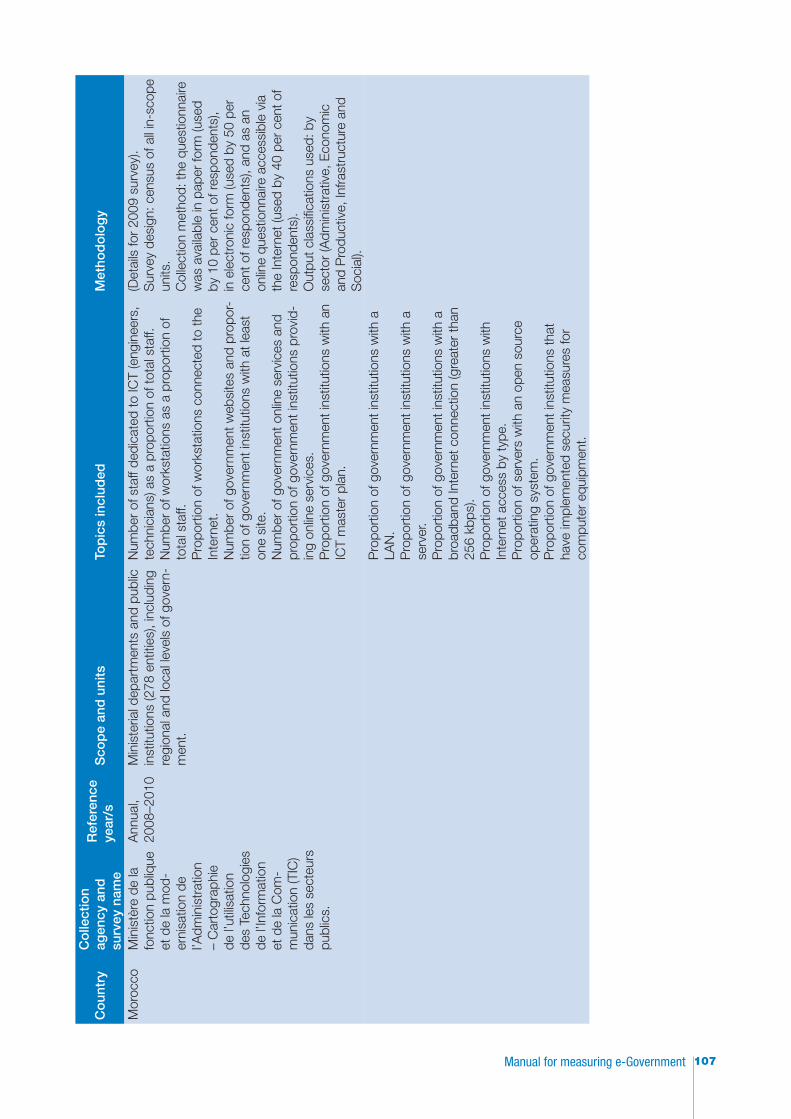
107Manual for measuring e-Government
Co
untr
yC
olle
ctio
n ag
ency
and
su
rvey
nam
e
Ref
eren
ce
year
/sS
cop
e an
d u
nits
Top
ics
incl
uded
Met
hod
olo
gy
Mor
occo
Min
istè
re d
e la
fo
nctio
n pu
bliq
ue
et d
e la
mod
-er
nisa
tion
de
l’Adm
inis
trat
ion
– C
arto
grap
hie
de l’
utilis
atio
n de
s Te
chno
logi
es
de l’
Info
rmat
ion
et d
e la
Com
-m
unic
atio
n (T
IC)
dans
les
sect
eurs
pu
blic
s.
Ann
ual,
2008
–201
0M
inis
teria
l dep
artm
ents
and
pub
lic
inst
itutio
ns (2
78 e
ntiti
es),
incl
udin
g re
gion
al a
nd lo
cal l
evel
s of
gov
ern-
men
t.
Num
ber
of s
taff
dedi
cate
d to
ICT
(eng
inee
rs,
tech
nici
ans)
as
a pr
opor
tion
of to
tal s
taff.
Num
ber
of w
orks
tatio
ns a
s a
prop
ortio
n of
to
tal s
taff.
Pro
port
ion
of w
orks
tatio
ns c
onne
cted
to th
e In
tern
et.
Num
ber
of g
over
nmen
t web
site
s an
d pr
opor
-tio
n of
gov
ernm
ent i
nstit
utio
ns w
ith a
t lea
st
one
site
.N
umbe
r of
gov
ernm
ent o
nlin
e se
rvic
es a
nd
prop
ortio
n of
gov
ernm
ent i
nstit
utio
ns p
rovi
d-in
g on
line
serv
ices
.P
ropo
rtio
n of
gov
ernm
ent i
nstit
utio
ns w
ith a
n IC
T m
aste
r pl
an.
(Det
ails
for
2009
sur
vey)
.S
urve
y de
sign
: cen
sus
of a
ll in
-sco
pe
units
.C
olle
ctio
n m
etho
d: th
e qu
estio
nnai
re
was
ava
ilabl
e in
pap
er fo
rm (u
sed
by 1
0 pe
r ce
nt o
f res
pond
ents
), in
ele
ctro
nic
form
(use
d by
50
per
cent
of r
espo
nden
ts),
and
as a
n on
line
ques
tionn
aire
acc
essi
ble
via
the
Inte
rnet
(use
d by
40
per
cent
of
resp
onde
nts)
.O
utpu
t cla
ssifi
catio
ns u
sed:
by
sect
or (A
dmin
istr
ativ
e, E
cono
mic
an
d P
rodu
ctiv
e, In
frast
ruct
ure
and
Soc
ial).
Pro
port
ion
of g
over
nmen
t ins
titut
ions
with
a
LAN
.P
ropo
rtio
n of
gov
ernm
ent i
nstit
utio
ns w
ith a
se
rver
.P
ropo
rtio
n of
gov
ernm
ent i
nstit
utio
ns w
ith a
br
oadb
and
Inte
rnet
con
nect
ion
(gre
ater
than
25
6 kb
ps).
Pro
port
ion
of g
over
nmen
t ins
titut
ions
with
In
tern
et a
cces
s by
type
.P
ropo
rtio
n of
ser
vers
with
an
open
sou
rce
oper
atin
g sy
stem
.P
ropo
rtio
n of
gov
ernm
ent i
nstit
utio
ns th
at
have
impl
emen
ted
secu
rity
mea
sure
s fo
r co
mpu
ter
equi
pmen
t.
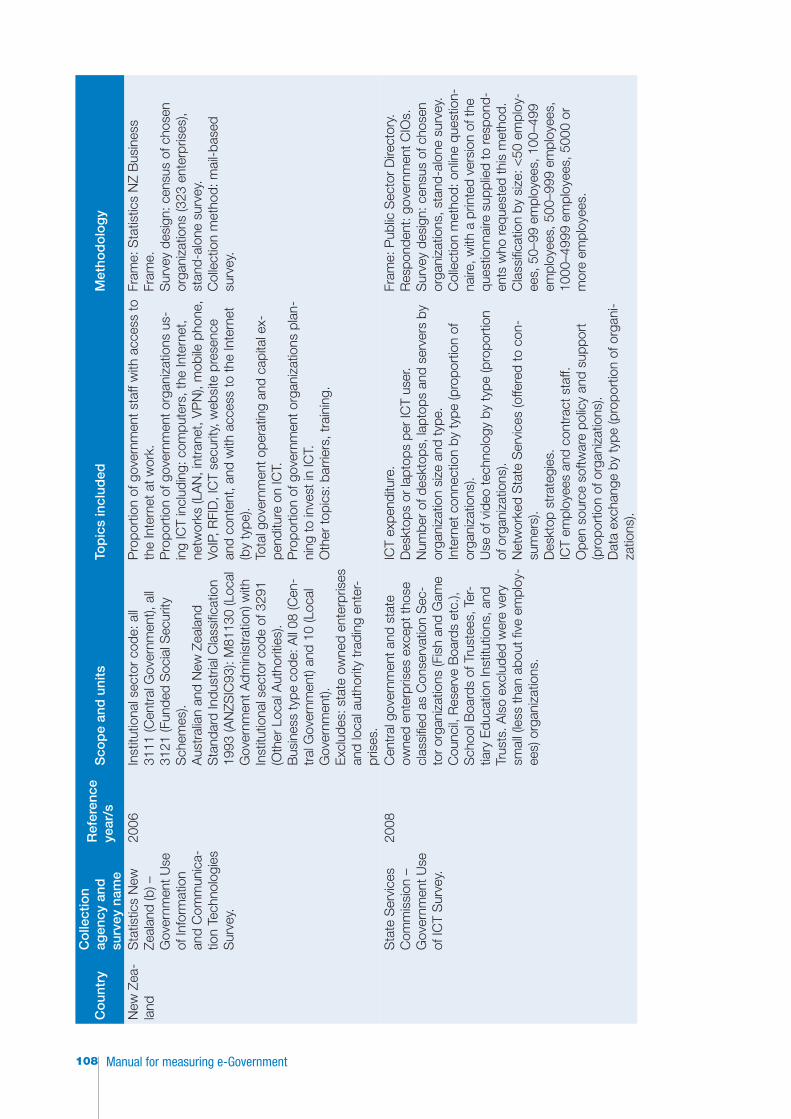
Manual for measuring e-Government108
Co
untr
yC
olle
ctio
n ag
ency
and
su
rvey
nam
e
Ref
eren
ce
year
/sS
cop
e an
d u
nits
Top
ics
incl
uded
Met
hod
olo
gy
New
Zea
-la
ndS
tatis
tics
New
Ze
alan
d (b
) –
Gov
ernm
ent U
se
of In
form
atio
n an
d C
omm
unic
a-tio
n Te
chno
logi
es
Sur
vey.
2006
Inst
itutio
nal s
ecto
r co
de: a
ll 31
11 (C
entr
al G
over
nmen
t), a
ll 31
21 (F
unde
d S
ocia
l Sec
urity
S
chem
es).
Aus
tral
ian
and
New
Zea
land
S
tand
ard
Indu
stria
l Cla
ssifi
catio
n 19
93 (A
NZS
IC93
): M
8113
0 (L
ocal
G
over
nmen
t Adm
inis
trat
ion)
with
In
stitu
tiona
l sec
tor
code
of 3
291
(Oth
er L
ocal
Aut
horit
ies)
.B
usin
ess
type
cod
e: A
ll 08
(Cen
-tr
al G
over
nmen
t) an
d 10
(Loc
al
Gov
ernm
ent).
Exc
lude
s: s
tate
ow
ned
ente
rpris
es
and
loca
l aut
horit
y tr
adin
g en
ter-
pris
es.
Pro
port
ion
of g
over
nmen
t sta
ff w
ith a
cces
s to
th
e In
tern
et a
t wor
k.P
ropo
rtio
n of
gov
ernm
ent o
rgan
izat
ions
us-
ing
ICT
incl
udin
g: c
ompu
ters
, the
Inte
rnet
, ne
twor
ks (L
AN
, int
rane
t, V
PN
), m
obile
pho
ne,
VoIP
, RFI
D, I
CT
secu
rity,
web
site
pre
senc
e an
d co
nten
t, an
d w
ith a
cces
s to
the
Inte
rnet
(b
y ty
pe).
Tota
l gov
ernm
ent o
pera
ting
and
capi
tal e
x-pe
nditu
re o
n IC
T.P
ropo
rtio
n of
gov
ernm
ent o
rgan
izat
ions
pla
n-ni
ng to
inve
st in
ICT.
Oth
er to
pics
: bar
riers
, tra
inin
g.
Fram
e: S
tatis
tics
NZ
Bus
ines
s Fr
ame.
Sur
vey
desi
gn: c
ensu
s of
cho
sen
orga
niza
tions
(323
ent
erpr
ises
), st
and-
alon
e su
rvey
.C
olle
ctio
n m
etho
d: m
ail-b
ased
su
rvey
.
Sta
te S
ervi
ces
Com
mis
sion
–
Gov
ernm
ent U
se
of IC
T S
urve
y.
2008
Cen
tral
gov
ernm
ent a
nd s
tate
ow
ned
ente
rpris
es e
xcep
t tho
se
clas
sifie
d as
Con
serv
atio
n S
ec-
tor
orga
niza
tions
(Fis
h an
d G
ame
Cou
ncil,
Res
erve
Boa
rds
etc.
), S
choo
l Boa
rds
of T
rust
ees,
Ter
-tia
ry E
duca
tion
Inst
itutio
ns, a
nd
Trus
ts. A
lso
excl
uded
wer
e ve
ry
smal
l (le
ss th
an a
bout
five
em
ploy
-ee
s) o
rgan
izat
ions
.
ICT
expe
nditu
re.
Des
ktop
s or
lapt
ops
per
ICT
user
.N
umbe
r of
des
ktop
s, la
ptop
s an
d se
rver
s by
or
gani
zatio
n si
ze a
nd ty
pe.
Inte
rnet
con
nect
ion
by ty
pe (p
ropo
rtio
n of
or
gani
zatio
ns).
Use
of v
ideo
tech
nolo
gy b
y ty
pe (p
ropo
rtio
n of
org
aniz
atio
ns).
Net
wor
ked
Sta
te S
ervi
ces
(offe
red
to c
on-
sum
ers)
.D
eskt
op s
trat
egie
s.IC
T em
ploy
ees
and
cont
ract
sta
ff.O
pen
sour
ce s
oftw
are
polic
y an
d su
ppor
t (p
ropo
rtio
n of
org
aniz
atio
ns).
Dat
a ex
chan
ge b
y ty
pe (p
ropo
rtio
n of
org
ani-
zatio
ns).
Fram
e: P
ublic
Sec
tor
Dire
ctor
y.R
espo
nden
t: go
vern
men
t CIO
s.S
urve
y de
sign
: cen
sus
of c
hose
n or
gani
zatio
ns, s
tand
-alo
ne s
urve
y.C
olle
ctio
n m
etho
d: o
nlin
e qu
estio
n-na
ire, w
ith a
prin
ted
vers
ion
of th
e qu
estio
nnai
re s
uppl
ied
to re
spon
d-en
ts w
ho re
ques
ted
this
met
hod.
Cla
ssifi
catio
n by
siz
e: <
50 e
mpl
oy-
ees,
50–
99 e
mpl
oyee
s, 1
00–4
99
empl
oyee
s, 5
00–9
99 e
mpl
oyee
s,
1000
–499
9 em
ploy
ees,
500
0 or
m
ore
empl
oyee
s.
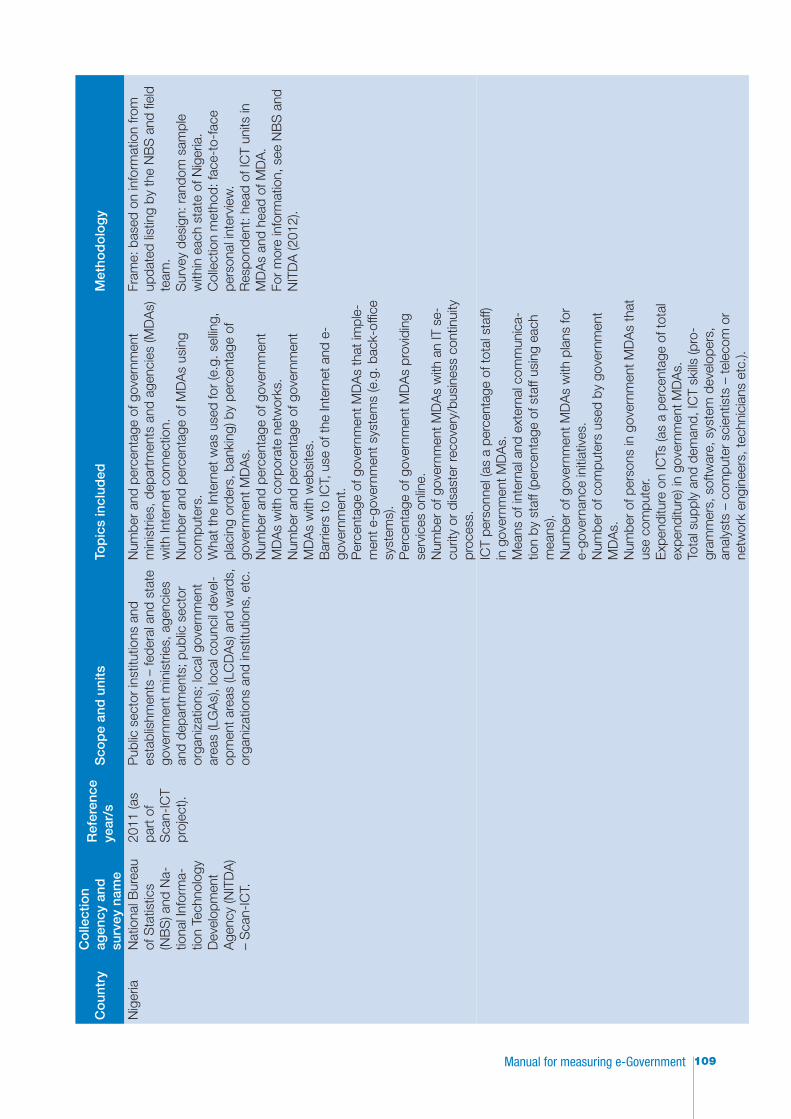
109Manual for measuring e-Government
Co
untr
yC
olle
ctio
n ag
ency
and
su
rvey
nam
e
Ref
eren
ce
year
/sS
cop
e an
d u
nits
Top
ics
incl
uded
Met
hod
olo
gy
Nig
eria
Nat
iona
l Bur
eau
of S
tatis
tics
(NB
S) a
nd N
a-tio
nal I
nfor
ma-
tion
Tech
nolo
gy
Dev
elop
men
t A
genc
y (N
ITD
A)
– S
can-
ICT.
2011
(as
part
of
Sca
n-IC
T pr
ojec
t).
Pub
lic s
ecto
r in
stitu
tions
and
es
tabl
ishm
ents
– fe
dera
l and
sta
te
gove
rnm
ent m
inis
trie
s, a
genc
ies
and
depa
rtm
ents
; pub
lic s
ecto
r or
gani
zatio
ns; l
ocal
gov
ernm
ent
area
s (L
GA
s), l
ocal
cou
ncil
deve
l-op
men
t are
as (L
CD
As)
and
war
ds,
orga
niza
tions
and
inst
itutio
ns, e
tc.
Num
ber
and
perc
enta
ge o
f gov
ernm
ent
min
istr
ies,
dep
artm
ents
and
age
ncie
s (M
DA
s)
with
Inte
rnet
con
nect
ion.
Num
ber
and
perc
enta
ge o
f MD
As
usin
g co
mpu
ters
.W
hat t
he In
tern
et w
as u
sed
for
(e.g
. sel
ling,
pl
acin
g or
ders
, ban
king
) by
perc
enta
ge o
f go
vern
men
t MD
As.
Num
ber
and
perc
enta
ge o
f gov
ernm
ent
MD
As
with
cor
pora
te n
etw
orks
.N
umbe
r an
d pe
rcen
tage
of g
over
nmen
t M
DA
s w
ith w
ebsi
tes.
Bar
riers
to IC
T, u
se o
f the
Inte
rnet
and
e-
gove
rnm
ent.
Per
cent
age
of g
over
nmen
t MD
As
that
impl
e-m
ent e
-gov
ernm
ent s
yste
ms
(e.g
. bac
k-of
fice
syst
ems)
.P
erce
ntag
e of
gov
ernm
ent M
DA
s pr
ovid
ing
serv
ices
onl
ine.
Num
ber
of g
over
nmen
t MD
As
with
an
IT s
e-cu
rity
or d
isas
ter
reco
very
/bus
ines
s co
ntin
uity
pr
oces
s.
Fram
e: b
ased
on
info
rmat
ion
from
up
date
d lis
ting
by th
e N
BS
and
fiel
d te
am.
Sur
vey
desi
gn: r
ando
m s
ampl
e w
ithin
eac
h st
ate
of N
iger
ia.
Col
lect
ion
met
hod:
face
-to-
face
pe
rson
al in
terv
iew
.R
espo
nden
t: he
ad o
f IC
T un
its in
M
DA
s an
d he
ad o
f MD
A.
For
mor
e in
form
atio
n, s
ee N
BS
and
N
ITD
A (2
012)
.
ICT
pers
onne
l (as
a p
erce
ntag
e of
tota
l sta
ff)
in g
over
nmen
t MD
As.
Mea
ns o
f int
erna
l and
ext
erna
l com
mun
ica-
tion
by s
taff
(per
cent
age
of s
taff
usin
g ea
ch
mea
ns).
Num
ber
of g
over
nmen
t MD
As
with
pla
ns fo
r e-
gove
rnan
ce in
itiat
ives
.N
umbe
r of
com
pute
rs u
sed
by g
over
nmen
t M
DA
s.N
umbe
r of
per
sons
in g
over
nmen
t MD
As
that
us
e co
mpu
ter.
Exp
endi
ture
on
ICTs
(as
a pe
rcen
tage
of t
otal
ex
pend
iture
) in
gove
rnm
ent M
DA
s.To
tal s
uppl
y an
d de
man
d, IC
T sk
ills (p
ro-
gram
mer
s, s
oftw
are,
sys
tem
dev
elop
ers,
an
alys
ts –
com
pute
r sc
ient
ists
– te
leco
m o
r ne
twor
k en
gine
ers,
tech
nici
ans
etc.
).
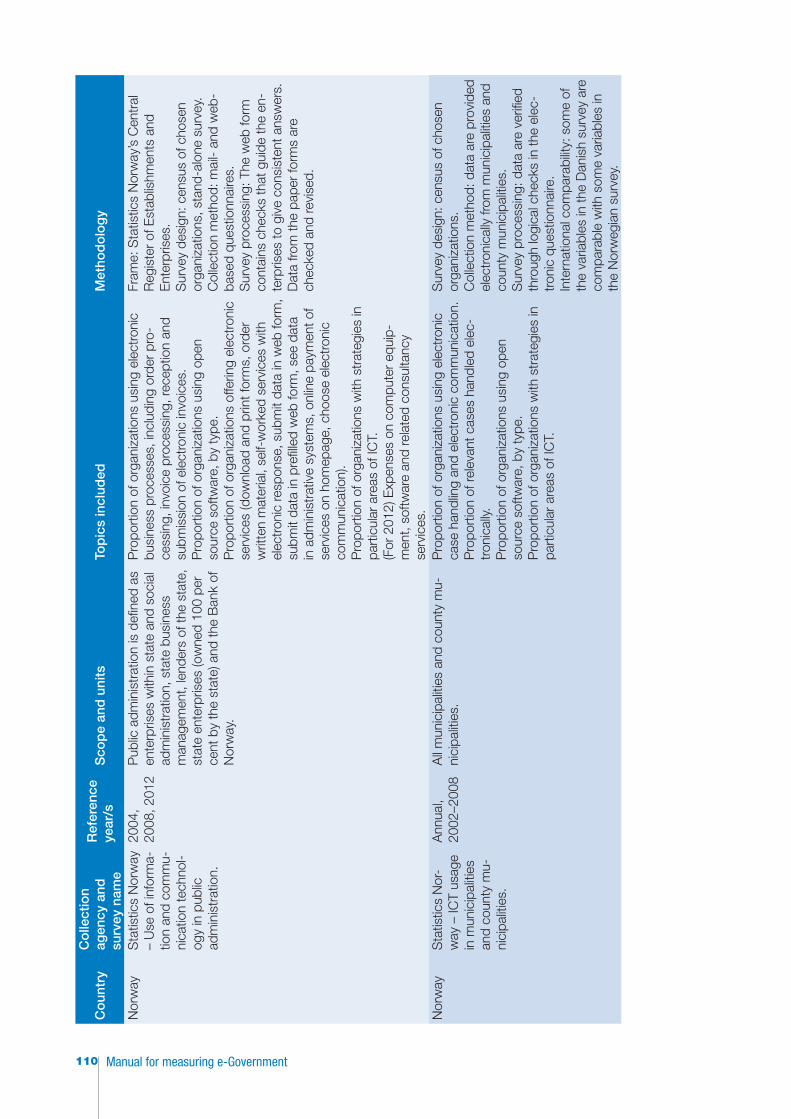
Manual for measuring e-Government110
Co
untr
yC
olle
ctio
n ag
ency
and
su
rvey
nam
e
Ref
eren
ce
year
/sS
cop
e an
d u
nits
Top
ics
incl
uded
Met
hod
olo
gy
Nor
way
Sta
tistic
s N
orw
ay
– U
se o
f inf
orm
a-tio
n an
d co
mm
u-ni
catio
n te
chno
l-og
y in
pub
lic
adm
inis
trat
ion.
2004
, 20
08, 2
012
Pub
lic a
dmin
istr
atio
n is
defi
ned
as
ente
rpris
es w
ithin
sta
te a
nd s
ocia
l ad
min
istr
atio
n, s
tate
bus
ines
s m
anag
emen
t, le
nder
s of
the
stat
e,
stat
e en
terp
rises
(ow
ned
100
per
cent
by
the
stat
e) a
nd th
e B
ank
of
Nor
way
.
Pro
port
ion
of o
rgan
izat
ions
usi
ng e
lect
roni
c bu
sine
ss p
roce
sses
, inc
ludi
ng o
rder
pro
-ce
ssin
g, in
voic
e pr
oces
sing
, rec
eptio
n an
d su
bmis
sion
of e
lect
roni
c in
voic
es.
Pro
port
ion
of o
rgan
izat
ions
usi
ng o
pen
sour
ce s
oftw
are,
by
type
.P
ropo
rtio
n of
org
aniz
atio
ns o
fferin
g el
ectr
onic
se
rvic
es (d
ownl
oad
and
prin
t for
ms,
ord
er
writ
ten
mat
eria
l, se
lf-w
orke
d se
rvic
es w
ith
elec
tron
ic re
spon
se, s
ubm
it da
ta in
web
form
, su
bmit
data
in p
refil
led
web
form
, see
dat
a in
adm
inis
trat
ive
syst
ems,
onl
ine
paym
ent o
f se
rvic
es o
n ho
mep
age,
cho
ose
elec
tron
ic
com
mun
icat
ion)
.P
ropo
rtio
n of
org
aniz
atio
ns w
ith s
trat
egie
s in
pa
rtic
ular
are
as o
f IC
T.(F
or 2
012)
Exp
ense
s on
com
pute
r eq
uip-
men
t, so
ftwar
e an
d re
late
d co
nsul
tanc
y se
rvic
es.
Fram
e: S
tatis
tics
Nor
way
’s C
entr
al
Reg
iste
r of
Est
ablis
hmen
ts a
nd
Ent
erpr
ises
.S
urve
y de
sign
: cen
sus
of c
hose
n or
gani
zatio
ns, s
tand
-alo
ne s
urve
y.C
olle
ctio
n m
etho
d: m
ail-
and
web
-ba
sed
ques
tionn
aire
s.S
urve
y pr
oces
sing
: The
web
form
co
ntai
ns c
heck
s th
at g
uide
the
en-
terp
rises
to g
ive
cons
iste
nt a
nsw
ers.
D
ata
from
the
pape
r fo
rms
are
chec
ked
and
revi
sed.
Nor
way
Sta
tistic
s N
or-
way
– IC
T us
age
in m
unic
ipal
ities
an
d co
unty
mu-
nici
palit
ies.
Ann
ual,
2002
–200
8A
ll m
unic
ipal
ities
and
cou
nty
mu-
nici
palit
ies.
Pro
port
ion
of o
rgan
izat
ions
usi
ng e
lect
roni
c ca
se h
andl
ing
and
elec
tron
ic c
omm
unic
atio
n.P
ropo
rtio
n of
rele
vant
cas
es h
andl
ed e
lec-
tron
ical
ly.P
ropo
rtio
n of
org
aniz
atio
ns u
sing
ope
n so
urce
sof
twar
e, b
y ty
pe.
Pro
port
ion
of o
rgan
izat
ions
with
str
ateg
ies
in
part
icul
ar a
reas
of I
CT.
Sur
vey
desi
gn: c
ensu
s of
cho
sen
orga
niza
tions
.C
olle
ctio
n m
etho
d: d
ata
are
prov
ided
el
ectr
onic
ally
from
mun
icip
aliti
es a
nd
coun
ty m
unic
ipal
ities
.S
urve
y pr
oces
sing
: dat
a ar
e ve
rified
th
roug
h lo
gica
l che
cks
in th
e el
ec-
tron
ic q
uest
ionn
aire
.In
tern
atio
nal c
ompa
rabi
lity:
som
e of
th
e va
riabl
es in
the
Dan
ish
surv
ey a
re
com
para
ble
with
som
e va
riabl
es in
th
e N
orw
egia
n su
rvey
.
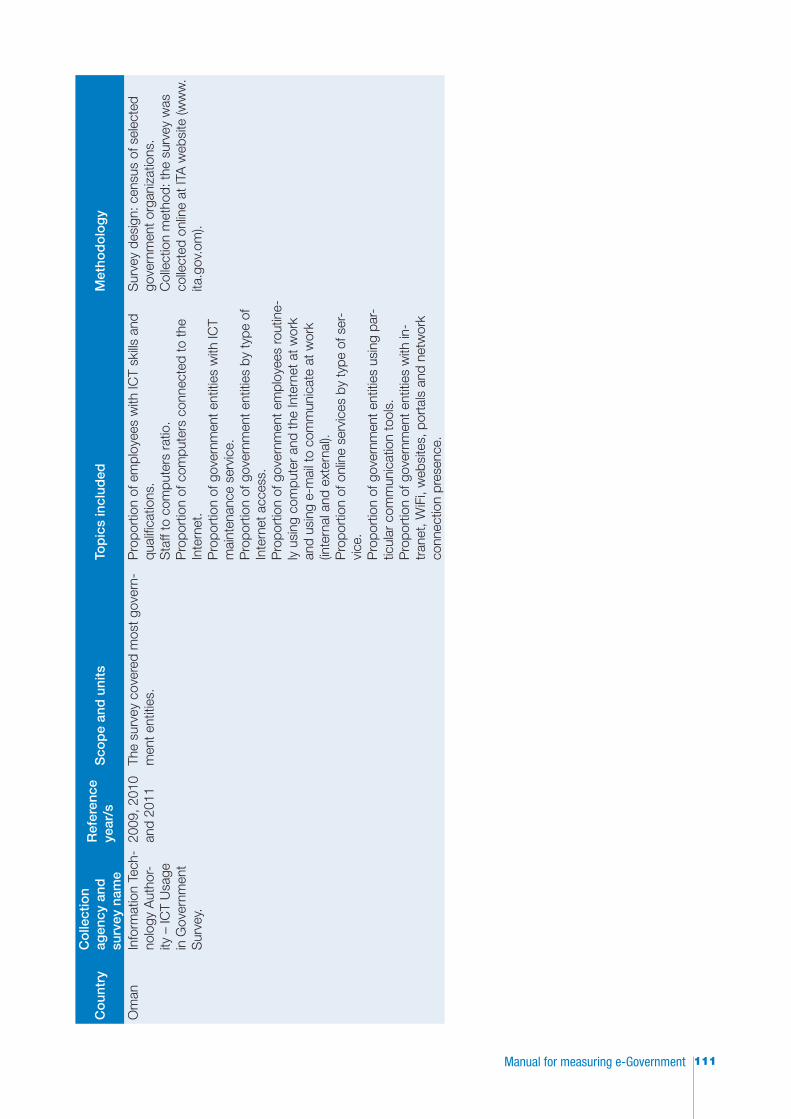
111Manual for measuring e-Government
Co
untr
yC
olle
ctio
n ag
ency
and
su
rvey
nam
e
Ref
eren
ce
year
/sS
cop
e an
d u
nits
Top
ics
incl
uded
Met
hod
olo
gy
Om
anIn
form
atio
n Te
ch-
nolo
gy A
utho
r-ity
– IC
T U
sage
in
Gov
ernm
ent
Sur
vey.
2009
, 201
0 an
d 20
11Th
e su
rvey
cov
ered
mos
t gov
ern-
men
t ent
ities
.P
ropo
rtio
n of
em
ploy
ees
with
ICT
skills
and
qu
alifi
catio
ns.
Sta
ff to
com
pute
rs r
atio
.P
ropo
rtio
n of
com
pute
rs c
onne
cted
to th
e In
tern
et.
Pro
port
ion
of g
over
nmen
t ent
ities
with
ICT
mai
nten
ance
ser
vice
.P
ropo
rtio
n of
gov
ernm
ent e
ntiti
es b
y ty
pe o
f In
tern
et a
cces
s.P
ropo
rtio
n of
gov
ernm
ent e
mpl
oyee
s ro
utin
e-ly
usi
ng c
ompu
ter
and
the
Inte
rnet
at w
ork
and
usin
g e-
mai
l to
com
mun
icat
e at
wor
k (in
tern
al a
nd e
xter
nal).
Pro
port
ion
of o
nlin
e se
rvic
es b
y ty
pe o
f ser
-vi
ce.
Pro
port
ion
of g
over
nmen
t ent
ities
usi
ng p
ar-
ticul
ar c
omm
unic
atio
n to
ols.
Pro
port
ion
of g
over
nmen
t ent
ities
with
in-
tran
et, W
iFi,
web
site
s, p
orta
ls a
nd n
etw
ork
conn
ectio
n pr
esen
ce.
Sur
vey
desi
gn: c
ensu
s of
sel
ecte
d go
vern
men
t org
aniz
atio
ns.
Col
lect
ion
met
hod:
the
surv
ey w
as
colle
cted
onl
ine
at IT
A w
ebsi
te (w
ww
.ita
.gov
.om
).
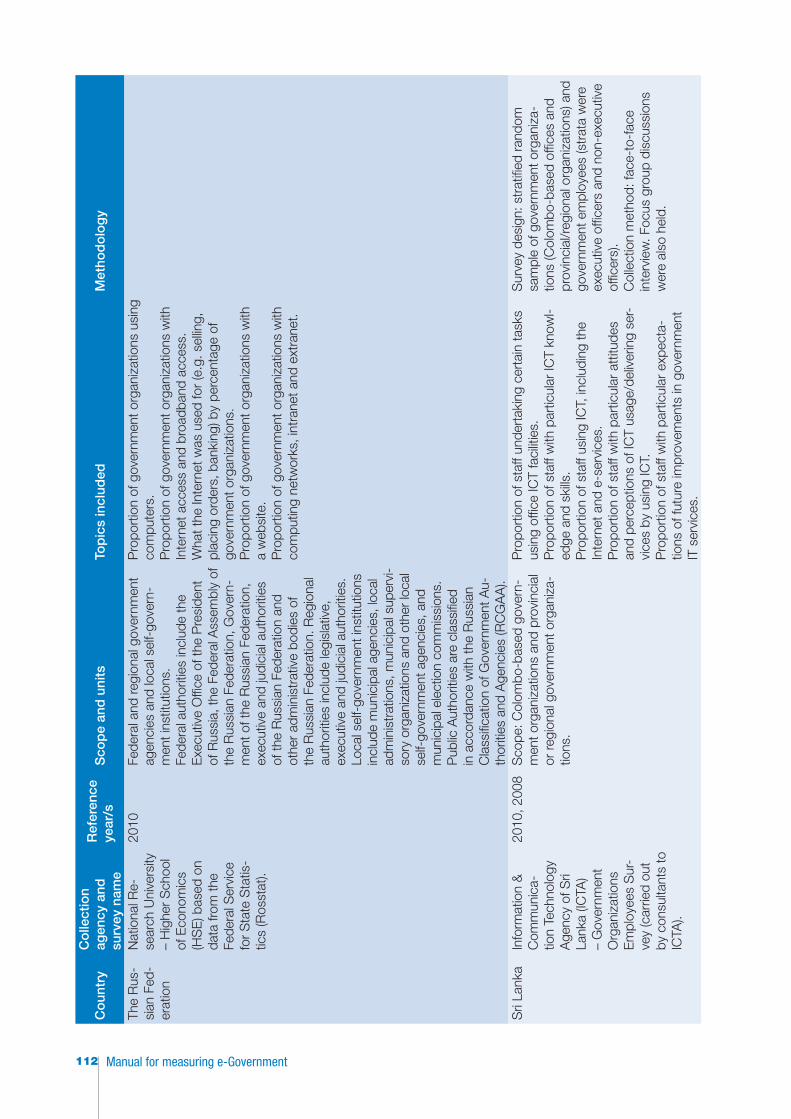
Manual for measuring e-Government112
Co
untr
yC
olle
ctio
n ag
ency
and
su
rvey
nam
e
Ref
eren
ce
year
/sS
cop
e an
d u
nits
Top
ics
incl
uded
Met
hod
olo
gy
The
Rus
-si
an F
ed-
erat
ion
Nat
iona
l Re-
sear
ch U
nive
rsity
–
Hig
her
Sch
ool
of E
cono
mic
s (H
SE
) bas
ed o
n da
ta fr
om th
e Fe
dera
l Ser
vice
fo
r S
tate
Sta
tis-
tics
(Ros
stat
).
2010
Fede
ral a
nd re
gion
al g
over
nmen
t ag
enci
es a
nd lo
cal s
elf-
gove
rn-
men
t ins
titut
ions
.Fe
dera
l aut
horit
ies
incl
ude
the
Exe
cutiv
e O
ffice
of t
he P
resi
dent
of
Rus
sia,
the
Fede
ral A
ssem
bly
of
the
Rus
sian
Fed
erat
ion,
Gov
ern-
men
t of t
he R
ussi
an F
eder
atio
n,
exec
utiv
e an
d ju
dici
al a
utho
ritie
s of
the
Rus
sian
Fed
erat
ion
and
othe
r ad
min
istr
ativ
e bo
dies
of
the
Rus
sian
Fed
erat
ion.
Reg
iona
l au
thor
ities
incl
ude
legi
slat
ive,
ex
ecut
ive
and
judi
cial
aut
horit
ies.
Lo
cal s
elf-
gove
rnm
ent i
nstit
utio
ns
incl
ude
mun
icip
al a
genc
ies,
loca
l ad
min
istr
atio
ns, m
unic
ipal
sup
ervi
-so
ry o
rgan
izat
ions
and
oth
er lo
cal
self-
gove
rnm
ent a
genc
ies,
and
m
unic
ipal
ele
ctio
n co
mm
issi
ons.
P
ublic
Aut
horit
ies
are
clas
sifie
d in
acc
orda
nce
with
the
Rus
sian
C
lass
ifica
tion
of G
over
nmen
t Au-
thor
ities
and
Age
ncie
s (R
CG
AA
).
Pro
port
ion
of g
over
nmen
t org
aniz
atio
ns u
sing
co
mpu
ters
.P
ropo
rtio
n of
gov
ernm
ent o
rgan
izat
ions
with
In
tern
et a
cces
s an
d br
oadb
and
acce
ss.
Wha
t the
Inte
rnet
was
use
d fo
r (e
.g. s
ellin
g,
plac
ing
orde
rs, b
anki
ng) b
y pe
rcen
tage
of
gove
rnm
ent o
rgan
izat
ions
.P
ropo
rtio
n of
gov
ernm
ent o
rgan
izat
ions
with
a
web
site
.P
ropo
rtio
n of
gov
ernm
ent o
rgan
izat
ions
with
co
mpu
ting
netw
orks
, int
rane
t and
ext
rane
t.
Sri
Lank
aIn
form
atio
n &
C
omm
unic
a-tio
n Te
chno
logy
A
genc
y of
Sri
Lank
a (IC
TA)
– G
over
nmen
t O
rgan
izat
ions
E
mpl
oyee
s S
ur-
vey
(car
ried
out
by c
onsu
ltant
s to
IC
TA).
2010
, 200
8S
cope
: Col
ombo
-bas
ed g
over
n-m
ent o
rgan
izat
ions
and
pro
vinc
ial
or re
gion
al g
over
nmen
t org
aniz
a-tio
ns.
Pro
port
ion
of s
taff
unde
rtak
ing
cert
ain
task
s us
ing
offic
e IC
T fa
cilit
ies.
Pro
port
ion
of s
taff
with
par
ticul
ar IC
T kn
owl-
edge
and
ski
lls.
Pro
port
ion
of s
taff
usin
g IC
T, in
clud
ing
the
Inte
rnet
and
e-s
ervi
ces.
Pro
port
ion
of s
taff
with
par
ticul
ar a
ttitu
des
and
perc
eptio
ns o
f IC
T us
age/
deliv
erin
g se
r-vi
ces
by u
sing
ICT.
Pro
port
ion
of s
taff
with
par
ticul
ar e
xpec
ta-
tions
of f
utur
e im
prov
emen
ts in
gov
ernm
ent
IT s
ervi
ces.
Sur
vey
desi
gn: s
trat
ified
ran
dom
sa
mpl
e of
gov
ernm
ent o
rgan
iza-
tions
(Col
ombo
-bas
ed o
ffice
s an
d pr
ovin
cial
/reg
iona
l org
aniz
atio
ns) a
nd
gove
rnm
ent e
mpl
oyee
s (s
trat
a w
ere
exec
utiv
e of
ficer
s an
d no
n-ex
ecut
ive
offic
ers)
.C
olle
ctio
n m
etho
d: fa
ce-t
o-fa
ce
inte
rvie
w. F
ocus
gro
up d
iscu
ssio
ns
wer
e al
so h
eld.
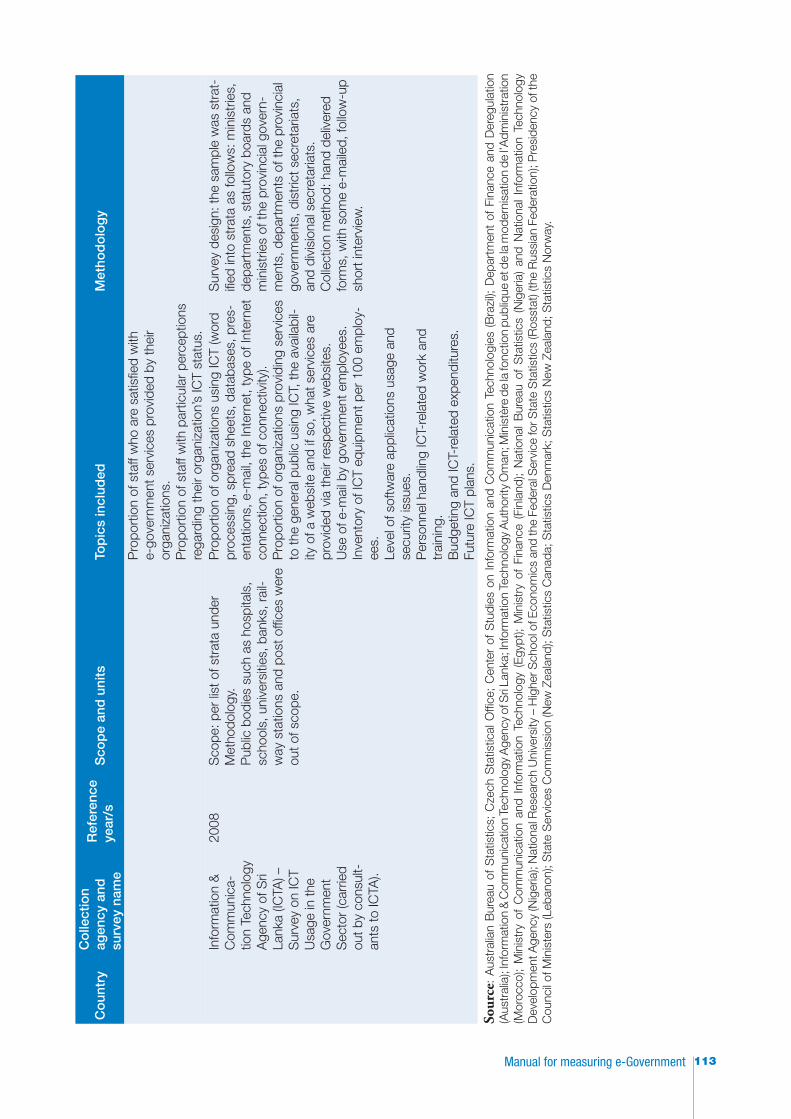
113Manual for measuring e-Government
Co
untr
yC
olle
ctio
n ag
ency
and
su
rvey
nam
e
Ref
eren
ce
year
/sS
cop
e an
d u
nits
Top
ics
incl
uded
Met
hod
olo
gy
Pro
port
ion
of s
taff
who
are
sat
isfie
d w
ith
e-go
vern
men
t ser
vice
s pr
ovid
ed b
y th
eir
orga
niza
tions
.P
ropo
rtio
n of
sta
ff w
ith p
artic
ular
per
cept
ions
re
gard
ing
thei
r or
gani
zatio
n’s
ICT
stat
us.
Info
rmat
ion
&
Com
mun
ica-
tion
Tech
nolo
gy
Age
ncy
of S
ri La
nka
(ICTA
) –
Sur
vey
on IC
T U
sage
in th
e G
over
nmen
t S
ecto
r (c
arrie
d ou
t by
cons
ult-
ants
to IC
TA).
2008
Sco
pe: p
er li
st o
f str
ata
unde
r M
etho
dolo
gy.
Pub
lic b
odie
s su
ch a
s ho
spita
ls,
scho
ols,
uni
vers
ities
, ban
ks, r
ail-
way
sta
tions
and
pos
t offi
ces
wer
e ou
t of s
cope
.
Pro
port
ion
of o
rgan
izat
ions
usi
ng IC
T (w
ord
proc
essi
ng, s
prea
d sh
eets
, dat
abas
es, p
res-
enta
tions
, e-m
ail,
the
Inte
rnet
, typ
e of
Inte
rnet
co
nnec
tion,
type
s of
con
nect
ivity
).P
ropo
rtio
n of
org
aniz
atio
ns p
rovi
ding
ser
vice
s to
the
gene
ral p
ublic
usi
ng IC
T, th
e av
aila
bil-
ity o
f a w
ebsi
te a
nd if
so,
wha
t ser
vice
s ar
e pr
ovid
ed v
ia th
eir
resp
ectiv
e w
ebsi
tes.
Use
of e
-mai
l by
gove
rnm
ent e
mpl
oyee
s.In
vent
ory
of IC
T eq
uipm
ent p
er 1
00 e
mpl
oy-
ees.
Leve
l of s
oftw
are
appl
icat
ions
usa
ge a
nd
secu
rity
issu
es.
Per
sonn
el h
andl
ing
ICT-
rela
ted
wor
k an
d tr
aini
ng.
Bud
getin
g an
d IC
T-re
late
d ex
pend
iture
s.Fu
ture
ICT
plan
s.
Sur
vey
desi
gn: t
he s
ampl
e w
as s
trat
-ifi
ed in
to s
trat
a as
follo
ws:
min
istr
ies,
de
part
men
ts, s
tatu
tory
boa
rds
and
min
istr
ies
of th
e pr
ovin
cial
gov
ern-
men
ts, d
epar
tmen
ts o
f the
pro
vinc
ial
gove
rnm
ents
, dis
tric
t sec
reta
riats
, an
d di
visi
onal
sec
reta
riats
.C
olle
ctio
n m
etho
d: h
and
deliv
ered
fo
rms,
with
som
e e-
mai
led,
follo
w-u
p sh
ort i
nter
view
.
Sour
ce:
Aus
tral
ian
Bur
eau
of S
tatis
tics;
Cze
ch S
tatis
tical
Offi
ce;
Cen
ter
of S
tudi
es o
n In
form
atio
n an
d C
omm
unic
atio
n Te
chno
logi
es (
Bra
zil);
Dep
artm
ent
of F
inan
ce a
nd D
ereg
ulat
ion
(Aus
tral
ia);
Info
rmat
ion
& C
omm
unic
atio
n Te
chno
logy
Age
ncy
of S
ri La
nka;
Info
rmat
ion
Tech
nolo
gy A
utho
rity
Om
an; M
inis
tère
de
la fo
nctio
n pu
bliq
ue e
t de
la m
oder
nisa
tion
de l’
Adm
inis
trat
ion
(Mor
occo
); M
inis
try
of C
omm
unic
atio
n an
d In
form
atio
n Te
chno
logy
(E
gypt
); M
inis
try
of F
inan
ce (
Finl
and)
; N
atio
nal
Bur
eau
of S
tatis
tics
(Nig
eria
) an
d N
atio
nal
Info
rmat
ion
Tech
nolo
gy
Dev
elop
men
t Age
ncy
(Nig
eria
); N
atio
nal R
esea
rch
Uni
vers
ity –
Hig
her S
choo
l of E
cono
mic
s an
d th
e Fe
dera
l Ser
vice
for S
tate
Sta
tistic
s (R
osst
at) (
the
Rus
sian
Fed
erat
ion)
; Pre
side
ncy
of th
e C
ounc
il of
Min
iste
rs (L
eban
on);
Sta
te S
ervi
ces
Com
mis
sion
(New
Zea
land
); S
tatis
tics
Can
ada;
Sta
tistic
s D
enm
ark;
Sta
tistic
s N
ew Z
eala
nd; S
tatis
tics
Nor
way
.
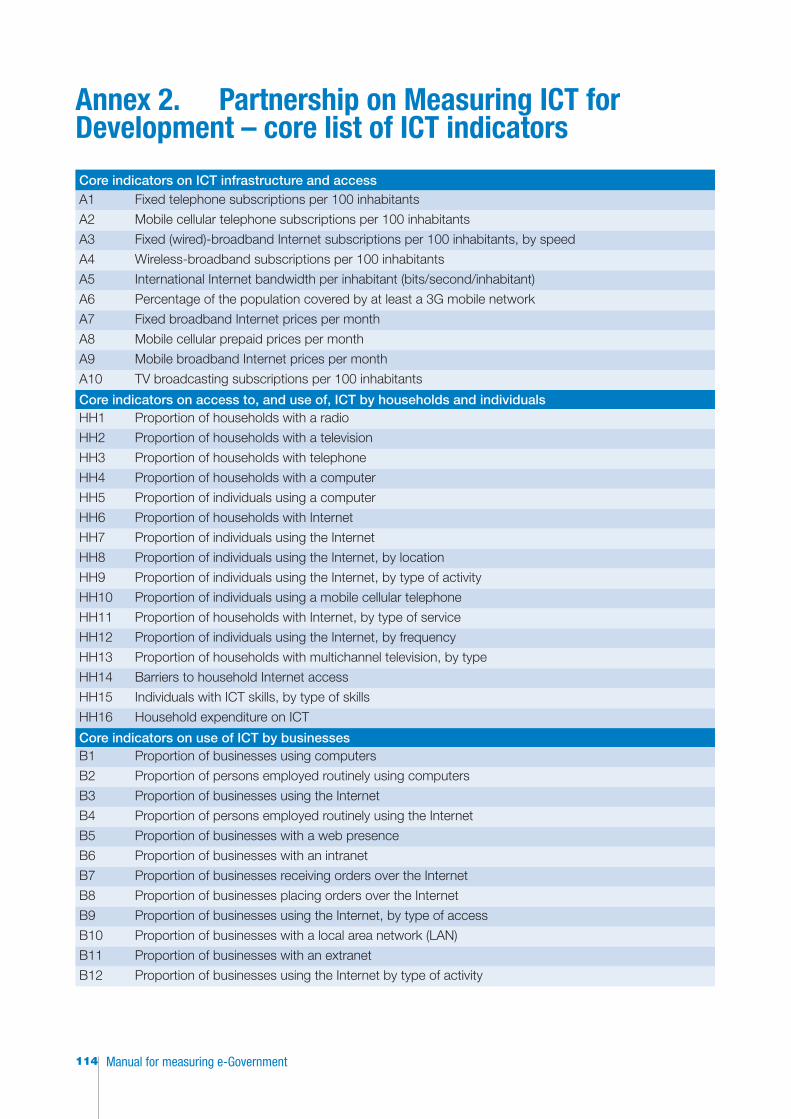
Manual for measuring e-Government114
Annex 2. Partnership on Measuring ICT for Development – core list of ICT indicators
Core indicators on ICT infrastructure and accessA1 Fixed telephone subscriptions per 100 inhabitants
A2 Mobile cellular telephone subscriptions per 100 inhabitants
A3 Fixed (wired)-broadband Internet subscriptions per 100 inhabitants, by speed
A4 Wireless-broadband subscriptions per 100 inhabitants
A5 International Internet bandwidth per inhabitant (bits/second/inhabitant)
A6 Percentage of the population covered by at least a 3G mobile network
A7 Fixed broadband Internet prices per month
A8 Mobile cellular prepaid prices per month
A9 Mobile broadband Internet prices per month
A10 TV broadcasting subscriptions per 100 inhabitants
Core indicators on access to, and use of, ICT by households and individualsHH1 Proportion of households with a radio
HH2 Proportion of households with a television
HH3 Proportion of households with telephone
HH4 Proportion of households with a computer
HH5 Proportion of individuals using a computer
HH6 Proportion of households with Internet
HH7 Proportion of individuals using the Internet
HH8 Proportion of individuals using the Internet, by location
HH9 Proportion of individuals using the Internet, by type of activity
HH10 Proportion of individuals using a mobile cellular telephone
HH11 Proportion of households with Internet, by type of service
HH12 Proportion of individuals using the Internet, by frequency
HH13 Proportion of households with multichannel television, by type
HH14 Barriers to household Internet access
HH15 Individuals with ICT skills, by type of skills
HH16 Household expenditure on ICT
Core indicators on use of ICT by businessesB1 Proportion of businesses using computers
B2 Proportion of persons employed routinely using computers
B3 Proportion of businesses using the Internet
B4 Proportion of persons employed routinely using the Internet
B5 Proportion of businesses with a web presence
B6 Proportion of businesses with an intranet
B7 Proportion of businesses receiving orders over the Internet
B8 Proportion of businesses placing orders over the Internet
B9 Proportion of businesses using the Internet, by type of access
B10 Proportion of businesses with a local area network (LAN)
B11 Proportion of businesses with an extranet
B12 Proportion of businesses using the Internet by type of activity
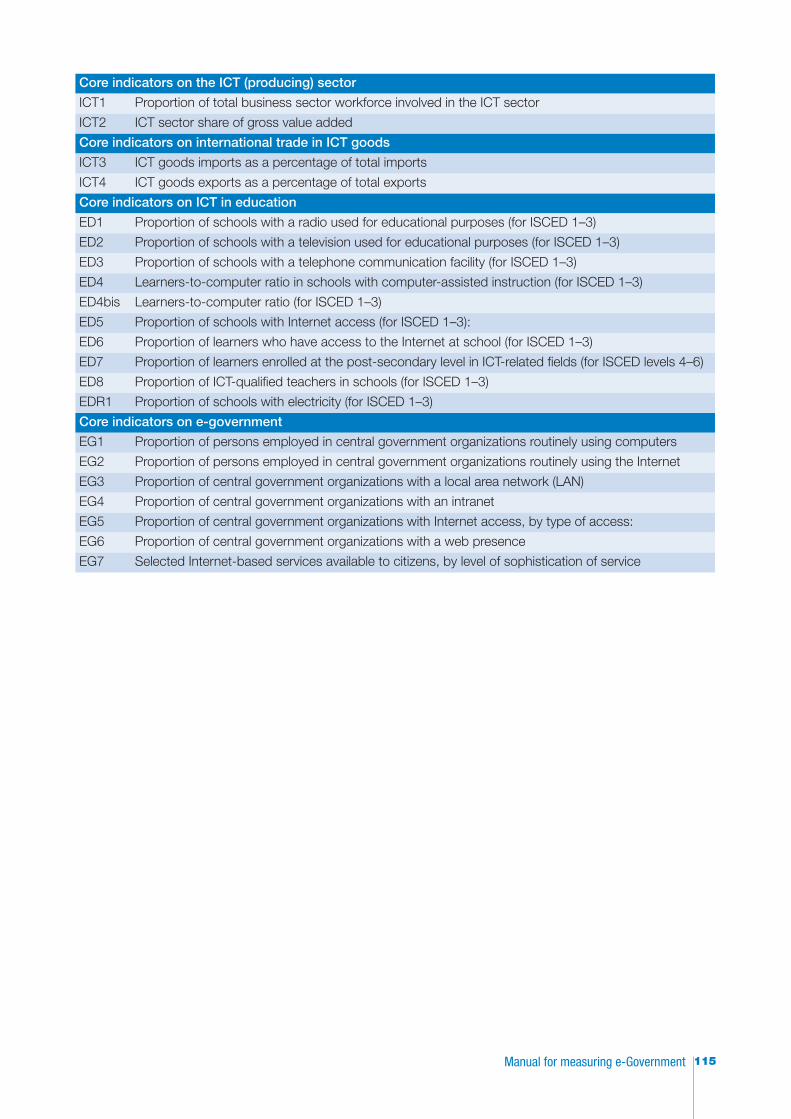
115Manual for measuring e-Government
Core indicators on the ICT (producing) sector
ICT1 Proportion of total business sector workforce involved in the ICT sector
ICT2 ICT sector share of gross value added
Core indicators on international trade in ICT goods
ICT3 ICT goods imports as a percentage of total imports
ICT4 ICT goods exports as a percentage of total exports
Core indicators on ICT in education
ED1 Proportion of schools with a radio used for educational purposes (for ISCED 1–3)
ED2 Proportion of schools with a television used for educational purposes (for ISCED 1–3)
ED3 Proportion of schools with a telephone communication facility (for ISCED 1–3)
ED4 Learners-to-computer ratio in schools with computer-assisted instruction (for ISCED 1–3)
ED4bis Learners-to-computer ratio (for ISCED 1–3)
ED5 Proportion of schools with Internet access (for ISCED 1–3):
ED6 Proportion of learners who have access to the Internet at school (for ISCED 1–3)
ED7 Proportion of learners enrolled at the post-secondary level in ICT-related fields (for ISCED levels 4–6)
ED8 Proportion of ICT-qualified teachers in schools (for ISCED 1–3)
EDR1 Proportion of schools with electricity (for ISCED 1–3)
Core indicators on e-government
EG1 Proportion of persons employed in central government organizations routinely using computers
EG2 Proportion of persons employed in central government organizations routinely using the Internet
EG3 Proportion of central government organizations with a local area network (LAN)
EG4 Proportion of central government organizations with an intranet
EG5 Proportion of central government organizations with Internet access, by type of access:
EG6 Proportion of central government organizations with a web presence
EG7 Selected Internet-based services available to citizens, by level of sophistication of service
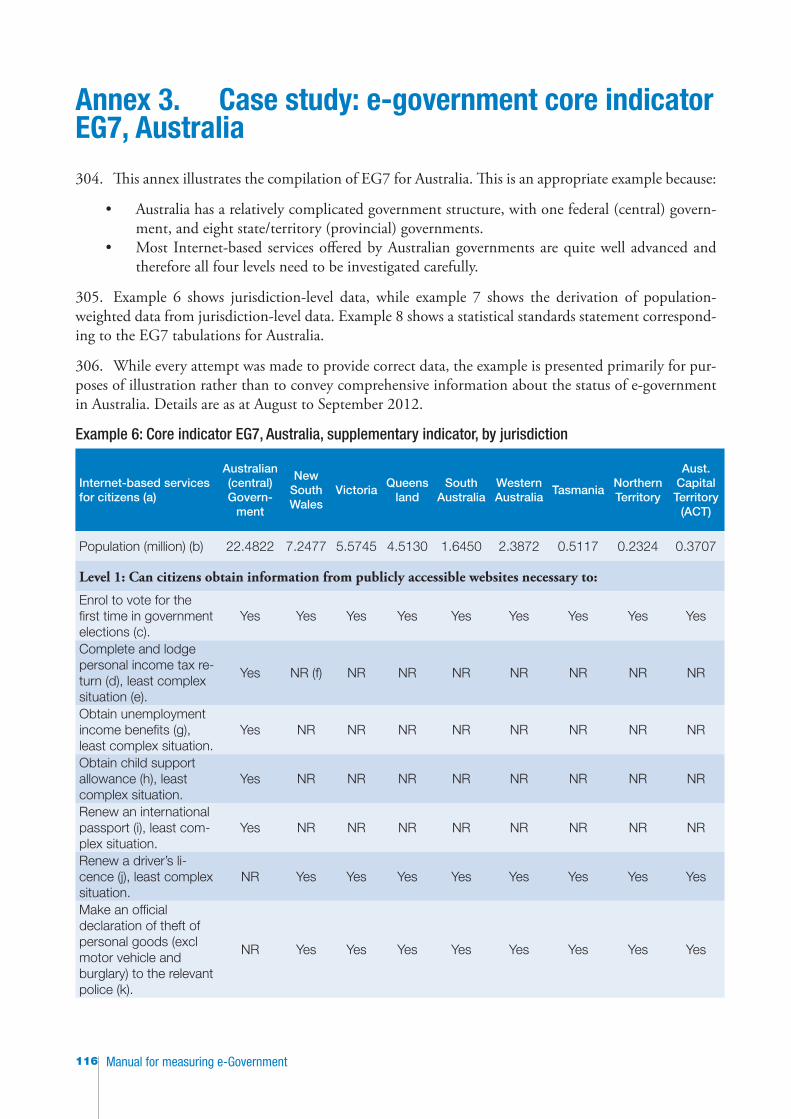
Manual for measuring e-Government116
Annex 3. Case study: e-government core indicator EG7, Australia
304. This annex illustrates the compilation of EG7 for Australia. This is an appropriate example because:
• Australia has a relatively complicated government structure, with one federal (central) govern-ment, and eight state/territory (provincial) governments.
• Most Internet-based services offered by Australian governments are quite well advanced and therefore all four levels need to be investigated carefully.
305. Example 6 shows jurisdiction-level data, while example 7 shows the derivation of population-weighted data from jurisdiction-level data. Example 8 shows a statistical standards statement correspond-ing to the EG7 tabulations for Australia.
306. While every attempt was made to provide correct data, the example is presented primarily for pur-poses of illustration rather than to convey comprehensive information about the status of e-government in Australia. Details are as at August to September 2012.
Example 6: Core indicator EG7, Australia, supplementary indicator, by jurisdiction
Internet-based services for citizens (a)
Australian (central) Govern-
ment
New South Wales
VictoriaQueens
landSouth
AustraliaWestern Australia
TasmaniaNorthern Territory
Aust. Capital Territory
(ACT)
Population (million) (b) 22.4822 7.2477 5.5745 4.5130 1.6450 2.3872 0.5117 0.2324 0.3707
Level 1: Can citizens obtain information from publicly accessible websites necessary to:
Enrol to vote for the first time in government elections (c).
Yes Yes Yes Yes Yes Yes Yes Yes Yes
Complete and lodge personal income tax re-turn (d), least complex situation (e).
Yes NR (f) NR NR NR NR NR NR NR
Obtain unemployment income benefits (g), least complex situation.
Yes NR NR NR NR NR NR NR NR
Obtain child support allowance (h), least complex situation.
Yes NR NR NR NR NR NR NR NR
Renew an international passport (i), least com-plex situation.
Yes NR NR NR NR NR NR NR NR
Renew a driver’s li-cence (j), least complex situation.
NR Yes Yes Yes Yes Yes Yes Yes Yes
Make an official declaration of theft of personal goods (excl motor vehicle and burglary) to the relevant police (k).
NR Yes Yes Yes Yes Yes Yes Yes Yes
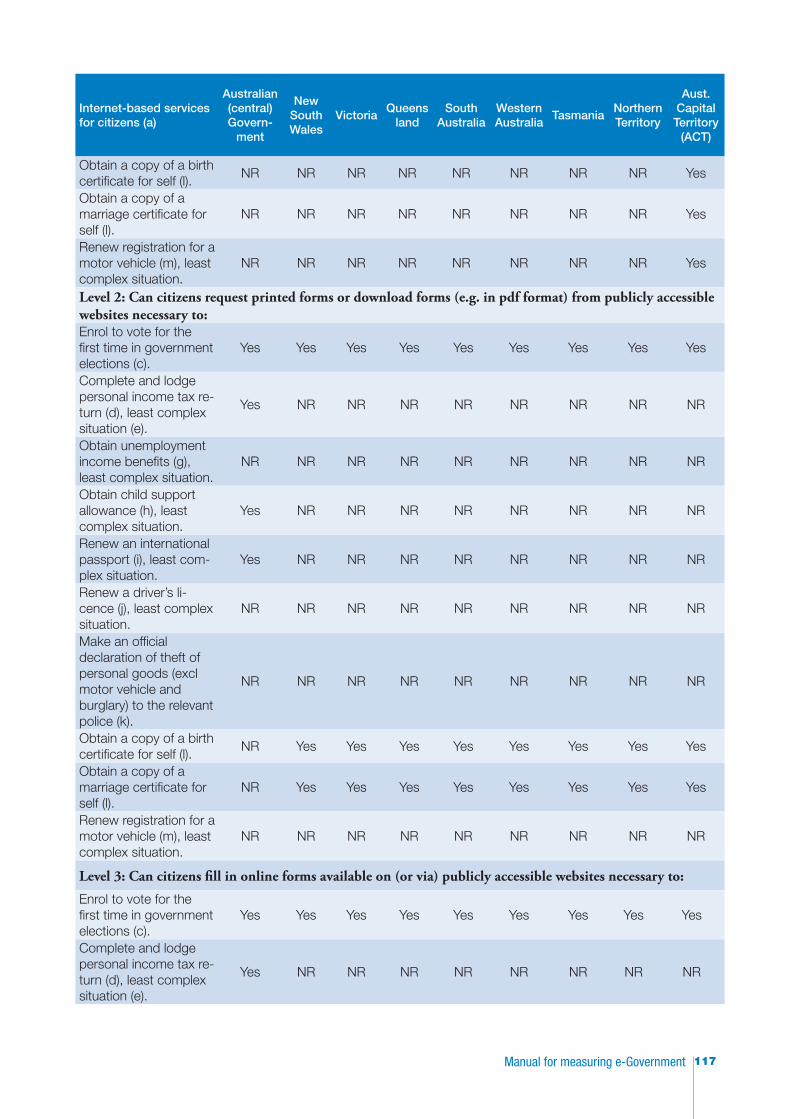
117Manual for measuring e-Government
Internet-based services for citizens (a)
Australian (central) Govern-
ment
New South Wales
VictoriaQueens
landSouth
AustraliaWestern Australia
TasmaniaNorthern Territory
Aust. Capital Territory
(ACT)
Obtain a copy of a birth certificate for self (l).
NR NR NR NR NR NR NR NR Yes
Obtain a copy of a marriage certificate for self (l).
NR NR NR NR NR NR NR NR Yes
Renew registration for a motor vehicle (m), least complex situation.
NR NR NR NR NR NR NR NR Yes
Level 2: Can citizens request printed forms or download forms (e.g. in pdf format) from publicly accessible websites necessary to:Enrol to vote for the first time in government elections (c).
Yes Yes Yes Yes Yes Yes Yes Yes Yes
Complete and lodge personal income tax re-turn (d), least complex situation (e).
Yes NR NR NR NR NR NR NR NR
Obtain unemployment income benefits (g), least complex situation.
NR NR NR NR NR NR NR NR NR
Obtain child support allowance (h), least complex situation.
Yes NR NR NR NR NR NR NR NR
Renew an international passport (i), least com-plex situation.
Yes NR NR NR NR NR NR NR NR
Renew a driver’s li-cence (j), least complex situation.
NR NR NR NR NR NR NR NR NR
Make an official declaration of theft of personal goods (excl motor vehicle and burglary) to the relevant police (k).
NR NR NR NR NR NR NR NR NR
Obtain a copy of a birth certificate for self (l).
NR Yes Yes Yes Yes Yes Yes Yes Yes
Obtain a copy of a marriage certificate for self (l).
NR Yes Yes Yes Yes Yes Yes Yes Yes
Renew registration for a motor vehicle (m), least complex situation.
NR NR NR NR NR NR NR NR NR
Level 3: Can citizens fill in online forms available on (or via) publicly accessible websites necessary to:
Enrol to vote for the first time in government elections (c).
Yes Yes Yes Yes Yes Yes Yes Yes Yes
Complete and lodge personal income tax re-turn (d), least complex situation (e).
Yes NR NR NR NR NR NR NR NR
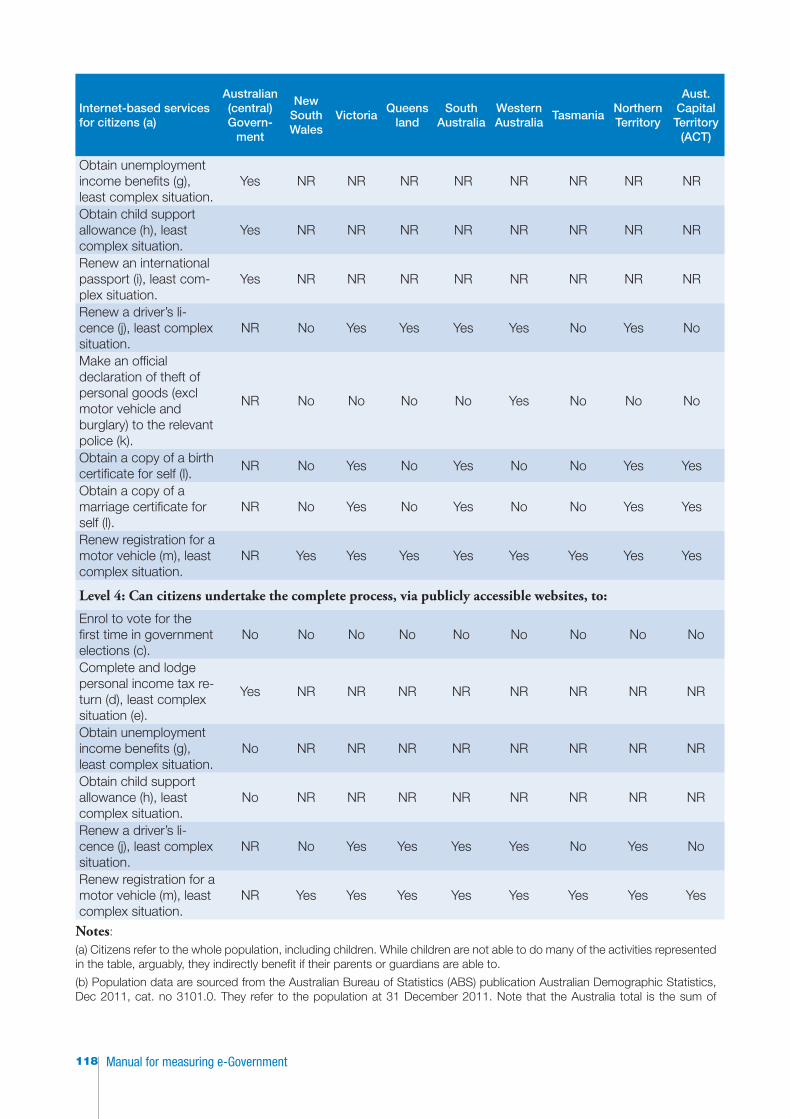
Manual for measuring e-Government118
Internet-based services for citizens (a)
Australian (central) Govern-
ment
New South Wales
VictoriaQueens
landSouth
AustraliaWestern Australia
TasmaniaNorthern Territory
Aust. Capital Territory
(ACT)
Obtain unemployment income benefits (g), least complex situation.
Yes NR NR NR NR NR NR NR NR
Obtain child support allowance (h), least complex situation.
Yes NR NR NR NR NR NR NR NR
Renew an international passport (i), least com-plex situation.
Yes NR NR NR NR NR NR NR NR
Renew a driver’s li-cence (j), least complex situation.
NR No Yes Yes Yes Yes No Yes No
Make an official declaration of theft of personal goods (excl motor vehicle and burglary) to the relevant police (k).
NR No No No No Yes No No No
Obtain a copy of a birth certificate for self (l).
NR No Yes No Yes No No Yes Yes
Obtain a copy of a marriage certificate for self (l).
NR No Yes No Yes No No Yes Yes
Renew registration for a motor vehicle (m), least complex situation.
NR Yes Yes Yes Yes Yes Yes Yes Yes
Level 4: Can citizens undertake the complete process, via publicly accessible websites, to:
Enrol to vote for the first time in government elections (c).
No No No No No No No No No
Complete and lodge personal income tax re-turn (d), least complex situation (e).
Yes NR NR NR NR NR NR NR NR
Obtain unemployment income benefits (g), least complex situation.
No NR NR NR NR NR NR NR NR
Obtain child support allowance (h), least complex situation.
No NR NR NR NR NR NR NR NR
Renew a driver’s li-cence (j), least complex situation.
NR No Yes Yes Yes Yes No Yes No
Renew registration for a motor vehicle (m), least complex situation.
NR Yes Yes Yes Yes Yes Yes Yes Yes
Notes:
(a) Citizens refer to the whole population, including children. While children are not able to do many of the activities represented in the table, arguably, they indirectly benefit if their parents or guardians are able to.
(b) Population data are sourced from the Australian Bureau of Statistics (ABS) publication Australian Demographic Statistics, Dec 2011, cat. no 3101.0. They refer to the population at 31 December 2011. Note that the Australia total is the sum of

119Manual for measuring e-Government
populations of the states and territories and therefore understates the Australian population by about 3,000 people (the population from Other Territories comprising Jervis Bay Territory, Christmas Island and the Cocos (Keeling) Islands).
(c) The Australian Electoral Commission (AEC) administers voter registration for all Australians for federal (Australian Government), state/territory and local government elections. A single registration covers voting for all levels of government in Australia. Even though voters can complete an online form, it needs to be printed, signed and returned to the AEC.
(d) Income tax for individuals is levied by the Australian Government (not states or territories) and administered by the Australian Taxation Office (ATO). The ATO website has information on taxation obligations and downloadable forms. The e-tax application can be downloaded from the ATO website, completed on an individual’s own computer and uploaded to the ATO via an Internet connection. E-tax enables calculation of income tax information and lodgement of the form.
(e) Least complex situation refers to the simplest standard procedure in the country. For some services, the procedure referred to is a common one, though not necessarily simple.
(f) NR is Not relevant and means that the service (whether undertaken online or offline) is not relevant for a particular level of government. The distinction between Not relevant and No may be difficult to make and reasons for choosing one over the other are explained in notes on particular services.
(g) Payment of social security income benefits is an Australian government function, administered by the Department of Human Services (Centrelink). Unemployment benefits are called Newstart Allowance. While a form is not necessary to claim the allowance, an Intent to Claim must be completed and is followed up by a personal interview. The responses in this table refer to the Intent to Claim application which is available online or can be communicated by phone, e-mail or in person. The fact that an Intent to Claim application form is not downloadable from the website is deemed to be not relevant as an alternative hardcopy version does not exist.
(h) Payment of a range of child support benefits is an Australian government function, administered by the Department of Human Services (Centrelink). The most common situation is reported in this table. It is Family Tax Benefit Part A, which is income-tested and paid for each eligible child or student up to the age of 22.
(i) Passport applications are an Australian government function. The situation chosen was a standard passport renewal for an adult (where the passport had not been lost or stolen).
(j) This is a state/territory function. All Australian states and territories have a licensing authority, which sends out licence renewal notices (or applications) before the expiry date. For New South Wales, Tasmania and the ACT, drivers licences must be renewed in person. For Victoria, Queensland, South Australia, Western Australia and the Northern Territory, in many situations, licences may be renewed and paid for online. The fact that a renewal notice is not downloadable from a website is deemed to be not relevant for all jurisdictions as an alternative hardcopy version does not exist (except as posted). The jurisdictions for which Yes has been reported for Level 3 are those allowing payment online. The online form is generally a very simple one associated with the payment (e.g. verifying a reference number).
(k) Each Australian jurisdiction (including the federal government) has its own police force. Theft and burglary are the responsibility of states and territories (though note that the Australian Federal Police provides policing services for the ACT). Most jurisdictions only allow reports of a crime to be made by phone or in person at a police station (this excludes Crime Stoppers reports, where the public can anonymously report information about crimes online). Queensland has a small number of online forms for reporting some crimes but they do not cover theft. Western Australia has an online reporting facility for thefts of value less than $3,000. The fact that a declaration form is not downloadable from a website is deemed to be not relevant for all jurisdictions as an alternative hardcopy version does not exist.
(l) This is a state/territory function, and all Australian states and territories have a registry of births, deaths and marriages. The situation chosen was an application for a standard certificate.
(m) This is a state/territory function, and all Australian states and territories have a motor vehicle registry, which sends out registration renewal notices. The least complex situation depends on the state/territory but involves renewal of a vehicle already registered in the state/territory and, in some cases, a relatively new vehicle not requiring an inspection (e.g. in New South Wales, vehicles more than five years old need to undergo a vehicle inspection as part of the registration process; however, the result of the check is available electronically and is incorporated into the renewal application process). The fact that a renewal notice is not downloadable from a website is deemed to be not relevant for all jurisdictions as an alternative hardcopy version does not exist (except as posted).
307. The derivation of population-weighted data from jurisdiction-level data is shown in example 7. For the central government jurisdiction, Yes-No-Not relevant data from example 6 are applied to the Austral-ian population. For the state/territory government level, Yes-No-Not relevant data are aggregated using state/territory populations to weight the data.
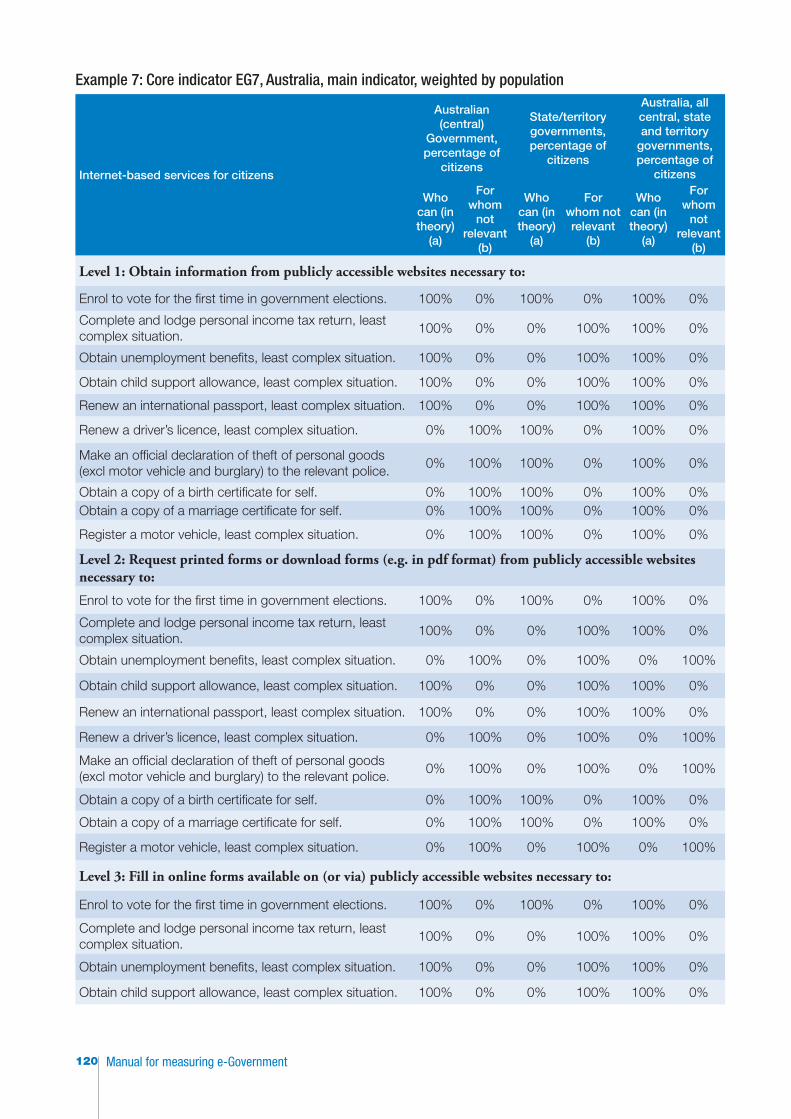
Manual for measuring e-Government120
Example 7: Core indicator EG7, Australia, main indicator, weighted by population
Internet-based services for citizens
Australian (central)
Government, percentage of
citizens
State/territory governments, percentage of
citizens
Australia, all central, state and territory
governments, percentage of
citizens
Who can (in theory)
(a)
For whom
not relevant
(b)
Who can (in theory)
(a)
For whom not relevant
(b)
Who can (in theory)
(a)
For whom
not relevant
(b)
Level 1: Obtain information from publicly accessible websites necessary to:
Enrol to vote for the first time in government elections. 100% 0% 100% 0% 100% 0%
Complete and lodge personal income tax return, least complex situation.
100% 0% 0% 100% 100% 0%
Obtain unemployment benefits, least complex situation. 100% 0% 0% 100% 100% 0%
Obtain child support allowance, least complex situation. 100% 0% 0% 100% 100% 0%
Renew an international passport, least complex situation. 100% 0% 0% 100% 100% 0%
Renew a driver’s licence, least complex situation. 0% 100% 100% 0% 100% 0%
Make an official declaration of theft of personal goods (excl motor vehicle and burglary) to the relevant police.
0% 100% 100% 0% 100% 0%
Obtain a copy of a birth certificate for self. 0% 100% 100% 0% 100% 0%Obtain a copy of a marriage certificate for self. 0% 100% 100% 0% 100% 0%
Register a motor vehicle, least complex situation. 0% 100% 100% 0% 100% 0%
Level 2: Request printed forms or download forms (e.g. in pdf format) from publicly accessible websites necessary to:
Enrol to vote for the first time in government elections. 100% 0% 100% 0% 100% 0%
Complete and lodge personal income tax return, least complex situation.
100% 0% 0% 100% 100% 0%
Obtain unemployment benefits, least complex situation. 0% 100% 0% 100% 0% 100%
Obtain child support allowance, least complex situation. 100% 0% 0% 100% 100% 0%
Renew an international passport, least complex situation. 100% 0% 0% 100% 100% 0%
Renew a driver’s licence, least complex situation. 0% 100% 0% 100% 0% 100%
Make an official declaration of theft of personal goods (excl motor vehicle and burglary) to the relevant police.
0% 100% 0% 100% 0% 100%
Obtain a copy of a birth certificate for self. 0% 100% 100% 0% 100% 0%
Obtain a copy of a marriage certificate for self. 0% 100% 100% 0% 100% 0%
Register a motor vehicle, least complex situation. 0% 100% 0% 100% 0% 100%
Level 3: Fill in online forms available on (or via) publicly accessible websites necessary to:
Enrol to vote for the first time in government elections. 100% 0% 100% 0% 100% 0%
Complete and lodge personal income tax return, least complex situation.
100% 0% 0% 100% 100% 0%
Obtain unemployment benefits, least complex situation. 100% 0% 0% 100% 100% 0%
Obtain child support allowance, least complex situation. 100% 0% 0% 100% 100% 0%
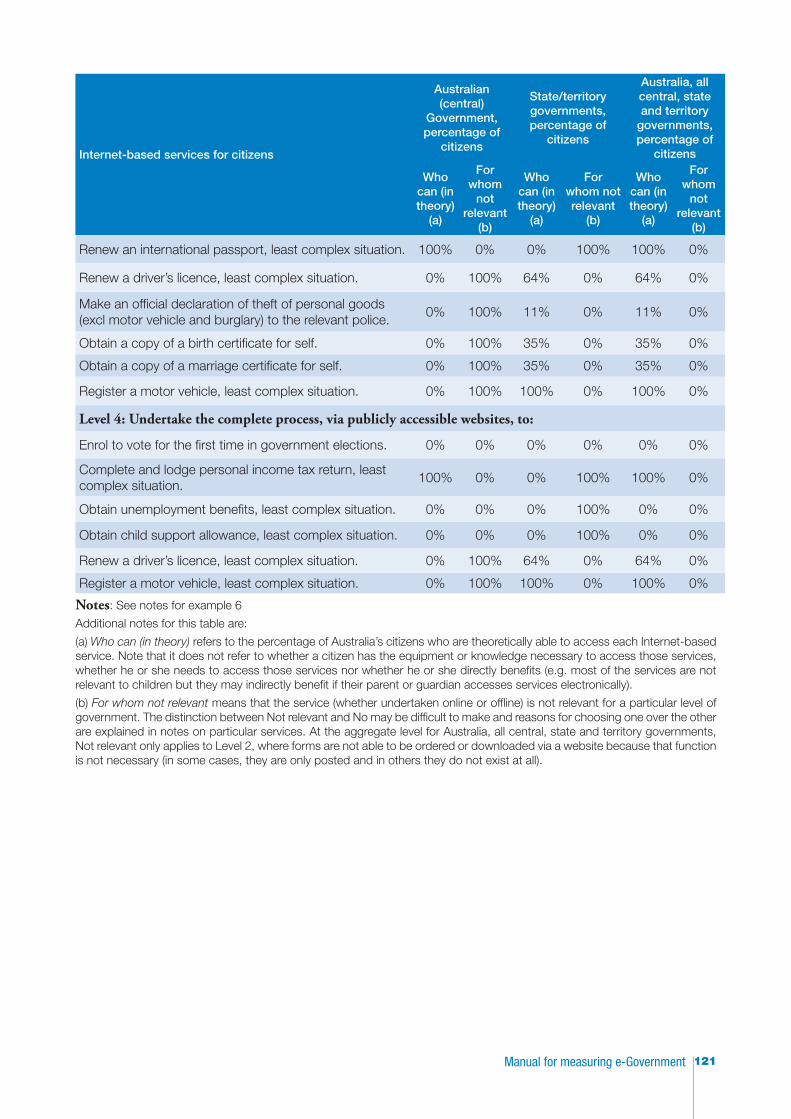
121Manual for measuring e-Government
Internet-based services for citizens
Australian (central)
Government, percentage of
citizens
State/territory governments, percentage of
citizens
Australia, all central, state and territory
governments, percentage of
citizens
Who can (in theory)
(a)
For whom
not relevant
(b)
Who can (in theory)
(a)
For whom not relevant
(b)
Who can (in theory)
(a)
For whom
not relevant
(b)
Renew an international passport, least complex situation. 100% 0% 0% 100% 100% 0%
Renew a driver’s licence, least complex situation. 0% 100% 64% 0% 64% 0%
Make an official declaration of theft of personal goods (excl motor vehicle and burglary) to the relevant police.
0% 100% 11% 0% 11% 0%
Obtain a copy of a birth certificate for self. 0% 100% 35% 0% 35% 0%
Obtain a copy of a marriage certificate for self. 0% 100% 35% 0% 35% 0%
Register a motor vehicle, least complex situation. 0% 100% 100% 0% 100% 0%
Level 4: Undertake the complete process, via publicly accessible websites, to:
Enrol to vote for the first time in government elections. 0% 0% 0% 0% 0% 0%
Complete and lodge personal income tax return, least complex situation.
100% 0% 0% 100% 100% 0%
Obtain unemployment benefits, least complex situation. 0% 0% 0% 100% 0% 0%
Obtain child support allowance, least complex situation. 0% 0% 0% 100% 0% 0%
Renew a driver’s licence, least complex situation. 0% 100% 64% 0% 64% 0%
Register a motor vehicle, least complex situation. 0% 100% 100% 0% 100% 0%
Notes: See notes for example 6
Additional notes for this table are:
(a) Who can (in theory) refers to the percentage of Australia’s citizens who are theoretically able to access each Internet-based service. Note that it does not refer to whether a citizen has the equipment or knowledge necessary to access those services, whether he or she needs to access those services nor whether he or she directly benefits (e.g. most of the services are not relevant to children but they may indirectly benefit if their parent or guardian accesses services electronically).
(b) For whom not relevant means that the service (whether undertaken online or offline) is not relevant for a particular level of government. The distinction between Not relevant and No may be difficult to make and reasons for choosing one over the other are explained in notes on particular services. At the aggregate level for Australia, all central, state and territory governments, Not relevant only applies to Level 2, where forms are not able to be ordered or downloaded via a website because that function is not necessary (in some cases, they are only posted and in others they do not exist at all).
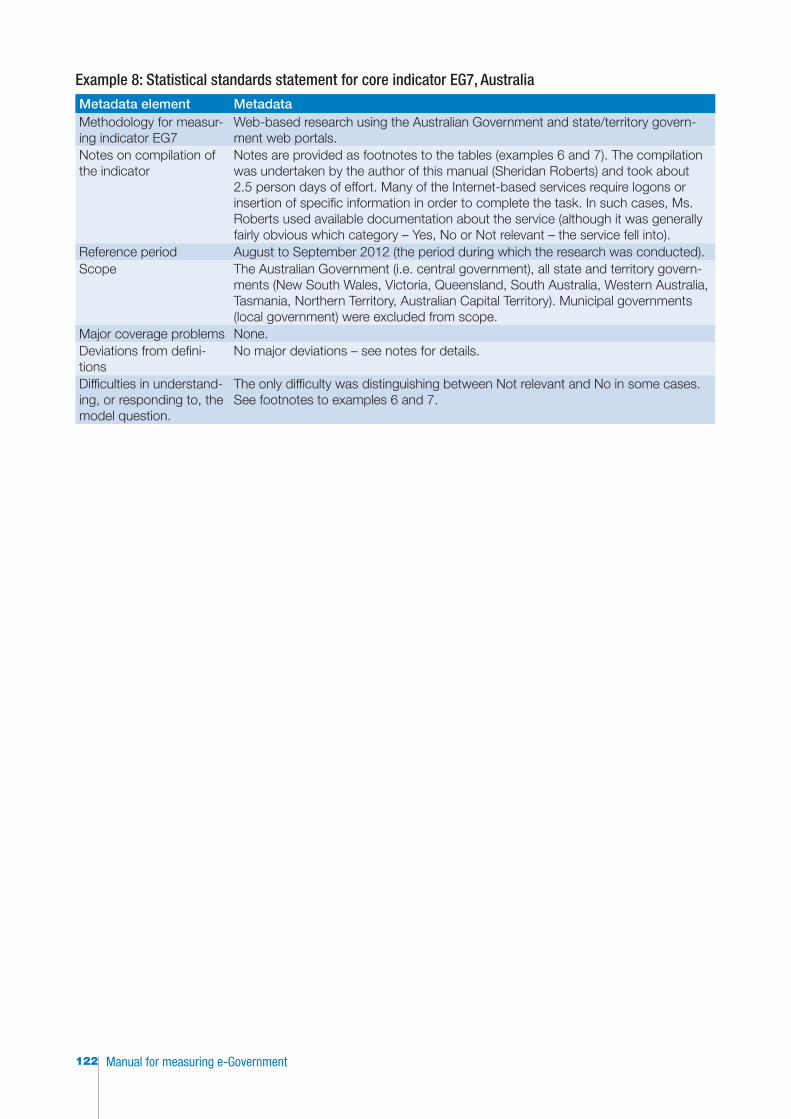
Manual for measuring e-Government122
Example 8: Statistical standards statement for core indicator EG7, Australia
Metadata element MetadataMethodology for measur-ing indicator EG7
Web-based research using the Australian Government and state/territory govern-ment web portals.
Notes on compilation of the indicator
Notes are provided as footnotes to the tables (examples 6 and 7). The compilation was undertaken by the author of this manual (Sheridan Roberts) and took about 2.5 person days of effort. Many of the Internet-based services require logons or insertion of specific information in order to complete the task. In such cases, Ms. Roberts used available documentation about the service (although it was generally fairly obvious which category – Yes, No or Not relevant – the service fell into).
Reference period August to September 2012 (the period during which the research was conducted).Scope The Australian Government (i.e. central government), all state and territory govern-
ments (New South Wales, Victoria, Queensland, South Australia, Western Australia, Tasmania, Northern Territory, Australian Capital Territory). Municipal governments (local government) were excluded from scope.
Major coverage problems None.Deviations from defini-tions
No major deviations – see notes for details.
Difficulties in understand-ing, or responding to, the model question.
The only difficulty was distinguishing between Not relevant and No in some cases. See footnotes to examples 6 and 7.
123Manual for measuring e-Government
References
Australian Bureau of Statistics (2009). ABS Data Quality Framework, May 2009, cat. no. 1520.0. Avail-able from http://www.abs.gov.au/ausstats/[email protected]/lookup/1520.0Main+Features1May+2009 [Accessed 9 February 2014]
__________(2010). ABS Forms Design Standards Manual, 2010, cat. no. 1530.0. Available from http://www.abs.gov.au/ausstats/[email protected]/Products/17722DAF1055205CCA2576B300126718. [Accessed 9 February 2014]
__________(2012a). Handbook, National Statistical Service website. Available from http://www.nss.gov.au/nss/home.NSF/pages/Handbook%20-%20Wheel%20Diagram. [Accessed 9 February 2014]
__________(2012b). Basic Survey Design, National Statistical Service website. Available from http://www.nss.gov.au/nss/home.nsf/SurveyDesignDoc?OpenView&RestrictToCategory=Basic+Survey+Design. [Accessed 9 February 2014]
Capgemini (2006). Online Availability of Public Services: How Is Europe Progressing? Web Based Survey on Electronic Public Services, Report of the 6th Measurement June 2006. Report prepared for the Euro-pean Commission.
__________(2010). Digitizing Public Services in Europe: Putting Ambition into Action, 9th Benchmark Measurement. Report prepared for the European Commission. Available from https://ec.europa.eu/digital-agenda/sites/digital-agenda/files/egov_report.pdf. [Accessed 9 February 2014]
Department of Finance and Deregulation (2009). List of Australian Government Bodies and Governance Relationships. Available from http://www.finance.gov.au/financial-framework/governance/docs/AA-Intro-FinalPrintVersion-161209.pdf. [Accessed 9 February 2014]
__________(2011). A Guide to the Australian Government: Structure, organizations and key people. Avail-able from http://www.directory.gov.au/directory. [Accessed 9 February 2014]
__________(2012). ICT Benchmarking. Available from http://www.finance.gov.au/budget/ict-invest-ment-framework/ict-benchmarking.html. [Accessed 9 February 2014]
European Commission (2014). Digital Agenda for Europe website. Available from http://ec.europa.eu/information_society/activities/egovernment/index_en.htm. [Accessed 9 February 2014]
European Commission and others (2009). System of National Accounts 2008. Available from http://unstats.un.org/unsd/nationalaccount/docs/SNA2008.pdf. [Accessed 9 February 2014]
Eurostat (2009). ESS Standard for Quality Reports. Available from http://epp.eurostat.ec.europa.eu/portal/page/portal/ver-1/quality/documents/ESQR_FINAL.pdf. [Accessed 9 February 2014]
__________(2011). Methodological Manual for statistics on the Information Society. Available from http://epp.eurostat.ec.europa.eu/portal/page/portal/information_society/methodology. [Accessed 9 Feb-ruary 2014]
International Monetary Fund (2001). Government Finance Statistics Manual 2001. Available from http://www.imf.org/external/pubs/ft/gfs/manual/index.htm. [Accessed 9 February 2014]
__________(2011). Government Finance Statistics: Compilation Guide for Developing Countries. Available from http://www.imf.org/external/pubs/ft/gfs/manual/compil.pdf. [Accessed 9 February 2014]
Manual for measuring e-Government124
International Telecommunication Union (2005). WSIS Outcome Documents: Geneva 2003 – Tunis 2005. Available from http://www.itu.int/wsis/outcome/booklet.pdf. [Accessed 9 February 2014]
__________(2009). Manual for Measuring ICT Access and Use by Households and Individuals. Available from http://www.itu.int/en/ITU-D/Statistics/Pages/publications/manual2009.aspx. [Accessed 9 February 2014].
__________(2010). World Telecommunication/ICT Development Report 2010: Monitoring the WSIS Targets, a Mid-term Review. Available from http://www.itu.int/dms_pub/itu-d/opb/ind/D-IND-WTDR-2010-PDF-E.pdf. [Accessed 9 February 2014]
__________(2014). Manual for Measuring ICT Access and Use by Households and Individuals. Available from http://www.itu.int/en/ITU-D/Statistics/Pages/publications/manual2014.aspx. [Accessed 9 February 2014]
National Bureau of Statistics, and National Information Technology Development Agency (2012). Draft Final Report Scan-ICT Nigeria 2011: Phase I Sectors Survey (Volume 2).
National Research University – Higher School of Economics (2012). Information Society Outlook. Avail-able from http://www.hse.ru/en/primarydata/niio2012. [Accessed 9 February 2014]
Observatory for the Information Society in Latin America and the Caribbean (2010). Regional Proposal for Core Indicators on e-Government: Methodological Guidelines. Document prepared by OSILAC, in cooperation with the Working Group on Information and Communications Technologies of the Statistical Conference of the Americas of the Economic Commission for Latin America and the Caribbean. Available from http://www.eclac.cl/socinfo/noticias/noticias/1/40221/Regional_pro-posal_for_core_indicators_on_e-government_-methodological_guidelines.pdf. [Accessed 9 Febru-ary 2014]
Office of Management and Budget (2006). Standards and Guidelines for Statistical Surveys, September 2006. Available from http://www.whitehouse.gov/sites/default/files/omb/inforeg/statpolicy/stand-ards_stat_surveys.pdf. [Accessed 9 February 2014]
Organisation for Economic Co-operation and Development (2002). Frascati Manual: Proposed Standard Practice for Surveys on Research and Experimental Development. Available from http://www.oecd-bookshop.org/oecd/display.asp?K=5LMQCR2K61JJ&DS=Frascati-Manual-2002. [Accessed 9 February 2014]
__________(2009). Guide to Measuring the Information Society, 2009. Available from www.oecd.org/sti/measuring-infoeconomy/guide. [Accessed 9 February 2014]
__________(2011a). Guide to Measuring the Information Society, 2011. Available from www.oecd.org/sti/measuring-infoeconomy/guide. [Accessed 9 February 2014]
__________(2011b). Government at a Glance, 2011. Available from http://www.oecd-ilibrary.org/gov-ernance/government-at-a-glance-2011_gov_glance-2011-en. [Accessed 9 February 2014]
__________(2012). Glossary of Statistical Terms. Available from http://stats.oecd.org/glossary/. [Accessed 9 February 2014]
Partnership on Measuring ICT for Development (2005). Core ICT Indicators. Available from http://new.unctad.org/upload/docs/Core%20ICT%20Indicators_Eng.pdf. [Accessed 9 February 2014]
__________(2010). Core ICT Indicators. Available from http://new.unctad.org/upload/docs/ICT_CORE-2010.pdf. [Accessed 9 February 2014]
125Manual for measuring e-Government
__________(2011). Measuring the WSIS Targets: A Statistical Framework. Available from http://www.itu.int/ITU-D/ict/partnership/wsistargets/index.html. [Accessed 9 February 2014]
__________(2012). Report of the Partnership on Measuring Information and Communication Technol-ogy for Development. Report to the United Nations Statistical Commission forty-third session, 2012, E/CN.3/2012/12. Available from http://unstats.un.org/unsd/statcom/doc12/2012-12-ICT-E.pdf. [Accessed 9 February 2014]
Partnership on Measuring ICT for Development and the United Nations Economic Commission for Africa (2012). Framework for a set of e-government core indicators. Available from http://www.uneca.org/publications/framework-set-e-government-core-indicators. [Accessed 9 February 2014]
Statistics Canada (2002). Statistics Canada’s Quality Assurance Framework. Available from http://www5.statcan.gc.ca/bsolc/olc-cel/olc-cel?catno=12-586-X&CHROPG=1&lang=eng. [Accessed 9 Febru-ary 2014]
__________(2010). Survey Methods and Practices. Available from http://www5.statcan.gc.ca/bsolc/olc-cel/olc-cel?lang=eng&catno=12-587-X. [Accessed 9 February 2014]
United Nations Conference on Trade and Development (2009). Manual for the Production of Statistics on the Information Economy, Revised Edition. Available from http://new.unctad.org/templates/Page____885.aspx. [Accessed 9 February 2014]
United Nations Department of Economic and Social Affairs (2002). International Standard Industrial Classification of all Economic Activities Rev. 3.1. Available from http://unstats.un.org/unsd/cr/registry/regcst.asp?Cl=17. [Accessed 9 February 2014]
__________(2003). United Nations Global E-Government Survey 2003: E-government at the Cross-roads. Available from. http://www.unpan.org/egovkb/global_reports/08report.htm [Accessed 27 June 2014]
__________(2004). Global E-Government Readiness Report 2004: Towards Access for Opportunity. Available from http://www.unpan.org/egovkb/global_reports/08report.htm. [Accessed 27 June 2014]
__________(2005). United Nations Global E-Government Readiness Report 2005: From E-Govern-ment to E-Inclusion. Available from http://www.unpan.org/egovkb/global_reports/08report.htm. [Accessed 27 June 2014]
__________(2008a). International Standard Industrial Classification of All Economic Activities (ISIC), Rev. 4. Available from http://unstats.un.org/unsd/cr/registry/isic-4.asp. [Accessed 9 February 2014]
__________(2008b). United Nations E-Government Survey 2008: From E-Government to Con-nected Governance. Available from http://www.unpan.org/egovkb/global_reports/08report.htm. [Accessed 27 June 2014]
__________(2010). United Nations E-Government Survey 2010: Leveraging e-Government at a Time of Financial and Economic Crisis. Available from http://www.unpan.org/egovkb/global_reports/08report.htm. [Accessed 27 June 2014]
__________(2012). United Nations E-Government Survey 2012: E-Government for the People. Available from http://unpan1.un.org/intradoc/groups/public/documents/un/unpan048065.pdf. [Accessed 27 June 2014]
Manual for measuring e-Government126
__________(2014). United Nations E-Government Survey 2014: E-Government for the Future We Want. Available from http://www.unpan.org/egovkb/global_reports/08report.htm. [Accessed 27 June 2014]
United Nations Economic Commission for Africa (2005). The Scan-ICT Phase 2 Methodology: A Tool Kit for the Development of Information Society ICT4D Status and Impact Monitoring, Assess-ment and Measurement Indicators. Available from http://repository.uneca.org/handle/10855/4539. [Accessed 9 February 2014]
UNESCO Institute for Statistics (2009). Guide to Measuring Information and Communication Tech-nologies (ICT) in Education. Technical Paper No. 2. Available from http://www.uis.unesco.org/Library/Documents/ICT_Guide_EN_v19_reprintwc.pdf. [Accessed 9 February 2014]
United Nations Statistical Commission (2007). Report on the thirty-eighth session (27 February to 2 March 2007). E/2007/24 and E/CN.3/2007/30. Available from http://unstats.un.org/unsd/stat-com/doc07/FinalReport-Unedited.pdf. [Accessed 9 February 2014]
__________(2012). Report on the forty-third session (28 February-2 March 2012). E/2012/24 and E/CN.3/2012/34. Available from http://unstats.un.org/unsd/statcom/doc12/2012-Report-E.pdf. [Accessed 9 February 2014]
United States Census Bureau (2008). Issues in the Design and Testing of Business Survey Question-naires: What We Know Now that We Didn’t Know Then – and What We Still Don’t Know. Paper presented to the International Association of Official Statistics Conference on Reshaping Official Statistics, Shanghai, China, 14 to 16 October 2008.
__________(2012). Federal, State, & Local Governments homepage. Available from http://www.census.gov/govs/. [Accessed 9 February 2014]
World Bank (2011). Definition of e-Government. Available from http://go.worldbank.org/M1JHE0Z280. [Accessed 27 June 2014]