managing use of alternative wastewater irrigation i
TRANSCRIPT
5/18/2020
1
Managing Use of Alternative Water for IrrigationThis is part of a two‐course series on use of wastewater for irrigation. The course will focus on using municipal reclaimed water and greywater in landscape and industrial applications. These are:
Landscape Wastewater Irrigation I: Permitting of Alternative Water for Irrigation (8 hours)
Landscape Wastewater Irrigation II: Managing Use of Alternative Water for Irrigation (8 hours)
Wastewater Irrigation IAgendaI. Introduction and Overview of Wastewater Reuse in Texas
II. Overview of Rules/Regulations
III. Permit Application Requirements
IV. Regulations on Use of Wastewater for Irrigation
V. Water Balance Calculations
Wastewater Irrigation I (Review)Water Balance Calculations◦ Evapotranspiration◦ Effective rainfall◦ Leaching requirement◦ Water / Irrigation requirement◦ Conversion from “inches” to “gallons”
3
Wastewater Irrigation II AgendaConsumptive Use Estimates
On‐site storage of water
Special irrigation system design and management requirements◦ Landscape Irrigation◦ Agricultural Irrigation
Managing Water Quality◦ Filtration & Chemigation◦ Salinity Management◦ Nutrient Loading
Irrigation Management
4
1 2
3 4
5/18/2020
2
Wastewater Irrigation I (Review)30TAC Chapter 210 – Reclaimed Water and Graywater
30TAC Chapter 285 – On‐Site Sewage Facilities (OSSF – “septic tank systems and other sewage on‐site systems)◦ 285 (h) Disposal of Graywater
30TAC Chapter 344 – Landscape Irrigation
5
Reclaimed Water – Use in IrrigationProviders are required to provide reclaimed water to users “on‐demand” which eliminates the need for on‐site storage or the application of water when it is not needed.
The user of reclaimed water must reasonably control application rates onto irrigation areas in order to ensure:◦ the efficient use of reclaimed water and ◦ avoid excessive application of reclaimed water that results in surface runoff or excessive percolation below the root zone.
Providers and users must determine and document typical irrigation demands for the proposed use based on type of vegetation and land area to be irrigated (i.e., a water balance set of calculations)
The provider must conduct periodic audits of reclaimed water use. Water use records are required and submitted to the TCEQ periodically.
Reclaimed Water – Use in IrrigationProvider and Users designing or operating an irrigation system using reclaimed water must ensure that reclaimed water overflow, crop stress, and undesirable soil contamination by salt does not occur.
Irrigation application rates and times must be developed so as to minimize "wet grass" conditions in unrestricted landscaped areas during the periods the area could be in use.
Spray irrigation systems must be designed to prevent water from reaching any privately‐owned premises outside the designated irrigation area or public drinking fountains.
There shall be no application of effluent when the ground is water saturated or frozen.
Consumptive Use Estimates
8
5 6
7 8
5/18/2020
3
Section 2: On‐Site Storage of Reclaimed Water
Typical Water Sources versus Treated Wastewater
Traditional water resources are used as both sources and storage facilities◦ Groundwater◦ Lakes◦ Rivers
Treated wastewater is continuously generated. What cannot be used must be stored or disposed of in some manner.
10
Storage ConsiderationsMay be a significant part of the design
Has a substantial impact on capital cost
Impacts operation and maintenance expenses◦ Especially if water is degraded due to storage and requires re‐treatment before use (algae growth)
Design capacity must be sized for peak use and to prevent discharge
11
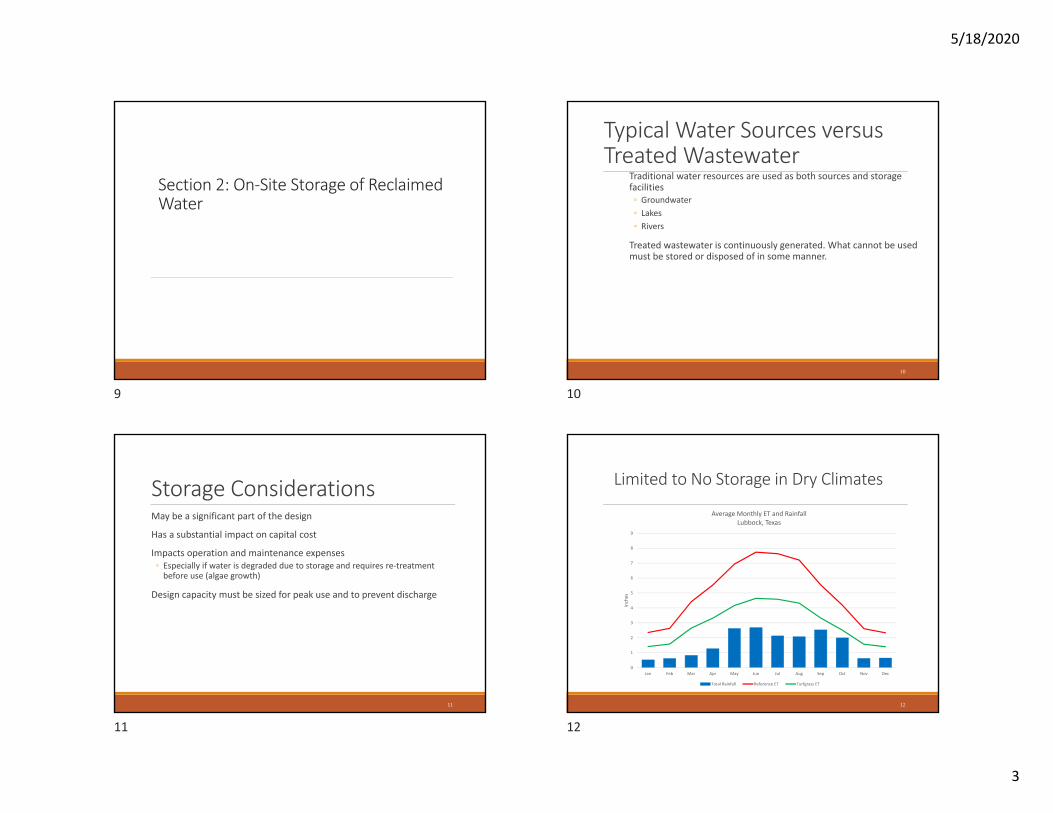
Limited to No Storage in Dry Climates
12
0
1
2
3
4
5
6
7
8
9
Jan Feb Mar Apr May Jun Jul Aug Sep Oct Nov Dec
Inches
Average Monthly ET and RainfallLubbock, Texas
Total Rainfall Reference ET Turfgrass ET
9 10
11 12
5/18/2020
4
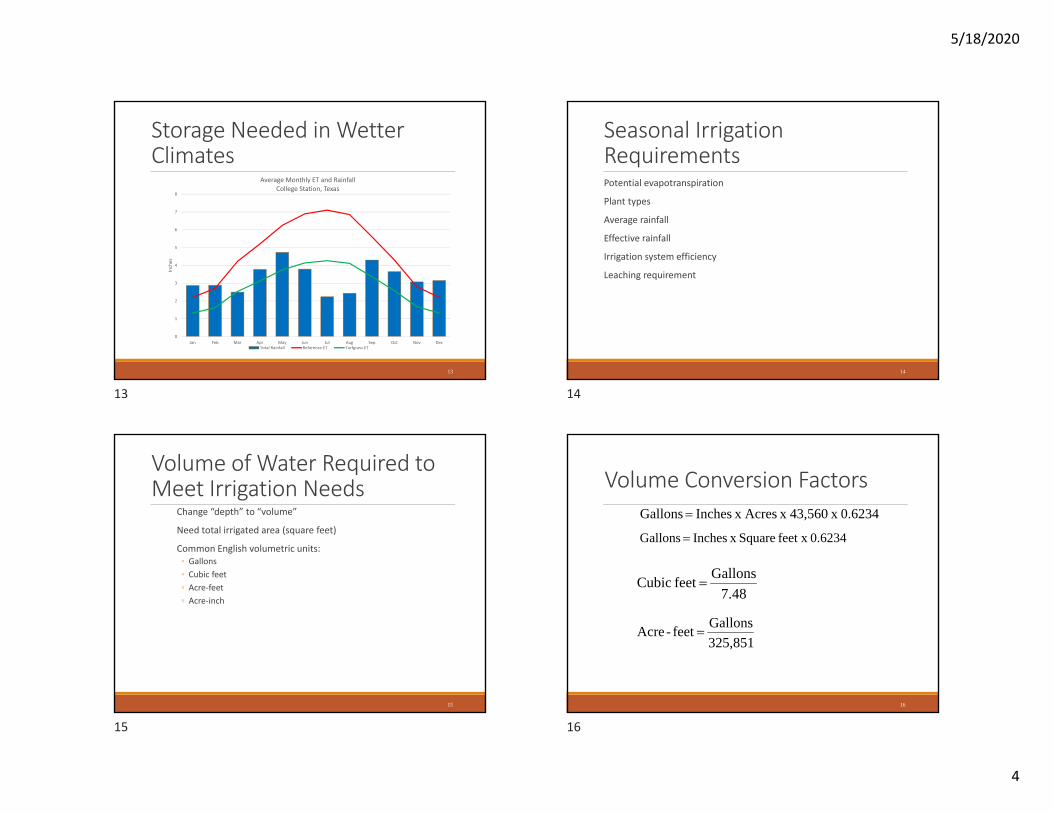
Storage Needed in Wetter Climates
13
0
1
2
3
4
5
6
7
8
Jan Feb Mar Apr May Jun Jul Aug Sep Oct Nov Dec
Inches
Average Monthly ET and RainfallCollege Station, Texas
Total Rainfall Reference ET Turfgrass ET
Seasonal Irrigation RequirementsPotential evapotranspiration
Plant types
Average rainfall
Effective rainfall
Irrigation system efficiency
Leaching requirement
14
Volume of Water Required to Meet Irrigation Needs
Change “depth” to “volume”
Need total irrigated area (square feet)
Common English volumetric units:◦ Gallons◦ Cubic feet◦ Acre‐feet◦ Acre‐inch
15
Volume Conversion Factors
16
0.6234 x 43,560 x Acres x Inches Gallons
0.6234feet x Square x Inches Gallons
7.48Gallons feet Cubic
325,851Gallons feet -Acre
13 14
15 16
5/18/2020
5
1000 Gallons = (Inches x Acres x 43,560 x 0.6234) / 1000
17
0
200
400
600
800
1,000
1,200
Jan Feb Mar Apr May Jun Jul Aug Sep Oct Nov Dec
Irrigation Re
quire
men
t (1000
gallons)
Supplemental Irrigation Requirement (1000 gallons)
Lubbock College Station
Acre‐feet = (Gallons ) 325,851)
18
0.0
0.5
1.0
1.5
2.0
2.5
3.0
3.5
4.0
Jan Feb Mar Apr May Jun Jul Aug Sep Oct Nov Dec
Irrig
ation Re
quire
men
t (acre‐fe
et)
Supplemental Irrigation Requirement (acre‐feet)
Lubbock College Station
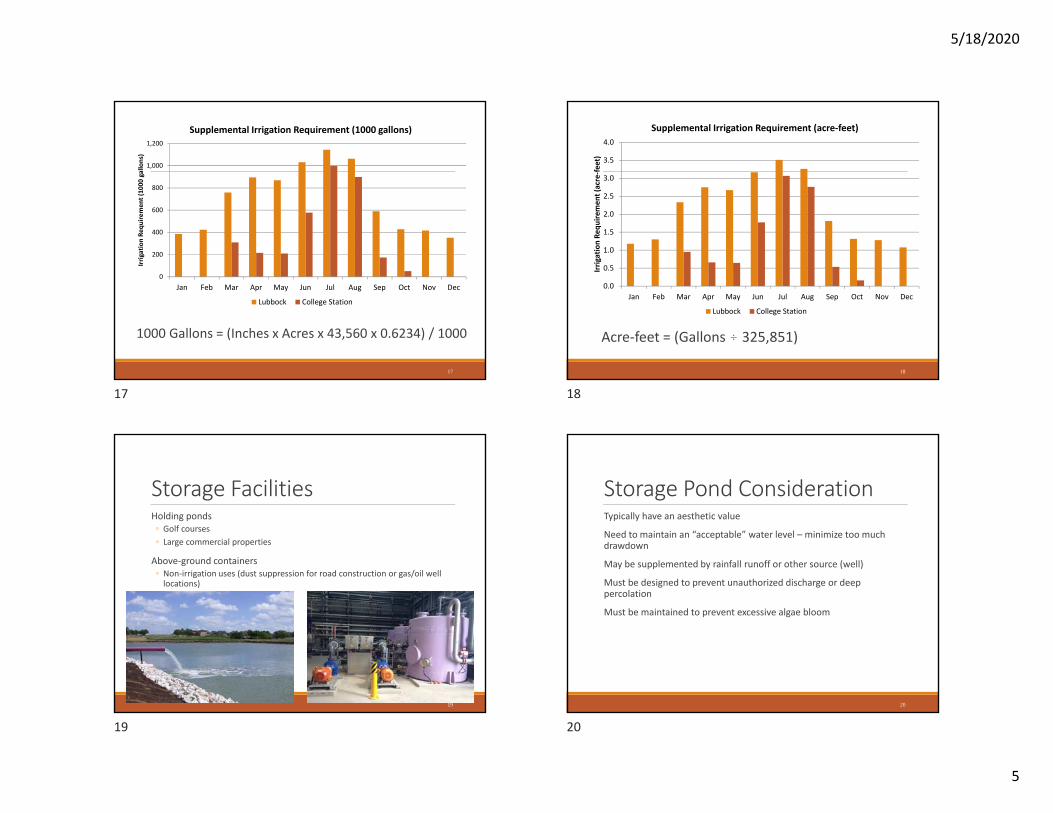
Storage FacilitiesHolding ponds◦ Golf courses◦ Large commercial properties
Above‐ground containers◦ Non‐irrigation uses (dust suppression for road construction or gas/oil well locations)
19
Storage Pond ConsiderationTypically have an aesthetic value
Need to maintain an “acceptable” water level – minimize too much drawdown
May be supplemented by rainfall runoff or other source (well)
Must be designed to prevent unauthorized discharge or deep percolation
Must be maintained to prevent excessive algae bloom
20
17 18
19 20
5/18/2020
6
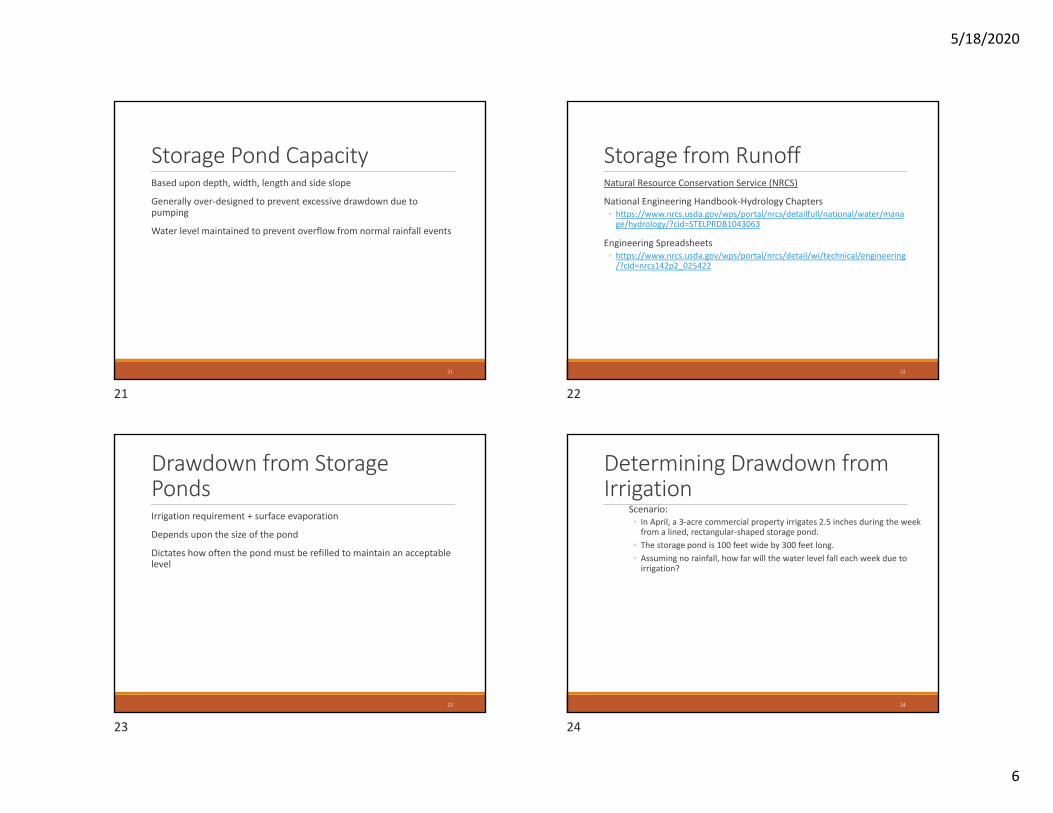
Storage Pond CapacityBased upon depth, width, length and side slope
Generally over‐designed to prevent excessive drawdown due to pumping
Water level maintained to prevent overflow from normal rainfall events
21
Storage from RunoffNatural Resource Conservation Service (NRCS)
National Engineering Handbook‐Hydrology Chapters◦ https://www.nrcs.usda.gov/wps/portal/nrcs/detailfull/national/water/manage/hydrology/?cid=STELPRDB1043063
Engineering Spreadsheets◦ https://www.nrcs.usda.gov/wps/portal/nrcs/detail/wi/technical/engineering/?cid=nrcs142p2_025422
22
Drawdown from Storage PondsIrrigation requirement + surface evaporation
Depends upon the size of the pond
Dictates how often the pond must be refilled to maintain an acceptable level
23
Determining Drawdown from Irrigation
Scenario: ◦ In April, a 3‐acre commercial property irrigates 2.5 inches during the week from a lined, rectangular‐shaped storage pond.
◦ The storage pond is 100 feet wide by 300 feet long. ◦ Assuming no rainfall, how far will the water level fall each week due to irrigation?
24
21 22
23 24
5/18/2020
7
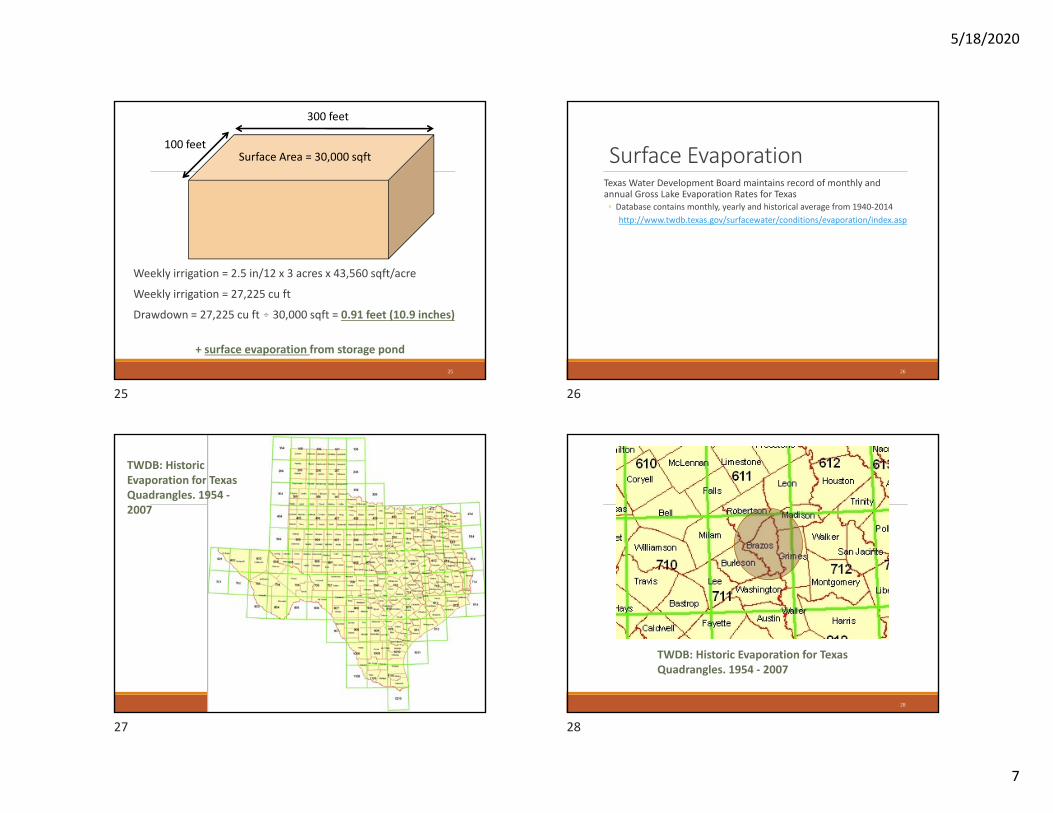
Weekly irrigation = 2.5 in/12 x 3 acres x 43,560 sqft/acre
Weekly irrigation = 27,225 cu ft
Drawdown = 27,225 cu ft ) 30,000 sqft = 0.91 feet (10.9 inches)
25
100 feet
300 feet
Surface Area = 30,000 sqft
+ surface evaporation from storage pond
Surface EvaporationTexas Water Development Board maintains record of monthly and annual Gross Lake Evaporation Rates for Texas◦ Database contains monthly, yearly and historical average from 1940‐2014
http://www.twdb.texas.gov/surfacewater/conditions/evaporation/index.asp
26
27
TWDB: Historic Evaporation for Texas Quadrangles. 1954 ‐2007
28
TWDB: Historic Evaporation for Texas Quadrangles. 1954 ‐ 2007
25 26
27 28
5/18/2020
8
29 30
0.00
1.00
2.00
3.00
4.00
5.00
6.00
7.00
8.00
9.00
10.00
Jan Feb Mar Apr May Jun Jul Aug Sep Oct Nov Dec
Lake Evapo
ratio
n (in
ches)
Average Monthly Lake Evaporation (inches)
College Station Lubbock
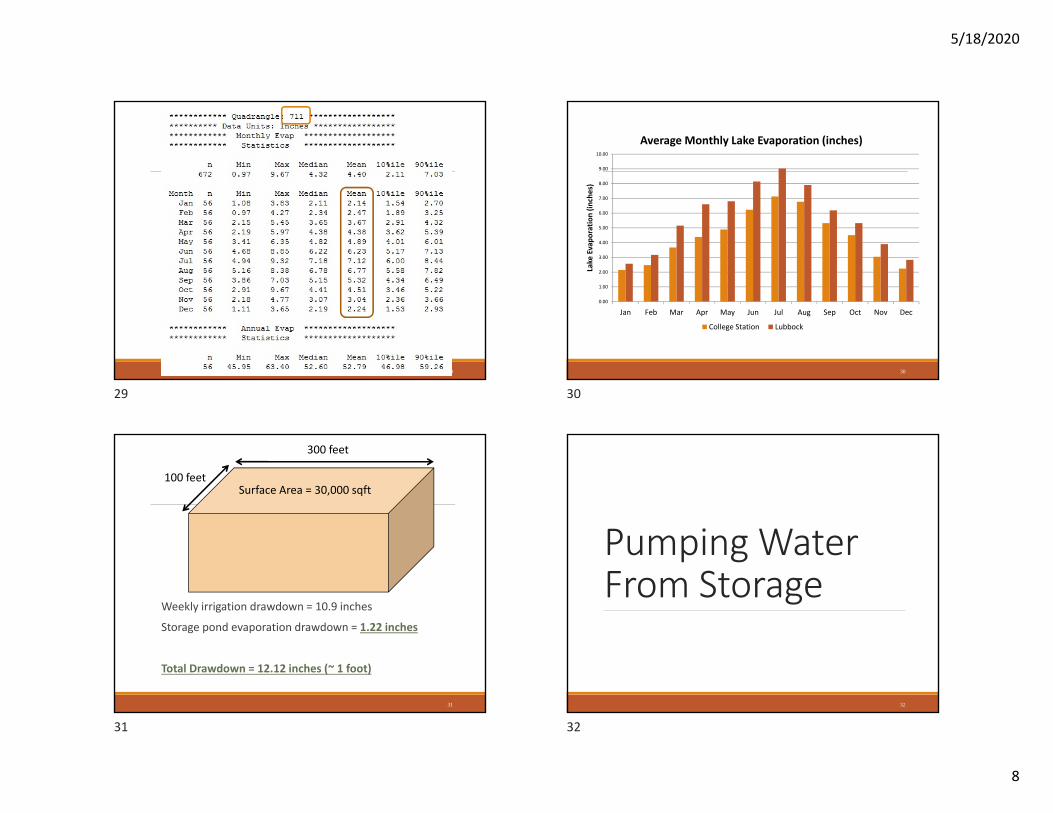
Weekly irrigation drawdown = 10.9 inches
Storage pond evaporation drawdown = 1.22 inches
Total Drawdown = 12.12 inches (~ 1 foot)
31
100 feet
300 feet
Surface Area = 30,000 sqft
Pumping Water From Storage
32
29 30
31 32
5/18/2020
9
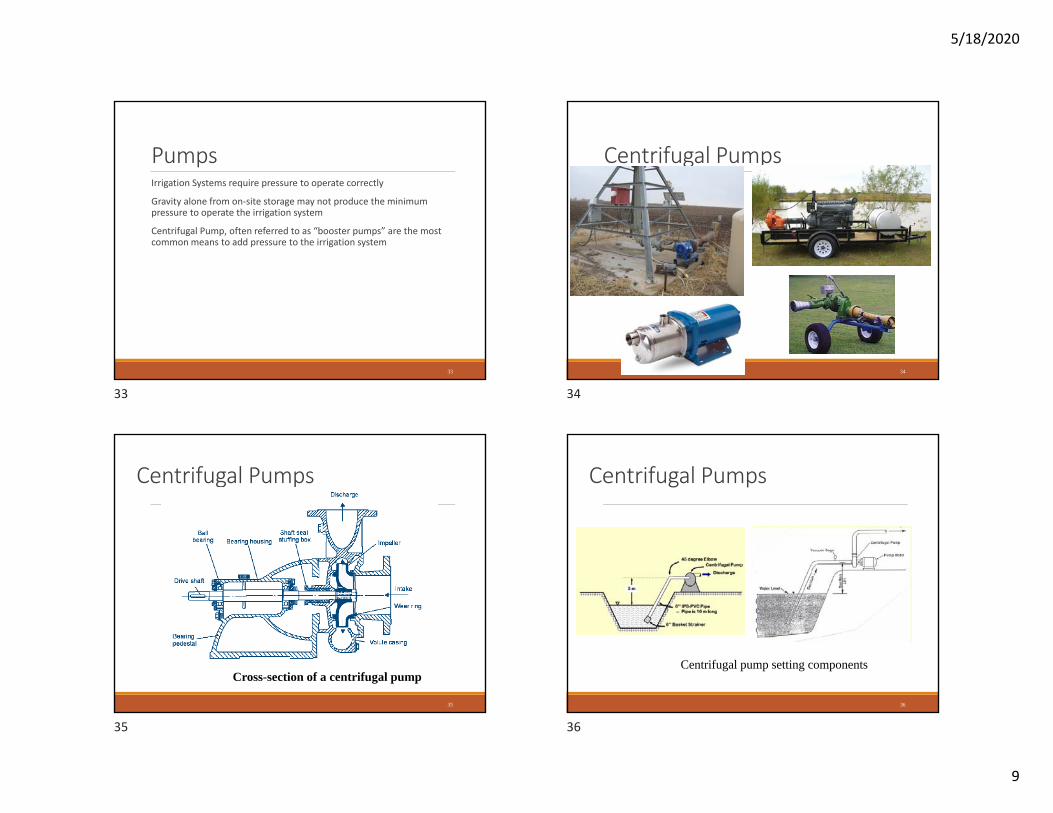
PumpsIrrigation Systems require pressure to operate correctly
Gravity alone from on‐site storage may not produce the minimum pressure to operate the irrigation system
Centrifugal Pump, often referred to as “booster pumps” are the most common means to add pressure to the irrigation system
33
Centrifugal Pumps
34
Centrifugal Pumps
35
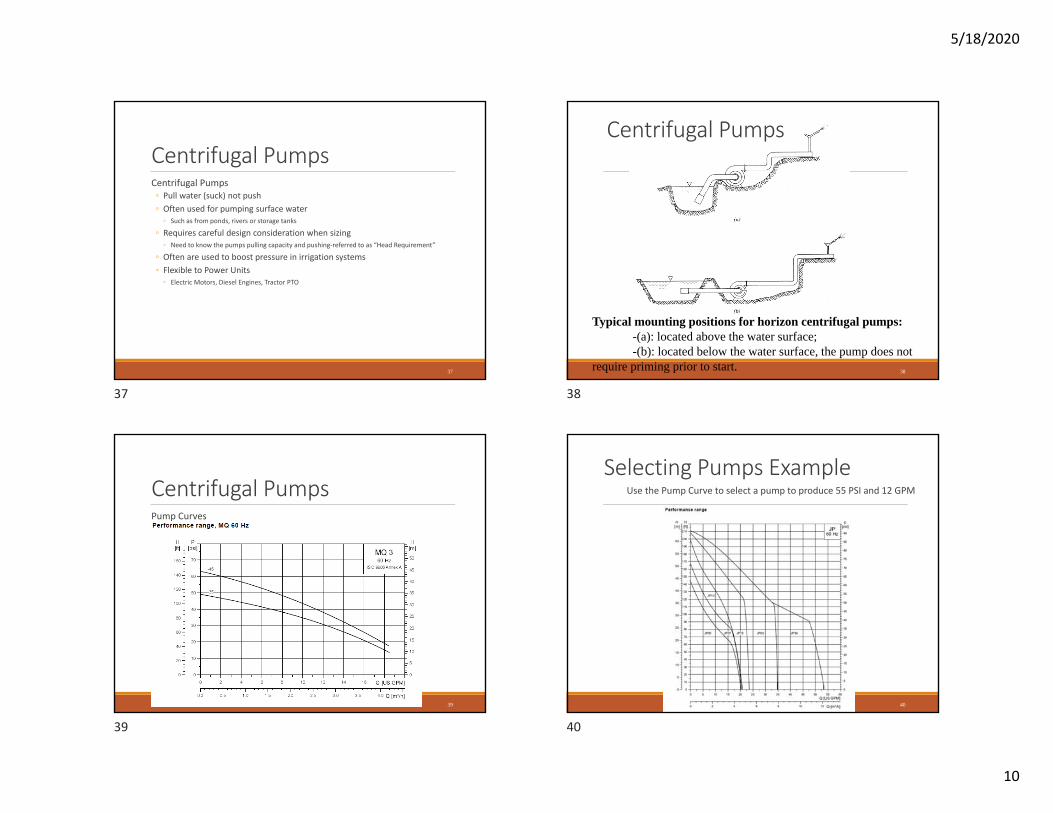
Cross-section of a centrifugal pump
Centrifugal Pumps
36
Centrifugal pump setting components
33 34
35 36
5/18/2020
10
Centrifugal PumpsCentrifugal Pumps◦ Pull water (suck) not push◦ Often used for pumping surface water
◦ Such as from ponds, rivers or storage tanks
◦ Requires careful design consideration when sizing◦ Need to know the pumps pulling capacity and pushing‐referred to as “Head Requirement”
◦ Often are used to boost pressure in irrigation systems◦ Flexible to Power Units
◦ Electric Motors, Diesel Engines, Tractor PTO
37
Centrifugal Pumps
38
Typical mounting positions for horizon centrifugal pumps:-(a): located above the water surface;-(b): located below the water surface, the pump does not
require priming prior to start.
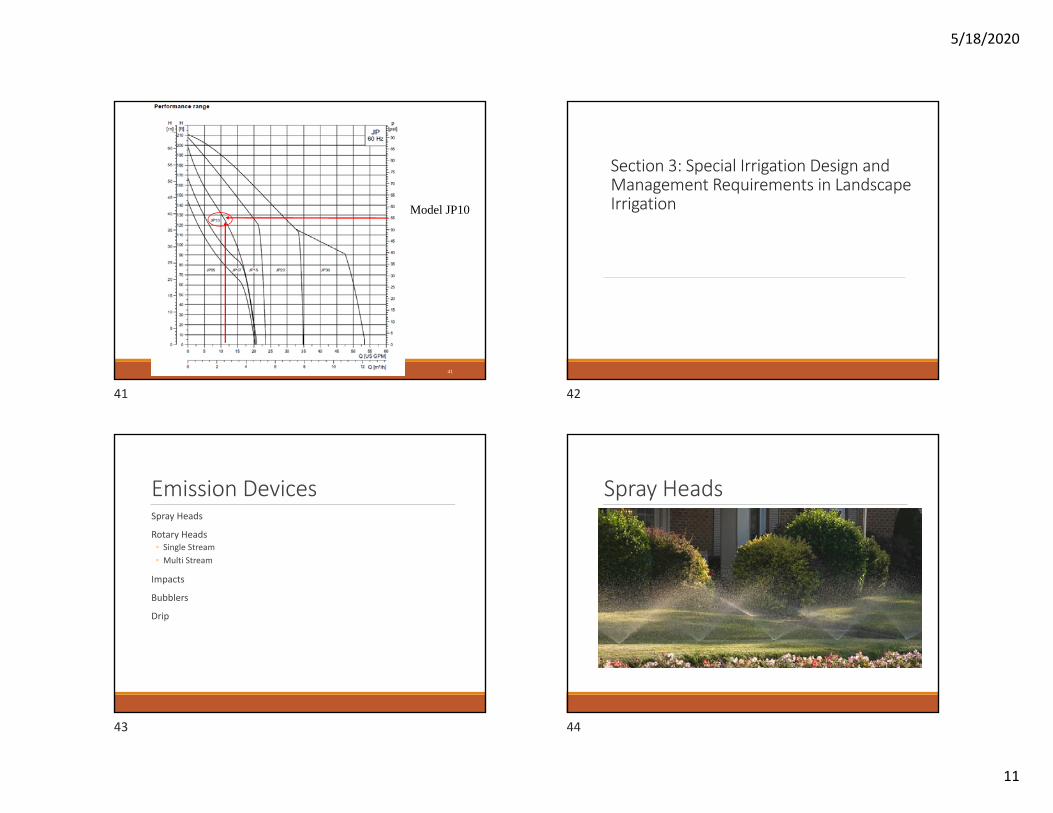
Centrifugal PumpsPump Curves
39
Selecting Pumps ExampleUse the Pump Curve to select a pump to produce 55 PSI and 12 GPM
40
37 38
39 40
5/18/2020
11
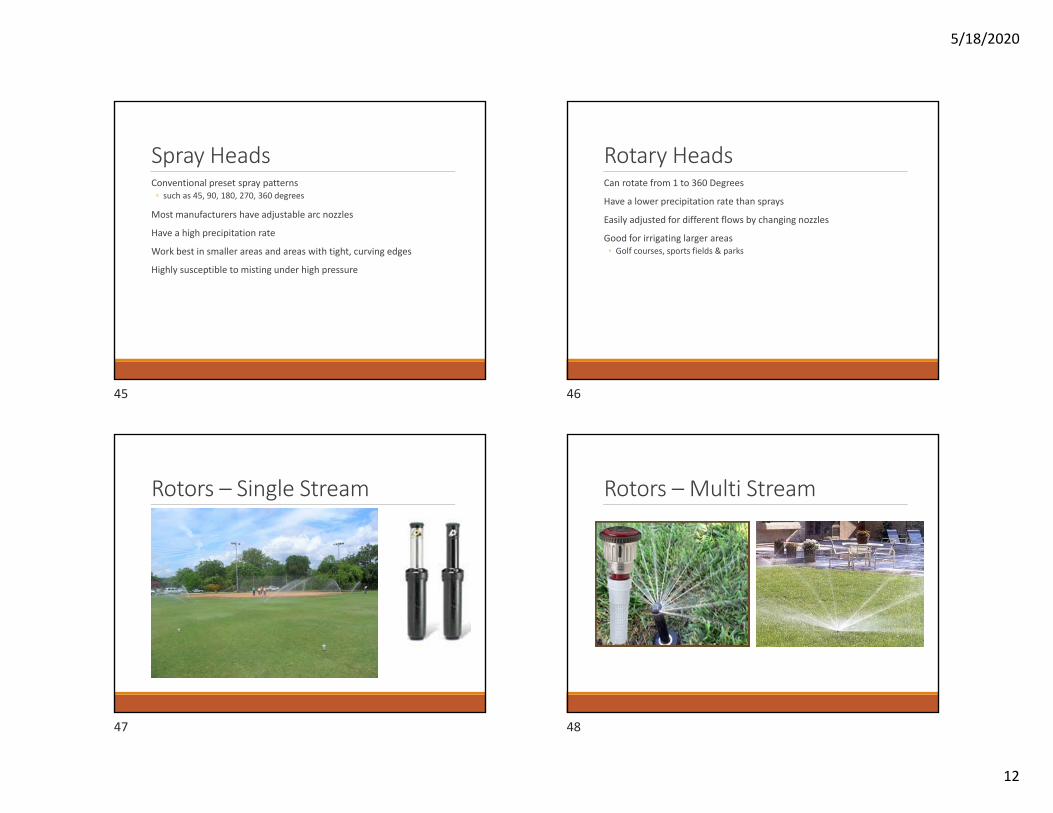
41
Model JP10
Section 3: Special Irrigation Design and Management Requirements in Landscape Irrigation
Emission DevicesSpray Heads
Rotary Heads◦ Single Stream◦ Multi Stream
Impacts
Bubblers
Drip
Spray Heads
41 42
43 44
5/18/2020
12
Spray HeadsConventional preset spray patterns◦ such as 45, 90, 180, 270, 360 degrees
Most manufacturers have adjustable arc nozzles
Have a high precipitation rate
Work best in smaller areas and areas with tight, curving edges
Highly susceptible to misting under high pressure
Rotary HeadsCan rotate from 1 to 360 Degrees
Have a lower precipitation rate than sprays
Easily adjusted for different flows by changing nozzles
Good for irrigating larger areas◦ Golf courses, sports fields & parks
Rotors – Single Stream Rotors – Multi Stream
45 46
47 48
5/18/2020
13
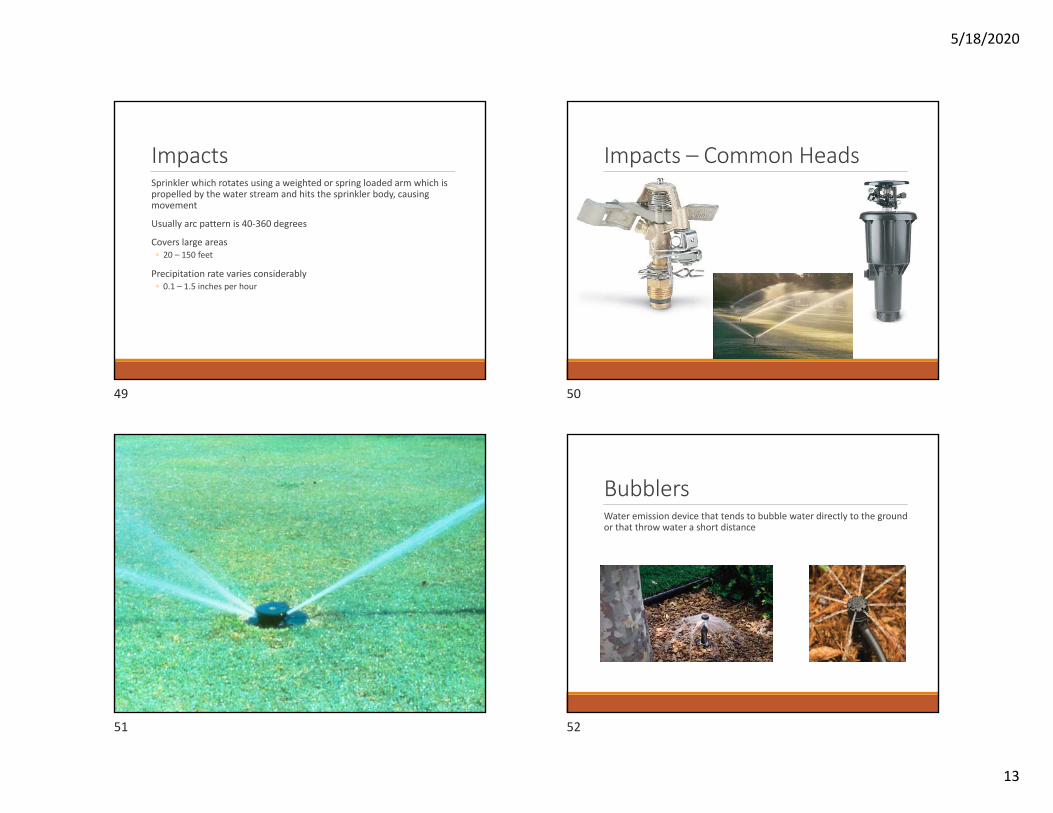
ImpactsSprinkler which rotates using a weighted or spring loaded arm which is propelled by the water stream and hits the sprinkler body, causing movement
Usually arc pattern is 40‐360 degrees
Covers large areas◦ 20 – 150 feet
Precipitation rate varies considerably◦ 0.1 – 1.5 inches per hour
Impacts – Common Heads
BubblersWater emission device that tends to bubble water directly to the ground or that throw water a short distance
49 50
51 52

5/18/2020
14
Drip Products – Drip Tubing with Embedded EmittersDurable thick‐wall tubing
Typically has pressure‐compensating embedded emitters
Use in beds and turf applications
Drip Tubing Under TurfFollow manufactures guides for recommendations on product spacing and emitter flow rates
54
Texas Commission on Environmental QualityLANDSCAPE IRRIGATION DESIGN RULES
55
TCEQ Definition: DesignThe act of determining the various elements of a landscape irrigation system that will include, but not limited to, elements such as:◦ Collecting site specific information◦ Defining the scope of the project◦ Defining plant watering needs◦ Selecting and layout out emission devices◦ Locating system components◦ Conducing hydraulics calculations◦ Identifying any local regulatory requirements◦ Scheduling irrigation work at a site
53 54
55 56
5/18/2020
15
Minimum Design and Installation RequirementsDefined by TCEQ Chapter 344.62◦ No irrigation design or installation shall require the use of any component, including the water meter, in a way which exceeds the manufacturers published performance limitations for the component◦ Be familiar with manufacturers product literature
Minimum Design and Installation RequirementsSpacing◦ Must not exceed manufacturers published radius or spacing of a device◦ No above ground spray devices in areas less than 48 inches
◦ Many ordinances exceed this
◦ Some areas may be exempt if the runoff drains into a landscaped area
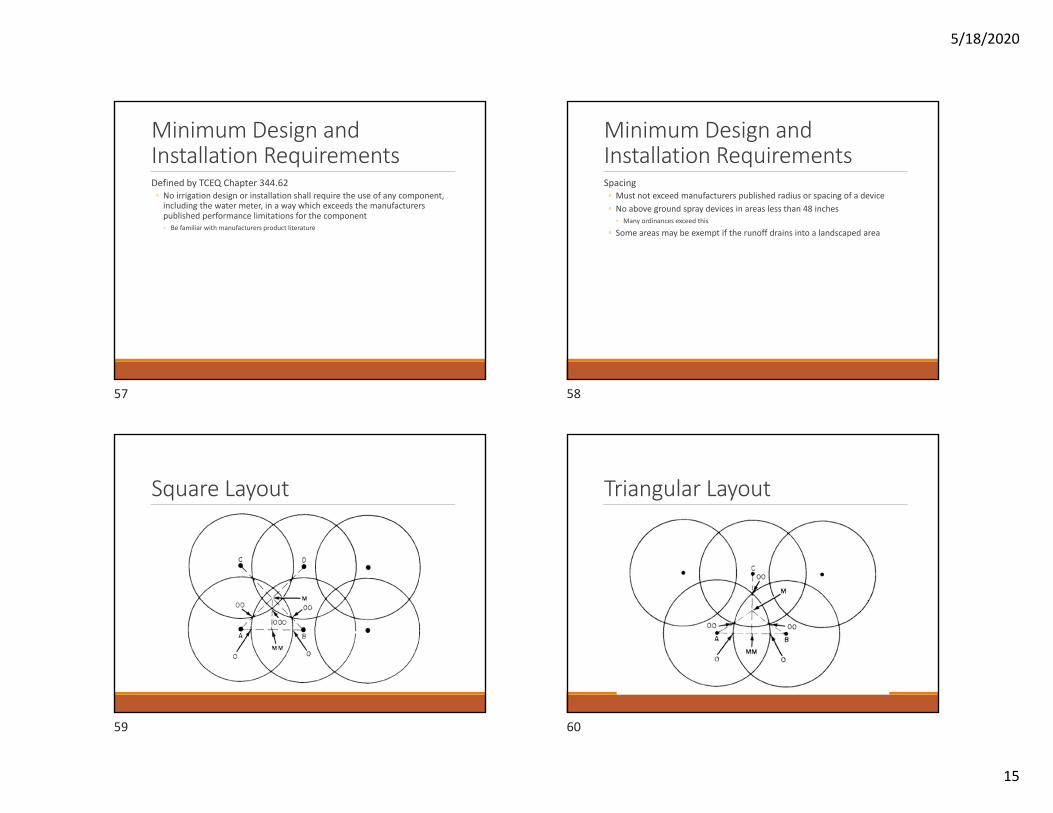
Square Layout Triangular Layout
57 58
59 60
5/18/2020
16
Square Vs Triangular SpacingSquare Layouts◦ Best for defined geometric spaces such as square or rectangular shaped fields or landscapes
Triangular Layouts◦ Often work better in areas that are irregular in shape and where overthrow is not an issue
◦ Most adaptable to curved or circular areas
61
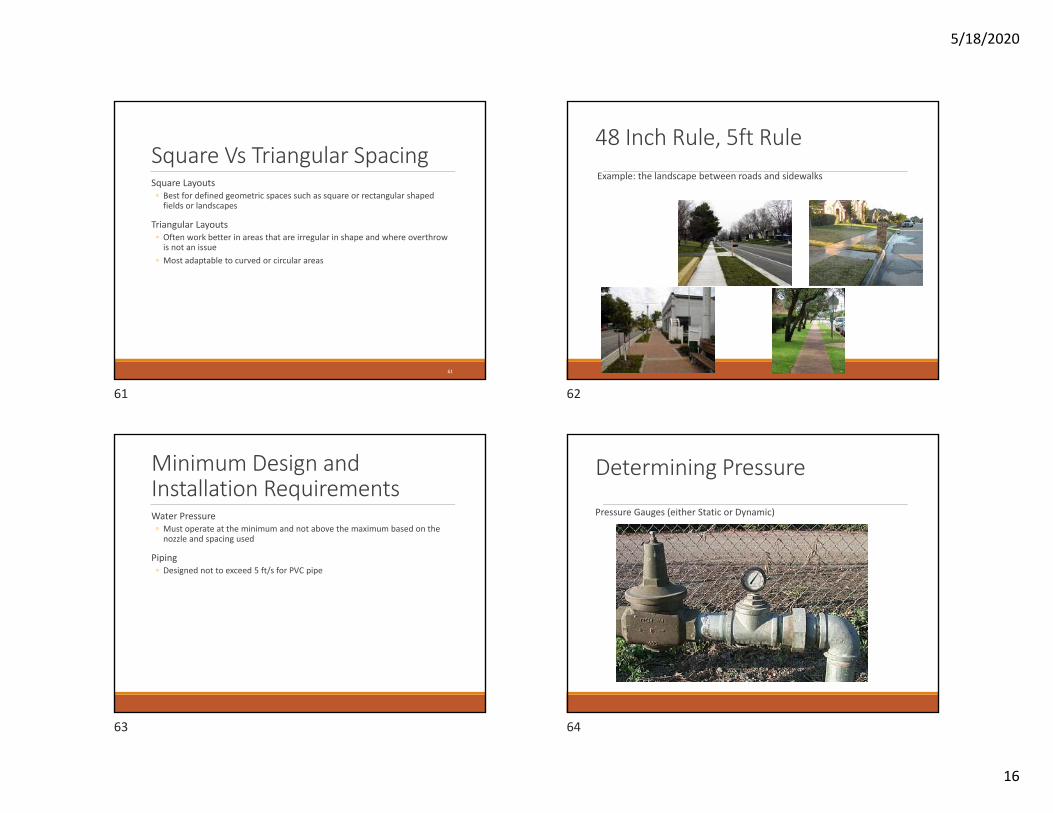
48 Inch Rule, 5ft RuleExample: the landscape between roads and sidewalks
Minimum Design and Installation RequirementsWater Pressure◦ Must operate at the minimum and not above the maximum based on the nozzle and spacing used
Piping◦ Designed not to exceed 5 ft/s for PVC pipe
Determining Pressure
Pressure Gauges (either Static or Dynamic)
61 62
63 64
5/18/2020
17
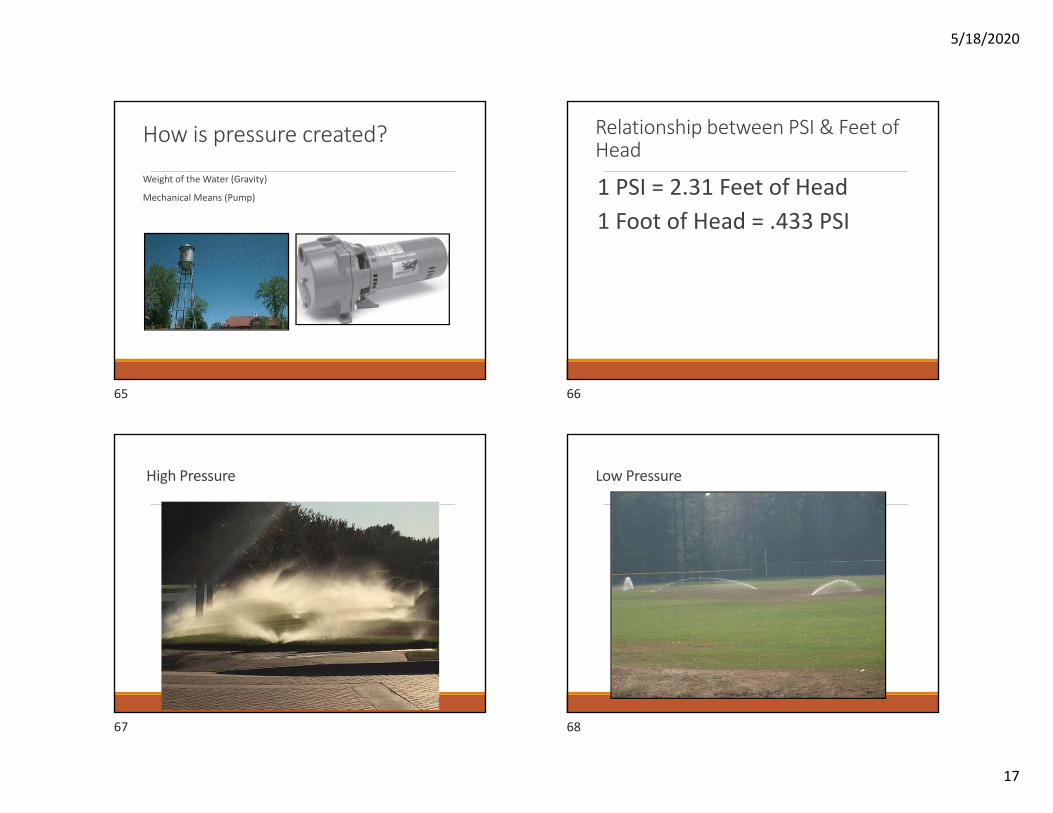
How is pressure created?
Weight of the Water (Gravity)
Mechanical Means (Pump)
Relationship between PSI & Feet of Head
1 PSI = 2.31 Feet of Head1 Foot of Head = .433 PSI
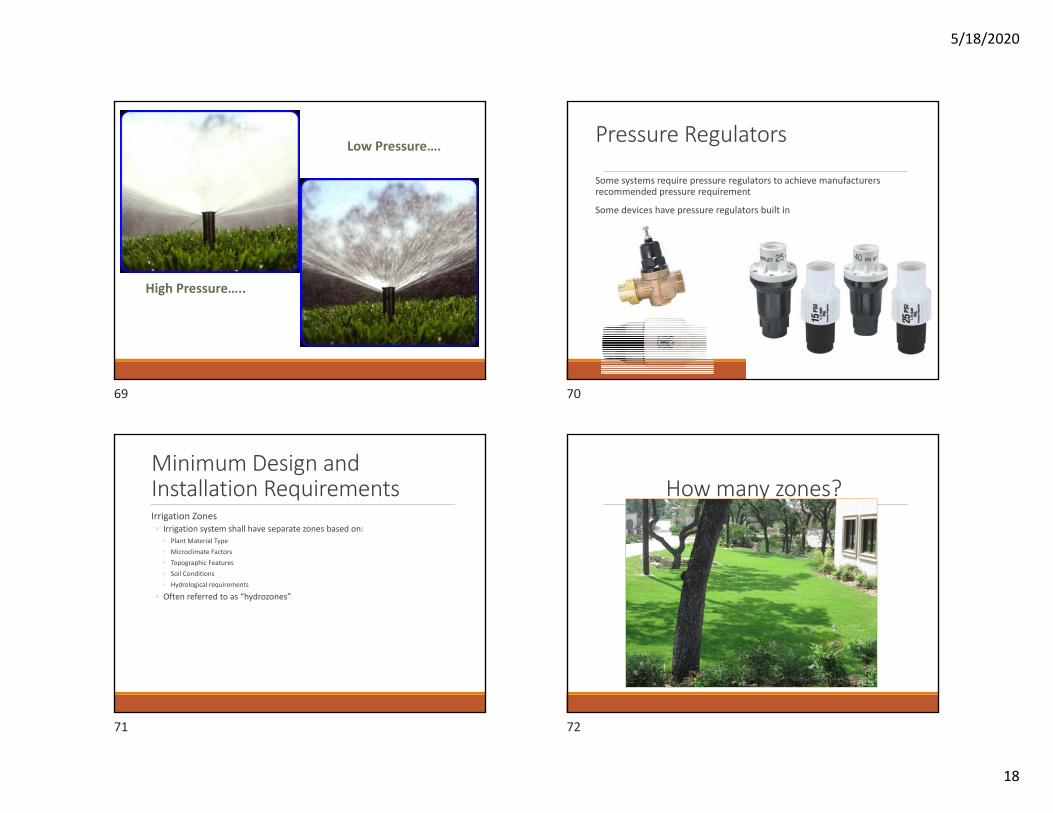
High Pressure Low Pressure
65 66
67 68
5/18/2020
18
High Pressure…..
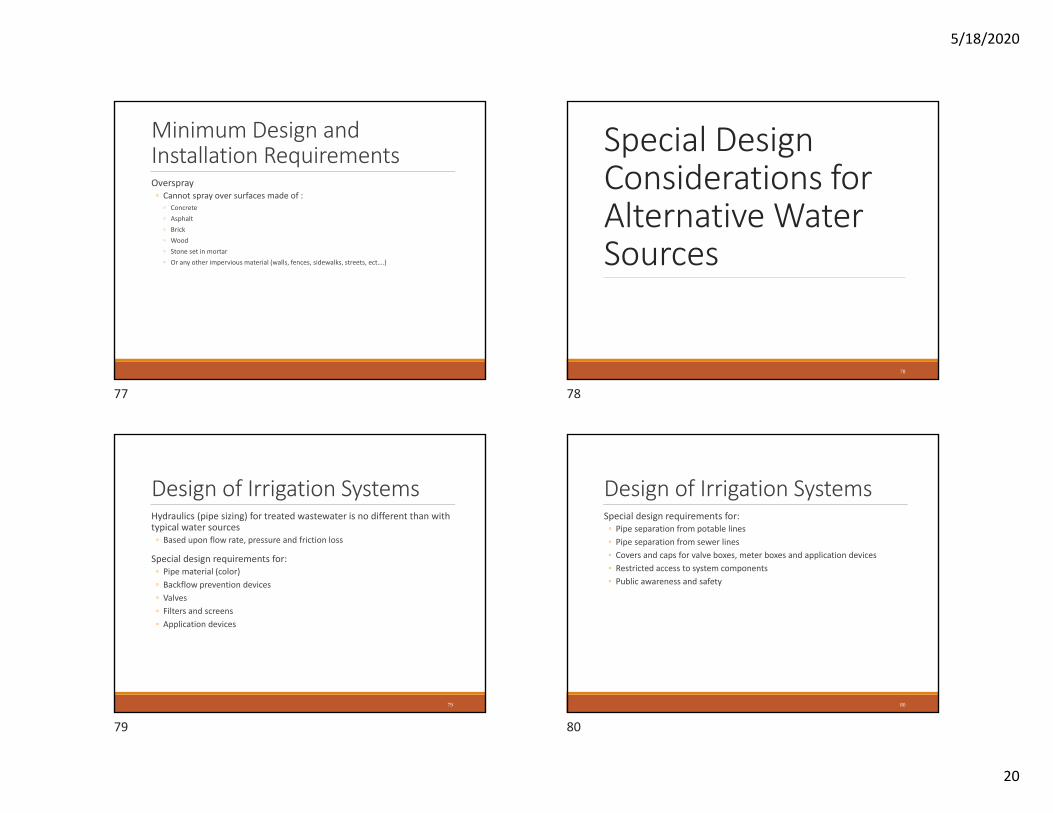
Low Pressure…. Pressure Regulators
Some systems require pressure regulators to achieve manufacturers recommended pressure requirement
Some devices have pressure regulators built in
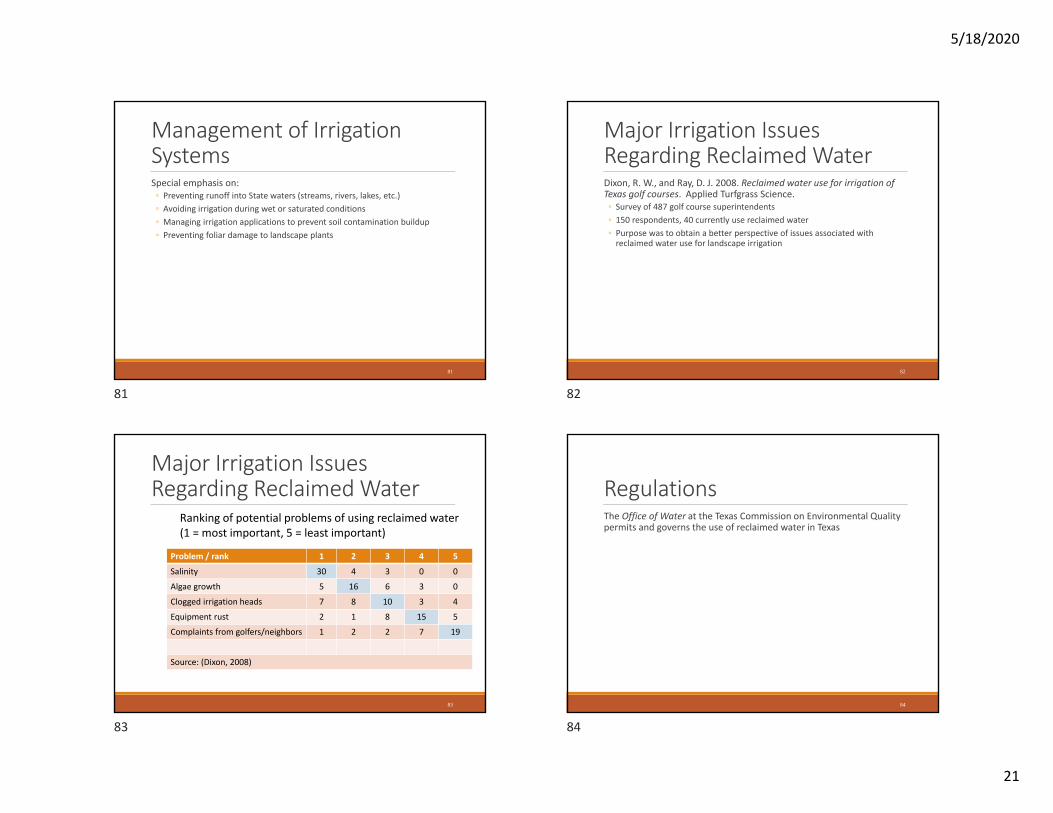
Minimum Design and Installation RequirementsIrrigation Zones◦ Irrigation system shall have separate zones based on:
◦ Plant Material Type◦ Microclimate Factors◦ Topographic Features◦ Soil Conditions◦ Hydrological requirements
◦ Often referred to as “hydrozones”
How many zones?
69 70
71 72

5/18/2020
19
ZoningPoor designs will often have multiple zones located within a station◦ Example
◦ Irrigating Shrubs, flowers and turfon the same zone
◦ Often results in something beingover or under watered
ZoningCharacteristics of a poorly zoned landscape:◦ Impractical turf areas◦ Impractical shrub or tree plantings
ZoningOften established plants (non‐turf) can be zoned into one of 3 categories◦ Frequent Watering
◦ Annual Flowers
◦ Occasional Watering◦ Perennial Flowers, groundcovers, tender woody shrubs and vines
◦ Natural Rainfall◦ Tough woody shrubs and vines, shade trees
Minimum Design and Installation RequirementsMatched Precipitation Rate◦ Zones must be designed so all devices in the zone irrigate at the same precipitation rate
73 74
75 76
5/18/2020
20
Minimum Design and Installation RequirementsOverspray◦ Cannot spray over surfaces made of :
◦ Concrete◦ Asphalt◦ Brick◦ Wood◦ Stone set in mortar◦ Or any other impervious material (walls, fences, sidewalks, streets, ect….)
Special Design Considerations for Alternative Water Sources
78
Design of Irrigation SystemsHydraulics (pipe sizing) for treated wastewater is no different than with typical water sources◦ Based upon flow rate, pressure and friction loss
Special design requirements for:◦ Pipe material (color)◦ Backflow prevention devices◦ Valves◦ Filters and screens◦ Application devices
79
Design of Irrigation SystemsSpecial design requirements for:◦ Pipe separation from potable lines◦ Pipe separation from sewer lines◦ Covers and caps for valve boxes, meter boxes and application devices◦ Restricted access to system components◦ Public awareness and safety
80
77 78
79 80
5/18/2020
21
Management of Irrigation SystemsSpecial emphasis on:◦ Preventing runoff into State waters (streams, rivers, lakes, etc.)◦ Avoiding irrigation during wet or saturated conditions◦ Managing irrigation applications to prevent soil contamination buildup◦ Preventing foliar damage to landscape plants
81
Major Irrigation Issues Regarding Reclaimed WaterDixon, R. W., and Ray, D. J. 2008. Reclaimed water use for irrigation of Texas golf courses. Applied Turfgrass Science.◦ Survey of 487 golf course superintendents◦ 150 respondents, 40 currently use reclaimed water◦ Purpose was to obtain a better perspective of issues associated with reclaimed water use for landscape irrigation
82
Major Irrigation Issues Regarding Reclaimed Water
Problem / rank 1 2 3 4 5
Salinity 30 4 3 0 0
Algae growth 5 16 6 3 0
Clogged irrigation heads 7 8 10 3 4
Equipment rust 2 1 8 15 5
Complaints from golfers/neighbors 1 2 2 7 19
Source: (Dixon, 2008)
83
Ranking of potential problems of using reclaimed water(1 = most important, 5 = least important)
RegulationsThe Office of Water at the Texas Commission on Environmental Quality permits and governs the use of reclaimed water in Texas
84
81 82
83 84

5/18/2020
22
Regulatory RequirementsChapter 210 – Use of Reclaimed Water◦ Pipe:
◦ Buried pipe installed after February 12, 1997 must be:◦ Manufactured in purple◦ Painted purple◦ Taped with purple metallic tape◦ Bagged in purple
◦ Exposed pipe should be stenciled in white with the words “NON‐POTABLE WATER”◦ All exposed and buried reclaimed water pipes at a wastewater treatment facility is exempt from
the color coding requirements◦ Color coding also applies to graywater
85
PipingPurple Piping
Pipe Sleeves
86
Regulatory RequirementsChapter 210 – Use of Reclaimed Water◦ Pipe separation:
◦ Must be separated from potable water piping by a horizontal distance of 9 feet (exemptions exist)
◦ Must be separated from sewer lines by a horizontal distance of 3 feet with the reclaimed water line at the level or above the sewer line.
◦ Where a reclaimed water line crosses a sewer line, the reclaimed water line must be at least 2 feet above the sewer line
87
Regulatory RequirementsHose bibs:◦ All hose bibs and faucets must be painted purple◦ Must be designed so that they prevent connection to a standard water hose◦ Must be located:
◦ Below ground◦ In vaults◦ Locked◦ Labeled as non‐potable
◦ Exception: Above‐ground non‐lockable service boxes are allowed if they can only be operated with special tools
88
85 86
87 88
5/18/2020
23
Regulatory RequirementsChapter 344 – Landscape IrrigationReclaimed Water◦ Definition: Domestic or Municipal water which has been treated to a quality suitable for beneficial use, such as landscape irrigation.
Non‐Potable Water◦ Definition: Water that is not suitable for human consumption. Includes irrigation systems, lakes, ponds, streams, gray water, water vapor condensate, reclaimed water and harvested rainwater
89
ValvesConstructed with materials that withstand high chlorine and other harsh chemicals ‐ chemical resistant components
Diaphragms reinforced to protect against corrosion
Stainless steel, self‐flushing filter screens
Purple handles for easy identification
Lockable valve boxes to prevent unauthorized operation
90
Application DevicesPurple ID caps and covers for conventional rotors and spray heads
Check valves reduces low‐head drainage
Low angle nozzles minimizes spray drift
Filters prevent clogged nozzles
91
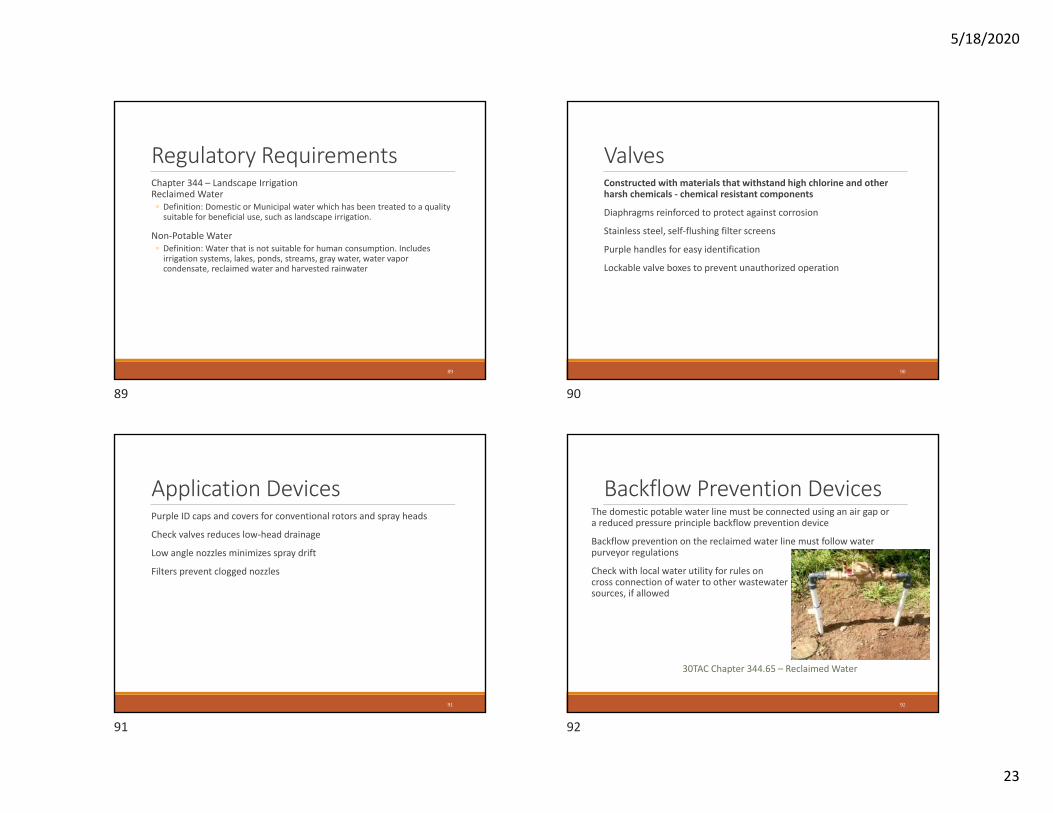
Backflow Prevention DevicesThe domestic potable water line must be connected using an air gap or a reduced pressure principle backflow prevention device
Backflow prevention on the reclaimed water line must follow water purveyor regulations
Check with local water utility for rules on cross connection of water to other wastewater sources, if allowed
92
30TAC Chapter 344.65 – Reclaimed Water
89 90
91 92

5/18/2020
24
Public Safety and AwarenessThe irrigation system may not spray water across property lines
An minimum 8”x8” sign must be displayed in English and Spanish in the area being irrigated and stored. It must read:
93
“RECLAIMED WATER – DO NOT DRINK” and
“AQUA DE RECUPERACION – NO BEBER”
30TAC Chapter 344.65 – Reclaimed Water
Public Safety and AwarenessThere can be no contact with edible crops, unless the crop is pasteurized before consumption
Application rates and times must be managed so as to minimize “wet” grass conditions in unrestricted landscaped areas
Irrigation spray must not reach public drinking fountains
94
Public Safety and AwarenessIrrigation system must not allow application when the ground is saturated or frozen◦ Rain sensors◦ Freeze sensors◦ Soil moisture sensors
Systems must be designed to restrict unauthorized operation
95
Environmental ProtectionMust ensure that reclaimed water overflow, crop stress, and undesirable soil contamination by salt does not occur.
The irrigated property must be maintained with vegetative cover at all times when reclaimed water is used
Reclaimed water must not cause a nuisance, degrade groundwater quality, or be discharged into State waters
96
93 94
95 96

5/18/2020
25
Special Management NeedsPeriodic soil and water tests to track levels of salinity and other constituents
Leaching to remove salt accumulation
Plant evaluation for foliar toxicity
Advanced irrigation scheduling methods and tools
Documentation of irrigation use, water quality and soil quality
System audits, filter cleaning and routine maintenance
97
Special ConsiderationsCORROSION
98
CorrosionDefinition:
The chemical or electrochemical reaction between a material, usually a metal, and its environment that produces a deterioration of the material and its properties
99
PipingPoly Liners for metal pipes with corrosive water◦ Ex. Valley Irrigation ‐ PolySpan
100
97 98
99 100
5/18/2020
26
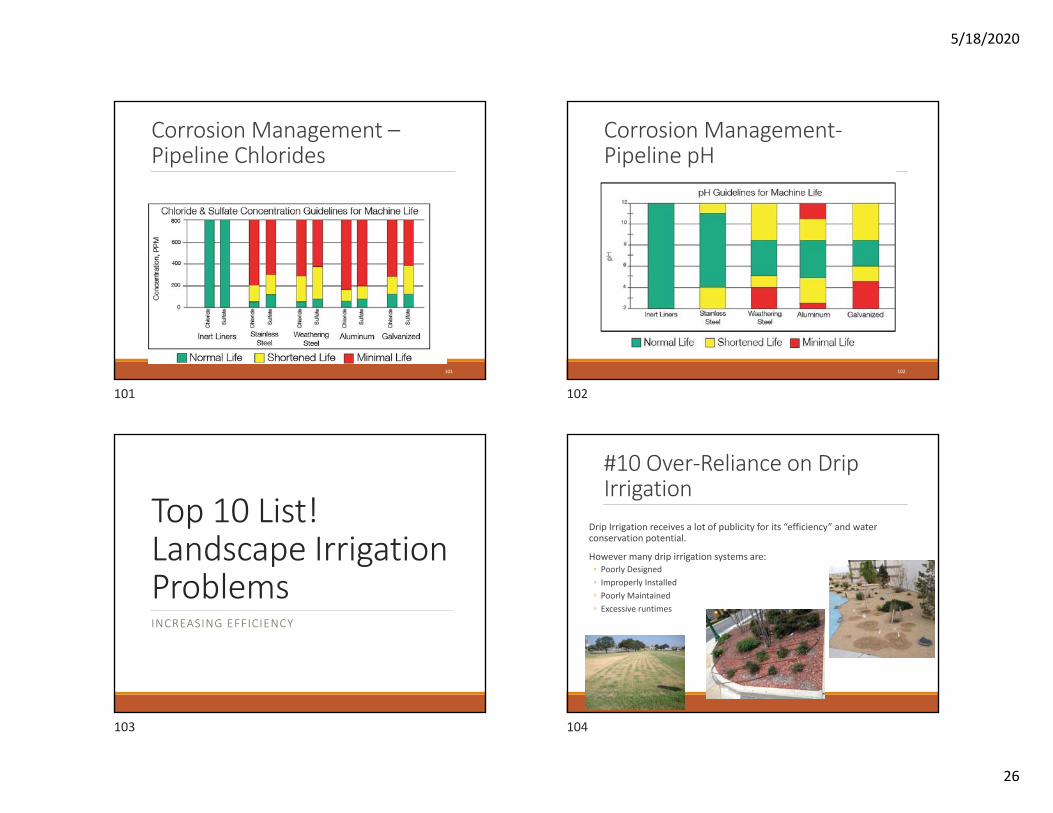
Corrosion Management –Pipeline Chlorides
101
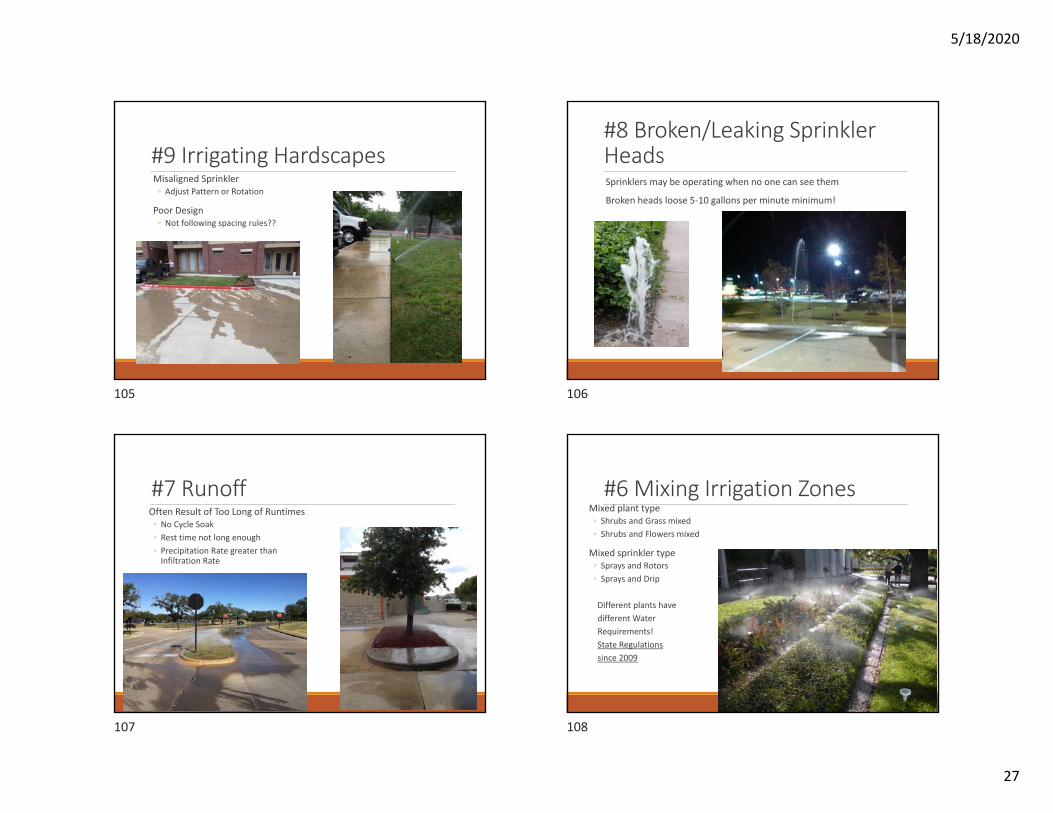
Corrosion Management‐Pipeline pH
102
Top 10 List!Landscape Irrigation ProblemsINCREASING EFFICIENCY
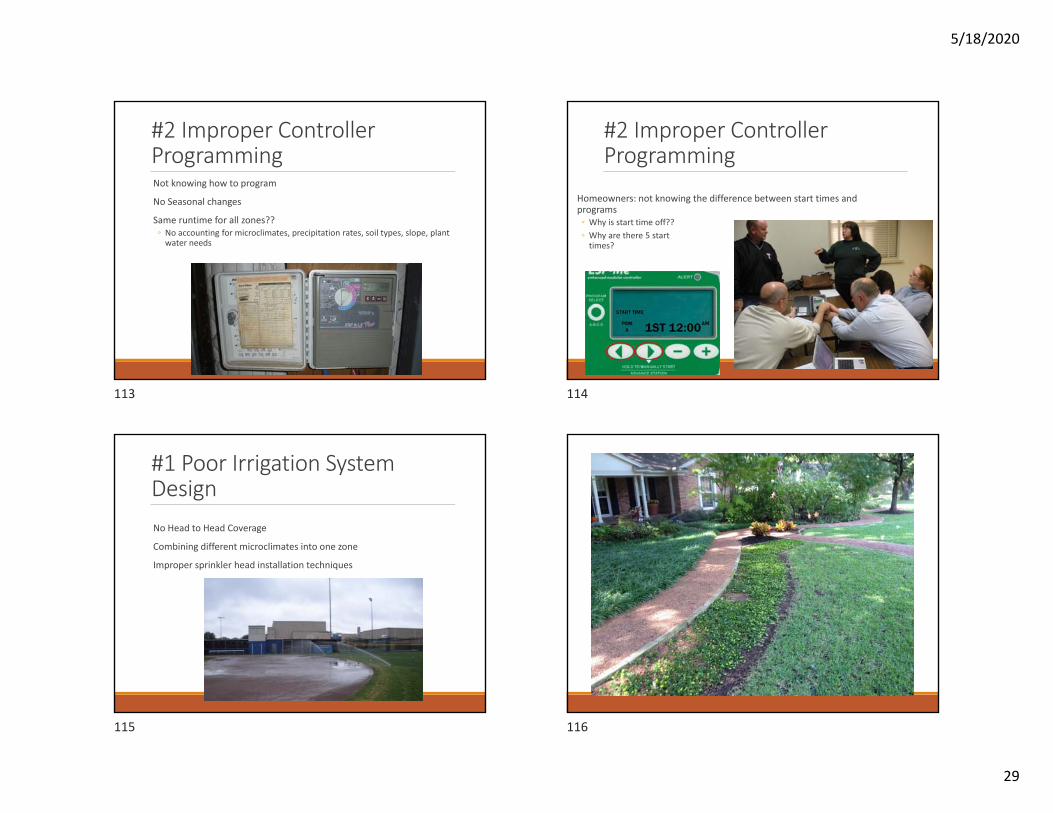
#10 Over‐Reliance on Drip Irrigation
Drip Irrigation receives a lot of publicity for its “efficiency” and water conservation potential.
However many drip irrigation systems are:◦ Poorly Designed◦ Improperly Installed◦ Poorly Maintained◦ Excessive runtimes
101 102
103 104
5/18/2020
27
#9 Irrigating HardscapesMisaligned Sprinkler◦ Adjust Pattern or Rotation
Poor Design◦ Not following spacing rules??
#8 Broken/Leaking Sprinkler HeadsSprinklers may be operating when no one can see them
Broken heads loose 5‐10 gallons per minute minimum!
#7 RunoffOften Result of Too Long of Runtimes◦ No Cycle Soak◦ Rest time not long enough◦ Precipitation Rate greater than Infiltration Rate
#6 Mixing Irrigation ZonesMixed plant type◦ Shrubs and Grass mixed◦ Shrubs and Flowers mixed
Mixed sprinkler type◦ Sprays and Rotors◦ Sprays and Drip
Different plants have different Water Requirements!State Regulations since 2009
105 106
107 108
5/18/2020
28
#5 Missing, Misplaced or Broken Rain Sensor
No rain shut‐off device:◦ Irrigating when raining or following rainfall
Device not installed in proper location or maintained
Controller is in sensor bypass mode
Damaged sensor or sensor wires
Sensor required on all new systems installed after 2009
#4 Lack of Pressure RegulationToo Much Pressure◦ Misting: 30‐50% lost to wind and evaporation◦ Can increase water use by as much as 20%
Low pressure limits coverage and decreases uniformity
#3 Lack of Regular Inspection and Maintenance
Sunken Heads
Cracked/Broken Heads/ Nozzles
Holes cut/chewed in drip hose
Solenoid valves not working properly
#3 Lack of Regular Inspection and Maintenance (cont.)
Backup battery dead‐reverts to default program◦ Wrong Day or Time of Day Irrigation?
Sprinkler heads or nozzles misaligned
Clogged Nozzles
109 110
111 112
5/18/2020
29
#2 Improper Controller ProgrammingNot knowing how to program
No Seasonal changes
Same runtime for all zones??◦ No accounting for microclimates, precipitation rates, soil types, slope, plant water needs
#2 Improper Controller Programming
Homeowners: not knowing the difference between start times and programs◦ Why is start time off??◦ Why are there 5 start times?
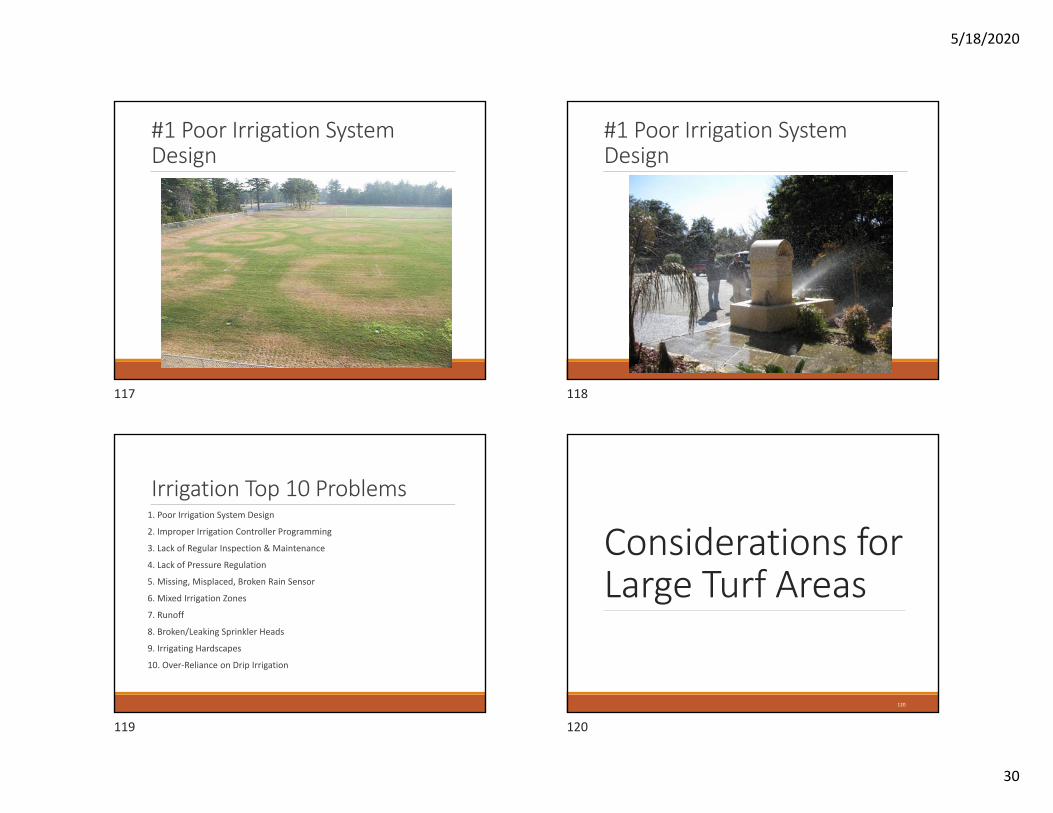
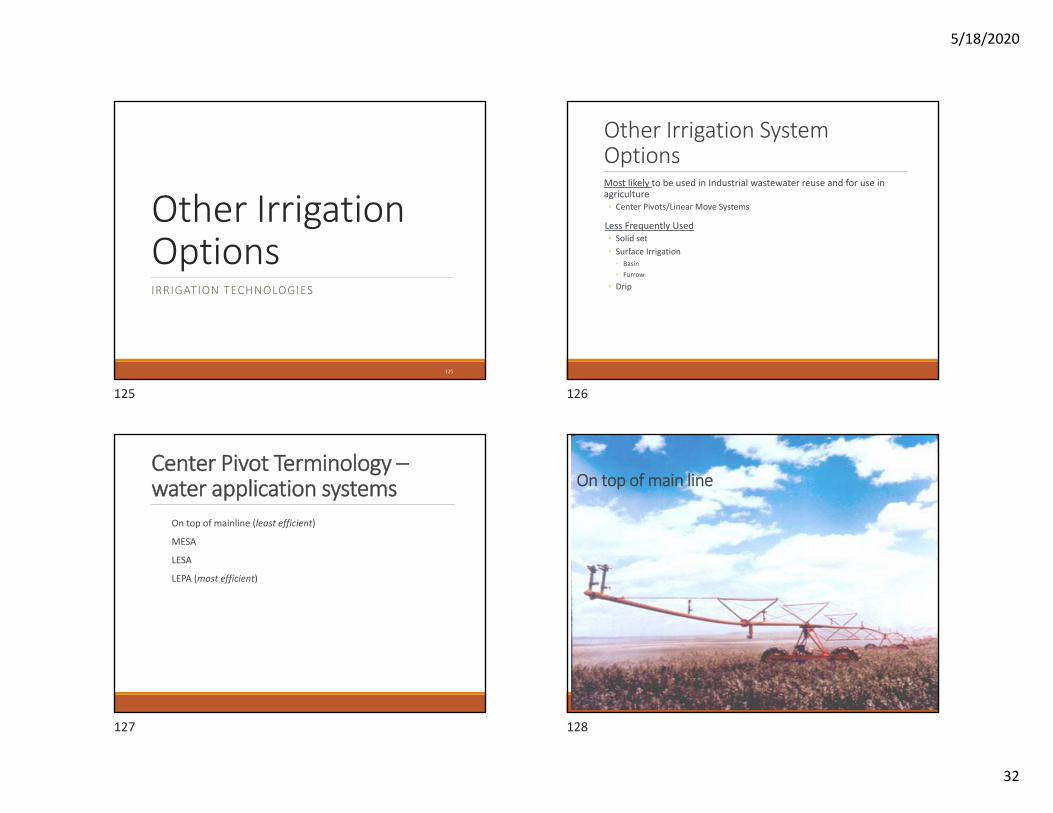
#1 Poor Irrigation System DesignNo Head to Head Coverage
Combining different microclimates into one zone
Improper sprinkler head installation techniques
113 114
115 116
5/18/2020
30
#1 Poor Irrigation System Design
#1 Poor Irrigation System Design
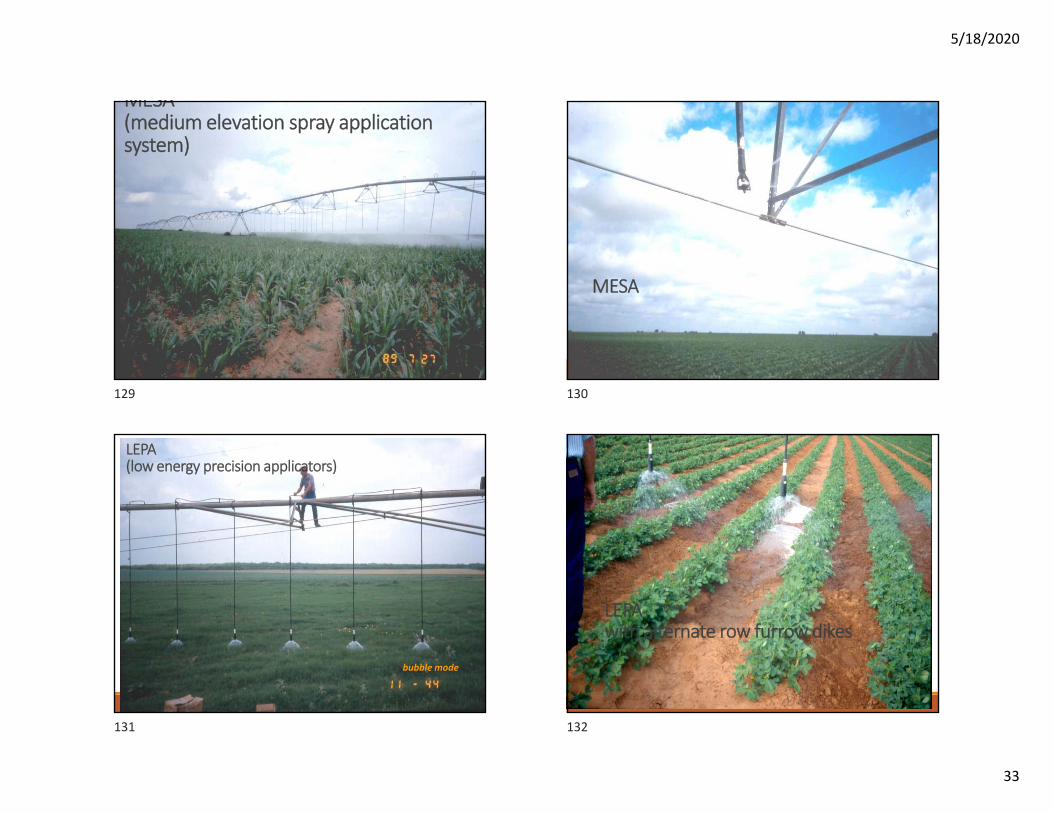
Irrigation Top 10 Problems1. Poor Irrigation System Design
2. Improper Irrigation Controller Programming
3. Lack of Regular Inspection & Maintenance
4. Lack of Pressure Regulation
5. Missing, Misplaced, Broken Rain Sensor
6. Mixed Irrigation Zones
7. Runoff
8. Broken/Leaking Sprinkler Heads
9. Irrigating Hardscapes
10. Over‐Reliance on Drip Irrigation
Considerations for Large Turf Areas
120
117 118
119 120

5/18/2020
31
Large Turf Landscape AreasLarge Turf areas are often ideal landscapes to use Reclaimed and alternative water supplies◦ Golf Course◦ Sports Complexes
◦ Football, Soccer, Baseball, etc.
Irrigation Design and Management can vary for large turf landscape areas◦ Use of Larger Sprinklers such as Impacts to cover more area◦ Sprinkler layout ◦ Controller Operation – managing flow and pressure
121
Considerations for Large Turf AreasIrrigation Blocks vs Valve in Head Management◦ Irrigation Blocks – 1 Valve controls multiple sprinkler heads
◦ Designed for a target flow and pressure
◦ Valve in Head – Each Sprinkler head has it own control valve.◦ More wiring, managing available flow and pressure
122
Considerations for Large Turf AreasRunoff◦ Large Turf areas like golf courses often have a mix of sloped to flat areas◦ Sports Fields and Golf Course often use larger sprinklers
123
Considerations for Large Turf AreasSprinkler layouts – Square vs Triangular Design
Irrigation of the Critical/Target Areas
124
121 122
123 124
5/18/2020
32
Other Irrigation OptionsIRRIGATION TECHNOLOGIES
125
Other Irrigation System OptionsMost likely to be used in Industrial wastewater reuse and for use in agriculture◦ Center Pivots/Linear Move Systems
Less Frequently Used◦ Solid set◦ Surface Irrigation
◦ Basin◦ Furrow
◦ Drip
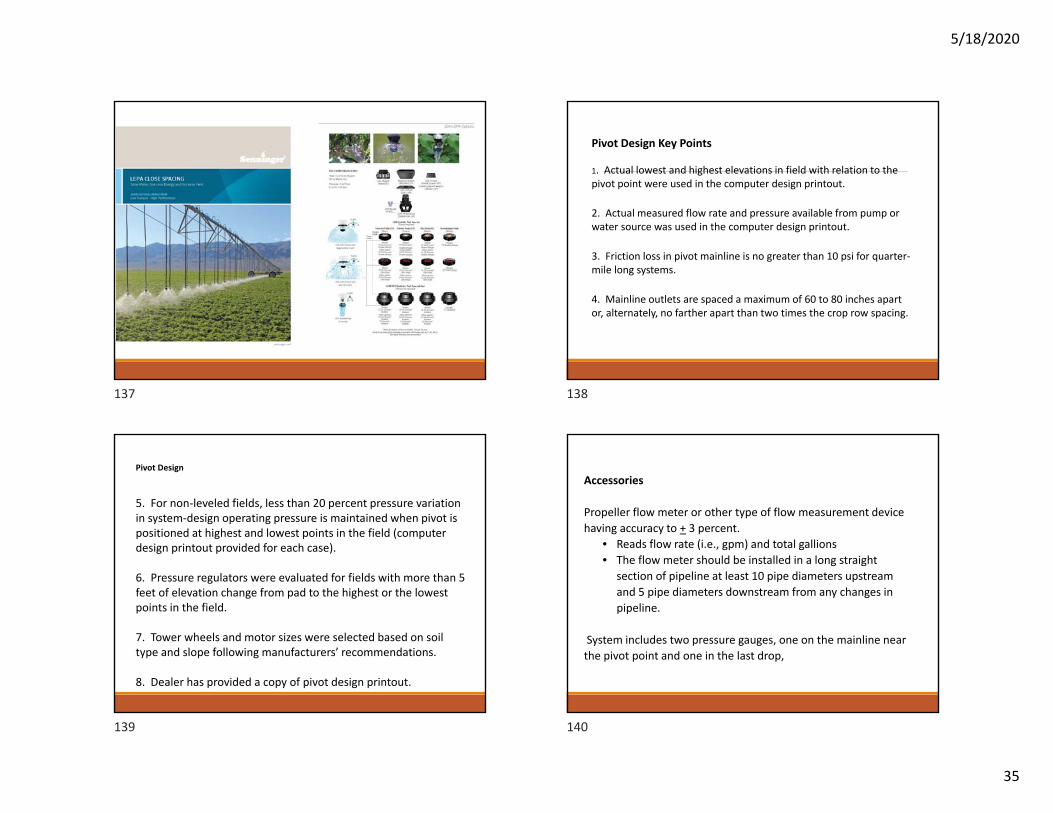
Center Pivot Terminology –water application systems
On top of mainline (least efficient)
MESA
LESA
LEPA (most efficient)
On top of main line
125 126
127 128
5/18/2020
33
MESA (medium elevation spray application system)
MESA
LEPA (low energy precision applicators)
bubble mode
LEPA with alternate row furrow dikes
129 130
131 132
5/18/2020
34
LESA (low elevation spry applicators) Drag line system (“mobile drip”)
Drag‐line evaluation at the Texas A&M University Farm – Fipps, 2016
Terminology – water application systems
On top of mainline
MESA
LESA
LEPA
On top of mainline
Above‐canopy
In‐canopy
Close drop spacing (with either LESA or LEPA)
133 134
135 136
5/18/2020
35
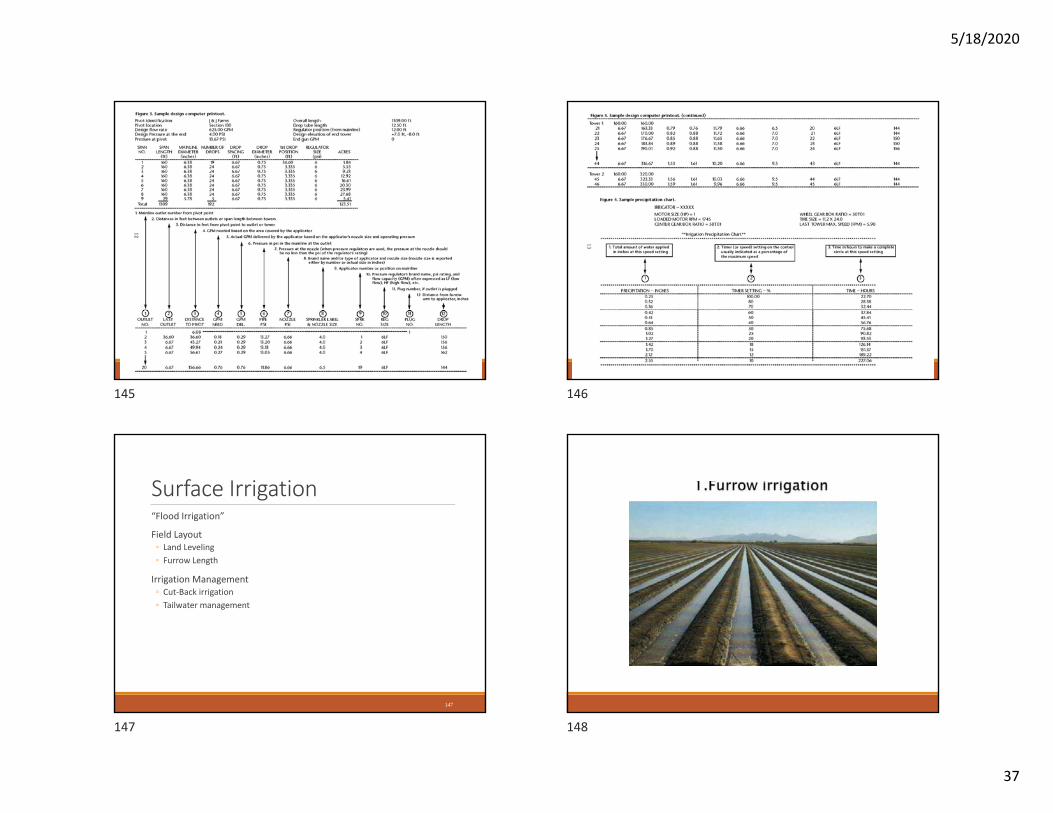
Pivot Design Key Points
1. Actual lowest and highest elevations in field with relation to the pivot point were used in the computer design printout.
2. Actual measured flow rate and pressure available from pump or water source was used in the computer design printout.
3. Friction loss in pivot mainline is no greater than 10 psi for quarter‐mile long systems.
4. Mainline outlets are spaced a maximum of 60 to 80 inches apart or, alternately, no farther apart than two times the crop row spacing.
Pivot Design
5. For non‐leveled fields, less than 20 percent pressure variation in system‐design operating pressure is maintained when pivot is positioned at highest and lowest points in the field (computer design printout provided for each case).
6. Pressure regulators were evaluated for fields with more than 5 feet of elevation change from pad to the highest or the lowest points in the field.
7. Tower wheels and motor sizes were selected based on soil type and slope following manufacturers’ recommendations.
8. Dealer has provided a copy of pivot design printout.
Accessories
Propeller flow meter or other type of flow measurement device having accuracy to + 3 percent.
• Reads flow rate (i.e., gpm) and total gallions• The flow meter should be installed in a long straight
section of pipeline at least 10 pipe diameters upstream and 5 pipe diameters downstream from any changes in pipeline.
System includes two pressure gauges, one on the mainline near the pivot point and one in the last drop,
137 138
139 140

5/18/2020
36
Control and Management Systems
141 142
143 144
5/18/2020
37
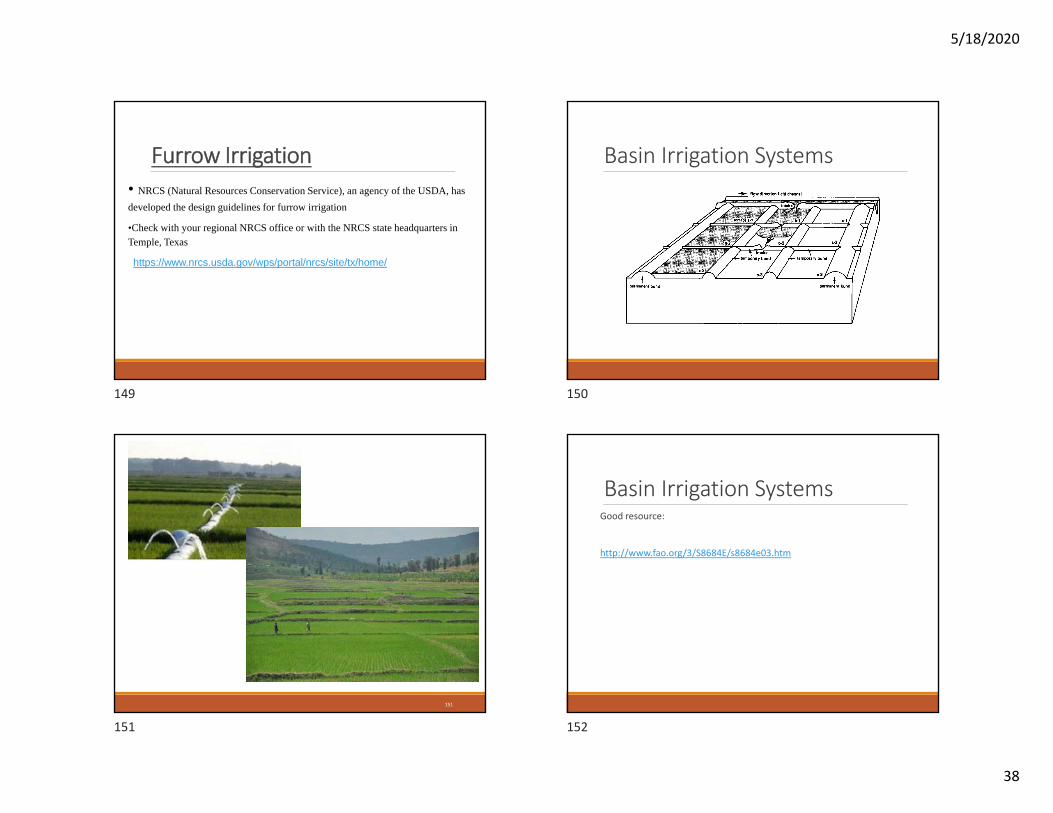
Surface Irrigation“Flood Irrigation”
Field Layout◦ Land Leveling◦ Furrow Length
Irrigation Management◦ Cut‐Back irrigation◦ Tailwater management
147
145 146
147 148
5/18/2020
38
Furrow Irrigation• NRCS (Natural Resources Conservation Service), an agency of the USDA, has developed the design guidelines for furrow irrigation
•Check with your regional NRCS office or with the NRCS state headquarters in Temple, Texas
https://www.nrcs.usda.gov/wps/portal/nrcs/site/tx/home/
Basin Irrigation Systems
151
Basin Irrigation SystemsGood resource:
http://www.fao.org/3/S8684E/s8684e03.htm
149 150
151 152
5/18/2020
39
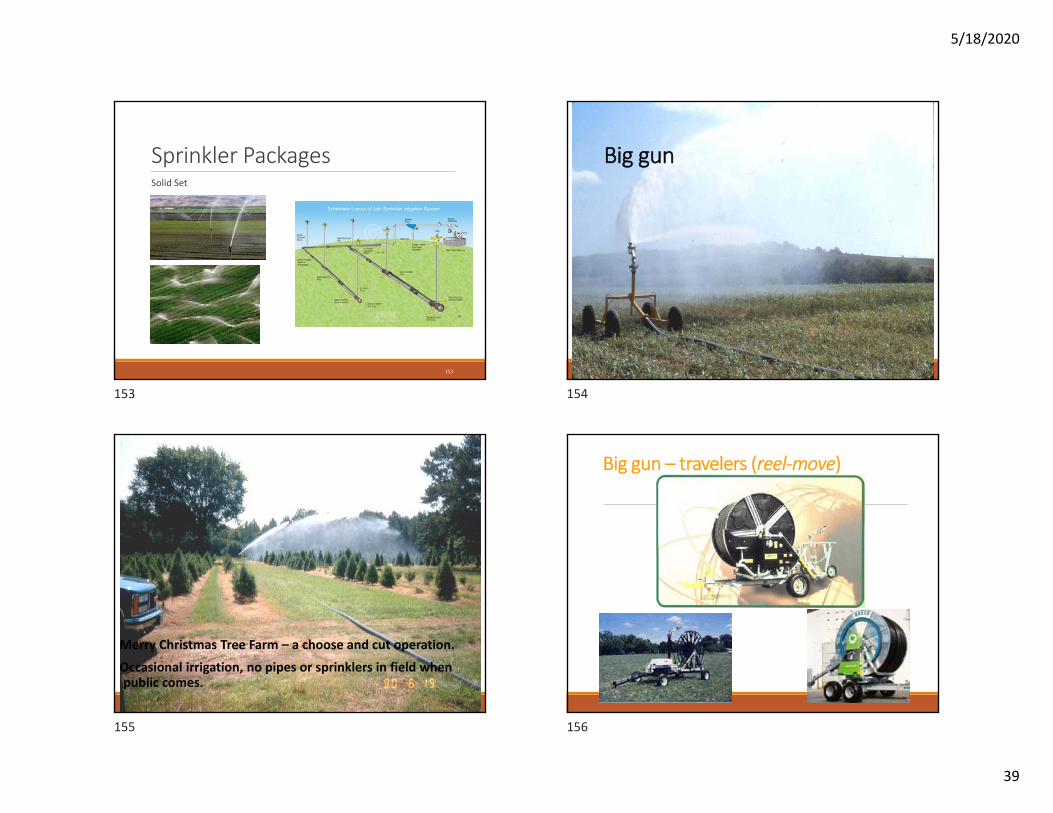
Sprinkler PackagesSolid Set
153
Big gun
Merry Christmas Tree Farm – a choose and cut operation.
Occasional irrigation, no pipes or sprinklers in field when public comes.
Big gun – travelers (reel‐move)
153 154
155 156
5/18/2020
40
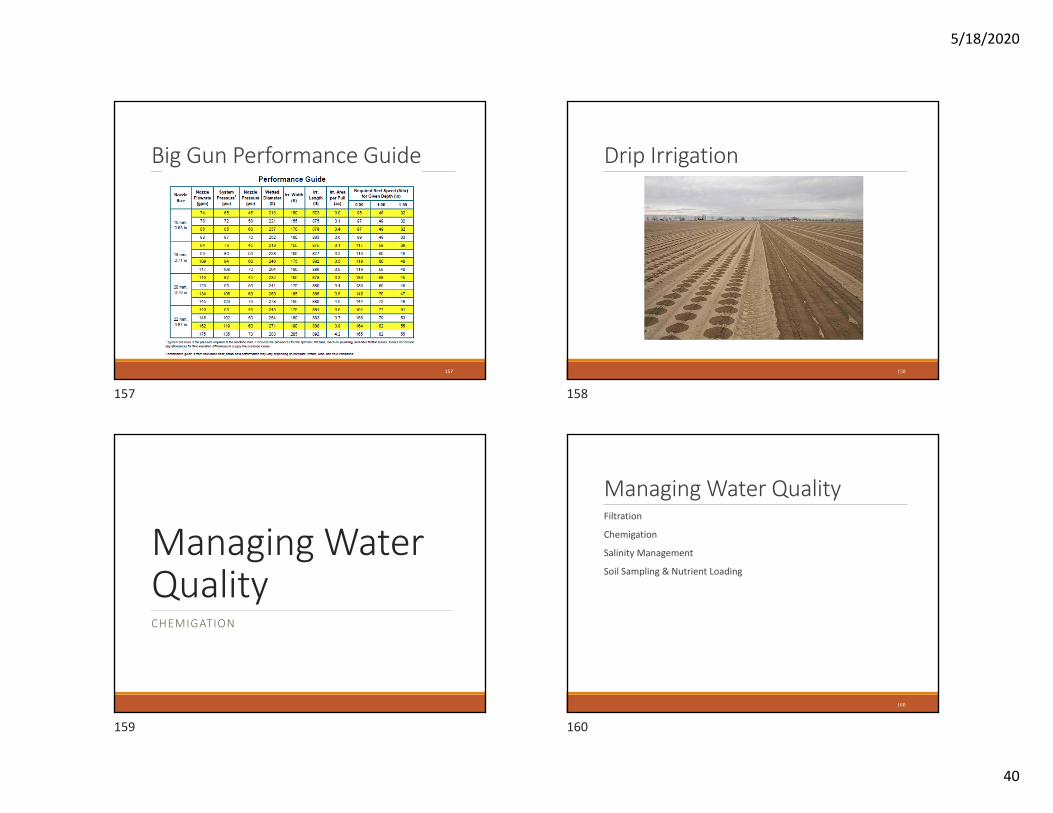
Big Gun Performance Guide
157
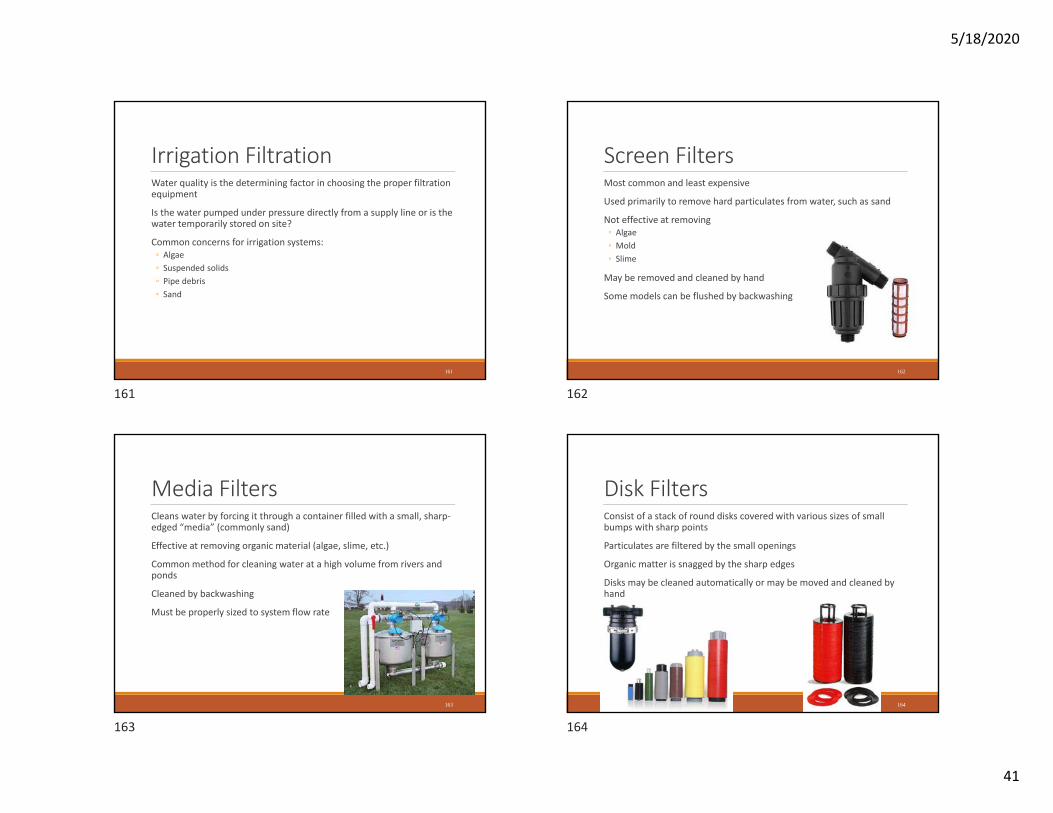
Drip Irrigation
158
Managing Water Quality CHEMIGATION
Managing Water QualityFiltration
Chemigation
Salinity Management
Soil Sampling & Nutrient Loading
160
157 158
159 160
5/18/2020
41
Irrigation FiltrationWater quality is the determining factor in choosing the proper filtration equipment
Is the water pumped under pressure directly from a supply line or is the water temporarily stored on site?
Common concerns for irrigation systems:◦ Algae◦ Suspended solids◦ Pipe debris◦ Sand
161
Screen FiltersMost common and least expensive
Used primarily to remove hard particulates from water, such as sand
Not effective at removing◦ Algae◦ Mold◦ Slime
May be removed and cleaned by hand
Some models can be flushed by backwashing
162
Media FiltersCleans water by forcing it through a container filled with a small, sharp‐edged “media” (commonly sand)
Effective at removing organic material (algae, slime, etc.)
Common method for cleaning water at a high volume from rivers and ponds
Cleaned by backwashing
Must be properly sized to system flow rate
163
Disk FiltersConsist of a stack of round disks covered with various sizes of small bumps with sharp points
Particulates are filtered by the small openings
Organic matter is snagged by the sharp edges
Disks may be cleaned automatically or may be moved and cleaned by hand
164
161 162
163 164
5/18/2020
42
Centrifugal Filters (sand separators)Used primarily for removing particulates such as sand
“Dirty” water is pumped into the filter where centrifugal force causes sand to move to the outside edge of the filter. Sand then slides down the outside edge to a holding tank at the bottom
Commonly used to filter well‐water
May require additional downstream filtration depending on the application
165
How much filtration do you need?Depends upon:◦ Type of irrigation system you have
◦ Drip◦ Spray
◦ Emitter orifice size◦ Allowable pressure loss through system◦ Durability, construction, and quality of solenoid valves
◦ Small sand grains are a common source of valve failure◦ Savings in valve repairs can pay for the extra cost of a filter in a short period of time
166
Approximate Filter Size EquivalentsMicron mm Mesh Micron mm Mesh
800 0.8 20 100 0.1 150
500 0.5 30 80 0.08 200
300 0.3 50 50 0.05 300
250 0.25 60 40 0.04 350
200 0.2 75 30 0.03 500
180 0.18 80 25 0.025 600
150 0.15 100 15 0.015 1000
130 0.13 120
167
“Mesh” is based upon the number of wires in 1 linear inch of the screen.
Drip product manufacturers will specify the level offiltration required.
Chemigation
General term that includes:FertigationInsectigationFungigationNematigation
165 166
167 168
5/18/2020
43
Advantages of Chemigation
Uniformity of application
Precise application
Economics
Timeliness
Reduced soil compaction and plant damage
Operator safety
Disadvantages of Chemigation
High management
Additional equipment
Must calculate injection rates and volumes
Chemigation and Regulations
General Classes◦ Controlled Substances
◦ Pesticides and Herbicides
◦ Fertilizers and Nutrients◦ Drip Maintenance/Clogging Control Chemicals
◦ Chlorine and Acids
Chemigation Injectors and PumpsThe most common types:
Mechanical◦ Piston (positive displacement) pumps◦ Diaphragm pumps
Venturi meters
169 170
171 172
5/18/2020
44
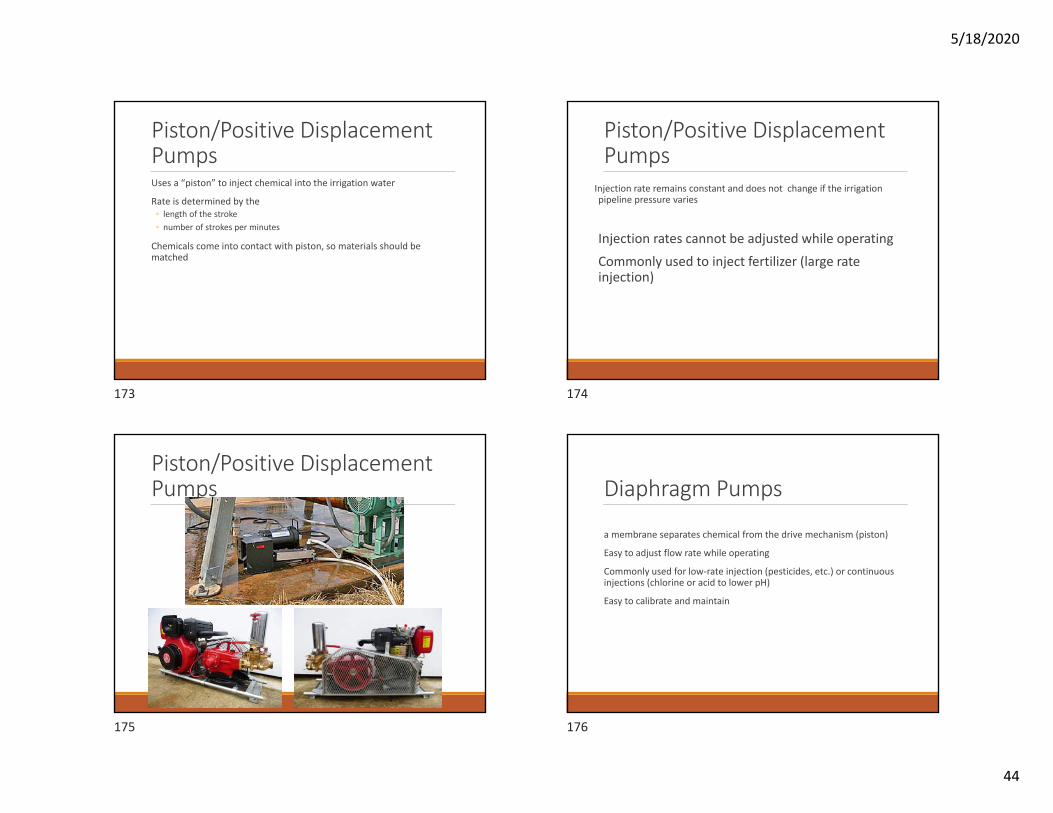
Piston/Positive Displacement PumpsUses a “piston” to inject chemical into the irrigation water
Rate is determined by the◦ length of the stroke◦ number of strokes per minutes
Chemicals come into contact with piston, so materials should be matched
Piston/Positive Displacement Pumps
Injection rate remains constant and does not change if the irrigation pipeline pressure varies
Injection rates cannot be adjusted while operating
Commonly used to inject fertilizer (large rate injection)
Piston/Positive Displacement Pumps Diaphragm Pumps
a membrane separates chemical from the drive mechanism (piston)
Easy to adjust flow rate while operating
Commonly used for low‐rate injection (pesticides, etc.) or continuous injections (chlorine or acid to lower pH)
Easy to calibrate and maintain
173 174
175 176
5/18/2020
45
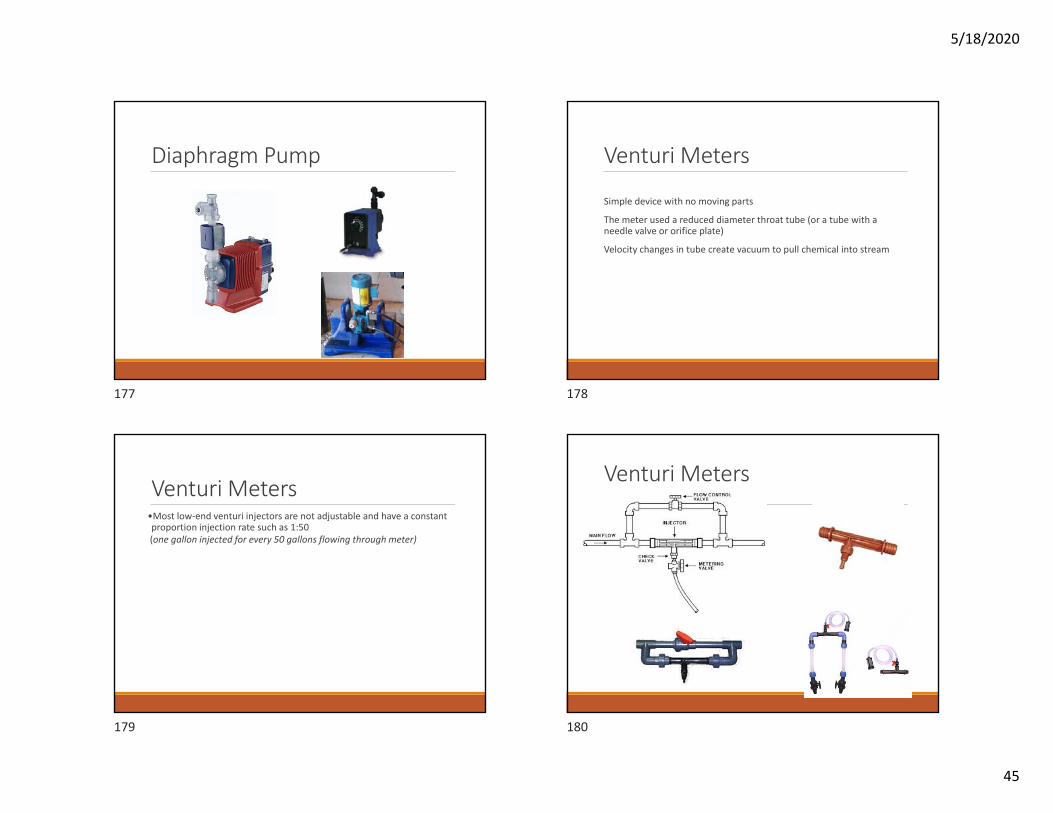
Diaphragm Pump Venturi Meters
Simple device with no moving parts
The meter used a reduced diameter throat tube (or a tube with a needle valve or orifice plate)
Velocity changes in tube create vacuum to pull chemical into stream
Venturi Meters•Most low‐end venturi injectors are not adjustable and have a constant proportion injection rate such as 1:50 (one gallon injected for every 50 gallons flowing through meter)
Venturi Meters
177 178
179 180
5/18/2020
46
Chlorine
Injected to control biological clogging of lines and emitters
Household bleach is often used in small systems (5.25% chlorine)
Higher concentrations (up to 100 ppm) if iron bacteria and/or organic matter are problems
Chlorine
Chlorine concentration at the end of the drip line should be:
‐ 1 to 2 ppm for occasional treatment
‐ 0.5 to 1 ppm for continuous treatment
Begin with a low concentration (5 ppm to 10 ppm) for one hour
Acid Injection
Acid is injected to control mineral clogging of emitters
Water with a high pH (>7.5) or
“moderate” to “hard water” (>60 ppm Ca) more likely to cause problems
Acid Injection
98% sulfuric acid is commonly used in drip irrigation
Citric acid or vinegar can be used in organic farming
Titration can be used to determine concentration of acid need
(adding acid to a sample of the water to see how much is required to lower pH)
181 182
183 184
5/18/2020
47
Acid Injection
Experimentation is used in absence of titration
Acid is injected until pH is lowered to 6.5
(measured at end of drip line)
Higher concentrations are added if needed, lowering pH to as low as ~4
Acid is corrosive – inject downsteam of filter if made of metal
Calculations Injection RatesCalculate injection rate based on concentration (ppm) of solution to be injected
IR = (0.006 x F x C) ÷ P
IR = injection rate (gal/hr)F = flow rate of irrigation system (gal/hr)C = concertration of chemical wanted (ppm)P = Percentage of chemical in solution
Chemigation Calculations ‐ Example 1I want to inject chlorine at a concentration of 5 ppm for one hour.
My irrigation system has a flow rate of 100 gpm, and I’m using household bleach (5.25% chlorine)
IR = (0.006 x F x C) ÷ P
IR = (0.006 x 100 gpm x 5 ppm) ÷ 5.25%
IR = 0.571 gal/hr of bleach
IR = injection rate (gal/hr)
F = flow rate of irrigation system (gpm)
C = concentration of chemical wanted (ppm)
P = Percentage of chemical in solution
Chemigation Calculations ‐ Example 2Determining amount of solution for fixed ratio injectors
For example 2, my venturi injector has a 100:1 ration
(injecting chlorine at a concentration of 5 ppm for one hour, a flow rate of 100 gpm, and using household bleach)
IR = 0.571 gal/hr of bleach
Step 1: Calculate total flow of irrigation system in one hour
100 gpm x 60 min/hr = 6000 gallons per hour
Step 2: Calculate total gallons of solution to be injected
(divide Step 1 by ratio)
6000 gph ÷ 100 = 60 gallons of solution
Step 3: Mix the 0.571 gallons of bleach with 60 gallons of water in the injection tank
185 186
187 188
5/18/2020
48
Managing Saline and Sodic Soils
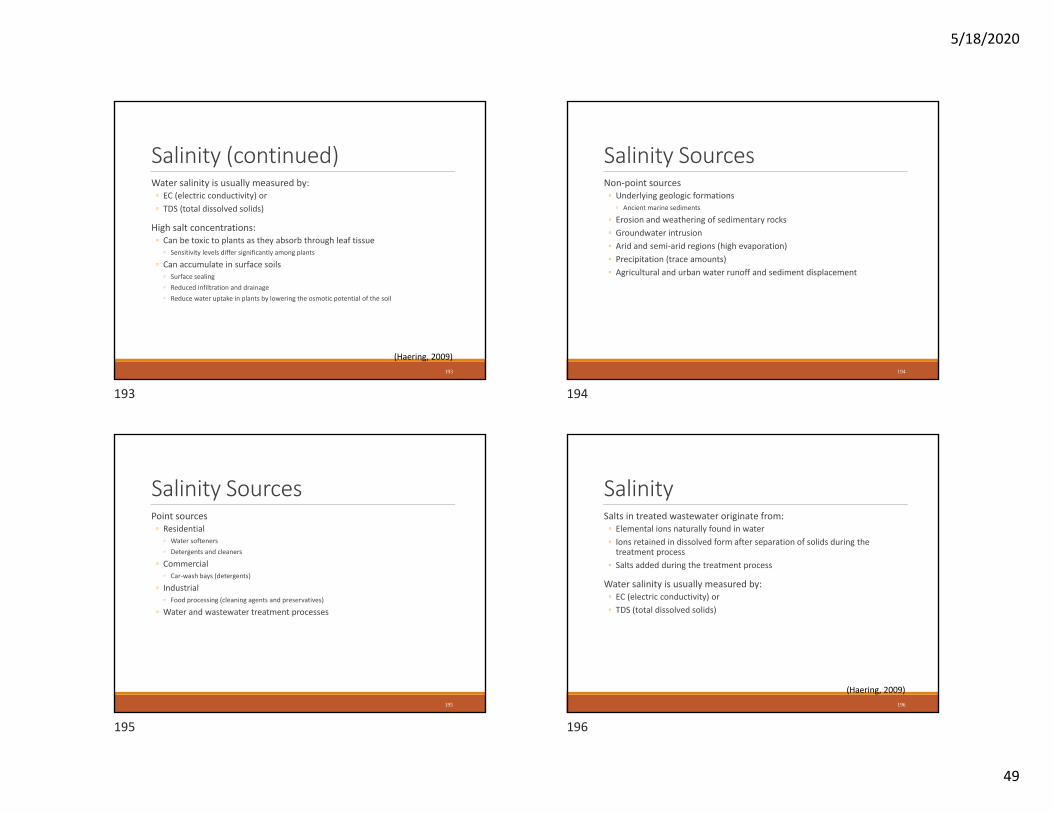
Why is salinity important?Most common problem associated with irrigating with treated wastewater
Can be toxic to some “salt‐sensitive” plants
Can cause surface sealing of soils, decrease infiltration and increase runoff
Can accumulate in the soil, reduce plant productivity, and make plants more prone to disease
Can damage and corrode equipment
190
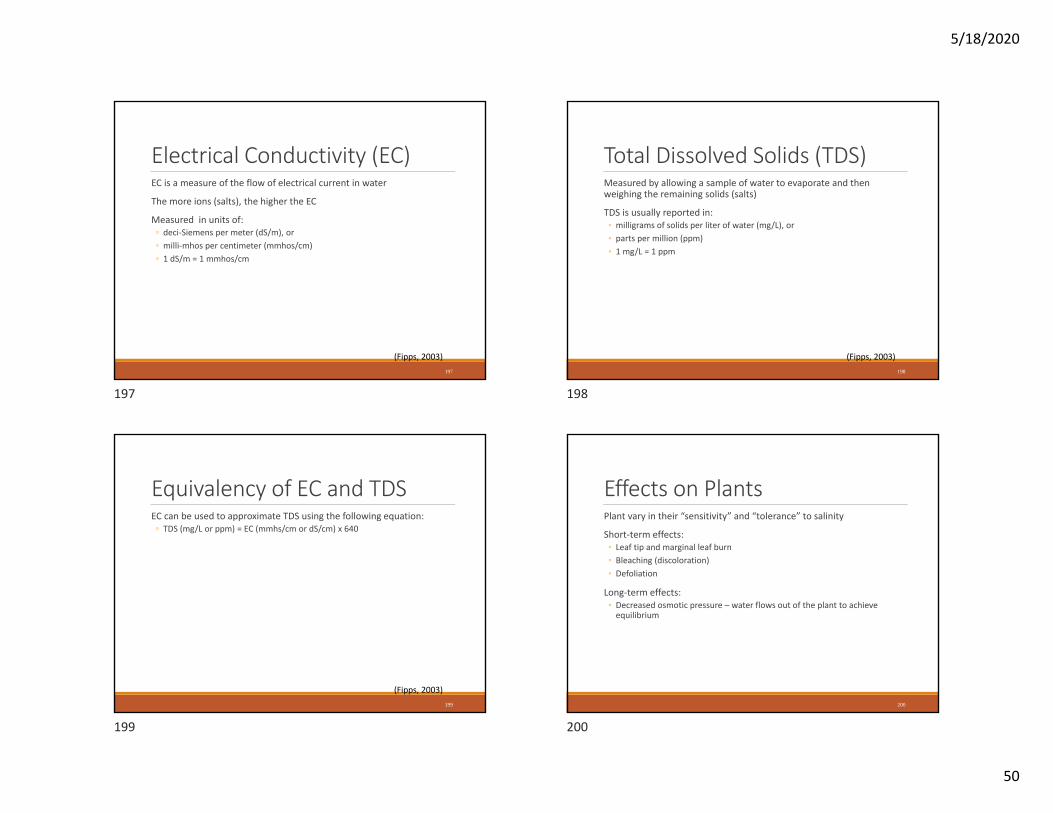
Inorganic Salts Anions (‐ charge)◦ Carbohydrates◦ Chlorides◦ Sulfates◦ Nitrates◦ Phosphates
Cations (+ charge)◦ Potassium◦ Magnesium◦ Calcium◦ Sodium
191
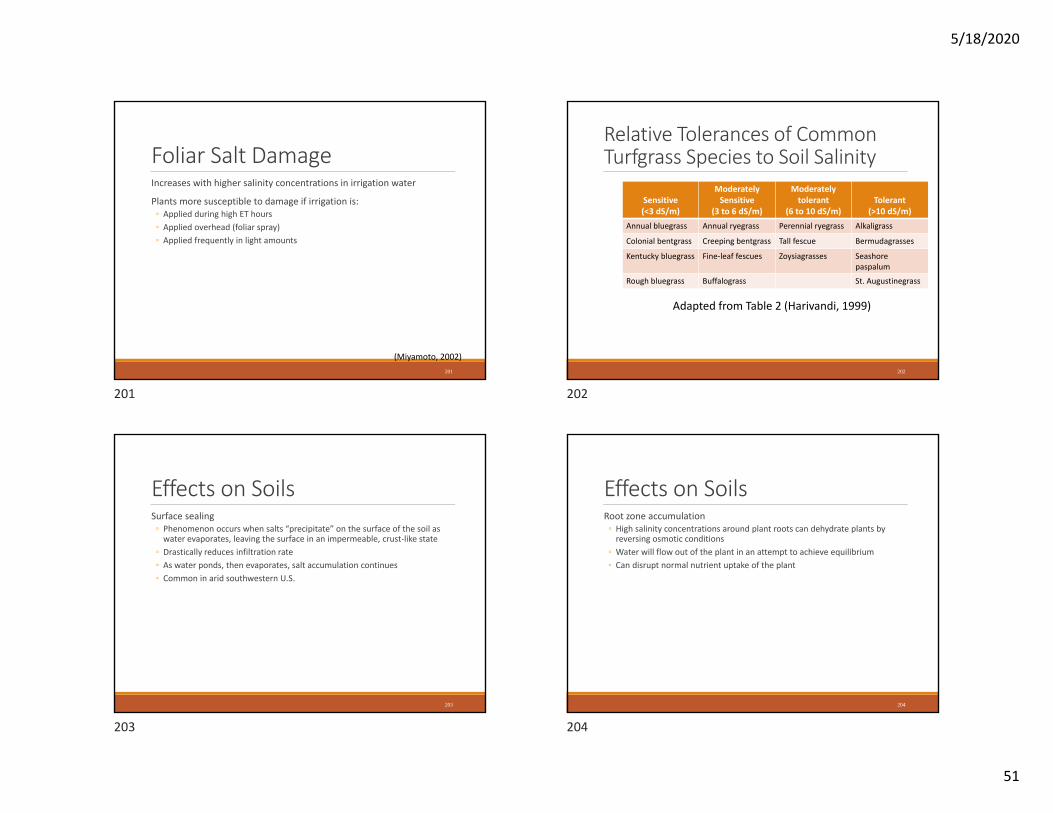
Dissolved Salts in Irrigation WatersChemical Name Symbol
Sodium chloride NaCl
Sodium sulfate Na2SO4
Calcium chloride CaCl2Calcium sulfate (gypsum)
CaSO4
Magnesium chloride MgCl2Magnesium sulfate MgSO4
Potassium chloride KCl
Potassium sulfate K2SO4
Sodium bicarbonate NaHCO3
Calcium carbonate CaCO3
Sodium carbonate Na2CO3
Borates BO‐3
Nitrates NO‐3 192
Adapted from Table 1 (Fipps, 2003)
189 190
191 192
5/18/2020
49
Salinity (continued)Water salinity is usually measured by:◦ EC (electric conductivity) or◦ TDS (total dissolved solids)
High salt concentrations:◦ Can be toxic to plants as they absorb through leaf tissue
◦ Sensitivity levels differ significantly among plants
◦ Can accumulate in surface soils◦ Surface sealing◦ Reduced infiltration and drainage◦ Reduce water uptake in plants by lowering the osmotic potential of the soil
193
(Haering, 2009)
Salinity SourcesNon‐point sources◦ Underlying geologic formations
◦ Ancient marine sediments
◦ Erosion and weathering of sedimentary rocks◦ Groundwater intrusion◦ Arid and semi‐arid regions (high evaporation)◦ Precipitation (trace amounts)◦ Agricultural and urban water runoff and sediment displacement
194
Salinity SourcesPoint sources◦ Residential
◦ Water softeners◦ Detergents and cleaners
◦ Commercial◦ Car‐wash bays (detergents)
◦ Industrial◦ Food processing (cleaning agents and preservatives)
◦ Water and wastewater treatment processes
195
SalinitySalts in treated wastewater originate from:◦ Elemental ions naturally found in water◦ Ions retained in dissolved form after separation of solids during the treatment process
◦ Salts added during the treatment process
Water salinity is usually measured by:◦ EC (electric conductivity) or◦ TDS (total dissolved solids)
196
(Haering, 2009)
193 194
195 196
5/18/2020
50
Electrical Conductivity (EC)EC is a measure of the flow of electrical current in water
The more ions (salts), the higher the EC
Measured in units of:◦ deci‐Siemens per meter (dS/m), or◦ milli‐mhos per centimeter (mmhos/cm)◦ 1 dS/m = 1 mmhos/cm
197
(Fipps, 2003)
Total Dissolved Solids (TDS)Measured by allowing a sample of water to evaporate and then weighing the remaining solids (salts)
TDS is usually reported in:◦ milligrams of solids per liter of water (mg/L), or◦ parts per million (ppm)◦ 1 mg/L = 1 ppm
198
(Fipps, 2003)
Equivalency of EC and TDSEC can be used to approximate TDS using the following equation:◦ TDS (mg/L or ppm) = EC (mmhs/cm or dS/cm) x 640
199
(Fipps, 2003)
Effects on PlantsPlant vary in their “sensitivity” and “tolerance” to salinity
Short‐term effects:◦ Leaf tip and marginal leaf burn◦ Bleaching (discoloration)◦ Defoliation
Long‐term effects:◦ Decreased osmotic pressure – water flows out of the plant to achieve equilibrium
200
197 198
199 200
5/18/2020
51
Foliar Salt DamageIncreases with higher salinity concentrations in irrigation water
Plants more susceptible to damage if irrigation is:◦ Applied during high ET hours◦ Applied overhead (foliar spray)◦ Applied frequently in light amounts
201
(Miyamoto, 2002)
Relative Tolerances of Common Turfgrass Species to Soil Salinity
Sensitive(<3 dS/m)
Moderately Sensitive
(3 to 6 dS/m)
Moderately tolerant
(6 to 10 dS/m)Tolerant
(>10 dS/m)Annual bluegrass Annual ryegrass Perennial ryegrass Alkaligrass
Colonial bentgrass Creeping bentgrass Tall fescue Bermudagrasses
Kentucky bluegrass Fine‐leaf fescues Zoysiagrasses Seashore paspalum
Rough bluegrass Buffalograss St. Augustinegrass
202
Adapted from Table 2 (Harivandi, 1999)
Effects on SoilsSurface sealing◦ Phenomenon occurs when salts “precipitate” on the surface of the soil as water evaporates, leaving the surface in an impermeable, crust‐like state
◦ Drastically reduces infiltration rate◦ As water ponds, then evaporates, salt accumulation continues◦ Common in arid southwestern U.S.
203
Effects on SoilsRoot zone accumulation◦ High salinity concentrations around plant roots can dehydrate plants by reversing osmotic conditions
◦ Water will flow out of the plant in an attempt to achieve equilibrium◦ Can disrupt normal nutrient uptake of the plant
204
201 202
203 204
5/18/2020
52
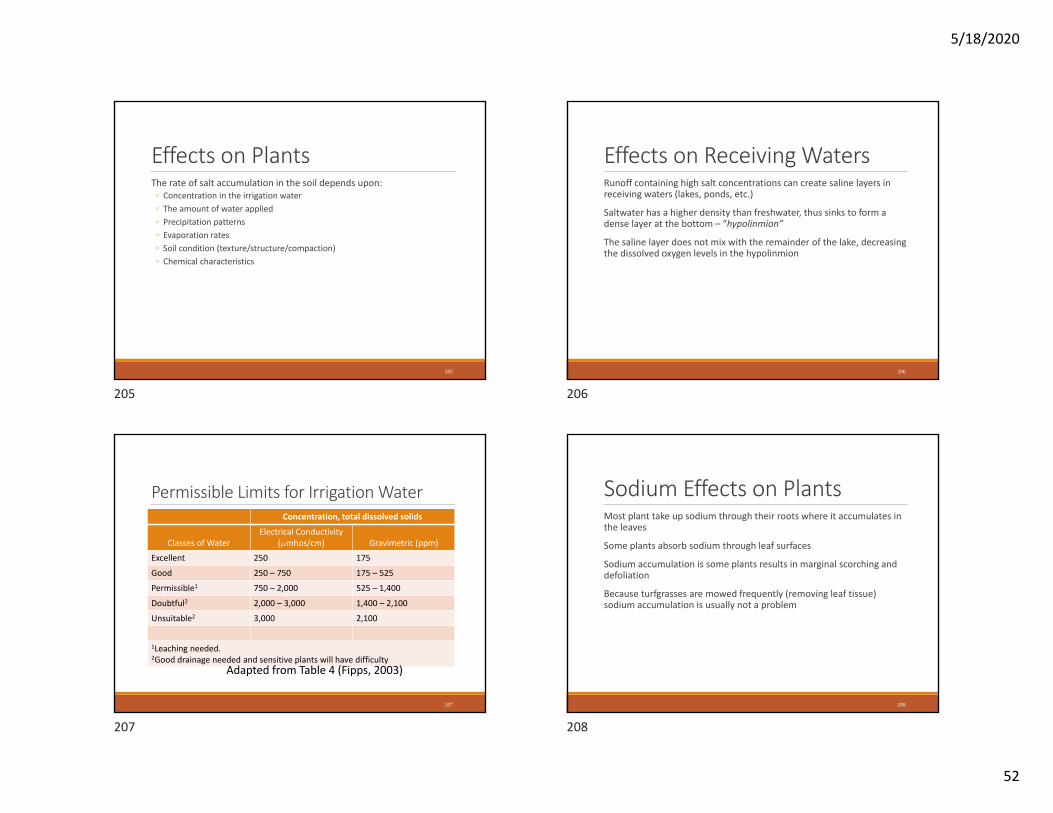
Effects on PlantsThe rate of salt accumulation in the soil depends upon:◦ Concentration in the irrigation water◦ The amount of water applied◦ Precipitation patterns◦ Evaporation rates◦ Soil condition (texture/structure/compaction)◦ Chemical characteristics
205
Effects on Receiving WatersRunoff containing high salt concentrations can create saline layers in receiving waters (lakes, ponds, etc.)
Saltwater has a higher density than freshwater, thus sinks to form a dense layer at the bottom – “hypolinmion”
The saline layer does not mix with the remainder of the lake, decreasing the dissolved oxygen levels in the hypolinmion
206
Permissible Limits for Irrigation WaterConcentration, total dissolved solids
Classes of WaterElectrical Conductivity
(Fmhos/cm) Gravimetric (ppm)
Excellent 250 175
Good 250 – 750 175 – 525
Permissible1 750 – 2,000 525 – 1,400
Doubtful2 2,000 – 3,000 1,400 – 2,100
Unsuitable2 3,000 2,100
1Leaching needed.2Good drainage needed and sensitive plants will have difficulty
207
Adapted from Table 4 (Fipps, 2003)
Sodium Effects on PlantsMost plant take up sodium through their roots where it accumulates in the leaves
Some plants absorb sodium through leaf surfaces
Sodium accumulation is some plants results in marginal scorching and defoliation
Because turfgrasses are mowed frequently (removing leaf tissue) sodium accumulation is usually not a problem
208
205 206
207 208
5/18/2020
53
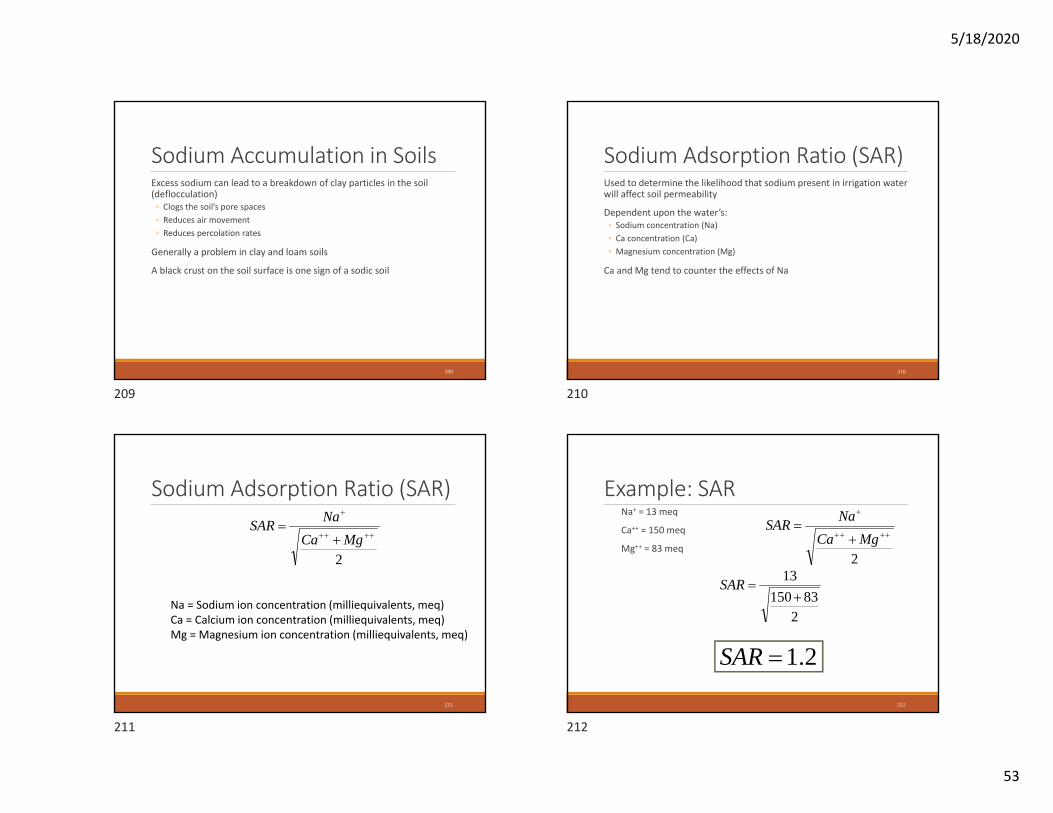
Sodium Accumulation in SoilsExcess sodium can lead to a breakdown of clay particles in the soil (deflocculation)◦ Clogs the soil’s pore spaces◦ Reduces air movement◦ Reduces percolation rates
Generally a problem in clay and loam soils
A black crust on the soil surface is one sign of a sodic soil
209
Sodium Adsorption Ratio (SAR)Used to determine the likelihood that sodium present in irrigation water will affect soil permeability
Dependent upon the water’s:◦ Sodium concentration (Na)◦ Ca concentration (Ca)◦ Magnesium concentration (Mg)
Ca and Mg tend to counter the effects of Na
210
Sodium Adsorption Ratio (SAR)
2
MgCaNaSAR
211
Na = Sodium ion concentration (milliequivalents, meq)Ca = Calcium ion concentration (milliequivalents, meq)Mg = Magnesium ion concentration (milliequivalents, meq)
Example: SARNa+ = 13 meq
Ca++ = 150 meq
Mg++ = 83 meq
212
2
MgCaNaSAR
283150
13
SAR
2.1SAR
209 210
211 212
5/18/2020
54
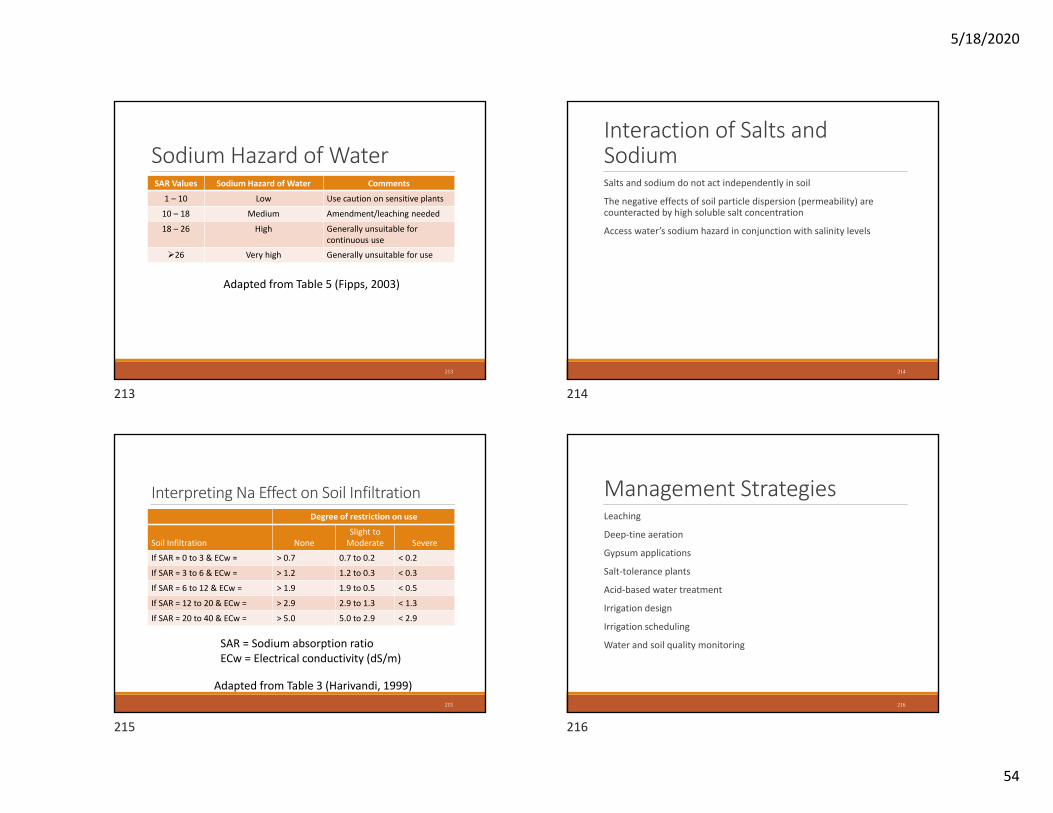
Sodium Hazard of WaterSAR Values Sodium Hazard of Water Comments
1 – 10 Low Use caution on sensitive plants
10 – 18 Medium Amendment/leaching needed
18 – 26 High Generally unsuitable for continuous use
26 Very high Generally unsuitable for use
213
Adapted from Table 5 (Fipps, 2003)
Interaction of Salts and SodiumSalts and sodium do not act independently in soil
The negative effects of soil particle dispersion (permeability) are counteracted by high soluble salt concentration
Access water’s sodium hazard in conjunction with salinity levels
214
Interpreting Na Effect on Soil InfiltrationDegree of restriction on use
Soil Infiltration NoneSlight to Moderate Severe
If SAR = 0 to 3 & ECw = > 0.7 0.7 to 0.2 < 0.2
If SAR = 3 to 6 & ECw = > 1.2 1.2 to 0.3 < 0.3
If SAR = 6 to 12 & ECw = > 1.9 1.9 to 0.5 < 0.5
If SAR = 12 to 20 & ECw = > 2.9 2.9 to 1.3 < 1.3
If SAR = 20 to 40 & ECw = > 5.0 5.0 to 2.9 < 2.9
215
SAR = Sodium absorption ratioECw = Electrical conductivity (dS/m)
Adapted from Table 3 (Harivandi, 1999)
Management StrategiesLeaching
Deep‐tine aeration
Gypsum applications
Salt‐tolerance plants
Acid‐based water treatment
Irrigation design
Irrigation scheduling
Water and soil quality monitoring
216
213 214
215 216
5/18/2020
55
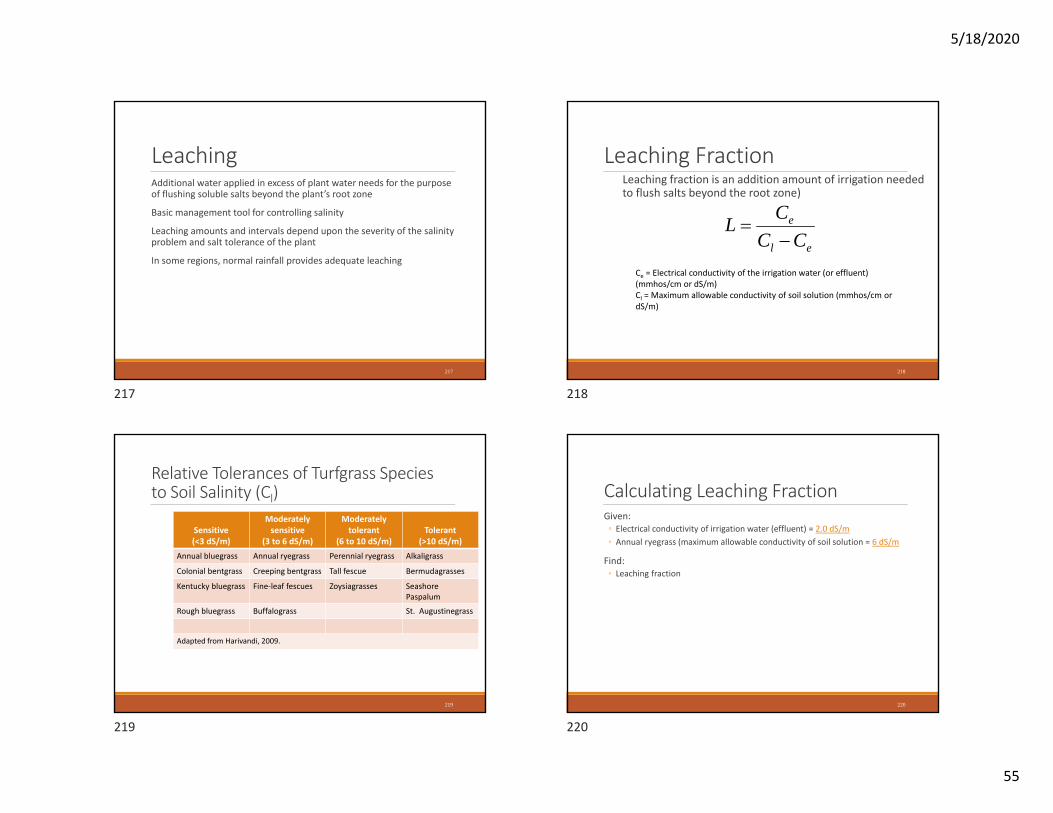
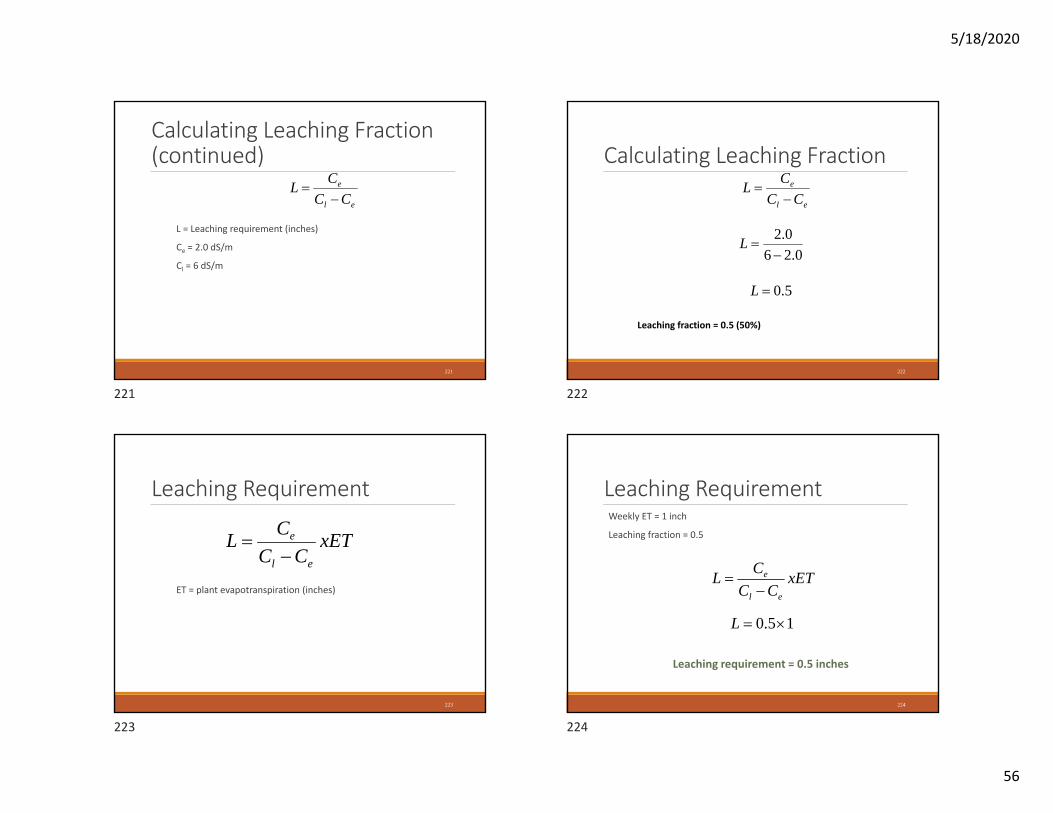
LeachingAdditional water applied in excess of plant water needs for the purpose of flushing soluble salts beyond the plant’s root zone
Basic management tool for controlling salinity
Leaching amounts and intervals depend upon the severity of the salinity problem and salt tolerance of the plant
In some regions, normal rainfall provides adequate leaching
217
Leaching FractionLeaching fraction is an addition amount of irrigation needed to flush salts beyond the root zone)
218
el
e
CCCL
Ce = Electrical conductivity of the irrigation water (or effluent) (mmhos/cm or dS/m)Cl = Maximum allowable conductivity of soil solution (mmhos/cm or dS/m)
Relative Tolerances of Turfgrass Species to Soil Salinity (Cl)
Sensitive(<3 dS/m)
Moderately sensitive
(3 to 6 dS/m)
Moderately tolerant
(6 to 10 dS/m)Tolerant
(>10 dS/m)Annual bluegrass Annual ryegrass Perennial ryegrass Alkaligrass
Colonial bentgrass Creeping bentgrass Tall fescue Bermudagrasses
Kentucky bluegrass Fine‐leaf fescues Zoysiagrasses Seashore Paspalum
Rough bluegrass Buffalograss St. Augustinegrass
Adapted from Harivandi, 2009.
219
Calculating Leaching FractionGiven:◦ Electrical conductivity of irrigation water (effluent) = 2.0 dS/m◦ Annual ryegrass (maximum allowable conductivity of soil solution = 6 dS/m
Find:◦ Leaching fraction
220
217 218
219 220
5/18/2020
56
Calculating Leaching Fraction (continued)
L = Leaching requirement (inches)
Ce = 2.0 dS/m
Cl = 6 dS/m
221
el
e
CCCL
Calculating Leaching Fraction
Leaching fraction = 0.5 (50%)
222
el
e
CCCL
0.260.2
L
5.0L
Leaching Requirement
ET = plant evapotranspiration (inches)
223
xETCC
CLel
e
Leaching RequirementWeekly ET = 1 inch
Leaching fraction = 0.5
224
xETCC
CLel
e
15.0 L
Leaching requirement = 0.5 inches
221 222
223 224
5/18/2020
57
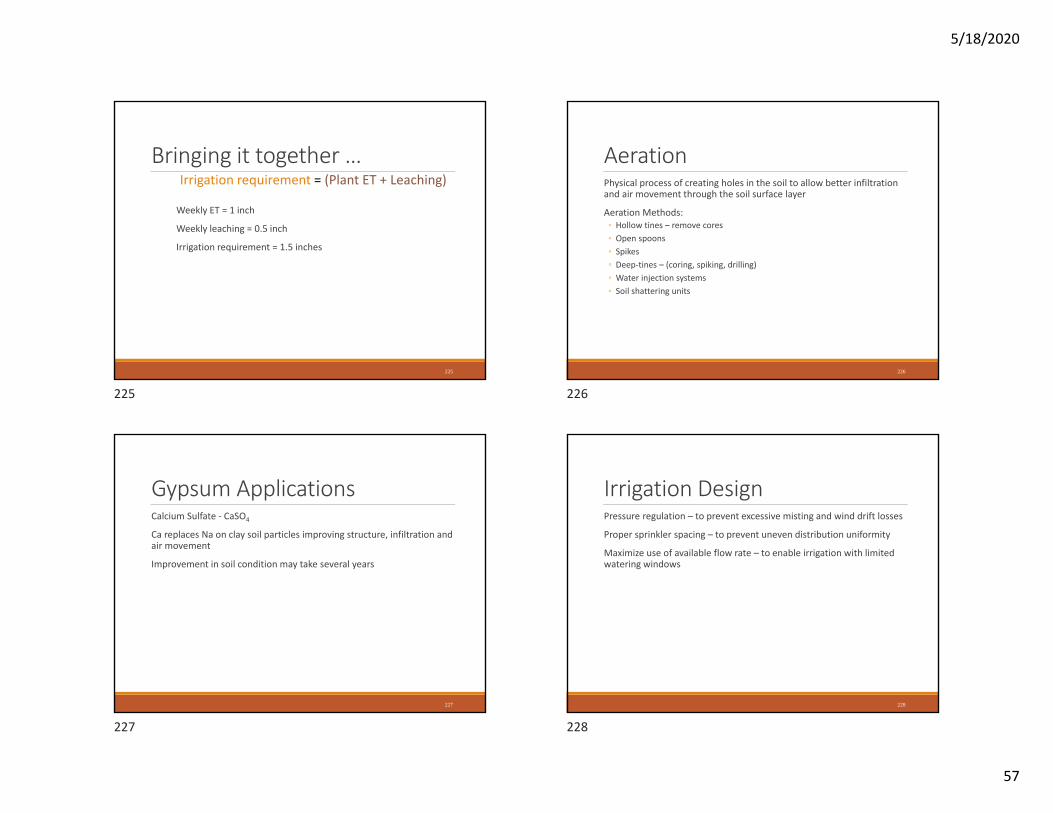
Bringing it together …
Weekly ET = 1 inch
Weekly leaching = 0.5 inch
Irrigation requirement = 1.5 inches
225
Irrigation requirement = (Plant ET + Leaching)AerationPhysical process of creating holes in the soil to allow better infiltration and air movement through the soil surface layer
Aeration Methods:◦ Hollow tines – remove cores◦ Open spoons◦ Spikes◦ Deep‐tines – (coring, spiking, drilling)◦ Water injection systems◦ Soil shattering units
226
Gypsum ApplicationsCalcium Sulfate ‐ CaSO4
Ca replaces Na on clay soil particles improving structure, infiltration and air movement
Improvement in soil condition may take several years
227
Irrigation DesignPressure regulation – to prevent excessive misting and wind drift losses
Proper sprinkler spacing – to prevent uneven distribution uniformity
Maximize use of available flow rate – to enable irrigation with limited watering windows
228
225 226
227 228
5/18/2020
58
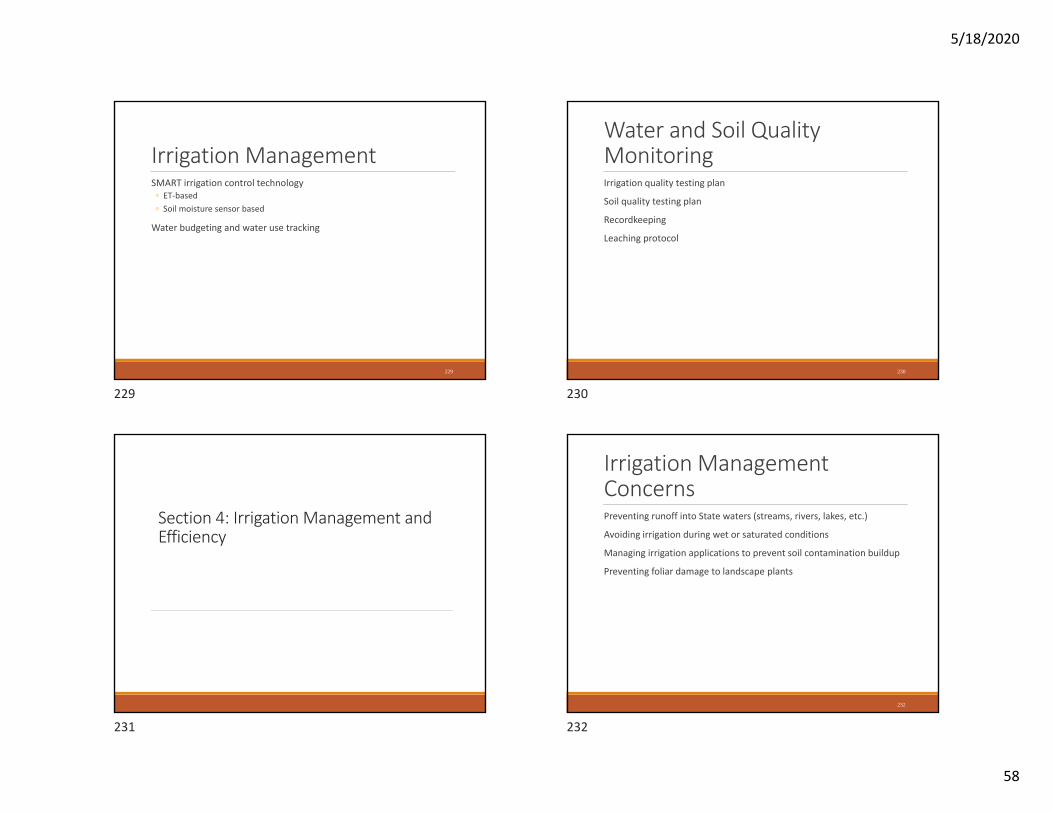
Irrigation ManagementSMART irrigation control technology◦ ET‐based◦ Soil moisture sensor based
Water budgeting and water use tracking
229
Water and Soil Quality MonitoringIrrigation quality testing plan
Soil quality testing plan
Recordkeeping
Leaching protocol
230
Section 4: Irrigation Management and Efficiency
Irrigation Management ConcernsPreventing runoff into State waters (streams, rivers, lakes, etc.)
Avoiding irrigation during wet or saturated conditions
Managing irrigation applications to prevent soil contamination buildup
Preventing foliar damage to landscape plants
232
229 230
231 232
5/18/2020
59
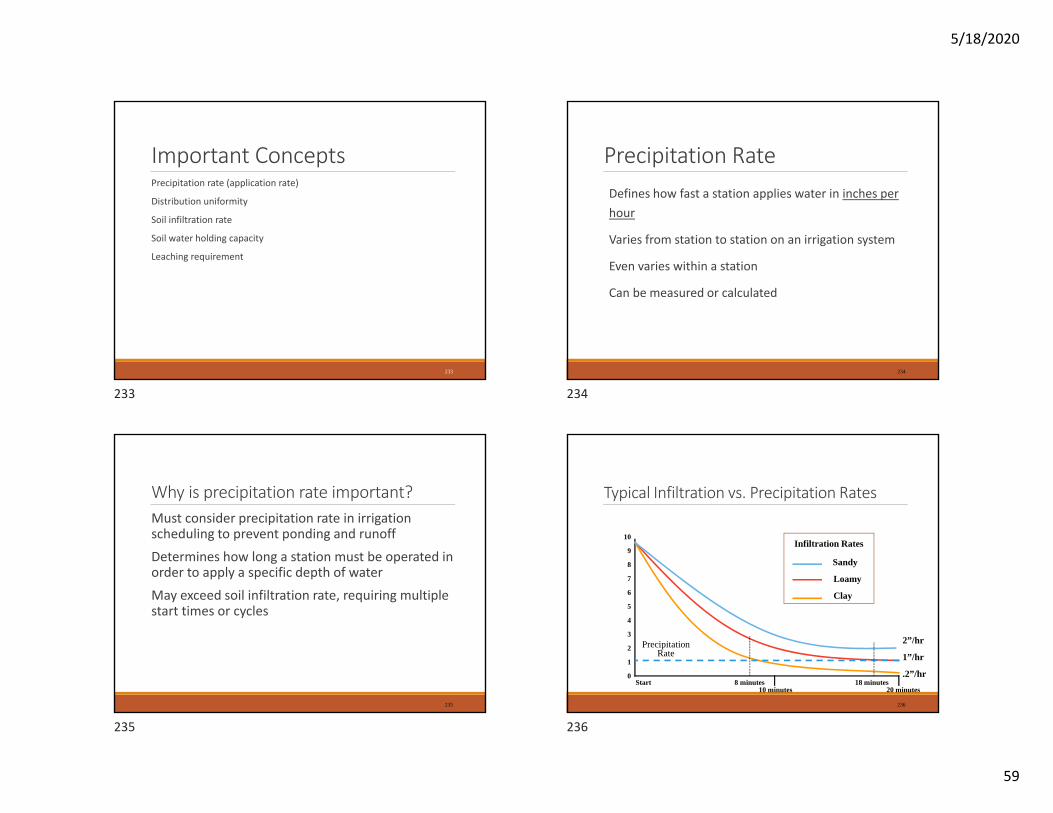
Important ConceptsPrecipitation rate (application rate)
Distribution uniformity
Soil infiltration rate
Soil water holding capacity
Leaching requirement
233
Precipitation RateDefines how fast a station applies water in inches per hour
Varies from station to station on an irrigation system
Even varies within a station
Can be measured or calculated
234
Why is precipitation rate important?Must consider precipitation rate in irrigation scheduling to prevent ponding and runoff
Determines how long a station must be operated in order to apply a specific depth of water
May exceed soil infiltration rate, requiring multiple start times or cycles
235
Typical Infiltration vs. Precipitation Rates
236
10
9
8
7
6
5
4
3
2
1
0Start 8 minutes 18 minutes
10 minutes 20 minutes
Infiltration Rates
Sandy
Loamy
Clay
PrecipitationRate
2”/hr
1”/hr
.2”/hr
233 234
235 236
5/18/2020
60
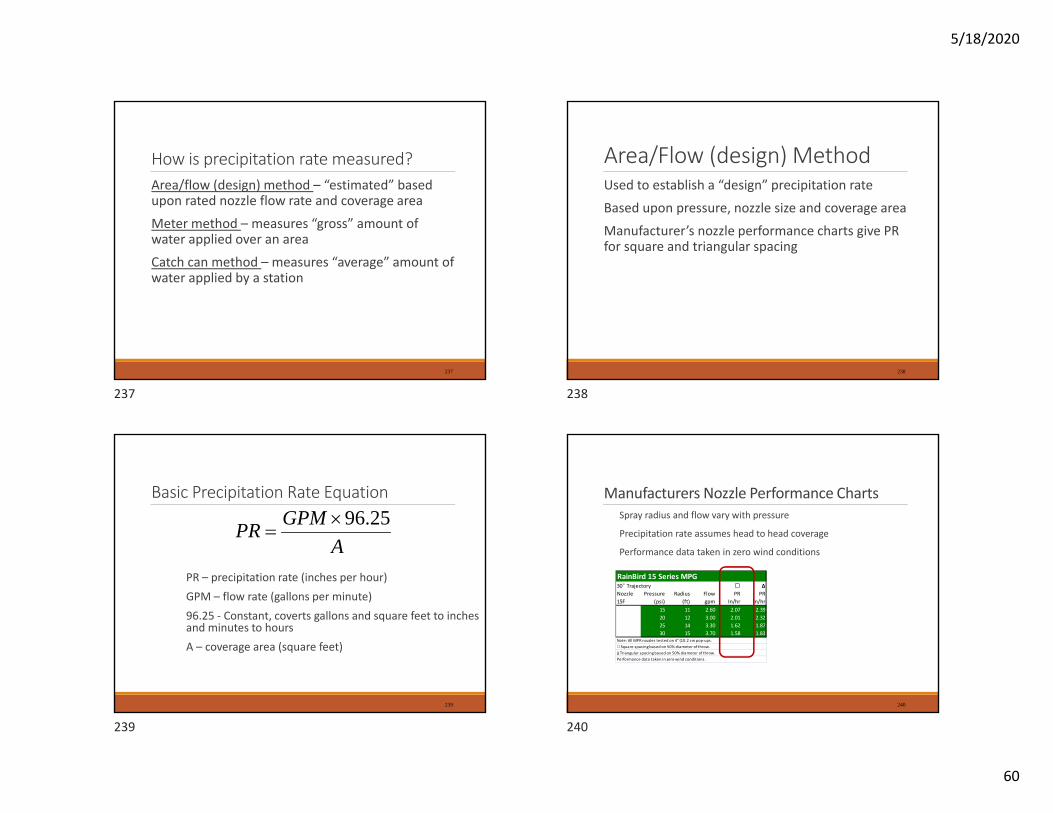
How is precipitation rate measured?Area/flow (design) method – “estimated” based upon rated nozzle flow rate and coverage area
Meter method – measures “gross” amount of water applied over an area
Catch can method – measures “average” amount of water applied by a station
237
Area/Flow (design) MethodUsed to establish a “design” precipitation rate
Based upon pressure, nozzle size and coverage area
Manufacturer’s nozzle performance charts give PR for square and triangular spacing
238
Basic Precipitation Rate Equation
AGPMPR 25.96
239
PR – precipitation rate (inches per hour)GPM – flow rate (gallons per minute)96.25 ‐ Constant, coverts gallons and square feet to inches and minutes to hoursA – coverage area (square feet)
Manufacturers Nozzle Performance Charts
RainBird 15 Series MPG30E Trajectory ~ ∆Nozzle Pressure Radius Flow PR PR15F (psi) (ft) gpm In/hr In/hr
15 11 2.60 2.07 2.3920 12 3.00 2.01 2.3225 14 3.30 1.62 1.8730 15 3.70 1.58 1.83
Note: All MPR nozzles tested on 4" (10.2 cm pop‐ups.~ Square spacing based on 50% diameter of throw.∆ Triangular spacing based on 50% diameter of throw.Performance data taken in zero wind conditions.
Spray radius and flow vary with pressure
Precipitation rate assumes head to head coverage
Performance data taken in zero wind conditions
240
237 238
239 240
5/18/2020
61
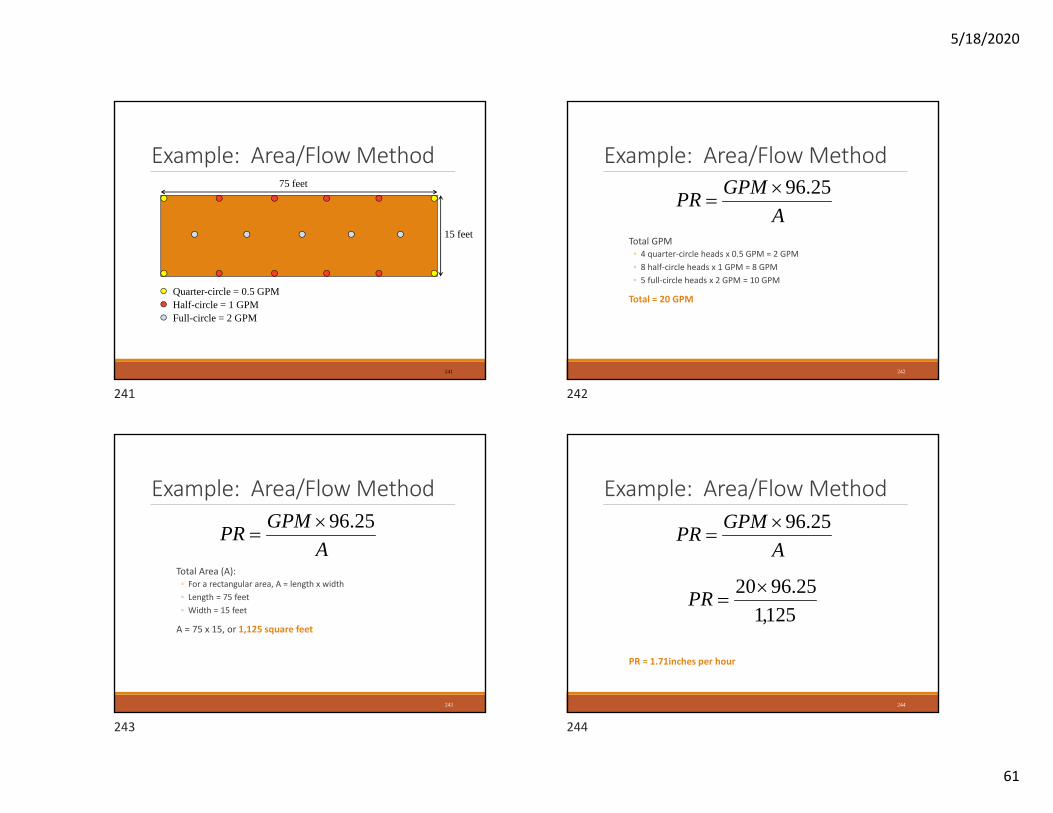
Example: Area/Flow Method
241
Quarter-circle = 0.5 GPMHalf-circle = 1 GPMFull-circle = 2 GPM
15 feet
75 feet
Example: Area/Flow Method
Total GPM◦ 4 quarter‐circle heads x 0.5 GPM = 2 GPM◦ 8 half‐circle heads x 1 GPM = 8 GPM◦ 5 full‐circle heads x 2 GPM = 10 GPM
Total = 20 GPM
242
AGPMPR 25.96
Example: Area/Flow Method
Total Area (A):◦ For a rectangular area, A = length x width◦ Length = 75 feet◦ Width = 15 feet
A = 75 x 15, or 1,125 square feet
243
AGPMPR 25.96
Example: Area/Flow Method
PR = 1.71inches per hour
244
AGPMPR 25.96
125,125.9620
PR
241 242
243 244
5/18/2020
62
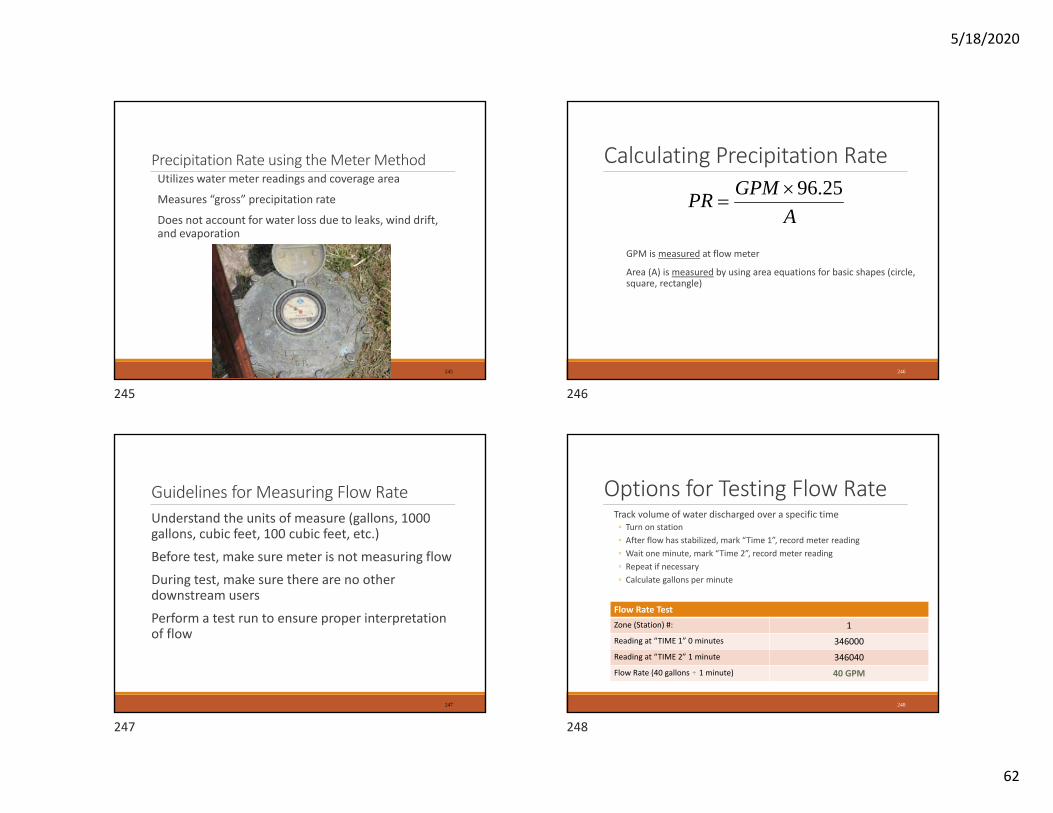
Precipitation Rate using the Meter MethodUtilizes water meter readings and coverage area
Measures “gross” precipitation rate
Does not account for water loss due to leaks, wind drift, and evaporation
245
Calculating Precipitation Rate
GPM is measured at flow meter
Area (A) is measured by using area equations for basic shapes (circle, square, rectangle)
246
AGPMPR 25.96
Guidelines for Measuring Flow RateUnderstand the units of measure (gallons, 1000 gallons, cubic feet, 100 cubic feet, etc.)
Before test, make sure meter is not measuring flow
During test, make sure there are no other downstream users
Perform a test run to ensure proper interpretation of flow
247
Options for Testing Flow RateTrack volume of water discharged over a specific time◦ Turn on station◦ After flow has stabilized, mark “Time 1”, record meter reading◦ Wait one minute, mark “Time 2”, record meter reading◦ Repeat if necessary◦ Calculate gallons per minute
248
Flow Rate TestZone (Station) #: 1Reading at “TIME 1” 0 minutes 346000Reading at “TIME 2” 1 minute 346040Flow Rate (40 gallons ) 1 minute) 40 GPM
245 246
247 248
5/18/2020
63
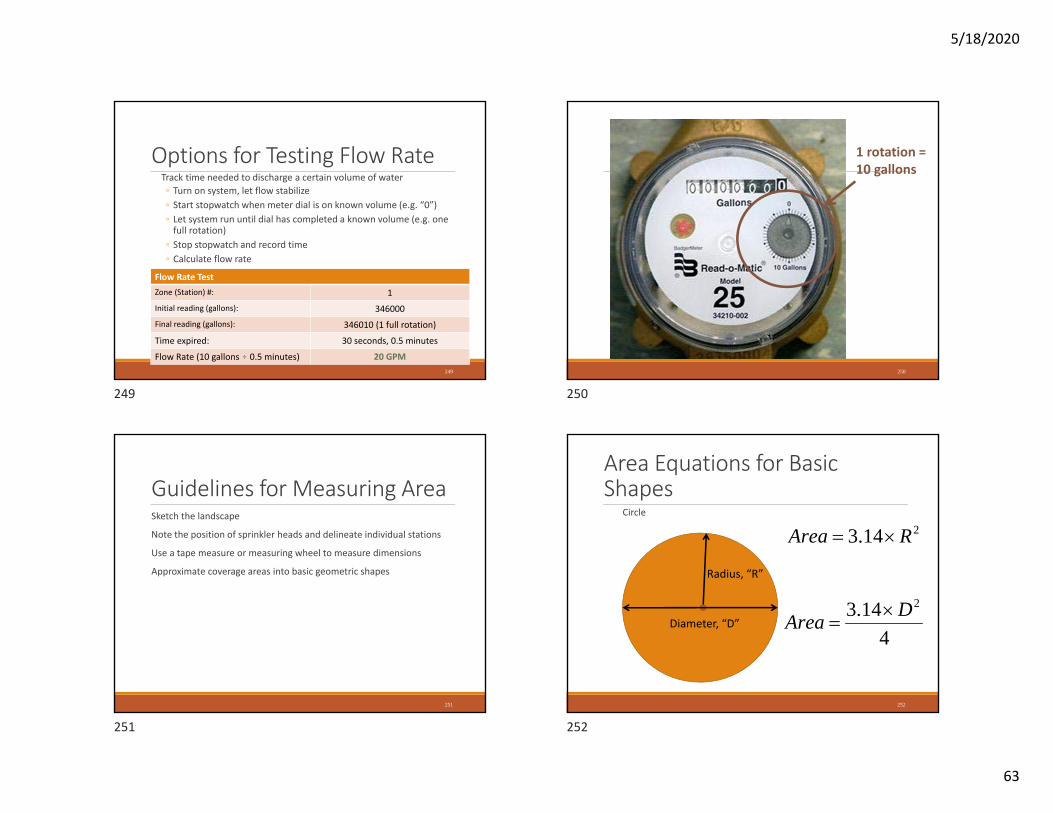
Options for Testing Flow RateTrack time needed to discharge a certain volume of water◦ Turn on system, let flow stabilize◦ Start stopwatch when meter dial is on known volume (e.g. “0”)◦ Let system run until dial has completed a known volume (e.g. one full rotation)
◦ Stop stopwatch and record time◦ Calculate flow rate
249
Flow Rate TestZone (Station) #: 1Initial reading (gallons): 346000Final reading (gallons): 346010 (1 full rotation)
Time expired: 30 seconds, 0.5 minutes
Flow Rate (10 gallons ) 0.5 minutes) 20 GPM250
1 rotation = 10 gallons
Guidelines for Measuring AreaSketch the landscape
Note the position of sprinkler heads and delineate individual stations
Use a tape measure or measuring wheel to measure dimensions
Approximate coverage areas into basic geometric shapes
251
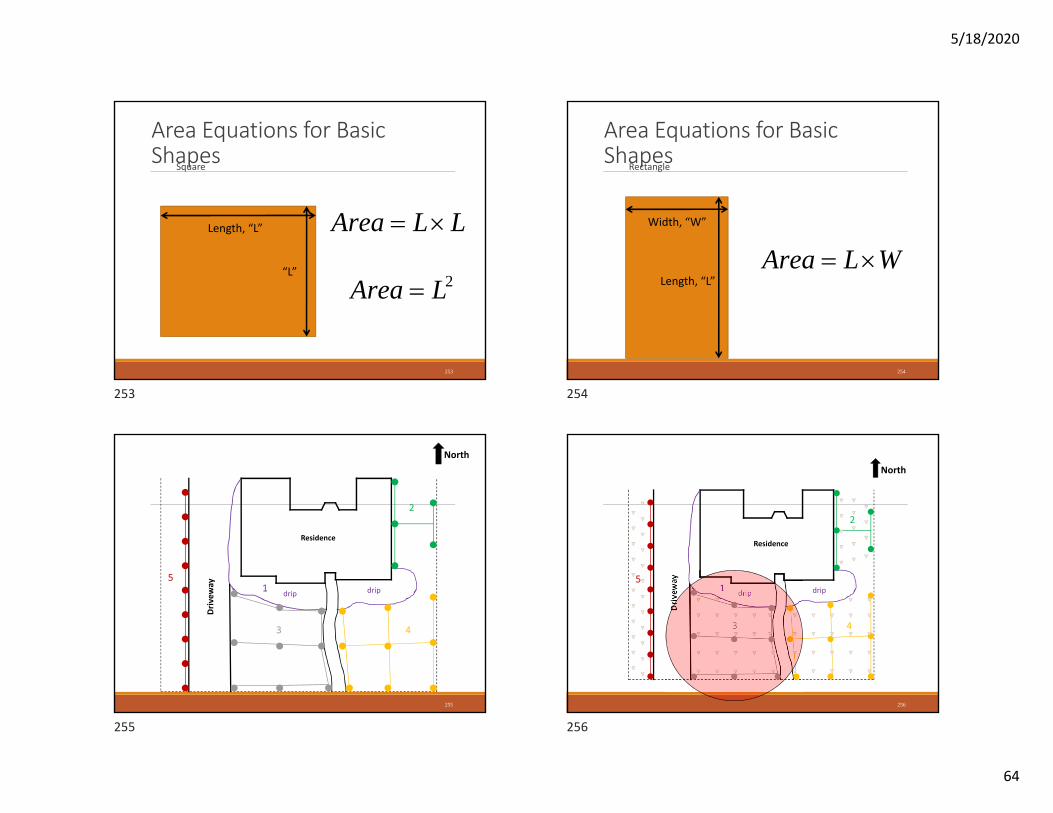
Area Equations for Basic Shapes
Circle
252
Radius, “R”
Diameter, “D”
214.3 RArea
414.3 2DArea
249 250
251 252
5/18/2020
64
Area Equations for Basic Shapes
Square
253
Length, “L”
“L”
LLArea
2LArea
Area Equations for Basic Shapes
Rectangle
254
Width, “W”
Length, “L”WLArea
255
Residence
Driv
eway
drip drip1
2
3 4
5
North
256
Residence
Driv
eway
drip1
4
5drip
3
2
North
253 254
255 256
5/18/2020
65
257
drip
Station 3
258
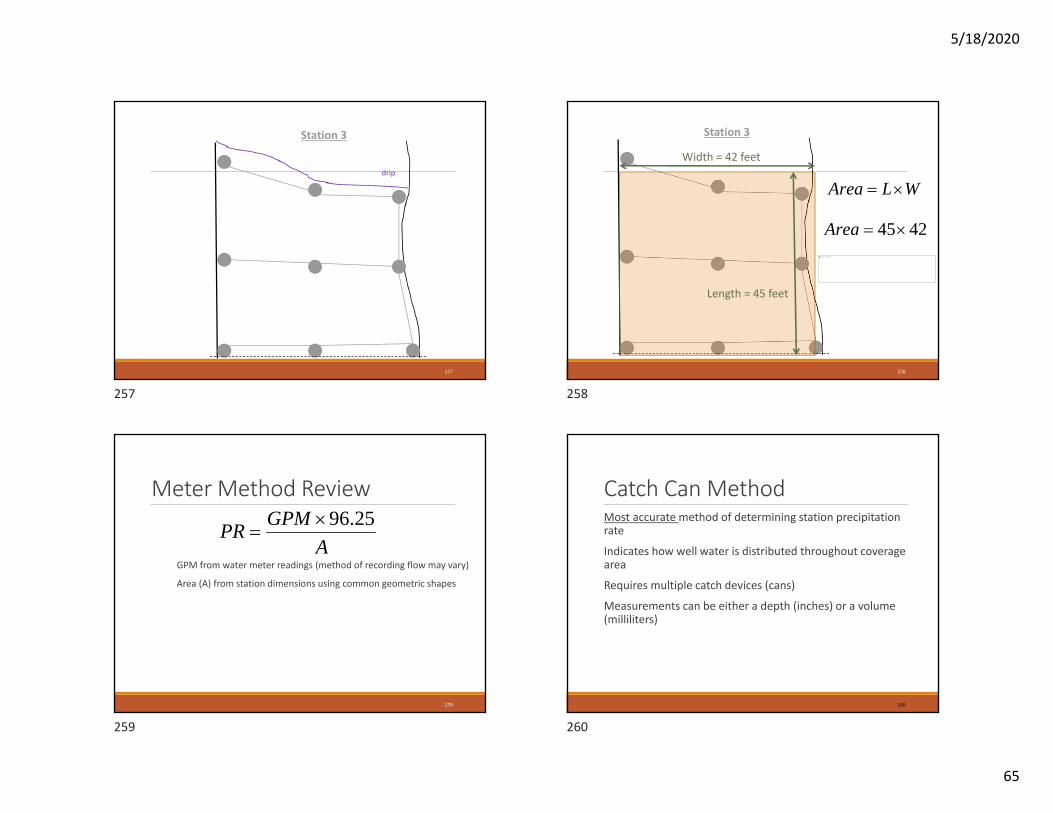
Station 3
Width = 42 feet
Length = 45 feet
WLArea
4245AreaThe picture can't be displayed.
Meter Method Review
GPM from water meter readings (method of recording flow may vary)
Area (A) from station dimensions using common geometric shapes
259
AGPMPR 25.96
Catch Can MethodMost accurate method of determining station precipitation rate
Indicates how well water is distributed throughout coverage area
Requires multiple catch devices (cans)
Measurements can be either a depth (inches) or a volume (milliliters)
260
257 258
259 260
5/18/2020
66
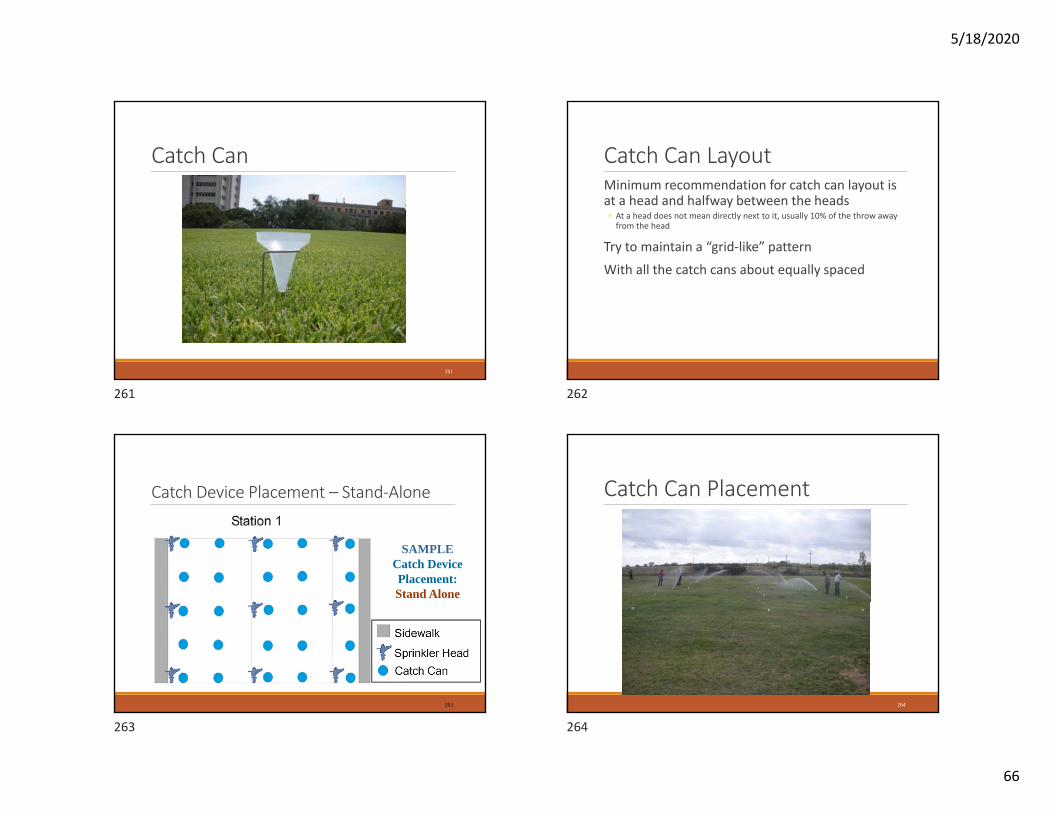
Catch Can
261
Catch Can LayoutMinimum recommendation for catch can layout is at a head and halfway between the heads◦ At a head does not mean directly next to it, usually 10% of the throw away from the head
Try to maintain a “grid‐like” pattern
With all the catch cans about equally spaced
Catch Device Placement – Stand‐Alone
263
SAMPLECatch DevicePlacement:Stand Alone
Catch Can Placement
264
261 262
263 264
5/18/2020
67
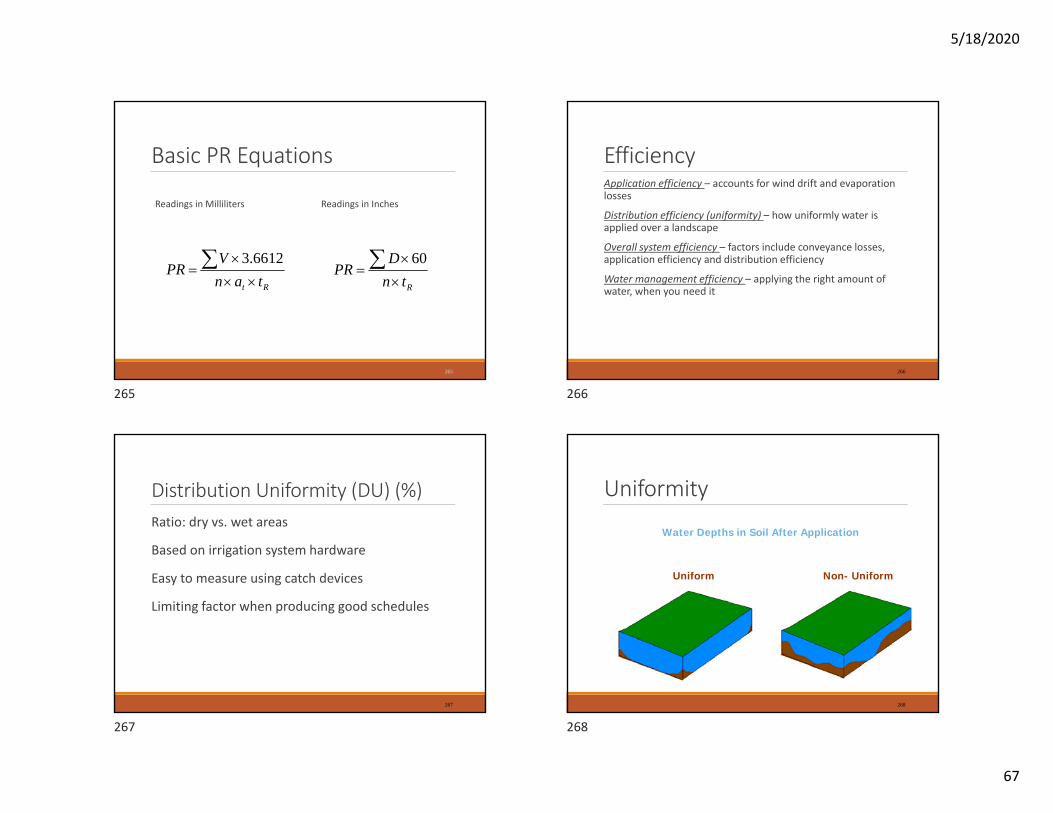
Basic PR Equations
Readings in Milliliters Readings in Inches
265
Rt tanV
PR
6612.3
RtnD
PR
60
EfficiencyApplication efficiency – accounts for wind drift and evaporation losses
Distribution efficiency (uniformity) – how uniformly water is applied over a landscape
Overall system efficiency – factors include conveyance losses, application efficiency and distribution efficiency
Water management efficiency – applying the right amount of water, when you need it
266
Distribution Uniformity (DU) (%)Ratio: dry vs. wet areas
Based on irrigation system hardware
Easy to measure using catch devices
Limiting factor when producing good schedules
267
Uniformity
268
Water Depths in Soil After Application
Uniform Non- Uniform
265 266
267 268
5/18/2020
68
What factors determine DU?Spray distribution profile of individual nozzles
Wind distortion at the time of operation
Spacing patterns and distance between sprinklers
Operating pressure
Speed of rotation
Hardware problems (i.e., clogged nozzles, head misalignment, and sprinkler head rotation problems)
269
Why is distribution uniformity important?Systems with poor DU:◦ must be operated longer to ensure “dry” areas get enough water (this may lead to ponding and runoff in some areas)
◦ lead to plant stress from over‐ and under‐watering◦ wastes water (must overwater some areas to ensure all areas get enough water)
Poor DU can lead to isolated areas of salt accumulation
270
What can be done to minimize DU problems?Ensure matched precipitation rate nozzles within individual stations.
Use proper sprinkler spacing and operating pressure according to manufacturers’ product recommendations
Utilize and maintain proper nozzle filtration
Periodic inspection of system performance
271
Soil Infiltration RateThe rate at which water enters the soil surface
Influenced by:◦ Antecedent moisture conditions (dryer soils tend to accept water more rapidly than wet soils, with exceptions)
◦ Soil type/texture/structure◦ Vegetative surface conditions◦ Surface salinity concentration (sealing effect)
272
269 270
271 272
5/18/2020
69
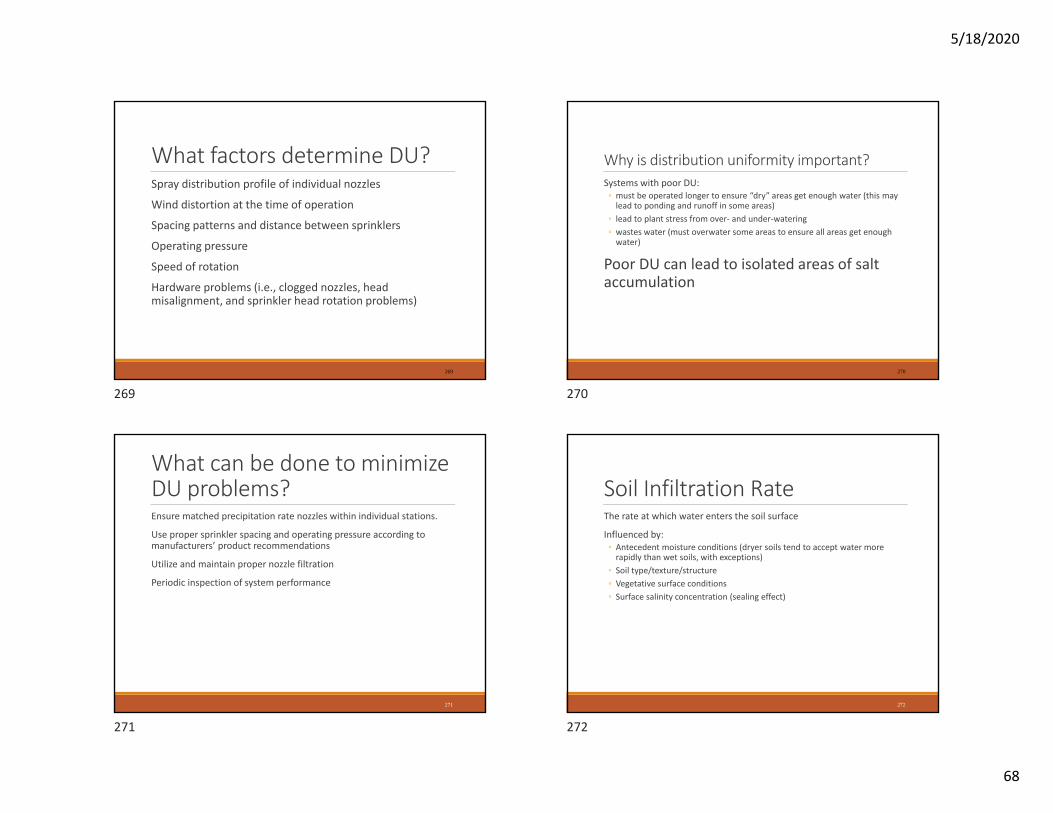
Typical Infiltration vs. Precipitation Rates
273
10
9
8
7
6
5
4
3
2
1
0Start 8 minutes 18 minutes
10 minutes 20 minutes
Infiltration Rates
Sandy
Loamy
Clay
PrecipitationRate
2”/hr
1”/hr
.2”/hr
Infiltration Rate ConcernsSandy soils (high infiltration rates)◦ Must be careful not to apply too much water that can percolate below the root zone)
Clay soils (low infiltration rates)◦ Must manage irrigation cycles to prevent ponding and surface runoff
Infiltration rates may change considerable over time with compaction and salt accumulation without leaching
274
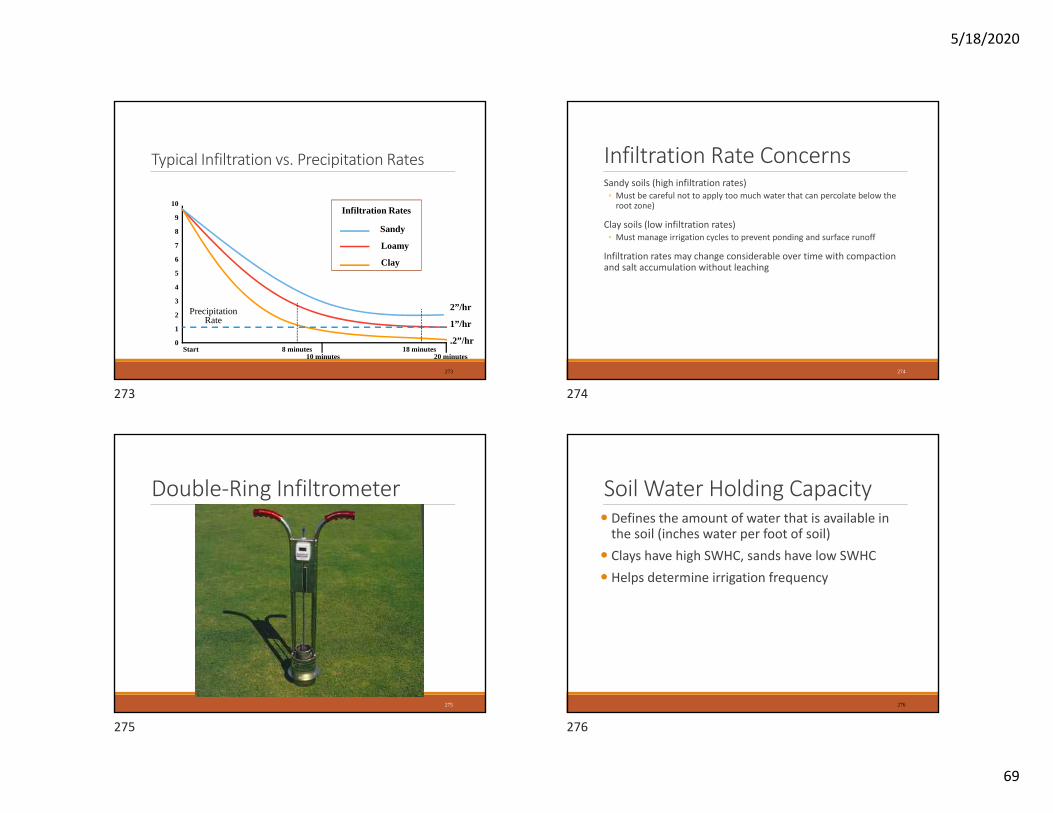
Double‐Ring Infiltrometer
275
Soil Water Holding Capacity Defines the amount of water that is available in the soil (inches water per foot of soil)
Clays have high SWHC, sands have low SWHC Helps determine irrigation frequency
276
273 274
275 276
5/18/2020
70
277 278
279
Typical Water Holding Capacity(inches of water per foot of soil)
Soil Texture
At Field Capacity
At Permanent
Wilting Point
Soil Water Holding Capacity
Plant Available Water
(@ MAD = 50%)
Sand 1.0-1.4 0.2-0.4 0.8-1.0 0.45Sandy Loam
1.9-2.3 0.6-0.8 1.3-1.5 0.70
Loam 2.5-2.9 0.9-1.1 1.6-1.8 0.85Silt Loam 2.7-3.1 1.0-1.2 1.7-1.9 0.90Clay Loam 3.0-3.4 1.1-1.3 1.9-2.1 1.00Clay 3.5-3.9 1.5-1.7 2.0-2.2 1.05
280
277 278
279 280
5/18/2020
71
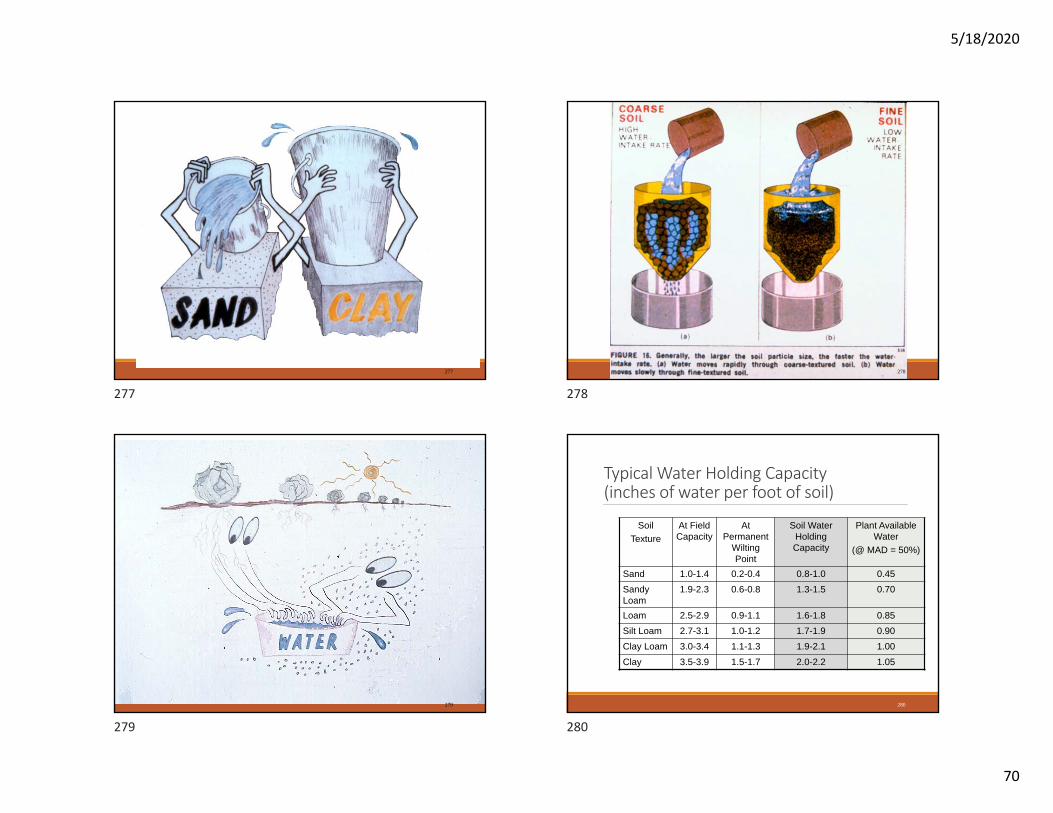
Effective Root ZoneThe depth containing about 80% of the total root mass
Excludes “tap” and “feeder” roots
Easily measured with a soil probe
281
Managed Allowable Depletion (MAD)Percentage of water within the effective root depth allowed to deplete between irrigation events
Influences irrigation frequency
50% MAD is typically used for irrigation scheduling purposes
283
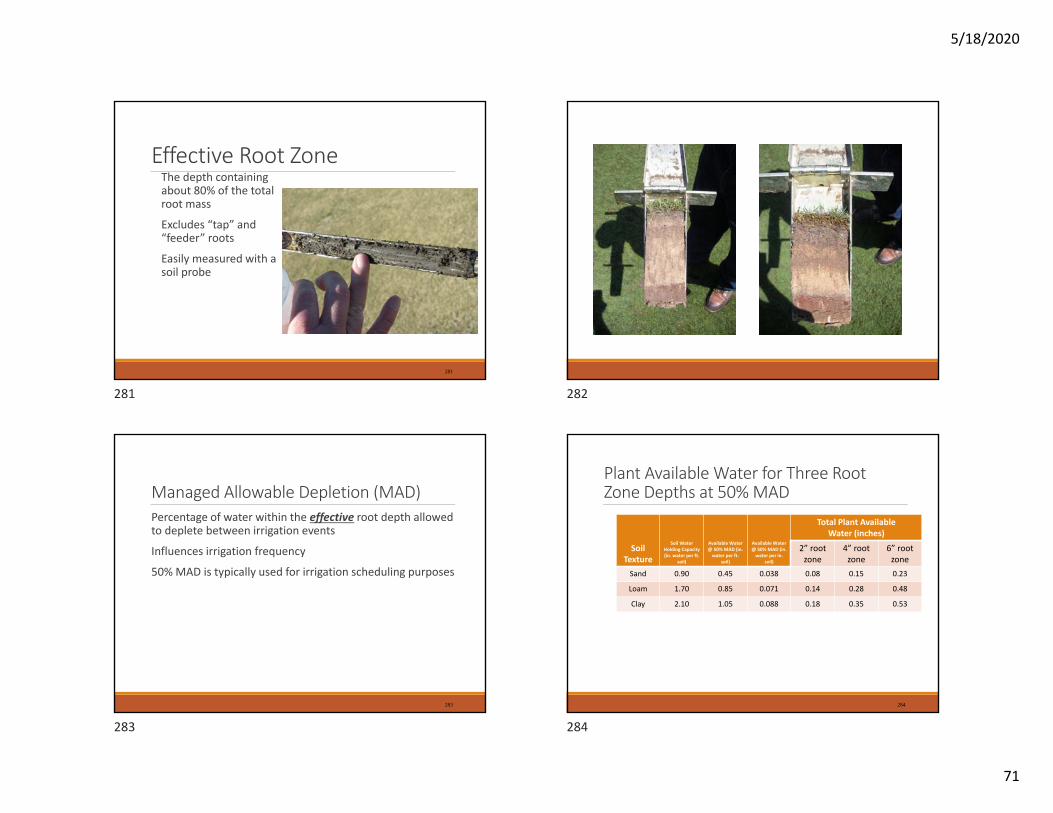
Plant Available Water for Three Root Zone Depths at 50% MAD
SoilTexture
Soil Water Holding Capacity (in. water per ft.
soil)
Available Water @ 50% MAD (in. water per ft.
soil)
Available Water@ 50% MAD (in. water per in.
soil)
Total Plant AvailableWater (inches)
2” root zone
4” root zone
6” root zone
Sand 0.90 0.45 0.038 0.08 0.15 0.23
Loam 1.70 0.85 0.071 0.14 0.28 0.48
Clay 2.10 1.05 0.088 0.18 0.35 0.53
284
281 282
283 284
5/18/2020
72
Factors that Influence Soil‐Water Holding CapacitiesSoil type/texture
Soil structure
Effective root zone depth
Excessive sodium concentration (deflocculates clay soil particles)
285
Irrigation Scheduling FactorsPlant water requirements◦ Seasonal evapotranspiration rates◦ Microclimate adjustments
Soil and root zone limitations◦ Soil water holding capacity◦ Infiltration rate
Sprinkler system performance◦ Precipitation rate
Leaching requirements◦ May be regular or periodic depending on rainfall patterns
286
Evapotranspiration (ET)Refers to the total amount of water used by plants
Includes water evaporated from the soil and plant surface AND water transpired by the plant
Different plants have different ET rates
Most plants can withstand a ET deficit (or allowable stress) from its maximum use and still maintain acceptable quality
287
Reference Evapotranspiration (ETo)Refers to the amount of water used by a cool‐season grass, growing 4 inches tall under well‐watered conditions
Used as a “reference” to which the ET for all other plant types is related.
For example, the ET for common bermudagrass is approximately 60% of that for the cool‐season reference grass◦ I.e. ET = 0.60 x ETo, for this example
288
285 286
287 288
5/18/2020
73
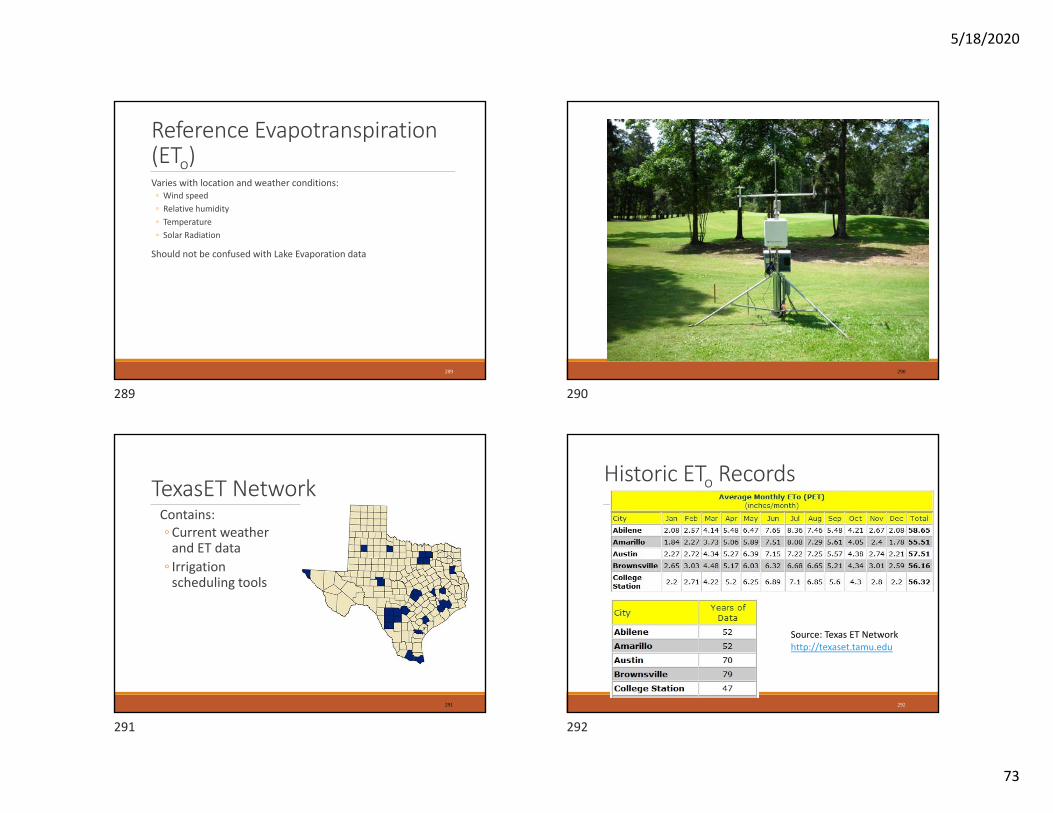
Reference Evapotranspiration (ETo)Varies with location and weather conditions:◦ Wind speed◦ Relative humidity◦ Temperature◦ Solar Radiation
Should not be confused with Lake Evaporation data
289 290
TexasET NetworkContains:◦Current weather and ET data
◦ Irrigation scheduling tools
291
Historic ETo Records
292
Source: Texas ET Networkhttp://texaset.tamu.edu
289 290
291 292
5/18/2020
74
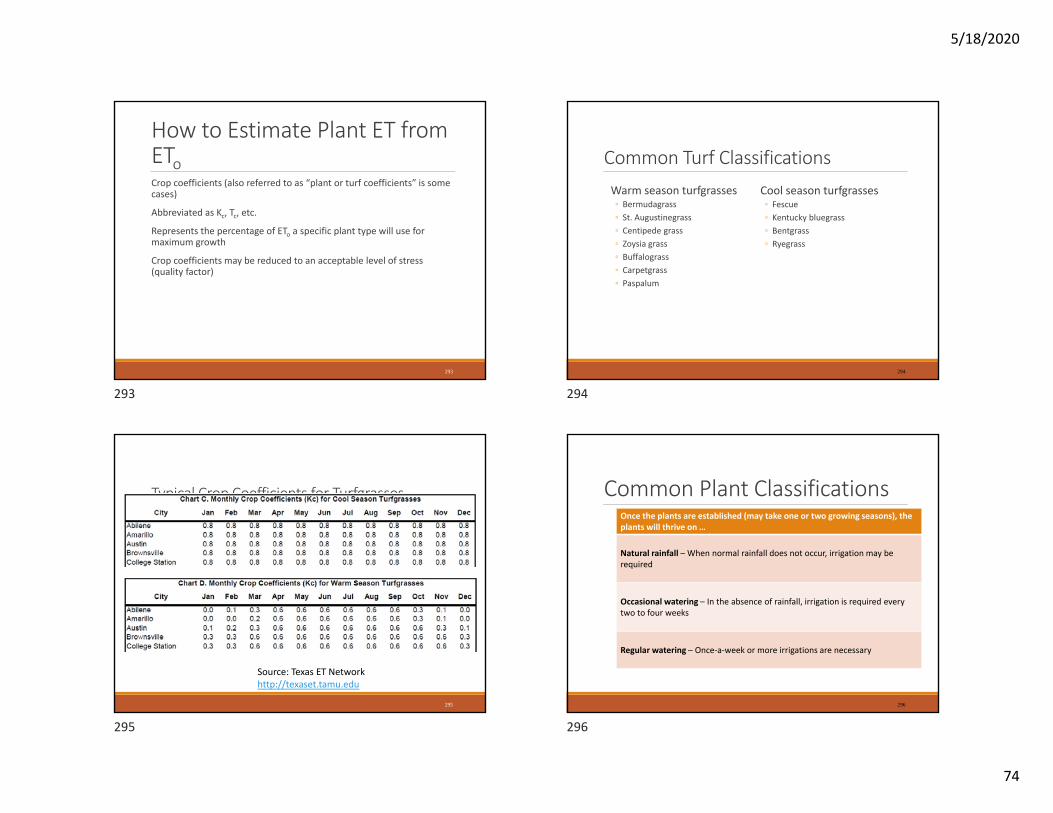
How to Estimate Plant ET from EToCrop coefficients (also referred to as “plant or turf coefficients” is some cases)
Abbreviated as Kc, Tc, etc.
Represents the percentage of ETo a specific plant type will use for maximum growth
Crop coefficients may be reduced to an acceptable level of stress (quality factor)
293
Common Turf ClassificationsWarm season turfgrasses◦ Bermudagrass◦ St. Augustinegrass◦ Centipede grass◦ Zoysia grass◦ Buffalograss◦ Carpetgrass◦ Paspalum
Cool season turfgrasses◦ Fescue◦ Kentucky bluegrass◦ Bentgrass◦ Ryegrass
294
Typical Crop Coefficients for Turfgrasses
295
Source: Texas ET Networkhttp://texaset.tamu.edu
Common Plant ClassificationsOnce the plants are established (may take one or two growing seasons), the plants will thrive on …
Natural rainfall – When normal rainfall does not occur, irrigation may be required
Occasional watering – In the absence of rainfall, irrigation is required every two to four weeks
Regular watering – Once‐a‐week or more irrigations are necessary
296
293 294
295 296
5/18/2020
75
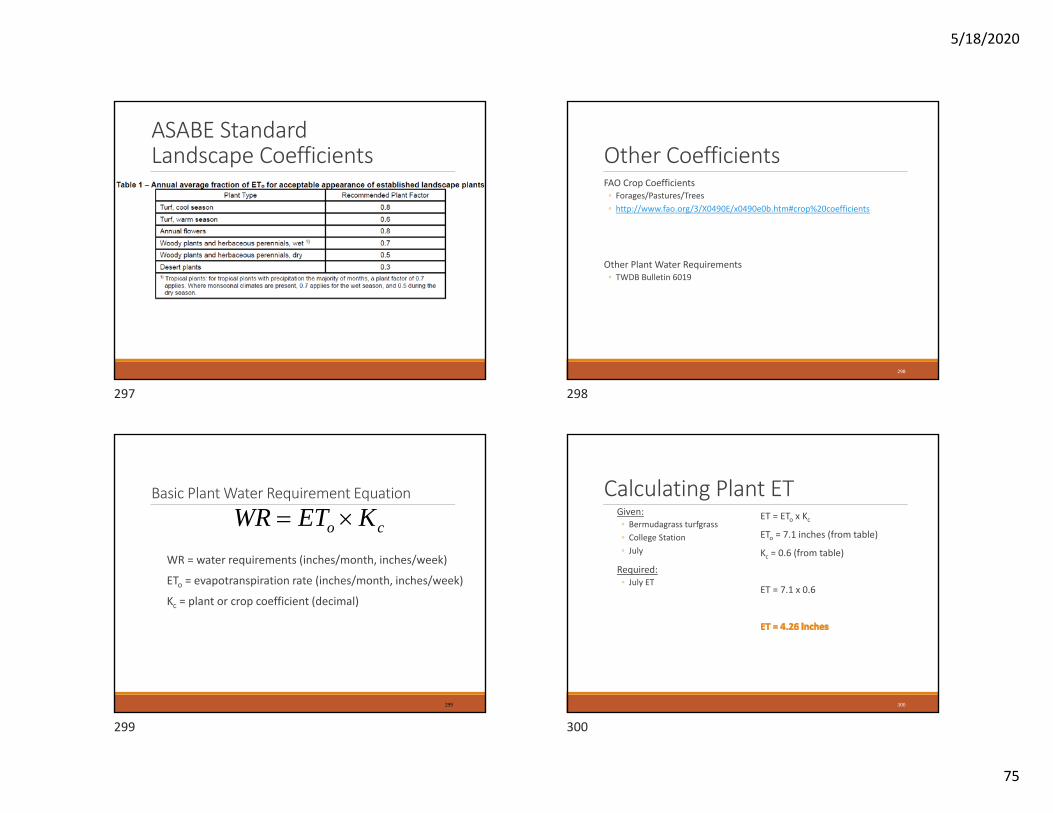
ASABE Standard Landscape Coefficients Other Coefficients
FAO Crop Coefficients◦ Forages/Pastures/Trees◦ http://www.fao.org/3/X0490E/x0490e0b.htm#crop%20coefficients
Other Plant Water Requirements◦ TWDB Bulletin 6019
298
Basic Plant Water Requirement Equation
WR = water requirements (inches/month, inches/week)
ETo = evapotranspiration rate (inches/month, inches/week)
Kc = plant or crop coefficient (decimal)
299
co KETWR Calculating Plant ET
Given:◦ Bermudagrass turfgrass◦ College Station◦ July
Required:◦ July ET
ET = ETo x KcETo = 7.1 inches (from table)
Kc = 0.6 (from table)
ET = 7.1 x 0.6
300
297 298
299 300
5/18/2020
76
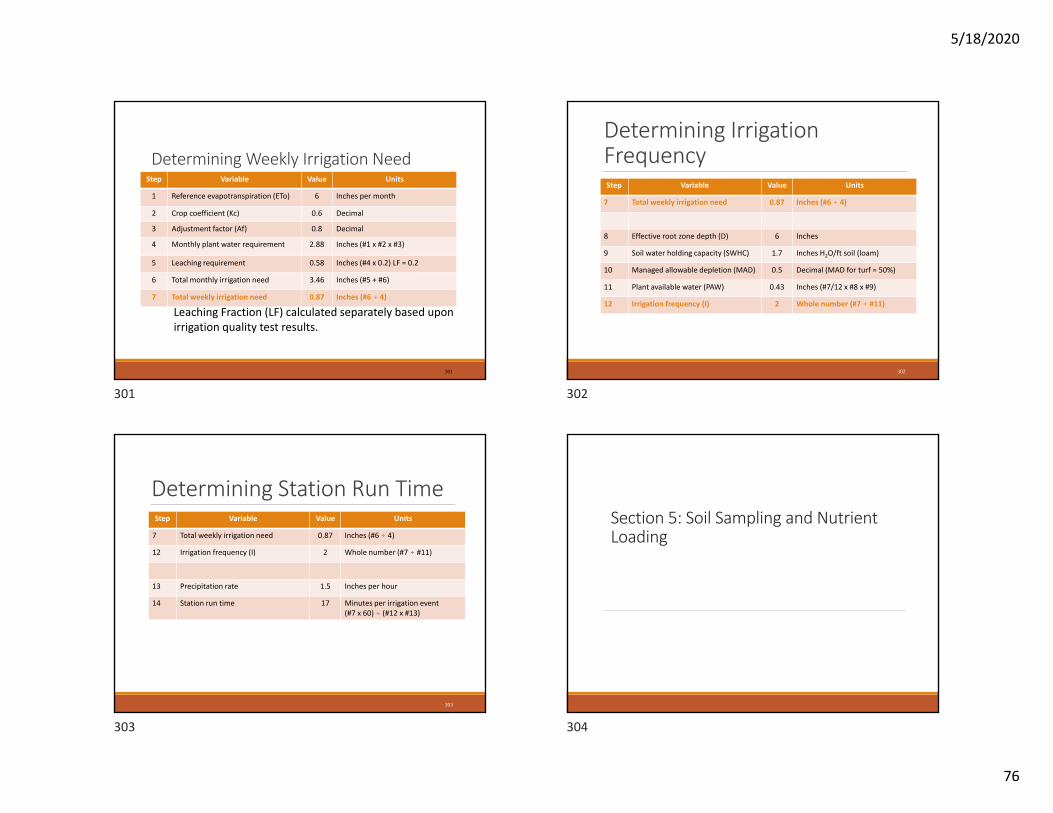
Determining Weekly Irrigation Need
301
Step Variable Value Units
1 Reference evapotranspiration (ETo) 6 Inches per month
2 Crop coefficient (Kc) 0.6 Decimal
3 Adjustment factor (Af) 0.8 Decimal
4 Monthly plant water requirement 2.88 Inches (#1 x #2 x #3)
5 Leaching requirement 0.58 Inches (#4 x 0.2) LF = 0.2
6 Total monthly irrigation need 3.46 Inches (#5 + #6)
7 Total weekly irrigation need 0.87 Inches (#6 ) 4)
Leaching Fraction (LF) calculated separately based uponirrigation quality test results.
Determining Irrigation Frequency
302
Step Variable Value Units
7 Total weekly irrigation need 0.87 Inches (#6 ) 4)
8 Effective root zone depth (D) 6 Inches
9 Soil water holding capacity (SWHC) 1.7 Inches H2O/ft soil (loam)
10 Managed allowable depletion (MAD) 0.5 Decimal (MAD for turf = 50%)
11 Plant available water (PAW) 0.43 Inches (#7/12 x #8 x #9)
12 Irrigation frequency (I) 2 Whole number (#7 ) #11)
Determining Station Run Time
303
Step Variable Value Units
7 Total weekly irrigation need 0.87 Inches (#6 ) 4)
12 Irrigation frequency (I) 2 Whole number (#7 ) #11)
13 Precipitation rate 1.5 Inches per hour
14 Station run time 17 Minutes per irrigation event(#7 x 60) ) (#12 x #13)
Section 5: Soil Sampling and Nutrient Loading
301 302
303 304
5/18/2020
77
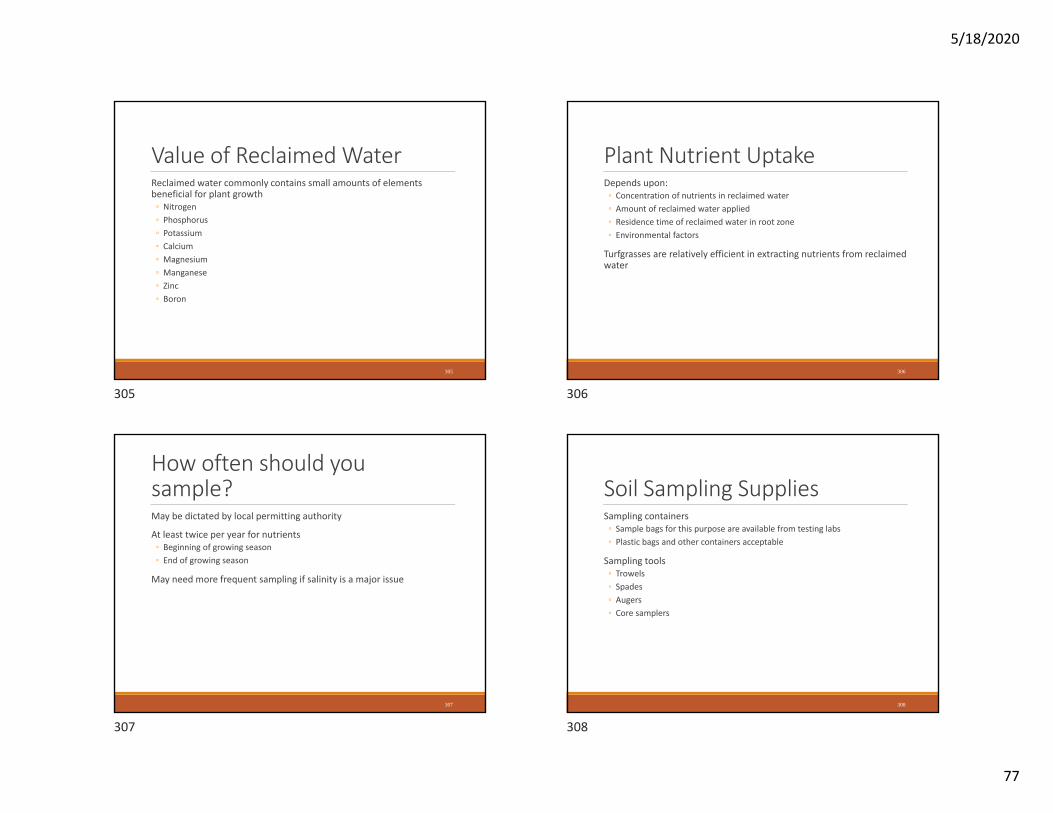
Value of Reclaimed WaterReclaimed water commonly contains small amounts of elements beneficial for plant growth◦ Nitrogen◦ Phosphorus◦ Potassium◦ Calcium◦ Magnesium◦ Manganese◦ Zinc◦ Boron
305
Plant Nutrient UptakeDepends upon:◦ Concentration of nutrients in reclaimed water◦ Amount of reclaimed water applied◦ Residence time of reclaimed water in root zone◦ Environmental factors
Turfgrasses are relatively efficient in extracting nutrients from reclaimed water
306
How often should you sample?May be dictated by local permitting authority
At least twice per year for nutrients◦ Beginning of growing season◦ End of growing season
May need more frequent sampling if salinity is a major issue
307
Soil Sampling SuppliesSampling containers◦ Sample bags for this purpose are available from testing labs◦ Plastic bags and other containers acceptable
Sampling tools◦ Trowels◦ Spades◦ Augers◦ Core samplers
308
305 306
307 308
5/18/2020
78
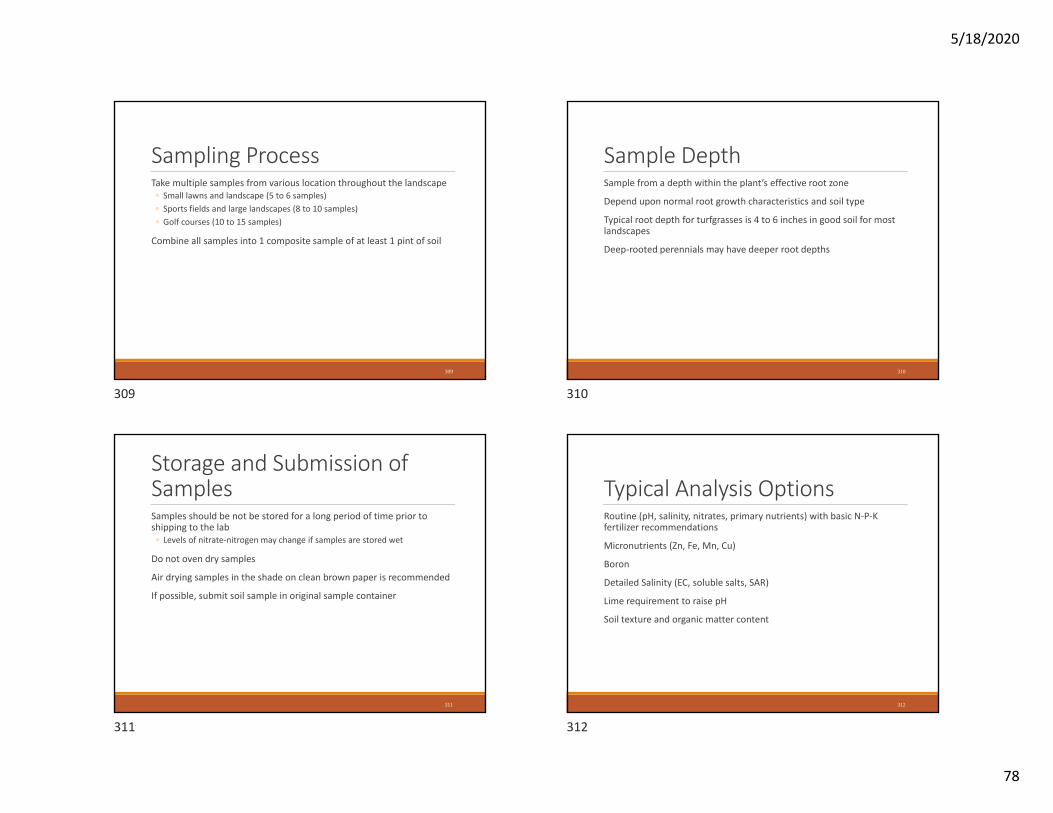
Sampling ProcessTake multiple samples from various location throughout the landscape◦ Small lawns and landscape (5 to 6 samples)◦ Sports fields and large landscapes (8 to 10 samples)◦ Golf courses (10 to 15 samples)
Combine all samples into 1 composite sample of at least 1 pint of soil
309
Sample DepthSample from a depth within the plant’s effective root zone
Depend upon normal root growth characteristics and soil type
Typical root depth for turfgrasses is 4 to 6 inches in good soil for most landscapes
Deep‐rooted perennials may have deeper root depths
310
Storage and Submission of SamplesSamples should be not be stored for a long period of time prior to shipping to the lab◦ Levels of nitrate‐nitrogen may change if samples are stored wet
Do not oven dry samples
Air drying samples in the shade on clean brown paper is recommended
If possible, submit soil sample in original sample container
311
Typical Analysis OptionsRoutine (pH, salinity, nitrates, primary nutrients) with basic N‐P‐K fertilizer recommendations
Micronutrients (Zn, Fe, Mn, Cu)
Boron
Detailed Salinity (EC, soluble salts, SAR)
Lime requirement to raise pH
Soil texture and organic matter content
312
309 310
311 312
5/18/2020
79
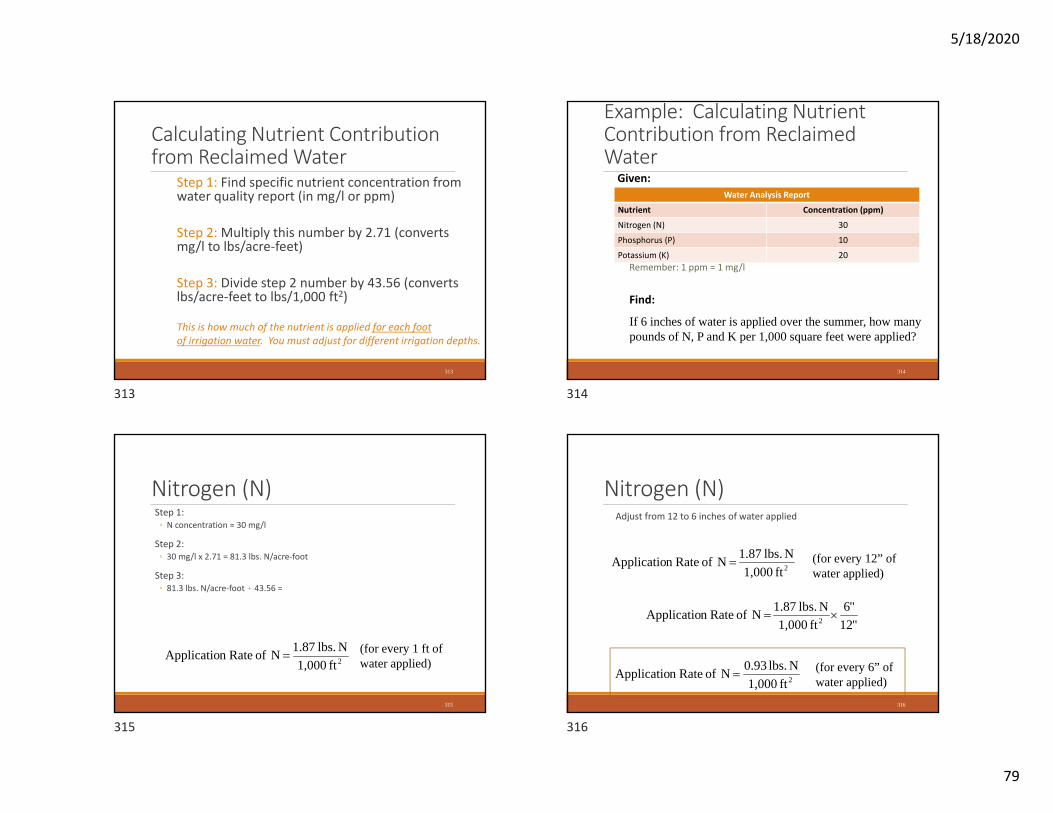
Calculating Nutrient Contribution from Reclaimed Water
Step 1: Find specific nutrient concentration from water quality report (in mg/l or ppm)
Step 2: Multiply this number by 2.71 (converts mg/l to lbs/acre‐feet)
Step 3: Divide step 2 number by 43.56 (converts lbs/acre‐feet to lbs/1,000 ft2)
313
This is how much of the nutrient is applied for each footof irrigation water. You must adjust for different irrigation depths.
Example: Calculating Nutrient Contribution from Reclaimed Water
Water Analysis Report
Nutrient Concentration (ppm)
Nitrogen (N) 30
Phosphorus (P) 10
Potassium (K) 20
314
Remember: 1 ppm = 1 mg/l
Given:
Find:
If 6 inches of water is applied over the summer, how many pounds of N, P and K per 1,000 square feet were applied?
Nitrogen (N)Step 1: ◦ N concentration = 30 mg/l
Step 2:◦ 30 mg/l x 2.71 = 81.3 lbs. N/acre‐foot
Step 3:◦ 81.3 lbs. N/acre‐foot ) 43.56 =
315
2ft 1,000N lbs. 1.87 N of Raten Applicatio (for every 1 ft of
water applied)
Nitrogen (N)Adjust from 12 to 6 inches of water applied
316
2ft 1,000N lbs. 1.87 N of Raten Applicatio (for every 12” of
water applied)
"12"6
ft 1,000N lbs. 1.87 N of Raten Applicatio 2
2ft 1,000N lbs. 0.93 N of Raten Applicatio (for every 6” of
water applied)
313 314
315 316
5/18/2020
80
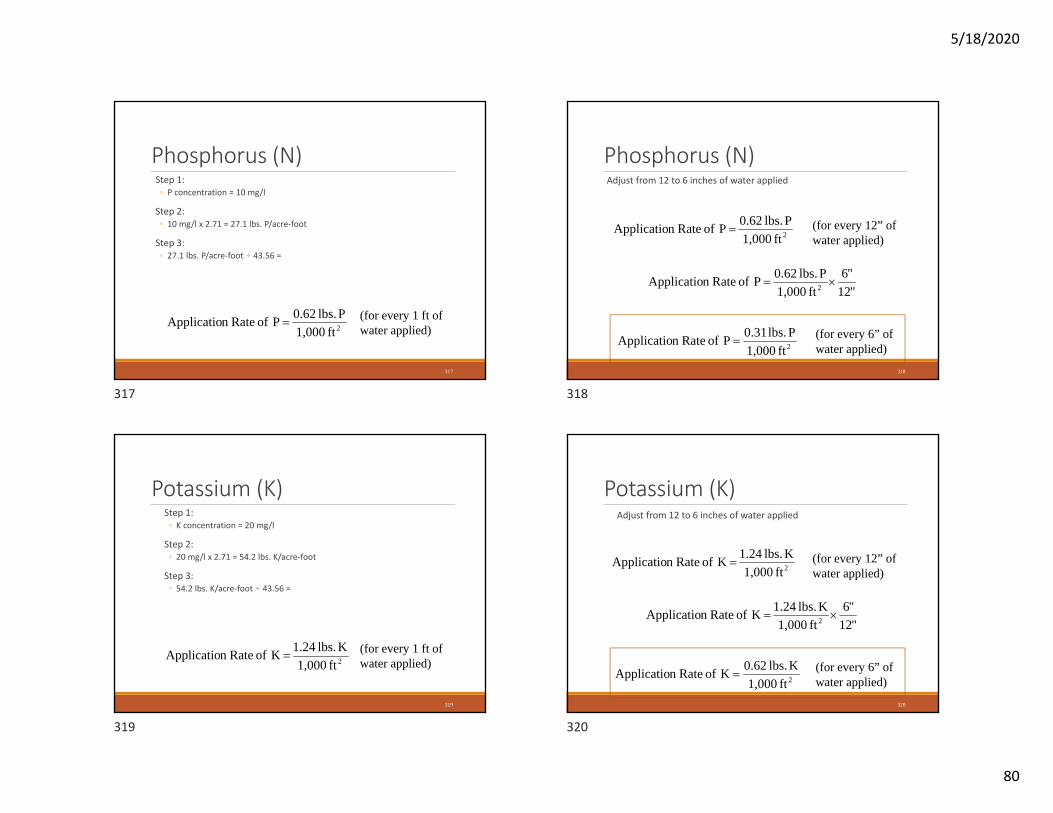
Phosphorus (N)Step 1: ◦ P concentration = 10 mg/l
Step 2:◦ 10 mg/l x 2.71 = 27.1 lbs. P/acre‐foot
Step 3:◦ 27.1 lbs. P/acre‐foot ) 43.56 =
317
2ft 1,000P lbs. 0.62 P of Raten Applicatio (for every 1 ft of
water applied)
Phosphorus (N)Adjust from 12 to 6 inches of water applied
318
2ft 1,000P lbs. 0.62 P of Raten Applicatio (for every 12” of
water applied)
"12"6
ft 1,000P lbs. 0.62 P of Raten Applicatio 2
2ft 1,000P lbs. 0.31 P of Raten Applicatio (for every 6” of
water applied)
Potassium (K)Step 1: ◦ K concentration = 20 mg/l
Step 2:◦ 20 mg/l x 2.71 = 54.2 lbs. K/acre‐foot
Step 3:◦ 54.2 lbs. K/acre‐foot ) 43.56 =
319
2ft 1,000K lbs. 1.24 K of Raten Applicatio (for every 1 ft of
water applied)
Potassium (K)Adjust from 12 to 6 inches of water applied
320
2ft 1,000K lbs. 1.24 K of Raten Applicatio (for every 12” of
water applied)
"12"6
ft 1,000K lbs. 1.24 K of Raten Applicatio 2
2ft 1,000K lbs. 0.62K of Raten Applicatio (for every 6” of
water applied)
317 318
319 320
5/18/2020
81
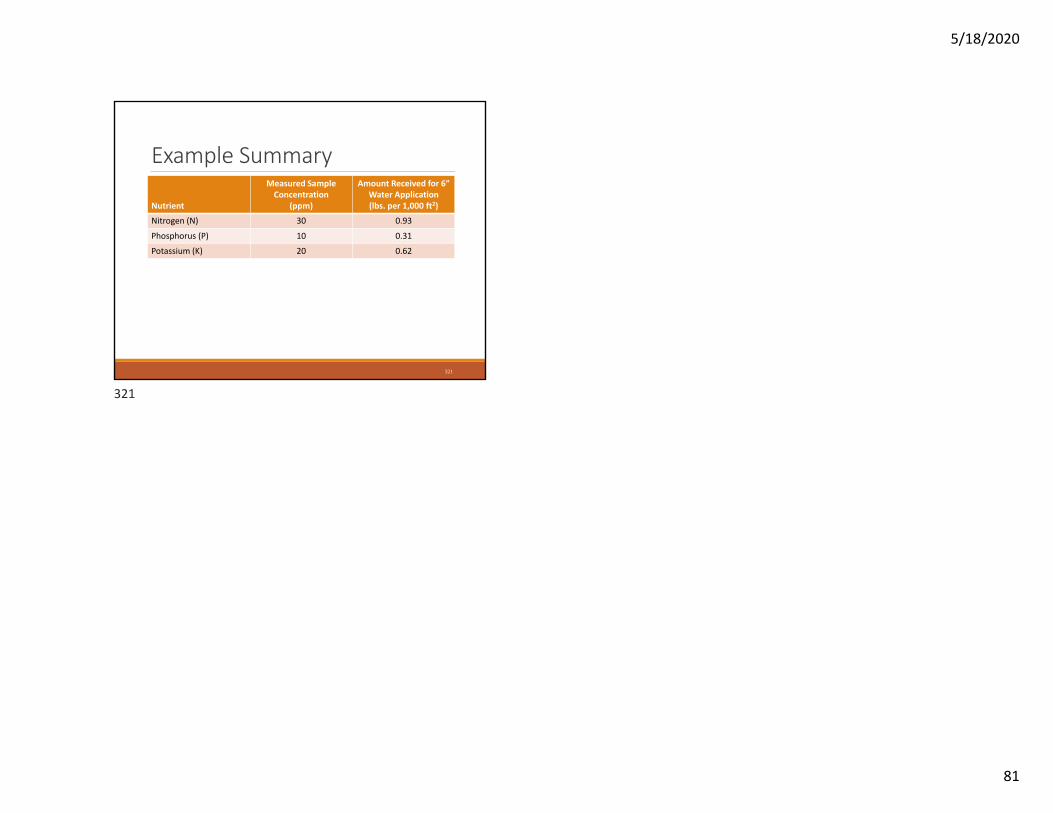
Example Summary
Nutrient
Measured Sample Concentration
(ppm)
Amount Received for 6” Water Application(lbs. per 1,000 ft2)
Nitrogen (N) 30 0.93
Phosphorus (P) 10 0.31
Potassium (K) 20 0.62
321
321