managing urban nutrient biogeochemistry for sustainable urbanization
TRANSCRIPT

lable at ScienceDirect
Environmental Pollution xxx (2014) 1e7
Contents lists avai
Environmental Pollution
journal homepage: www.elsevier .com/locate/envpol
Managing urban nutrient biogeochemistry for sustainableurbanization
Tao Lin a,b,1, Valerie Gibson a,b,1, Shenghui Cui a,b,2, Chang-Ping Yu a,b,3, Shaohua Chen a,b,4,Zhilong Ye a,b,5, Yong-Guan Zhu a,b,*
aKey Lab of Urban Environment and Health, Institute of Urban Environment, Chinese Academy of Sciences, Xiamen 361021, ChinabXiamen Key Lab of Urban Metabolism, Xiamen 361021, China
a r t i c l e i n f o
Article history:Received 24 January 2014Received in revised form17 March 2014Accepted 26 March 2014Available online xxx
Keywords:Urban metabolismNitrogenPhosphorusBiogeochemistrySustainable urbanization
* Corresponding author.E-mail addresses: [email protected] (T. Lin), [email protected]
cn (S. Cui), [email protected] (C.-P. Yu), [email protected](Z. Ye), [email protected], [email protected] (Y.-G. Zhu
1 Tel.: þ86 592 6190651.2 Tel.: þ86 592 6190957.3 Tel.: þ86 592 61906768.4 Tel.: þ86 592 6190995.5 Tel.: þ86 592 6190528.
http://dx.doi.org/10.1016/j.envpol.2014.03.0380269-7491/� 2014 Elsevier Ltd. All rights reserved.
Please cite this article in press as: Lin, T., et al(2014), http://dx.doi.org/10.1016/j.envpol.20
a b s t r a c t
Urban ecosystems are unique in the sense that human activities are the major drivers of biogeochemicalprocesses. Along with the demographic movement into cities, nutrients flow towards the urban zone(nutrient urbanization), causing the degradation of environmental quality and ecosystem health. In thispaper, we summarize the characteristics of nutrient cycling within the urban ecosystem compared tonatural ecosystems. The dynamic process of nutrient urbanization is then explored taking Xiamen city,China, as an example to examine the influence of rapid urbanization on food sourced nitrogen andphosphorus metabolism. Subsequently, the concept of a nutrient footprint and calculation method isintroduced from a lifecycle perspective. Finally, we propose three system approaches to mend the brokenbiogeochemical cycling. Our study will contribute to a holistic solution which achieves synergies be-tween environmental quality and food security, by integrating technologies for nutrient recovery andwaste reduction.
� 2014 Elsevier Ltd. All rights reserved.
1. Introduction
The urban proportion of the global population has alreadyexceeded 50% and will continue to rise in the coming decades. Asthe principal socioeconomic entity for human habitation, citieshave a distinct biogeochemical process and impose a hugeecological footprint on surrounding ecosystems, which providetheir sustenance and receive their waste products (Luck et al., 2001;Kaye et al., 2006). For example, even though urban areas cover lessthan 3% of the global terrestrial surface, cities are responsible for78% of carbon emissions, 60% of residential water use, and 76% ofwood use at the global scale (Grimm et al., 2008). Urban ecosystemsare dominated by the human population and the biogeochemicalprocesses in urban and peri-urban areas are controlled by the
.cn (V. Gibson), [email protected] (S. Chen), [email protected]).
., Managing urban nutrient bi14.03.038
complex interactions between society and the environment. Sus-tainable urbanization refers to the benign and efficient interactionsbetween the urban socioeconomic system and biosphere, whichare often considered to be two interdependent systems in co-evolution.
Urban metabolism has been defined as the socioeconomicdriven materials and energy flows in a city (Wolman, 1965;Newman, 1999), which extracts resources from the biosphere toprovide services for human life. However, lack of integrated man-agement and wise utilization have resulted in negative metabolicprocesses including altered groundwater levels, exhaustion of localresources, accumulation of toxic materials, summer heat islands,and irregular accumulation of nutrients (Kennedy et al., 2007).Great efforts are required to gain better understanding and char-acterization of the distinct urban biogeochemical processes toreduce environmental pressures and achieve sustainableurbanization.
Nitrogen (N) and phosphorus (P) are essential elements for life,and the availability of N and P controls many aspects of globalbiogeochemistry (Schlesinger and E.S.B., 2013). In natural ecosys-tems, N and P cycling is dominated by internal transfers betweenplants and various soil pools, and is coupled to a large global poolwith relatively slow turnover. Currently, urbanization is acceler-ating N and P cycling, which is the major driving force for
ogeochemistry for sustainable urbanization, Environmental Pollution

T. Lin et al. / Environmental Pollution xxx (2014) 1e72
environmental deterioration (Kaye et al., 2006; Grimm et al., 2008;Cui et al., 2013; Grimm et al., 2004; Li et al., 2012). The impact ofurbanization on N and P biogeochemistry has two aspects: one ishuman induced N and P fluxes and their socioeconomic meta-bolism; another is natural N and P biogeochemical changes inducedby the urban physical environment, including urban nonpointsource pollution caused by impervious surface expansion(Goonetilleke et al., 2005; Al Bakri et al., 2008), soil erosion causedby urban land development and hydrological changes (Kaye et al.,2006; Leigh, 1982), and altered community structure and denitri-fication due to local climate or other environmental changes (Bettezand Groffman, 2012; Groffman and Crawford, 2003; Grimm et al.,2004; Johnson et al., 2013).
Although these physical alterations can affect the urban N and Pinfluxes in multiple and complex ways, socioeconomic influxes (i.e.urban metabolism) normally dominate the nutrient biogeochem-istry in the urban ecosystem.
To sustain the development of human society (urban meta-bolism), cities import natural resources from ecosystems andgenerate metabolites (i.e. wastes or pollutants) in the same waythat heterotrophic organisms do (Zhang, 2013). Generally, the Nand P fluxes into the urban ecosystem can be categorized as naturalor human-induced inputs. The natural N inputs include wetdeposition, surface water inflows and biological fixation. Sincethere is almost no significant gaseous component, the natural Pinputs mainly come from surface water inflows. Human induced Nand P inputs mainly come from food supply, energy use and non-food goods (i.e. N or P-containing chemicals) (Gu et al., 2013).Commonly, food supply and fertilizer application are major sourcesof urban nutrient metabolism. In some highly industrialized cities,fixation by combustion has become an increasingly importantsource (Fissore et al., 2011; Baker et al., 2001; Gu et al., 2012).
Currently, there is limited understanding of how to manageurban nutrient biogeochemical processes. Increased understandingof urban nutrient management will contribute to resolving not onlynutrient derived environmental pollution such as water eutrophi-cation and organic pollution, but also the recycling of urban wastesin agriculture and the problem of food security (Forkes, 2007;Faerge et al., 2001). In this paper, we firstly summarize the char-acteristics of urban nutrient cycling compared with naturalecosystem cycling. Then, the dynamic process of nutrient urbani-zation is explored using a case study of food consumption in Xia-men, China, and the concept of a nutrient footprint is introduced.Finally, we propose a system approach to mend the brokenbiogeochemical cycling, which includes material flow analysis,technological innovation and integration, and risk assessment.
2. Characteristics of nutrient cycling in urban ecosystems
A city is a special human and nature coupled ecosystem inwhichnutrient cycling is significantly different to that in a naturalecosystem. Four characteristics of urban nutrient cycling are sum-marized below.
2.1. High density
To feed the growing population and maintain a modernizedurban lifestyle, cities significantly increase nutrient throughput andpresent a high N and P flux density. At the global scale, over the pastcentury humans have contributed far more nutrients to the envi-ronment than all natural terrestrial processes (Schlesinger andE.S.B., 2013; Canfield et al., 2010). The natural N and P inputs intoterrestrial ecosystems are about 839 kg N/yr.km2 and 168 kg P/yr.km2 (see “The global cycles of nitrogen and phosphorus” inSchlesinger and E.S.B. (2013); we consider only fixation by lightning
Please cite this article in press as: Lin, T., et al., Managing urban nutrient bi(2014), http://dx.doi.org/10.1016/j.envpol.2014.03.038
and biological fixation as N inputs and mining for P inputs, dividedby Earth’s total land area).
According to previous studies, the N and P inputs into cities aremore than ten times larger than those of natural ecosystems (forexample about 7946 kg N/yr.km2 in Phoenix, USA (Baker et al.,2001), 15,974 kg N/yr.km2 and 2364 kg P/yr.km2 in Bangkok,Thailand (Faerge et al., 2001), and 55,376 kg N/yr.km2 and 5000 kgP/yr.km2 in Stockholm, Sweden (Burström et al., 1997)). Food andinadvertent imports with fossil fuels are the major components ofhuman induced N and P fluxes (Baker et al., 2001; Gu et al., 2012;NILSSON, 1995). Moreover, intensive fertilizer application in ur-ban green spaces, such as residential lawns, plays a comparable rolein impacting urban nutrient cycles to agricultural fertilizer appli-cation in some low population density cities (Law et al., 2004).
2.2. Disrupted cycling
Nutrient flows in natural ecosystems follow the food chain andform a closed loop between the producers, consumers and de-composers. To some extent, the decomposers drive and maintainthe nutrient cycling by transferring the waste (detritus) from pro-ducers and consumers into resources for producers. However, theconnection between nutrient utilization and waste treatment isdisrupted or nearly broken during urban nutrient metabolismbecause of a lack of effective nutrient recycling mechanisms incities. This often results in a considerable amount of the induced Nand P being discharged as a pollutant into the surrounding envi-ronment, while some is accumulated in the city system (Zhang,2013; Fissore et al., 2011; Baker et al., 2001; Forkes, 2007; Faergeet al., 2001).
From a perspective of environmental capacity, sustainable ur-banization can be understood as a development process whichdoes not increase the throughput of materials beyond the bio-sphere’s capacity for regeneration andwaste assimilation (Kennedyet al., 2007; Goodland and Daly, 1996). The disrupted nutrientcycling in urban areas has exerted great stress on natural N and Pbiogeochemistry, not only from nutrient resource exploitation butalso from waste assimilation. Furthermore, discharged organicwaste from urban ecosystems contains huge quantities of plantnutrients that should be recovered and reused to close theecological nutrient cycle.
2.3. Human dominated
Most of the N and P fluxes in urban areas are controlled byhuman activities either inadvertently or advertently, particularlyhuman induced nutrient. Taking food consumption as an example,consumer demand is the main driver of material production pro-cesses. Population growth and food consumption patterns willdirectly affect the N and P fluxes associated with food supply to theurban ecosystem. Meanwhile, consumption behavior will greatlyinfluence the production of food waste. It is estimated that nearlyone third of all food produced for human consumption is lostglobally (FAO, 2013). In China, about 39% of the total dietary P incities is exported through direct sewage discharge without treat-ment, while still containing large amounts of recoverable nutrient(Li et al., 2012).
In cities with poor waste treatment systems, rivers and coastalmarine environments are the major acceptors for nutrientdischarge. However, in some cities, modern waste treatment facil-ities can extract or separate discarded nutrients from one envi-ronment medium and consequently transfer them into anotherenvironmental medium (or the same environmental medium in adifferent place or time). For example, a sewage treatment plantextracts the N and P from waste water into sludge, which is finally
ogeochemistry for sustainable urbanization, Environmental Pollution

T. Lin et al. / Environmental Pollution xxx (2014) 1e7 3
buried in soil or combusted and emitted into the atmospherethrough an incineration plant. However, only a minimal amount ofnutrient is actually recycled.
2.4. Low eco-efficiency
In many respects, cities can be considered as a model of effi-ciency, due to their economies of scale and advantages of proximity.However, compared with natural ecosystems, urban ecosystemsdisplay a very low efficiency of nutrient recycling. In essence,ecological efficiency of urban metabolism is a cost-benefit indicatorwhich refers to the amount of social services per unit resourceconsumption or per unit pollution discharge during the process ofurban material metabolism (Liu et al., 2010; Zhang et al., 2009).Nutrient cycling in natural ecosystems is closed and highly efficient,because millions of years of evolution have allowed complex re-lationships to form among living organisms and between organ-isms and their environment, for example food networks. As a result,N can be absorbed by organisms so rapidly that little nitrogen re-mains in inorganic forms (Schlesinger and E.S.B., 2013).
In contrast, most of the nutrients entering the urban ecosystemare wasted (e.g. through food waste). The low efficiency of nutrientrecycling in urban ecosystems is the combined result of high den-sity fluxes and disrupted cycling. However, human managementcurrently plays a rather weak role in enhancing urban nutrientefficiency. It is still a relatively new concept to consider cities as acoupled human and natural ecosystem (Collins et al., 2000; Pickettet al., 2011), and there is huge potential for scientists, planners andengineers to manage nutrient biogeochemical processes bymovingmisplaced resources into the right position to enhance the eco-efficiency of urban nutrient recycling (Fig. 1).
3. Nutrient urbanization
Urban ecosystems are unique in that humans are the majordriving force of the biogeochemical processes. Therefore, alongwith the demographic movement into cities, there is a clearnutrient “urbanization”. For example, in Shanghai, China, as a resultof food structure changes, the food sourced N and P fluxes present aclear density gradient, with 19.36 g N and 1.80 g P in the urbancentral area,16.48 N g and 1.52 g P in the newer urban districts, and13.04 g N and 1.20 g P in the suburban area per person per day (Liuet al., 2013). According to the different sources, nutrient urbaniza-tion can be considered as two pathways, one advertent and theother inadvertent. The former refers to urban nutrient metabolismsuch as food consumption, while the latter means the alteredbiogeochemical processes in the urban environment such asnonpoint source pollution. Here, we focus on advertent urban
Human dominated
High density Disrupted cycling
low eco-efficiency
Fig. 1. Characteristics of urban nutrient cycling and their relationships.
Please cite this article in press as: Lin, T., et al., Managing urban nutrient bi(2014), http://dx.doi.org/10.1016/j.envpol.2014.03.038
metabolism to explore the dynamic causal chains of human drivennutrient urbanization processes, as shown in Fig. 2.
In general, urbanization means the urban population growthand lifestyle changes which will potentially drive the demand fornutrient consumption. At the same time, urbanization also pro-motes infrastructure development including waste treatment sys-tems to achieve a better living environment. To satisfy nutrientconsumption demand from the urban population, nutrient pro-duction and supply of food and other N or P-containing chemicalswill increase, leading to increased waste production from nutrientconsumption. Nutrient production will speed up the naturalresource shortage, whilst waste dischargewill cause environmentalpollution when it exceeds ecological carrying capacity.
To maintain a suitable living environment, humans in the citywill try to recover the ecosystem services by enhancing the wastetreatment system and adjusting nutrient consumption behavior.Thus, a dynamic relationship between urbanization, nutrient con-sumption and ecological carrying capacity appears (see Fig. 2).Below we take Xiamen city as a case study to show the nutrienturbanization process through food consumption.
Xiamen is a coastal city in southeast China which has experi-enced rapid urbanization since becoming one of the first ‘SpecialEconomic Zones’. The population tripled between 1991 and 2010,and total food consumption increased at the same rate. Althoughper capita food consumption hovered around 300 kg per year, thefood structure altered significantly reflecting residents’ lifestylechanges (Fig. 3). During urbanization, the waste treatment systemwas improved and gradually collected more and more food wasteand human excreta. However, the enhanced treatment systemmerely alters the nutrient discharges into different environmentalmedia including air, water, and soil, and the amount of recycledfood-sourced nutrients was limited or even decreased due toreduced farmland area and mechanization of agriculture. As aresult of improvements in urban waste treatment, landfill hasbecome an increasing stock for food waste and sludge from sewagetreatment plants, with the city accumulating large quantities ofnutrients (Fig. 4). The following equations show the dynamic massbalance of food sourced N and P during urbanization:
NPinput ¼ NPoutput þ NPaccumulated
NPoutput ¼ NPair þ NPsoil þ NPwater
NPaccumulated ¼ NPhuman þ NPlandfill
where NPinput represents the total amount of N and P input to a citythrough food consumption in a given year; NPoutput and NPaccumu-
lated represent the total N and P discharged from and accumulatedin the urban ecosystem respectively; NPair, NPsoil, and NPwater
UrbanPopulation
NutrientConsumption
Urbanization
NutrientProduction Waste
Production
WasteTreatment
+
+
+ +
+
-
Ecologicalcapacity
-
+
+
-
Fig. 2. Dynamic schematic diagram of nutrient cycling with urbanization. Note: þrepresents positive feedback, � represents negative feedback.
ogeochemistry for sustainable urbanization, Environmental Pollution
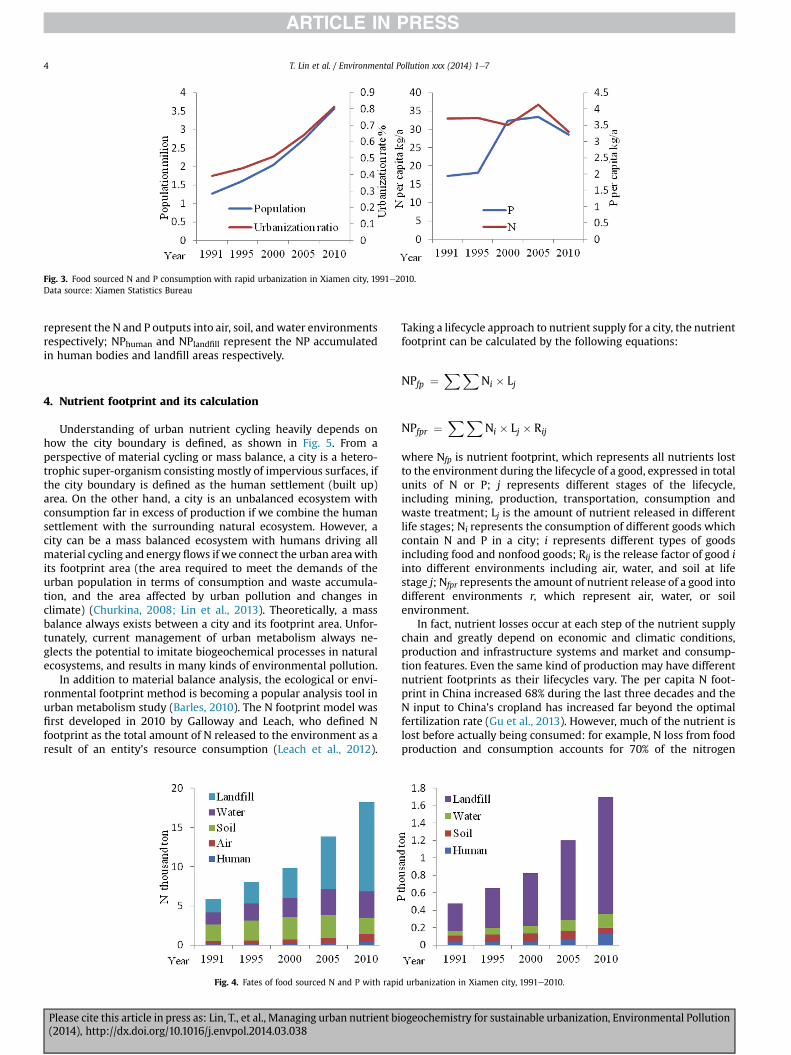
Fig. 3. Food sourced N and P consumption with rapid urbanization in Xiamen city, 1991e2010.Data source: Xiamen Statistics Bureau
T. Lin et al. / Environmental Pollution xxx (2014) 1e74
represent the N and P outputs into air, soil, andwater environmentsrespectively; NPhuman and NPlandfill represent the NP accumulatedin human bodies and landfill areas respectively.
4. Nutrient footprint and its calculation
Understanding of urban nutrient cycling heavily depends onhow the city boundary is defined, as shown in Fig. 5. From aperspective of material cycling or mass balance, a city is a hetero-trophic super-organism consisting mostly of impervious surfaces, ifthe city boundary is defined as the human settlement (built up)area. On the other hand, a city is an unbalanced ecosystem withconsumption far in excess of production if we combine the humansettlement with the surrounding natural ecosystem. However, acity can be a mass balanced ecosystem with humans driving allmaterial cycling and energy flows if we connect the urban areawithits footprint area (the area required to meet the demands of theurban population in terms of consumption and waste accumula-tion, and the area affected by urban pollution and changes inclimate) (Churkina, 2008; Lin et al., 2013). Theoretically, a massbalance always exists between a city and its footprint area. Unfor-tunately, current management of urban metabolism always ne-glects the potential to imitate biogeochemical processes in naturalecosystems, and results in many kinds of environmental pollution.
In addition to material balance analysis, the ecological or envi-ronmental footprint method is becoming a popular analysis tool inurban metabolism study (Barles, 2010). The N footprint model wasfirst developed in 2010 by Galloway and Leach, who defined Nfootprint as the total amount of N released to the environment as aresult of an entity’s resource consumption (Leach et al., 2012).
Fig. 4. Fates of food sourced N and P with rapi
Please cite this article in press as: Lin, T., et al., Managing urban nutrient bi(2014), http://dx.doi.org/10.1016/j.envpol.2014.03.038
Taking a lifecycle approach to nutrient supply for a city, the nutrientfootprint can be calculated by the following equations:
NPfp ¼XX
Ni � Lj
NPfpr ¼XX
Ni � Lj � Rij
where Nfp is nutrient footprint, which represents all nutrients lostto the environment during the lifecycle of a good, expressed in totalunits of N or P; j represents different stages of the lifecycle,including mining, production, transportation, consumption andwaste treatment; Lj is the amount of nutrient released in differentlife stages; Ni represents the consumption of different goods whichcontain N and P in a city; i represents different types of goodsincluding food and nonfood goods; Rij is the release factor of good iinto different environments including air, water, and soil at lifestage j; Nfpr represents the amount of nutrient release of a good intodifferent environments r, which represent air, water, or soilenvironment.
In fact, nutrient losses occur at each step of the nutrient supplychain and greatly depend on economic and climatic conditions,production and infrastructure systems and market and consump-tion features. Even the same kind of production may have differentnutrient footprints as their lifecycles vary. The per capita N foot-print in China increased 68% during the last three decades and theN input to China’s cropland has increased far beyond the optimalfertilization rate (Gu et al., 2013). However, much of the nutrient islost before actually being consumed: for example, N loss from foodproduction and consumption accounts for 70% of the nitrogen
d urbanization in Xiamen city, 1991e2010.
ogeochemistry for sustainable urbanization, Environmental Pollution

Crop
Livestock
Consumption
Wastetreatment
Loss (1)
Loss (2) Loss (3)
Loss (4)Input (1)
Input (2)
Input (3)
Food (1)
Feed
Food (2)
Recycle (1)
Recycle (2)
Recycle (3) Recycle (4)
Waste (1)
Waste (3)
Waste (2)
Fig. 6. Sustainable food sourced nutrient cycling in a coupled urban and peri-urbanecosystem. Note: Red and green boxes mean the processes of food consumption,waste treatment, livestock and crop production, which take place in urban (red) andperi-urban (green) areas respectively. Input (1) is natural nutrient input such as Ndeposition; Input (2) is fertilizer application; Input (3) is extra feed input; Loss (1) isnutrient leaching and runoff; Loss (2) is nutrient loss from livestock’s excreta; Loss (3)is reclaimed water discharge and landfill; Loss (4) is food waste discharged directly(not entering waste treatment); Food (1) is plant derived food such as wheat, vege-tables; Food (2) is animal derived food such as egg, pork; Waste (1) includes food wasteand human excreta; Waste (2) includes crop residues and runoff nutrients; Waste (3)includes animal excreta and carcasses; Recycle (1) is the recycled use of animal excretaas fertilizer; Recycle (2) is the recycled use of human excreta as fertilizer; Recycle (3) isthe recycled use of food waste and sludge as fertilizer; Recycle (4) is the recycled use offood waste as feed. (For interpretation of the references to color in this figure legend,the reader is referred to the web version of this article.)
Fig. 5. Urban ecosystem boundary and material balance. Arrows represent the mate-rial fluxes.
T. Lin et al. / Environmental Pollution xxx (2014) 1e7 5
footprint (Gu et al., 2013) and only 18% of P entering the food supplychain exits as food for humans (Wang et al., 2011).
Meanwhile, people living in suburban or rural areas, whichtraditionally consider crop products as major dietary sources offood, now show a preference for increasing the intake of animal-derived as well as processed foods, which will inevitably enlargethe N and P footprint from human diets (Liu et al., 2013). System-atically evaluating the life cycle N and P flows for urban utilizationwill contribute to identifying the inefficient uses and leaks to theenvironment, and enable more effectively targeted policymakingfor managing urban nutrient biogeochemistry (Forkes, 2007;Wanget al., 2011).
5. Mending the broken nutrient biogeochemical cycling
Coupling nutrient consumption in the urban area with pro-duction and supply chains in the footprint area is necessary torealize balanced nutrient cycling. Food supply and consumption arefundamental for a city to sustain urban development and triggerurban nutrient metabolism. Agricultural ecosystems are the typicalfootprint ecosystem for urban food consumption, and one of theworst consequences of urbanization is breaking the traditionalnutrients link between food consumption and production. Foodwaste and sewage sludge from the urban waste treatment systemare the largest sources of nutrients which remain unused today andshould be returned to agricultural land (Nilsson, 1995).
In rapidly urbanizing China, human food consumption hassignificantly increased the input of N and P into the urbanecosystem, causing the typical agro-ecosystem to become moredependent on chemical fertilizers (Liu et al., 2012). Some nutrientrecycling practices have been established among agriculture andaquaculture activities (Cucarella et al., 2012; Heeb et al., 1996;Granstedt, 2000). However, without considering the nutrient sup-plies for cities, these kinds of recycling are incomplete. Producingfood closer to where it is consumed represents a closed-loopapproach to resolve the current nutrient problems of cities andagriculture. Furthermore, it is a practical solution for urbanizationcoupled with poverty issues (Abdalla et al., 2012; Zezza andTasciotti, 2010).
Here, we propose systems approaches to mend the brokenbiogeochemical cycling including: (1) material flow analysis toreveal the source and fate of N and P in the urban system; (2)technology innovation and integration to recover/recycle nutrientsfrom urban waste streams and reduce the urbanization footprint;and (3) risk assessment to ensure appropriate technologies toremove toxic chemicals before recovery and recycling can beimplemented. Taking food supply as an example, we design asustainable food sourced nutrient cycle in a coupled urban andperi-urban ecosystem (Fig. 6).
Please cite this article in press as: Lin, T., et al., Managing urban nutrient bi(2014), http://dx.doi.org/10.1016/j.envpol.2014.03.038
5.1. Nutrient budget (material flow analysis)
In the coupled urban and peri-urban ecosystem, the crop systemis the fundamental footprint ecosystem of food supply for a city,since it provides food for people as well as feed for livestock. Thewaste treatment system should play a critical role in nutrientrecycling due to its capacity to transfer waste from the crop, live-stock and consumption systems into fertilizer for food production.As the four subsystems are spatially adjacent, we can minimize thenutrient loss from processing, storage and transportation withinthe system. The recovered nutrients from food waste and sewagesludge will replace, at least in part, the chemical fertilizers im-ported from outside of the system. Thus, the nutrients lost withinthe system are nearly equal to the inputs from the outside in thelong run. The detailed nutrient budget description can be seen inFig. 6.
5.2. Technology integration and innovation
Technologies for sustainable nutrient cycling in the coupledsystem can be categorized as loss reduction technology and recy-cled use technology. Loss reduction technology aims to minimizethe nutrient loss in the four subsystems including reducing cropresidues and mitigating non-point source pollution in the peri-urban area, increasing food waste collection and enhancing thenutrient removal rate during waste treatment in the urban area. Ina stable cycling system, the total nutrient loss is compensated byinputs from outside the system. Thus, the reduction of nutrient losswithin the system leads to decreased nutrient input in the form offertilizer and imported feed. Recycling technologies aim to formdirect and indirect recycling loops between the four subsystems.
The key functions in the direct and indirect recycling loops are1) efficiently collecting waste from crops, livestock, and consump-tion systems and 2) transferring waste into organic fertilizer forfood production systems. Loss reduction technology and recyclingtechnologies should be integrated into the urban and peri-urbancoupled system. Furthermore, technological innovation will
ogeochemistry for sustainable urbanization, Environmental Pollution

T. Lin et al. / Environmental Pollution xxx (2014) 1e76
contribute to efficient integration. For example, Ray et al. (2013)introduced cyanobacteria and microalga to accumulate poly-phosphate and then used them as biofertilizers to substitute forinorganic phosphorus fertilizers and curb environmental P pollu-tion (Ray et al., 2013).
O’Neal and Boyer (2013) used a hybrid anion exchange resincontaining hydrous ferric oxide coupled with chemical precipita-tion reactions to accumulate and recover nutrient from differenttypes of wastewater and to minimize environmental impacts ofexcess nutrient on receiving waters. In addition, electrodialysis wasfound to be an effective way to achieve nutrient recycling by inte-gration with struvite precipitation (Zhang et al., 2013). Wan et al(2013) found that co-digestion of food and garden waste or wastepaper materials in a new single stage rotary anaerobic reactor canenhance the recovery of ammonium-N and simultaneously pro-duce energy (biogas). Because it produces additional energy duringthe waste treatment process, Wan’s approach could be a cost-effective alternative to treat food wastes and other organic wastesafter landfill (Wan et al., 2013a,b).
5.3. Risk assessment
Capturing nutrients from waste sources may be cost-effective(Qiao et al., 2011) but their safe use should be carefully evaluated.For example, sewage sludge and animal waste have been reused inagricultural land, because the nutrients and organic constituentsthey contain can improve plant growth as well as provide beneficialsoil conditioning properties. However, sewage sludge and animalwaste often contain elevated concentrations of residual chemicalsand bio-hazardous substances, such as metals, pharmaceuticalsand personal care products (PPCPs), pathogens and antibioticresistance genes (ARGs) (Werner, 2000; Zhu et al., 2013). Therefore,direct application of sewage sludge and animal waste on farmlandcould result in public health concerns. For example, Zhu et al.(2013) found diverse and abundant ARGs in swine manure andelevated concentrations of ARGs in manure-applied farmland,which also pose potential health risks due to the possible spread ofantibiotic resistance to human pathogens (Zhu et al., 2013).
Consequently, it is necessary to develop suitable techniques tomonitor the release of contaminants in the environment and theiruptake by crops after the application of recovered nutrients fromurban waste to farmland, to provide information for further riskassessment and evaluation of applicability. For example, Huang andhis colleagues conceptualized food wastemanagement through theuse of a Food Recycling Index (FRI) to assess recyclability within afood system and improve urban food safety (Lin et al., 2009; Huang,2010). In addition, development of effective technologies to removehazardous substances or minimize their release before and afterapplication will be beneficial for sustainable nutrient recyclingfrom urban waste. For example, Khan et al. (2013) found thatturning sewage sludge to biochar and using it as a soil amendmentin peri-urban agriculture can reduce the availability of contami-nants to the soil and crops (Khan et al., 2013). Currently, moreresearch is needed to assure the safe use of recovered nutrientsfrom urban waste streams for agricultural purposes.
6. Conclusion
In conclusion, urban ecosystems maintain a greater amount ofnutrients than any other natural ecosystems on the Earth to sustainthe high density of human population and intensive socioeconomicactivities. The nutrient cycling in the urban ecosystem is dominatedby human but tightly connected to natural biogeochemical cyclingin a larger scale, presenting distinguished characteristics. Withincreasing urbanization, more and more nutrients (N and P) are
Please cite this article in press as: Lin, T., et al., Managing urban nutrient bi(2014), http://dx.doi.org/10.1016/j.envpol.2014.03.038
imported into cities leading to potential environmental pollution(e.g. lakes or rivers) and wastage of resources. However, our un-derstanding on the urban nutrient cycling is still limited and theexisting management methods are unsustainable. It is proposedthat for sustainable urbanization, it is critical to mend the brokennutrient biogeochemical cycling with a life cycle perspective, suchas recycling the nutrient between urban human population andperi-urban food production systems. Thus, a nutrient budgetanalysis is necessary to track the flows in the coupled urban andfootprint ecosystems. It also suggested that technologies should beimproved to make sure that nutrient cycling is implemented safelyand efficiently. We suggest that nutrient flow analysis, technologyinnovation and integration, and risk assessment should be foci forfuture urban nutrient cycling studies that will require trans-disciplinary collaboration among urban planners, ecologists, engi-neers, social scientists and managers.
Acknowledgment
The authors are grateful for the support of the Chinese Academyof Sciences (KZZD-EW-16) and National Science Foundation ofChina (41201598, 41371540). This study was financially supportedby the Ministry of Science & Technology, China (2011DFB91710).
References
Abdalla, S.B., et al., 2012. Horizontal nutrient flows and balances in irrigated urbangardens of Khartoum, Sudan. Nutr. Cycl. Agroecosyst. 92 (2), 119e132.
Al Bakri, D., Rahman, S., Bowling, L., 2008. Sources and management of urbanstormwater pollution in rural catchments, Australia. J. Hydrol. 356 (3e4), 299e311.
Baker, L.A., et al., 2001. Nitrogen balance for the central Arizona-Phoenix (CAP)ecosystem. Ecosystems 4 (6), 582e602.
Barles, S., 2010. Society, energy and materials: the contribution of urban meta-bolism studies to sustainable urban development issues. J. Environ. Plan.Manag. 53 (4), 439e455.
Bettez, N.D., Groffman, P.M., 2012. Denitrification potential in stormwater controlstructures and natural riparian zones in an urban landscape. Environ. Sci.Technol. 46 (20), 10909e10917.
Burström, F., et al., 1997. Material flow accounting and information for environ-mental policies in the city of Stockholm. In: Analysis for Action: Support forPolicy towards Sustainability by Material Flow Accounting, actes de la confér-ence «Conaccount» de Wuppertal.
Canfield, D.E., Glazer, A.N., Falkowski, P.G., 2010. The evolution and future of Earth’snitrogen cycle. Science 330 (6001), 192e196.
Churkina, G., 2008. Modeling the carbon cycle of urban systems. Ecol. Model. 216(2SI), 107e113.
Collins, J.P., et al., 2000. A new urban ecology. Am. Sci. 88 (5), 416e425.Cucarella, V., et al., 2012. Recycling of calcium-silicate material after wastewater
filtration to agriculture e soil condition impact. Ecol. Chem. Eng. S-Chem.Inzynieria Ekol. S 19 (3), 373e382.
Cui, S.H., et al., 2013. Centennial-scale analysis of the creation and fate of reactivenitrogen in China (1910e2010). Proc. Natl. Acad. Sci. U. S. A. 110 (6), 2052e2057.
Faerge, J., Magid, J., de Vries, F., 2001. Urban nutrient balance for Bangkok. Ecol.Model. 139 (1), 63e74.
FAO, 2013. Food Wastage Footprint: Impacts on Natural Resources.Fissore, C., et al., 2011. Carbon, nitrogen, and phosphorus fluxes in household
ecosystems in the Minneapolis-Saint Paul, Minnesota, urban region. Ecol. Appl.21 (3), 619e639.
Forkes, J., 2007. Nitrogen balance for the urban food metabolism of Toronto, Canada.Resour. Conserv. Recycl. 52 (1), 74e94.
Goodland, R., Daly, H., 1996. Environmental sustainability: universal and non-negotiable. Ecol. Appl. 6 (4), 1002e1017.
Goonetilleke, A., et al., 2005. Understanding the role of land use in urban storm-water quality management. J. Environ. Manag. 74 (1), 31e42.
Granstedt, A., 2000. Reducing the nitrogen load to the Baltic Sea by increasing theefficiency of recycling within the agricultural system e experience of ecologicalagriculture in Sweden and Finland. Landbauforsch. Volkenr. 50 (3e4), 95e102.
Grimm, N.B., et al., 2004. Effects of urbanization on nutrient biogeochemistry ofaridland streams. Ecosyst. Land Use Change 153, 129e146.
Grimm, N.B., et al., 2008. Global change and the ecology of cities. Science 319(5864), 756e760.
Groffman, P.M., Crawford, M.K., 2003. Denitrification potential in urban riparianzones. J. Environ. Qual. 32 (3), 1144e1149.
Gu, B.J., et al., 2012. The long-term impact of urbanization on nitrogen patterns anddynamics in Shanghai, China. Environ. Pollut. 171, 30e37.
ogeochemistry for sustainable urbanization, Environmental Pollution

T. Lin et al. / Environmental Pollution xxx (2014) 1e7 7
Gu, B., et al., 2013. Nitrogen footprint in China: food, Energy, and nonfood goods.Environ. Sci. Technol. 47 (16), 9217e9224.
Heeb, A., Staudenmann, J., Schmid, B., 1996. Wastewater purification efficiency andgrowth of aquatic macrophytes e possible use in aquaculture for nutrientrecycling. In: Recycling the Resource: Proceedings of the Second InternationalConference on Ecological Engineering for Wastewater Treatment, 5-6: p. 375e377.
Huang, S., 2010. A recycling index for food and health security: urban Taipei. AsiaPac. J. Clin. Nutr. 19 (3), 402e411.
Johnson, R.C., et al., 2013. Macroinvertebrate community structure, secondaryproduction and trophic-level dynamics in urban streams affected by non-point-source pollution. Freshw. Biol. 58 (5), 843e857.
Kaye, J.P., et al., 2006. A distinct urban biogeochemistry? Trends Ecol. Evol. 21 (4),192e199.
Kennedy, C., Cuddihy, J., Engel-Yan, J., 2007. The changing metabolism of cities.J. Ind. Ecol. 11 (2), 43e59.
Khan, S., et al., 2013. Sewage sludge biochar influence upon Rice (Oryza sativa L)yield, metal bioaccumulation and greenhouse gas emissions from acidic paddysoil. Environ. Sci. Technol. 47 (15), 8624e8632.
Law, N., Band, L., Grove, M., 2004. Nitrogen input from residential lawn care prac-tices in suburban watersheds in Baltimore County, MD. J. Environ. Plan. Manag.47 (5), 737e755.
Leach, A.M., et al., 2012. A nitrogen footprint model to help consumers understandtheir role in nitrogen losses to the environment. Environ. Dev. 1 (1), 40e66.
Leigh, C.H., 1982. Urban-development and soil-erosion in Kuala-lumpur, Malaysia.J. Environ. Manag. 15 (1), 35e45.
Li, G.L., et al., 2012. Urban phosphorus metabolism through food consumption thecase of China. J. Ind. Ecol. 16 (4SI), 588e599.
Lin, T., et al., 2013. Greenhouse Gas emissions accounting of urban residentialconsumption: a household survey based approach. PLOS ONE 8, e556422.
Lin, A., Huang, S., Wahlqvist, M.L., 2009. Waste management to improve food safetyand security for health advancement. Asia Pac. J. Clin. Nutr. 18 (4), 538e545.
Liu, Y., et al., 2010. Eco-efficiency of urban material metabolism: a case study inXiamen, China. Int. J. Sustain. Dev. World Ecol. 17 (2), 142e148.
Liu, C., et al., 2012. Recent trends of nitrogen flow of typical agro-ecosystems inChina-major problems and potential solutions. J. Sci. Food Agric. 92 (5SI), 1046e1053.
Liu, C., et al., 2013. Impact assessment of human diet changes with rapid urbani-zation on regional nitrogen and phosphorus flowsda case study of the mega-city Shanghai. Environ. Sci. Pollut. Res., 1e10.
Luck, M.A., et al., 2001. The urban funnel model and the spatially heterogeneousecological footprint. Ecosystems 4 (8), 782e796.
Please cite this article in press as: Lin, T., et al., Managing urban nutrient bi(2014), http://dx.doi.org/10.1016/j.envpol.2014.03.038
Newman, P., 1999. Sustainability and cities: extending the metabolism model.Landsc. Urban Plan. 44 (4), 219e226.
NILSSON, J., 1995. A phosphorus budget for a Swedish Municipality. J. Environ.Manag. 45 (3), 243e253.
O’Neal, J.A., Boyer, T.H., 2013. Phosphate recovery using hybrid anion exchange:applications to source-separated urine and combined wastewater streams.Water Res. 47 (14), 5003e5017.
Pickett, S., et al., 2011. Urban ecological systems: scientific foundations and a decadeof progress. J. Environ. Manag. 92 (3), 331e362.
Qiao, M., Zheng, Y.M., Zhu, Y.G., 2011. Material flow analysis of phosphorus throughfood consumption in two megacities in northern China. Chemosphere 84 (6SI),773e778.
Ray, K., Mukherjee, C., Ghosh, A.N., 2013. A way to curb phosphorus toxicity in theenvironment: use of polyphosphate reservoir of cyanobacteria and microalga asa safe alternative phosphorus biofertilizer for Indian agriculture. Environ. Sci.Technol. 47 (20), 11378e11379.
Schlesinger, William H., E.S.B., 2013. Biogeochemistry: an Analysis of Global Change.Elsevier.
Wan, S.G., et al., 2013a. Anaerobic digestion of municipal solid waste composed offood waste, wastepaper, and plastic in a single-stage system: performance andmicrobial community structure characterization. Bioresour. Technol. 146, 619e627.
Wan, S.G., et al., 2013b. Biogas production and microbial community change duringthe co-digestion of food waste with chinese silver grass in a single-stageanaerobic reactor. Biotechnol. Bioprocess Eng. 18 (5), 1022e1030.
Wang, F., et al., 2011. The phosphorus footprint of China’s food Chain: implicationsfor food security, natural resource management, and environmental quality.J. Environ. Qual. 40 (4), 1081e1089.
Werner, C., 2000. Ecosan-a Holistic Approach to Material-flow-management inSanitation. Ecosan-closing the Loop inWastewater Management and Sanitation.
Wolman, A., 1965. Metabolism of cities. Sci. Am. 213 (3), 179.Zezza, A., Tasciotti, L., 2010. Urban agriculture, poverty, and food security: empirical
evidence from a sample of developing countries. Food Policy 35 (4), 265e273.Zhang, Y., 2013. Urban metabolism: a review of research methodologies. Environ.
Pollut. 178, 463e473.Zhang, Y., et al., 2009. Measurement and evaluation of the metabolic capacity of an
urban ecosystem. Commun. Nonlinear Sci. Numer. Simul. 14 (4), 1758e1765.Zhang, Y., et al., 2013. Phosphate separation and recovery fromwastewater by novel
electrodialysis. Environ. Sci. Technol. 47 (11), 5888e5895.Zhu, Y.G., et al., 2013. Diverse and abundant antibiotic resistance genes in Chinese
swine farms. Proc. Natl. Acad. Sci. U. S.. Am. 110 (9), 3435e3440.
ogeochemistry for sustainable urbanization, Environmental Pollution