managing the maintenance of virginia’s roads … · managing the maintenance of virginia’s...
TRANSCRIPT

Center for Risk Management of Engineering Systems University of Virginia, Charlottesville
Slide 1
MANAGING THE MAINTENANCE OF VIRGINIA’S ROADS AND HIGHWAYS
Progress Report
Presented toProject Steering Committee
By
Center for Risk Management of Engineering SystemsUniversity of Virginia
March 20, 2002

Center for Risk Management of Engineering Systems University of Virginia, Charlottesville
Slide 2
Team MembersCenter for Risk Management
of Engineering Systems:• Yacov Haimes• James Lambert• Barry Horowitz• Michael Pennock• Ruth Dicdican• Satish Kartha• John Robinson • Justin Rousseau• Alex Uhl• Chad Warner
Virginia Transportation Research Council:
• William Bushman• Wayne Ferguson• Jose Gomez• Robert Hanson• Dan Roosevelt (leading adviser)
VDOT:• Steve Mondul

Center for Risk Management of Engineering Systems University of Virginia, Charlottesville
Slide 3
Steering Committee• Steve Black – DTE, Fredericksburg
District• Bill Bushman - VTRC• William Bywaters – MOM, Warrenton• John Coleman – Asst. Bridge Engineer,
Structures and Bridge Division• Roger Clatterbuck – Assistant to the
DME, Culpeper• Bob Gibson – District Maintenance
Engineer, Culpeper• Jose Gomez - VTRC• Jane Gunter – Assistant to the DME,
Staunton• Rob Hanson –VTRC• Dan Hinderliter – Budget Director,
Maintenance Division• Otis Hinton – Superintendent Fisherville
AHQ, Verona Res.• Lisa Hughes – Resident Engineer,
Martinsville
• Dan Liston – State Maintenance Engineer • Glenn McMillan – District Maintenance
Engineer, Fredricksburg• Joe Mitchell – MOM, Dillwyn Residency• Bob Moore – Resident Engineer,
Warrenton• Brooke Mullery – Training and
Development Coordinator - HRD• Dan Roosevelt – VTRC• Dennis Shea – IMMS Project Manager,
Maintenance Division• Jim Smith – District Maintenance
Engineer, Richmond• Kamal Suliman – District Traffic
Operations Director• Jerry VanLear – Resident Engineer,
Verona• Bruce Wilkerson – Facility Manager for
Monitor Merrimac Memorial Bridge Tunnel

Center for Risk Management of Engineering Systems University of Virginia, Charlottesville
Slide 4
Outline• Introduction
– Multiple Objective Aspects
• Data Collection
• Current Budget Allocation Process
• Concept for a Needs-Based Approach– Residency
– District/State Maintenance Office
• Extensions
• Discussion Questions
Center for Risk Management of Engineering Systems University of Virginia, Charlottesville
Slide 5
Introduction
Center for Risk Management of Engineering Systems University of Virginia, Charlottesville
Slide 6
Motivation“The future of maintenance lies clearly along the lines of asset management, investment strategy and sound business decisions. With competition for scarce resources a certainty of life, the adoption of asset management principles and the completion of the underlying support structures and management systems are key to future improvements in efficiency and productivity.”
- Governor’s Commission on Transportation Policy, Final Report, December 15, 2000
Center for Risk Management of Engineering Systems University of Virginia, Charlottesville
Slide 7
Motivation (cont.)
• Virginia’s maintenance expenditure in FY 2001 was $837M (MPLG Budget and Expenditure Report, 2001) and in FY 2000 was $762M (Governor’s Commission, 2000).
• Increase in maintenance cost is expected to continue into the future.
• Competition for scarce monetary resources is prevalent.
• There is a need to make timely decisions in order to maintain transportation assets.

Center for Risk Management of Engineering Systems University of Virginia, Charlottesville
Slide 8
Goal
Develop a risk-cost-benefit modeling and analysis framework to aid the management of maintenance of
Virginia roads and highways by the Virginia Department of Transportation

Center for Risk Management of Engineering Systems University of Virginia, Charlottesville
Slide 9
Efficacy of Risk Management
Cost of Maintenance without Risk Management
Cost
δ
Cost of Maintenance with Risk Management
∆
∆>>δ
Time

Center for Risk Management of Engineering Systems University of Virginia, Charlottesville
Slide 10
Multiobjective Trade-offAnalysis is at the Heart of
Risk Management
Risks, costs, and benefits are often measured in different units; nevertheless, to manage the system, an acceptable balance is sought.

Center for Risk Management of Engineering Systems University of Virginia, Charlottesville
Slide 11
As we advance into the Terra Incognita of tomorrow, it is better to have a generaland incomplete map, subject to revision and correction, than to have no map at all.
Alvin Toffler, Powershift, Bantam Books, 1990(author of Future Shock)

Center for Risk Management of Engineering Systems University of Virginia, Charlottesville
Slide 12
Technological AgeRisk Management ≈ Optimal Balance
Uncertain UncertainBenefits Costs
Technology Management:
Man/Machine/Software•Planning•Design
•Operation
RiskManagement

Center for Risk Management of Engineering Systems University of Virginia, Charlottesville
Slide 13
Risk Assessment and Management
Risk assessment and management must be an integral part of the decisionmaking process, rather than a gratuitous add-on technical analysis.

Center for Risk Management of Engineering Systems University of Virginia, Charlottesville
Slide 14
Risk
A Measure of the Probability andSeverity of Adverse Effects
William W. Lowrance, 1976

Center for Risk Management of Engineering Systems University of Virginia, Charlottesville
Slide 15
Risk vs. Safety• Measuring risk is an empirical, quantitative,
scientific activity (e.g., measuring the probability and severity of harm).
• Judging safety is judging the acceptability of risks – a normative, qualitative, political activity.
(After William W. Lowrance, 1976)
Center for Risk Management of Engineering Systems University of Virginia, Charlottesville
Slide 16
Importance of Risk Assessmentand Management
Those private and public organizations who can successfully address the risk inherent in their business – whether future use of chemicals,environmental protection, future product design, resource availability, natural forces, or the reliability ofman/machine systems will dominate the technologicalmarket.

Center for Risk Management of Engineering Systems University of Virginia, Charlottesville
Slide 17
System Failure
HardwareFailure
HumanFailure
OrganizationalFailure
SoftwareFailure
Risk: is a measure of theprobability and severity ofadverse effects
Measuring Risk: is anempirical, quantitative, scientific activity
Safety: is the level of riskthat is deemed acceptable
Judging Safety: is a normative, qualitative, political activity

Center for Risk Management of Engineering Systems University of Virginia, Charlottesville
Slide 18
System FailureOrganizational Failure
KnowledgeManagement
Human Failure
InformationAssurance
Hardware Failure Software Failure

Center for Risk Management of Engineering Systems University of Virginia, Charlottesville
Slide 19
Risk Assessment andManagement

Center for Risk Management of Engineering Systems University of Virginia, Charlottesville
Slide 20
Risk Assessment
Risk Assessment• What can go wrong? • What is the likelihood that it would go wrong? • What are the consequences?
[Kaplan and Garrick 1981].
Answers to these questions help risk analysts identify, measure, quantify, and evaluate risks and their consequences and impacts.

Center for Risk Management of Engineering Systems University of Virginia, Charlottesville
Slide 21
Risk Management
Risk Management• What can be done and what options are available?• What are the associated trade-offs in terms of all
costs, benefits, and risks? • What are the impacts of current management
decisions on future options? [Haimes 1991, 1998].
Answers to these questions help decisionmakers build on the risk assessment process and benefit from sound current and future policy options and their associated tradeoffs.

Center for Risk Management of Engineering Systems University of Virginia, Charlottesville
Slide 22
Multiple Objective Aspects

Center for Risk Management of Engineering Systems University of Virginia, Charlottesville
Slide 23
Multiobjective Decisionmaking
The Student Dilemma
{Grade Point Average
Income for Part-Time Work
Leisure Time
Maximize

Center for Risk Management of Engineering Systems University of Virginia, Charlottesville
Slide 24
100
200
300
400
500
10 20 30 40 50
$/wk
f1(•)
hr./wk
INCOME FROM PART-TIME WORK

Center for Risk Management of Engineering Systems University of Virginia, Charlottesville
Slide 25
10 20 4030 6050 70 hr./wk.
GPA AS A FUNCTION OF STUDYING TIME
GPA
0.0
1.0
2.0
3.0
4.0
f2(•)

Center for Risk Management of Engineering Systems University of Virginia, Charlottesville
Slide 26
600
0 10 20 30 40 50 60 70 80 90
GPA( )•
2f ( )•1f
$/wk
GPA AS A FUNCTION OF STUDYING TIME
INCOME FROM PART-TIME WORK90 80 70 60 50 40 30 20 10 0
INCOME
GPA
4.0 500
4003.0
300
2.0
200
1.0100
00.0

Center for Risk Management of Engineering Systems University of Virginia, Charlottesville
Slide 27
The Student Dilemma(Pareto Optimal Frontier)
700
600
100
Inco
me
($/w
eek)
200
400
300
500
04.000.00 0.50 1.00 1.50 2.00 2.50 3.00 3.50
Grade Point Average

Center for Risk Management of Engineering Systems University of Virginia, Charlottesville
Slide 28
Data Collection

Center for Risk Management of Engineering Systems University of Virginia, Charlottesville
Slide 29
Meetings and Interviews• 12/18/01 – Bob Moore, Doug Bywaters, Warrenton
Residency• 12/21/01 – Malcolm Kerley, Structures and Bridge
Division• 12/21/01 – Dan Hinderliter, Maintenance Division• 2/15/02 – Doug Bywaters, Warrenton Residency• 3/5/02 – Roger Clatterbuck, Culpeper District• 3/5/02 – David Pierce, Culpeper District Bridge Office• Several meetings with VTRC staff and managers

Center for Risk Management of Engineering Systems University of Virginia, Charlottesville
Slide 30
Sample of Information Collected

Center for Risk Management of Engineering Systems University of Virginia, Charlottesville
Slide 31
Sample of Information Collected (cont.)

Center for Risk Management of Engineering Systems University of Virginia, Charlottesville
Slide 32
Current Budget Allocation Process

Center for Risk Management of Engineering Systems University of Virginia, Charlottesville
Slide 33
Current Budget Allocation Process
MPLG
State Maintenance Allocation
District Allocations
Residency Allocations
District
Special Sections
AreaHistorical District Allocations
Feedback
Area AllocationsDistrict
Residency
Residency AreaHistorical Allocations, Lane Mileage, Inventoried Structures, Bridge Inspections
Feedback
AreaHistorical Allocations, Bridge Inspections, Superintendent Input Superintendent
Assessments

Center for Risk Management of Engineering Systems University of Virginia, Charlottesville
Slide 34
Current Budget Allocation Process (cont.)
MPLG
NEGOTIATION
1 2 9j… …District
1 2 nk… …
BUDGET
Residency
Assets
Pavements(PMP)
Bridges(Pontis)
Others(ICAS)
Center for Risk Management of Engineering Systems University of Virginia, Charlottesville
Slide 35
Current Budget Allocation: MPLG
• Allocations to Districts are based on allocations of previous years.
• Adjustments are made considering state budgetary changes and changes in the maintenance burdens of the Districts.
• Decisions are made by consensus.

Center for Risk Management of Engineering Systems University of Virginia, Charlottesville
Slide 36
Current Budget Allocation: Culpeper District
• Culpeper District receives budget allocations from the MPLG for specific programs:– Base budget (95.1%)– Replacement of signs for all systems (1.0%)– Preventative maintenance bridges (0.6%)– Preventative maintenance pavements (1.2%)– Guardrail upgrades and replacements (1.3%)– Diamond grading rollup signs (0.4%)– Nationwide permits (0.2%)– Additional inventory (0.2%)
Center for Risk Management of Engineering Systems University of Virginia, Charlottesville
Slide 37
Current Budget Allocation: Culpeper District (cont.)
• The base budget consists of expenses for salaries, equipment, ferry, liquid calcium, mowing, litter control, landfill fees, fencing, tree and brush removal, hydroseeding, sign maintenance, and uniforms.
• The base budget also covers the expenses and salaries of the divisions: Structure and Bridge, Environmental, District Maintenance, Traffic Engineering, and Pavement Management.
• Excess funds are classified as funds for additional allocation.
Center for Risk Management of Engineering Systems University of Virginia, Charlottesville
Slide 38
Current Budget Allocation: Culpeper District (cont.)
• Culpeper District allocates the given budget using:– Lane miles
• Preventative Maintenance Pavements• Guardrail Upgrades and Replacement• Additional Inventory• Additional Allocation
– Number of inventoried structures• Preventative Maintenance Bridges
– Secondary lane miles• Sign Replacement

Center for Risk Management of Engineering Systems University of Virginia, Charlottesville
Slide 39
Current Budget Allocation: Warrenton Residency
• The Residency receives its budget from the District.
• The budget allocation is determined from historical and special needs for increased funding (determined by lane mileage and safety).
• The Residency then looks at the budget history of its area headquarters.

Center for Risk Management of Engineering Systems University of Virginia, Charlottesville
Slide 40
Current Budget Allocation: Warrenton Residency (cont.)
• Funds are allocated to the area headquarters based on past expenditures. Funding is typically increased by 5%.
• Funds are also allocated for maintenance, construction, and bridges. Any funds left over are used for sidewalks, gutters, culverts, guardrails, and others.
Center for Risk Management of Engineering Systems University of Virginia, Charlottesville
Slide 41
Current Budget Allocation: Warrenton Residency (cont.)
• Funds are allocated to each area for specific activities (e.g., patching and mowing).
• Remaining funds are allocated for specific assets (e.g., pavement replacements). Budget tradeoffs are made on a daily basis. The decision horizon is usually one month.

Center for Risk Management of Engineering Systems University of Virginia, Charlottesville
Slide 42
Challenges and Opportunities
• Develop an allocation system that is driven by the needs of Residencies and Districts such that the allocation is directed to areas where it achieves greatest benefit
• Incorporate engineering and economic principles to determine actions that result in least life-cycle costs

Center for Risk Management of Engineering Systems University of Virginia, Charlottesville
Slide 43
Challenges and Opportunities (cont.)
• Perform trade-offs among competing objectives (e.g., immediate (short-term) cost and long-term costs)
• Identify extreme events that influence maintenance and vice versa
Center for Risk Management of Engineering Systems University of Virginia, Charlottesville
Slide 44
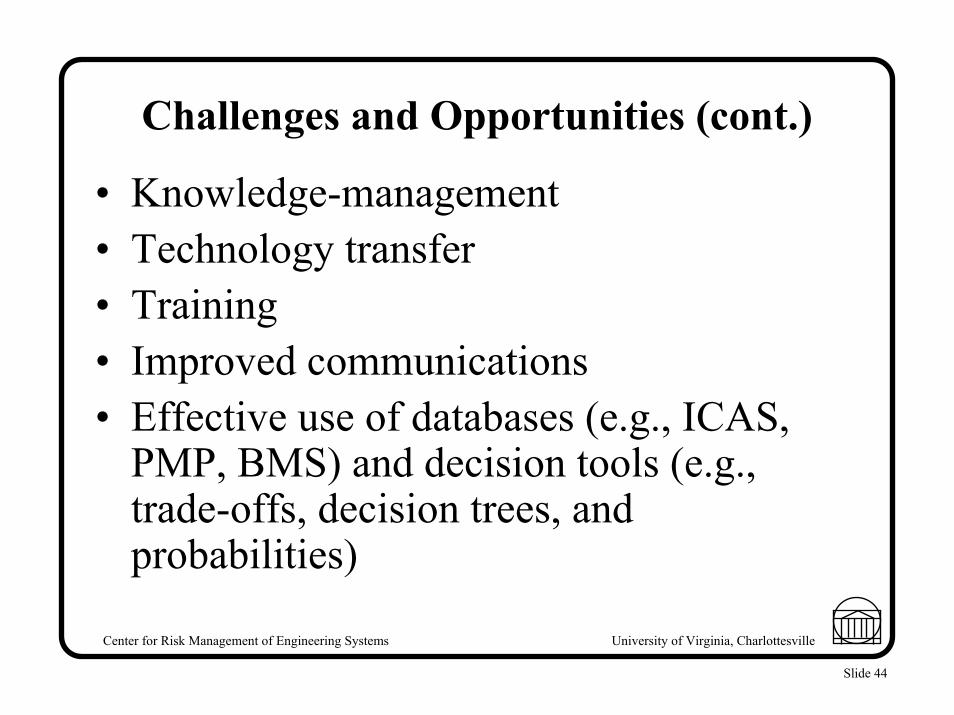
Challenges and Opportunities (cont.)
• Knowledge-management• Technology transfer• Training• Improved communications• Effective use of databases (e.g., ICAS,
PMP, BMS) and decision tools (e.g., trade-offs, decision trees, and probabilities)
Center for Risk Management of Engineering Systems University of Virginia, Charlottesville
Slide 45
Concept for a Needs-Based Approach

Center for Risk Management of Engineering Systems University of Virginia, Charlottesville
Slide 46
Needs-Based Approach
MPLG
1 2 9j… …District
1 2 nk… …Residency
Assets
Pavements (PMP)
Bridges(Pontis)
Others(ICAS)
BUDGET
NEEDS

Center for Risk Management of Engineering Systems University of Virginia, Charlottesville
Slide 47
Needs-Based Approach (cont.)
Needs Assessment
Identification of Maintenance Options
Evaluation of Maintenance Options
Filtering of Maintenance Options
Aggregation of Maintenance Options
Evaluation of Maintenance Policies

Center for Risk Management of Engineering Systems University of Virginia, Charlottesville
Slide 48
Needs-Based Approach (cont.)
Pavements (PMP)Bridges (BMS) Needs Assessment Others (ICAS)
Identification of Maintenance Options
Pavement Management Program
Bridge Management System (Pontis)Evaluation of Maintenance OptionsDecision Trees
Threshold Values Filtering of Maintenance Options
Aggregation of Maintenance Options
Set of viable policiesEvaluation of Maintenance Policies

Center for Risk Management of Engineering Systems University of Virginia, Charlottesville
Slide 49
Needs-Based Approach (cont.)Short-term Cost, Long-term cost, Average Condition
Maintenance OptionsPMP
Residency Staff
Pontis
ICAS
Visual Inspections
Level of Service Requirements, Policies
Modeling Option Aggregation
Viable Sets of Maintenance Options
Allocation Recommendations
Option EvaluationFeedback Budget

Center for Risk Management of Engineering Systems University of Virginia, Charlottesville
Slide 50
Definition of Maintenance Policy
A policy is an aggregation of
maintenance options for all assets
under consideration.

Center for Risk Management of Engineering Systems University of Virginia, Charlottesville
Slide 51
Principle for Evaluation of Maintenance Options
Short-term Cost
∆ Cost
Long-term Cost (NPV)∆ Cost

Center for Risk Management of Engineering Systems University of Virginia, Charlottesville
Slide 52
Viable (Pareto optimal) Pavement Options
Pareto Optimal Pavement Policies
$-
$10
$20
$30
$40
$50
$60
$70
$80
$90
$100
$- $10 $20 $30 $40 $50 $60 $70 $80 $90 $100
Long-term Cost (Annualized, thousands)
Shor
t-ter
m C
ost (
thou
sand
s)

Center for Risk Management of Engineering Systems University of Virginia, Charlottesville
Slide 53
Evaluation of Maintenance Options
• Primary objectives
*6-year horizon is used
Criteria Metric
Short-term cost Immediate cost; Cost of maintenance action for current year
Long-term cost Expected net present value of the cost of a sequence of future maintenance actions
Condition Expected average condition over a set horizon

Center for Risk Management of Engineering Systems University of Virginia, Charlottesville
Slide 54
Evaluation of Maintenance Options (cont.)
• Applying these three objectives enables us to only consider those combinations of maintenance options that meet cost and performance constraints.
• In finding the viable set of policies, we employ only two objectives: long-term cost and short-term cost.

Center for Risk Management of Engineering Systems University of Virginia, Charlottesville
Slide 55
Evaluation of Maintenance Options (cont.)
• When we assume a minimum level-of-service requirement for the highway system, long-term costs fall as average condition rises.
• Therefore, long-term cost and condition are not conflicting, and we only need one to find the viable (Pareto optimal) set.

Center for Risk Management of Engineering Systems University of Virginia, Charlottesville
Slide 56
Evaluation of Maintenance Options (cont.)
• Secondary objectivesCriteria Metric
Ride quality Performance Capacity sufficiency Safety Change in accident rate
Reliability Probability of design requirements shortfall
Ride quality Traffic disruption Local acceptance
Customer satisfaction
Public opinion Detour length Accessibility Local (area) importance
Average daily traffic Economic benefit Network importance Appearance Appearance improvement

Center for Risk Management of Engineering Systems University of Virginia, Charlottesville
Slide 57
Approach Overview: Residency
Residency Staff
Maintenance Options
Options Modeling
Options EvaluationDatabase
PMPBMS(Pontis)ICAS
1. Option A2. Option B3. Do Nothing
1. Option A2. Option B3. Do Nothing
Pavement Management Program
Bridge Management System (Pontis)

Center for Risk Management of Engineering Systems University of Virginia, Charlottesville
Slide 58
Approach Overview: District/MPLG
District/MPLG Staff
Policy Aggregation and Tradeoff AnalysisOptions Evaluation
Residencies/Districts
Center for Risk Management of Engineering Systems University of Virginia, Charlottesville
Slide 59
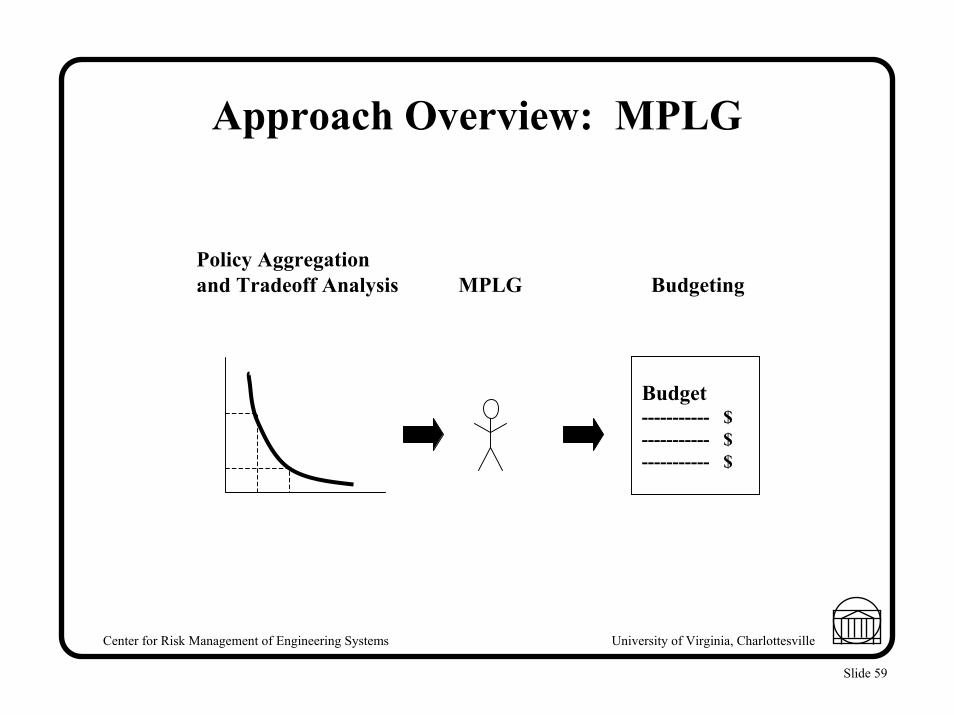
Approach Overview: MPLG
Policy Aggregation and Tradeoff Analysis MPLG Budgeting
Budget----------- $----------- $----------- $

Center for Risk Management of Engineering Systems University of Virginia, Charlottesville
Slide 60
Approach Overview: Feedback and Fine-Tuning
MPLG
1 2 9j… …District
Residency 1 2 nk… …

Center for Risk Management of Engineering Systems University of Virginia, Charlottesville
Slide 61
Residency: Step-by-Step

Center for Risk Management of Engineering Systems University of Virginia, Charlottesville
Slide 62
Approach Details: Residency
B1Asset Condition
Area Supervisor
Needs Assessment
B1
B3
B2Option 1 - Repaint
Option 2 – Do Nothing
B3 Option 1 - Resurface
B4
Option 2 – Do Nothing

Center for Risk Management of Engineering Systems University of Virginia, Charlottesville
Slide 63
Approach Details: Residency (cont.)
Consider Asset B1
Option 1 - Repaint
Option 2 – Do Nothing
Primary Objectives Long-
term $Long-term $
Condition
Size = Short-term $
Short-term $
Secondary Objectives + Priority Level
Risk Fingerprinting

Center for Risk Management of Engineering Systems University of Virginia, Charlottesville
Slide 64
Approach Details: Residency (cont.)% Completed
Long –term $ Size =
Short-term $
Condition
Priority1 2 3
+ Priority Level
Long-term $
Condition
Size = Short-term $
+ Priority Level
Long-term $
Condition
Size = Short-term $
DistrictDifferent Assets
+ Priority Info
Long-term $
Condition
Size = Short-term $
Resident Engineer

Center for Risk Management of Engineering Systems University of Virginia, Charlottesville
Slide 65
Examples of Identification of Maintenance Options
• Crack sealing– application of a sealing material directly into the cracks or joints
• Fog seals– application of material sprayed directly on surface of existing
pavement
• Chip seals– spray application of binder immediately covered by a layer of
one-sized or graded aggregate
• Thin cold-mix seals– application of mixtures of emulsions, aggregates, portland
cement, and chemicals directly on pavement

Center for Risk Management of Engineering Systems University of Virginia, Charlottesville
Slide 66
Examples of Identification of Maintenance Options (cont.)
Pontis Bridge Management System• We can use the database contained in Pontis to
predict future conditions of bridge elements and determine maintenance needs over a fixed horizon.
• We can also use Pontis to analyze preservation and improvement options for bridges.

Center for Risk Management of Engineering Systems University of Virginia, Charlottesville
Slide 67
Examples of Identification of Maintenance Options (cont.)
Multiobjective Decision Tree• Composed of decision nodes and chance nodes• Each pairing of an alternative and a state of nature is
characterized by a vector-valued performance measure.
Maintenance Options
Scenarios short-term ,cost
long-termcost

Center for Risk Management of Engineering Systems University of Virginia, Charlottesville
Slide 68
Examples of Identification of Maintenance Options (cont.)
• We use PMP, BMS (Pontis), and decision trees to look at different maintenance scenarios that can occur over a specified horizon.
• With these systems, we can determine short-and long-term maintenance costs and asset condition for each scenario.

Center for Risk Management of Engineering Systems University of Virginia, Charlottesville
Slide 69
Principle for Evaluation of Maintenance Options
Short-term Cost
∆ Cost
Long-term Cost (NPV)∆ Cost

Center for Risk Management of Engineering Systems University of Virginia, Charlottesville
Slide 70
Filtering of Maintenance Options: Risk Fingerprinting
ADT Detour Network Importance
Local Importance
High Priority Filter
ADT Detour Network Importance
Local Importance
Low Priority Filter

Center for Risk Management of Engineering Systems University of Virginia, Charlottesville
Slide 71
Filtering of Maintenance Options: Risk Fingerprinting (cont.)
ADT Detour Network Importance
Local Importance
Option 1
ADT Detour Network Importance
Local Importance
Option 2

Center for Risk Management of Engineering Systems University of Virginia, Charlottesville
Slide 72
Filtering of Maintenance Options: Risk Fingerprinting (cont.)
Option 1- High Filter
ADT Detour Network Importance
LoImportance
cal
High Priority

Center for Risk Management of Engineering Systems University of Virginia, Charlottesville
Slide 73
Filtering of Maintenance Options: Risk Fingerprinting (cont.)
ADT Detour Network Importance
Local Importance
Option 2 – High Filter
ADT Detour Network Importance
Local Importance
Option 2 – Low Filter
Medium Priority

Center for Risk Management of Engineering Systems University of Virginia, Charlottesville
Slide 74
Aggregation of Maintenance Options
HighHighHighHighHighHighLocal Importance
LowLowLowLowLowLowNetwork Importance
DecreaseIncreaseDecreaseIncreaseDecreaseIncreaseRide Quality
111122Detour Length (miles)
65065010001000500500ADT
N/AMedN/AHighN/AMedPriority
436492405463470495Long-Term Condition
99541188713599Long-Term Cost (thousand)
020035040Short-Term Cost (thousand)
Defer2” ACDefer2” ACDefer2” ACOption
Pavement 3 (0.4 mi) Pavement 2 (0.6 mi) Pavement 1 (0.9 mi) Asset

Center for Risk Management of Engineering Systems University of Virginia, Charlottesville
Slide 75
Aggregation of Maintenance Options (cont.)
• We are concerned with the aggregate performance and costs of the highway system. Therefore, we should examine combinations of maintenance options.
• By examining the possible combinations of options, we can find maintenance policies that fall within budgetary and performance constraints.

Center for Risk Management of Engineering Systems University of Virginia, Charlottesville
Slide 76
Aggregation of Maintenance Options: Example
• Assume we have two sections of pavement with the following options
$30,000AC MixPavement 1
$0Do Nothing
$22,000AC MixPavement 2
$0Do Nothing

Center for Risk Management of Engineering Systems University of Virginia, Charlottesville
Slide 77
Aggregation of Maintenance Options: Example (cont.)
• From these possible actions we can generate four possible policy options, each with its own cost.
0Do NothingDo Nothing4
22000AC MixDo Nothing3
30000Do NothingAC Mix2
52000AC MixAC Mix1
CostPavement 2 ActionPavement 1 ActionPolicy

Center for Risk Management of Engineering Systems University of Virginia, Charlottesville
Slide 78
Aggregation of Maintenance Options (cont.)
• The previous example illustrates the basic option aggregation procedure. In order to make it complete, however, there are two additions to the process:– We do not just consider a single maintenance action
on a particular asset. Rather we look at series of actions taken on that asset over time.
– We examine the policies in terms of both their short-term cost and their long-term cost.

Center for Risk Management of Engineering Systems University of Virginia, Charlottesville
Slide 79
Aggregation of Maintenance Options (cont.)
• We should eliminate policies that are dominated (i.e., there is another policy that outperforms it in every way).
• We are left with the viable (Pareto optimal) set of possible maintenance policies.

Center for Risk Management of Engineering Systems University of Virginia, Charlottesville
Slide 80
Aggregation of Maintenance Options (cont.)
Short Term Cost
DOMINATED Maintenance Policy
Long Term Cost

Center for Risk Management of Engineering Systems University of Virginia, Charlottesville
Slide 81
Obj 1
Obj 2
Aggregation of Maintenance Options (cont.)
Assets 1, 2, 3, & 4
Obj 1 Obj 1
Assets 3 & 4Assets 1 & 2
Obj 2 Obj 2
Obj 1 Obj 1 Obj 1 Obj 1
Obj 2 Obj 2 Obj 2 Obj 2
Asset 1 Asset 2 Asset 3 Asset 4

Center for Risk Management of Engineering Systems University of Virginia, Charlottesville
Slide 82
Aggregation of Maintenance Options (cont.)
• After the aggregation, we should end up with an output like the following (six year horizon):
• All of these policies are viable (Pareto optimal) and we can plot them in order to see the tradeoffs.
240952” AC2” AC2” AC5
272602” ACDefer2” AC4
276552” AC2” ACDefer3
308202” ACDeferDefer2
353-DeferDeferDefer1
Long-Term Cost (thousand)
Short-Term Cost (thousand)Pavement 3Pavement 2Pavement 1Policy

Center for Risk Management of Engineering Systems University of Virginia, Charlottesville
Slide 83
Viable (Pareto optimal) Pavement Options
Pareto Optimal Pavement Policies
$-
$10
$20
$30
$40
$50
$60
$70
$80
$90
$100
$200 $220 $240 $260 $280 $300 $320 $340 $360 $380
Long-term Cost (NPV, thousands)
Shor
t-ter
m C
ost (
thou
sand
s)

Center for Risk Management of Engineering Systems University of Virginia, Charlottesville
Slide 84
Viable (Pareto optimal) Pavement Options (cont.)
Pareto Optimal Pavement Policies
$-
$10
$20
$30
$40
$50
$60
$70
$80
$90
$100
$- $10 $20 $30 $40 $50 $60 $70 $80 $90 $100
Long-term Cost (Annualized, thousands)
Shor
t-ter
m C
ost (
thou
sand
s)

Center for Risk Management of Engineering Systems University of Virginia, Charlottesville
Slide 85
Aggregation of Maintenance Options (cont.)
• We may also look at the average pavement conditions that result from these policies.
• We can plot the average pavement condition as the bubble size in a bubble chart.
81240952” AC2” AC2” AC5
77272602” ACDefer2” AC4
79276552” AC2” ACDefer3
76308202” ACDeferDefer2
73353-DeferDeferDefer1
Long-Term Ave. Condition
Long-Term Cost (thousand)
Short-Term Cost
(thousand)
Pavement 3Pavement 2Pavement 1Policy

Center for Risk Management of Engineering Systems University of Virginia, Charlottesville
Slide 86
Pavement Options with Conditions
Pareto Optimal Pavement Policies
$-
$20
$40
$60
$80
$100
$120
$200 $220 $240 $260 $280 $300 $320 $340 $360 $380
Thou
sand
s
Thousands
Long-term Cost (NPV)
Shor
t-ter
m C
ost
73
76
79
77
81

Center for Risk Management of Engineering Systems University of Virginia, Charlottesville
Slide 87
District/State Maintenance Office: Step-by-Step

Center for Risk Management of Engineering Systems University of Virginia, Charlottesville
Slide 88
Approach Details: District/State Maintenance Office
% Completed
Long –term $ Size =
Short-term $
Condition
Priority1 2 3
District/ State Maintenance Office Staff
+ Priority Info
Long-term $
Condition
Size = Short-term $
+ Priority Info
Long-term $
Condition
Size = Short-term $
+ Priority Info
Long-term $
Condition
Size = Short-term $
Residencies / Districts

Center for Risk Management of Engineering Systems University of Virginia, Charlottesville
Slide 89
Aggregation of Maintenance Options
The aggregation of maintenance options occurs at the residency level, the district level, and the
state level.

Center for Risk Management of Engineering Systems University of Virginia, Charlottesville
Slide 90
Evaluation of Maintenance Policies
• Once we have selected a set of candidate policies, we can compare them in terms of their costs, predicted asset conditions, accomplishment of priorities, and accomplishment on the secondary metrics.

Center for Risk Management of Engineering Systems University of Virginia, Charlottesville
Slide 91
Evaluation of Maintenance Policies:Demonstration
• For illustration purposes, we simulated two maintenance policies for the district level using a six-year horizon.
• Let us assume that we are comparing two policies and we are primarily concerned with priority accomplishment and ride quality. The following charts show how we could compare these policies.

Center for Risk Management of Engineering Systems University of Virginia, Charlottesville
Slide 92
Evaluation of Maintenance Policies: Demonstration (cont.)
Policy Comparison - Priority Accomplishment
0102030405060708090
100
High PriorityAccomplishment
(%)
Med PriorityAccomplishment
(%)
Low PriorityAccomplishment
(%)
% o
f Tas
ks A
chie
ved
Option 1Option 2

Center for Risk Management of Engineering Systems University of Virginia, Charlottesville
Slide 93
Evaluation of Maintenance Policies: Demonstration (cont.)
Policy Comparison - Ride Quality
0
10
20
30
40
50
60
70
80
90
100
Decreases Same Increases
% o
f Mai
nten
ance
Act
ions
Option 1Option 2

Center for Risk Management of Engineering Systems University of Virginia, Charlottesville
Slide 94
Evaluation of Maintenance Policies Demonstration (cont.)
• These are just two possible evaluation criteria. The following are examples of other possible information that can be derived for an a particular maintenance policy.

Center for Risk Management of Engineering Systems University of Virginia, Charlottesville
Slide 95
Evaluation of Maintenance Policies: Demonstration (cont.)
Short Term Cost ($ million) 60Long Term Cost (NPV, $ million) 485Long Term Avg Bridge Condition 80Long Term Avg Road Condition 74High Priority Accomplishment (%) 85Med Priority Accomplishment (%) 60Low Priority Accomplishment (%) 20
Bridge High Priority Accomplishment (%) 87Bridge Med Priority Accomplishment (%) 55Bridge Low Priority Accomplishment (%) 18
Road High Priority Accomplishment (%) 84Road Med Priority Accomplishment (%) 63Road Low Priority Accomplishment (%) 21

Center for Risk Management of Engineering Systems University of Virginia, Charlottesville
Slide 96
Evaluation of Maintenance Policies: Demonstration (cont.)
Policy 1 - Bridge Priority Accomplishment
0102030405060708090
100
Bridge High PriorityAccomplishment (%)
Bridge Med PriorityAccomplishment (%)
Bridge Low PriorityAccomplishment (%)
% o
f Tas
ks A
chie
ved
Policy 1 - Road Priority Accomplishment
0102030405060708090
100
Road High PriorityAccomplishment (%)
Road Med PriorityAccomplishment (%)
Road Low PriorityAccomplishment (%)
% o
f Tas
ks A
chie
ved

Center for Risk Management of Engineering Systems University of Virginia, Charlottesville
Slide 97
Evaluation of Maintenance Policies: Demonstration (cont.)
Network Importance
0
20
40
60
80
100
Low Med High
Ride Quality
0
20
40
60
80
100
Decreases Same Increases
Public Opinion
0
20
40
60
80
100
Unfavorable Indifferent Favorable
Local Importance
0
20
40
60
80
100
Low Med High

Center for Risk Management of Engineering Systems University of Virginia, Charlottesville
Slide 98
Evaluation of Maintenance Policies: Demonstration (cont.)
Residency Charlottesville Culpeper Louisa WarrentonBudget (million $)Bridges 7 8 5 7Roads 4 5 4 5Total 11 13 9 12Long Term CostBridges 57 64 40 56Roads 32 40 32 40Total 89 104 72 96Long Term ConditionBridges Avg 83 78 75 85Roads Avg 75 73 72 77

Center for Risk Management of Engineering Systems University of Virginia, Charlottesville
Slide 99
Evaluation of Maintenance Policies: Demonstration (cont.)
Residency Charlottesville Culpeper Louisa WarrentonPrioritiesBridges High 85 86 90 88Bridges Med 50 58 60 55Bridges Low 10 11 22 30Roads High 87 88 78 83Roads Med 55 60 65 69Roads Low 18 20 22 23Total High 84 86 87 84Total Med 58 60 63 60Total Low 23 10 40 13ADTBridges 30025 9125 8735 10705Roads 52000 15000 10000 46000Total 82025 24125 18735 56705DetourBridges 25 172 221 149Roads 30 42 50 32Total 55 214 271 181

Center for Risk Management of Engineering Systems University of Virginia, Charlottesville
Slide 100
Evaluation of Maintenance Policies: Demonstration (cont.)
Long Term Expected Road Condtion
0102030405060708090
100
Charlottesville Culpeper Louisa Warrenton
Long Term Expected Bridge Condtion
0102030405060708090
100
Charlottesville Culpeper Louisa Warrenton

Center for Risk Management of Engineering Systems University of Virginia, Charlottesville
Slide 101
Evaluation of Maintenance Policies: Demonstration (cont.)
Charlottesville Priority Accomplishment
0
10
20
30
40
50
60
70
80
90
100
High Med Low
% A
chie
ved
Louisa Priority Accomplishment
0
10
20
30
40
50
60
70
80
90
100
High Med Low
% A
chie
ved
Culpeper Priority Accomplishment
0
10
20
30
40
50
60
70
80
90
100
High Med Low
% A
chie
ved
Warrenton Priority Accomplishment
0
10
20
30
40
50
60
70
80
90
100
High Med Low
% A
chie
ved

Center for Risk Management of Engineering Systems University of Virginia, Charlottesville
Slide 102
Evaluation of Maintenance Policies: Demonstration (cont.)
Residency Allocations
0
2
4
6
8
10
12
14
Charlottesville Culpeper Louisa Warrenton

Center for Risk Management of Engineering Systems University of Virginia, Charlottesville
Slide 103
MPLG
Decision Making Process

Center for Risk Management of Engineering Systems University of Virginia, Charlottesville
Slide 104
Extensions

Center for Risk Management of Engineering Systems University of Virginia, Charlottesville
Slide 105
Extensions
• Evaluate methods for combining and performing trade-offs among bridge and pavement policies
• Add uncertainty intervals to cost and condition estimates
• Introduce consideration of extreme events• Introduce risk metrics to the prioritization
procedure

Center for Risk Management of Engineering Systems University of Virginia, Charlottesville
Slide 106
Discussion Questions

Center for Risk Management of Engineering Systems University of Virginia, Charlottesville
Slide 107
Discussion Questions
• Knowledge Based Questions1. How do engineers and other VDOT personnel
communicate within a residency? Among residencies within a district? Among districts?
2. Do you share information? How do you share experiences? Do you meet once a month or occasionally to compare experiences?
3. How do people from maintenance deal with people in other divisions (e.g., construction)?

Center for Risk Management of Engineering Systems University of Virginia, Charlottesville
Slide 108
Discussion Questions (cont.)
• Knowledge Based Questions (cont.)4. How do you ensure that experiences and
knowledge in one district is transferred and utilized by other districts?
5. What do you do to promote continuing education and training of engineers and staff?
6. What do we (UVA) need to do in order to start developing people who can use what we have developed?

Center for Risk Management of Engineering Systems University of Virginia, Charlottesville
Slide 109
Discussion Questions (cont.)
• Data collection7. Is there a relationship between long-term cost (total
cost associated with a series of maintenance actions over a fixed horizon) and asset condition?
8. Can you suggest topics or areas for case study or demonstration purposes that balance short-term and long-term maintenance costs?
9. Where can we get data on maintenance actions and costs (per sq. yd. or per mi.) to use for demonstration purposes?

Center for Risk Management of Engineering Systems University of Virginia, Charlottesville
Slide 110
Discussion Questions (cont.)
• Data collection (cont.)10. How are the probabilities used in Pontis obtained?
Are there probabilities for other assets (e.g., roads, signs, and pipes)?
11. Do you feel that the experience with VMS was beneficial? Is there anything that we can learn from the VMS experience?

Center for Risk Management of Engineering Systems University of Virginia, Charlottesville
Slide 111
Discussion Questions (cont.)• Data collection (cont.)
12. These are some objectives that can be used to evaluate maintenance options. Are these sufficient? What other objectives can you suggest?
Criteria M etric Ride quality Performance Capacity sufficiency
Safety Change in accident rate
Reliability Probability of design requirements shortfall
Ride quality Traffic disruption Local acceptance
Customer satisfaction
Public opinion Detour length Accessibility Local (area) importance
Average daily traffic Economic benefit Network importance Appearance Appearance improvement

Center for Risk Management of Engineering Systems University of Virginia, Charlottesville
Slide 112
Discussion Questions (cont.)
• Risk Management13. How can you help to identify a range of
unexpected and/or undetected conditions that can have an impact to maintenance activities at facility, Residency, District, and statewide levels (e.g., heavy snow seasons, other weather patterns, actions of other agencies, financial stringencies)?
14. How can you help to characterize the impacts of the conditions above (Question 13)?
15. How can you help to generate policy options to mitigate the conditions above (Question 13)?

Center for Risk Management of Engineering Systems University of Virginia, Charlottesville
Slide 113
Discussion Questions (cont.)
• Risk Management (cont.)16. How can you help to identify benefit-to-cost
measurements in order to evaluate the policy options above (Question 13)?
17. How can you help to identify the influence of maintenance activities to the potential occurrence of extreme conditions at facility, Residency, District, and statewide levels (e.g., lane or bridge closures due to unforeseen or undetected deterioration of structures or pavements)?
18. How can you help to characterize the impacts of the conditions above (Question 17)?

Center for Risk Management of Engineering Systems University of Virginia, Charlottesville
Slide 114
Discussion Questions (cont.)
• Risk Management (cont.)19. How can you help to generate policy options to
mitigate the conditions above (Question 17)?20. How can you help to identify benefit-to-cost
measurements in order to evaluate the policy options above (Question 17)?
21. How can you help to identify a range of alternative maintenance policies at facility, Residency, District, and statewide levels?

Center for Risk Management of Engineering Systems University of Virginia, Charlottesville
Slide 115
Discussion Questions (cont.)
• Risk Management (cont.)22. How can you help to estimate the short-term costs
of implementing the above maintenance policies (Question 21)?
23. How can you help to characterize the potential lifecycle costs (where incurred, when incurred, to whom, under what conditions) of the above maintenance policies (Question 21)?