virginia’s economic development landscape hampton roads association of financial professionals...
TRANSCRIPT

VIRGINIA’S ECONOMIC DEVELOPMENT LANDSCAPE
HAMPTON ROADS ASSOCIATION OF FINANCIAL PROFESSIONALS
ROBERT W. MCCLINTOCK RESEARCH DIRECTOR
FEBRUARY 14, 2012
VIRGINIA UNEMPLOYMENT
2
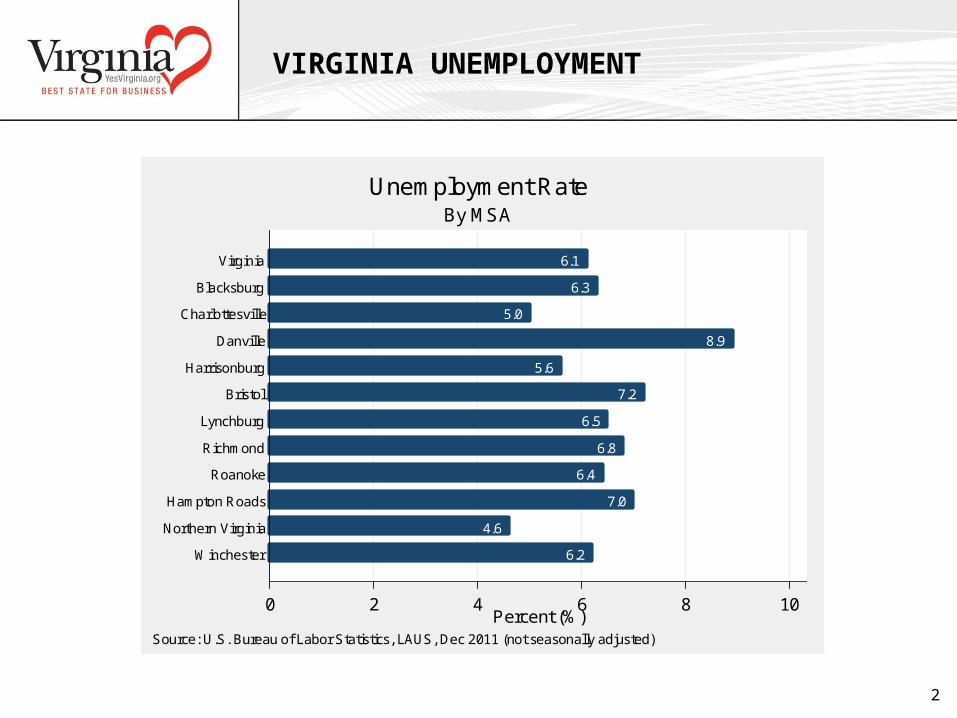
6.2
4.6
7.0
6.4
6.8
6.5
7.2
5.6
8.9
5.0
6.3
6.1
0 2 4 6 8 10Percent (%)
Winchester
Northern Virginia
Hampton Roads
Roanoke
Richmond
Lynchburg
Bristol
Harrisonburg
Danville
Charlottesville
Blacksburg
Virginia
Source: U.S. Bureau of Labor Statistics, LAUS, Dec 2011 (not seasonally adjusted)
By MSAUnemployment Rate
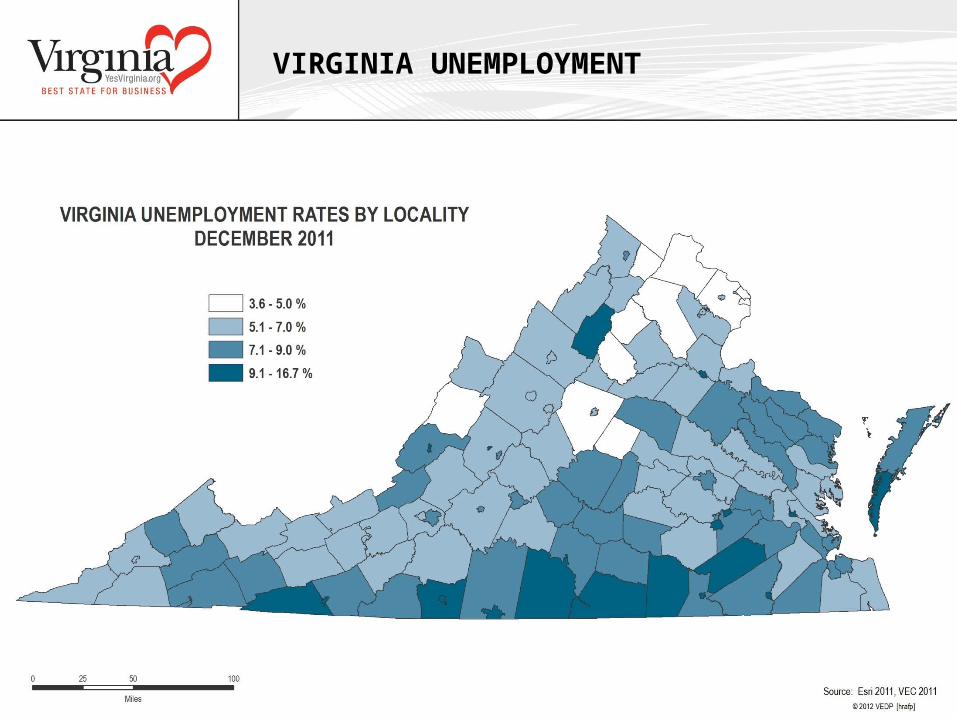
VIRGINIA UNEMPLOYMENT
3

VIRGINIA UNEMPLOYMENT
4
2.0
4.0
6.0
8.0
10.
0P
erc
ent (
%)
Jan 2000Jan 2001
Jan 2002Jan 2003
Jan 2004Jan 2005
Jan 2006Jan 2007
Jan 2008Jan 2009
Jan 2010Jan 2011
United States Virginia
Hampton Roads MSA
Source: U.S. Bureau of Labor Statistics (Not Seasonally Adjusted)
United States, Virginia, and Hampton Roads MSAUnemployment Rate

5
20%
Blacksburg CharlottesvilleDanville Hampton RoadsHarrisonburg LynchburgNorthern Virginia Other localitiesRichmond RoanokeWinchester, VA-WV
Source: Bureau of Labor Statistics, CES (Dec 2011, preliminary)
By MSAVirginia Employment

VIRGINIA EMPLOYMENT GROWTH
6
Recession Recession
-6.0
-4.0
-2.0
0.0
2.0
4.0
Pe
rcen
t (%
)
Jan 2000Jan 2001
Jan 2002Jan 2003
Jan 2004Jan 2005
Jan 2006Jan 2007
Jan 2008Jan 2009
Jan 2010Jan 2011
United States Virginia
Hampton Roads MSA
Source: U.S. Bureau of Labor Statistics, CESMeasured in percent change in S.A. nonfarm payrolls year-over-year; Virginia and Hampton Roads data not seasonally adjusted.
United States, Virginia, and Hampton Roads MSAEmployment Growth

VIRGINIA EMPLOYMENT GROWTH
7
2.9
1.3
-0.2
-0.6
0.4
1.1
1.5
1.6
1.0
3.0
5.2
1.0
1.3
-2 0 2 4 6Percent (%)
Winchester
Northern Virginia
Hampton Roads
Roanoke
Richmond
Lynchburg
Bristol
Harrisonburg
Danville
Charlottesville
Blacksburg
Virginia
United States
Percentage Change from Previous Year
Source: U.S. Bureau of Labor Statistics, CES
December 2011Employment Growth

VIRGINIA EMPLOYMENT GROWTH
8
1.01.3
-5.2-1.3
-1.40.8
-0.51.9
0.71.6
1.0-1.3
1.42.2
1.50.1
2.02.0
2.22.7
-6 -4 -2 0 2 4Percent (%)
Total Nonagriculture
Information
Construction
Manufacturing
Trade, Trans. & Util.
Government
Educ. & Health Services
Financial Activities
Leisure & Hospitality
Prof. & Bus. Services
Percentage Change from Previous Year
Source: Bureau of Labor Statistics, CES, December 2011
December 2011Employment Growth By Major Sector
United States Virginia

HAMPTON ROADS EMPLOYMENT GROWTH
9
-0.21.0
-1.4
-6.5-5.2
-1.70.7
-1.71.5
-0.42.0
0.6-0.5
0.91.0
1.42.2
1.71.4
-6 -4 -2 0 2 4Percent (%)
Total Nonagriculture
Construction
Information
Trade, Trans. & Util.
Financial Activities
Leisure & Hospitality
Manufacturing
Government
Prof. & Bus. Services
Educ. & Health Services
Percentage Change from Previous Year
Source: Bureau of Labor Statistics, CES, Monthly Data (December 2011), Not seasonally adjusted
December 2011Employment Growth By Major Sector
Virginia Hampton Roads

VIRGINIA EMPLOYMENT FORECAST
10
-0.4
-1.0
0.6
-0.3
0.9
-0.0
1.7
1.1
-2-1
01
23
Pe
rcen
t (%
)
2010 2011(p) 2012F 2013F
Percentage Change from Previous Year
Source: Bureau of Labor Statistics, BEA, Moody's Analytics
Virginia and Hampton Roads MSAEmployment Growth Forecast
Virginia Hampton Roads MSA
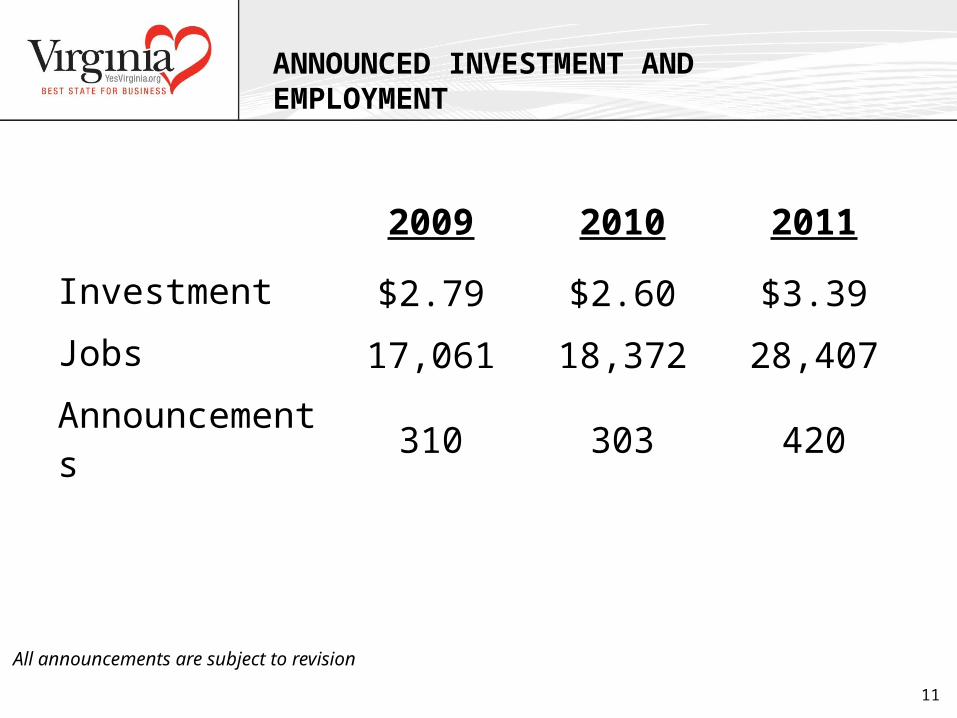
ANNOUNCED INVESTMENT AND EMPLOYMENT
2009 2010 2011
Investment $2.79 $2.60 $3.39Jobs 17,061 18,372 28,407Announcements 310 303 420
11
All announcements are subject to revision

CALENDAR YEAR 2011 HIGHLIGHTS
• Encouraging announcements results and trends compared with 2010– Jobs: +52% (28,407)– Capital Investment: +30% ($3.39 Billion)– Projects: +34% (420)
• Strongest job totals in 8 years, since 2003 • Geographic parity in job growth; each of the 6 Regions exceeded 2010 job totals;
and Diversified Sector Growth statewide• Existing business expansions remain fundamentally important to economic
performance: 71% of jobs, 72% of capital investment• Manufacturing represents 22% of job totals, 38% of total capital investment• Data centers (14 projects) dominant sector for investment; ($960M), and almost
half of all non-manufacturing investment• Professional, Scientific, and Technical Services dominant sector for job growth
(12,363 jobs); high wage sector• International job growth up 66% (2,162 jobs), 8% of all projects; still down about
2/3 from 2008 recent peak of almost 7,000 jobs

RECENT MAJOR ANNOUNCEMENTS
13

SELECTED STATEWIDE PROJECTS - 2011
Company Name Location Business Jobs Investment (millions)
Amazon.com Chesterfield & Dinwiddie Cos. Fulfillment centers 1,060 $85.0
Green Mountain Coffee Roasters Isle of Wight Co. Coffee roasting, grinding, flavoring, packaging 800 $180.0Defense Health Headquarters Fairfax Co. Defense Department’s Medical Command HQ 533 $225.0 International Paper Isle of Wight Co. Fluff pulp mill 213 $80.0ICF International Henry Co. Operations center, business process mgmt. 539 $15.0Bechtel Corporation Fairfax Co. Global Operations HQ; engineering 625 $18.0Backcountry.com Montgomery Co. Online retailer of outdoor gear 216 $25.5MeadWestvaco Corp. Covington Bleached paperboard 0 $285.0
Rubbermaid Commercial Products Winchester/Frederick Co. Commercial plastic products 71 $67.25
Albany Industries Galax Upholstered furniture 335 $2.5K-VA-T Food Stores Washington Co. Corporate HQ; Distribution of food products 25 $20.4Microsoft Corp. Mecklenburg Co. Data center 10 $150.0Cadence Staunton Micro-scale precision-cutting tools 65 $15.9CFA Institute Charlottesville Global association of investment professionals 45 $24.5
All announcements are subject to revision 14

SELECTED HAMPTON ROADS PROJECTS - 2011
Company Name Location Business Jobs Investment (millions)
Green Mountain Coffee Roasters Isle of Wight Co. Coffee roasting, grinding, flavoring, packaging 800 $180.0
Enviva LP Southampton Co. Manufactures wood pellets 64 $75.0
International Paper Isle of Wight Co. Fluff pulp mill 213 $80.0
Katoen Natie Norfolk Warehousing and distribution 225 $12.0
GEICO Corporation Virginia Beach Call center; insurance policies 285 $1.0
IMS:GEAR Virginia, Inc. Virginia Beach Metal and plastic gear assemblies 80 $35.5
Ace Hardware Corp. Suffolk East Coast re-distribution center; hardware 75 $14.0
TRG Customer Solutions Hampton Inbound and outbound communications 120 $3.0
Kruger, Inc. Portsmouth Warehouse, pulp and paper import/export 0 $25.0
Enviva LP Chesapeake Storage/distribution of wood biomass products 24 $11.7
All announcements are subject to revision
15

ANNOUNCED INVESTMENT AND EMPLOYMENT
Region New Jobs Investment (millions) Announcements
Central Virginia 4,134 $517.64 70
Hampton Roads 3,202 $567.81 52
Northern Virginia 14,422 $1,220.73 184
Southern Virginia 2,669 $424.50 39
Southern Virginia 2,029 $149.62 31
Valley Region 1,951 $508.16 44
Grand Total 28,407 $3,388.46 420
Regional Totals – Calendar Year 2011
16
All announcements are subject to revision

RECENT VEDP HIGHLIGHTS
• International Presence Expanded– India: 2 firms engaged in August 2011– United Kingdom: Engaged HMC Global in March 2011– China: Representative in Shanghai in May 2011
• Governor’s Mission to Israel & India – November 2011– Over 60 prospect meetings and events
• Digital Media Campaigns – Over 30 million targeted impressions– Wall Street Journal, Bloomberg Business Week, Forbes– Area Development
• Export Program (VALET ) expanded– Serving existing VA businesses to increase international sales
17

RECENT VEDP HIGHLIGHTS
• Project pipeline improving(+ 40%)• International projects (18% of pipeline)• Broad-based sector activity
– Advanced manufacturing– IT/ Data centers “hot”– Corporate HQ’s; operations centers– Slight uptick in distribution activity, but still below pre-recession norms
• Sector Marketing Campaigns – launched in key regions – Federal (MD/DC)– IT (Northern CAL)– Food Processing (Chicago)– Aerospace (TBD)– Life Sciences (TBD)
18

VIRGINIA’S MESSAGE
19
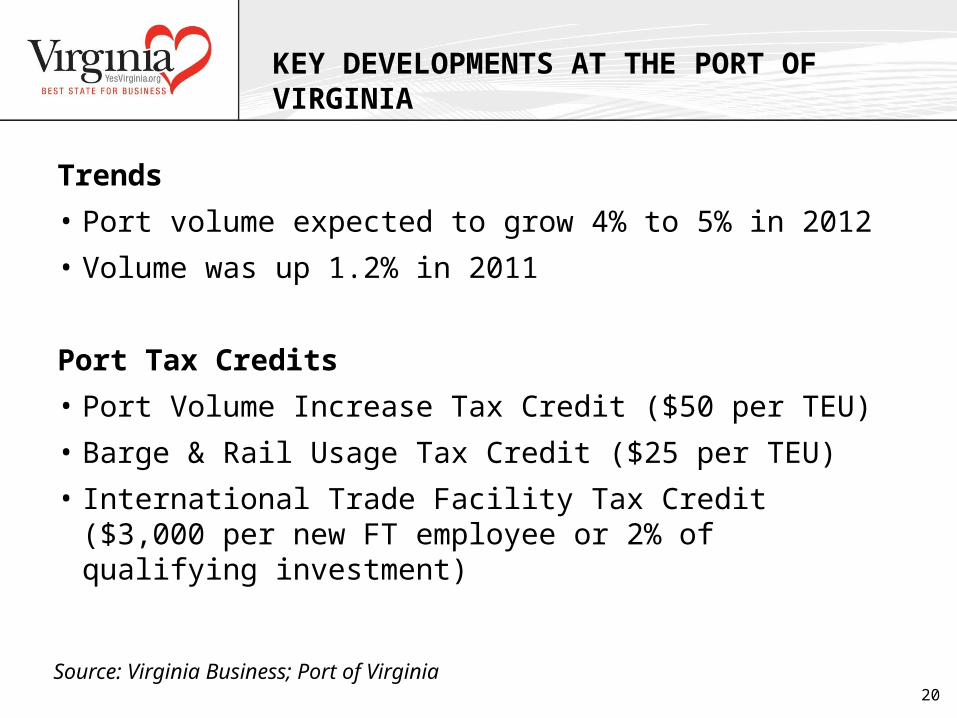
KEY DEVELOPMENTS AT THE PORT OF VIRGINIA
Trends
• Port volume expected to grow 4% to 5% in 2012
• Volume was up 1.2% in 2011
Port Tax Credits
• Port Volume Increase Tax Credit ($50 per TEU)
• Barge & Rail Usage Tax Credit ($25 per TEU)
• International Trade Facility Tax Credit ($3,000 per new FT employee or 2% of qualifying investment)
20Source: Virginia Business; Port of Virginia

LEGISLATIVE AGENDA - 2012
• Life Sciences Strategy• Tax Credit Enhancements
– Major Business Facility Job Tax Credit– Small Business Investor Tax Credits
• Funding to Promote Advanced Manufacturing– Mega project site development– Workforce readiness
• Non-credit instruction at community colleges• Wallops Island launch site improvements• International & domestic marketing funds• Agricultural & Forestry Initiative Development Fund
21

PROMINENT ACCOLADES
• Virginia named “Top State for Business” by CNBC
• Ranked “No. 1 Pro-Business State” by Pollina Corporate Real Estate, Inc. in 2011
• Ranked number one for “Economic Growth Potential” in Business Facilities magazine
• Virginia Beach named the “Best-Run City in America” by 24/7 Wall St., a financial news website. Chesapeake was ranked sixth.
22

THE ECONOMY IS IMPROVING (?)
23
