managing the investment portfolio chapter 13 prof. dr. rainer stachuletz banking academy of vietnam...
Post on 21-Dec-2015
218 views
TRANSCRIPT

Managing the InvestmentPortfolio
Chapter 13
Prof. Dr. Rainer StachuletzProf. Dr. Rainer StachuletzBanking Academy of Vietnam Banking Academy of Vietnam Based upon: Bank ManagementBased upon: Bank Management, 6th edition. 6th edition.Timothy W. Koch and S. Scott MacDonaldTimothy W. Koch and S. Scott MacDonald
Prof. Dr. Rainer Stachuletz – Banking Academy of Vietnam - Hanoi

The Investment Portfolio
Most banks concentrate their asset management efforts on loans Managing investment securities is
typically a secondary role, especially at smaller banks
Historically, small banks have purchased securities and held them to maturity

The Investment Portfolio
Large banks, in contrast, not only buy securities for their own portfolios, but they also: Manage a securities trading account Manage an underwriting subsidiary
that helps municipalities issue debt in the money and capital markets

The Investment Portfolio
Historically, bank regulators have limited the risk associated with banks owning securities by generally: Prohibiting banks from purchasing
common stock (for income purposes) Limiting debt instruments to
investment grade securities Increasingly, banks are pursuing
active strategies in managing investments in the search for higher yields
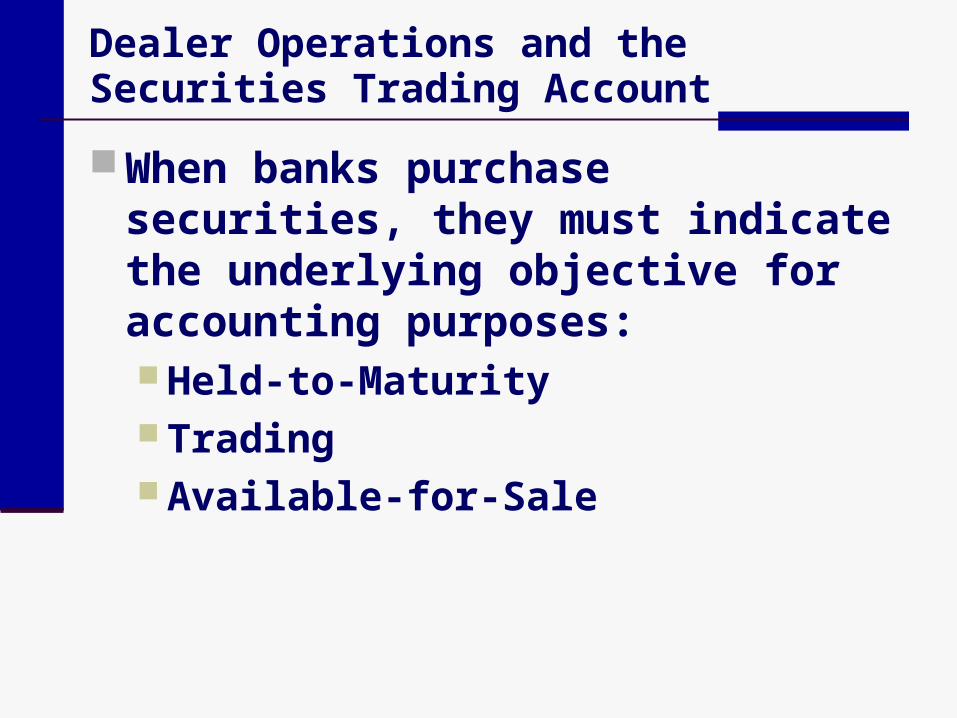
Dealer Operations and the Securities Trading Account
When banks purchase securities, they must indicate the underlying objective for accounting purposes: Held-to-Maturity Trading Available-for-Sale

Dealer Operations and the Securities Trading Account
Held to Maturity Securities purchased with the intent
and ability to hold to final maturity Carried at historical (amortized) cost
on the balance sheet Unrealized gains and losses have no
impact on the income statement

Dealer Operations and the Securities Trading Account
Trading: Securities purchased with the intent to
sell them in the near term Carried at market value on the balance
sheet with unrealized gains and losses included in income

Dealer Operations and the Securities Trading Account
Available for Sale: Securities that are not classified as
either held-to-maturity securities or trading securities
Carried at market value on the balance sheet with unrealized gains and losses included as a component of stockholders’ equity

Dealer Operations and the Securities Trading Account
Banks perform three basic functions within their trading activities: Offer investment advice and assistance
to customers managing their own portfolios
Maintain an inventory of securities for possible sale to investors
Their willingness to buy and sell securities is called making a market
Traders speculate on short-term interest rate movements by taking positions in various securities

Dealer Operations and the Securities Trading Account
Banks earn profits from their trading activities in several ways: When making a market, they price
securities at an expected positive spread Bid
Price the dealer is willing to pay Ask
Price the dealer is willing to sell
Traders can also earn profits if they correctly anticipate interest rate movements
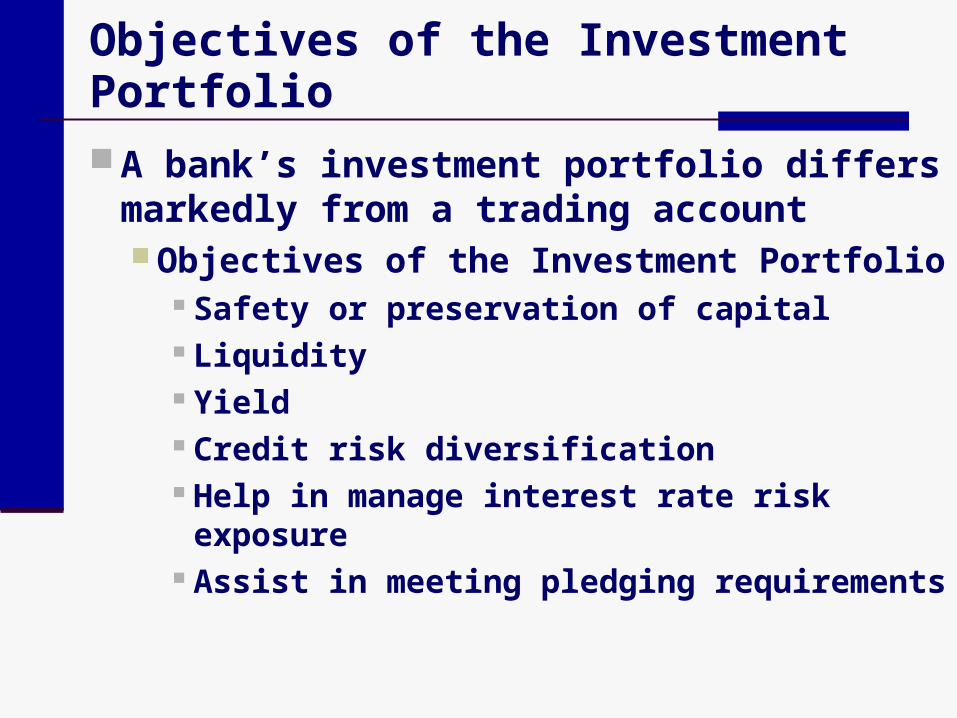
Objectives of the Investment Portfolio
A bank’s investment portfolio differs markedly from a trading account Objectives of the Investment Portfolio
Safety or preservation of capital Liquidity Yield Credit risk diversification Help in manage interest rate risk
exposure Assist in meeting pledging requirements

Objectives of the Investment Portfolio
Accounting for Investment Securities FASB 115 requires security holdings to
be divided into three categories Held-to-Maturity (HTM) Trading Available-for-Sale
The distinction between investment motives is important because of the accounting treatment of each

Objectives of the Investment Portfolio
Accounting for Investment Securities A change in interest rates can
dramatically affect the market value of a security
The difference between market value and the purchase price equals the unrealized gain or loss on the security; assuming a purchase at par:
Unrealized Gain/Loss =
Market Value – Par Value

Objectives of the Investment Portfolio
Accounting for Investment Securities Assume interest rates increase and bond
prices fall: Held-to-Maturity Securities
There is no impact on either the balance sheet or income statement
Trading Securities The decline in value is reported as a loss on
the income statement Available-for-Sale Securities
The decline in value reduces the value of bank capital

Objectives of the Investment Portfolio
Safety or Preservation of Capital A primary objective of the investment
portfolio is to preserve capital by purchasing securities when there is only a small risk of principal loss.
Regulators encourage this policy by requiring that banks concentrate their holdings in investment grade securities, those rated Baa (BBB) or higher.

Objectives of the Investment Portfolio
Liquidity Commercial banks purchase debt
securities to help meet liquidity requirements
Securities with maturities under one year can be readily sold for cash near par value and are classified as liquid investments
In reality, most securities selling at a premium can also be quickly converted to cash, regardless of maturity, because management is willing to sell them

Investment Portfolio for a Hypothetical Commercial Bank
Liquidity

Objectives of the Investment Portfolio
Yield To be attractive, investment securities
must pay a reasonable return for the risks assumed
The return may come in the form of price appreciation, periodic coupon interest, and interest-on-interest
The return may be fully taxable or exempt from taxes

Objectives of the Investment Portfolio
Diversify Credit Risk The diversification objective is closely
linked to the safety objective and difficulties that banks have with diversifying their loan portfolios
Too often loans are concentrated in one industry that reflects the specific economic conditions of the region
Investment portfolios give banks the opportunity to spread credit risk outside their geographic region and across different industries

Objectives of the Investment Portfolio
Help Manage Interest Rate Exposure Investment securities are very flexible
instruments for managing a bank’s overall interest rate risk exposure
Banks can select terms that meet their specific needs without fear of antagonizing the borrower
They can readily sell the security if their needs change

Objectives of the Investment Portfolio
Pledging Requirements By law, commercial banks must pledge
collateral against certain types of liabilities.
Banks that borrow via repurchase agreements essentially pledge part of their government securities portfolio against this debt
Public deposits Borrowing from the Federal Reserve Borrowing from FHLBs

Composition of the Investment Portfolio
Money market instruments with short maturities and durations include: Treasury bills Large negotiable CDs Bankers acceptances Commercial paper Repurchase agreements Tax anticipation notes.

Composition of the Investment Portfolio
Capital market instruments with longer maturities and duration include: Long-term U.S. Treasury securities Obligations of U.S. government agencies Obligations of state and local
governments and their political subdivisions labeled municipals
Mortgage-backed securities backed both by government and private guarantees
Corporate bonds Foreign bonds

Composition of the Investment Portfolio

Characteristics of Taxable Securities
Money Market Investments Highly liquid instruments which mature
within one year that are issued by governments and large corporations
Very low risk as they are issued by well-known borrowers and a active secondary market exists
Banks purchase money market instruments in order to meet liquidity and pledging requirements and earn a reasonable return

Characteristics of Taxable Securities
Capital Market Investments Consists of instruments with original
maturities greater than one year Banks are restricted to “investment
grade” securities, those rated Baa (BBB) or above; i.e., no junk bonds
If banks purchase non-rated securities, they must perform a credit analysis to validate that they are of sufficient quality relative to the promised yield .
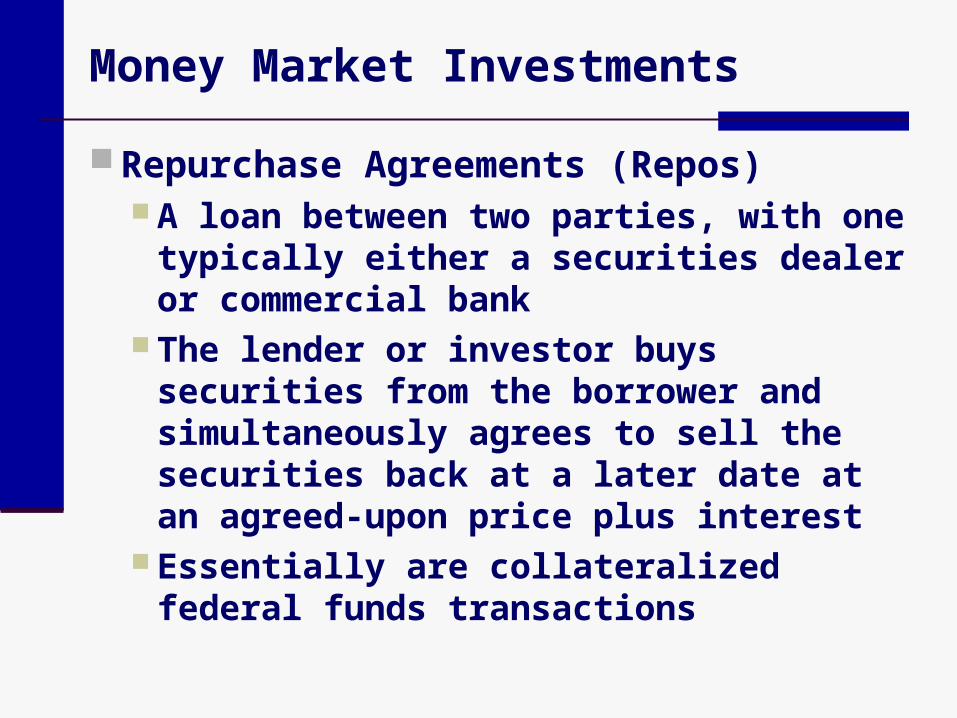
Money Market Investments
Repurchase Agreements (Repos) A loan between two parties, with one
typically either a securities dealer or commercial bank
The lender or investor buys securities from the borrower and simultaneously agrees to sell the securities back at a later date at an agreed-upon price plus interest
Essentially are collateralized federal funds transactions

Money Market Investments
Repurchase Agreements (Repos) The minimum denomination is generally $1
million, with maturities ranging from one day to one year
The rate on one-day repos is referred to as the overnight repo rate and is quoted on an add-on basis assuming a 360-day year
$ Interest = Par Value x Repo Rate x Days/360 Longer-term transactions are referred to as term
repos and the associated rate the term repo rate

Money Market Investments
Treasury Bills Marketable obligations of the U.S.
Treasury that carry original maturities of one year or less
They exist only in book-entry form, with the investor simply holding a dated receipt
Investors can purchase bills in denominations as small as $1,000, but most transactions involve much larger amounts

Money Market Investments
Treasury Bills Each week the Treasury auctions
bills with 13-week and 26-week maturities
Investors submit either competitive or noncompetitive bids With a competitive bid, the purchaser
indicates the maturity amount of bills desired and the discount price offered
Non-competitive bidders indicate only how much they want to acquire

Money Market Investments
Treasury Bills Treasury bills are purchased on a discount
basis, so the investor’s income equals price appreciation
The Treasury bill discount rate is quoted in terms of a 360-day year:
Where DR = Discount Rate FV = Face Value P = Purchase Price N = Number of Days to Maturity
N
360
FV
PFVDR

Money Market Investments
Treasury Bills Example: A bank purchases $1 million in face value of
26-week (182-day) bills at $990,390. What is the discount rate and effective yield?
The discount rate is:
The true (effective) yield is:
1.90%182
360
$1,000,000
$990,390$1,000,000DR
1.956%1(365/182)
$990,390$990,390$1,000,0001 YieldEffective

Money Market Investments
Certificates of Deposit Dollar-denominated deposits issued by
U.S. banks in the United States Fixed maturities ranging from 7 days to
several years Pay yields above Treasury bills. Interest is quoted on an add-on basis,
assuming a 360-day year

Money Market Investments
Eurodollars Dollar-denominated deposits issued by
foreign branches of banks outside the United States
The Eurodollar market is less regulated than the domestic market, so the perceived riskiness is greater.

Money Market Investments
Commercial Paper Unsecured promissory notes issued by
corporations Proceeds are use to finance short-term working
capital needs The issuers are typically the highest quality
firms Minimum denomination is $10,000 Maturities range from 3 to 270 days Interest rates are fixed and quoted on a
discount basis Small banks purchase large amounts of
commercial paper as investments

Money Market Investments
Bankers Acceptances A draft drawn on a bank by firms that
typically are importer or exporters of goods
Has a fixed maturity, typically up to nine months
Priced as a discount instrument like T-bills
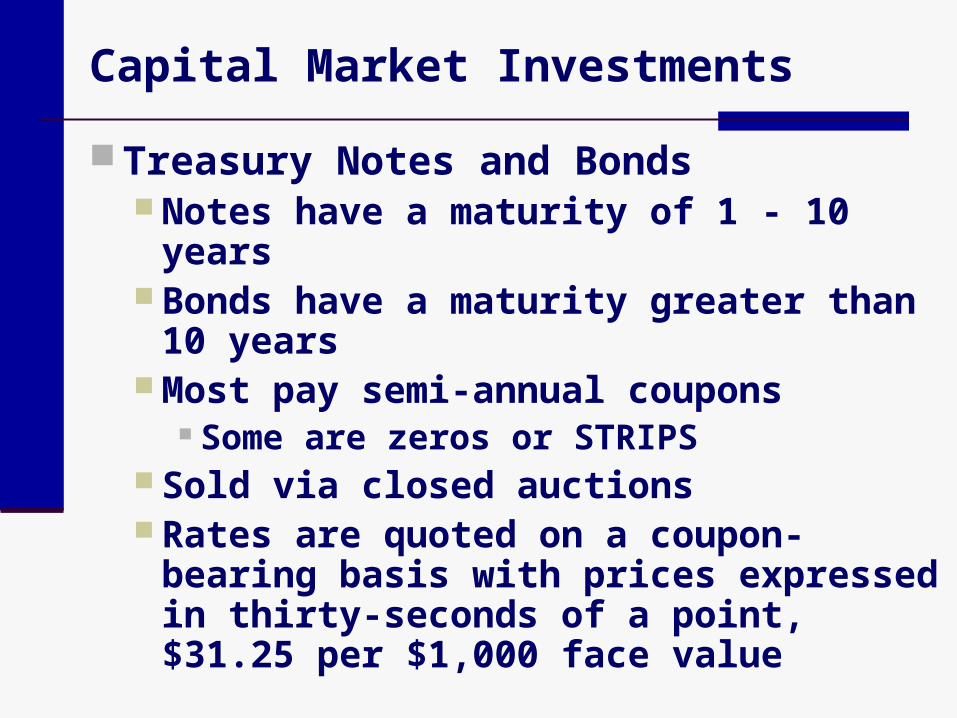
Capital Market Investments
Treasury Notes and Bonds Notes have a maturity of 1 - 10 years Bonds have a maturity greater than 10
years Most pay semi-annual coupons
Some are zeros or STRIPS Sold via closed auctions Rates are quoted on a coupon-bearing
basis with prices expressed in thirty-seconds of a point, $31.25 per $1,000 face value

Capital Market Investments
Treasury STRIPS Many banks purchase zero-coupon Treasury
securities as part of their interest rate risk management strategies
The U.S. Treasury allows any Treasury with an original maturity of at least 10 years to be “stripped” into its component interest and principal pieces and traded via the Federal Reserve wire transfer system.
Each component interest or principal payment constitutes a separate zero coupon security and can be traded separately from the other payments

Capital Market Investments
Treasury STRIPS Example Consider a 10-year, $1 million par value
Treasury bond that pays 9 percent coupon interest semiannually ($45,000 every six months)
This security can be stripped into 20 separate interest payments of $45,000 each and a single $1 million principal payment, or 21 separate zero coupon securities.

Capital Market Investments
U.S. Government Agency Securities Composed of two groups
Members who are formally part of the federal government
Federal Housing Administration Export-Import Bank Government National Mortgage Association
(Ginnie Mae)

Capital Market Investments
U.S. Government Agency Securities Composed of two groups
Members who are government-sponsored agencies
Federal Home Loan Mortgage Corporation (Freddie Mac)
Federal National Mortgage Association (Fannie Mae) Student Loan Marketing Association (Sallie Mae)
Default risk is low even though these securities are not direct obligations of the Treasury; most investors believe there is a moral obligation.
These issues normally carry a risk premium of about 10 to 100 basis points.

Federal Status of U.S. Government Agency Securities
Agency
Full Faith and Credit of the U.S.
Government Authority to Borrow from the Federal Treasury
Interest on Bonds Generally Exempt
from State and Local Taxes
Farm Credit System No Yes—$260 million revolving line of credit. Yes Farm Credit System Financial Assistance Corporation (FCSFAC) Yes Yes—FCSFAC began issuing bonds in late 1988. Yes
Federal Home Loan Banks (FHLB) No Yes—the Treasury is authorized to purchase up to $4 billion of FHLB securities. Yes
Federal Home Loan Mortgage Corporation (Freddie Mac)* No Yes—indirect line of credit through the FHLBs. No
Federal National Mortgage Association (FNMA) (Fannie Mae)* No Yes—at FNMA request the Treasury may
purchase $2.25 billion of FNMA securities. No
Financing Corporation (FICO) No No Yes Student Loan Marketing Association (Sallie Mae) Not since 1/9/82 Yes—at its discretion the Treasury may purchase
$1 billion of Sallie Mae obligations. Yes
United States Postal Service†
Guarantee may be extended if Postal Service requests and Treasury determines this to be in the public interest.
Yes—the Postal Service may require the Treasury to purchase up to $2 billion of its obligations.
Yes
Resolution Funding Corporation (RefCorp) No No Yes Farmers Home Administration†(FmHA) Yes No No
Federal Financing Bank (FFB) Yes
Yes—FFB can require the Treasury to purchase up to $5 billion of its obligations. The Treasury Secretary is authorized to purchase any amount of FFB obligations at his or her discretion.
Yes
General Services Administration†(GSA) Yes No Yes Government National Mortgage Association†(GNMA) Yes No No
Maritime Administration Guaranteed Ship Financing Bonds issued after 1972 Yes No No
Small Business Administration (SBA) Yes No No, with exceptions Tennessee Valley Authority (TVA) No Yes—up to $150 million. Yes
Washington Metropolitan Area Transit Authority (WMATA) Bonds Yes No
No, except for states involved in the interstate compact

Capital Market Investments
Callable Agency Bonds Securities issued by government-
sponsored enterprises in which the issuer has the option to call the bonds prior to final maturity
Typically, there is a call deferment period during which the bonds cannot be called
The issuer offers a higher promised yield relative to comparable non-callable bonds
The present value of this rate differential essentially represents the call premium

Capital Market Investments
Callable Agency Bonds Banks find these securities attractive
because they initially pay a higher yield than otherwise similar non-callable bonds
The premium reflects call risk If rates fall sufficiently, the issuer will
redeem the bonds early, refinancing at lower rates, and the investor gets the principal back early which must then be invested at lower yields for the same risk profile
Capital Market Investments
Conventional Mortgage-Backed Securities (MBSs) Any security that evidences an
undivided interest in the ownership of mortgage loans
The most common form of MBS is the pass-through security
Even though many MBSs have very low default risk, they exhibit unique interest rate risk due to prepayment risk
As rates fall, individuals will refinance

Capital Market Investments
GNMA Pass-Through Securities Government National Mortgage
Association (Ginnie Mae) Government entity that buys mortgages
for low income housing and guarantees mortgage-backed securities issued by private lenders
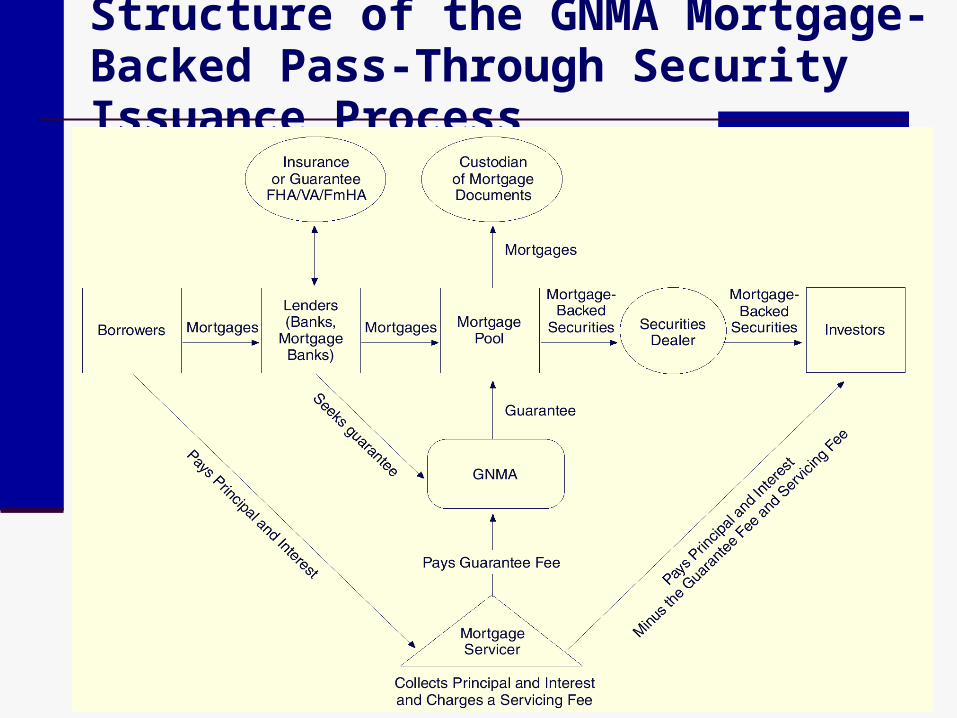
Structure of the GNMA Mortgage-Backed Pass-Through Security Issuance Process

Capital Market Investments
FHLMC Federal Home Loan Mortgage Corporation
(Freddie Mac) FNMA securities
Federal National Mortgage Association (Fannie Mae)
Both are: Private corporations Operate with an implicit federal guarantee Buy mortgages financed largely by mortgage-
backed securities

Capital Market Investments
Privately Issued Pass-Through Issued by banks and thrifts, with private
insurance rather than government guarantee

Prepayment Risk on Mortgage-Backed Securities
Borrowers may prepay the outstanding mortgage principal at any point in time for any reason
Prepayments generally occur because of fundamental demographic trends as well as movements in interest rates Prepayments typically increase as
interest rates fall and slow as rates increase
Forecasting prepayments is not an exact science

Prepayment Risk on Mortgage-Backed Securities
Example: Current mortgage rates are 8% and you
buy a MBS paying 8.25% Because rates have fallen, you paid a
premium to earn the higher rate With rates only .25% lower, it is unlikely
individuals will refinance If rates fall 3%, there will be a large
increase in prepayments due to refinancing
If the prepayments are fast enough, you may never recover the premium you paid

Pre
paym
en
t ri
sk o
n m
ort
gag
e-b
acked
secu
riti
es
Do
lla
rs
5Interest Rate (Percent)
A. The Interest Sensitivity of Mortgage Pass-Throughs (Dollar Value of $100,000 Share in a Mortgage Pool)
130,000
115,000
100,000
85,000
70,0006 7 8 9 10 11 12 13
Constant prepayment rate
Varying prepayment rate
Measures the value of the MBS if the prepayment rate remains at 6% regardless of the level of mortgage rates.
The value of the MBS if the pre-payment rate varies from 6%
Pre-payment experience is low on new mortgages, increases through five years then declines.
B. The Effect of Relative Coupon on the Prepayment Rate
-8Relative Coupon Rate (Percent)
Per
cen
t p
er M
on
th
3
-6 -4 -2 0 2 4 6 8
2
1
0
C. The Effect of Mortgage Age on the Prepayment Rate
Mortgage Age (Years)
1.25
1.00
.75
.50
.25
01 255 10 15 20
Perc
en
t p
er
Mo
nth Pre-payment
rates increase sharply when mortgage rates fall

Unconventional Mortgage-Backed Securities
Collateralized Mortgage Obligations (CMOs) Security backed by a pool of mortgages
and structured to fall within an estimated maturity range (tranche) based on the timing of allocated interest and principal payments on the underlying mortgages
Tranche: The principal amount related to a specific
class of stated maturities on a collateralized mortgage obligation. The first class of bonds has the shortest maturities

Unconventional Mortgage-Backed Securities
Collateralized Mortgage Obligations (CMOs) CMOs were introduced to circumvent
some of the prepayment risk associated with the traditional pass-through security
CMOs are essentially bonds An originator combines various
mortgage pools to serve as collateral and creates classes of bonds with different maturities

Unconventional Mortgage-Backed Securities
Collateralized Mortgage Obligations (CMOs) The first class, or tranche, has the
shortest maturity Interest payments are paid to all classes
of bonds but principal payments are paid to the first tranche until they have been paid off
After the first tranche is paid, principal payments are made to the second tranche, etc

Unconventional Mortgage-Backed Securities
Types of CMOs Planned Amortization Class CMO (PAC)
A security that is retired according to a planned amortization schedule, while payments to other classes of securities are slowed or accelerated
Least risky of the CMOs Objective is to ensure that PACs exhibit highly
predictable maturities and cash flows Z-Tranche
Final class of securities in a CMO, exhibiting the longest maturity and greatest price volatility
These securities often accrue interest until all other classes are retired

Unconventional Mortgage-Backed Securities
CMOs’ Advantages over MBS Pass-Throughs Some classes (tranches) exhibit less
prepayment risk; some exhibit greater prepayment risk
Appeal to investors with different maturity preferences by segmenting the securities into maturity classes

Unconventional Mortgage-Backed Securities
Stripped Mortgage-Backed Securities More complicated in terms of structure and
pricing characteristics Example:
Consider a 30 year, 12% fixed-rate mortgage There will be 30 x 12 (360) payments (principal plus
interest Loan amortization means the principal only payments
are smaller in the beginning: P1 < P2 < … < P360
Interest only payments decrease over time: I1 > I2 > … > I360

Features of Pass-Through, Government, and Corporate Securities

Asset-Backed Securities
Conceptually, an asset-backed security is comparable to a mortgage-backed security in structure
The securities are effectively “pass-throughs” since principal and interest are secured by the payments on the specific loans pledged as security
Two popular asset-backed securities are: Collateralized automobile receivables
(CARS) CARDS
Securities backed by credit card loans to individuals

Other Investments
Corporate and Foreign Bonds At the end of 2004, banks held $560
billion in corporate and foreign bonds Mutual Funds
Banks have increased their holdings in mutual funds to over $25 billion in 2004
Mutual fund investments must be marked-to-market and can cause volatility on the values reported on the bank’s balance sheet

Characteristics of Municipal Securities
Municipals are exempt from federal income taxes and generally exempt from state or local as well
General obligation Principal and interest payments are backed
by the full faith, credit, and taxing authority of the issuer
Revenue Bonds Backed by revenues generated from the
project the bond proceeds are used to finance
Industrial Development Bonds Expenditures of private corporations
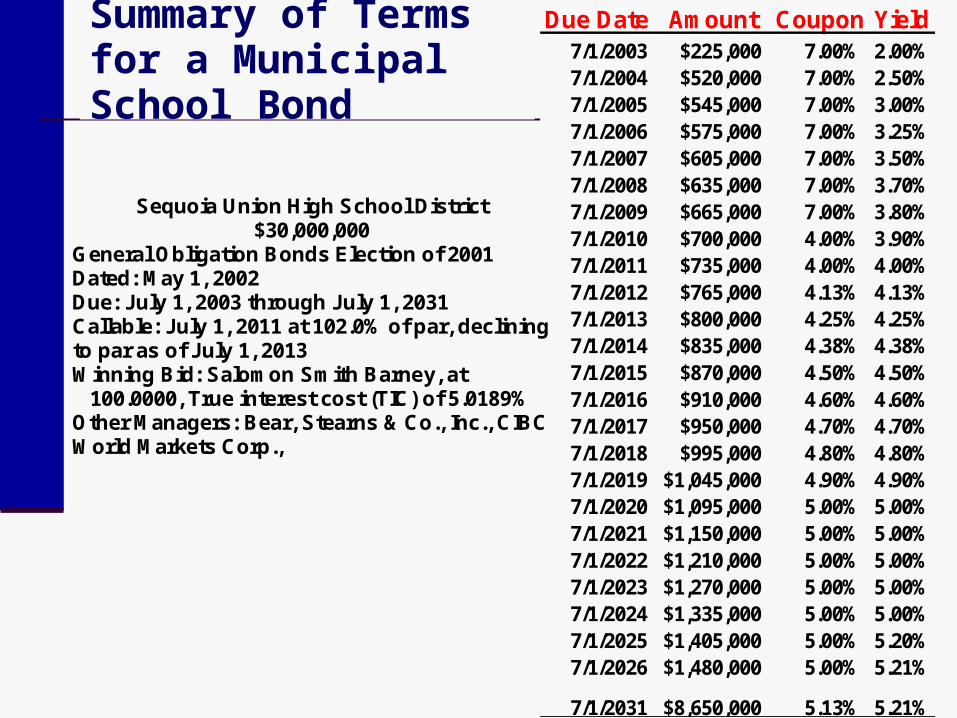
Summary of Terms for a Municipal School Bond
Due Date Amount Coupon Yield7/1/2003 $225,000 7.00% 2.00%7/1/2004 $520,000 7.00% 2.50%7/1/2005 $545,000 7.00% 3.00%7/1/2006 $575,000 7.00% 3.25%7/1/2007 $605,000 7.00% 3.50%7/1/2008 $635,000 7.00% 3.70%7/1/2009 $665,000 7.00% 3.80%7/1/2010 $700,000 4.00% 3.90%7/1/2011 $735,000 4.00% 4.00%7/1/2012 $765,000 4.13% 4.13%7/1/2013 $800,000 4.25% 4.25%7/1/2014 $835,000 4.38% 4.38%7/1/2015 $870,000 4.50% 4.50%7/1/2016 $910,000 4.60% 4.60%7/1/2017 $950,000 4.70% 4.70%7/1/2018 $995,000 4.80% 4.80%7/1/2019 $1,045,000 4.90% 4.90%7/1/2020 $1,095,000 5.00% 5.00%7/1/2021 $1,150,000 5.00% 5.00%7/1/2022 $1,210,000 5.00% 5.00%7/1/2023 $1,270,000 5.00% 5.00%7/1/2024 $1,335,000 5.00% 5.00%7/1/2025 $1,405,000 5.00% 5.20%7/1/2026 $1,480,000 5.00% 5.21%
7/1/2031 $8,650,000 5.13% 5.21%
Sequoia Union High School District $30,000,000
General Obligation Bonds Election of 2001 Dated: May 1, 2002 Due: July 1, 2003 through July 1, 2031 Callable: July 1, 2011 at 102.0% of par, declining to par as of July 1, 2013 Winning Bid: Salomon Smith Barney, at 100.0000, True interest cost (TIC) of 5.0189% Other Managers: Bear, Stearns & Co., Inc., CIBC World Markets Corp.,

Characteristics of Municipal Securities
Money Market Municipals Municipal notes provide operating
funds for government units Banks buy large amounts of short-term
municipals They often work closely with
municipalities in placing these securities
Capital Market Municipals Includes general obligation bonds and
revenue bonds

Characteristics of Municipal Securities
Credit Risk in the Municipal Portfolio Until the 1970s, few municipal securities
went into default Deteriorating conditions in many large
cities ultimately resulted in defaults by: New York City (1975), Cleveland (1978),
Washington Public Power & Supply System (WHOOPS) (1983)

Characteristics of Municipal Securities
Liquidity Risk Municipals exhibit substantially lower liquidity
than Treasury or agency securities The secondary market for municipals is
fundamentally an over-the-counter market Small, non-rated issues trade infrequently and
at relatively large bid-ask dealer spreads Large issues of nationally known municipalities,
state agencies, and states trade more actively at smaller spreads

Characteristics of Municipal Securities
Liquidity Risk Name recognition is critical, as investors
are more comfortable when they can identify the issuer with a specific location
Insurance also helps by improving the rating and by association with a known property and casualty insurer
Characteristics of Municipal Securities
Municipals are less volatile in price than Treasury securities This is generally attributed to the peculiar tax
features of municipals The municipal market is segmented
On the supply side, municipalities cannot shift between short- and long-term securities to take advantage of yield differences because of constitutional restrictions on balanced operating budgets
Thus long-term bonds cannot be substituted for short-term municipals to finance operating expenses, and
Capital expenditures are not financed by ST securities

Characteristics of Municipal Securities
Municipals are less volatile in price than Treasury securities The municipal market is segmented.
On the demand side, banks once dominated the market for short-term municipals
Today, individuals via tax-exempt money market mutual funds dominate the short maturity spectrum

Establishing Investment Policy Guidelines
Each bank’s asset and liability or risk management committee is responsible for establishing investment policy guidelines These guidelines define the parameters
within which investment decisions help meet overall return and risk objectives
Because securities are impersonal loans that are easily bought and sold, they can be used at the margin to help achieve a bank’s liquidity, credit risk, and earnings sensitivity or duration gap targets

Establishing Investment Policy Guidelines
Investment guidelines identify specific goals and constraints regarding: Return Objective Composition of Investments Liquidity Considerations Credit Risk Considerations Interest Rate Risk Considerations Total Return Versus Current Income

Active Investment Strategies
Portfolio managers can buy or sell securities to achieve aggregate risk and return objectives
Investment strategies can subsequently play an integral role in meeting overall asset and liability management goals
Unfortunately, not all banks view their securities portfolio in light of these opportunities

Active Investment Strategies
Many smaller banks passively manage their portfolios using simple buy and hold strategies
The purported advantages are that such a policy requires limited investment expertise and virtually no management time; lowers transaction costs; and provides for predictable liquidity

Active Investment Strategies
Other banks actively manage their portfolios by: Adjusting maturities Changing the composition of taxable versus
tax-exempt securities Swapping securities to meet risk and return
objectives Advantage is that active portfolio managers
can earn above-average returns by capturing pricing discrepancies in the marketplace
Disadvantages are: that managers must consistently out predict
the market for the strategies to be successful, and
high transactions costs

The Maturity or Duration Choice for Long-Term Securities
The optimal maturity or duration is possibly the most difficult choice facing portfolio managers
It is very difficult to outperform the market when forecasting interest rates
Some managers justify passive buy and hold strategies because of a lack of time and expertise
Other managers actively trade securities in an attempt to earn above average returns

Passive Maturity Strategies
Laddered (or Staggered) maturity strategy Management initially specifies a
maximum acceptable maturity and securities are evenly spaced throughout maturity
Securities are held until maturity to earn the fixed returns

Passive Maturity Strategies
Barbell Maturity Strategy Differentiates investments between
those purchased for liquidity and those for income
Short-term securities are held for liquidity
Long-term securities for income Also labeled the long and short
strategy

Active Maturity Strategies
Active portfolio management involves taking risks to improve total returns by: Adjusting maturities Swapping securities Periodically liquidating discount
instruments To be successful, the bank must avoid
the trap of aggressively buying fixed-income securities at relatively low rates when loan demand is low and deposits are high

Active Maturity Strategies
Riding the Yield Curve This strategy works best when the yield curve
is upward-sloping and rates are stable. Three basic steps:
Identify the appropriate investment horizon Buy a par value security with a maturity longer
than the investment horizon and where the coupon yield is higher in relationship to the overall yield curve
Sell the security at the end of the holding period when time remains before maturity

Riding the Yield Curve Example
Initial conditions and assumptions: •5-year investment horizon
•yield curve is upward-sloping,
•5-year securities yielding 7.6 % and
•10-year securities yielding 8 %.
•Annual coupon interest is reinvested at 7%.
Expected Total Return Calculation
0.0752
1100,000
5,70538,000100,000i
1/5
5yr
0.0810
1100,000
6,00540,000101,615y
1/5
10yr

Interest Rates and the Business Cycle
Expansion Increasing Consumer Spending Inventory Accumulation Rising Loan Demand Federal Reserve Begins to Slow Money
Growth Peak
Monetary Restraint High Loan Demand Little Liquidity

Interest Rates and the Business Cycle
Contraction Falling Consumer Spending Inventory Contraction Falling Loan Demand Federal Reserve Accelerates Money
Growth Trough
Monetary Policy Eases Limited Loan Demand Excess Liquidity

Interest rates and the Business Cycle
The inverted U.S. yield curve has predicted these recessions:

Passive Strategies Over the Business Cycle
One popular passive investment strategy follows from the traditional belief that a bank’s securities portfolio should consist of primary reserves and secondary reserves
This view suggests that banks hold short-term, highly marketable securities primarily to meet unanticipated loan demand and deposit withdrawals
Once these primary liquidity reserves are established, banks invest any residual funds in long-term securities that are less liquid but offer higher yields

Passive Strategies Over the Business Cycle
A problem arises because banks normally have excess liquidity during contractionary periods when loan demand is declining and the Fed starts to pump reserves into the banking system
Interest rates are thus relatively low.

Passive Strategies Over the Business Cycle
Banks employing this strategy add to their secondary reserve by buying long-term securities near the low point in the interest rate cycle Long-term rates are typically above
short-term rates, but all rates are relatively low
With a buy and hold orientation, these banks lock themselves into securities that depreciate in value as interest rates move higher

Active Strategies Over the Business Cycle
Many portfolio managers attempt to time major movements in the level of interest rates relative to the business cycle and adjust security maturities accordingly
Some try to time interest rate peaks by following a counter-cyclical investment strategy defined by changes in loan demand and the yield curve’s shape

Active Strategies Over the Business Cycle
The strategy entails both expanding the investment portfolio and lengthening maturities at the top of they business cycle, when both interest rates and loan demand are high Note that the yield curve generally inverts
when rates are at their peak prior to a recession
Alternatively, at the bottom of the business cycle when both interest rates and loan demand are low, a bank contracts the portfolio and shorten maturities

The Impact of Interest Rates on the Value of Securities with Embedded Options
Issues for Securities with Embedded Options Callable agency securities or mortgage-
backed securities have embedded options To value a security with an embedded
option, three questions must be addressed Is the investor the buyer or seller of the
option? How and by what amount is the buyer being
compensated for selling the option, or how much must it pay to buy the option?
When will the option be exercised and what is the likelihood of exercise?

Price-Yield Relationship for Securities with Embedded Options
7% 9.5%Yield onMortgages
B. High-Coupon, Interest-Only Mortgage-Backed Security
Pri
ce
of
IO
P*
5.78%
3-Year, $100 Par Value FHLB Bond, Callable afterOne Year, Priced at $99.97
Yield
A. Callable Agency Bond
Pri
ce
100
$99.97

The Roles of Duration and Convexity in Analyzing Bond Price Volatility
Recall that the duration for an option-free security is a weighted average of the time until the expected cash flows from a security will be received
i)(1i
PP
- Duration
Pi)(1
iDuration - P

Tangent line representing the slope at 10%
$ Price
10,524.21
10,507.52
10,000.00
8% 10%Interest Rate %
Price-yield curve
The Roles of Duration and Convexity in Analyzing Bond Price Volatility
Yield % Price Price - $10,000 Duration 8 10,524.21 524.21 5.349 9 10,257.89 257.89 5.339
10 10,000.00 0.00 5.329 11 9,750.00 (249.78) 5.320 12 9,508.27 (491.73) 5.310
Actual price increase is greater when interest rates fall for option free bonds.

The Roles of Duration and Convexity in Analyzing Bond Price Volatility
From the previous slide, we can see: The difference between the actual
price-yield curve and the straight line representing duration at the point of tangency equals the error in applying duration to estimate the change in bond price at each new yield
For both rate increases and rate decreases, the estimated price based on duration will be below the actual price

The Roles of Duration and Convexity in Analyzing Bond Price Volatility
From the previous slide, we can see: Actual price increases are greater and
price declines less than that suggested by duration when interest rates fall or rise, respectively, for option-free bonds
For small changes in yield the error is small
For large changes in yield the error is large

The Roles of Duration and Convexity in Analyzing Bond Price Volatility
Convexity The rate of change in duration when
yields change It attempts to improve upon duration
as an approximation of price
This is positive feature for buyers of bonds because as yields decline, price appreciation accelerates
Price)iConvexity( Convexity to Due ΔPrice 2

The Roles of Duration and Convexity in Analyzing Bond Price Volatility
Convexity As yields increase, duration for option
free bonds decreases, once again reducing the rate at which price declines
This characteristic is called positive convexity
The underlying bond becomes more price sensitive when yields decline and less price sensitive when yields increase

Impact of Prepayments on Duration and Yield for Bonds with Options
Embedded options affect the estimated duration and convexity of securities
For example, prepayments will affect the duration of mortgage-backed securities Market participants price mortgage-backed
securities by following a 3-step procedure: Estimate the duration based on an assumed
interest rate environment and prepayment speed
Identify a zero-coupon Treasury security with the same (approximate) duration.
The MBS is priced at a mark-up over the Treasury

Impact of Prepayments on Duration and Yield for Bonds with Options
The MBS yield is set equal to the yield on the same duration Treasury plus a spread The spread can range from 50 to 300
basis points depending on market conditions
The MBS yields reflect the zero-coupon Treasury yield curve plus a premium
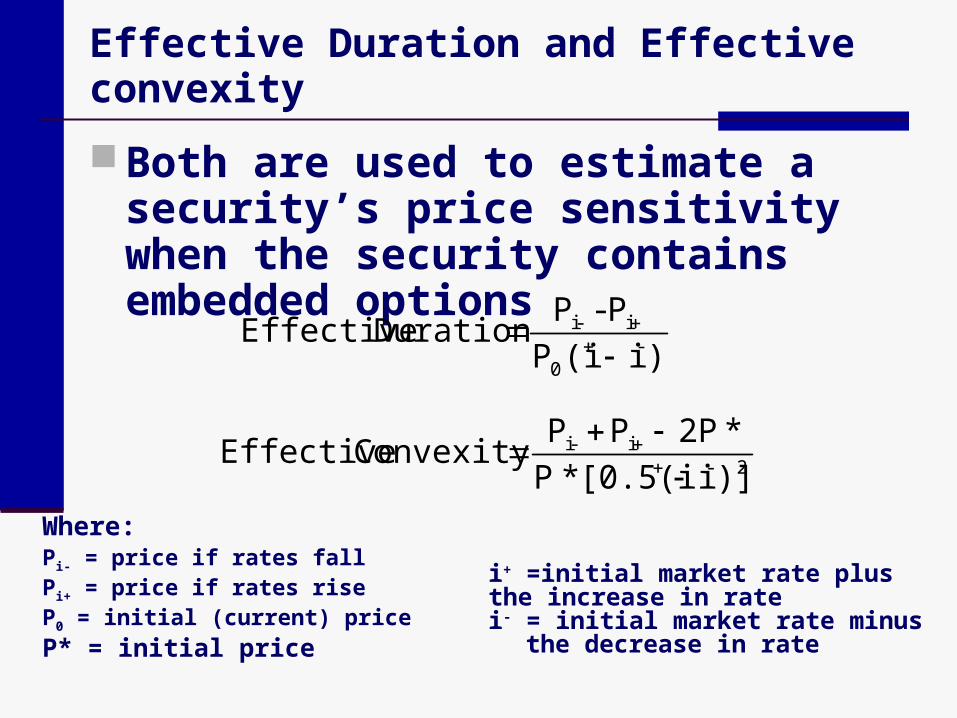
Effective Duration and Effective convexity
Both are used to estimate a security’s price sensitivity when the security contains embedded options
)i (iP
P-P Duration Effective
-0
i-i
Where: Pi- = price if rates fallPi+ = price if rates riseP0 = initial (current) price
P* = initial price
2-i-i
)]i [0.5(i*P
*2PPP Convexity Effective
i+ =initial market rate plus the increase in rate i- = initial market rate minus the decrease in rate

Effective duration and Convexity
Example: Consider a GNMA pass-through which
has 28-years and 4-months weighted average maturity
The MBS is initially priced at 102 and 17/32nds to yield 6.912%, at 258 PSA
At this price and PSA, MBS has an estimated average life of 5.57 years and a modified duration of 4.01 years
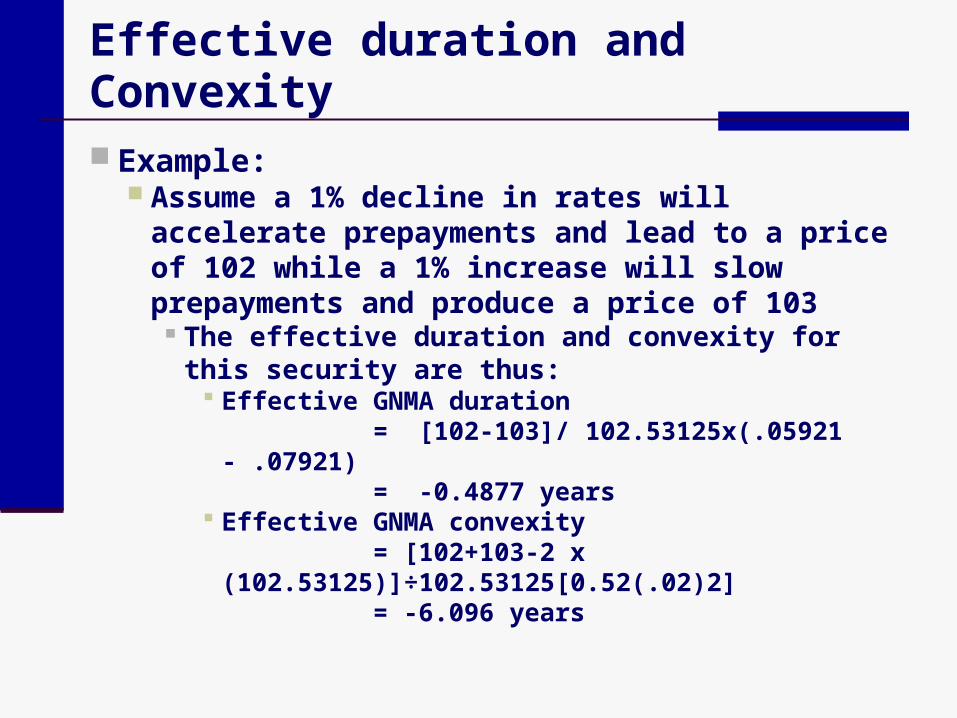
Effective duration and Convexity
Example: Assume a 1% decline in rates will accelerate
prepayments and lead to a price of 102 while a 1% increase will slow prepayments and produce a price of 103
The effective duration and convexity for this security are thus:
Effective GNMA duration = [102-103]/ 102.53125x(.05921 - .07921) = -0.4877 years
Effective GNMA convexity = [102+103-2 x
(102.53125)]÷102.53125[0.52(.02)2]= -6.096 years
Positive and Negative Convexity
Option-free securities exhibit positive convexity because as rates increase, the percentage price decline is less than the percentage price increase associated with the same rate decline
Securities with embedded options may exhibit negative convexity The percentage price increase is less than
the percentage price decrease for equal negative and positive changes in rates

Total Return Analysis
An investor’s actual realized return should reflect the coupon interest, reinvestment income, and value of the security at maturity or sale at the end of the holding period
When a security carries embedded options, these component cash flows will vary in different interest rate environments

Total Return Analysis
If rates fall and borrowers prepay faster than originally expected: Coupon interest will fall Reinvestment income will fall The price at sale (end of the holding
period) may rise or fall depending on the speed of prepayments

Total Return Analysis
When rates rise Borrowers prepay slower Coupon income increases Reinvestment income increases The price at sale may rise or fall

Tota
l R
etu
rn A
naly
sis
for
a C
allab
le F
HLB
B
on
d

Tota
l R
etu
rn A
naly
sis
for
a C
allab
le F
HLB
B
on
d

Option-Adjusted Spread
The standard calculation of yield to maturity is inappropriate with prepayment risk
Option-adjusted spread (OAS) accounts for factors that potentially affect the likelihood and frequency of call and prepayments
Static spread is the yield premium, in percent, that (when added to Treasury zero coupon spot rates along the yield curve) equates the present value of the estimated cash flows for the security with options equal to the prevailing price of the matched-maturity Treasury

Option-Adjusted Spread
OAS represents the incremental yield earned by investors from a security with options over the Treasury spot curve, after accounting for when and at what price the embedded options will be exercised.
OAS analysis is one procedure to estimate how much an investor is being compensated for selling an option to the issuer of a security with options.
OAS is often calculated as an incremental yield relative to the LIBOR swap curve.

Option-Adjusted Spread
The approach starts with estimating Treasury spot rates (zero coupon Treasury rates) using a probability distribution and Monte Carlo simulation, identifying a large number of possible interest rate scenarios over the time period that the security’s cash flows will appear

Option-Adjusted Spread
The analysis then assigns probabilities to various cash flows based on the different interest rate scenarios For mortgages, one needs a prepayment
model and for callable bonds, one needs rules and prices indicating when the bonds will be called and at what values

Steps in Option-Adjusted Spread CalculationCurrent Treasury Curve
(Mean)
Distribution ofInterest Rates
Rate Volatility Estimates(Variance)
Prepayment Model
Find Spread overTreasury Rates Such That
Market Price = PresentValue of Cash Flows
Option-AdjustedSpread
Calculate Durationand Convexity
Shock Rates Upand Down
Market Price ofMortgage Security
Security-SpecificInformation: CouponRate, Maturity, etc.
Other PrepaymentFactors
Possible Cash Flowsfrom Mortgage Security

Op
tion
-Ad
juste
d S
pre
ad
An
aly
sis
for
a C
allab
le
FH
LB
Bon
d

Comparative Yields on Taxable versus Tax-Exempt Securities
Interest on most municipal securities is exempt from federal income taxes and, depending on state law, from state income taxes Some states exempt all municipal
interest Most states selectively exempt interest
from municipals issued in-state but tax interest on out-of-state issues
Other states either tax all municipal interest or do not impose an income tax

Comparative Yields on Taxable versus Tax-Exempt Securities
Capital gains on municipals are taxed as ordinary income under the federal income tax code This makes discount municipals less
attractive than par municipals because a portion of the return, the price appreciation, is fully taxable
When making investment decisions, portfolio managers compare expected risk-adjusted after-tax returns from alternative investments

Comparative Yields on Taxable versus Tax-Exempt Securities
After-Tax and Tax-Equivalent Yields Once the investor has determined the
appropriate maturity and risk security, the investment decision involves selecting the security with the highest after-tax yield

Comparative Yields on Taxable versus Tax-Exempt Securities
After-Tax and Tax-Equivalent Yields Tax-exempt and taxable securities can
be compared as:
t)(1RR tm
whereRm = pretax yield on a municipal securityRt = pretax yield on a taxable securityt = investor’s marginal federal income tax rate

Comparative Yields on Taxable versus Tax-Exempt Securities
After-Tax and Tax-Equivalent Yields Example
Let:Rm = 5.75%Rt = 7.50%
Marginal Tax Rate = 34% The investor would choose the municipal
because it pays a higher after tax return:
Rm = 5.75% after taxesRt = 7.50% (1 - 0.34)
= 4.95% after taxes

Comparative Yields on Taxable versus Tax-Exempt Securities
Marginal Tax Rates Implied in the Taxable - Tax-Exempt Spread If taxable securities and tax-exempt
securities are the same for all other reasons then:
t* = 1 - (Rm / Rt) where
Rm = pretax yield on a municipal security
Rt = pretax yield on a taxable security

Comparative Yields on Taxable versus Tax-Exempt Securities
Marginal Tax Rates Implied in the Taxable - Tax-Exempt Spread t* represents the marginal tax rate at
which an investor would be indifferent between a taxable and a tax-exempt security equal for all other reasons
Higher marginal tax rates or high tax individuals (companies) will prefer tax-exempt securities

Comparative Yields on Taxable versus Tax-Exempt Securities
Example Let:
Rm = 5.75%Rt = 7.50%
Marginal Tax Rate = 34%
An investor would be indifferent between these two investment alternatives if her marginal tax rate were 23.33%

Comparative Yields on Taxable versus Tax-Exempt Securities
Municipals and State & Local Taxes The analysis is complicated somewhat
when state and local taxes apply to municipal securities:
)]t(t[1R)t(tR mtmm

Comparative Yields on Taxable versus Tax-Exempt Securities
Municipals and State & Local Taxes Many analysts compare securities on a
pre-tax basis To compare municipals on a tax
equivalent basis (pre-tax):
t)(t1
)t(tR YieldEquivalentTax
m
mm

Comparative Yields on Taxable versus Tax-Exempt Securities
Deductibility of Interest Expense Prior to 1983, banks could deduct the
full amount of interest paid on liabilities used to finance the purchase of muni's
After 1983 15% was not deductible and after 1984 20% was not deductible

Comparative Yields on Taxable versus Tax-Exempt Securities
Deductibility of Interest Expense The 1986 tax reform act made 100% not
deductible except for qualified muni's, small issue (less than $10 million)
The loss of interest expense deductibility is like an implicit tax on the bank's holding of municipal securities

Comparative Yields on Taxable versus Tax-Exempt Securities
Deductibility of Interest Expense To calculate after tax yields on muni's,
if interest expense is not fully deductible, calculate the bank’s effective tax rate on municipals (tm):
Local and StateR
Cost
Interest
Pooled
Deductable
%Nott
tmuni
m

Comparative Yields on Taxable versus Tax-Exempt Securities
Example: Assume
t =34%, 20% Not Deductible 7.5% Pooled Interest Cost Rmuni = 7%.
7.49%0.0638)(18.0Ratmuni
6.38%00.08
(0.075)(0.20)(0.34)tmuni

Comparison of After-Tax Returns on Taxable and Tax-Exempt Securities for a Bank as Investor
After-Tax Interest Earned Recognizing Partial Deductibility of Interest Expense
After-Tax Interest Earned on Taxable versus Exempt Securities
Taxable MunicipalPar Value 10,000$ 10,000$ Coupon Rate 10.00% 8.00%Annual Coupon interest 1,000$ 800$ Federal income taxes (34%) 340$ $0After-tax income 660$ 800$
Par Value 10,000$ 10,000$ Coupon Value 0$ 0$ Annual coupon interest 1,000$ 800$ Federal income taxes (34%) 340$ -$ Polled interest expense (7.5%) 750$ 750$ Lost interest deduction (20%) -$ 150$ Increased tax liability (34%) -$ 51$ Effective after-tax interest income 660$ 749$

After-Tax Interest Earned, Recognizing Partial Deductibility of Interest Expense: Individual Asset
Factors affecting allowable deduction:
Total interest expense paid 1,500,000$
Average amount of assets owned 20,000,000$
Average amount of tax exempt securities owned: 800,000$
Weighted average cost of financing 7.50%
Nondeductible interest expense:
Pro rata share of interest expense to carry muni's 4.00%
Nondeductible interest expense (20%) 12,000$
Deductible interest expense: $1,500,000 - $12,000 = 1,488,000$

The Impact of the Tax Reform Act of 1986 (TRA 1986)
The TRA of 1986 created two classes of municipals Qualified Nonqualified Municipals
After 1986, banks could no longer deduct interest expenses associated with municipal investments, except for qualified municipal issues
The Impact of the Tax Reform Act of 1986 (TRA 1986)
Qualified versus Non-Qualified Municipals Qualified Municipals
Banks can still deduct 80 percent of the interest expense associated with the purchase of certain small issue public-purpose bonds (bank qualified)
Nonqualified Municipals All municipals that do not meet the
qualified criteria

The Impact of the Tax Reform Act of 1986 (TRA 1986)
Qualified versus Non-Qualified Municipals Municipals issued before August 7,
1986, retain their tax exemption; i.e., can still deduct 80 percent of their associated financing costs (grandfathered in)
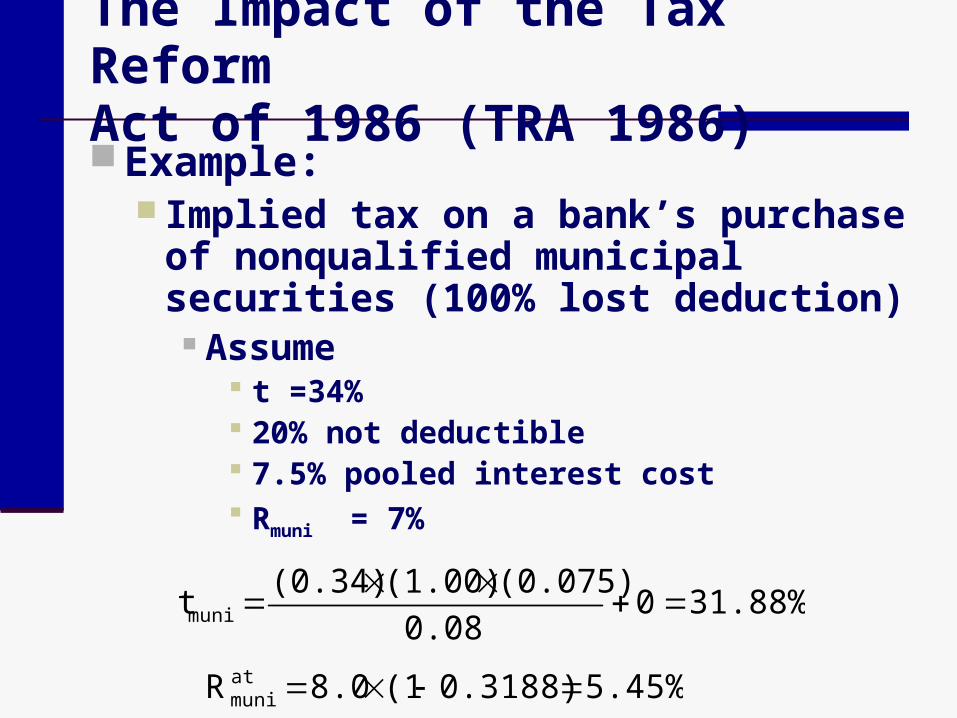
The Impact of the Tax Reform Act of 1986 (TRA 1986) Example:
Implied tax on a bank’s purchase of nonqualified municipal securities (100% lost deduction)
Assume t =34% 20% not deductible 7.5% pooled interest cost Rmuni = 7%
5.45%0.3188)(18.0Ratmuni
31.88%00.08
(0.075)(1.00)(0.34)tmuni

Strategies Underlying Security Swaps
Active portfolio strategies also enable banks to sell securities prior to maturity whenever economic conditions dictate that returns can be earned without a significant increase in risk
When a bank sells a security at a loss prior to maturity, because interest rates have increased, the loss is a deductible expense At least a portion of the capital loss is
reduced by the tax-deductibility of the loss

Evaluation of Security Swaps
Par ValueMarket Value
RemainMaturity
SemiannCoupon YTM
A. Classic Swap DescriptionSell US Trea bonds @ 10.50% $2,000,000 $1,926,240 3 $105,000 12.00%Buy FHLMC bons @ 12.20% $1,952,056 $1,952,056 3 $119,075 12.20%
B. Swap with Minimal Tax EffectsSell US Treas bons @ 10.50% $2,000,000 $1,926,240 3 $105,000 12.00%Sell FNMA @ 13.80% $3,000,000 $3,073,065 4 $207,000 13.00% Total $5,000,000 $4,999,305 $312,000Buy FNMA @ 13.00% $5,000,000 $5,000,000 1 $325,000 12.00%
13,000$ C. Present Value AnalysisPeriod 0 1 2 3 4 5 6Treas Cash flow $1,926,240 ($105,000) ($105,000) ($105,000) ($105,000) ($105,000) ($2,105,000)Tax savings $25,816FHLMC ($1,952,056) $119,075 $119,075 $119,075 $119,075 $119,075 $2,071,132Difference: $0 $14,075 $14,075 $14,075 $14,075 $14,075 ($33,868)
$35,3801.061
14,07547,944
1.061
14,075PV
6
6
1tt

Security Swap Example
Tax Savings:= (2,000,000 - 1,926,240) * 0.35 = 25,816
After Tax Proceeds= 1,926,240 + 25,816 = 1,952,056
Present Value of the Difference:
$35,3801.061
14,07547,944
1.061
14,075PV
6
6
1tt

Strategies Underlying Security Swaps
In general, banks can effectively improve their portfolios by: Upgrading bond credit quality by
shifting into high-grade instruments when quality yield spreads are low
Lengthening maturities when yields are expected to level off or decline
Obtaining greater call protection when management expects rates to fall

Strategies Underlying Security Swaps
In general, banks can effectively improve their portfolios by: Improving diversification when
management expects economic conditions to deteriorate
Generally increasing current yields by taking advantage of the tax savings
Shifting into taxable securities from municipals when management expects losses

Prof. Dr. Rainer Stachuletz edited and updated the PowerPoint slides for this edition.
Managing the Investment Portfolio
Chapter 13
Bank ManagementBank Management, 6th edition.6th edition.Timothy W. Koch and S. Scott MacDonaldTimothy W. Koch and S. Scott MacDonaldCopyright © 2006 by South-Western, a division of Thomson Learning