managing director retail banking asia pacificshareholder.anz.com/sites/default/files/presentations...
TRANSCRIPT

ANZ ASIA INVESTOR TOUR 2014
AUSTRALIA AND NEW ZEALAND BANKING GROUP LIMITED
SANJOY SEN MANAGING DIRECTOR
Retail Banking Asia Pacific
24 JULY 2014

International & Institutional Banking
Global Markets and Loans
Global Transaction
Banking
Global Products
4
5
Business Performance Management
Credit & Capital
Management
Business Execution & Performance
6
7
Finance
Risk
HR
Operations & Technology
Enablement
8
9
10
11
Customer Segments
Global Banking
1
International Banking
2
Retail Banking Asia Pacific
3
2
Retail Banking is an integral part of IIB customer segments

136 171
2012 2017 F
1. D&B's Global Economic Outlook - 2013 to 2017
2. The Boston Consulting Group, Global Wealth 2013, Maintaining Momentum in a Complex World
Asia Pacific individual wealth is growing at more than double the global rate to become the largest personal wealth region by 20172
Asia Pacific (ex. Japan)
North America Western Europe
28
48
2012 2017 F
43 48
2012 2017 F
36 41
2012 2017 F
11.4% CAGR
2.1% CAGR
Global
Growing GDP and maturing financial markets in Asia Pacific
• Strengthening regulatory frameworks
• Proliferation of products & services
• Heightening competition
• Urbanisation and industrialisation -1%
0%
1%
2%
3%
4%
5%
2012 2013 2014 2015 2016 2017
Asia Pacific North America Europe
Real GDP Growth1
3
Private Financial Wealth US$t
Asia Pacific individual wealth growth rates remain high and markets are becoming more well regulated
4.8% CAGR
2.5% CAGR

1. RFi Intelligence, Global Retail Banking Cross-Sell Report, Achieving and maximising the main bank status, November 2013
China
11.5 products with
4.2 institutions
Singapore
12.2 products with
5.8 institutions
Hong Kong
12.8 products with
4.7 institutions
Taiwan
14.8 products with
5 institutions
Indonesia
4.9 products with
2.8 institutions
4
Affluent customers in Asia typically have relationships with 4-5 banks with a ~50% local vs foreign bank ratio
Number of relationships with and products held by affluent banking clients

Our strategy is focused on the 4 key pillars
5
3 core contributions to the super regional strategy
Retail Asia Pacific plays an important role in the ANZ super regional strategy
Liquidity
Brand & Physical Network
Connectivity
Driven by 7 key priorities
1 Financial discipline
2 Simplify
3 Enhance Customer Value Proposition
4 Grow our customer base
5 Build on connectivity
6 Focus on control and compliance
7 Build out talent base
Geography
Focus on priority markets
Segment
Affluent and Emerging Affluent
Channel
Digital
proposition
Operating model
Efficient end-to-end
model

Customer Deposits & AUM $b
$7.9 37%
$5.3 25%
$6.8 32%
$1.2 6%
NLA
CASA
Time Deposits
Wealth Deposits
Strong Growth in Assets
Diversified Balance Sheet
4.3 5.7
7.9
Mar-12 Mar-13 Mar-14Mar-12 Mar-13 Mar-14
AUM Customer Deposits
12.8 14.7
17.8
Net Loans & Advances $b
Stable Customer Deposits & AUM Growth
5% YoY increase in Net Funding
Mar-13 Mar-14
Lending
Deposits NLA 37%
6
$b
$5.2b
$5.5b
Our balance sheet continues to grow with stable customer deposits, contributing to increased liquidity
35% CAGR
18% CAGR
Deposits
63%
Mar-14

Best Deposit Product 2014
1. 2014 BrandZ Top 100 Most Valuable Global Brands by Millward Brown – ANZ is ahead of Citi (#57) and SCB (not in Top 100)
2. Brand Value by Millward Brown
Brand Awareness and Value Awards & Recognition
Best International Personal Banking
2014
Hong Kong
Best Financial Planning Process (A – Z review)
2013
Hong Kong
Best Consumer Internet Bank 2012 & 2013
Taiwan
Platinum Call Centre Service 2014
Indonesia
Best Retail Bank 2013
Vietnam
Certified Best in Class for Service Quality
(2013 – 2016)
Singapore Singapore
Best Deposit Services Bank 2013 & 2014
Hong Kong
Regional Retail Asia Pacific
Excellence in Customer Centricity
Retail Banker International
#51 Most valuable brand globally1 Ahead of Citi & Standard Chartered Bank
15% Uplift in ANZ’s brand value
from 20132
Best Foreign Bank and Retail Bank
2014
Vietnam
7
Our brand awareness and market recognition as a key foreign retail provider are increasing in Asia

Focus on core
geographies while
leveraging on our
distinctive
geographic
footprint across
Asia Pacific
markets
GEOGRAPHY
Focus on
“affluent” and
“emerging
affluent”
customer
segments
SEGMENT
Building a strong
digital proposition
CHANNELS
Continue to
simplify our
infrastructure and
processes and
build an efficient
“end-to-end”
operating model
OPERATING MODEL
8
A focused strategy and execution are crucial to deliver our 3 core contributions to ANZ in Asia Pacific

1. As of Jun-14
• Australia & New Zealand expertise
• Clear connections across the region
• One of the world‟s strongest, safest and most sustainable banks
A distinctive geographic footprint Differentiated offering
9
Sep-12 Sep-13 Mar-14
Singapore & Hong Kong Offshore Banking
Unit
• Unique offering for other countries customers
to invest in Singapore and Hong Kong – the
two main hubs of Asia financial centre
A distinctive geographic footprint1
21 Countries
136 Branches
514 ANZ-branded ATMs
3,700 Retail staff
2 MILLION Customers
ANZ SG and HK offshore banking clients, #‟000
Geography: Growing in priority markets and leveraging our distinctive footprint to deliver connectivity and growth
39%

Protect life and assets
Insurance
Grow your wealth
Investments
Purchase an asset
Mortgage
Access to credit
Credit Card Personal Loan
Save and Transact
CASA
10
Segment: Positioned as a niche player, targeting Affluent and Emerging Affluent segments
Retail Customer Lifecycle
Wealth-led advisory proposition to protect and
grow assets
Affluent
Core banking and simple wealth solutions with a
focus on self-service:
Emerging Affluent
• Holistic portfolio management
• Diversified range of wealth solutions
1000+ investment products,
120+ insurance solutions
• Design product and value proposition
according to customer life cycle
• Enhancing our online capabilities
Emerging Affluent
Features at a glance

Signature Banking Proposition
Portfolio Management Actionable market insights to make
informed decisions
• “Recognize me, understand me” through the
A – Z review
• Banking the family - holistic financial needs
planning
• Retirement planning
• Australia and New Zealand expertise
• Wealth solutions and advisory
A – Z Review
11
Dedicated Servicing Model
• Dedicated Relationship Manager
• Supported by a team of Specialists:
Investment Consultant
Treasury Specialist
Insurance Specialist
Mortgage
Segment: Signature Priority Banking is designed to meet the needs of sophisticated affluent clients in Asia

1. Contact Centre locations include Manila and Suva hub
136 Branches
514 ANZ-branded ATMs
Current Retail Asia Pacific Channel Capability
14 Contact Centres
18 Countries with Digital capability
12
Channel: Building out our digital proposition to provide a multi-channel experience for our customers

• Launched in 4 countries:
Papua New Guinea
Samoa
Solomon Islands
Vanuatu
• More than 500 merchants
• Acquired over 50,000 new to bank clients
• Processed over 1 million transactions since launch
13
Channel: Branchless mobile banking is significantly improving our distribution capability in the Pacific

95
108
1H13 1H14
1. Annualised Revenue per FTE
2. Affluent client figures for Asia only
3. Product Penetration into the Affluent Client Base as at Mar-14
Transforming our Operating Model Improving Revenue per FTE1
14
• Simplify our business
• Optimise our resources
• Build a strong execution culture
• Strengthen our foundation
Accelerating growth of our Affluent customers2
Improving Affluent customer retention through cross sell3
34% Investment penetration
30% Credit Cards penetration
19% Insurance penetration
29% Term Deposit penetration
192 216
1H13 1H14
$‟000
„000
Operating model: Streamlining our business to become “simpler, cheaper and faster”
12%
14%

355 365
402
1H12 1H13 1H14
Increasing Profitability
21 27
43
1H12 1H13 1H14
Cash Profit
$m
9% Cost to Income
10% JAWS
Operating Income
$m
Key Financial Indicators,
reduction/increase from 1H12 to 1H14
Assets, 58%
Banking &
Wealth,
42%
Consistent Growth
Diversified Revenue Improved Financial Indicators
15
Driven by its 7 priorities, Retail Asia Pacific is delivering diversified income and sustainable growth
1H14
6% CAGR
42% CAGR
29%
21% 8%
18%
23% Credit Cards
Unsecured Lending
Mortgage
Transaction Banking
Wealth

Connecting more Customers by Providing Seamless Value
Delivering Leading Products through Insights
Intensifying Balance Sheet Discipline
Scaling & Optimising Infrastructure
• Provide product that delivers value based on customer needs
• Leverage market and competition insights to enable our financial solutions to our customers
• Focus on a well-balanced asset and liability growth
• Ensure value-driven product offering with healthy balance growth and margin deliverables
• Simplify our infrastructure and processes in serving our customers
• Focus on developing bench strength and improve productivity
• Build end-to-end focus on customer delivery – from point of acquisition and throughout the lifecycle
• Enable our clients with a multi-channel platform with a strong digital proposition, building further our brand awareness
IIB STRATEGIC PRIORITIES
KEY AREAS OF FOCUS FOR RETAIL BANKING
16
Retail Banking strategy and execution are aligned to market opportunities and IIB’s strategic priorities

The material in this presentation is general background information about the Bank‟s activities current at the date of the presentation. It is information given in summary form and does not purport to be complete. It is not intended to be relied upon as advice to investors or potential
investors and does not take into account the investment objectives, financial situation or needs of any particular investor. These should be considered, with or without professional advice when
deciding if an investment is appropriate
This presentation may contain forward-looking statements including statements regarding our intent, belief or current expectations with respect to ANZ‟s business and operations, market
conditions, results of operations and financial condition, capital adequacy, specific provisions and risk management practices. When used in this presentation, the words “estimate”, “project”,
“intend”, “anticipate”, “believe”, “expect”, “should” and similar expressions, as they relate to ANZ and its management, are intended to identify forward-looking statements. Readers are cautioned not to place undue reliance on these forward-looking statements, which speak only as of the date hereof. Such statements constitute “forward-looking statements” for the purposes of the United
States Private Securities Litigation Reform Act of 1995. ANZ does not undertake any obligation to publicly release the result of any revisions to these forward-looking statements to reflect events or
circumstances after the date hereof to reflect the occurrence of unanticipated events.
For further information visit
www.anz.com
or contact
Jill Craig Group General Manager Investor Relations
ph: (613) 8654 7749 fax: (613) 8654 9977 e-mail: [email protected]

ANZ ASIA INVESTOR TOUR 2014
AUSTRALIA AND NEW ZEALAND BANKING GROUP LIMITED
24 JULY 2014
SAMEER SAWHNEY MANAGING DIRECTOR
Global Banking

Global Banking forms a key element of IIB’s coverage of our target segments
2
International & Institutional Banking
Global Markets and Loans
Global Transaction
Banking
Global Products
4
5
Business Performance Management
Credit & Capital
Management
Business Execution & Performance
6
7
Finance
Risk
HR
Operations
Enablement
8
9
10
11
Customer Segments
Global Banking
Retail Banking Asia Pacific
1
3
International Banking
2

The macro fundamentals show that Asia enjoys the highest growth in banking revenue pools
Asia Pac is expected to deliver almost 50% of growth in banking revenue pools
Forecast absolute growth in Global Banking revenues US$b, 2012-171 ,2
Asia Pac markets will represent ~US$800 billion in revenues by 2017
3,087
4,151
46%
Australia & NZ
World 2017
Rest of World
Asia World 2012
2%
53%
10% 4% 6% CAGR: Lending Transaction
Banking Markets
Australia
& NZ 36.9 6.3 10.0
Singapore 10.0 2.1 4.5
Hong Kong 8.5 2.5 8.2
Indonesia 29.9 4.2 0.6
China 310.7 39.2 13.1
Japan 186.4 20.6 25.0
India 56.6 14.1 9.0
Forecast revenue pools for key Asia Pacific markets by product US$b, 20171
3
1. Source: BCG Banking Revenue Pools Database 2013 2. Global Banking defined as all banking segments

Global Banking Industries
• Food Beverage & Agriculture
• Consumer Services & Industrial
• Telecom, Media, Entertainment & Technology
• Transportation
Through industry expertise, Global Banking focuses on large, cross border companies operating in ANZ’s region
IIB Relationship Businesses
Resources, Energy & Infrastructure (REI)
Global Diversified Industries (GDI)
Banks & Diversified Financials
Funds and Insurance
ANZ Customer Segments
Global Banking
Industry coverage for large multi national
companies operating in ANZ’s region
International Banking
Retail Banking Asia Pacific
• Oil & Gas
• Global Commodities Companies
• Mining and Metals
• Utilities & Infrastructure
4
Sub Segments
• Global, regional and local banks with transaction needs in Asia Pacific
• Regulated Brokers, Exchanges, Leasing & Finance Companies, Mortgage and Other Financial Institutions
• Real Money, Sovereign Wealth Funds, and Private Equity funds
• Life and Property/Casualty insurers
• Public Sector

…generating almost half the revenue
5
Global Banking is focused on a select number of IIB total customer base…
…with approximately half the assets
FY13 Institutional Revenue
Institutional Net Loans and Advances (Sep-13)
IIB Clients (excl. Retail)1 (Sep-13)
Global Banking constitutes a significant proportion of IIB’s overall customer business
<30,000
Global Banking, 8%
International Banking 92%
~$4.5b
41%
59%
Global Banking
Global Banking
Remainder of Institutional
Remainder of Institutional
1. IIB Clients include Global Banking, International Banking and Emerging Corporate customers

FY12 FY13 1H14
1. Total Effort revenue in AUD. Percentage splits exclude intra geographic and intra segment revenue
6
FY12 FY13 1H14
Global Diversified Industries
Resources, Energy &
Infrastructure
Financial Institutions
Group
Australia
Americas
Europe
Asia
Pacific
$2.4b $2.6b $1.4b $2.4b $2.6b $1.4b
New Zealand
A diverse, growing client base focusing on high growth areas
Our client portfolio is diversified across industry…
…and regionally as we build a broader Asian client franchise
Global Banking Revenue1 Mix by Segment Global Banking Revenue1 Mix by Geography
Asia

How we will win?
Global Banking
Global Banking has a specific set of clients with whom we are targeting a deeper and broader relationship
7
Characteristics of a Global Banking client
Operates a multi geography business model
Requirement for banking capabilities around flow
business together with need for more strategic advisory and
funding
Complex banking requirements with multiple buying centres
Who we serve and how will we succeed
• Senior Industry bankers - Experience in the region and insight, ability to execute, relationships at CFO/CEO level
• Global team structures - seamless connectivity across centres for coverage and execution
• Higher intensity - low account loading, stronger alignment with product sales groups
• Stronger Senior Executive sponsorship - Institutionalise these relationships
Specific set of clients that are of a global nature operating in Asia Pacific, including our home markets of Australia and New Zealand
Leading/Significant players in their industries

35% 31%
23% 21%
0%
10%
20%
30%
40%
ANZ Bank 1 Bank 2 Bank 3
8
1. Peter Lee Associates Large Corporate and Institutional Relationship Banking surveys, Australia and New Zealand 2014. Ranked against the Top 4 competitors.
2. As defined by Total Relationships Market Penetration In Asia
3. The Greenwich Quality Index score is based upon a normalized composite of all qualitative evaluations transformed to a scale of 0 to 1,000 with the difference from the average shown. Note: Cross-hairs are calculated by the average of the banks shown in graph
Strong regional execution capability and product has given ANZ a strong position in Australasia and Asia
No.1 Lead Bank for more large corporate customers in Australia1
A top 4 Corporate Bank in Asia2
by Market Penetration
6% 12%
11%
11%
17%
24%
17%
0%
10%
20%
30%
40%
50%
60%
Import
ant Rela
tionship
s
2013
Bank A
Bank B
Bank C
Bank F
Bank E Bank D
Bank H
Bank G
Bank I
Greenwich Quality Index3 - Overall Relationship Quality (Difference from the Average)
2010
Greenwich Associates Large Corporate Study Asian Large Corporate Banking Market Penetration
Represents the momentum of growth and quality improvement
achieved by ANZ Bank over the past 4 years
Share of lead bank, 2014
53%
27% 21%
7%
0%
10%
20%
30%
40%
50%
60%
ANZ Bank 1 Bank 2 Bank 3
Share of lead bank, 2014
No.1 Lead Bank for more large corporate customers in New Zealand1

$0.0m
$0.5m
$1.0m
$1.5m
$2.0m
$2.5m
$3.0m
$3.5m
$4.0m
$4.5m
0
200
400
600
800
1,000
1,200
1,400
1 2 3 4 5 6+
9
Global Banking revenue mix
Strategic Advisory – ECM, M&A
Value added solutions – Investment Products, Structured Lending, Derivatives, DCM and Trade
Flow business – Cash, Trade, Vanilla FX, Commodities, Rates and Credit
Lending – Vanilla Term Loans
Regional connectivity1
45%
1%
21%
52%
26%
Global Banking business offers a good mix of flow and value added solutions with increasing regional connectivity across existing clients
Currently a substantial portion of our business is flow and value add
With extra upside from regional connectivity
FY13 = ~$2.6b
# of countries client banks in with ANZ
# $m
An extra country increases revenue
exponentially
1. “Meaningful Client” master groups that generate $30,000 for Institutional clients, and $10,000 for Corporate & Commercial clients in rolling 12 month revenue
# of Meaningful Clients (LHS)
Avg. Revenue per client (RHS)

10
2008-09 • Relationship Initiation
through participation in key transactions (as JLM)
• Key products of: Relationship Lending, Import Finance and Short Term Loan
• 4 companies
From a lending relationship in one country to one company, now banking 33 companies across nine countries in the group and becoming Trusted Advisor
With coverage in 17 countries, Global Banking is able to assist our clients grow through the region
2010-12 • Led/ Ideated key transactions and broad based
engagement across geographies/ products • Key products of: Loan Syndications, Trade
Financing and Short Term Loan • 21 companies 2013+ • Partner the Group in strategic dialogue • Products extended to include DCM and PCM • On boarded 10+ entities since FY13
2008-09 Revenue $4m
2010-12 Revenue $13m
2013+ Revenue $21m
Customer Case Study:
11
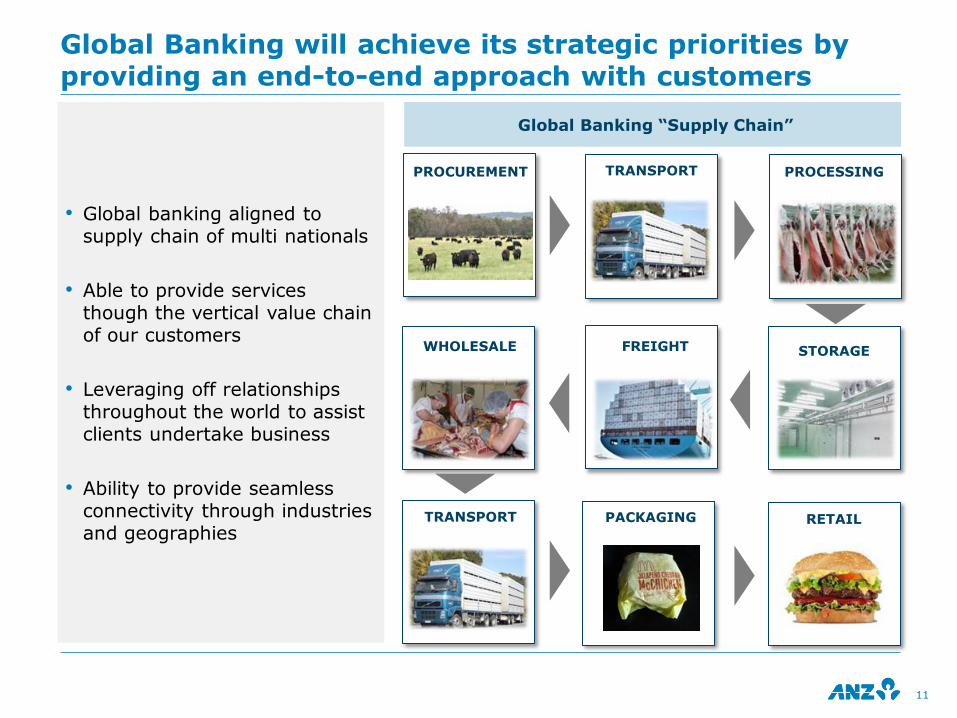
FREIGHT
PROCESSING
STORAGE
RETAIL
WHOLESALE
TRANSPORT PROCUREMENT
Global Banking “Supply Chain”
PACKAGING TRANSPORT
Global Banking will achieve its strategic priorities by providing an end-to-end approach with customers
• Global banking aligned to supply chain of multi nationals
• Able to provide services though the vertical value chain of our customers
• Leveraging off relationships throughout the world to assist clients undertake business
• Ability to provide seamless connectivity through industries and geographies

Connecting more Customers by Providing Seamless Value
Delivering Leading Products through Insights
Intensifying Balance Sheet Discipline
Scaling & Optimising Infrastructure
• Use industry insights to drive solutions dialogue with clients
• More intense coverage with a high degree of industry specialisation
• Aligning our key strengths to customers needs particularly in Capital Markets, Trade, Commodities, and FX on the product side, and Resources/Energy and FIG from an industry perspective
• Deepen existing client relationships
• Increase connectivity of our clients in ANZ’s region targeting growth on specific trade corridors where ANZ can offer full service
• Provide an end-to-end approach with large customers who are often vertically integrated
• Continually update our staffing to customer ratios and staffing footprints to align with our customers growth projections and needs
• Add transaction volumes without increasing the current fixed cost base, and leverage our newly created customer strategy and capital management teams to extract productivity gains
• Review customer value proposition and adjust accordingly using various metrics and balance sheet versus non balance sheet usage
• Continual review client list, ensuring resources are allocated to those customers with sophisticated and global reaching needs only
• Multi product service strategy requiring Balance Sheet hold levels and risk limits will continue to be managed
IIB STRATEGIC PRIORITIES
KEY AREAS OF FOCUS FOR GLOBAL BANKING
Delivering on these IIB Strategic Priorities will be critical for us to maintain our home market lead position and accelerate even further in Asia
12

APPENDIX

INFRASTRUCTURE BANK OF THE YEAR IN ASIA PACIFIC
NO.1 LEAD BANK FOR MORE LARGE CORPORATE CUSTOMERS ACROSS AUSTRALIA AND NEW ZEALAND
Recognised expertise through recent awards
14
2014
PETER LEE PETER LEE
NO. 1 FOR OVERALL MARKET PENETRATION IN AUSTRALIA AND
NEW ZEALAND
ASIA PACIFIC SYNDICATED LOAN AWARDS
ASIA PACIFIC SYNDICATED PROJECT FINANCE LOAN HOUSE OF
THE YEAR
ASIA PACIFIC SYNDICATED LOAN AWARDS
SYNDICATED LOAN HOUSE OF THE YEAR – AUSTRALIA
SYNDICATED LOAN HOUSE OF THE YEAR - NEW ZEALAND
INFRASTRUCTURE INVESTOR AWARDS
ASIA PACIFIC SYNDICATED LOAN AWARDS
SYNDICATED CORPORATE DEAL OF THE YEAR
Alibaba Group Holdings Ltd
ASIA PACIFIC SYNDICATED LOAN AWARDS
SYNDICATED FINANCIAL INSTITUTION DEAL OF THE YEAR
Yes Bank Ltd
ASIA PACIFIC SYNDICATED LOAN AWARDS
SYNDICATED PROJECT FINANCE DEAL OF THE YEAR
Ichthys LNG Pty Ltd
ASIA PACIFIC SYNDICATED LOAN AWARDS
SYNDICATED ACQUISITION FINANCE DEAL OF THE YEAR
CNOOC Canada Holding Ltd
ASIA PACIFIC SYNDICATED LOAN AWARDS
2014 2013 2013 2013
2013 2013 2013 2013 2013
BEST INVESTMENT BANK AWARDS - AUSTRALIA
BEST DOMESTIC CURRENCY BOND ARRANGER
BEST INVESTMENT BANK AWARDS - AUSTRALIA
BEST LOANS ARRANGER
ASIA PACIFIC SYNDICATED LOAN AWARDS
BEST SYNDICATED LOAN
Origin Energy
ASIA PACIFIC SYNDICATED LOAN AWARDS
BEST PROJECT FINANCING
Ichthys LNG
2013 2013 2013 2013
1. Peter Lee Associates Large Corporate and Institutional Relationship Banking Surveys, Australia and New Zealand 2014. Ranked against the top 4 competitors

Formosa Steel IB Pty Ltd
TERM LOAN FACILITY MANDATED LEAD ARRANGER,
UNDERWRITER & BOOKRUNNER
CNOOC Limited
5 – YR TERM LOAN FACILITY MANDATED LEAD ARRANGER
Tong Teik
SYNDICATED BORROWING BASE FACILITY FOR AGRI COMMODITIES JOINT MANDATED LEAD ARRANGER
& BOOKRUNNER
China Hongqiao
3YEAR SENIOR UNSECURED NOTES JOINT LEAD MANGER & JOINT
BOOKRUNNER
Volvo
REVOLVING CREDIT FACILITIES MANDATED LEAD ARRANGER &
BOOKRUNNER
AngloGold Australia
REFINANCE JOINT MANDATED LEAD ARRANGER
& BOOKRUNNER
15
JUNE 2014
EUR 2,300,000,000 USD 400,000,000 USD 360,000,000 USD 1,500,000,000
SGD 500,000,000 USD 1,350,000,000 USD 1,000,000,000 EUR 1,500,000,000 USD 700,000,000
USD 700,000,000
JUNE 2014 MAY 2014 JUNE 2014 JUNE 2014
Successful execution capabilities
USD 900,000,000
AUD 400,000,000
IN PROGESS
USD 250,000,000 AUD 8,600,000,000 EUR 800,000,000 NZD 725 MILLION AUD 1,000,000,000 USD 550,000,000
Ameropa
SYNDICATED BORROWING BASE FACILITY FOR GRAIN AND
FERTILIZER PRODUCTS PARTICIPATING BANK
Compañia Española de Petróleos S.A.U.
REVOLVING CREDIT FACILITY MANDATED LEAD ARRANGER &
BOOKRUNNER
Cargill Inc.
REVOLVING CREDIT FACILITY MANDATED LEAD ARRANGER &
BOOKRUNNER
PT Perusahaan Gas Negara (Persero)
3Y10-YEAR 5.125% 144A/REGS SENIOR UNSECURED NOTES
JOINT LEAD MANAGER & JOINT BOOKRUNNER
United Overseas Bank
BASEL III-COMPLIANT TIER 2 BONDS
JOINT LEAD MANAGER & JOINT BOOKRUNNER
Beijing Capital Group
1 YEAR BRIDGE LOAN FACILITY MANDATED LEAD ARRANGER &
UNDERWRITER
MAY 2014 MAY 2014 MARCH 2014 MARCH 2014 JANUARY 2014 JUNE 2014
AMP Group Finance Services Ltd
SYNDICATED REVOLVING FACILITY JOINT MANDATED LEAD ARRANGER
& BOOKRUNNER
Fletcher Building Limited
SYNDICATED LOAN FACILITY JOINT LEAD ARRANGER, FACILITY
AGENT
Origin Energy
BOND ISSUANCE JOINT LEAD MANGER
Origin Energy
SYNDICATED FACILITY JOINT MANDATED LEAD
ARRANGER, UNDERWRITER & BOOKRUNNER
ANZ Commodity Trading Pty Ltd
IRON ORE PREPAYMENT FACILITY SOLE MANDATED LEAD ARRANGER,
UNDERWRITER & BOOKRUNNER
GS Coal Pty Ltd
ACQUISITION SOLE MANDATED LEAD ARRANGER,
UNDERWRITER & BOOKRUNNER
NOVEMBER 2013 NOVEMBER 2013 NOVEMBER 2013 DECEMBER 2013 AUGUST 2013 JANUARY 2014
The material in this presentation is general background information about the Bank’s activities current at the date of the presentation. It is information given in summary form and does not purport to be complete. It is not intended to be relied upon as advice to investors or potential
investors and does not take into account the investment objectives, financial situation or needs of any particular investor. These should be considered, with or without professional advice when
deciding if an investment is appropriate
This presentation may contain forward-looking statements including statements regarding our intent, belief or current expectations with respect to ANZ’s business and operations, market
conditions, results of operations and financial condition, capital adequacy, specific provisions and risk management practices. When used in this presentation, the words “estimate”, “project”,
“intend”, “anticipate”, “believe”, “expect”, “should” and similar expressions, as they relate to ANZ and its management, are intended to identify forward-looking statements. Readers are cautioned not to place undue reliance on these forward-looking statements, which speak only as of the date hereof. Such statements constitute “forward-looking statements” for the purposes of the United
States Private Securities Litigation Reform Act of 1995. ANZ does not undertake any obligation to publicly release the result of any revisions to these forward-looking statements to reflect events or
circumstances after the date hereof to reflect the occurrence of unanticipated events.
For further information visit
www.anz.com
or contact
Jill Craig Group General Manager Investor Relations
ph: (613) 8654 7749 fax: (613) 8654 9977 e-mail: [email protected]
ANZ ASIA INVESTOR TOUR 2014
AUSTRALIA AND NEW ZEALAND BANKING GROUP LIMITED
24 JULY 2014
SIMON IRELAND GLOBAL HEAD OF BANKS & DIVERSIFIED FINANCIALS
Financial Institutions Group

2
International & Institutional Banking
Global Markets and Loans
Global Transaction
Banking
Global Products
4
5
Business Performance Management
Credit & Capital
Management
Business Execution & Performance
6
7
Finance
Risk
HR
Operations
Enablement
8
9
10
11
Customer Segments
Global Banking
Retail Banking Asia Pacific
1
3
International Banking
2
FIG
FIG is a customer segment within Global Banking

ANZ FIG serves a targeted, select set of Financial Institutions active across our network
3
Emphasis on Low Balance Sheet Intensity Products…
• Markets: FX, Rates, Credit and Commodities
• Transaction Banking: Clearing, Payments and Cash Management, Trade Finance
• Selective capital support
…Leads to high returns
Segment Description
Banks • Global, regional and local
banks with transaction needs
Diversified Financials
• Regulated Brokers, Exchanges, Leasing & Finance Companies, Mortgage and other Financial Institutions
Insurance • Life insurers, general insurers
and re-insurance brokers
Funds
• Fund managers, sovereign wealth funds, and alternative funds with appetite for Asia-Pacific and Australia & New Zealand assets

FIG Financial Performance
Relative to IIB Total YOY Growth
Revenue1
Deposits
Lending
FIG continues to grow and has a liquid balance sheet
4
Mar-14
Mar-14
1H14
Rest of IIB FIG
1. FIG revenues include amounts booked in other divisions
7.1%
22.2%
-2.4% Mar-14 PCP Sep-13 Sep-12
14.7% 12.4%
-6.7%
Mar-14 PCP Sep-13 Sep-12
16.6% 13.0%
17.5%
FY13 1H14 PCP FY12

The expanding financial services sector in Asia provides the foundation for FIG growth
5
1. Personal wealth defined as financial assets, including stocks, bonds and funds. Excludes real estate
Source: BCG analysis, EIU, Cerulli Associates
Asia Pacific
Australia & New Zealand
Europe
North America
Rest of World
2017
142
5
2014
125
4
2010
108
3
Banking Assets US$ tn
2014-2017 CAGR
4.3%
10.3%
3.3%
2.8%
5.0%
5.7%
Asia Pacific
Rest of World
Australia
Europe
North America
2017
87
3
2014
73
2
2010
55
1
Personal Wealth1 US$ tn
2014-2017 CAGR
6.2%
7.0%
5.7%
6.0%
9.6%
7.6%
Growing Banking Assets Growing Assets Under Management

We have built our FIG capabilities in Asia on our Australia/NZ foundation and the IIB product build-out
6
2009 – 2010 2011 - 2013 Today
• Identified FIG as a global growth opportunity
• Strong AUD and NZD clearing franchise
• Leading AUD and NZD FX player
• Established Asia coverage team
• Established India, Malaysia and Pacific FIG presence
• Global presence: circa 100 FTEs in 17 offices
• Enhance product offering – DCM, FX, FI Trade, Gold loans and leasing
• Extended coverage team
• Established presence in Middle East
• Introduced specialization within FIG
• Global presence: circa 140 FTEs in 18 offices
• Strong presence in home markets, Asian hubs, China, Europe and America
• Deepening capabilities in India, Indonesia, Japan and Taiwan
• Balanced franchise with competitive capabilities across both Transaction Banking and Markets
• Leading position in AUD/NZD clearing, Syndications, DCM, Regional FX and Gold
• Global presence: circa 150 FTEs in 18 offices
Getting off the Ground Building the
Platform Competitive Offering

FIG is expanding in Asia and improving product mix as we deepen our capabilities and broaden our reach
7
Australia & New Zealand
Americas
Europe
Asia
Pacific
FIG Revenue Mix by Geography1
Lending
Transaction Banking
Markets
Retail, Private Bank
& Other
FIG Revenue Mix by Product
Geographic Mix Product Mix
1. Based on location of the client irrespective of where revenue is booked
41.9% 39.9% 38.7%
15.8% 15.4% 14.3%
14.9% 15.2%
14.0%
24.3% 26.8% 30.5%
3.2% 2.6% 2.6%
FY12 FY13 1H14
33.3% 29.0% 29.6%
32.6% 39.8% 41.9%
10.1% 10.0% 8.6%
24.0% 21.3% 19.9%
FY12 FY13 1H14

FIG competes with global and regional players using a focused model balancing revenue potential with cost
8
Full Service Universal
Banks
Broad FICC & Commercial
Banking
Specialist Banks (Clearing,
Investment Banks)
Domestic Regional Global
Increasing cost
Increasing cost
FIG Competitive Positioning

• Provide international Financial Institutions with capital raising, transaction banking, and investment opportunities across Australia, New Zealand and Asia Pacific
• With local specialists on the ground, we provide clients with deep insights and access to the right products in individual markets across the region
• AA rating, reputation and steeping into gaps vacated by competitors
• Flow bank for market products (namely FX, Fixed Income, DCM, Trade Finance) across Asia Pacific
• Liquidity provider to regional financial institutions and targeting investors – specialize in Asian investors
• While ANZ is non competitive with American and European incorporated FI’s in their home market, we can provide their Asian footprint
9
ANZ FIG’s value proposition is built on a unique mix of rating, footprint and product capabilities
Value Proposition ANZ’s Competitive Advantage
ANZ Global FIG Value Proposition

Leading products strengthen ties to customers and enhance cross-sell of flow products
10
Debt Markets Physical Gold
• Strong track record of issuance for Chinese, Korean, Singaporean and Middle Eastern FIG issuers
• Leading position in AUD in both Australia and Asia
• Leader in Basel III compliant issues
• Largest CNH bond issuance for a Taiwanese financial institution
• Number 2 by volume and number 1 by number of deals in 2013 as Mandated Arranger of Loan Syndication for Asia Pacific ex Japan
• Top 3 position in gold imports into China – the largest market globally, with 1,540 tonnes imported during 2013
• Recognized as the #1 Foreign Bank Market Maker by Shanghai Gold Exchange 4-yrs running from 2010-2013
• Relationships with the 10 domestic gold importing banks in China – 4 of the 10 did their first import with ANZ and 5 of the 10 their first overseas gold loan
• One of just two foreign banks licensed by the PBOC to import gold into China
• One of just two foreign bank market makers licensed on the Shanghai Futures Exchange
• Also have presence in other markets in Asia and the Middle East
Flow Products
• Markets: FX, Rates and Credit
• Transaction Banking: Clearing, Cash Management and FI Trade
• Rated #1 for AUD and NZD Clearing Relationships by FImetrix1
1. FImetrix 2014 Bank-to-Bank Services in Australia & New Zealand Dollars survey

USD 135/EUR 95m USD 700m USD 800m USD 400m
AmBank (M) Berhad USD400mn 5-Year 3.125%
Reg S only Senior Unsecured Notes
As demonstrated by sophisticated transactions for our clients
11
AUD
Local
Currency
USD
USD 300m
JUNE 2014
China CITIC Bank Int. USD300m 7.250%
PerpNC5 Basel III-Compliant AT1 Notes
APRIL 2014
United Overseas Bank USD800mn 3.750% 10.5NC5.5 Basel III-Compliant T2 Notes
MARCH 2014
Bank of Communications
Hong Kong Branch
USD700mn 2.125%
3-Year Bonds
JANUARY 2014
Hana Bank
Term Loan Facility Mandated Lead Arranger
AUGUST 2013
RMB 890m USD 375m equiv. PHP 1.2b SGD 500m
United Overseas Bank 12NC6 3.5% Basel III-
Compliant Tier 2 Subordinated Notes
JPY 12b
MAY 2014
NongHyup Bank
Term Loan Facility
Mandated Lead Arranger
MAY 2014
Metrobank Card Corporation
PHP1,170mn 6.210% 10NC5 T2 Notes
DECEMBER 2013
Far East Horizon USD375mn equivalent
Multi-currency USD/HKD/CNH Syndicated Term Loan
DECEMBER 2013
Chailease Holding Term Loan Facility
Mandated Lead Arranger, Bookrunner, Sole Coordinating
Arranger
NOVEMBER 2013
AUD 500m AUD 400m AUD 500m AUD 400m
Korea Development Bank AUD 400mn Dual Tranche
Fixed and Floating Rate Bonds
AUD 400m
MAY 2014
Emirates NBD PJSC AUD400mn 5.750%
5-Year Bonds
APRIL 2014
The Export-Import Bank of Korea
AUD 500mn Dual Tranche Fixed and Floating Rate Bonds
APRIL 2013
National Bank of Abu Dhabi PJSC
AUD400mn 4.750% 5-Year Bonds
MARCH 2013
Bank of China, Sydney Branch
AUD500mn 3m BBSW +110bps Floating Rate TCD
NOVEMBER 2013

FIG is critical to linking home market and Asian clients to global investors in our originate-to-distribute model
12
Progress to Date
• Distribution of DCM and
Syndicated Loans
• Established relationships with key investors – fund managers, pension & sovereign wealth funds, alternative funds and insurers
Future Build
• Enhance sales capabilities in key investor markets: London, New York, Japan, Hong Kong, Singapore, Taiwan and Korea
• Develop financing partners for Infrastructure, Energy, Mining and Agriculture assets
Balance Sheet
• Primary Distribution
• Secondary Distribution
• Originate to known demand
Resources, Energy & Infra.
Commercial / Private Banks
Investment Funds
Pension Funds & SWFs
Alternative Funds
Insurers
HNW & Affluent
Global Diversified Industries
Financial Institutions
Commercial
Corporate
International Banking
Cross-sell Cross-sell
Originate from Clients Distribute to Clients FIG is Critical to Originate-
to-Distribute
Flow Products

FIG’s objective to be a core FICC and TB partner for FI’s across Asia Pacific aligns to IIB priorities
Connecting more Customers by Providing Seamless Value
Delivering Leading Products through Insights
Intensifying Balance Sheet Discipline
Scaling & Optimising Infrastructure
• Enhance Rates and Credit offering for Funds and Insurance
• Continue roll-out of e-FX platform across all FIs
• Cash Management for Insurance and Diversified Financials
• Enhance investor client value proposition through increased specialization of the relationship team
•Dedicated Markets and Transaction Banking sales teams for FI for enhanced solution capability
•Deepen investor relationships, facilitating the originate-to-distribute model for our corporate business
• Provide Asia footprint for institutions outside Asia Pacific
• Utilize new products in other parts of the business as they become available
• Extend clearing capability to targeted Asian currencies (INR, IDR, PHP, RMB)
IIB STRATEGIC PRIORITIES
KEY AREAS OF FOCUS FOR FIG
13
•Maintain strict risk discipline through Business Risk Appetite Statement and active portfolio reviews
•Manage client returns objectives
• Staying on Strategy

APPENDIX

Loan Syndication League Table
15
1. Source: Thomson Reuters LoanConnector, ANZ
2013 Mandated Arranger League Table for Financial Institutions
(Asia Pacific ex Japan)
Rank Lender Amount (USD mn)
Deal Count
1 Mizuho Financial Group 466 6
2 ANZ 435 11
3 HSBC 433 8
4 Mitsubishi UFJ Financial Group 360 5
5 Sumitomo Mitsui Financial Group 316 6
6 Commerzbank 315 10
7 Standard Chartered 290 7
8 Citibank 166 5
9 Bank of America Merrill Lynch 155 5
10 Wells Fargo 144 5

The material in this presentation is general background information about the Bank’s activities current at the date of the presentation. It is information given in summary form and does not purport to be complete. It is not intended to be relied upon as advice to investors or potential
investors and does not take into account the investment objectives, financial situation or needs of any particular investor. These should be considered, with or without professional advice when
deciding if an investment is appropriate
This presentation may contain forward-looking statements including statements regarding our intent, belief or current expectations with respect to ANZ’s business and operations, market
conditions, results of operations and financial condition, capital adequacy, specific provisions and risk management practices. When used in this presentation, the words “estimate”, “project”,
“intend”, “anticipate”, “believe”, “expect”, “should” and similar expressions, as they relate to ANZ and its management, are intended to identify forward-looking statements. Readers are cautioned not to place undue reliance on these forward-looking statements, which speak only as of the date hereof. Such statements constitute “forward-looking statements” for the purposes of the United
States Private Securities Litigation Reform Act of 1995. ANZ does not undertake any obligation to publicly release the result of any revisions to these forward-looking statements to reflect events or
circumstances after the date hereof to reflect the occurrence of unanticipated events.
For further information visit
www.anz.com
or contact
Jill Craig Group General Manager Investor Relations
ph: (613) 8654 7749 fax: (613) 8654 9977 e-mail: [email protected]

ANZ ASIA INVESTOR TOUR 2014
AUSTRALIA AND NEW ZEALAND BANKING GROUP LIMITED
24 JULY 2014
WILL RATHVON GLOBAL HEAD OF RESOURCES, ENERGY & INFRASTRUCTURE
Resources, Energy & Infrastructure

Resources, Energy and Infrastructure (REI) is a customer segment within IIB
1
International & Institutional Banking
Global Markets and Loans
Global Transaction
Banking
Global Products
4
5
Business Performance Management
Credit & Capital
Management
Business Execution & Performance
6
7
Finance
Risk
HR
Operations & Technology
Enablement & Control
8
9
10
11
Customer Segments
Global Banking
Retail Banking Asia Pacific
1
3
International Banking
2
REI
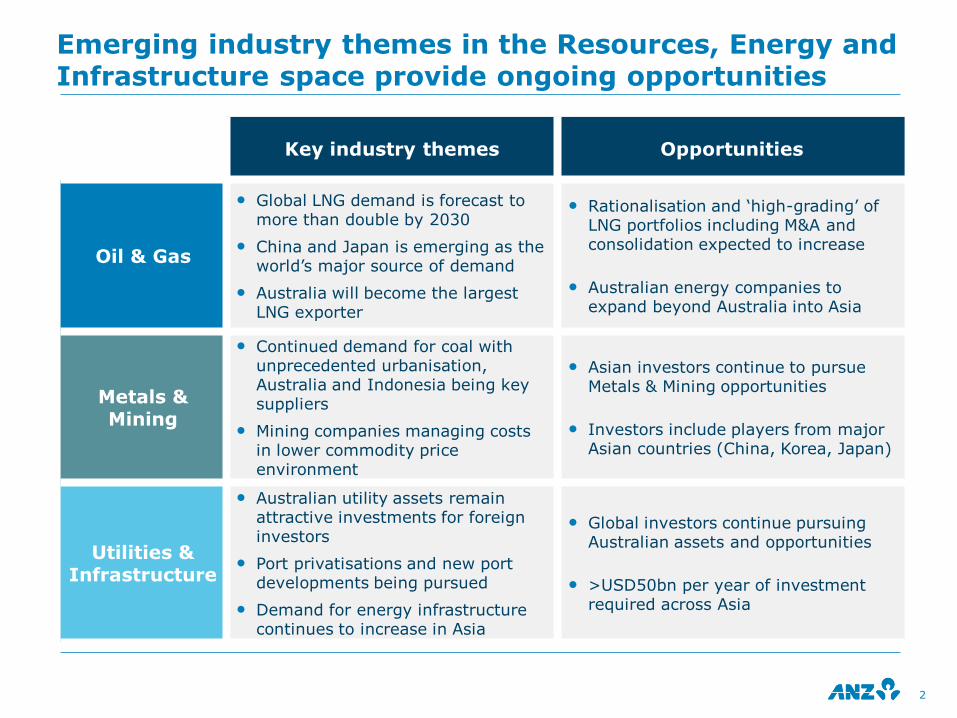
Emerging industry themes in the Resources, Energy and Infrastructure space provide ongoing opportunities
2
Key industry themes Opportunities
Oil & Gas
• Global LNG demand is forecast to more than double by 2030
• China and Japan is emerging as the world‟s major source of demand
• Australia will become the largest LNG exporter
• Rationalisation and „high-grading‟ of LNG portfolios including M&A and consolidation expected to increase
• Australian energy companies to expand beyond Australia into Asia
Metals & Mining
• Continued demand for coal with unprecedented urbanisation, Australia and Indonesia being key suppliers
• Mining companies managing costs in lower commodity price environment
• Asian investors continue to pursue Metals & Mining opportunities
• Investors include players from major Asian countries (China, Korea, Japan)
Utilities & Infrastructure
• Australian utility assets remain attractive investments for foreign investors
• Port privatisations and new port developments being pursued
• Demand for energy infrastructure continues to increase in Asia
• Global investors continue pursuing Australian assets and opportunities
• >USD50bn per year of investment required across Asia

The ANZ REI business focuses on 4 key segments
Emphasis on selected products and geographies
• Transaction Banking: Trade Finance and Cash Management
• Markets: DCM, FX, Rates, and Commodities
• Global Loans & Advisory: Structured Debt and Financial/M&A Advisory
• Key countries: Australia, China, Indonesia, and Singapore
Segment Description
Oil & Gas
• Oil & Gas development and production, LNG, refining, and petrochemicals
Mining & Metals
• Globally diversified miners, industry leaders, and specialist resource companies
• Primary focus is with producers and consumers of coal, iron ore, copper, and gold
Global Commodities Companies
• Larger diverse global Commodities companies involved with Oil & Gas and Mining & Metals activities
• Includes Asian strategic investors and traditional commodity traders
Utilities & Infrastructure
• Global, regional, and local infrastructure and utilities companies
• Focus on ports, power, privatisation, and PPP
3
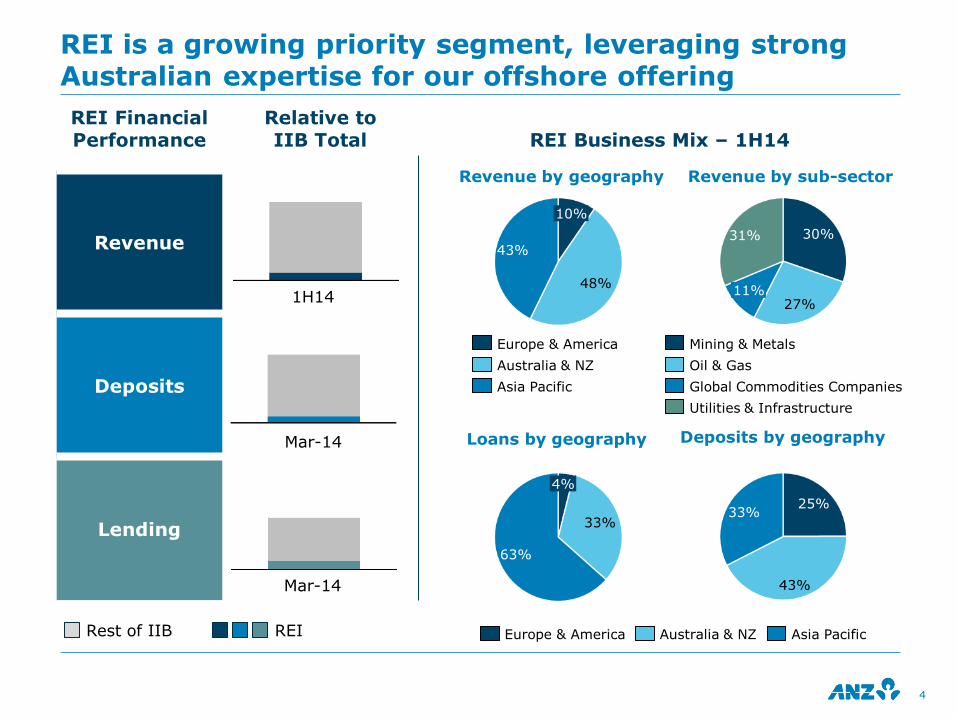
REI Financial Performance
Relative to IIB Total REI Business Mix – 1H14
Revenue
Deposits
Lending
REI is a growing priority segment, leveraging strong Australian expertise for our offshore offering
Mar-14
Mar-14
1H14
Rest of IIB REI
11% 27%
30% 31%
Global Commodities Companies
Mining & Metals
Oil & Gas
Utilities & Infrastructure
43%
48%
10%
Asia Pacific
Europe & America
Australia & NZ
Revenue by geography Revenue by sub-sector
33%
43%
25%
63%
33%
4%
Asia Pacific Europe & America Australia & NZ
Loans by geography Deposits by geography
4

5
Supported resources and infrastructure clients since 1886, remaining committed throughout all commodity cycles and changes in the global industry; initially focused predominantly in Mining & Metals
Natural resources banker to over 60% of the largest resources companies on the ASX300
We have had a lead bank relationship with a number of major resources and infrastructure companies for over 50 years (BHP: ~140 years, Shell: ~120 years, AGL: ~50 years)
Built deep LNG expertise in Australia over the last decade, having been involved in every Australian project over the last 8 years
ANZ has been a key player in the financing of a number of National infrastructure projects
We are leveraging our long history with the Australian Resources & Infrastructure sector to grow REI globally
ANZ’s rich history with natural resources and infrastructure

ANZ is differentiating itself with a whole of client approach through insights and home market expertise
6
Nature of our clients
ANZ’s proposition How we will win
Geographic breadth in operations
Leading with our deep experience and expertise in
Natural Resources in the Australian market
• Leveraging our resources expertise to differentiate from global and regional peers
• Continuing to enhance our cross-border product capabilities to differentiate with domestic peers
• Established cross-border product suite capability for our bankers to structure for clients
Debt Capital Market
Commodities team
Structured Trade Finance
Regional Cash Management platform
Requiring cross-border
complex banking solutions
“Global Hybrid Bankers” offering strategic dialogue to
clients; translating into insights and tailored
solutions
Operating in a challenging
and competitive environment
Deep understanding of associated risks to deliver complex solutions which are appropriately structured
and priced

We are building a core client and global flow proposition focusing on key market corridors
7
REI is focused on a small number of complex multi national clients, the right balance of Industry specialisation, and regional & local teams
Global Clients Regional Clients Local Clients
Type of client
Specialist relationship teams providing
international connectivity
Industry specialists with regional experts
provide deeper insights
Local relationships will use industry specialists
as needed
• Flow products focus • Value added solutions
important • Strategic Balance
Sheet Use
• Value added solutions focus
• Grow Flow products • Strategic Balance
Sheet Use
• Value added solutions and Flow products focus
• Strategic Balance Sheet Use
Key market
corridors
Asia, Europe, & Americas to Australia
• Australia to and from North Asia
• Intra Asia
• Australia
• China
• Singapore
• Indonesia

8
Our value added solutions will focus on flow business and value added solutions…
…with deeper focus on key offerings
Flow business (Markets)
• Foreign Exchange
• Commodities
• Rates
• Debt Capital Markets
Structured & Strategic
• Structured Trade & Export finance
• Project finance
• Asset finance
• Advisory & Finance
24%
55%
19%
2%
Vanilla lending
Flow business
Value added solutions
Strategic advisory
3%
56%
20% 21%
1H14 Our Aim
REI Revenue Mix
We will continue to deepen our established relationships with less capital intensive products

Good progress to date with our strategic evolution by leveraging our home market strengths to build offshore
9
Stage I (2008-11): Initiating our “Super-Regional” approach
Stage II (2012-13): Executing to “Super-Regional” approach
Stage III (2014+): Success stories
Our clients are:
• Leading European and US-based Oil & Gas, Commodities companies
• Large operations across multiple countries, particularly across Asia Pacific
ANZ was:
• Deep sector expertise historically in resources sector in Australia, but with limited geographic reach
• Limited cross-border insights
• Leveraging home market expertise to expand offshore capability
Our clients are looking for:
• Deep understanding of their business given the challenging and competitive environment
• Complex cross-border solutions that are tailored to client‟s needs
What ANZ is now:
• Geographic reach in key centres (Australia, HK, Singapore, Europe, US, China, Indonesia)
• Leveraging our history and strong anchor market to provide industry expertise and insights into Australian market
• Translating these insights to offer complex tailored solutions to multi-geographic clients
Becoming one of the primary banks
Structuring complex cross-border solutions
Inpex
SENIOR DEBT PROJECT FINANCING
MANDATED LEAD ARRANGER & BOOKRUNNER, SUB-FACILITY
AGENT, UPSTREAM ACCOUNT BANK
USD 20,000,000,000
DECEMBER 2012
Puma Energy
ACQUISITION & TRADE FINANCE
SOLE BRIDGE UNDERWRITER, JOINT MANDATED LEAD
ARRANGER, UNDERWRITER & BOOKRUNNER
AUD 500,000,000
FEBRUARY 2013
Formosa Plastics Group ADVISORY & FINANCING FOR JOINT VENTURE AGREEMENT FOR MINING INVESTMENT IN
AUSTRALIA FINANCIAL ADVISOR, BRIDGE FINANCING PROVIDER & TERM
FINANCING UNDERWRITER
USD 1,150,000,000
AUGUST 2013
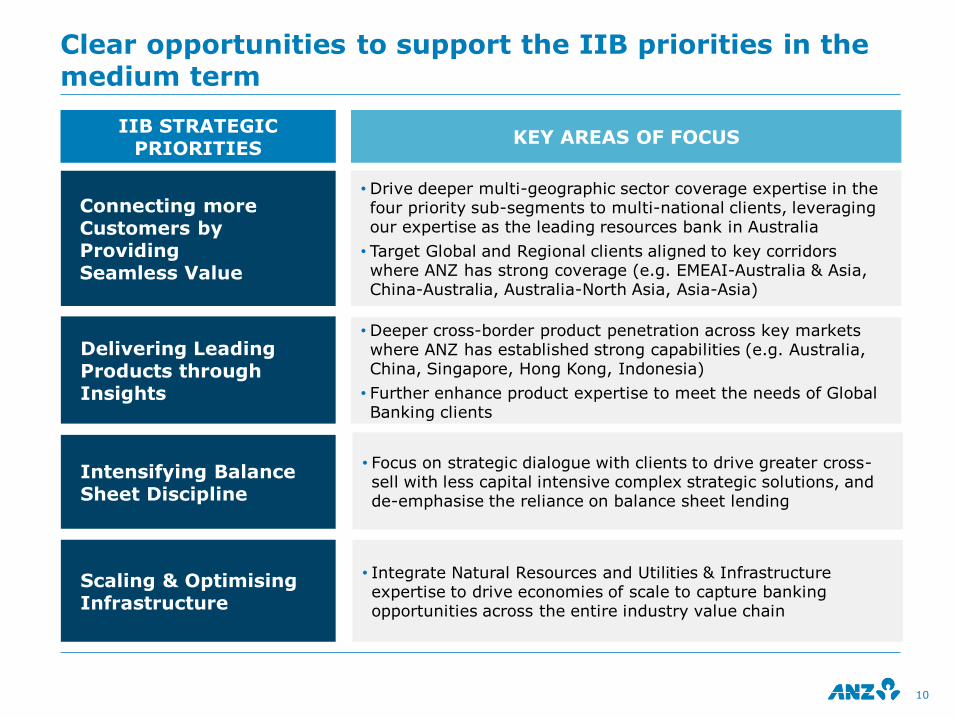
Clear opportunities to support the IIB priorities in the medium term
Connecting more Customers by Providing Seamless Value
Delivering Leading Products through Insights
Intensifying Balance Sheet Discipline
Scaling & Optimising Infrastructure
•Deeper cross-border product penetration across key markets where ANZ has established strong capabilities (e.g. Australia, China, Singapore, Hong Kong, Indonesia)
• Further enhance product expertise to meet the needs of Global Banking clients
•Drive deeper multi-geographic sector coverage expertise in the four priority sub-segments to multi-national clients, leveraging our expertise as the leading resources bank in Australia
• Target Global and Regional clients aligned to key corridors where ANZ has strong coverage (e.g. EMEAI-Australia & Asia, China-Australia, Australia-North Asia, Asia-Asia)
• Integrate Natural Resources and Utilities & Infrastructure expertise to drive economies of scale to capture banking opportunities across the entire industry value chain
• Focus on strategic dialogue with clients to drive greater cross-sell with less capital intensive complex strategic solutions, and de-emphasise the reliance on balance sheet lending
IIB STRATEGIC PRIORITIES
KEY AREAS OF FOCUS
10

APPENDIX

12
Client feedback with our strategy
Oil & Gas
“Over the past 24 months, we have noticed a positive change in working more closely with ANZ‟s global Natural Resources team, and have appreciated the team‟s co-ordination, commitment, and responsiveness to our banking and finance needs. We will continue to seek ANZ‟s industry specialist advice and financing support as one of our close international banking partners.”
Mining & Metals
“Since ANZ implemented an industry focus, the relationship with ANZ has unequivocally changed from mediocre to being a top relationship bank. Today, the regional industry mining expertise, coupled with a strong local coverage capability makes ANZ the leader in coverage of this industry in the region. This can only be achieved with the strong leadership from Singapore, as well as the senior level access from key ANZ members in Melbourne.”
Global Commodities Companies
“We like ANZ particularly because they have a speciality in serving commodity and metals companies. They…offer fast execution, and are able to provide a full suite of services, including consulting.”
Utilities & Infrastructure
“ANZ regularly engages with us in strategic discussions, demonstrating a depth of market and industry insights. This has resulted in more informed and dynamic discussions well beyond day-to-day transactional requirements. ANZ‟s industry expertise and regional strengths, are why we have entrusted them to lead arrange select core funding facilities and acquisitions in Asia Pacific.”
Client Testimonials

The material in this presentation is general background information about the Bank‟s activities current at the date of the presentation. It is information given in summary form and does not purport to be complete. It is not intended to be relied upon as advice to investors or potential
investors and does not take into account the investment objectives, financial situation or needs of any particular investor. These should be considered, with or without professional advice when
deciding if an investment is appropriate
This presentation may contain forward-looking statements including statements regarding our intent, belief or current expectations with respect to ANZ‟s business and operations, market
conditions, results of operations and financial condition, capital adequacy, specific provisions and risk management practices. When used in this presentation, the words “estimate”, “project”,
“intend”, “anticipate”, “believe”, “expect”, “should” and similar expressions, as they relate to ANZ and its management, are intended to identify forward-looking statements. Readers are cautioned not to place undue reliance on these forward-looking statements, which speak only as of the date hereof. Such statements constitute “forward-looking statements” for the purposes of the United
States Private Securities Litigation Reform Act of 1995. ANZ does not undertake any obligation to publicly release the result of any revisions to these forward-looking statements to reflect events or
circumstances after the date hereof to reflect the occurrence of unanticipated events.
For further information visit
www.anz.com
or contact
Jill Craig Group General Manager Investor Relations
ph: (613) 8654 7749 fax: (613) 8654 9977 e-mail: [email protected]

ANZ ASIA INVESTOR TOUR 2014
AUSTRALIA AND NEW ZEALAND BANKING GROUP LIMITED
24 JULY 2014
SREERAM IYER CHIEF OPERATING OFFICER, INTERNATIONAL & INSTITUTIONAL BANKING
Operational Strategy

International & Institutional Banking
Global Markets and Loans
Global Transaction
Banking
Global Products
4
5
Business Performance Management
Credit & Capital
Management
Business Execution & Performance
6
7
Finance
Risk
HR
Operations and
Technology
Enablement
8
9
10
11
Customer Segments
Retail Banking Asia Pacific
3
International Banking
2
Global Relationship
Banking
1
2
International & Institutional Banking Structure

3
Our function supports the delivery of the IIB strategy
Technology is a foundation for customer initiation, relationship, service and delivery
Customer self service
Service Quality
People Capability
Cost to Serve
Operational Risk
Customer interface Customer Service Operations Delivery Model
Cu
sto
mer i
nit
iati
on
Customers
•Global • International •Retail, Wealth & Private Bank
Delivery
Enterprise Capability
Regional Delivery Network:
•Melbourne
•Wellington
•Bangalore
•Manila
•Chengdu
•Suva
Frontline business
•Relationship management
• Product, market knowledge
Operations Service Providers
• Technical solution delivery
•Close proximity to customers

4
Our operations delivery model focuses on customer outcomes
Service Quality
• In addition to transactional processing responsibilities, we proactively
provide customer insights and analytics to service our
relationship teams and add value to our customers
• We have made ~3,000 client visits in the last 18 months to deepen
our understanding and customise our response
• Through our Tiered Service model, we have an integrated cross-
product service proposition for customers, including a single
point of contact and query resolution to better match service
capability and transaction delivery standards
People Capability
• Our enterprise wide operations and technology team has physical
presence in ~28 countries.
• Our regional delivery networks now have ~10,000 employees
across Australia, New Zealand, India, Philippines, China and Fiji and
are a source of talent to support future growth
• Our people capability includes change and transformation
expertise across Markets, Digital, Payments and Lending
Operations Delivery Model
5
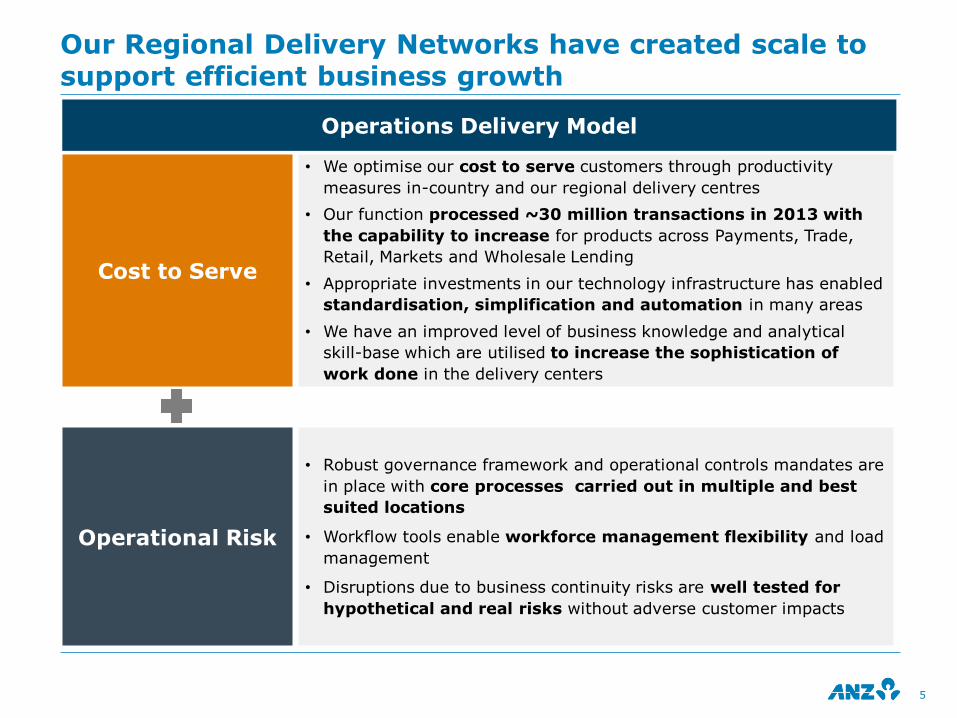
Our Regional Delivery Networks have created scale to support efficient business growth
Cost to Serve
• We optimise our cost to serve customers through productivity
measures in-country and our regional delivery centres
• Our function processed ~30 million transactions in 2013 with
the capability to increase for products across Payments, Trade,
Retail, Markets and Wholesale Lending
• Appropriate investments in our technology infrastructure has enabled
standardisation, simplification and automation in many areas
• We have an improved level of business knowledge and analytical
skill-base which are utilised to increase the sophistication of
work done in the delivery centers
Operational Risk
• Robust governance framework and operational controls mandates are
in place with core processes carried out in multiple and best
suited locations
• Workflow tools enable workforce management flexibility and load
management
• Disruptions due to business continuity risks are well tested for
hypothetical and real risks without adverse customer impacts
Operations Delivery Model

From To Operational advantages via the Regional Delivery Network
Individual hubs
Integrated Network
Individual Hubs to an Integrated Network with Enterprise thinking
• Built-in operational resilience with load balancing of critical processes to improve business continuity planning and execution
• Strong cross hub collaboration and resource sharing
• Maximise skills and scale in the right geographic location
Business Transitions
Operational Productivity
Optimising capabilities to improve productivity
• Process standardisation in key processes with investment in key technology infrastructure
• Continuous Process improvements through Quality initiatives
Business Process
Customer Solution
From being part of a process to being an integral part of end-to-end process
• Project SMEs in the hubs delivering award winning platforms in payments
• Domain expertise for complex transaction in Trade Guarantees and Markets
Hotel Manager
Service Owner
Driving and owning service outcomes
• Simplified customer engagement and escalation models
• Standard Service Catalogue
• Implement functional structures based on standard processes
Regional Delivery Centres are strategically aligned and integrated to the business
6

Common Enterprise Capabilities
A consistent customer experience via a multi-channel platform for our business
A regional delivery network allowing standardised processes
An integrated transaction banking portal for Institutional
An improved payments network providing a seamless experience
An upgraded infrastructure to enhance resilience and reduce operating risks
Keep pace with evolving security environment to maintain customer and regulator confidence
Secure Banking Environment
Technology has a pivotal role in the transformation of all our core business domains
Connected Customer Experience
Self-serve channels Assisted channels
Business and Experience Integration
Robust IT Foundation Capabilities
Robust Infrastructure
Seamless Integration
Convenient Access
Customer Payments Operations Products & Services
Supported by a
regional network
7

1. Operations onshore and offshore profile; excludes countries with regulatory constraints to offshore
2. Cost growth has been calculated on constant FX & includes IIB Operations hub costs
Improved capability and geographic dispersion of where our employees are based Driving productivity
5.41%
4.45% 4.25%
3.86%
3.0%
3.5%
4.0%
4.5%
5.0%
5.5%
6.0%
FY11 FY12 FY13 1H14
8
IIB Operations have successfully increased productivity
4,469
4,865
5,346
FY11 FY12 FY13
20%
26%
33%
36%
80%
74%
67%
64%
FY11 FY12 FY13 1H14
Offshore Onshore
IIB Operations Cost to Revenue2
Transactions per FTE
IIB Operations FTE profile1

Creating a continuous improvement culture to drive business performance
9
Standardise Enrich Simplify
Actions Re-engineering standard
processes and creating more flexibility across the network
Maintaining a focus on consistent customer service experience while providing
specialised support for our top clients
Driving simpler and streamlined processes with a focus on
customer experience through end-to-end improvements
How
Using standardised technology solutions across
our network to improve efficiency and productivity
Deepening our understanding of customer needs via
continued customer visits and better leveraging Customer
Insights
Focusing on quality delivery to drive improvement in accuracy
and turn-around-times
Outcomes
Won 11 awards from JP Morgan across the network following
upgrades of payments infrastructure allowing
for greater straight through processing
Created consistency of Cross-Border Product
Documentation tailored to Global
Diversified Industrials
Enhanced servicing model deployed for 350
Australian customers to improve retention and
cross sell
Client servicing tool utilised to capture client insights in Payments &
Cash, Trade and Markets Operations –10 countries
Digitisation (workflow and imaging) of manual
payments processing in 12 countries creating capacity
and productivity
Transactive registration process in Australia & NZ
reduced by up to 66% allowing faster take up by
customers

Connecting more Customers by Providing Seamless Value
Delivering Leading Products through Insights
Intensifying Balance Sheet Discipline
Scaling & Optimising Infrastructure
• Continue to utilise customer analytics and insights through our regional delivery network to connect with the business and contribute to revenue generation
• Connected and simplified client on-boarding experience leading to enhanced customer cross-sell, leads and retention
• Proactively managing operating and regulatory risks on an end to end basis
• Continue to improve and consolidate our systems across Payments, Markets, Core Banking, Wholesale Lending and Retail
• Improve straight through process rates and sustain our productivity agenda
• Nimble cross-border delivery by making use of our natural time-zone advantage to shorten servicing and processing turnaround
• Drive continuous improvement to simplify processes
IIB STRATEGIC PRIORITIES
KEY AREAS OF FOCUS FOR OPERATIONS AND TECHNOLOGY
10
Our priorities are focused on supporting the next phase of IIB strategy

APPENDIX

Our function is well integrated into the IIB business and enterprise delivery division
Group Management
Control and Support Functions
Group Technology
Wealth Operations
Centres of Excellence
Regional Network of Hubs and Delivery Centres
Australia Operations
Hub
New Zealand Operations
Hub
Asia-Pacific Operations
Hubs
Institutional Operations
Centres of Excellence
Wealth Australia NZ Asia-Pacific Institutional GTSO
– D
elivery
Custo
mer
Busin
esses
Enable
ment
Australia New Zealand Global Wealth
Divisional COO’s
Australia New Zealand Global Wealth
Customer Businesses
International & Institutional Banking
Div
isio
nal
IIB
CO
O
Divisional IIB COO
Global Markets Operations
IIB Lending Operations
IIB Property
Global Trade Operations
IIB Payments & Cash Operations
IIB Sourcing
Asia Pacific Retail, Private Bank & Wealth Operations
IIB Technology
IIB Projects
Divisional IIB COO
12

The material in this presentation is general background information about the Bank’s activities current at the date of the presentation. It is information given in summary form and does not purport to be complete. It is not intended to be relied upon as advice to investors or potential
investors and does not take into account the investment objectives, financial situation or needs of any particular investor. These should be considered, with or without professional advice when
deciding if an investment is appropriate
This presentation may contain forward-looking statements including statements regarding our intent, belief or current expectations with respect to ANZ’s business and operations, market
conditions, results of operations and financial condition, capital adequacy, specific provisions and risk management practices. When used in this presentation, the words “estimate”, “project”,
“intend”, “anticipate”, “believe”, “expect”, “should” and similar expressions, as they relate to ANZ and its management, are intended to identify forward-looking statements. Readers are cautioned not to place undue reliance on these forward-looking statements, which speak only as of the date hereof. Such statements constitute “forward-looking statements” for the purposes of the United
States Private Securities Litigation Reform Act of 1995. ANZ does not undertake any obligation to publicly release the result of any revisions to these forward-looking statements to reflect events or
circumstances after the date hereof to reflect the occurrence of unanticipated events.
For further information visit
www.anz.com
or contact
Jill Craig Group General Manager Investor Relations
ph: (613) 8654 7749 fax: (613) 8654 9977 e-mail: [email protected]