managing credit risk in rural financial institutions in latin america mark wenner rural finance...
TRANSCRIPT

Managing Credit Risk in Rural Financial Institutions in Latin America
Mark Wenner
Rural Finance Research Conference
March 19, 2007
Rome, Italy

Outline
Types of Risks Financial Institutions Face Significance of Credit Risk Ways of Evaluating Creditworthiness Common Portfolio Credit Risk Management
Techniques Results from Survey of 42 Latin American RFIs Highlights of Four Case Studies Conclusions and Recommendations

Types of RF Institutional Risks
Credit Liquidity Interest Rate Foreign Exchange Technological
Operational Product Innovation Reputational Regulatory

Two Most Important Risks
CreditCredit Interest Rate
Focus is on credit risk because majority of rural finance institutions are non-deposit taking. Many smaller institutions are dependent on concessional funds.
Note: a liquidity crisis is the culmination of other risks and is the immediate cause of insolvency and failure.

Forms of Evaluating Creditworthiness
Repayment Capacity Analysis Human Based Expert Systems Mathematical Models
Credit Scoring (discriminant analysis & logit/probit)Programming Hybrids (computation, estimation, and plus
simulation)
Asset-backed Analysis

Figure 1: Credit Analysis Process Flow
Does the borrower have a repayment strategy
Why does the firm need to borrow?
Is the risk-reward ratio acceptable to the
lender?
Source: Adapted from Caoutte et al, 1998
Strategy Review: Does the firm have a clear sense of direction and
how to get there?
1. Management Analysis: Competence, Integrity 2. Financial Analysis: Balance Sheet and Cash Flow Analysis - projections 3. Sector Analysis: Position in Industry, Price Trends, Competition, Suppliers, Labor Situation, Transport and Marketing Issues, Importance of Quality and Differentiation 4. Qualitative Factors-Environmental Due Dilligence 5. Financial Simulations: Stress Testing, Breakeven Analysis 6. Risk Rating/Legal Opinion
1. Loan Administration: Set up, Funding Schedule, Entry into Data, Management System 2. Negotiations/ Credit Approval 3. Loan Documentation/Closing

Common Portfolio Credit Risk Management Techniques
Geographic Diversification
Sectoral Diversification Crop Diversification Loan Size Limits Minimal Enterprise Size
Limits Over collateralization Joint Liability Contracts
Graduated Lending Exclusion Lists Linking Savings to
Credit Approval Guarantee Funds Donor Trust Funds Credit Insurance Portfolio Securitization
Survey Methodology
Methodology: Web-based survey instrument with was sent to 226 financial institutions in Latin America. The survey asked about perceived risks in rural lending and in particular agricultural lending; techniques used to manage credit risk; and basic information on the institution (size, age, loan products, interest rates charged, guarantees required, profitability, delinquency, staff profile, etc.)
42 institutions responded.

Table 3: Rural Financial Institutions in LAC by Country
BOLIVIA
BRAZIL
COLUMBIA
COSTA
RICA
ECUADOR
EL SALVADOR
GUATEMALA
HONDURAS
MEXICO
PARAGUAY
PERU
TOTAL
Regulated 1 2 0 0 1 1 0 1 1 1 9 17
Commercial Banks 1 1 2
Non-bank Financial Institution
1 1 1 8 11
Credit Unions 1 1 1 1 4
Nonregulated (NGOs) 7 0 2 2 1 1 3 1 1 0 7 25
Total 8 2 2 2 2 2 3 2 2 1 16 42
Source: IDB Survey to Rural Financial Institutions – 2006.

Survey Results
Ranking of Perceived Risks Political Interference 74% Climatic Risks 71% Price Risk 59% Lack of guarantees 56% Regulatory and Legal 36% Weak Contract Enforcement
36% Operational risk, lack of
information (tied) 33% High cost of funds 31%
Credit Evaluation Techniques Used
Majority use human-based expert system
One used credit scoring Guarantees were not seen as
vital due to scarcity and high cost of enforcement.

Survey Results
Index of Credit Technology constructed consisting of reported use
Financial and Character-based Information
Requirements Decentralized decision-
making Monitoring Guarantees
Sharp differences between regulated and non-regulated
50% of regulated entities require a sales contract versus 11% of non-regulated (requirements)
39% of regulated entities required that client be part of a value chain
Better performing entities monitored more, gathered less but more pertinent information.
Regulated entities had more requirements as per law.

Survey Results Cont.
Keys Policies Used to Reduce Credit Risks Staff Incentives (60% used, bonuses amount to approx.
50% of base salary) Loan size limits (94%) Additional Requirements about a Threshold (91%) Loan Provisioning (88%) Client Repayment Incentives (84%) Use of Credit Bureaus (81%)

Survey Results Cont.
Institutions that had a higher share of agricultural lending had higher PAR>30
There seems to be minimum scale required to obtain strong financial results.

Figure 2: Agricultural Portfolio Share vs. PAR (>30 days) Source: IDB Survey to Rural Financial Institutions – 2006.
0
0.2
0.4
0.6
0.8
1
1.2
0 5 10 15 20 25 30 35
PAR>30 days
Ag
ricu
ltu
ral
Port
foli
o S
hare
(%
)
Diversification Effect

Scale Effect
Mean
Mean
Table 9: Scale Effects – Ranked by Total Portfolio Size
Share of Agricultural Credit (%)
Agricultural Delinquency – PAR>30 days (%)
Total Portfolio
Delinquency -
PAR>30 days (%)
ROA (%) ROE (%)
Quartile 1
0.53 4.11 10.60 1.72 0.08
Median 0.61 2.50 3.50 5.0 7.75
Quartile 4
0.25 4.56 5.87 2.57 14.65
Median 0.25 0.25 5.00 2.00 7.00
Total Portfolio - Correlation Coefficient -0.308* -0.009 -0.152 0.0238 0.295*
Source: IDB Survey to Rural Financial Institutions – 2006.Note: Due to it significant different size, data from BancoCooperativo SICREDI was not included in this calculation.(*) Significant of at least 10 % level ( cut-off corresponds to is 0.296).
* Significant difference of at least 10 % level.

Case Studies
Banrural SA-Guatemala Fundación para el Desarrollo Empresarial y
Agrícola (FUNDEA) Caja Municipal de Ahorro y Crédito (CMAC)
Sullana-Perú Entidad de Desarrollo para la Pequeña y Micro
Empresa (EDPYME) Confianza

General Indicators
Banrural Sullana Confianza FUNDEA
Regulated Yes Yes Yes No
Ownership Mixed Public Private Private
Branches 323 20 10 19
Loans $673.8m $69.5m $21m $6.2m
Clients 195,822 58,301 26,258 12,213
PAR >30 days 0.9% 5.1% 3.5% 0.9%
ROA 2.1% 5.7% 3.7% 12%
ROE 38.7% 38.2% 21.3% 14.8%
Efficiency Ratio 11.4% 11.4% 15.2% 23.5%Source: Trivelli and Tarazona, 2007
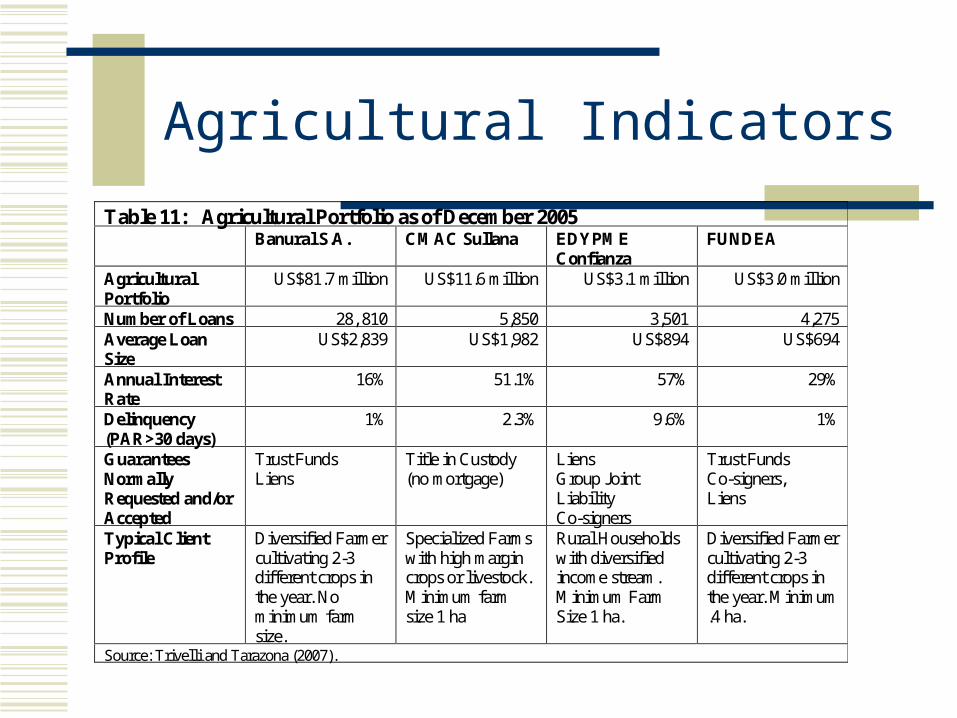
Agricultural Indicators Table 11: Agricultural Portfolio as of December 2005 Banural S.A. CMAC Sullana EDYPME
Confianza FUNDEA
Agricultural Portfolio
US$81.7 million US$11.6 million US$3.1 million US$3.0 million
Number of Loans 28, 810 5,850 3,501 4,275 Average Loan Size
US$2,839 US$1,982 US$894 US$694
Annual Interest Rate
16% 51.1% 57% 29%
Delinquency (PAR>30 days)
1% 2.3% 9.6% 1%
Guarantees Normally Requested and/or Accepted
Trust Funds Liens
Title in Custody (no mortgage)
Liens Group Joint Liability Co-signers
Trust Funds Co-signers, Liens
Typical Client Profile
Diversified Farmer cultivating 2-3 different crops in the year. No minimum farm size.
Specialized Farms with high margin crops or livestock. Minimum farm size 1 ha
Rural Households with diversified income stream. Minimum Farm Size 1 ha.
Diversified Farmer cultivating 2-3 different crops in the year. Minimum .4 ha.
Source: Trivelli and Tarazona (2007).

Key Elements in Credit Technology and Risk Management
Specialized staff Staff incentives Information gathered on
character, managerial ability, reputation for repayment, and financial viability
Cash flow and sensitivity analysis
Client repayment incentives Preference for households with
diversified income streams Regular monitoring
Diversification Geographic Sectoral Commodity
Portfolio exposure limit for agriculture (20-45%)
Limits financing for or refusing to finance basic grains.
Excessive provisioning (121% -260%)
Technology Risk Management

Conclusions and Recommendations
Leading institutions are using information-intensive appraisal systems and rely on well-prepared and motivated staff. Real guarantees are not important.
Repayment incentives are commonplace. RFIs seek to build long term relationships.
Diversification, portfolio limits, and provisioning are principal means of managing agricultural credit risk
Transfer instruments (guarantee funds, insurance, securitization etc.) not widely used or available.

Continued
Some minimal economies of scale seem to be necessary in absence of more modern risk transfer instruments. Implications Smaller institutions with rural vocation have to grow
rapidly, emphasizing non-farm lending. Mergers of small rural institutions should be encouraged. Donors and policymakers should target larger institutions to
provide rural financial services. Will be difficult entice urban institutions due to high perceived risks, lack of robust risk mgmt. instruments, lack of appropriately trained staff, and and more attractive risk-return profile of the consumer lending market.

Continued
Agricultural microfinance has expanded the frontier but is limited.
Longer term options needed and desired. Interest rates are very high probably surpassing average rates for
more agricultural activities. Specialized and more commercially–oriented small and medium sized
agricultural producers seem to be disadvantaged due to lender preference for diversified households. However, they could benefit if the lender adopts a value chain approach.
Need to introduce more project-centered, yet economical, types of loan appraisal appropriate for larger sized agricultural loans.
Urgently need to introduce more robust and modern risk management instruments combined with delivery systems that lower operational costs.