76244679 manual soil resistivity wenner method
TRANSCRIPT

8/20/2019 76244679 Manual Soil Resistivity Wenner Method
http://slidepdf.com/reader/full/76244679-manual-soil-resistivity-wenner-method 1/14
Version: 2 Date of Issue: December 2006
Author: Nigel Johnson Job Title: Earthing Specialist
Approver: Patrick Booth Job Title: Asset Manager
Earthing Manual
Section E3
Soil Resistivity Measurements
8/20/2019 76244679 Manual Soil Resistivity Wenner Method
http://slidepdf.com/reader/full/76244679-manual-soil-resistivity-wenner-method 2/14
Eathing Manual
Section E3 Soil Resistivity Measurements
Version: 2 Date of Issue: December 2006 Page 2 of 14
The master version of the this document resides in the E.ON UK Documentum database
CAUTION – any other copy may be out of date
© Central Networks plc
Revision Log
Version: 2.0 Prepared by: Nigel Johnson Date: December 2006
Re-branded to E.ON Central Networks.
Version: 1.0 Prepared by: Nigel Johnson Date: April 2006
New document issued.

8/20/2019 76244679 Manual Soil Resistivity Wenner Method
http://slidepdf.com/reader/full/76244679-manual-soil-resistivity-wenner-method 3/14
Eathing Manual
Section E3 Soil Resistivity Measurements
Version: 2 Date of Issue: December 2006 Page 3 of 14
The master version of the this document resides in the E.ON UK Documentum database
CAUTION – any other copy may be out of date
© Central Networks plc
CONTENTS
E3.0 INTRODUCTION 4
E3.1 Wenner Method for Measuring Soil Resistivity at Primary/Grid sites 5 E3.1.1 Instruments 5 E3.1.2 Checks for other buried equipment 5 E3.1.3 Wenner Test Method 6 E3.1.4 Probes in areas of tarmac or concrete 8 E3.1.5 Problems with depth of probes 8 E3.1.6 Fluctuating results 8
E3.2 “One Rod Method” for Measuring Soil Resistivity at Distribution Sites 9
E3.3 Estimation of Soil Resistivity using Geological Survey Data 10
APPENDIX AE3.1 – CHART FOR “ONE ROD METHOD” RESISTIVITY TEST 12
APPENDIX AE3.2 – CHART FOR WENNER TEST 13
Appendix AE3.3 - Wenner Soil Resistivity Field Sheet 14

8/20/2019 76244679 Manual Soil Resistivity Wenner Method
http://slidepdf.com/reader/full/76244679-manual-soil-resistivity-wenner-method 4/14
Eathing Manual
Section E3 Soil Resistivity Measurements
Version: 2 Date of Issue: December 2006 Page 4 of 14
The master version of the this document resides in the E.ON UK Documentum database
CAUTION – any other copy may be out of date
© Central Networks plc
E3.0 Introduction
The resistance to the earth of any earth electrode is
influenced by the resistivity of the surrounding soil. This will
depend to a large extent on the nature of the soil and it’s
moisture content. Resistivity may change with depth,
temperature, moisture content and can vary from place to
place depending on the strata of the soil and rock
formation. The soil resistivity figure will have a direct impact
on the overall substation resistance and how much
electrode is required to achieve the desired values. It will
also influence separation distances between two adjacent
earth systems (e.g. HV and LV earths at Hot distribution
sites). The lower the resistivity, the less electrode is
required to achieve the desired earth resistance value. It is
an advantage to know the resistivity value at the planningstage as this gives a good indication of how much electrode
is likely to be required. This section describes the different methods that can be used to determine
the soil resistivity.
The resistivity of any material is defined as the electrical resistance measured between the
opposite faces of a uniform 1m3 cube (See Fig E3.1). The accepted symbol is ‘ ρ’ and is measured in
ohm-meters (Ωm). Typically soils can vary from a few ohm-meters for very wet loams up to
thousands of ohm-meters for granite. Table E3.2 shows the values expected for a range of soil
types together with examples of the likely resistance values for two types of electrode. In practice
soil is very rarely homogenous and so the values indicted should be taken as a rough guide only.
The Wenner (four terminal) test is the Company approved method for determining soil resistivity at
Primary/Grid sites (see Section E3.1). The soil resistivity data can influence the chosen site location
as well as the decision on the best type of earthing electrode system to be installed. For example,
it helps to decide if it’s an advantage to drive rods to a greater depth or whether to increase the
surface area by installing more buried tape. The survey can produce considerable savings in
electrode and installation costs when trying to achieve the required resistance.
If the results gained from the soil resistivity survey are unclear then soil modeling can be
undertaken. With up-to-date techniques a fairly good and accurate soil model can be produced.
Also core drilling usually associated with a Geo-Technical survey will give an accurate soil modeland can be used to check measured soil resistivity results.
Soil resistivity is also important in determining the separation distances between the HV and LV
electrodes at Hot distribution substations. A Wenner test could be used but a simpler procedure
has been developed for use at these sites. This is known as the ‘one’ or ‘driven rod method’ and
gives an average value of soil resistivity (see Section E3.2).
Once an electrode system is installed then the actual resistance value must be measured and
recorded. If this falls short of the design value then additional electrodes will be required to rectify
the problem.
Figure E3.1 Soil Resistivity
1m cube

8/20/2019 76244679 Manual Soil Resistivity Wenner Method
http://slidepdf.com/reader/full/76244679-manual-soil-resistivity-wenner-method 5/14
Eathing Manual
Section E3 Soil Resistivity Measurements
Version: 2 Date of Issue: December 2006 Page 5 of 14
The master version of the this document resides in the E.ON UK Documentum database
CAUTION – any other copy may be out of date
© Central Networks plc
E3.1 Wenner Method for Measuring Soil Resistivity at Primary/Grid sites
E3.1.1 Instruments
A four-terminal earth tester is required (see Table E4.1), equipped with four probes and connecting
leads. The latter shall be mounted on reels for easy run-out and recovery and shall be checked for
continuity and condition prior to use. The calibration of the instrument shall be checked before
taking any readings, using the test resistors supplied with the instrument. Provision shall also be
made for a laboratory re-calibration check of the instrument every year.
E3.1.2 Checks for other buried equipment
Before carrying out any testing, checks shall be made from other utility records, our own cable
records and using radio detection equipment, for the presence of any buried cables, earth
conductors or other metalwork. These could adversely affect the accuracy of the readings taken,
particularly if they are parallel to the measurement route. Conventional metal detectors will only
locate very large pipelines or objects close to the surface, so cannot be relied upon. Location
equipment should be used in the inductive mode (to locate pipes which are not connected to theearthing system), and direct mode (to locate any pipes or cables bonded to the earth grid). For the
latter, the transmitter is connected to the earthing system at the substation.
The routes chosen should preferably be free of long buried metal pipes or lead sheathed cables
etc., but if this is not possible the measurement route should be positioned at right angles to these
items wherever possible. The route chosen should not be close and parallel to an overhead line. If
the line supports are earthed, then this will adversely affect the readings. If the soil resistivity
measurement leads are long and in parallel with an overhead line, then an induced voltage may
occur in the leads should fault current flow through the overhead line. To avoid this, measurement
routes should preferably be at right angles to overhead lines. If they must be in parallel, then a
separation of 20m or more from the line is required.

8/20/2019 76244679 Manual Soil Resistivity Wenner Method
http://slidepdf.com/reader/full/76244679-manual-soil-resistivity-wenner-method 6/14
Eathing Manual
Section E3 Soil Resistivity Measurements
Version: 2 Date of Issue: December 2006 Page 6 of 14
The master version of the this document resides in the E.ON UK Documentum database
CAUTION – any other copy may be out of date
© Central Networks plc
E3.1.3 Wenner Test Method
Fig. E3.2 shows the general measurement setup. The four earth probes should be driven into the
ground in a straight line, at a distance ‘a’ metres apart and driven to a depth of ‘P’ cm.
The maximum depth of the probe should not exceed 20cm nor exceed 1/20 th of the probe spacing
distance ‘a’. A series of resistance readings are taken for various spacings of the probes. For large
sites the maximum spacings are increased to enable the soil resistivity to be assessed at a greater
depth. Table 3.1 shows the required spacings for various sites.
Table E3.1 Recommended probe spacing/depths for soil resistivity tests
Spacing & Probe Depths Minimum recommended range of spacings for
different substation types
Probe
Spacing
‘a’
(m)
Soil
Resistivity
Depth ‘d’
(3/4 of ‘a’)
(m)
Dist. X to
Voltage
Probe
(m)
Dist. Y to
Current
Probe
(m)
Max.
Probe
depth
‘P’
(cm)
Wood Pole
Locations
11kV GM Dist.
S/S
Small
66/33 to
11kV S/S
Towers,
132kV S/S &
large sites
1 0.75 0.5 1.5 5
2 1.5 1 3 5
3 2.25 1.5 4.5 10
5 3.75 2.5 7.5 10
10 7.5 5 15 15
15 11.25 7.5 22.5 15
20 15 10 30 20
25 18.75 12.5 37.5 20
30 22.5 15 45 20
40 30 20 60 20
50 37.5 25 75 20
C1 ‘a’ P1 ‘a’ P2 ‘a’ C2
Depth ‘P’ of
test robes
‘x’
‘y’
Fig E3.2 Arrangement for the Wenner Test
Make sure any links areremoved between the
terminals on the tester
8/20/2019 76244679 Manual Soil Resistivity Wenner Method
http://slidepdf.com/reader/full/76244679-manual-soil-resistivity-wenner-method 7/14
Eathing Manual
Section E3 Soil Resistivity Measurements
Version: 2 Date of Issue: December 2006 Page 7 of 14
The master version of the this document resides in the E.ON UK Documentum database
CAUTION – any other copy may be out of date
© Central Networks plc
The four probes should be connected to the tester, with the outer probes connected to the C1 and
C2 terminals, and the inner probes to the P1 and P2 terminals. The instrument should be kept in a
central position and a series of resistance measurements made as the four electrodes are moved
out in equal distances from the central point. A calculation is made to determine the average soil
resistivity of all layers of soil between the surface and a depth ‘d’ which is taken to be ¾ of the
separation distance ‘a’. The meter should be left on to allow the built in filters to operate and the
value after 30 seconds should be taken. If the reading is varying significantly, this may be due to :-
• Electrical interference
• High contact resistance at the test probes
• Damaged test leads
• Reading at the lower limit of the instrument’s measuring capability
If, after investigating the above, the reading is still changing by more than 5%, then record a series
of ten consecutive readings over an interval of few minutes, calculate the average and then
proceed with the rest of the measurements.
The apparent soil resistivity is then given by ρ=2πaR (Ωm) where:-
ρ = ground resistivity in Ωm
π = 3.142
a = electrode spacing in metres
R = measured resistance in Ω at spacing 'a'
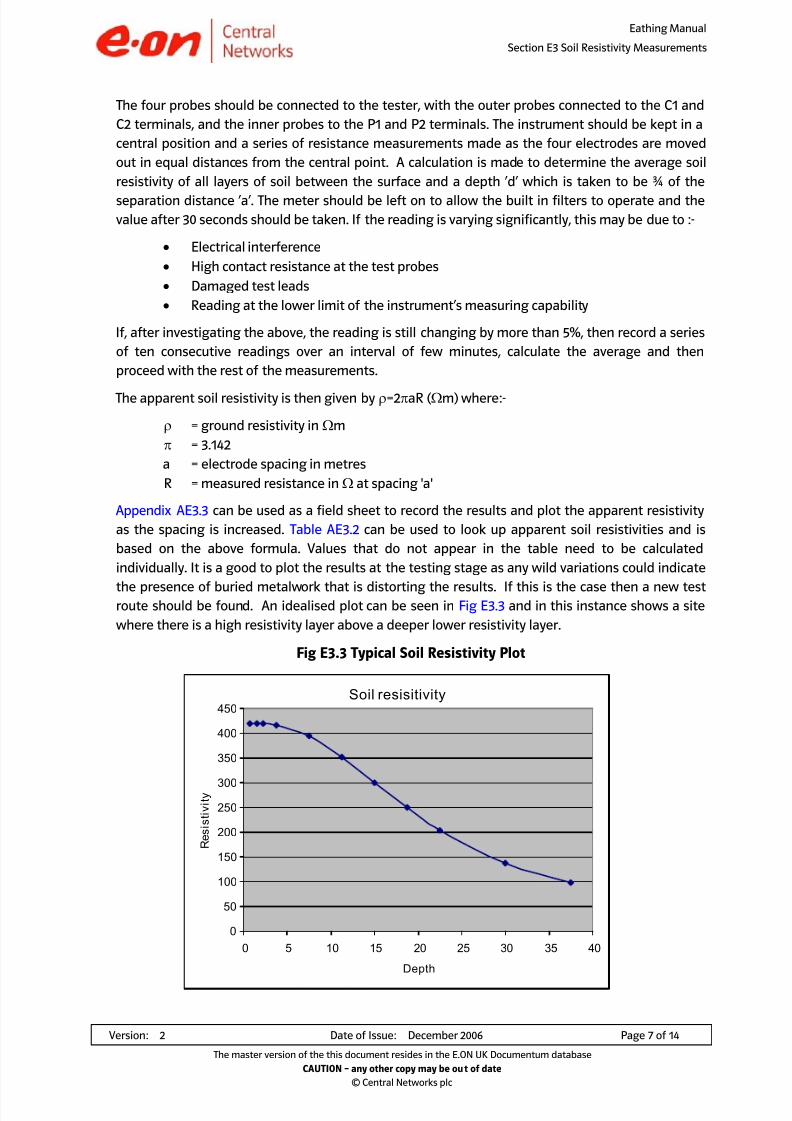
Appendix AE3.3 can be used as a field sheet to record the results and plot the apparent resistivity
as the spacing is increased. Table AE3.2 can be used to look up apparent soil resistivities and is
based on the above formula. Values that do not appear in the table need to be calculated
individually. It is a good to plot the results at the testing stage as any wild variations could indicate
the presence of buried metalwork that is distorting the results. If this is the case then a new testroute should be found. An idealised plot can be seen in Fig E3.3 and in this instance shows a site
where there is a high resistivity layer above a deeper lower resistivity layer.
Fig E3.3 Typical Soil Resistivity Plot
Soil resisitivity
0
50
100
150
200
250
300
350
400
450
0 5 10 15 20 25 30 35 40
Depth
R e s i s t i v i t y

8/20/2019 76244679 Manual Soil Resistivity Wenner Method
http://slidepdf.com/reader/full/76244679-manual-soil-resistivity-wenner-method 8/14
Eathing Manual
Section E3 Soil Resistivity Measurements
Version: 2 Date of Issue: December 2006 Page 8 of 14
The master version of the this document resides in the E.ON UK Documentum database
CAUTION – any other copy may be out of date
© Central Networks plc
At least two or three series of measurements, via routes perpendicular to one another should be
taken, to allow interference and small local variation effects to be balanced out. If any readings
were unstable, then additional routes will be necessary, possibly further away from the site. Note
that it is important to ensure that measurements are symmetrical about point X midway between
the voltage probes. An Excel spreadsheet “ Soil Resistivity Tests.xls” has been developed to help
interpret the results.
E3.1.4 Probes in areas of tarmac or concrete
In some cases, the required position for one of the inner ‘voltage’ probes may coincide with an area
covered with tarmac or concrete. Measurements can usually still be obtained by using a flat metal
plate, of approximately 10 to 15cm square, placed on a cloth soaked with saline water, instead of
the driven probe. A small weight on top of the plate will help to decrease contact resistance. The
usual precautions concerning buried metal structures apply and the area where the plate is used
should not contain reinforced steel which runs in the same direction as the measurement route, or
the reading will be adversely affected.
E3.1.5 Problems with depth of probes
Despite suggestions to the contrary in many manufacturers publications, the test probe’s depth
(‘P’) need normally only need be inserted to a depth in the range of 5 to 20cm, as shown in Table
E3.2. The outer (current) probes are required to have a reasonably low resistance to earth, sufficient
to allow approximately 50mA to flow. However, if the surface soil is dry or frozen, the high contact
resistance with the probe will restrict the flow of test current. To overcome this it is recommended
that a short steel rod having a smaller radius than the test probe is driven into the soil to a depth
of 20cm and removed. A weak solution of preferably warm, saline water is poured into the hole and
the test probe re-inserted. If this does not provide a satisfactory reading, the probe may be driven
in a little deeper. A better arrangement is a cluster of three to five probes positioned 25cm apart
and connected together. Probe clusters are normally only required at long test spacings and would
introduce an error if used at small spacings. It is very unusual to require probe depths of more than
30cm and precautions will be required to ensure that third party equipment or cables are not
damaged if probes are driven to more than 20cm depth. Their installed depth should never exceed
1/20th of ‘a’.
E3.1.6 Fluctuating results
If there are large fluctuations in the measured values at one particular spacing, then it is likely that
interference from buried cables/pipes or stray ground currents are present. Additional sets of
readings must be taken at locations a few metres away. Having first discounted readings which areobviously incorrect, then the average resistivity value for each probe separation ‘a’ is used to
generate the soil model. It is important to note that measurements near the site will often be
subject to interference from buried structures which will result in lower apparent readings than in
undisturbed soil. This is why readings cannot be taken using this method within the area of an
existing substation.
Software programs are available for carrying out detailed calculations, based upon data from the
above readings, to provide a “best-fit”, representative soil model for the area, consisting of a
number of vertical or horizontal layers having different resistivity values.

8/20/2019 76244679 Manual Soil Resistivity Wenner Method
http://slidepdf.com/reader/full/76244679-manual-soil-resistivity-wenner-method 9/14
Eathing Manual
Section E3 Soil Resistivity Measurements
Version: 2 Date of Issue: December 2006 Page 9 of 14
The master version of the this document resides in the E.ON UK Documentum database
CAUTION – any other copy may be out of date
© Central Networks plc
⎟⎟ ⎠
⎞⎜⎜⎝
⎛ −⎟
⎠
⎞⎜⎝
⎛ = 18
ln2 d
L
L R
π
ρ
⎟⎟ ⎠
⎞⎜⎜⎝
⎛ −⎟
⎠
⎞⎜⎝
⎛ =
18
ln
2
d
L
LRπ ρ
E3.2 “One Rod Method” for Measuring Soil Resistivity at Distribution Sites
At Hot distribution substations it is necessary to segregate the HV and LV earths in accordance
with sections E5.10.2 and E5.10.3. In order to do this the average soil resistivity value is required.
This is a simpler test than the full Wenner test described above. The test is based on measuring the
resistance of a single rod that is driven into the ground for a known depth. The resistance
measurement and rod dimensions are then used to calculate the average soil resistivity required to
produce the measured resistance. The resistance measurement can be made by using the 61.8%
method described in Section E4.0.3.5. Using the formula for calculating the resistance (R) of a rod in
uniform soil,
gives
Where ‘L’ is the length and ‘d’ is the diameter of the rod, both in metres.
The apparent resistivity to match the measured resistance is calculated or looked up from the table
in Appendix AE3.1. For most distribution substations it is sufficient to drive the rod to a depth of
2.4m and use this reading as the average soil resistivity value. In difficult locations a 1.2m rod is
acceptable but if it even this proves difficult to drive in, then it’s an early indication that there may
be a high resistivity rock layer just be below the surface which could give problems achieving the
desired electrode value. Once the average soil resistivity is known a separation distance between
the HV and LV can be determined. It is a good idea to position the test rod so that it can be
incorporated into the final earthing arrangement. Fig E3.4 shows the general arrangement for this
test.
A further technique would be to take a series of measurements as the rod is driven into the ground
at greater and greater depths. When the results are plotted out they could be useful in the
following situations:-
0.5m
deep
hole
5/8” dia
2.4m
(or 1.2m)
rod
Fig E3.4 General Arrangement for “One Rod Method” at Distribution Sites
Procedure:-
Measure rod resistance using 61.8% test (see Section E4.0.3.5)then use table in Appendix AE3.1 to look up soil resistivity value
or
to obtain soil resistivity value, multiply resistance reading by
2.45 for a 2.4m rod
or 1.39 for a 1.2m rod
P2 C2
31m 50m

8/20/2019 76244679 Manual Soil Resistivity Wenner Method
http://slidepdf.com/reader/full/76244679-manual-soil-resistivity-wenner-method 10/14
Eathing Manual
Section E3 Soil Resistivity Measurements
Version: 2 Date of Issue: December 2006 Page 10 of 14
The master version of the this document resides in the E.ON UK Documentum database
CAUTION – any other copy may be out of date
© Central Networks plc
(i) to accurately locate the water table or low resistivity soil layers. The rod resistance will
be seen to drop dramatically once this level is reached, assuming the surface material
has a higher resistivity. This could influence the decision on whether to install deep
drive electrodes or to install a horizontal electrode system.
(ii)
at primary and grid sites where readings using the Wenner method are not possiblenear to the substation. Rods may be driven into the ground even within the substation
(once the area is proven free of buried cables/equipment). The results obtained are then
used to verify or modify the soil model obtained via Wenner measurements at suitable
locations outside the substation. On completion of the test the rod could be
incorporated into the main earth grid if appropriate.
The earth resistance of a rod will usually reduce as its driven depth is increased. The resistance of a
rod should never increase with driven depth. It is the rate at which the resistance decreases with
depth that allows the soil structure and layer resistivities to be determined. Soil structure where
the deeper layer has a lower resistivity than the upper, will produce sudden changes in the
gradient of the rod’s resistance curve. Where the top layer has a lower resistivity than the lowerlayers then the structure is more difficult determine, as the test current will tend to continue to
flow in the top, lower resistivity layer. The resulting low current density in the higher resistivity
layer has little influence on the measured resistance of the rod. Where a very high resistivity
stratum is penetrated, the rod resistance may remain virtually constant with increasing depth. If a
further lower resistivity layer is penetrated beneath this, then the rod resistance will again begin to
decrease with increasing depth.
The technique does suffer from the fact that the rod resistance is determined by conditions close
to it and there is often a wide variation between rod resistances (of the same length) obtained at
different positions around a site.
E3.3 Estimation of Soil Resistivity using Geological Survey Data
Whilst less accurate than direct measurement, geological data can given a reasonable indication as
to the resistivity of the ground in a particular area.
You may also find it useful to build up a data base of resistivity measurements from actual jobs. By
using these two sources of information you can determine how much electrode to install at most
job locations without the need for a preliminary survey.
Of course – you MUST MEASURE the actual resistances of the earth system after installation to
confirm your predictions.
In the short term the geological data can be obtained from the one inch series ‘Solid and Drift’
edition geological survey maps published by:
British Geological Survey, Keyworth, Nottingham, NG12 5GG. Tel. 0115 9363100
These maps are colour coded to show different underlying geological types and surface deposits
such as clay and head. The following table gives typical resistivity ranges for a number of different
ground types.
This method shall not be used in isolation where extensive earth installations are going to be
installed such as at primary and bulk supply point substations. Accurate soil resistivity
measurements and soil modelling techniques are essential to the proper design process.

8/20/2019 76244679 Manual Soil Resistivity Wenner Method
http://slidepdf.com/reader/full/76244679-manual-soil-resistivity-wenner-method 11/14
Eathing Manual
Section E3 Soil Resistivity Measurements
Version: 2 Date of Issue: December 2006 Page 11 of 14
The master version of the this document resides in the E.ON UK Documentum database
CAUTION – any other copy may be out of date
© Central Networks plc
However, geological information can be useful when short-listing possible sites. It may help you to
choose a site with low earth resistivity instead of a site with high resistivity. Intelligent site
selection can considerably reduce the cost of earthing and also remove/reduce the implications of
creating a “Hot Zone”.
Where the maps indicate very high soil resistivities such as limestone, granite, gritstone etc. it isrecommended that a soil resistivity test is carried out as the cost to install the earth electrode
could be a significant proportion of the cost of the overall job.
Table E3.2 - Typical soil resistivity values and likely electrode resistances
Soil/Ground Type Typical
Resistivity
( m)
For homogenous soil
likely resistance of a
2.4m rod (
)
For homogenous soil
likely resistance of 50m
of a 70mm2
earthwire(
)
Mercia Mudstone 20 8 0.8
Coal Measures 20 8 0.8
Loam 25 10 0.9
Alluvium 35 14 1.3
Boulder Clay 50 20 1.9
Keuper Marl & Waterstones 50 20 1.9
Head 70 28 2.6
Sand/Gravel 300 120 11
Limestone 300 120 11
Pebble Beds 300 120 11
Permian Limestone & Marl 400 160 15
Gritstone 1000 400 38

8/20/2019 76244679 Manual Soil Resistivity Wenner Method
http://slidepdf.com/reader/full/76244679-manual-soil-resistivity-wenner-method 12/14
Eathing Manual
Section E3 Soil Resistivity Measurements
Version: 2 Date of Issue: December 2006 Page 12 of 14
The master version of the this document resides in the E.ON UK Documentum database
CAUTION – any other copy may be out of date
© Central Networks plc
Appendix AE3.1 – Chart for “One Rod Method” Resistivity TestTable to calculate soil resistivity using single rod technique described in Section E3.2 (assuming 5/8” dia. rod).
Example: - 4.8m rod with resistance of 20 Ω gives average soil resistivity of 89 Ωm
Length of
rod
Resistance (Ω)
1.2m 2.4m 3.6m 4.8m 6mLength of
rod
esistance (Ω)
1.2m 2.4m 3.6m 4.8m 6m
1 1 2 3 4 5 56 78 138 195 249 301
2 3 5 7 9 11 57 80 141 198 253 306
3 4 7 10 13 16 58 81 143 202 258 312
4 6 10 14 18 21 59 82 146 205 262 317
5 7 12 17 22 27 60 84 148 209 266 322
6 8 15 21 27 32 62 86 153 216 275 333
7 10 17 24 31 38 64 89 158 223 284 344
8 11 20 28 36 43 66 92 163 230 293 355
9 13 22 31 40 48 68 95 168 237 302 365
10 14 25 35 44 54 70 98 173 243 311 376
11 15 27 38 49 59 72 100 178 250 320 387
12 17 30 42 53 64 74 103 183 257 329 398
13 18 32 45 58 70 76 106 188 264 338 408
14 20 35 49 62 75 78 109 193 271 346 419
15 21 37 52 67 81 80 112 198 278 355 430
16 22 40 56 71 86 82 114 203 285 364 441
17 24 42 59 75 91 84 117 208 292 373 451
18 25 45 63 80 97 86 120 213 299 382 462
19 27 47 66 84 102 88 123 218 306 391 473
20 28 49 70 89 107 90 126 223 313 400 484
21 29 52 73 93 113 92 128 228 320 409 494
22 31 54 77 98 118 94 131 232 327 417 505
23 32 57 80 102 124 96 134 237 334 426 516
24 33 59 83 107 129 98 137 242 341 435 527
25 35 62 87 111 134 100 140 247 348 444 537
26 36 64 90 115 140 102 142 252 355 453 548
27 38 67 94 120 145 104 145 257 362 462 559
28 39 69 97 124 150 106 148 262 369 471 570
29 40 72 101 129 156 108 151 267 376 480 580
30 42 74 104 133 161 110 153 272 383 489 591
31 43 77 108 138 167 112 156 277 390 497 602
32 45 79 111 142 172 114 159 282 397 506 613
33 46 82 115 147 177 116 162 287 403 515 623
34 47 84 118 151 183 118 165 292 410 524 634
35 49 87 122 155 188 120 167 297 417 533 645
36 50 89 125 160 193 125 174 309 435 555 672
37 52 91 129 164 199 130 181 321 452 577 699
38 53 94 132 169 204 135 188 334 470 600 726
39 54 96 136 173 210 140 195 346 487 622 752
40 56 99 139 178 215 145 202 359 504 644 779
41 57 101 143 182 220 150 209 371 522 666 806
42 59 104 146 187 226 155 216 383 539 688 833
43 60 106 150 191 231 160 223 396 556 711 860
44 61 109 153 195 236 165 230 408 574 733 887
45 63 111 157 200 242 170 237 420 591 755 914
46 64 114 160 204 247 175 244 433 609 777 941
47 66 116 163 209 253 180 251 445 626 799 967
48 67 119 167 213 258 185 258 457 643 822 994
49 68 121 170 218 263 190 265 470 661 844 1021
50 70 124 174 222 269 195 272 482 678 866 1048
51 71 126 177 226 274 200 279 495 696 888 1075
52 73 129 181 231 279 205 286 507 713 910 1102
53 74 131 184 235 285 210 293 519 730 933 1129
54 75 134 188 240 290 215 300 532 748 955 1156
55 77 136 191 244 296 220 307 544 765 977 1182

8/20/2019 76244679 Manual Soil Resistivity Wenner Method
http://slidepdf.com/reader/full/76244679-manual-soil-resistivity-wenner-method 13/14
Eathing Manual
Section E3 Soil Resistivity Measurements
Version: 2 Date of Issue: December 2006 Page 13 of 14
The master version of the this document resides in the E.ON UK Documentum database
CAUTION – any other copy may be out of date
© Central Networks plc
Appendix AE3.2 – Chart for Wenner Test
This table is to assist in determining soil resistivity using the Wenner technique in section E3.1 and is
based on the formula ρ= 2 π a R. Values that fall outside this chart should be calculated individually.
Example: -‘a’ spacing of 2m, with a resistance reading of 1 Ω gives a soil resistivity value of 13 Ωm
Rod Spacing ‘a’
Measured
Resistance ( )
1m 2m 3m 5m 10m 15m 20m 25m 30m 40m 50m
0.1 1 1 2 3 6 9 13 16 19 25 31
0.2 1 3 4 6 13 19 25 31 38 50 63
0.3 2 4 6 9 19 28 38 47 57 75 94
0.4 3 5 8 13 25 38 50 63 75 101 126
0.5 3 6 9 16 31 47 63 79 94 126 157
0.6 4 8 11 19 38 57 75 94 113 151 188
0.7 4 9 13 22 44 66 88 110 132 176 220
0.8 5 10 15 25 50 75 101 126 151 201 251
0.96 11 17 28 57 85 113 141 170 226 283
1 6 13 19 31 63 94 126 157 188 251 314
2 13 25 38 63 126 188 251 314 377 503 628
3 19 38 57 94 188 283 377 471 565 754 942
4 25 50 75 126 251 377 503 628 754 1005 1257
5 31 63 94 157 314 471 628 785 942 1257 1571
6 38 75 113 188 377 565 754 942 1131 1508 1885
7 44 88 132 220 440 660 880 1100 1319 1759
8 50 101 151 251 503 754 1005 1257 1508
9 57 113 170 283 565 848 1131 1414 1696
10 63 126 188 314 628 942 1257 1571 1885
11 69 138 207 346 691 1037 1382 1728
12 75 151 226 377 754 1131 1508 1885 13 82 163 245 408 817 1225 1634
14 88 176 264 440 880 1319 175915 94 188 283 471 942 1414 1885
16 101 201 302 503 1005 1508
17 107 214 320 534 1068 1602
18 113 226 339 565 1131 1696
19 119 239 358 597 1194 1791
20 126 251 377 628 1257 1885
25 157 314 471 785 1571
30 188 377 565 942 1885
35 220 440 660 1100
40 251 503 754 1257
45 283 565 848 1414
50 314 628 942 1571
55346 691 1037 1728
60 377 754 1131 1885
65 408 817 1225
70 440 880 1319
75 471 942 1414
80 503 1005 1508
85 534 1068 1602
90 565 1131 1696
95 597 1194 1791
100 628 1257 1885
150 942 1885
200 1257
300 1885

8/20/2019 76244679 Manual Soil Resistivity Wenner Method
http://slidepdf.com/reader/full/76244679-manual-soil-resistivity-wenner-method 14/14
Eathing Manual
Section E3 Soil Resistivity Measurements
Version: 2 Date of Issue: December 2006 Page 14 of 14
The master version of the this document resides in the E.ON UK Documentum database
CAUTION – any other copy may be out of date
Appendix AE3.3 - Wenner Soil Resistivity Field Sheet
Spacing 'a'
of
electrodes
(m)
Distance
"x" to
potential
probes (m)
Distance
"y" to
current
probes(m)
Max.
Depth ‘P’
of probes
(cm)
Resistance
reading from
Instrument R
(Ω)
Soil
Resistivity
Depth 'd' (m)
(3/4 of 'a')
Average soil
resistivity ‘ ρ
’ to
depth 'd' (Ωm)
(see note below)1 0.5 1.5 5 0.75
2 1 3 10 1.5
3 1.5 4.5 15 2.25
5 2.5 7.5 20 3.75
10 5 15 20 7.5
15 7.5 22.5 20 11.25
20 10 30 20 15
25 12.5 37.5 20 18.75
30 15 45 20 22.5
40 20 60 20 3050 25 75 20 37.5
Note: -Average Soil resistivity (ρ
) is based on the formula: -ρ
=2 a R (where = 3.142)
C1 ‘a’ P1 ‘a’ P2 ‘a’ C2
Depth ‘P’ of
test probes
‘x’
‘y’
Make sure any links are
removed between the
terminals on the tester