managing carbon in wisconsin soils - soils.wisc.edu · consists of ….. – – plant and animal...
TRANSCRIPT
Managing Carbon in Wisconsin Managing Carbon in Wisconsin SoilsSoils
Dick WolkowskiDick WolkowskiExtension Soil ScientistExtension Soil ScientistUWUW--MadisonMadison
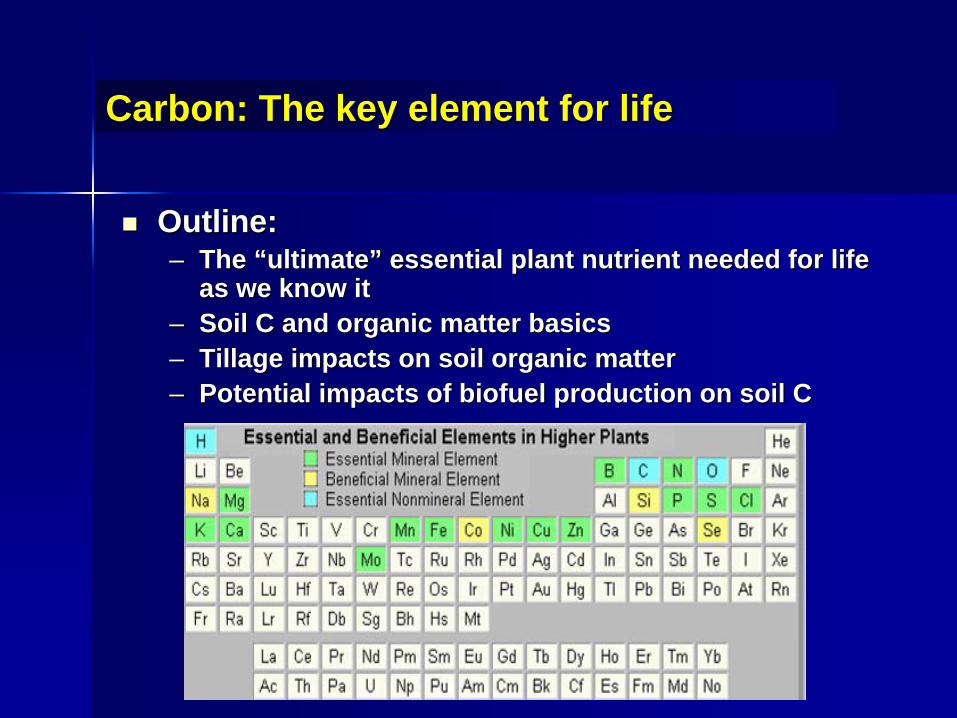
Carbon: The key element for lifeCarbon: The key element for life
Outline:Outline:–– The “ultimate” essential plant nutrient needed for life The “ultimate” essential plant nutrient needed for life
as we know itas we know it–– Soil C and organic matter basicsSoil C and organic matter basics–– Tillage impacts on soil organic matterTillage impacts on soil organic matter–– Potential impacts of biofuel production on soil CPotential impacts of biofuel production on soil C

Carbon: The key element for lifeCarbon: The key element for life
Carbon:Carbon:–– Forms both the hardest and one of the softest Forms both the hardest and one of the softest
minerals on earthminerals on earthDiamond used as an abrasiveDiamond used as an abrasiveGraphite used as a lubricantGraphite used as a lubricant
–– Fourth most abundant element in the universe Fourth most abundant element in the universe (H, He, O)(H, He, O)
–– Bonds to itself in a myriad of configurations to Bonds to itself in a myriad of configurations to form over 10,000,000 different moleculesform over 10,000,000 different molecules
–– Cycled through variety of phasesCycled through variety of phasesSolid (cellulose)Solid (cellulose)Liquid (gasoline)Liquid (gasoline)Gas (carbon dioxide)Gas (carbon dioxide)

Why worry about soil carbon: C is a major Why worry about soil carbon: C is a major component of the soil organic mattercomponent of the soil organic matter
Energy source for microorganismsEnergy source for microorganisms–– Nutrient cyclingNutrient cycling–– Residue decompositionResidue decomposition
Improves aggregationImproves aggregation–– Aeration, drainage, erosion, tilth, etc.Aeration, drainage, erosion, tilth, etc.
Storehouse for nutrientsStorehouse for nutrients–– Included in organic structureIncluded in organic structure–– Held on exchange sitesHeld on exchange sites
C is sequestered in organic matterC is sequestered in organic matterInteracts with environmental contaminantsInteracts with environmental contaminants

What is soil organic matterWhat is soil organic matter
“The fraction of soil composed of anything that once lived”“The fraction of soil composed of anything that once lived”
Consists of …..Consists of …..–– Plant and animal remains in various Plant and animal remains in various
stages of decompositionstages of decomposition–– Living soil organismsLiving soil organisms–– Root and microbial exudates/waste Root and microbial exudates/waste
productsproductsNot all the sameNot all the same–– Labile (active)Labile (active)–– Stabile (recalcitrant)Stabile (recalcitrant)Need continuous additions from crop Need continuous additions from crop residue, roots, and amendmentsresidue, roots, and amendments

Labile or biologically activeLabile or biologically active
Living or microbial biomassLiving or microbial biomass– One gram of soil contains:
>100,000,000 bacterial cells>100,000,000 bacterial cells>16,000 species of bacteria>16,000 species of bacteria
MacroMacro--organic matterorganic matterPolysaccharide moleculesPolysaccharide moleculesMostly involved in decomposition; Mostly involved in decomposition; energy and nutrient cyclingenergy and nutrient cycling
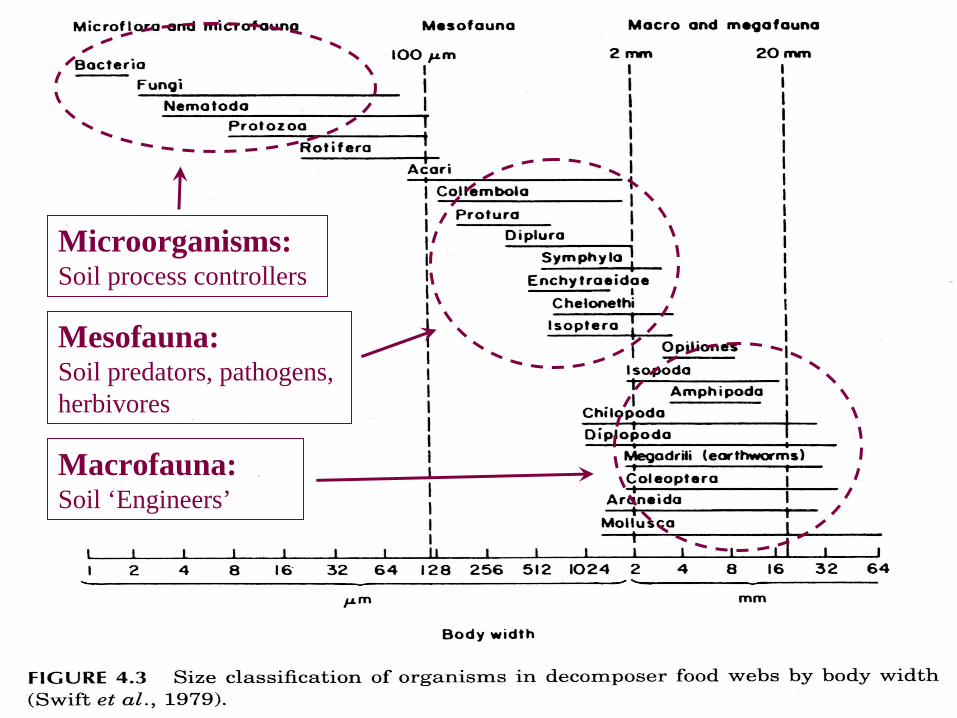
Macrofauna: Soil ‘Engineers’
Mesofauna: Soil predators, pathogens, herbivores
Microorganisms: Soil process controllers
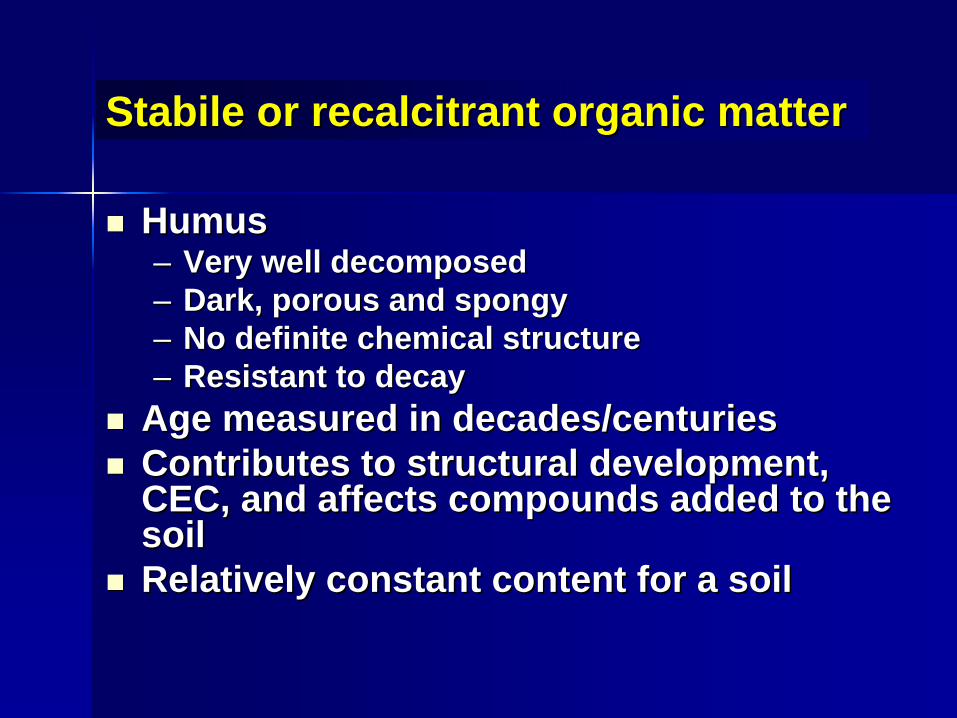
Stabile or recalcitrant organic matterStabile or recalcitrant organic matter
HumusHumus–– Very well decomposedVery well decomposed–– Dark, porous and spongyDark, porous and spongy–– No definite chemical structureNo definite chemical structure–– Resistant to decayResistant to decay
Age measured in decades/centuriesAge measured in decades/centuriesContributes to structural development, Contributes to structural development, CEC, and affects compounds added to the CEC, and affects compounds added to the soil soil Relatively constant content for a soilRelatively constant content for a soil

LongLong--term studies assess N effect on soil term studies assess N effect on soil organic matter management organic matter management (Vanotti et. al., 1997)(Vanotti et. al., 1997)
ArlingtonArlington–– Established 1958Established 1958–– Continuous cornContinuous corn–– History of residue History of residue
burningburning–– Three N ratesThree N rates
NoneNone5050--75 % 75 % 150 %150 %
LancasterLancaster–– Established 1967Established 1967–– Several rotationsSeveral rotations–– Previous alfalfa Previous alfalfa
historyhistory–– Four N ratesFour N rates
0 0 –– 300 through ’77300 through ’770 0 –– 200 since200 since

Arlington LongArlington Long--Term N StudyTerm N Study
REP 3REP 3
REP 1REP 1 REP 2REP 2
REP 4REP 4
LTN 1LTN 1
LTN 1LTN 1LTN 1LTN 1
LTN 1LTN 1LTN 2LTN 2
LTN 2LTN 2LTN 2LTN 2
LTN 2LTN 2LTN 3LTN 3
LTN 3LTN 3LTN 3LTN 3
LTN 3LTN 3

Effect of N fertilization on soil C Effect of N fertilization on soil C accumulation, Arlington, 1958 accumulation, Arlington, 1958 -- 19831983
TreatmentTreatment BiomassBiomass Total CTotal C(above ground)(above ground)
Soil CSoil C
------------ t/a/yr t/a/yr ------------ t/at/a %%
GrainGrain StoverStover
No NNo N 1.71.7 2.62.6 3030 2.02.0
50 50 –– 75 %75 % 3.03.0 3.43.4 4141 2.22.2
150 %150 % 3.13.1 3.63.6 4242 2.22.2
Initial soil C = 1.9 %Initial soil C = 1.9 %


Effect of N fertilization on soil C Effect of N fertilization on soil C accumulation, Lancaster, 1967 accumulation, Lancaster, 1967 -- 19891989
TreatmentTreatment BiomassBiomass Total CTotal C(above ground)(above ground)
Soil CSoil C
lb N/alb N/a ------------ t/a/yr t/a/yr ------------ t/at/a %%
GrainGrain StoverStoverNo NNo N 1.51.5 2.42.4 2525 1.41.450 or 7550 or 75 2.72.7 3.33.3 3434 1.21.2100 or 150100 or 150 3.13.1 3.53.5 3737 1.41.4200 or 300200 or 300 3.33.3 3.73.7 3838 1.31.3
Initial soil C = 1.6 %Initial soil C = 1.6 %

Time
Soil
Org
anic
Mat
ter C
onte
nt
Prod. > Decomp. Prod. > Decomp.Decomp. > Prod.
Native Accumulation Cultivated Agriculture Conservation Adoption
C SequestrationC Loss
Tillage effect on soil organic matterTillage effect on soil organic matter (adapted from Al(adapted from Al--Kaisi and Licht, 2005)Kaisi and Licht, 2005)
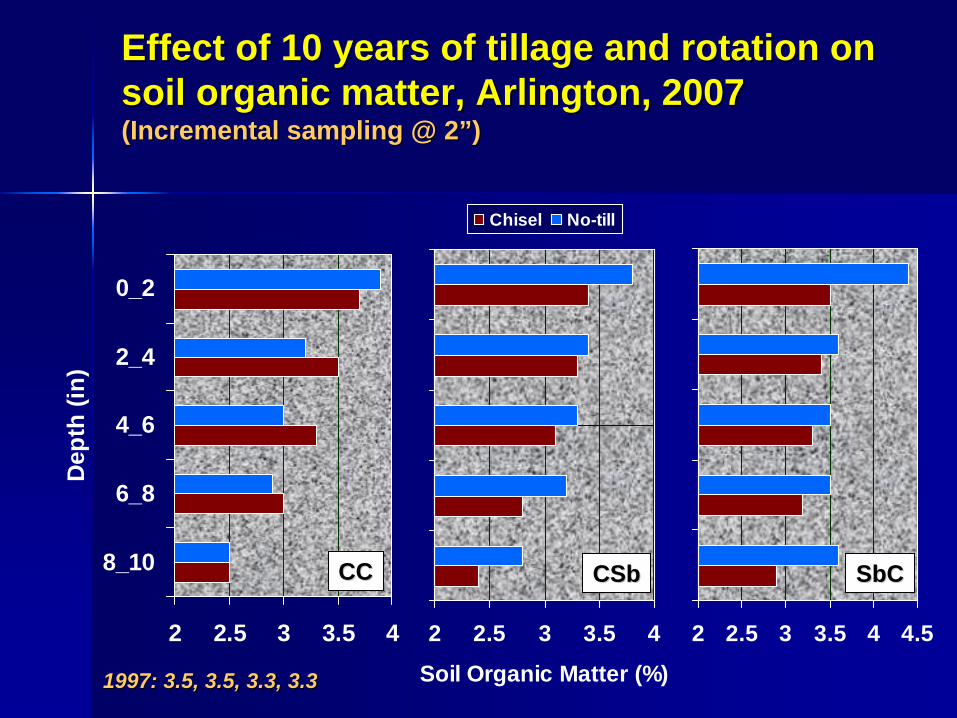
Effect of 10 years of tillage and rotation on Effect of 10 years of tillage and rotation on soil organic matter, Arlington, 2007soil organic matter, Arlington, 2007 (Incremental sampling @ 2”)(Incremental sampling @ 2”)
2 2.5 3 3.5 4
8_10
6_8
4_6
2_4
0_2
Dep
th (i
n)
2 2.5 3 3.5 4
Soil Organic Matter (%)
Chisel No-till
2 2.5 3 3.5 4 4.5
CCCC CSbCSb SbCSbC
1997: 3.5, 3.5, 3.3, 3.31997: 3.5, 3.5, 3.3, 3.3

Effect of 10 years of tillage and rotation on Effect of 10 years of tillage and rotation on soil organic matter, Arlington, 2007soil organic matter, Arlington, 2007 (Averaged over 0 (Averaged over 0 –– 8”)8”)
2 2.5 3 3.5 4
SbC
CSb
CC
Chisel No-till

Moldboard or NoMoldboard or No--tilltillHarvested for silage or grainHarvested for silage or grainField created from forested land in Field created from forested land in 1957 and in continuous corn with the 1957 and in continuous corn with the tillage/harvest systems since 1972 tillage/harvest systems since 1972 Until 1972 C inputs were as C3Until 1972 C inputs were as C3--C; C; whereas corn is a C4whereas corn is a C4--C plantC plantUtilize Utilize 1313C analysis to evaluate cyclingC analysis to evaluate cycling
Effect of tillage and corn management Effect of tillage and corn management on soil C cycling on soil C cycling (Hooker et. al. U(Hooker et. al. U--Conn.)Conn.)

1.5 2 2.5 3 3.5
0_6
2_6
0_2
Dep
th (i
n)
Soil Organic Matter (%)
Moldboard No-till
2 2.5 3 3.5 4 4.5
0_6
2_6
0_2
Soil Organic Matter (%)
Moldboard No-till
GrainGrainSilageSilage
Effect of tillage and corn management on soil C Effect of tillage and corn management on soil C amount over 28 years amount over 28 years ((Hooker et. al. UHooker et. al. U--Conn.)Conn.)

Effect of tillage and corn management Effect of tillage and corn management on soil C partitioning on soil C partitioning ((Hooker et. al. UHooker et. al. U--Conn.)Conn.)
TillageTillage Corn Mgt.Corn Mgt. C4C4--CC C3C3--C HalfC Half--lifelife
%% yearsyearsNTNT GrainGrain 4242 1919
NTNT SilageSilage 3535 1818
MBMB GrainGrain 3232 1515
MBMB SilageSilage 2727 1414
0 0 –– 2 in.2 in.

Effect of tillage and corn management Effect of tillage and corn management on soil C partitioning on soil C partitioning ((Hooker et. al. UHooker et. al. U--Conn.)Conn.)
TillageTillage Corn Mgt.Corn Mgt. C4C4--CC C3C3--C HalfC Half--lifelife
%% yearsyearsNTNT GrainGrain 1717 5757
NTNT SilageSilage 1313 6161
MBMB GrainGrain 2424 3232
MBMB SilageSilage 2121 2424
2 2 -- 6 in.6 in.
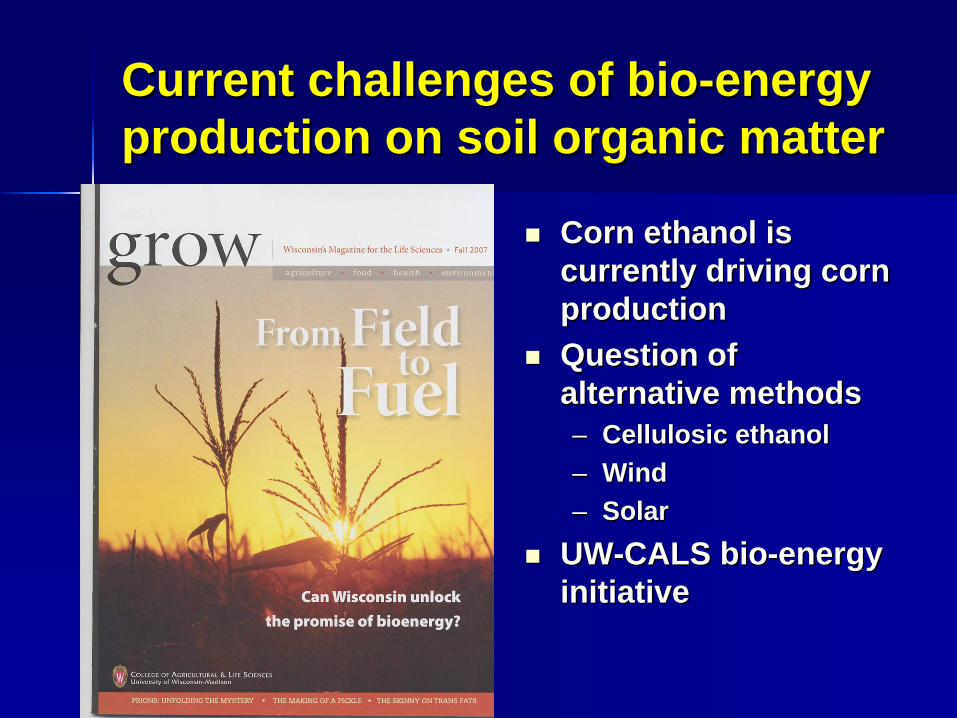
Current challenges of bioCurrent challenges of bio--energy energy production on soil organic matterproduction on soil organic matter
Corn ethanol is Corn ethanol is currently driving corn currently driving corn productionproductionQuestion of Question of alternative methodsalternative methods–– Cellulosic ethanolCellulosic ethanol–– WindWind–– SolarSolar
UWUW--CALS bioCALS bio--energy energy initiativeinitiative
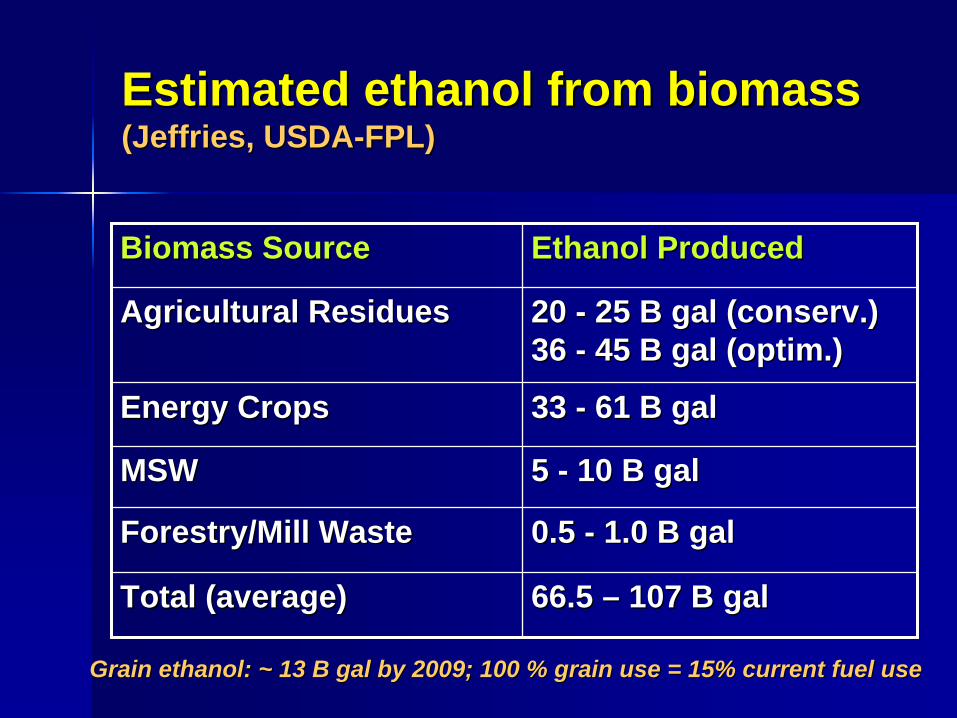
Estimated ethanol from biomass Estimated ethanol from biomass (Jeffries, USDA(Jeffries, USDA--FPL)FPL)
Biomass SourceBiomass Source Ethanol ProducedEthanol Produced
Agricultural ResiduesAgricultural Residues 20 20 -- 25 B gal (conserv.)25 B gal (conserv.)36 36 -- 45 B gal (optim.)45 B gal (optim.)
Energy CropsEnergy Crops 33 33 -- 61 B gal61 B gal
MSWMSW 5 5 -- 10 B gal10 B gal
Forestry/Mill WasteForestry/Mill Waste 0.5 0.5 -- 1.0 B gal1.0 B gal
Total (average)Total (average) 66.5 66.5 –– 107 B gal107 B gal
Grain ethanol: ~ 13 B gal by 2009; 100 % grain use = 15% currentGrain ethanol: ~ 13 B gal by 2009; 100 % grain use = 15% current fuel usefuel use

LongLong--term noterm no--till: Removed till: Removed 0, 25, 50, 75, and 100 % of 0, 25, 50, 75, and 100 % of stover after grainstover after grainThree Ohio locationsThree Ohio locationsRemoving > 50 % reduced Removing > 50 % reduced soil C and grain yield by ~ soil C and grain yield by ~ 30 bu/a on one site30 bu/a on one siteRemoving > 25 % reduced Removing > 25 % reduced infiltration on two sitesinfiltration on two sitesRemoving > 50 % reduced Removing > 50 % reduced PAW and earthworms on all PAW and earthworms on all sites.sites.Recommend limiting stover Recommend limiting stover removal to < 25 %removal to < 25 %
Concerns with using corn residues Concerns with using corn residues for biofor bio--energy energy ((BlancoBlanco--Canqui and Lal, OSU)Canqui and Lal, OSU)

Many produces already chop Many produces already chop stalks for beddingstalks for bedding
Current practice leavesCurrent practice leavesa considerable amount ofa considerable amount ofstoverstover (> 50 %?)(> 50 %?)

Removing Removing stoverstover also removes nutrients also removes nutrients ((Sawyer and Sawyer and MallarinoMallarino, ISU, 2007), ISU, 2007)
Crop Crop componentcomponent NN PP22 OO55 KK22 OO CaCa MgMg SS
---------------------------------- lb/ton DM lb/ton DM ----------------------------------
StoverStover 2020 44 3535 1111 88 33
CobsCobs 88 22 2020 22 11 99
Elemental composition of corn Elemental composition of corn stoverstover and cobsand cobs

What is Switchgrass?What is Switchgrass?Source: http://www.iowaswitchgrass.com/benefits~onfarmbenefits.html
Karl Green, LaCrosse County CNRED Agent, 2007
Warm season perennial grass (Panicum virgatum)

Benefits of Switchgrass?Benefits of Switchgrass?
Dominant native species found on native North American Dominant native species found on native North American plains/prairies of Canada & United Statesplains/prairies of Canada & United StatesAttains reasonable yields w/o high rates of nitrogen fertilizer Attains reasonable yields w/o high rates of nitrogen fertilizer (low inputs)(low inputs)–– Cost componentCost component–– Groundwater componentGroundwater component
Longevity of CropLongevity of Crop–– Approximately 10 yearsApproximately 10 years
Adapts to numerous soil/climatic conditions, therefore can be Adapts to numerous soil/climatic conditions, therefore can be introduced onto marginal croplandintroduced onto marginal cropland–– Converting row crops to perennial grasses may increase soil Converting row crops to perennial grasses may increase soil
stabilitystability–– Carbon sequestration in root mass and stubbleCarbon sequestration in root mass and stubble
Excellent burn qualities Excellent burn qualities –– Can be coCan be co--fired w/ certain coal plantsfired w/ certain coal plants–– This creates an immediate end use (market) for crops, allowing This creates an immediate end use (market) for crops, allowing
establishment of crops as cellulosic technology developsestablishment of crops as cellulosic technology develops
Karl Green, LaCrosse County CNRED Agent, 2007

Soil under switchgrass Soil under switchgrass stores more Cstores more C
Arlington ResearchArlington ResearchK. Shinners, BSEK. Shinners, BSE
Readily oxidizable CReadily oxidizable CHH22 OO22 addedadded

Potential soil Potential soil (pheasant)(pheasant) loss loss from converting CRP to cornfrom converting CRP to corn
A3830 and A3831A3830 and A3831–– Addresses soil and P Addresses soil and P
losseslosses–– Many contracts are Many contracts are
expiring by 2010expiring by 2010–– Wis. has relatively low Wis. has relatively low
rere--enrollment 56 %enrollment 56 %–– National average reNational average re--
enrollment is 83 %enrollment is 83 %

Estimated soil and P loss Estimated soil and P loss from CRP conversion to corn from CRP conversion to corn (Panuska et al., 2007)(Panuska et al., 2007)
Soil Loss - D Slope Fields
0
5
10
15
20
25
30
CRP
Cg: NT
Cg: ST
Cg-bale: NTCg-Cg-S: NTCg: FcultCg: CP
Cs: NT
Cs: NT w cvrCs: FcultCs: CP
Rotation and tillage
Soil
Loss
(T/a
/yr)
With ManureNo Manure
Wisconsin P Index - D Slope Fields
05
1015202530354045
CRP
Cg: NT
Cg: ST
Cg-bale: NTCg-Cg-S: NTCg: FcultCg: CP
Cs: NT
Cs:NTw cvr
Cs: FcultCs: CP
Rotation and tillage
Ann
ual P
Inde
x
With ManureNo Manure

-3
-2
-1
0
1
2
Grass hay
Cg: N
T
Cg: ST
Cg-baled: N
T
Cg-C
g-S: NT
Cg: Fcult
Cg: C
P
Cs: N
T
Cs: N
Tw cvr
Cs: Fcult
Cs: C
P
Rotation and tillage
Soil
Con
ditio
ning
Inde
x
Estimated Soil Conditioning Estimated Soil Conditioning Index for CRP conversion to corn Index for CRP conversion to corn (Panuska et al., 2007)(Panuska et al., 2007)

SummarySummary
Soil organic matter is importantSoil organic matter is importantPractices that maintain or build SOM Practices that maintain or build SOM should be encouragedshould be encouragedFollow conservation plans and strive to Follow conservation plans and strive to reduce tillage intensityreduce tillage intensityReturn crop residues when possibleReturn crop residues when possibleCarefully consider impact of converting Carefully consider impact of converting CRPCRPCrop production for bioCrop production for bio--energy may hurt energy may hurt or help soil qualityor help soil quality