managing campus wide energy
TRANSCRIPT
Managing Campus Wide Energy
Getting Beyond the SpreadsheetOctober 22, 2019
Celeste Cizik, PE, CEM, PMP, LEED-AP Principal/ Team Leader
Jerry Gallegos, PE, CEMEnergy Program Lead
Sandia National Laboratories is a multimission laboratory managed and operated by National Technology
& Engineering Solutions of Sandia, LLC, a wholly owned subsidiary of Honeywell International Inc., for the U.S.
Department of Energy’s National Nuclear Security Administration under contract DE-NA0003525. SAND2019-11663 C
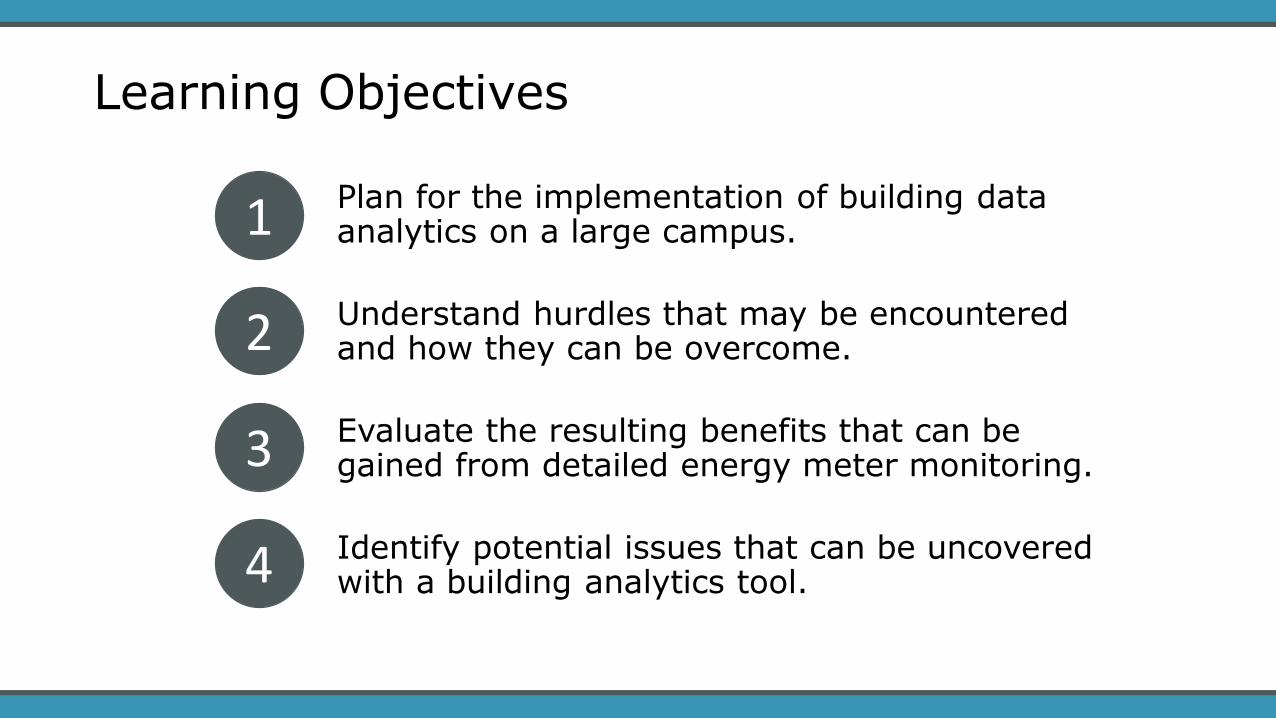
Plan for the implementation of building data analytics on a large campus.
Understand hurdles that may be encountered and how they can be overcome.
Evaluate the resulting benefits that can be gained from detailed energy meter monitoring.
Identify potential issues that can be uncovered with a building analytics tool.
Learning Objectives
1
2
3
4
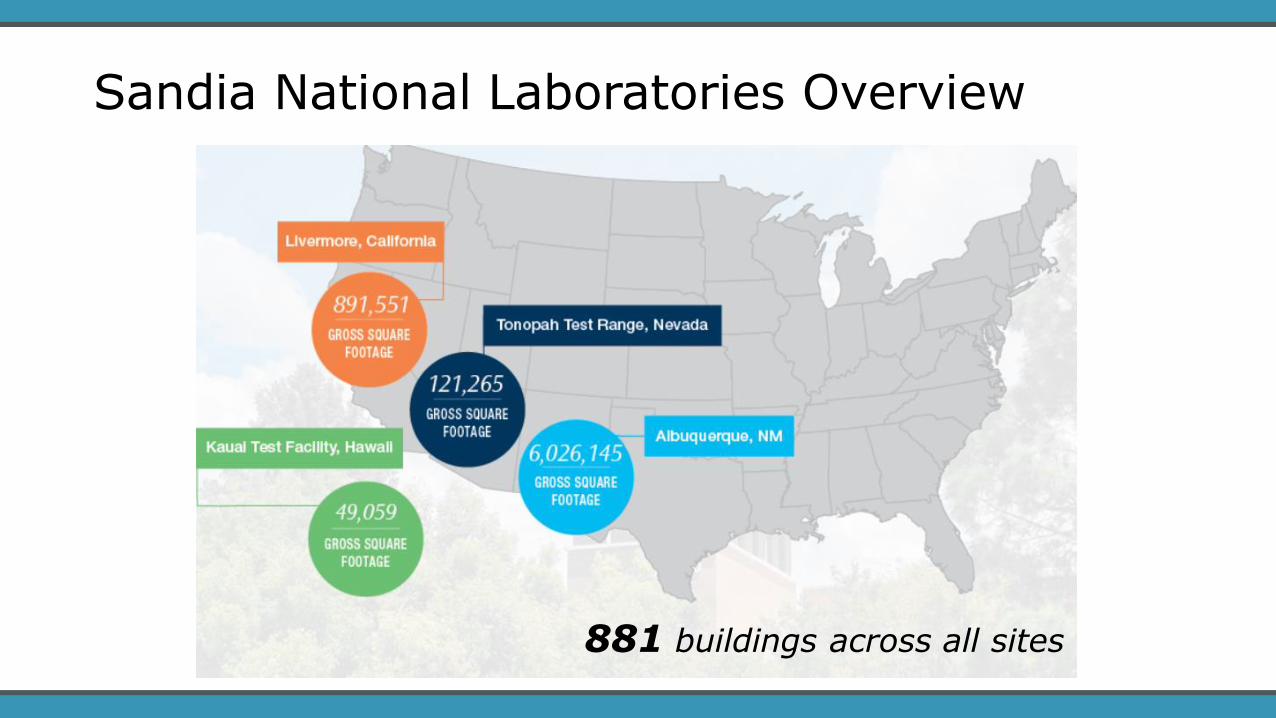
Sandia National Laboratories Overview
881 buildings across all sites
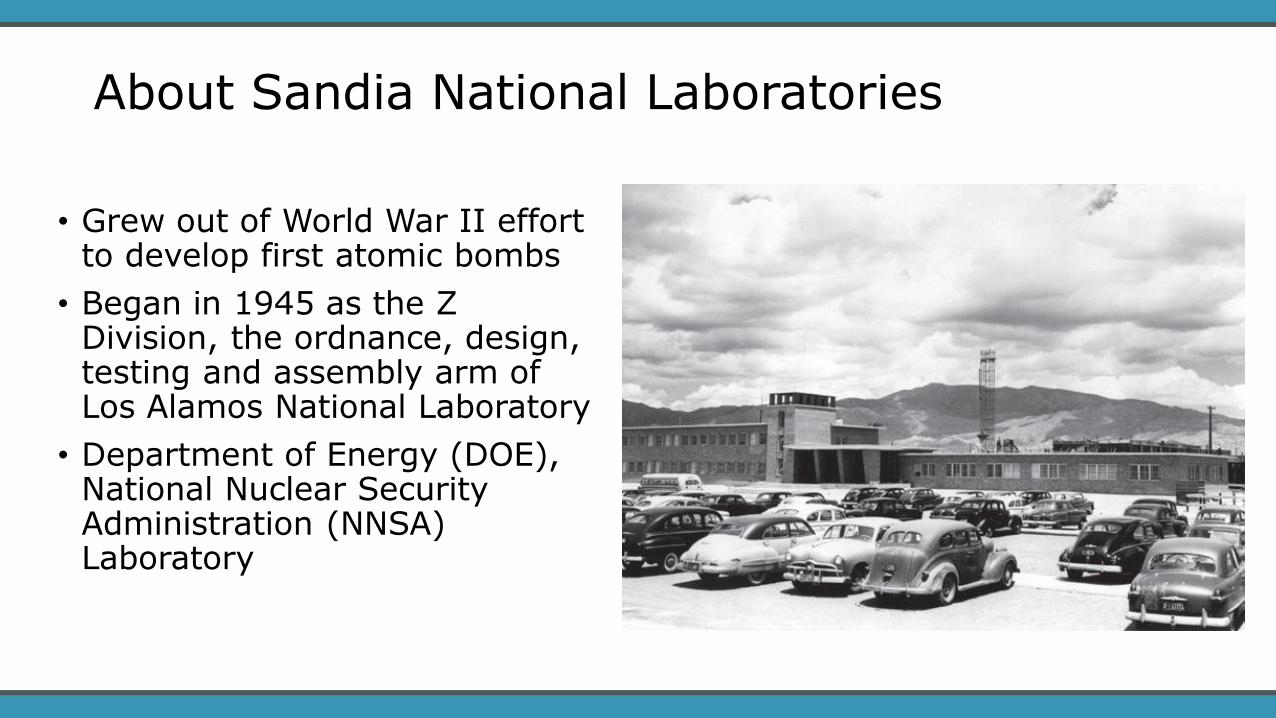
• Grew out of World War II effort to develop first atomic bombs
• Began in 1945 as the Z Division, the ordnance, design, testing and assembly arm of Los Alamos National Laboratory
• Department of Energy (DOE), National Nuclear Security Administration (NNSA) Laboratory
About Sandia National Laboratories

Sandia National Laboratories Mission & Facilities
Research & Development Types of Facilities
Nuclear Weapons
National Security Programs
Defense Nuclear Proliferation
Energy & Homeland Security
Advanced Science & Technology
Clean Rooms, Data Centers
Chemical Bio, Radiological Labs
Manufacturing R&D, Testing
Chilled Water & Hot Water Plants
Offices, High Security, Cafeterias, Warehouses, and High Bays
700+ fume hoods
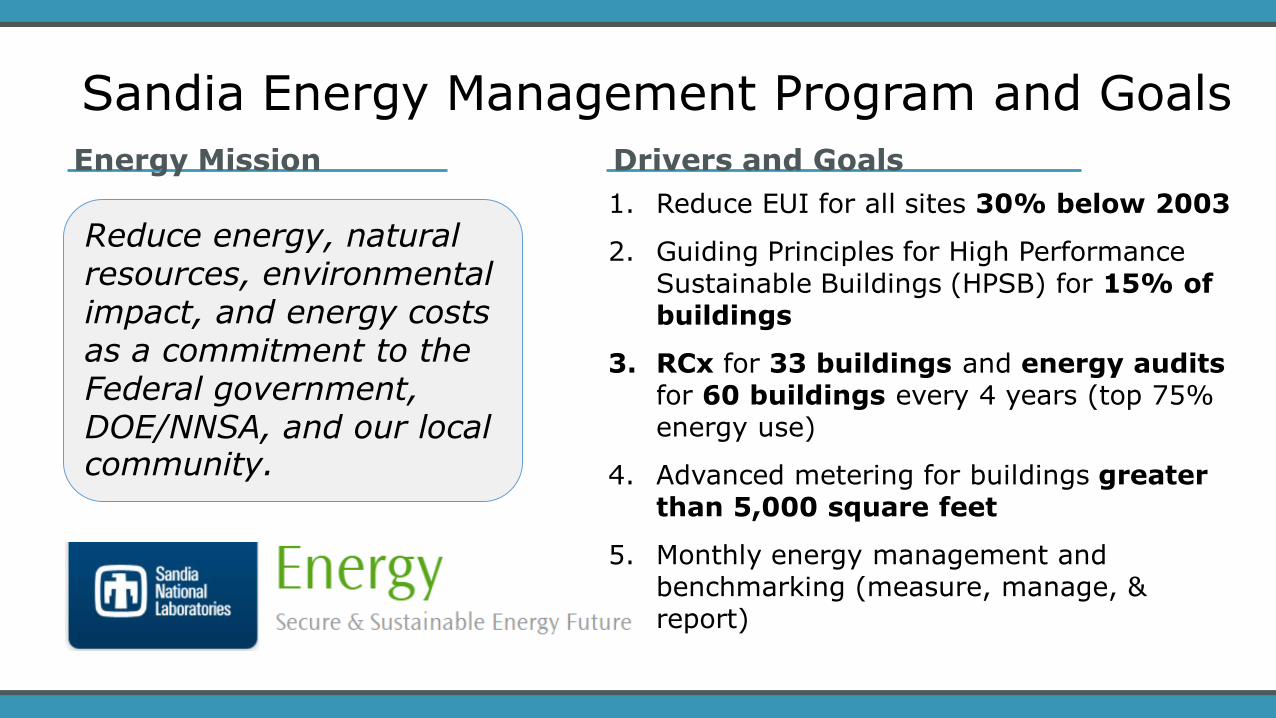
Sandia Energy Management Program and Goals
Energy Mission Drivers and Goals
Reduce energy, natural resources, environmental impact, and energy costs as a commitment to the Federal government, DOE/NNSA, and our local community.
1. Reduce EUI for all sites 30% below 2003
2. Guiding Principles for High Performance Sustainable Buildings (HPSB) for 15% of buildings
3. RCx for 33 buildings and energy audits for 60 buildings every 4 years (top 75% energy use)
4. Advanced metering for buildings greater than 5,000 square feet
5. Monthly energy management and benchmarking (measure, manage, & report)
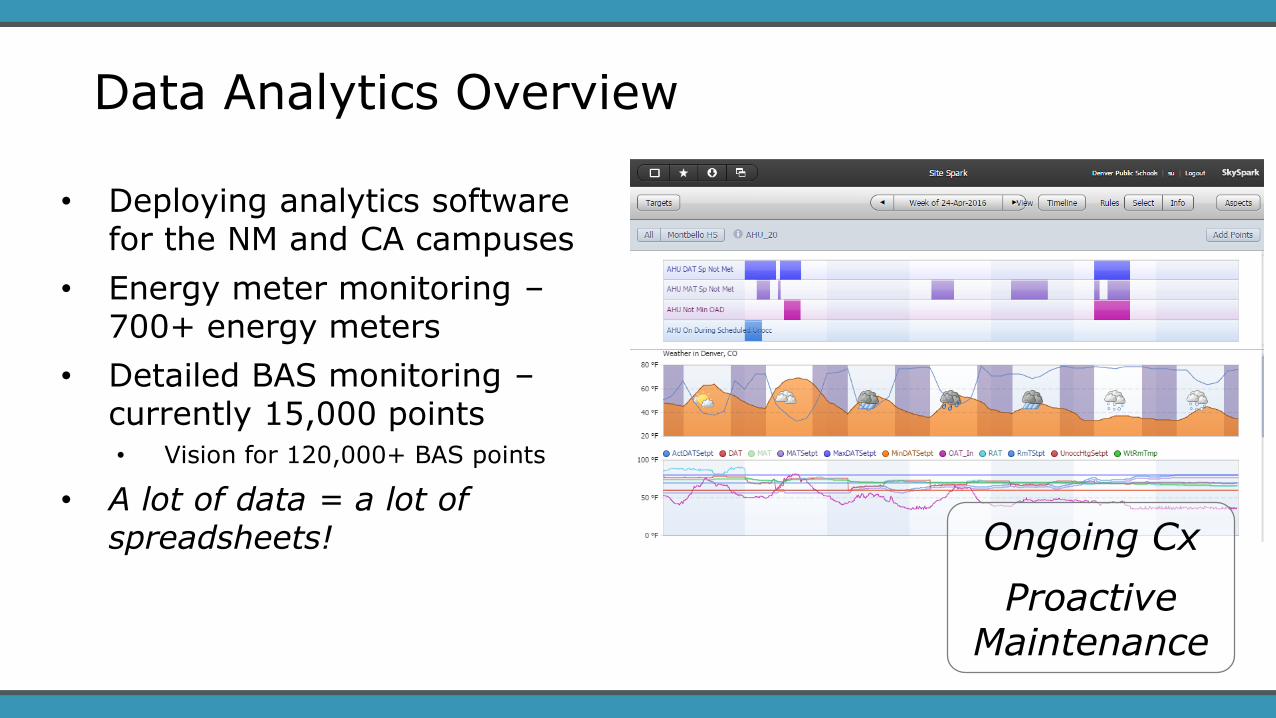
• Deploying analytics software for the NM and CA campuses
• Energy meter monitoring –700+ energy meters
• Detailed BAS monitoring –currently 15,000 points• Vision for 120,000+ BAS points
• A lot of data = a lot of spreadsheets! Ongoing Cx
Proactive Maintenance
Data Analytics Overview

CHALLENGES
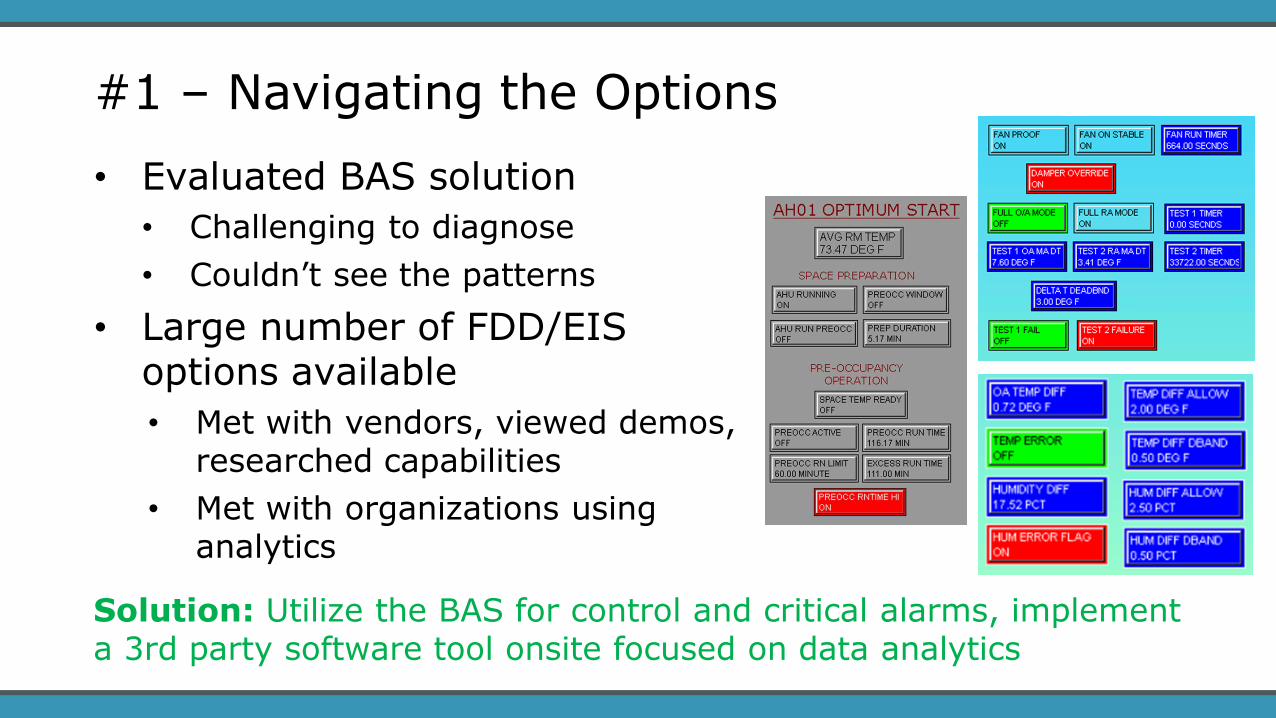
Solution: Utilize the BAS for control and critical alarms, implement a 3rd party software tool onsite focused on data analytics
• Evaluated BAS solution
• Challenging to diagnose
• Couldn’t see the patterns
• Large number of FDD/EIS options available
• Met with vendors, viewed demos, researched capabilities
• Met with organizations using analytics
#1 – Navigating the Options
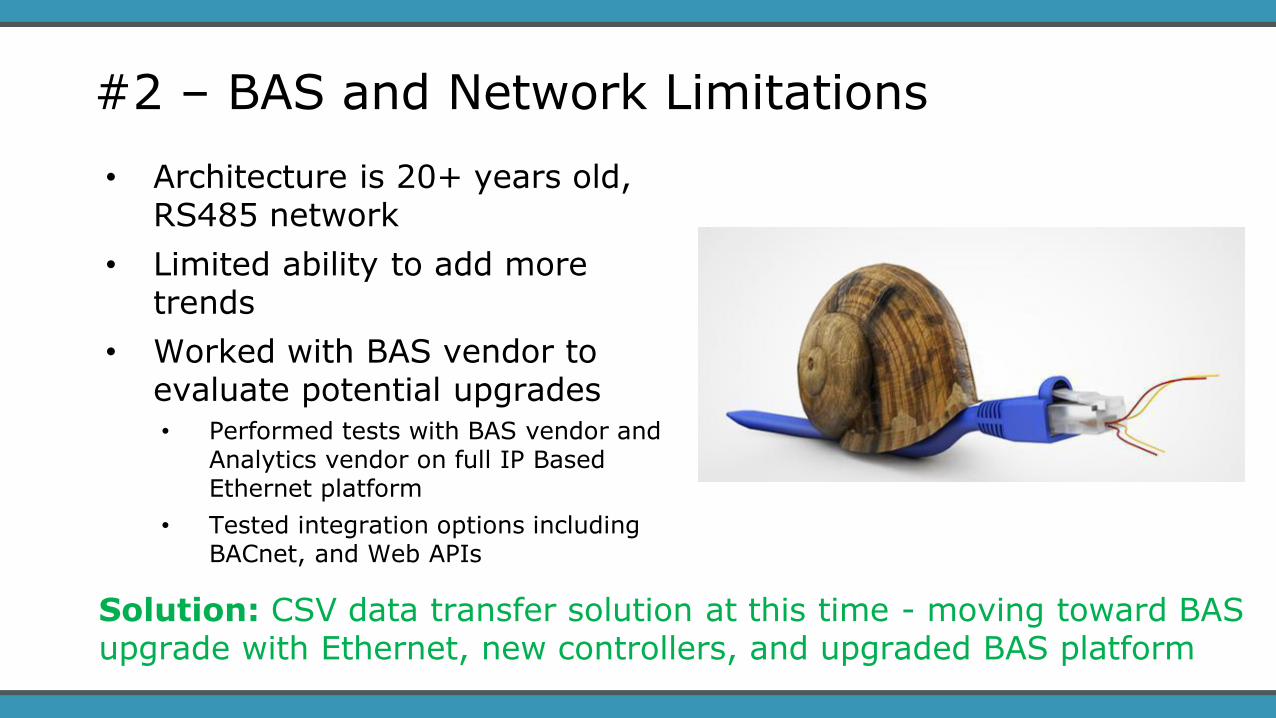
Solution: CSV data transfer solution at this time - moving toward BAS upgrade with Ethernet, new controllers, and upgraded BAS platform
• Architecture is 20+ years old, RS485 network
• Limited ability to add more trends
• Worked with BAS vendor to evaluate potential upgrades • Performed tests with BAS vendor and
Analytics vendor on full IP Based Ethernet platform
• Tested integration options including BACnet, and Web APIs
#2 – BAS and Network Limitations
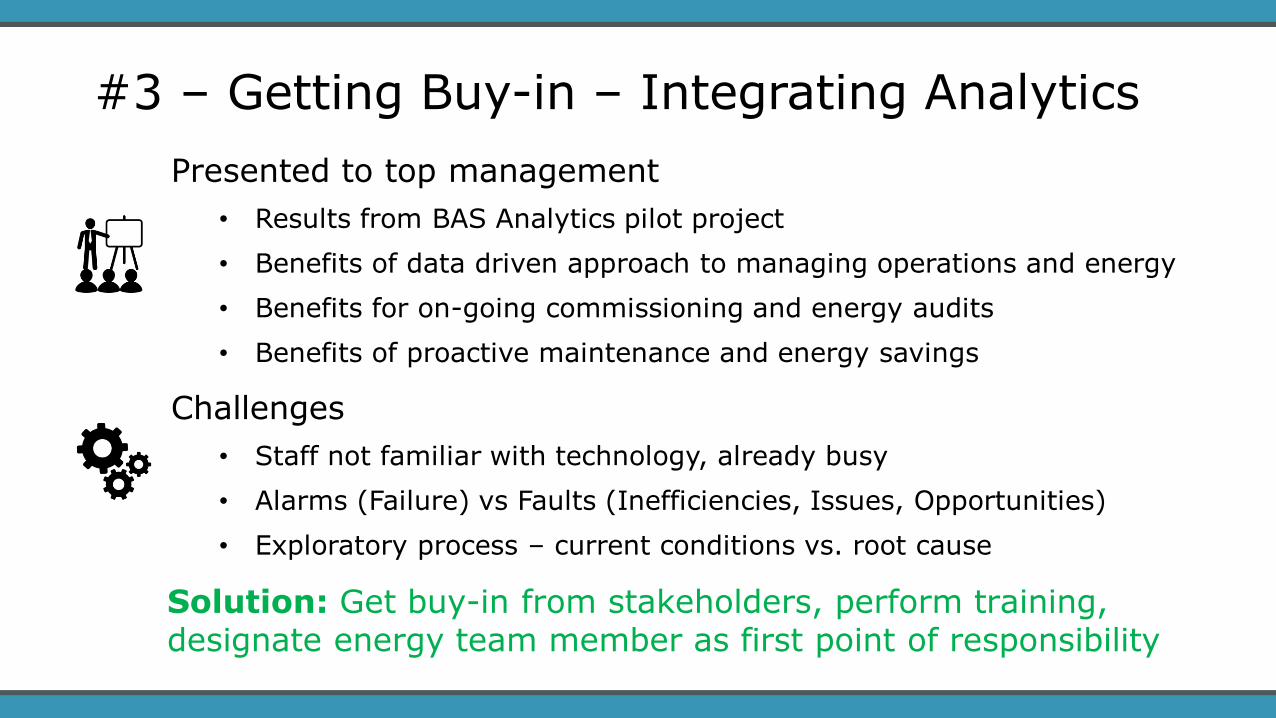
Presented to top management
• Results from BAS Analytics pilot project
• Benefits of data driven approach to managing operations and energy
• Benefits for on-going commissioning and energy audits
• Benefits of proactive maintenance and energy savings
Challenges
• Staff not familiar with technology, already busy
• Alarms (Failure) vs Faults (Inefficiencies, Issues, Opportunities)
• Exploratory process – current conditions vs. root cause
Solution: Get buy-in from stakeholders, perform training, designate energy team member as first point of responsibility
#3 – Getting Buy-in – Integrating Analytics
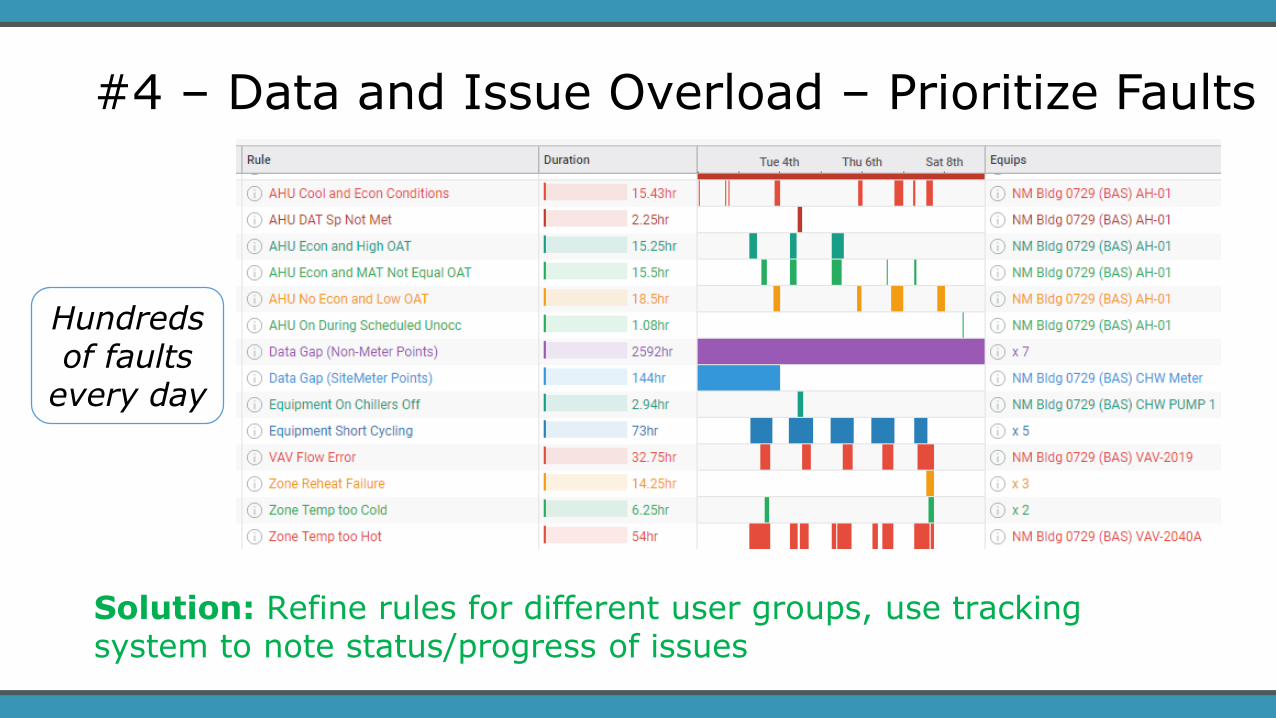
Solution: Refine rules for different user groups, use tracking system to note status/progress of issues
Hundreds of faults
every day
#4 – Data and Issue Overload – Prioritize Faults

TRIUMPHS
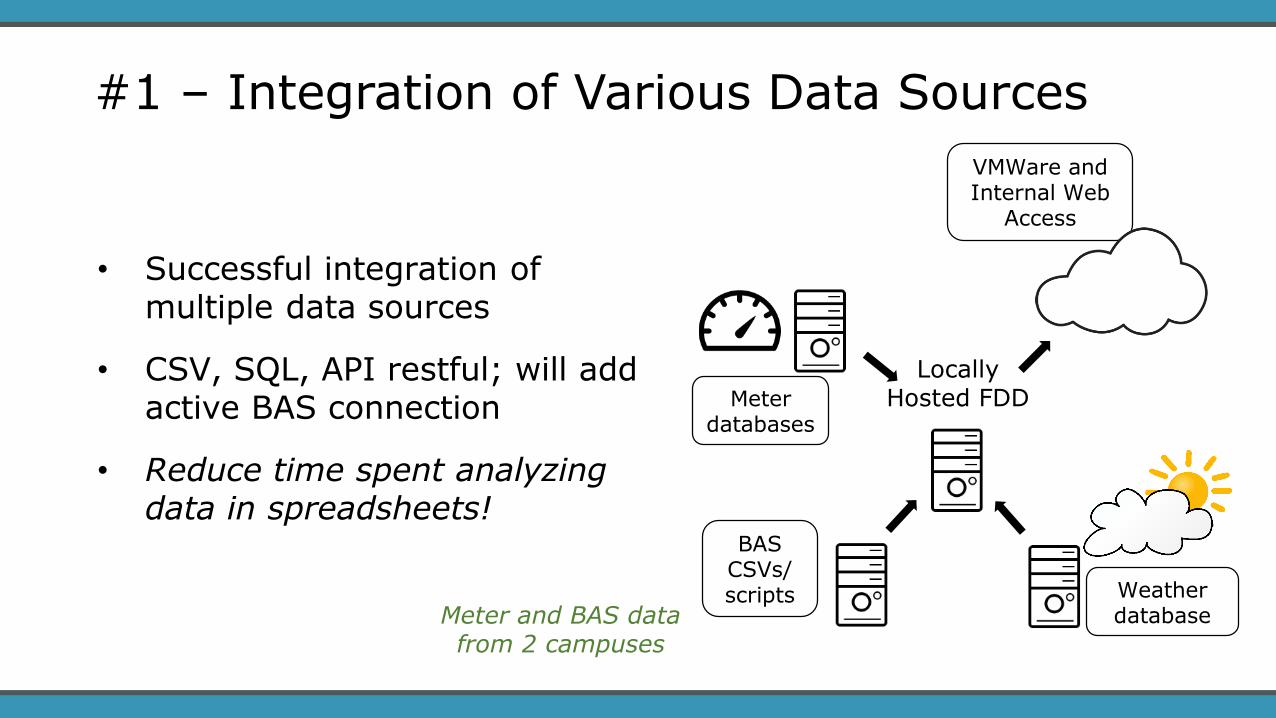
Locally Hosted FDD
• Successful integration of multiple data sources
• CSV, SQL, API restful; will add active BAS connection
• Reduce time spent analyzing data in spreadsheets!
BAS CSVs/ scripts
Meter databases
Weather database
VMWare and Internal Web
Access
Meter and BAS data from 2 campuses
#1 – Integration of Various Data Sources
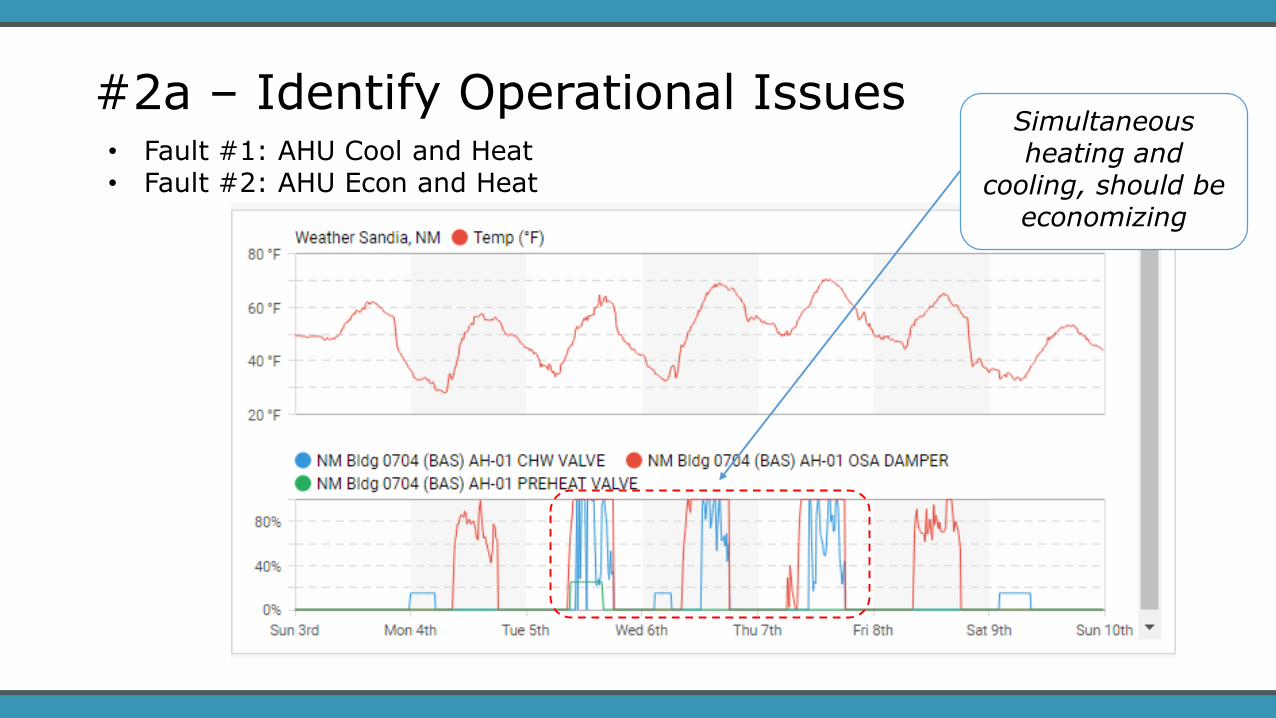
Simultaneous heating and
cooling, should be economizing
• Fault #1: AHU Cool and Heat• Fault #2: AHU Econ and Heat
#2a – Identify Operational Issues
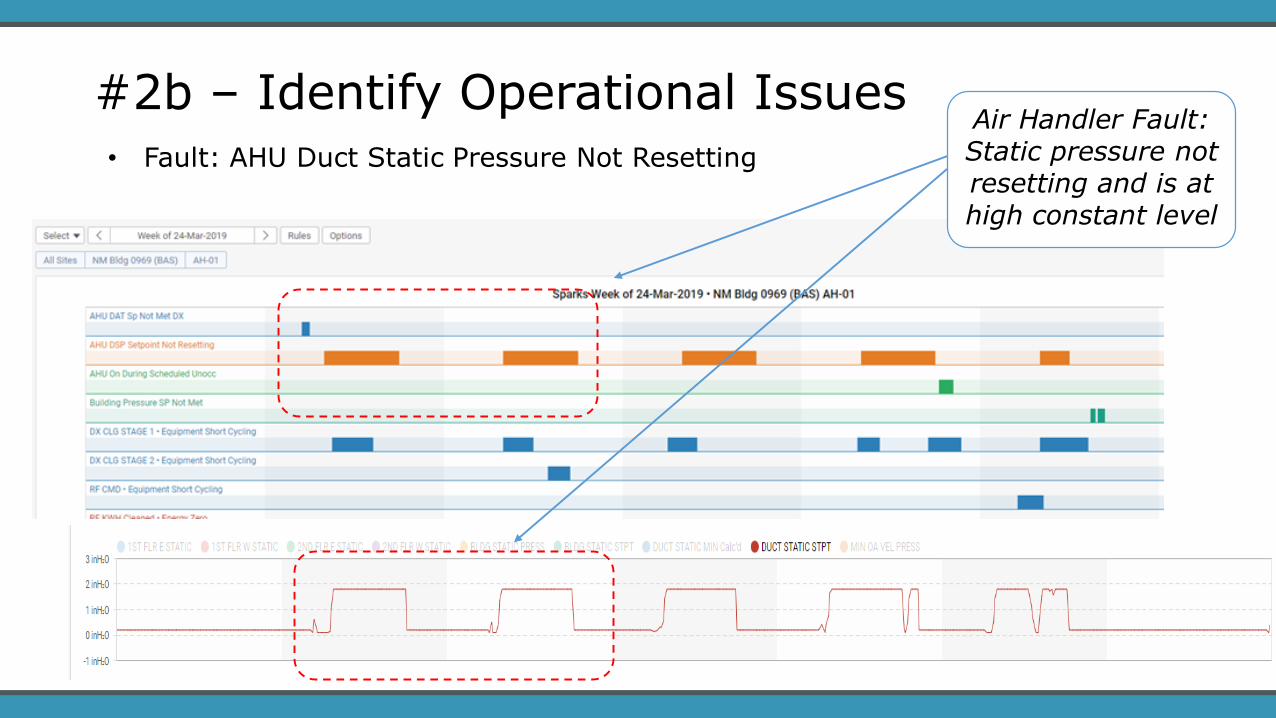
Air Handler Fault: Static pressure not resetting and is at high constant level
• Fault: AHU Duct Static Pressure Not Resetting
#2b – Identify Operational Issues
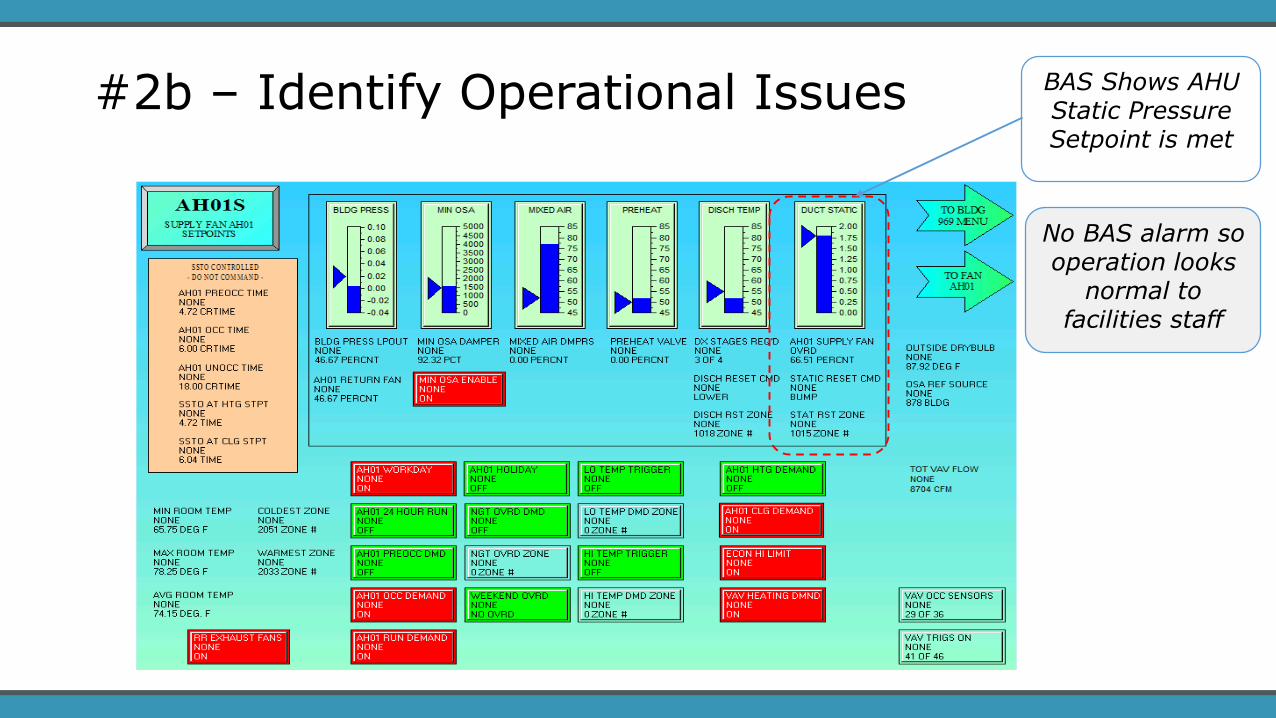
BAS Shows AHU Static Pressure Setpoint is met
#2b – Identify Operational Issues
No BAS alarm so operation looks
normal to facilities staff
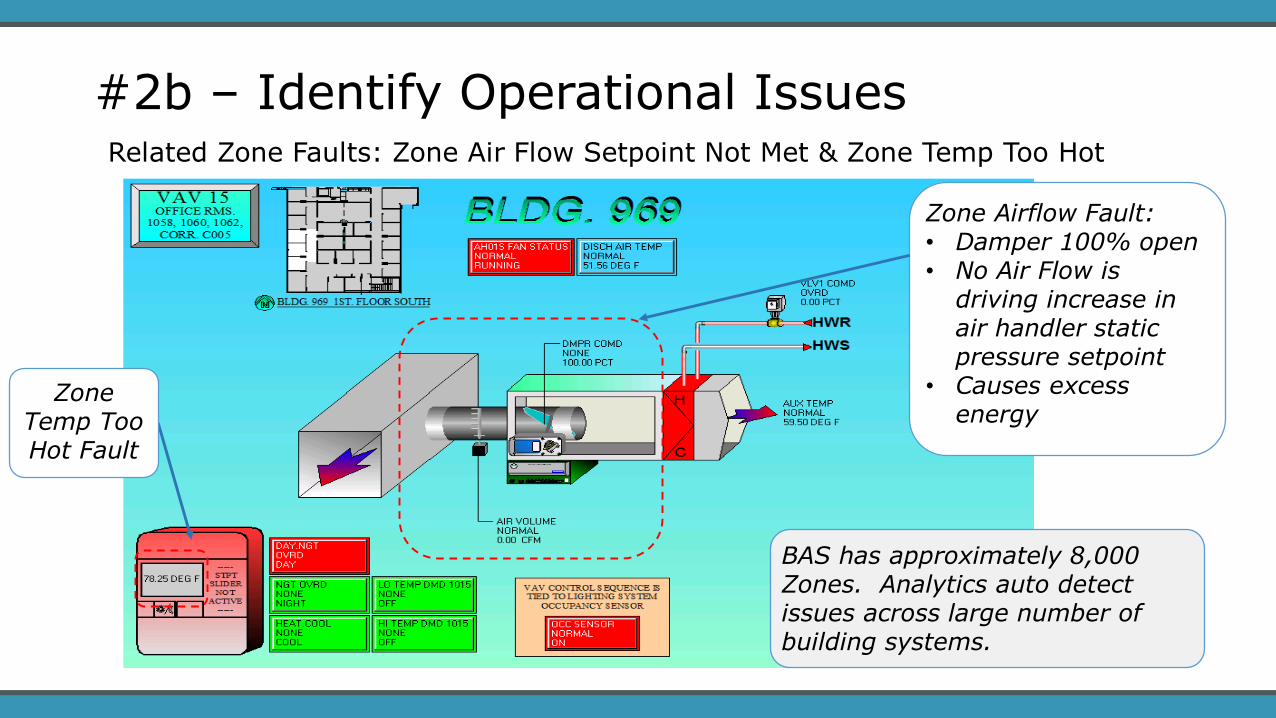
Zone Airflow Fault:• Damper 100% open • No Air Flow is
driving increase in air handler static pressure setpoint
• Causes excess energy
Zone Temp Too Hot Fault
#2b – Identify Operational Issues
BAS has approximately 8,000 Zones. Analytics auto detect issues across large number of building systems.
Related Zone Faults: Zone Air Flow Setpoint Not Met & Zone Temp Too Hot
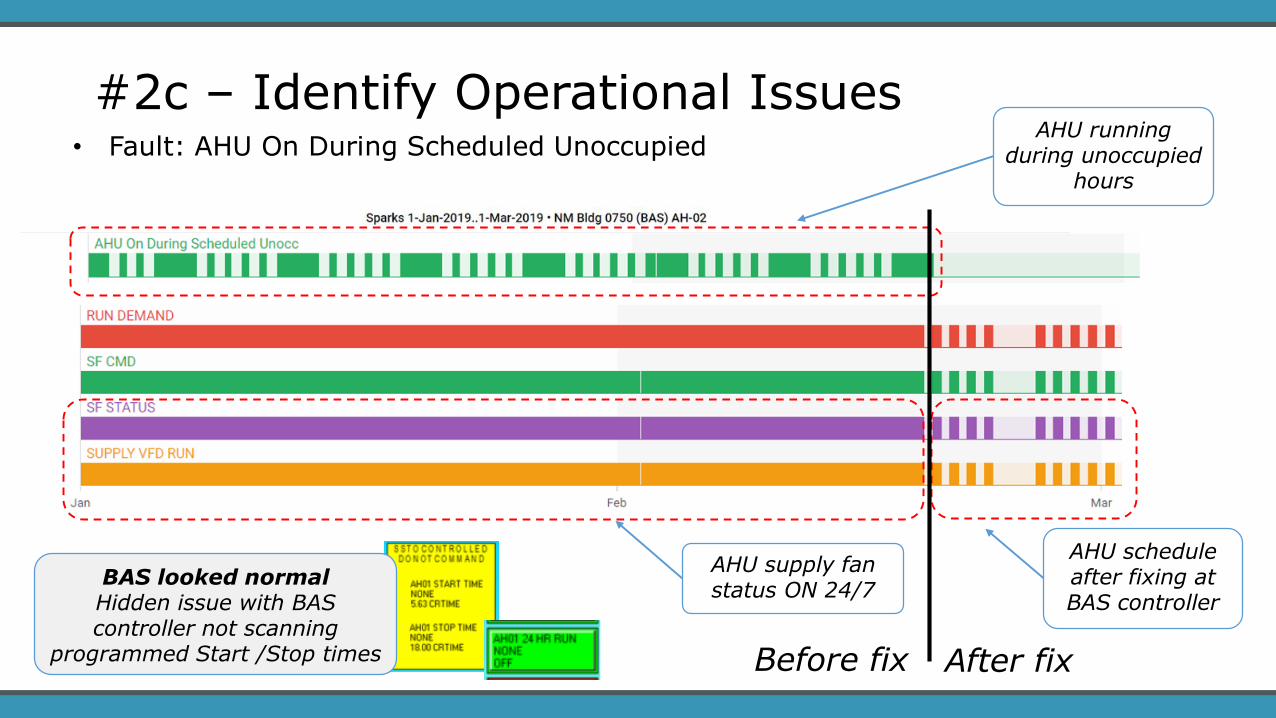
• Fault: AHU On During Scheduled UnoccupiedAHU running
during unoccupied hours
AHU schedule after fixing at BAS controller
AHU supply fan status ON 24/7
#2c – Identify Operational Issues
Before fix After fix
BAS looked normalHidden issue with BAS controller not scanning
programmed Start /Stop times
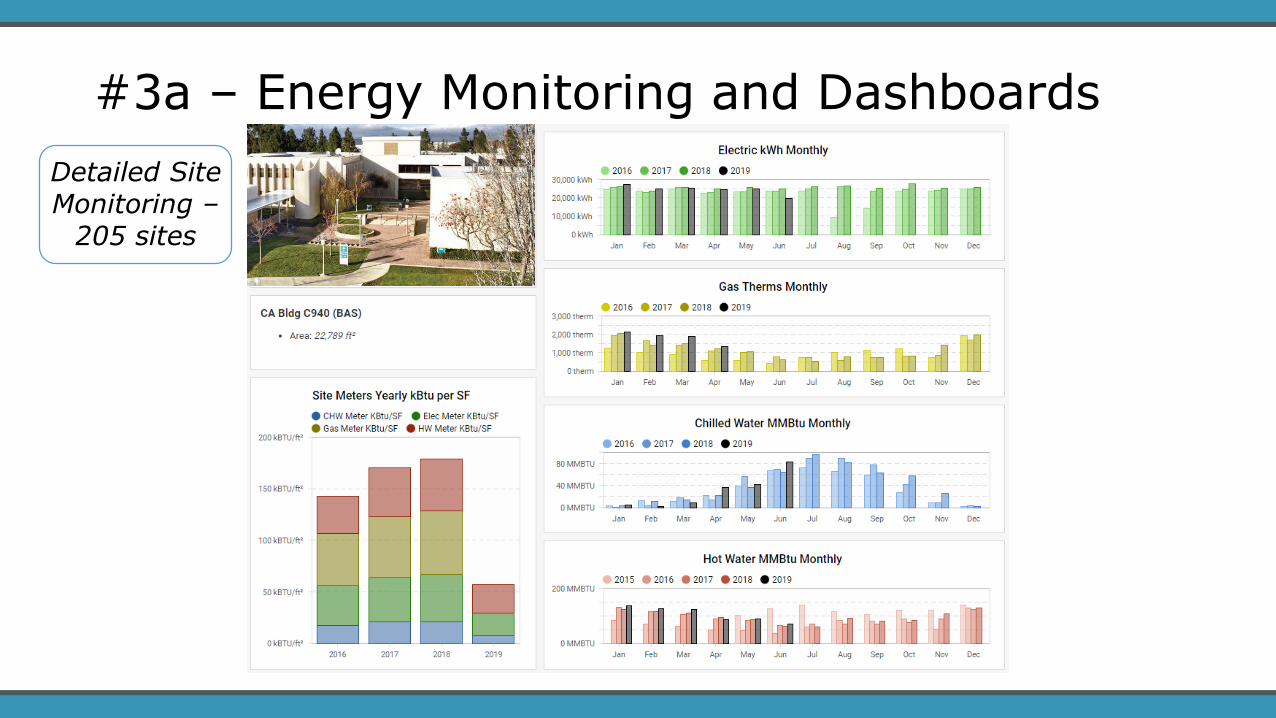
Detailed Site Monitoring –
205 sites
#3a – Energy Monitoring and Dashboards
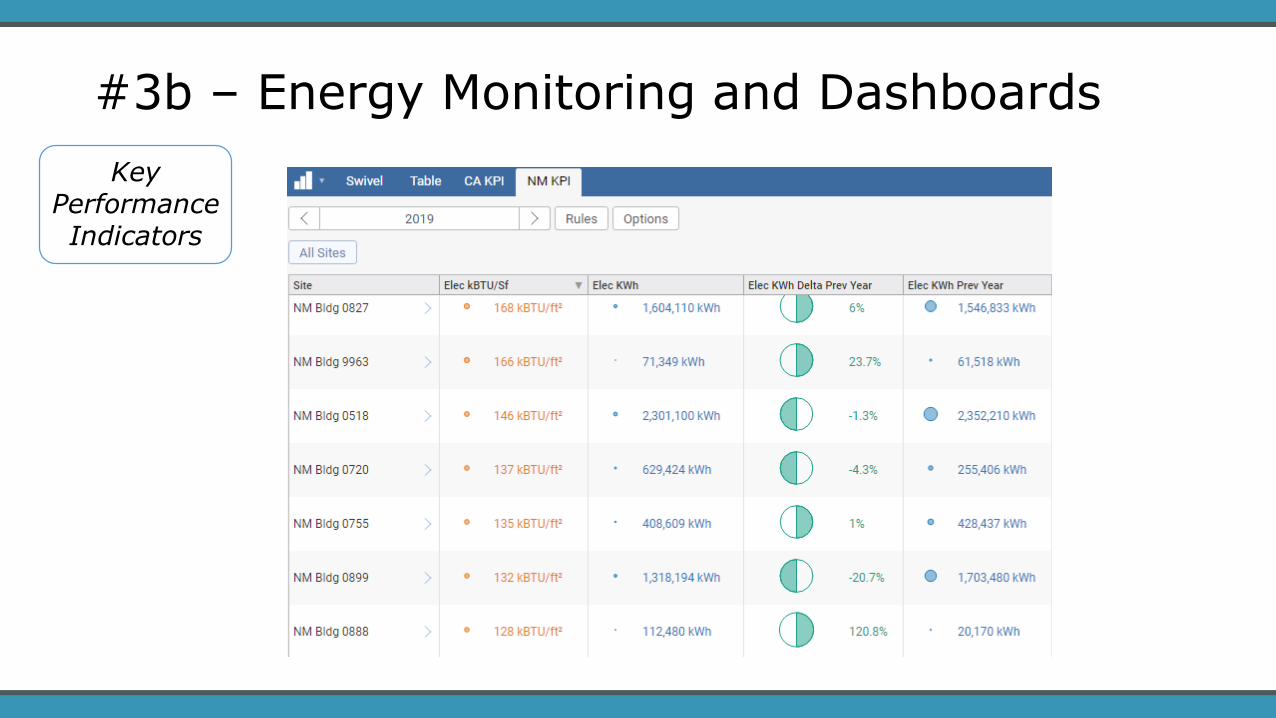
Key Performance Indicators
#3b – Energy Monitoring and Dashboards
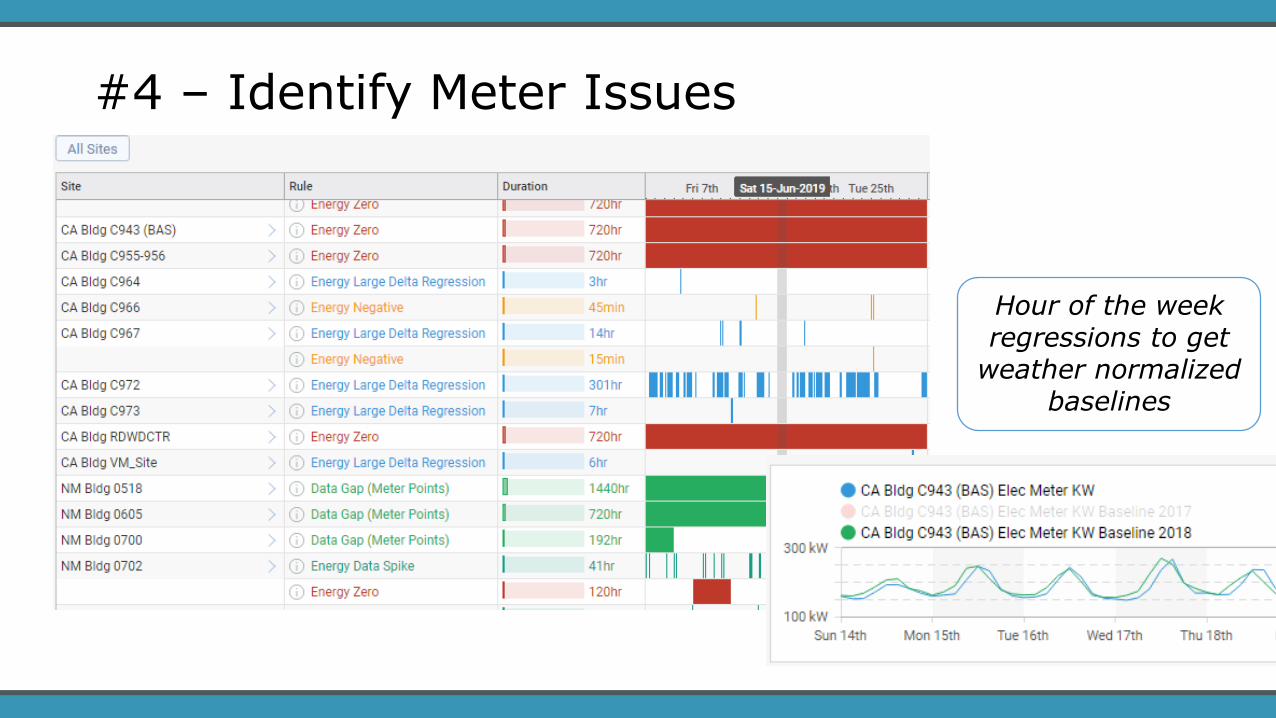
Hour of the week regressions to get
weather normalized baselines
#4 – Identify Meter Issues

THE PATH FORWARD
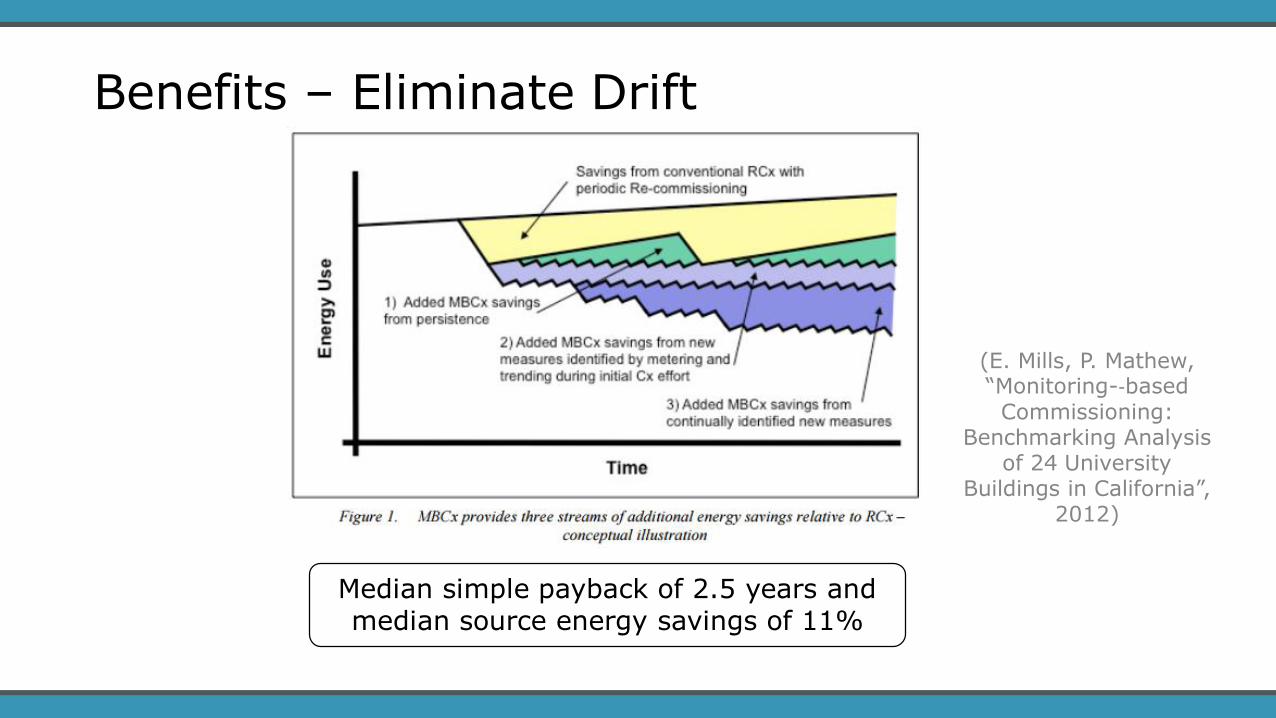
Median simple payback of 2.5 years and median source energy savings of 11%
(E. Mills, P. Mathew, “Monitoring-‐based
Commissioning: Benchmarking Analysis
of 24 University Buildings in California”,
2012)
Benefits – Eliminate Drift
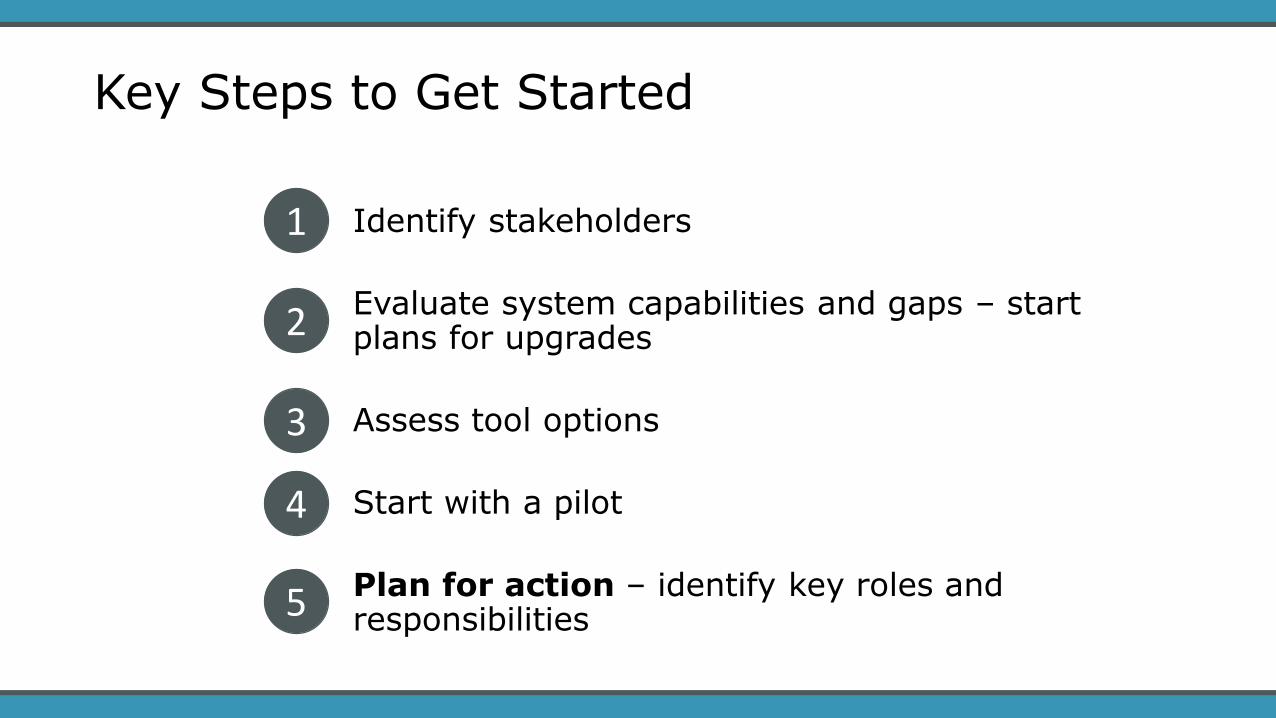
Key Steps to Get Started
Identify stakeholders
Evaluate system capabilities and gaps – start plans for upgrades
Assess tool options
Start with a pilot
Plan for action – identify key roles and responsibilities
1
2
3
4
5

Questions?
Celeste Cizik, PE, CEM, PMP, LEED-AP Principal/ Team Leader
[email protected](720) 382-1705
Jerry Gallegos, PE, CEMEnergy Program Lead
[email protected] (505) 845-0582
Sandia National Laboratories is a multimission laboratory managed and operated by National Technology
& Engineering Solutions of Sandia, LLC, a wholly owned subsidiary of Honeywell International Inc., for the U.S.
Department of Energy’s National Nuclear Security Administration under contract DE-NA0003525. SAND2019-11663 C