managing agricultural greenhouse gases || cropland management in the eastern united states for...
TRANSCRIPT

CHAPTER 3
Cropland Management inthe Eastern United Statesfor Improved Soil OrganicCarbon Sequestration
Curtis J. Dell1, Jeffrey M. Novak21USDA-ARS-Pasture Systems and Watershed Management Research Unit,University Park, PA2USDA-ARS-Coastal Plains Soil, Water, and Plant Research Center, Florence, SCM
2
CHAPTER OUTLINE
23Introduction 23Geographic Regions of the EasternU.S 25Cropland Management in the EasternU.S. 27Synthesis of Published Findings 29
Results of Previously Reported
Research 29
Recent Information from the Southeastern
U.S. 31
anaging Agricultural Greenhouse Gases. DOI: 10.1016/B978-0-12-386897-8
012, Published by Elsevier Inc.
Northeastern U.S. 35
Carbon Sequestration Potential in theRegion 36
Southeastern U.S. 36
Northeastern U.S. 36
Research Needs 36
Conclusions and Recommendations 37References 38
Abbreviations: CT, conventional tillage; NT, no-till; SOC, soil organic carbon
INTRODUCTIONThe eastern United States (Figure 3.1) is a very diverse region with respect to geography, soils,
and climate. This diversity leads to the production of a wide range of crops using numerousmanagement practices and variable potentials to increase soil organic C (SOC) sequestration
(defined here as the accumulation of SOC in response to changing management). The largest
extent of cropland lies on Atlantic and Gulf Coastal Plains and Piedmont of the southeasternand mid-Atlantic states; however, portions of the Appalachian Plateau, Ridge and Valley, and
New England physiographic provinces are also used for crop production.
The eastern U.S. has a long history of crop production. Prior to the arrival of European settlers
in the 17th and 18th centuries, Native Americans produced crops such as corn (Zea mays),
.00003-6

24
SECTION 2Agricultural Management
beans (genus Phaseolus), and squash (genus Cucurbita) in small clearings and established newfields when older fields became depleted. With European colonization, settlers expanded the
area under cultivation by clearing forests and established intensive cultivation of cash crops
such as corn, cotton (Gossypium L.), tobacco (Nicotina L.), rice (Oryzal L.), indigo (Indigoferatintoria), and timber production. Continuous cultivation of fields coupled with poor land
stewardship resulted in rapid depletion in nutrients, accelerated soil erosion, and an eventualdecline in crop productivity (Busscher et al., 2010). This type of management was commonly
practiced because there was always more land available for farming. Unfortunately, it took
another century for farmers to be made aware that land availability was limited and that thesoil needed good stewardship to replenish nutrients and reduce erosion losses (Bennett and
Chapline, 1928). Because of a more favorable climate, the intensification of agriculture and
depletion of soil resources was greatest in the southeastern and mid-Atlantic states. However,past soil erosion also degraded productivity of soils throughout the northeastern U.S.
For almost two centuries, fields in the eastern U.S. were prepared for row crop production
using some form of conventional tillage (CT, plowing and/or disking). These tillageoperations invert topsoil and incorporate crop residue, a practice that is well known to
hasten its microbial oxidation and loss from the SOC pool (Reicosky et al., 1995; Hunt
et al., 1996). This has been a serious concern because SOC declines in sandy soils of thecoastal plains can result in poor soil physical conditions for plant growth (Busscher et al.,
1987), low water storage capacities (Peele et al., 1970; Campbell et al., 1974), and reduced
capacity of soils to retain nutrients (Pierzynski et al., 2000) and herbicides (Novak et al.,1996). In addition to tilling the soil using conventional practices, SOC declines in the
TX
LA
MS
AR
AL GA
FL
SC
NC
VA
WV MDDE
NJ
PA
VT
NH
ME
MS
CTRI
TN
Coastal Plain
Piedmon
tRi
dge
and
Valle
y
Applac
hian
Platea
us
New England
NY
Blue R
idge
FIGURE 3.1Physiographic provinces of the Eastern United States.

CHAPTER 3Cropland Management in the Eastern United States
southeastern U.S. have been made worse in many areas by long-term cotton monoculturebecause cotton returns small amounts of crop residue to the soil (Causarano et al., 2006;
Novak et al., 2009). Other crops such as corn, soybean (Glycine max L.), or wheat (Triticum
L.) can supply more crop residues (>3.1 t/ha) to the soil (Hunt and Matheny, 1993; Karlenet al., 1987); unfortunately, more crop residues may not translate into higher SOC contents
especially when soils are tilled using conventional practices (Parton and Schimel, 1987;Wang et al., 2000).
Increased awareness and adoption of conservation measures since the mid-20th century
have helped to control erosion and restore productivity of soils throughout the eastern U.S.The adoption of conservation tillage, which involves minimal surface tillage, leaves crop
residues to accumulate at the soil surface. The unincorporated crop residues decompose
more slowly when compared to soils under traditional tillage operations (Reicosky andLindstrom, 1993; Lal and Kimble, 1997; Paustian et al., 2000; Bauer et al., 2006). The use
of additional management practices such as cover cropping, manure application, and
improved crop rotations can also help to reduce soil losses and increase retention of soilorganic matter. This chapter will address current crop production management practices
and their impact on SOC dynamics in the eastern U.S. and analyze potential for additional
SOC sequestration.
25
GEOGRAPHIC REGIONS OF THE EASTERN U.SThe Coastal Plain is an expansive geophysical province that extends from southern NewJersey along the Atlantic coast through the coast of the Gulf of Mexico to southeastern Texas
(Figure 3.1), with cropland comprising about 15% of the total land area in the region
(USDA, 2006). The Coastal Plain was formed through a series of sea level rises and recessionsand subsequent depressional and erosional forces (Siple, 1967). The landscape is relatively
flat and typified by scarps and terraces resulting from changes in ocean level, deposition of
sediments, and river dissection over time. The elevation ranges from sea level to about 150m(Daniels et al., 1999). Ultisols are the dominant Coastal Plain soil order. Stable coastal
surfaces developed aged soils that included an eluvial (E) horizon, weathered clays (Daniels
et al., 1967a), and a reddened argillic B horizon (Daniels et al., 1967b). Because of theextreme age, abundant rainfall, and humid climate, many of the Ultisols have a high degree
of weathering leading to low pH (unless limed), highly weathered clay (Shaw et al., 2004;
Novak et al., 2009), low cation exchange capacity (<2 to 4 cmolc kg�1; Kleiss, 1994), and low
SOC content (0.2 to 0.8 g kg�1; Hunt et al., 1982; Novak et al., 2009). Coastal Plains sandy
soils also commonly have a restrictive subsurface hard layer (Mullins, 2000; Chartres et al.,
1990) that can limit root penetration (Busscher et al., 2001). Average precipitation is1000e1500mm yr�1 (increasing north to south), with maximum rainfall in mid-summer
in the eastern portion and winter and spring in the west. Average temperatures range from
13 to 20�C (increasing north to south), with the average number of frost-free days rangingfrom 200 to 305 (USDA, 2006).
The Piedmont extends from the Appalachian Mountains to the Coastal Plain, ranging fromAlabama to southeastern Pennsylvania (Figure 3.1). Cropland accounts for 8% of the
Southern Piedmont Major Land Resource Area (MLRA) and 28% of Northern Piedmont
MLRA (USDA, 2006). The Piedmont can be extensively hilly and contain soils that formedin unstable positions where soil profile expression has been limited (i.e. Inceptisols,
Entisols). In more stable positions, such as on gently rolling topography, soils are older and
will show more soil profile development (Alfisols and Ultisols). Piedmont soils are oftenformed from residuum or alluvium along streams and rivers (Daniels et al., 1999) leading
to textures that vary from fine-clayey to coarse. Profile horizonation sequences of Piedmont
soils are highly variable. Profiles can be composed of kaolinitic, mixed, and smectitic claysand depending on age are low in base saturation due to leaching from the rock parent

TABLE 3.1 Land Area (Hectares) in the Eastern United States Planted to Major Row Crops Reported in the 2007 Census of Agriculture (USDA-National Agricultural Statistic Service). Sugarcane was Produced on 164,200 ha in Louisiana and 153,328 ha in Florida. The Total LandArea in all States Planted to these Crops was 14,620,640 ha
StateCorn(grain)
Corn(silage) Soybeans Cotton
Smallgrains Rice
Allvegetables Peanuts
Grainsorghum Tobacco
Statetotal
Alabama 112,048 11,016 72,768 154,939 41,014 NR 7,433 64,162 2,360 NR 465,739Arkansas 236,775 1,887 1,141,889 346,036 284,760 536,767 5,637 NR 87,655 NR 2,641,406Connecticut 1,443 24,147 119 NRy 3,220 NR 4,167 NR NR 1,267 34,363Delaware 75,090 6,353 62,997 NR 35,167 NR 14,179 NR 132 NR 193,919Florida 13,736 27,005 4,887 32,421 25,486 4,603 91,059 48,048 539 421 248,205Georgia 181,848 38,657 113,489 403,553 120,432 NR 48,196 210,081 18,101 7,286 1,141,643Louisiana 292,567 4,087 240,495 135,191 87,774 152,613 7,601 NR 99,381 NR 1,019,708Maine 1,325 23,516 310 NR 18,205 NR 27,006 NR NR NR 70,362Maryland 186,355 63,979 156,575 NR 83,541 NR 13,024 NR 1,982 171 505,628Massachusetts 985 13,895 100 NR NR NR 6,302 NR NR 536 21,818Mississippi 353,815 11,900 579,589 265,701 134,910 74,897 12,438 NR 47,345 NR 1,480,596New Hampshire 92 12,640 NR NR NR NR 1,366 NR NR NR 14,097New Jersey 33,030 11,528 32,083 NR 134,908 NR 20,510 NR 249 NR 232,307New York 223,410 507,568 80,909 NR 66,269 NR 64,859 NR 290 NR 943,305N. Carolina 390,998 56,886 559,221 213,054 224,033 NR 47,398 36,057 3,497 68,884 1,600,028Pennsylvania 397,205 429,139 174,576 NR 116,122 NR 22,192 NR 1,278 3,194 1,143,706Rhode Island 17 1,653 NR NR NR NR 964 NR NR NR 2,634S. Carolina 150,886 13,392 179,197 64,110 64,032 NR 10,453 22,814 2,428 8,134 515,446Tennessee 316,146 52,565 395,284 204,143 104,447 937 11,650 NR 4,093 8,144 1,300,617Vermont 2,174 87,403 814 NR 279 NR 1,156 NR NR NR 91,827Virginia 162,433 126,295 198,610 23,993 96,571 NR 10,637 8,761 NR 8,457 635,758Crop total 3,132,377 1,525,511 3,993,913 1,843,142 1,641,171 769,817 428,228 389,923 269,331 106,493
yNR, None reported
SECTION2
Agric
ultu
ralManagement
26

CHAPTER 3Cropland Management in the Eastern United States
27
materials (Daniels et al., 1999). The average precipitation is 940e1525 mm yr�1
(increasing north to south). Average temperatures range from 9 to 18�C (also increasing
north to south), with the average number of frost-free days ranging from 185 to 275
(USDA, 2006).
The Appalachian Ridge and Valleys extend from northern Alabama through central Pennsyl-
vania (Figure 3.1). Parallel ridges of limestone, shale, and sandstone are separated by narrowto moderately wide valleys that range from nearly level to rolling hills. Soils are typically
shallow on ridges, but can be deep and productive in larger valleys. Valley soils are classified as
Inceptisols, Alfisols, and Ultisols with loamy or clayey textures and drainage typically rangingfrom excessively drained to moderately well drained. Croplands occupy approximately 15% of
the Ridge and Valley landscape. Average precipitation is 800e1300mm yr�1, with maximum
precipitation from late winter to early summer. Average temperatures are 11e17�C in thesouthern portion and 7e14�C in the north, with an average of 205 frost-free days in the south
and 180 days in the north (USDA, 2006).
Much of northern Pennsylvania and New York lies on the glaciated Appalachian Plateau
(Figure 3.1). Soils are primarily formed from glacial till and outwash (April et al., 1986).
Soils that formed on semi-stable plateaus are classified as Inceptisols or Alfisols, with loamytexture. These soils range from shallow to moderately deep with drainage ranging from well
to very poorly drained. Soils in the outwash areas are classified as Entisols, Inceptisols, or
Spodosols, and can be well to excessively well drained especially if the texture is dominatedby sands (April et al., 1986). Cropland is typically found on broad plateau tops which are
nearly level to moderately sloping and dissected by narrow, steep-walled valleys. Approxi-
mately 17% of the land area on the Appalachian Plateau is used for crop production (USDA,2006). It should be noted that the large amount of rock material on the till surface and in the
profile of glacial soils make agricultural production difficult; extremely rocky lands are left
for forestry production. Average precipitation is 760e1200 mm y�1, with a large portion assnowfall. The average temperature is 4e10�C, with an average of 165 frost-free days per year
(USDA, 2006).
The New England physiographic province (Figure 3.1) comprises the northern-most portionof the eastern United States and is a portion of the Appalachian Highlands. Over 80% of New
England is mountainous and forested, with less than 4% of the land used for cropproduction. The greatest portion of the cultivated land is on gently rolling uplands and
coastal lowlands. The dominant cultivated soils are Entisols and Inceptisols formed from
glacial till and outwash. The average precipitation is 850e1400mm y�1. The averagetemperature is 6e12�C in the southern portion of the region and 4e9�C in the north, with an
average of 190 frost-free days in the south decreasing to 160 days in the north portion of
the region.
CROPLAND MANAGEMENT IN THE EASTERN U.S.The 2007 Census of Agriculture (USDA-NASS, 2007) provided the most recent state-by-statelisting of land area devoted to the production of major crops (Table 3.1). Corn is the most
commonly grown crop throughout the eastern U.S., with approximately 4.6 and 1.5 Mha
grown for grain and silage, respectively. A majority of the corn is harvested for grain in themid-Atlantic and southeastern states, while much of the corn in the northeastern states
(generally grown in rotation with multiple years of alfalfa) is harvested for silage. Soybean
is the second most widely grown crop in the eastern U.S. (approximately 4 Mha) andaccounted for the greatest cropland area in several states (Arkansas, Mississippi, North
Carolina, South Carolina, Tennessee, and Virginia). Cotton production in the southeastern
states accounted for approximately 1 Mha. Approximately 1.6 Mha were used for smallgrain production throughout the region. Other major crops included rice (770,000 ha),

TABLE 3.2 Use of Conservation Tillage for Major Crops in Eastern U.S. States where Data are Availabley
Crop/stateHectaresplanted
Conservationtillagez
Reducedtillagex
Conventionaltillage{ No-till#
No-till with >30%residue cover
percent of hectares percent of hectares
Corn (2005)
Georgia 109,102 59 9 31 32 29New York 399,941 8 8 84 2 2North Carolina 303,027 60 11 29 57 54Pennsylvania 545,393 43 25 32 41 40
Cotton (2007)
Alabama 161,622 48 21 30 40 35Arkansas 347,529 12 5 83 9 9Georgia 416,086 41 16 43 38 27Louisiana 135,428 7 7 87 5 5Mississippi 266,673 19 3 78 20 19North Carolina 202,019 56 15 29 57 46South Carolina 72,753 47 11 41 48 45Tennessee 208,024 65 17 17 80 65
Soybeans (2006)
Arkansas 1,249,220 26 8 66 15 14Louisiana 351,480 32 12 56 26 25Mississippi 674,680 41 14 46 35 35North Carolina 553,480 60 31 10 73 55Tennessee 463,687 83 5 12 74 72Virginia 210,080 93 3 4 82 81
ySource: Horowitz et al. (2010).z>30% residue cover on soil surface.x15e30% residue cover on soil surface.{<15% residue cover on soil surface.#Defined as no-inversion tillage or other mechanical disturbance of the soil.
SECTION 2Agricultural Management
28
peanut (Arachis hypogea L.) (390,000 ha), sugarcane (Saccharium officinarum L.)(318,000 ha), grain sorghum (Sorghum bicolor Moench) (270,000 ha), and tobacco
(106,000 ha). A wide range of vegetables, including potato (Solanum tuberosum L.), are also
grown throughout the eastern states, with production of all vegetables accounting forapproximately 430,000 ha.
No-till and other conservation tillage (>30% residue cover) and reduced tillage (15e30%residue cover) are used to varying extents within eastern states. While annual data for tillage
practices for all major crops in each state are not available, the USDA-Economic Research
Service estimates (Horowitz et al., 2010) are available for selected states in years that surveydata were obtained for a specific crop (Table 3.2). For corn (last estimated in 2005), conser-
vation tillage usage was as high as 60% in North Carolina and as low as 2% in New York. The
low rate of adoption of conservation tillage in New York and the New England states has beenattributed to slower warming of soils under residue cover and subsequent impacts on crop
establishment in the spring (P. Salon, personal communication). Estimates of tillage usage for
cotton production in 2007 (Table 3.2) also indicate large differences among states. Conser-vation tillage was used on approximately 60% of the acreage in North Carolina and Tennessee
and only 10% of the land in Arkansas and Louisiana. Soybean production with conservation
tillage (estimated in 2006) ranged from as much as 93% of the acreage in Virginia to 26% inArkansas.

CHAPTER 3Cropland Management in the Eastern United States
29
Poultry, dairy, swine, and beef production are important throughout the eastern U.S., andland application of manure from confined animal operations is a significant C input to
soils on many farms throughout the region (Table 3.3). North Carolina, New York, and
Pennsylvania produce the greatest quantities of manure in the region (approximately900,000Mg C y�1, each, in 1997). With the exception of Connecticut and Vermont, annual
statewide manure C production would be �0.6 Mg C ha�1 on available cropland assuminguniform distribution (which does not occur), even in the states with the greatest manure
production (Table 3.3). Since only a portion of the manure C will be resistant to degra-
dation and contribute to the formation of stable organic matter in soil, the quantities ofmanure produced limits the total impact of manure application on C sequestration
throughout states within the region. However, ample manure is available for land appli-
cation in areas with concentrated livestock production and can contribute substantially toSOC sequestration. Application of manure at a rate sufficient to provide the N requirement
for a corn crop (145e180 kg N ha�1) typically requires 50,000e80,000 L ha�1 of liquid
dairy or swine manure, 15e25Mg of beef manure ha�1, or 2e4Mg ha�1 of chicken litter[fresh weight basis, Penn State University Agronomy Factsheet 55 (online at http://cropsoil.
psu.edu/extension/facts/agfact55.pdf)]. Assuming that manure solids and any included
bedding materials are 40% C, these application rates represent a C addition to soil of1.0e1.6 Mg C ha�1 for liquid dairy manure (assuming 5% dry matter), 1.8e3.0 Mg C ha�1
for beef manure (assuming 30% dry matter), 1.25e2.0 Mg C ha�1 for swine slurry
(assuming 2.5% dry matter), and 0.3e0.5 Mg C ha�1 with poultry litter (assuming 34% drymatter).
Cover crops are used throughout the eastern U.S. to reduce soil erosion and nutrient losses,
and they contribute biomass that can potentially lead to greater sequestration of C in soils.The use of cover crops can be especially beneficial following crops that leave limited
quantities of residues on the soil surface (i.e. soybean, cotton, and corn harvested for
silage). However, comprehensive data on the extent of eastern U.S. cropland planted tocover crops and the type of cover crop used are not available. A recent program in Mary-
land, as part of that state’s efforts to improve water quality in the Chesapeake Bay, has
provided financial incentives to farms planting winter cover crops. This resulted in theplanting of a state record 161,066 ha of winter cover crops in the fall of 2010 (Maryland
Department of Agriculture, 2010).
SYNTHESIS OF PUBLISHED FINDINGSResults of Previously Reported Research
An earlier review (Franzluebbers, 2005) addressing SOC sequestration potential for cropland
in the southeastern U.S. indicated that cropland management had a variable impact on SOC
storage. For 96 comparisons at 22 locations with 5 to15 years of NT, an average of0.41�0.46Mg SOC ha�1 yr�1 (mean� standard deviation) was sequestered in response to
the use of NT compared to CT. With an additional 51 comparisons of SOC on conventional
and conservation-tillage cropland in the region, SOC sequestration rate was revised to0.45� 0.04Mg C ha�1 yr�1 (mean� standard error) at a sampling depth of 20�1 cm and
11�1 y of duration (Franzluebbers, 2010). Soil organic C sequestration rate in studies with
cover crops (0.55� 0.06Mg C ha�1 y�1, n¼ 87), summarized by Franzluebbers (2005), wasgreater than without cover crops (0.30� 0.05Mg C ha�1 y�1, n¼ 60). Impacts of manure
application on SOC sequestration reported in Franzluebbers (2005) were unclear, with an
average increase of 0.26� 2.15Mg SOC ha�1 yr�1 with manure (19 comparisons). When onlymanure application studies longer than 2 years were considered (7 studies), manure additions
increased the SOC sequestration rate by 0.72� 0.67Mg ha�1 yr�1. In contrast, an estimated
SOC sequestration rate of �0.07�0.27Mg ha�1 yr�1 with conversion from CT to NT wasreported for the northeastern U.S. and eastern Canada by Franzluebbers and Follett (2005).
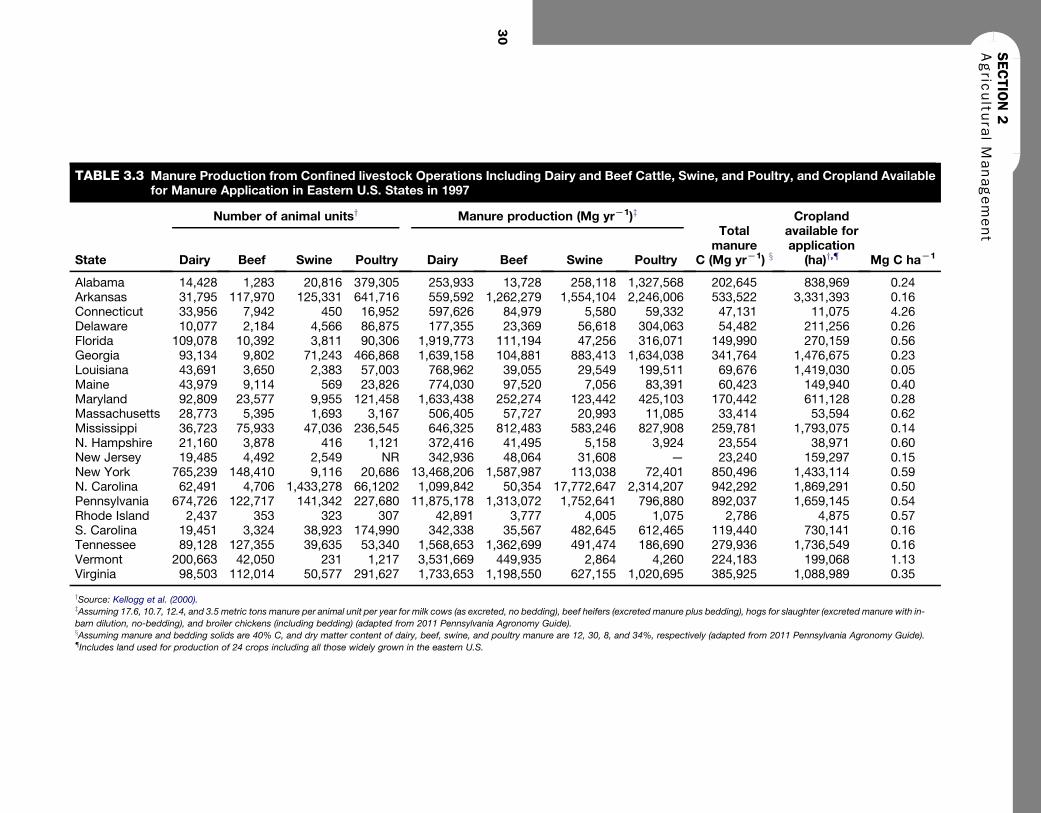
TABLE 3.3 Manure Production from Confined livestock Operations Including Dairy and Beef Cattle, Swine, and Poultry, and Cropland Availablefor Manure Application in Eastern U.S. States in 1997
Number of animal unitsy Manure production (Mg yrL1)z
Totalmanure
C (Mg yrL1) x
Croplandavailable forapplication
(ha)y,{ Mg C haL1State Dairy Beef Swine Poultry Dairy Beef Swine Poultry
Alabama 14,428 1,283 20,816 379,305 253,933 13,728 258,118 1,327,568 202,645 838,969 0.24Arkansas 31,795 117,970 125,331 641,716 559,592 1,262,279 1,554,104 2,246,006 533,522 3,331,393 0.16Connecticut 33,956 7,942 450 16,952 597,626 84,979 5,580 59,332 47,131 11,075 4.26Delaware 10,077 2,184 4,566 86,875 177,355 23,369 56,618 304,063 54,482 211,256 0.26Florida 109,078 10,392 3,811 90,306 1,919,773 111,194 47,256 316,071 149,990 270,159 0.56Georgia 93,134 9,802 71,243 466,868 1,639,158 104,881 883,413 1,634,038 341,764 1,476,675 0.23Louisiana 43,691 3,650 2,383 57,003 768,962 39,055 29,549 199,511 69,676 1,419,030 0.05Maine 43,979 9,114 569 23,826 774,030 97,520 7,056 83,391 60,423 149,940 0.40Maryland 92,809 23,577 9,955 121,458 1,633,438 252,274 123,442 425,103 170,442 611,128 0.28Massachusetts 28,773 5,395 1,693 3,167 506,405 57,727 20,993 11,085 33,414 53,594 0.62Mississippi 36,723 75,933 47,036 236,545 646,325 812,483 583,246 827,908 259,781 1,793,075 0.14N. Hampshire 21,160 3,878 416 1,121 372,416 41,495 5,158 3,924 23,554 38,971 0.60New Jersey 19,485 4,492 2,549 NR 342,936 48,064 31,608 — 23,240 159,297 0.15New York 765,239 148,410 9,116 20,686 13,468,206 1,587,987 113,038 72,401 850,496 1,433,114 0.59N. Carolina 62,491 4,706 1,433,278 66,1202 1,099,842 50,354 17,772,647 2,314,207 942,292 1,869,291 0.50Pennsylvania 674,726 122,717 141,342 227,680 11,875,178 1,313,072 1,752,641 796,880 892,037 1,659,145 0.54Rhode Island 2,437 353 323 307 42,891 3,777 4,005 1,075 2,786 4,875 0.57S. Carolina 19,451 3,324 38,923 174,990 342,338 35,567 482,645 612,465 119,440 730,141 0.16Tennessee 89,128 127,355 39,635 53,340 1,568,653 1,362,699 491,474 186,690 279,936 1,736,549 0.16Vermont 200,663 42,050 231 1,217 3,531,669 449,935 2,864 4,260 224,183 199,068 1.13Virginia 98,503 112,014 50,577 291,627 1,733,653 1,198,550 627,155 1,020,695 385,925 1,088,989 0.35
ySource: Kellogg et al. (2000).zAssuming 17.6, 10.7, 12.4, and 3.5 metric tons manure per animal unit per year for milk cows (as excreted, no bedding), beef heifers (excreted manure plus bedding), hogs for slaughter (excreted manure with in-
barn dilution, no-bedding), and broiler chickens (including bedding) (adapted from 2011 Pennsylvania Agronomy Guide).xAssuming manure and bedding solids are 40% C, and dry matter content of dairy, beef, swine, and poultry manure are 12, 30, 8, and 34%, respectively (adapted from 2011 Pennsylvania Agronomy Guide).{Includes land used for production of 24 crops including all those widely grown in the eastern U.S.
SECTION2
Agric
ultu
ralManagement
30

CHAPTER 3Cropland Management in the Eastern United States
31
However, because data for the northeastern U.S. were not available, that estimate was derivedonly from research conducted in eastern Canada (Gregorich et al., 2005)
Recent Information from the Southeastern U.S.
Recent studies reporting SOC changes in response to adoption of NT in the southeastern U.S.
croplands (Table 3.4) are consistent with the previous estimate for the region (Franzluebbers,
2005). For 37 comparisons of CT and NT with an average duration of 9 years, the SOCsequestration rate was 0.58� 0.71 Mg C ha�1 y�1(mean� standard deviation). Because
initial SOC masses were not always reported, sequestration rates were calculated as the
difference in SOC mass between NT and CT at the final sampling divided by the durationof the conservation practice. The variation in sequestration among sites may be a reflection of
differences in the capacities of individual soils to protect and retain organic matter, but is also
likely influenced by crop species and management as well as variability in experimentaldesign including factors such as length of experiment, sampling depth, and numbers of
samples obtained.
Soil organic C sequestration rates determined from two extensive field surveys were consistentwith rates estimated by Franzluebbers (2005). When sampling 63 sites to 15 cm depths on the
Coastal Plain of Virginia, Spargo et al. (2008) showed a positive sequestration of
0.31�0.28Mg SOC ha�1 yr�1 (mean� standard deviation) with NT. Half of the sites studiedhad histories of biosolid application. The sequestration rate with NT for fields receiving
biosolids was 0.48� 0.34Mg SOC ha�1 yr�1, while the rate for fields without biosolid
application was 0.11�0.35Mg SOC ha�1 yr�1. An on-farm study with 87 sites across thePiedmont and Coastal Plains of Alabama, Georgia, North Carolina, South Carolina, and
Virginia (Causarano et al., 2008) showed an average sequestration rate of0.52� 0.59Mg C ha�1 yr�1 with no distinct differences among states or geophysical province.
Average SOCmass in the upper 20 cm of soil was 38.9, 27.9, and 22.2 Mg SOC ha�1 in pasture,
NT, and CT, respectively. Management explained 41.6% of the variation in SOC, while surfacehorizon clay content explained 5.2%, and mean annual precipitation accounted for only 1%
of the variation.
Soil C accumulation with conservation tillage systems that employ some tillage, but retain>30% surface cover, has been studied to a lesser extent than with strict NT. Novak et al. (2009)
measured SOC content in a comparison of disk tillage (2 passes, 15 cm deep) with conser-
vation tillage (paratill subsoiling to 40 cm deep and NT planting) across a field in the SouthCarolina Coastal Plain that was under a cotton/corn rotation. Sampling soils by depth across
the field (Figure 3.2) showed that 8 years of conservation tillage led to a 49% increase in SOC
in the 0e3 cm depth (1.0 Mg ha�1, significant at P� 0.05). On the other hand, SOC contentsin 3e15 cm depth declined under conservation tillage by 26% (2.8Mg ha�1, significant at
P� 0.05). While data indicate that minimal residue incorporation into soil with conservation
tillage induced SOC stratification, the mixing of crop residues with disk tillage resulted in littlechange between initial and final SOC contents in either depth increment. A statistically
significant reduction in SOC contents in the subsurface (20e25 cm) with NT in Minnesota has
also been reported (Dolan et al., 2006).
A limited number of other reports for conservation tillage systems in the southeast have
shown net SOC accumulation. A comparison of CT, NT, NT planting with paratill (subsoilingto 40e50 cm) and paratill with disking conducted on the Alabama Coastal Plain (Siri-Prieto
et al., 2007) indicated that using both NT and NT with paratill increased SOC concentration
in the 0e5 cm depth by approximately 20% over 3 years (no significant change with CT andparatill with disking). However, in the 5e10 cm depth, SOC concentrations for the paratill
with NT planting treatment increased slightly over initial SOC concentration while
concentration did not change with time when NT was used. When CT, NT, and strip-till(subsoiled to 35 cm in 30 cm-wide strip) were compared in Georgia, Sainju et al. (2006)
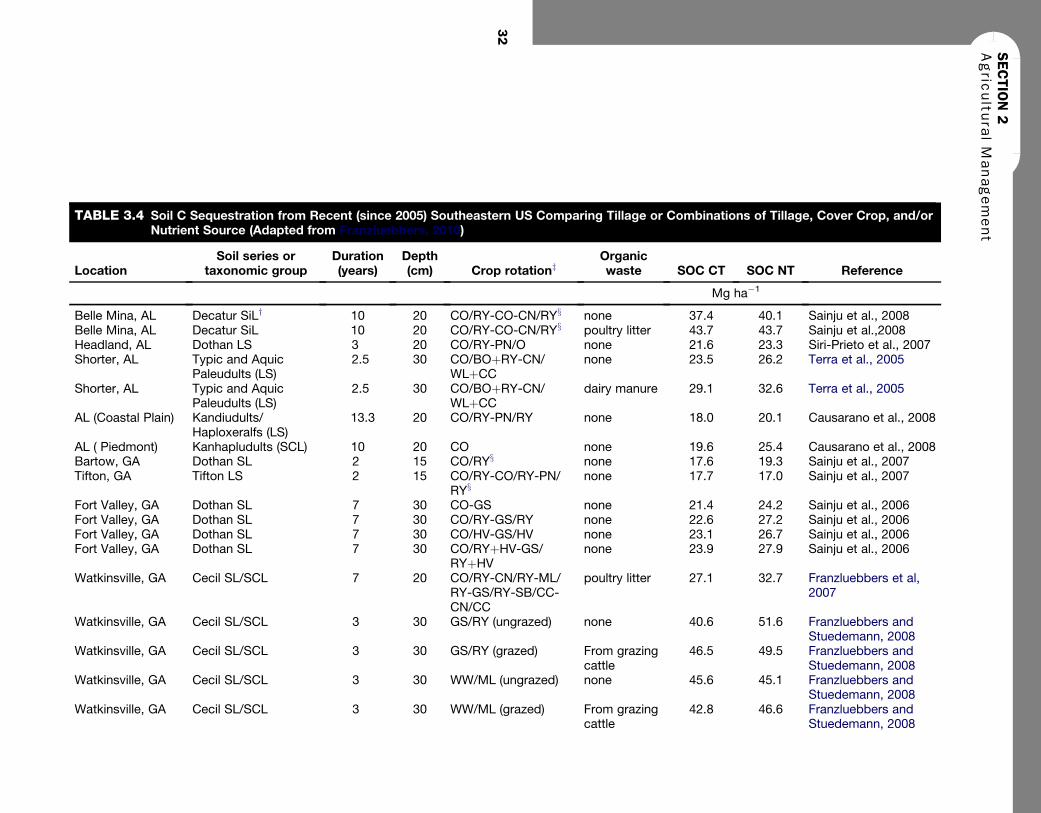
TABLE 3.4 Soil C Sequestration from Recent (since 2005) Southeastern US Comparing Tillage or Combinations of Tillage, Cover Crop, and/orNutrient Source (Adapted from Franzluebbers, 2010)
LocationSoil series or
taxonomic groupDuration(years)
Depth(cm) Crop rotationz
Organicwaste SOC CT SOC NT Reference
Mg ha�1
Belle Mina, AL Decatur SiLy 10 20 CO/RY-CO-CN/RYx none 37.4 40.1 Sainju et al., 2008Belle Mina, AL Decatur SiL 10 20 CO/RY-CO-CN/RYx poultry litter 43.7 43.7 Sainju et al.,2008Headland, AL Dothan LS 3 20 CO/RY-PN/O none 21.6 23.3 Siri-Prieto et al., 2007Shorter, AL Typic and Aquic
Paleudults (LS)2.5 30 CO/BOþRY-CN/
WLþCCnone 23.5 26.2 Terra et al., 2005
Shorter, AL Typic and AquicPaleudults (LS)
2.5 30 CO/BOþRY-CN/WLþCC
dairy manure 29.1 32.6 Terra et al., 2005
AL (Coastal Plain) Kandiudults/Haploxeralfs (LS)
13.3 20 CO/RY-PN/RY none 18.0 20.1 Causarano et al., 2008
AL ( Piedmont) Kanhapludults (SCL) 10 20 CO none 19.6 25.4 Causarano et al., 2008Bartow, GA Dothan SL 2 15 CO/RYx none 17.6 19.3 Sainju et al., 2007Tifton, GA Tifton LS 2 15 CO/RY-CO/RY-PN/
RYxnone 17.7 17.0 Sainju et al., 2007
Fort Valley, GA Dothan SL 7 30 CO-GS none 21.4 24.2 Sainju et al., 2006Fort Valley, GA Dothan SL 7 30 CO/RY-GS/RY none 22.6 27.2 Sainju et al., 2006Fort Valley, GA Dothan SL 7 30 CO/HV-GS/HV none 23.1 26.7 Sainju et al., 2006Fort Valley, GA Dothan SL 7 30 CO/RYþHV-GS/
RYþHVnone 23.9 27.9 Sainju et al., 2006
Watkinsville, GA Cecil SL/SCL 7 20 CO/RY-CN/RY-ML/RY-GS/RY-SB/CC-CN/CC
poultry litter 27.1 32.7 Franzluebbers et al,2007
Watkinsville, GA Cecil SL/SCL 3 30 GS/RY (ungrazed) none 40.6 51.6 Franzluebbers andStuedemann, 2008
Watkinsville, GA Cecil SL/SCL 3 30 GS/RY (grazed) From grazingcattle
46.5 49.5 Franzluebbers andStuedemann, 2008
Watkinsville, GA Cecil SL/SCL 3 30 WW/ML (ungrazed) none 45.6 45.1 Franzluebbers andStuedemann, 2008
Watkinsville, GA Cecil SL/SCL 3 30 WW/ML (grazed) From grazingcattle
42.8 46.6 Franzluebbers andStuedemann, 2008
SECTION2
Agric
ultu
ralManagement
32

GA (Coastal Plain) Plinthic Kaniudlts (LS) 15.3 20 CO-PN/WW-SB/RY none 16.7 21.5 Causarano et al., 2008GA ( Piedmont) Kanhapludults (SL) 8.3 20 GS/WW-SB-CO/O none 26.7 27.5 Causarano et al., 2008Harmony, NC Fairview SCL/
Braddock L7 20 CN/BL (silage) Dairy manure 33.5 36.6 Franzluebbers and
Brock, 2007Harmony, NC Fairview SCL/
Braddock L7 20 CN/RY (silage) Dairy manure 33.5 33.1 Franzluebbers and
Brock, 2007Harmony, NC Fairview SCL/
Braddock L7 20 CN/BL-SG/RY (silage) Dairy manure 33.5 39.1 Franzluebbers and
Brock, 2007NC (Coastal Plain) Quartzsamments/
Kandiudults (LS)7.5 20 CO-CO/RY-SB/WW none 18.2 33.6 Causarano et al., 2008
NC (Piedmont) Kanhapludults (SCL) 12.7 20 PN/WW-CO/WW-SB/CC
none 25.0 32.6 Causarano et al., 2008
Florence, SC Norfolk LS 25 7.6 CO-WW/SB-CO none 10.1 20.3 Bauer et al., 2006Florence, SC Norfolk LS 24 15 CO-WW/SB-CO none 20.6 31.4 Novak et al., 2007SC (Coastal Plain) Kaniudults/
Kanhapludults (LS)16 20 CO-SB none 24.8 25.3 Causarano et al., 2008
SC (Piedmont) Typic Kanhapludults(SCL)
14.7 20 CO-SB/WW-ML none 22.2 26.5 Causarano et al., 2008
VA (Coastal Plain) Altavista SL 14 15 CO-WW/SB none 15.9 21.9 Spargo et al., 2008VA (Coastal Plain) Altavista SL 9 15 CO-WW/SB biosolids 20.2 22.9 Spargo et al. , 2008VA (Coastal Plain) Bojac LfS 3 15 CO-WW/SB none 14.1 13.3 Spargo et al. , 2008VA (Coastal Plain) Bojac LfS 9 15 CO-WW/SB biosolids 16.7 19.1 Spargo et al. , 2008VA (Coastal Plain) Emporia LfS 11 15 CO-WW/SB none 17.2 19.3 Spargo et al. , 2008VA (Coastal Plain) Emporia LfS 11 15 CO-WW/SB biosolids 20.2 29.9 Spargo et al. , 2008VA (Coastal Plain) Hapludults (SL) 13.3 20 CO-WW/SB none 20.4 31.4 Causarano et al., 2008VA (Piedmont) Kanhapludults/
Kandiudults (L)9 20 SB-CO/WW none 27.7 29.9 Causarano et al., 2008
Mean � std. dev. 8.8 � 5.6 21 � 6 25.4� 9.4 29.6� 9.4
ySoil texture abbreviations: LfS, loamy fine sand; LS, loamy sand; S, sand; SCL, sandy clay loam; SL, sandy loam; SiL, silt loam.zCrop abbreviations: BL, barley; BO, black oat; CC, crimson clover; CN, corn; CO, cotton; FR, forage radish; GS, grain sorghum; HV, hairy vetch; ML, millet; O, oats; PN, peanut; RY, annual rye grass; SB,
soybean; SG, small grain (wheat or barley); WL, white lupine; WW, winter wheat.xMean includes treatments both with and without rye cover crop, because no significant effect on SOC of using cover crop.
CHAPTER3
Cro
plandManagementin
theEaste
rnUnite
dSta
tes
33

FIGURE 3.2Median SOC contents (n¼ 50) in topsoil after 8 years of conservation and disk tillage under a corn/cotton rotation atFlorence, South Carolina, indicated SOC gains in the upper 3 cm were offset by declining content in the 3e15 cmdepth. Linear regression lines indicate the trend in SOC with time within each depth (solid lines for conservation tillage, dashedlines for disk tillage). The symbol (*) indicates that the tillage treatments are significantly different (P� 0.05, Mann-Whitney
rank sum test) within a depth increment for a given year. (Adapted from Novak et al., 2009.)
SECTION 2Agricultural Management
34
observed similar rates of SOC gain with strip-till and NT (0.61�0.47 vs. 0.54Mg ha�1 y�1)compared to CT. In a separate study in Alabama, Sainju et al. (2007) found that, wheninorganic fertilizers were used, mulch till (rotary harrowing to 5e7 cm) led to an increase of
4.0Mg SOC ha�1 over 10 years, while NT resulted in an increase of 1.5Mg SOC ha�1 and
1.2Mg SOC ha�1 was lost with CT (moldboard plow/disk/field cultivator). However, whenthe fertility source was poultry litter the 10-year increase in SOC was similar for the three
tillage systems (4e5Mg ha�1).
While winter cover crops were used in a large number of the studies cited in Table 3.4, onlythree studies included comparisons to no-cover crop controls. Sainju et al. (2006) reported
that rye (Secale cereal L.), hairy vetch (Vicia villosa) and rye/vetch mixtures as cover crops led to
greater SOC in both CT and NT in a study conducted in Georgia. Hairy vetch/rye mixturesresulted in the greatest increase. In CT, SOC increased by about 0.8, 1.6, and 2.4 Mg ha�1,
relative to using no cover crop, with rye, hairy vetch, and the mixture during the 7-year study.
In NT, SOC was 2.4, 1.9, and 2.6 Mg ha�1 greater than the control for rye, vetch, and themixture. Conversely, cover crop use did not affect SOC mass in studies conducted in Alabama
(Sainju et al., 2008) and Georgia (Sainju et al., 2007) despite significant increases in biomass
inputs.
The impact of applying manures and other organic amendment on SOC sequestration remains
unclear, but data suggest there may be an interaction between NT use and manure addition.Biosolid applications on the Virginia Coastal Plain (Spargo et al., 2008) resulted in greater
SOC accumulations in the upper 15 cm compared to unamended fields with both CT and NT
(3.3� 0.9 and 5.8� 4.8Mg ha�1 for CT and NT). Sainju et al. (2008) found that poultry litterapplication over a 10-year period added approximately 0.3 Mg SOC ha�1 yr�1 to the upper
20 cmwith NT, mulch till, and CT. Watts et al. (2010) reported that the combination of NT and
poultry litter application (sufficient to supply 170 kg N ha�1 in corn or 45 kg P ha�1 insoybean) for 14 years to continuous corn and continuous soybean in northeastern Alabama

CHAPTER 3Cropland Management in the Eastern United States
increased SOC concentration in the 0e5 cm depth by 170 and 104%. The use of NT withinorganic fertilizer increased SOC contents in the 0e5 cm depth by 110% with corn, but did
not affect SOC in soybean. With CT, poultry litter application increased SOC in corn plots by
40% but did not affect SOC concentration when applied to soybean plots. Neither NT norpoultry litter impacted SOC concentration in the 5e10 or 10e20 cm depth. Adeli et al. (2007)
also observed an apparent interaction of NT and poultry litter application on SOC seques-tration in cotton fields on two farms in central Mississippi that had soils with similar texture
and initial organic matter concentrations. On the farm using NT, 0.6Mg SOC ha�1 yr�1 was
sequestered in the upper 15 cm with annual application of 4.5 Mg ha�1 of broiler litter and asmuch as 1.6 Mg SOC ha�1 yr�1 added with 6.5Mg ha�1 litter and supplemental inorganic N.
Soil organic C on the farm using CT was unchanged by broiler litter applications.
A limited number of studies from the southern U.S. have documented soil quality improve-ment in response to greater accumulation of SOC with the adoption of conservation practices.
In their survey of sites across Coastal Plain and Piedmont of several states, Causarano et al.
(2008) observed greater aggregate stability and a greater proportion of larger soil aggregateswith NT than with CT, suggesting improved soil structure, aeration, and resistance to erosion.
They also found a close correlation between total SOC, microbial biomass C, and potentially
mineralized C, suggesting enhanced microbial activity and nutrient cycling with increasingSOC. Franzluebbers and Stuedemann (2008) also observed 2e3-fold increases in microbial
biomass and potentially mineralized C with NT compared to CT.
35
Northeastern U.S.
Reports of management impacts on SOC sequestration in northeastern U.S. croplands are
very limited, and findings from replicated plot studies that have been specifically designed tofollow soil C dynamics are not available. In an on-farm study, Dell et al. (2008) sampled
soils from a common series (Hagerstown silt loam) on several farms in the State College, PA,
area where CT and NT had been used with silage corn/alfalfa rotations, with and without ryecover crops. They found an average of 51% greater mineral-associated C in the upper 5 cm of
fields where NT had been used, but they observed similar accumulations in the 5e10 cm
depths and upper Bt horizons of all fields. The difference in mineral-associated andparticulate soil C between NT and CT fields suggested a sequestration rate of about
0.5 Mg ha�1 yr�1 with NT. However, the study used neither repeated measurements nor
comparison of paired fields, and a true measure of sequestration was not determined. Therewas no detectable effect of cover crop usage, possibly because of the reported poor estab-
lishment of rye in many years due to unfavorable weather. In a long-term plot study
(25 years) conducted near State College, PA, Duiker and Beegle (2006) reported soil organicmatter (SOM) concentrations, determined by loss on ignition, that were 72 and 32% greater
in the upper 25 cm with NT compared to moldboard plow/disk and chisel/disk systems.
Concentration of SOM was very similar in the 5e10 and 10e15 cm depths of NT andmoldboard plowed soils, but SOM was 10 to 20% greater in the 5e10 and 10e15 cm layer
with chisel tillage compared to either NT or moldboard tillage.
Blanco-Canqui and Lal (2008) and Chatterjee and Lal (2009) reported paired comparisons of
CT and NTon several farms throughout Pennsylvania, along with farms in Ohio and Kentucky.
They generally observed greater SOC concentration in the upper 10 cm of soil with NTcompared to CT and estimated SOC sequestration rates to a 60 cm depth for NT ranging
from�2.95 to 4.94Mg ha�1 y�1, but no statistically significant differences (P� 0.05) could be
detected between CT and NT for the entire 60 cm soil profiles on any of the farms. However,Kravchenko and Robertson (2011) showed that the amount of replication reported by
Blanco-Canqui and Lal (2008) provided low statistical power and was insufficient to support
hypothesis testing. The probability of verifying an SOC change of 10% was �10% in all depthincrements and the probably of verifying even a 100% change in SOC was only about 50% in

SECTION 2Agricultural Management
36
the 50e60 cm depth. Kravchenko and Robertson (2011) stressed caution when drawingconclusions about whole-profile SOC changes in cases where high variability at deeper depth
masks the identification of significant changes near the soil surface.
Detection of statistically significant impacts of cropland management on SOC sequestration is
complicated by the measurement error resulting from spatial variation in SOC concentrations
and is dependent on adequate sampling replication (Kravchenko and Robertson, 2011). In theuneven and sloping terrain of the Piedmont, Ridge and Valley, Appalachian Plateau, and New
England Uplands, SOC can vary greatly over even short distances. Dell and Sharpley (2006)
observed a high degree of spatial variation in SOC concentration in the surface soils (0e5 cm)across a small watershed in the Ridge and Valley Province of central Pennsylvania. Using
geostatistical analysis, they determined that soil sampling was required at 10m or closer
intervals to adequately capture the range of spatial variation within fields in that landscape.Observed coefficients of variation for individual fields, sampled at 30m intervals, indicated
that 2- to 5-fold more samples were needed to statically verify changes in SOC that were less
than 10% of the original mean.
CARBON SEQUESTRATION POTENTIAL IN THE REGIONSoutheastern U.S.
Available data for the southeastern U.S. indicates that, on average, adoption of NT can be
expected to sequester approximately 0.5 Mg SOC ha�1 yr�1 for 10 to 20 years after the elimi-nation of tillage. However, deviation in estimated sequestration rates is sufficiently wide to
include some systems where no net accumulation of SOC is achieved, as well as soils with
substantially greater sequestration. Data are not sufficient to estimate sequestration rates forconservation tillage systems that utilize some tillage, especially considering the wide range of
field operations that are used. Estimates of sequestration potential with the use of cover crops
and manure application are also difficult to determine because of high variability amongstudies and the wide range of practices used.
Northeastern U.S.
Soil carbon sequestration potential in the northeastern U.S. is difficult to estimate because of
sparse data availability. Limited on-farm data from Pennsylvania showed greater SOC accu-
mulations near the surface in NT fields compared to adjacent CT fields, but sampling has notbeen extensive enough to support calculation of SOC sequestration rates. Moreover, data are
not available to accurately estimate impacts of manure application or cover crop use on SOC in
the region. No-till or other high residue conservation tillage methods have not been widelyadopted in New York and the New England states, contributing to the scarcity of data for the
northeast.
Research Needs
While conversion to NT or use of cover crops is generally expected to result in increased SOC
near the surface, management impacts on SOC below the upper few cm of soil are not as wellestablished. Both sampling depth and sample numbers must be carefully addressed, espe-
cially with diverse soil types, in future studies in order to provide sound information about
management impacts on SOC below the upper few cm of the soil profile and to correctlyestimate whole-profile SOC accumulations. While there has been controversy over appro-
priate sampling depth (Baker et al., 2007), VandenBygaart et al. (2011) evaluated data from
several sites across Canada and determined that sampling to 30 cm was appropriate forcapturing SOC changes. Given rooting depths of commonly grown crops, sampling to 30 cm
also appears appropriate in the eastern U.S. Adequate replication can become increasingly
more important with increasing depth in the soil profile, because SOC concentrationdecreases and spatial variability tends to increase. Therefore, large sample numbers may be

CHAPTER 3Cropland Management in the Eastern United States
37
needed to provide adequate statistical power to evaluate SOC stocks (Kravchenko andRobertson, 2011). Lack of statistically significant effects of management practices on SOC
accumulations have led to conclusions that the practices have no effect. However,
Kravchenko and Robertson (2011) point out the possibility of committing Type II statisticalerrors (concluding no difference when differences are present) when sample numbers are low
and statistical power is limited.
A limited number of studies, such as Novak et al. (2009), have reported that increases in SOC
near the surface with the adoption of NTor other conservation tillage practices can be offset by
statistically significant reductions in SOC lower in the soil profile. A better knowledge of theextent and cause of these atypical responses is needed to strengthen estimates of SOC
sequestration in cropland soils. Longer-term studies are needed to determine if SOC reduc-
tions observed in subsurface layers are short-term responses to changing management or ifthey are sustained over time.
In general, much more information is needed to adequately estimate the potential forincreased SOC sequestration in the northeastern U.S. One limitation to increasing SOC stocks
in croplands of New York and the New England states is little adoption of NT. Research and
education efforts are needed to identify and promote high residue/low disturbance productionmethods that are appropriate for the region. Strip-till and related practices have been successful
in Canada where, like the northeastern U.S., cool spring time soil temperatures are seen as
problematic with conventional NT (Vyn and Raimbault, 1992).
Use of cover crops is generally expected to increase SOC, but impacts of cover crop species and
management remain poorly defined. Mixtures of cover crops may have a greater impact on
SOC than monocultures, but additional research is needed at a greater number of locationswith a wider range of cover crop species and management practices.
Application of organic amendments can have a significant impact on SOC levels, but therelationship between manure management practices and sequestration has not been exten-
sively studied in all regions of the eastern U.S. and with a complete range of organic materials.
Manure management guidelines have changed in recent years to address water qualityimpairment, most notably in the Chesapeake Bay watershed, but it is not known if those
changes have impacted the sequestration of C added with manures. Manure injection is one
technology that offers promise for reducing nutrient transport to surface waters, but research isneeded to determine if it has an impact on the sequestration of manure C in soil.
Vegetables are grown on ~0.5Mha throughout the eastern U.S., but little is known about howmanagement and utilization of conservation practices can impact SOC sequestration in those
systems. Sugarcane and rice are additional crops that are grown extensively in portions of the
region, with limited information concerning sequestration potential. However, more is knownabout SOC losses through subsidence in the southern regions where sugarcane is grown than is
known about rebuilding SOC levels.
Improvements in soil quality and productivity resulting from practices that sequester SOCmeritgreater consideration. Additionally, a better understanding of the impact of reducing erosion,
and subsequent soil organic matter losses from the field, on regional C budgets is needed.
CONCLUSIONS AND RECOMMENDATIONSTopography, soil resources, climate, crops, and production methods vary greatly across the
eastern U.S., and these factors make estimation of SOC sequestration potential complex.Recent data from the southeastern U.S. has generally been consistent with previously
published sequestration rates following adoption of conservation practices in the region
(0.41�0.46Mg SOC ha�1 y�1; Franzluebbers, 2005). This range would encompass the limitednumber of systems where no net gain in SOC occurs. While reductions in SOC at depth with

SECTION 2Agricultural Management
38
conservation tillage do not appear to be the norm, further research is needed to define thecause, extent, and impact of this phenomenon on regional and national SOC sequestration
estimates. To avoid ambiguous results and potentially misleading conclusions, sampling from
ongoing and future SOC monitoring should be obtained to a depth of at least 30 cm andreplication from all sampling depths should be sufficient to provide adequate power for
conclusive statistical testing. In general, much more information is needed to predict SOCsequestration potential with conservation practices in the northeastern U.S.
Reducing soil erosion remains the primary benefit of conservation tillage and NT, regardless of
the potential for SOC sequestration with these practices. Controlling erosion and subsequentredistribution of SOC is essential to maintain productivity of soil resources. Sequestration of
SOC and mitigation of climate change are valuable “side” benefits of NT and other conser-
vation tillage systems, but even in situations where conservation practices do not result in a netgain in SOC, agronomic and environmental benefits of controlling soil erosion remain
compelling reasons for the use of the practices.
The combined use of NT and cover crops and the applications of manures or other C-rich
organic amendments to a broader land base represent the best potential for increased SOC
sequestration in eastern U.S. cropland soils. The greatest sequestration is likely to be achievedby conversion of marginally productive croplands to perennial vegetation (see Chapter 5) or,
based on recent reports, by the use of recalcitrant biochars to increase SOC sequestration
(Spokas, 2010; Novak and Busscher, 2011).
ReferencesAdeli, A., Sistani, K.R., Rowe, D.E., Tewolde, H., 2007. Effects of broiler litter application to no-till cotton on selected
soil properties. Soil Sci. Soc. Am. J. 71, 974e983.
April, H.A., Hluchy, M.E., Newton, R.M., 1986. The nature of vermiculite in Adirondack soils and till. Clays ClayMiner 34, 549e556.
Bauer, P.J., Frederick, J.R., Novak, J.M., Hunt, P.G., 2006. Soil CO2 flux from a Norfolk loamy sand after 25 years ofconventional and conservation tillage. Soil Tillage Res. 90, 205e211.
Baker, J.M., Ochsner, T.E., Venterea, R.T., Griffis, T.J., 2007. Tillage and soil carbon sequestrationdwhat do we really
know? Agric. Ecosystem. Environ. 118, 1e5.
Bennett, H.H., Chapline, W.R., 1928. Soil Erosion: A National Menace. United States Department of Agriculture.
Circular 33.
Blanco-Canqui, H., Lal, R., 2008. No-tillage and soil profile carbon sequestration: an on-farm assessment. Soil Sci.
Soc. Am. J. 72, 693e701.
Busscher, W.J., Spivey, L.D., Campbell, R.B., 1987. Estimation of soil strength properties for critical rooting
conditions. Soil Tillage Res. 9, 377e386.
Busscher, W.J., Frederick, J.R., Bauer, P.J., 2001. Effect of penetration resistance and timing of rain on grain yield ofnarrow-row corn in a coastal plain loamy sand. Soil Tillage Res. 63, 15e24.
Busscher, W.J., Schomberg, H., Raper, R.L., 2010. Soil and water conservation in the southeastern United States:
a look at conservation practices past, present and future. In: Zobeck, T.M., Schllinger, W.F. (Eds.), Soil and waterconservation in the United States. Soil Sci. Soc. Am. Spec. Pub. 60, Madison, WI, pp. 183e200.
Campbell, R.B., Reicosky, D.C., Doty, C.W., 1974. Physical properties and tillage of Paleudults in the southeasternCoastal Plains. J. Soil Water Conserv. 29 (5), 220e224.
Causarano, H.J., Franzluebbers, A.J., Reeves, D.W., Shaw, J.N., 2006. Soil organic carbon sequestration in cotton
production systems of the Southeastern United States: a review. J. Environ. Qual. 35, 1374e1383.
Causarano, H.J., Franzluebbers, A.J., Shaw, J.N., Reeves, D.W., Raper, R.L., Wood, C.W., 2008. Soil organic carbon
fractions and aggregation in the Southern Piedmont and Coast Plain. Soil Sci. Soc. Am. J. 72, 221e230.
Chartres, C.J., Kirby, J.M., Raupach, M., 1990. Poorly-ordered silica and aluminosilicates as temporary cementing
agents in hard-setting soils. Soil Sci. Soc. Am. J. 54, 1060e1067.
Chatterjee, A., Lal, R., 2009. On farm assessment of tillage impact on soil carbon and associated soil quality
parameters. Soil Tillage Res. 104, 270e277.
Daniels, R.B., Gamble, E.E., Nelson, L.A., 1967a. Relationship between A2 horizon characteristics and drainage insome fine loamy Ultisols. Soil Sci. 104, 365e369.
CHAPTER 3Cropland Management in the Eastern United States
39
Daniels, R.B., Gamble, E.E., 1967b. The edge effect in some Ultisols in the North Carolina Coastal Plain. Geoderma.1, 117e124.
Daniels, R.B., Buol, S.W., Kleiss, H.J., Ditzler, C.A., 1999. Soil systems in North Carolina. North Carolina State
University, Technical Bullettin 314. NCSU, Raleigh, NC.
Dell, C.J., Sharpely, A.N., 2006. Spatial variation of soil organic carbon in a northeastern U.S. watershed. J. Soil
Water Conserv. 61, 129e136.
Dell, C.J., Salon, P.R., Franks, C.D., Benham, E.C., Plowden, Y., 2008. No-till and cover crop impacts on soil carbon
and associated properties on Pennsylvania dairy farms. J. Soil Water Conserv. 63, 137e142.
Duiker, S.W., Beegle, D.B., 2006. Soil fertility distribution in long-term no-till, chisel/disk and moldboard plow/disk
systems. Soil Tillage Res. 88, 30e41.
Franzluebbers, A.J., 2005. Soil organic carbon sequestration and agricultural greenhouse gas emissions in thesoutheastern USA. Soil Tillage Res. 83, 120e147.
Franzluebbers, A.J., 2010. Achieving soil organic carbon sequestration with conservation agricultural systems in the
southeastern United States. Soil Sci. Soc. Am. J. 347e357.
Franzluebbers, A.J., Brock, B.G., 2007. Surface soil responses to silage cropping intensity on a Typic Kanhapludult in
the Piedmont of North Carolina. Soil Tillage Res. 93, 126e137.
Franzluebbers, A.J., Follett, R.F., 2005. Greenhouse gas contribution and mitigation potential in agricultural regions
of North America: Introduction. Soil Tillage Res. 83, 1e8.
Franzluebbers, A.J., Stuedemann, J.A., 2008. Early response of soil organic fractions to tillage and integrated crop-
livestock production. Soil Sci. Soc. Am. J. 72, 613e625.
Gregorich, E.G., Rochette, P., VandenBygaart, A.J., Angers, D.A., 2005. Greenhouse gas contributions of agriculturalsoils and potential mitigation practices in Eastern Canada. Soil Tillage Res. 83, 53e72.
Horowitz, J., Ebel, R., Ueda, K., 2010. “No-till” farming is a growing practice. USDA-ERS, Economic InformationBulletin, Number 70.
Hunt, P.G., Matheny, T.A., Campbell, R.B., Parsons, J.E., 1982. Ethylene accumulation in southeastern coastal plain
soils: soil characteristics and oxidative-reductive involvement. Comm. Soil Sci. Plant Anal. 13, 267e278.
Hunt, P.G., Matheny, T.A., 1993. Dry matter and nitrogen accumulation in determinant soybean grown on low-
nitrogen soils of the southeastern United States. Comm. Soil Sci. Plant. Anal. 24, 1271e1280.
Hunt, P.G., Karlen, D.L., Matheny, T.A., Quisenberry, V.L., 1996. Changes in carbon content of a Norfolk loamy
sand after 14 years of conservation or conventional tillage. J. Soil Water Conserv. 51, 255e258.
Karlen, D.L., Sadler, E.J., Camp, C.R., 1987. Dry matter, nitrogen, phosphorus, and potassium accumulation rates by
corn on Norfolk loamy sand. Agron. J. 79, 649e656.
Kellogg, R.L., Lander, C.L., Moffitt, D.C., Gollehon, N., 2000. Manure nutrients relative to the capacity of croplandand pastureland to assimilate nutrients (2000). USDA-NRCS-ERS nps00e0579 at <http://www.nhq.nrcs.usda.
gov/land/index/publication.html>
Kleiss, H.J., 1994. Relationship between geomorphic surfaces and low activity clay on the North Carolina coastalplain. Soil Sci. 157, 373e378.
Kravchenko, A.N., Robertson, G.P., 2011. Whole-profile soil carbon stocks: the danger of assuming too much fromanalyses of too little. Soil Sci. Soc. Am. J. 75, 235e240.
Lal, R., Kimble, J.M., 1997. Conservation tillage for carbon sequestration. Nutr. Cycling Agroecosyst. 49, 243e253.
Maryland Department of Agriculture, 2010. Governor O’Malley Announces Record Cover Crop Acreage Planted by
Maryland Farmers. At www.mda.state.md.us/article.php?i=29978.
Mullins,C.E., 2000.Hardsetting soils.G-65-g-87. In: Sumner,M.E. (Ed.),Handbookof Soil Science.CRC,BocaRaton, FL.
Novak, J.M., Watts, D.W., Hunt, P.G., 1996. Long-term tillage effects on atrazine and fluometuron sorption in
Coastal Plain soils. Agric. Ecosyst. Environ. 60, 165e173.
Novak, J.M., Frederick, J.R., Bauer, P.J., Watts, D.W., 2009. Rebuilding organic carbon contents in Coastal Plain soils
using conservation tillage systems. Soil Sci. Soc. Am. J. 73, 622e629.
Novak, J.M., Busscher, W.J., 2011. Selection and use of designer biochars to improve characteristics of Southeastern USA
Coastal Plain degraded soils. In: Lee, J.W. (Ed.), Advanced Biofuels and Bioproducts. Springer Science. In press.
Parton, W.J., Schimel, D., 1987. Analysis of factors controlling soil organic matter levels in Great Plains grasslands.Soil Sci. Soc. Am. J. 51, 1173e1179.
Paustian, K., Six, J., Elliott, E.T., Hunt, H.W., 2000. Management options for reducing CO2 emissions from agri-cultural soils. Biogeochemistry 48, 147e163.
Peele, T.C., Beale, O.W., Lesesne, F.F., 1970. The physical properties of some South Carolina soils. South Carolina
Exp. Station Tech. Bull. 1037.
Pierzynski, G.M., Sims, J.T., Vance, G.F., 2000. Soils and Environmental Quality, second ed. CRC Press, Boca Raton, FL.
SECTION 2Agricultural Management
40
Reicosky, D.C., Kemper, W.D., Langdale, G.W., Douglas Jr., C.L., Rasmussen, P.E., 1995. Soil organic matter changesresulting from tillage and biomass production. J. Soil Water Conserv. 50, 253e261.
Reicosky, D.C., Lindstrom, M.J., 1993. Effects of fall tillage method on short-term carbon dioxide flux from soil.
Agron. J. 85, 1237e1243.
Sainju, U.M., Singh, B.P., Whitehead, W.F., Wang, S., 2006. Carbon supply and storage in tilled and nontilled soils as
influenced by cover crops and nitrogen fertilization. J. Environ. Qual. 35, 1507e1517.
Sainju, U.M., Schomberg, H.H., Singh, B.P., Whitehead, W.F., Tillman, P.G., Lachnicht-Weyers, S.L., 2007. Cover
crop effect on soil carbon fractions under conservation tillage cotton. Soil Tillage Res. 96, 205e218.
Sainju, U.M., Senwo, Z.N., Nyakatawa, E.Z., Tazisong, I.A., Reddy, K.C., 2008. Tillage cropping systems, and
nitrogen fertilizer effects on soil carbon sequestration and fractions. J. Environ. Qual. 37, 880e888.
Shaw, J.N., West, L.T., Bosch, D.D., Truman, C.C., Leigh, D.S., 2004. Parent material influence on soil distributionand genesis in a Paleudult and Kandiudult complex, southeastern USA. 2004. Catena 57, 157e174.
Siple, G.E., 1967. Geology and groundwater of the Savannah River plant and vicinity South Carolina. U.S. Geol.
Surv. Water Supply Papers 1941. USGS, Washington, DC.
Siri-Prieto, G., Reeves, D.W., Raper, R.L., 2007. Tillage systems for a cotton-peanut rotation with winter-annual
grazing: impacts on soil carbon, nitrogen and physical properties. Soil Tillage Res. 96, 260e268.
Spargo, J.T., Alley, M.A., Follett, R.F., Wallace, J.V., 2008. Soil carbon sequestration with continuous no-till
management of grain cropping systems in the Virginia coastal plain. Soil Tillage Res. 100, 133e140.
Spokas, K., 2010. Review of the stability of biochars in soils: predictability of O: C molar ratios. Carbon Manage
1 (2), 289e303.
Terra, J.A., Reeves, D.W., Shaw, J.N., Raper, R.L., 2005. Impacts of landscape attributes on carbon sequestrationduring the transition from conventional to conservation management practices on a Coastal Plain field. J. Soil
Water Conserv. 60, 438e446.
USDA., 2006. USDA Agricultural Handbook 29: Online at <http://soils.usda.gov/MLRAexplorer>
USDA-NASS, 2007. 2007 Census of Agriculture: Online at <http://www.agcensus.usda.gov>
VandenBygaart, A.J., Bremer, E., McConkey, B.G., Ellert, B.H., Janzen, H.H., Angers, D.A., Carter, M.R., Drury, C.F.,
Lafond, G.P., McKenzie, R.H., 2011. Impact of sampling depth on differences in soil carbon stocks in long-term
agroecosystem experiments. Soil Sci. Soc. Am. J. 226e234.
Vyn, T.J., Raimbault, B.A., 1992. Evaluation of strip tillage systems for corn production in Ontario. Soil Tillage Res.
23, 163e167.
Wang, Y., Admunson, R., 2000. Seasonal and altitudinal variation in decomposition and soil organic matter inferred
from radiocarbon measurements of CO2 flux. Global Biogeochem. Cycles 14, 199e211.
Watts, D.B., Torbert, H.A., Prior, S.A., Huluka, G., 2010. Long-term tillage and poultry litter impacts soil carbon andnitrogen mineralization and fertility. Soil Sci. Soc. Am. J. 74, 1239e1247.