managerial philosophies scale organizational … expression of gratitude to linda edwards in the...
TRANSCRIPT

THE RELATIONSHIPS AMONG TEACHER ABSENTEEISM, PRINCIPALS’
LEADERSHIP STYLES, AND TEACHERS’ FRUSTRATION LEVELS
by
JOHN DAVID BARGE
(Under the Direction of C. Thomas Holmes)
ABSTRACT
The purpose of this study was to examine the extent of the relationships among
teacher absenteeism, principals’ leadership styles, and the frustration levels experienced
by teachers on the job. The significance of the study lay in its providing insight to
building-level and system-level administrators concerning the reasons teachers are
absent.
Jacoby and Terborg’s Managerial Philosophies Scale (MPS) was administered to
32 principals in a suburban Georgia school system. The MPS measured the degree to
which administrators subscribed to McGregor’s Theory X and Theory Y beliefs about
man. Additionally, Spector’s Organizational Frustration Scale (OFS) was administered
to 1,160 teachers in the same school system. The OFS measured the level of frustration
experienced by teachers in their schools.
Once data were obtained from principals and teachers, computerized attendance
data from the school system’s central office were acquired. Absence rates were calculated
for each school and the system mean was correlated to mean scores of teachers’

frustration levels and principals’ leadership styles. The Pearson Product-Moment
correlation coefficient was used to determine if a relationship existed among teacher
absenteeism, principal leadership styles and teacher frustration levels.
The results of this study suggested that no statistically significant, positive
relationship existed between principal leadership style and teacher absenteeism.
Additionally, the study found no significant, positive relationship between teacher
frustration level and teacher absenteeism. However, the study did find that a statistically
significant relationship existed between principal leadership style and teacher frustration
level.
INDEX WORDS: Teacher Absenteeism, Principal Leadership Style, Teacher
Frustration, Teacher Stress, Teacher Job Satisfaction, Teacher
Attendance

THE RELATIONSHIPS AMONG TEACHER ABSENTEEISM, PRINCIPALS’
LEADESRSHIP STYLES, AND TEACHERS’ FRUSTRATION LEVELS
by
JOHN DAVID BARGE
B.A., Berry College, 1988
M.Ed., West Georgia College, 1994
Ed.S., State University of West Georgia, 1997
A Dissertation Submitted to the Graduate Faculty of The University of Georgia in Partial
Fulfillment of the Requirements for the Degree
DOCTOR OF EDUCATION
ATHENS, GEORGIA
2004

© 2004
John David Barge
All Rights Reserved
THE RELATIONSHIPS AMONG TEACHER ABSENTEEISM, PRINCIPALS’
LEADESRSHIP STYLES, AND TEACHERS’ FRUSTRATION LEVELS
by
JOHN DAVID BARGE
Major Professor: C. Thomas Holmes
Committee: William Swan Sally Zepeda
Electronic Version Approved: Maureen Grasso Dean of the Graduate School The University of Georgia May 2004

iv
DEDICATION
I would like to dedicate this work to my family:
To my wife and best friend, Loraine, for her undying love and support; for her
enduring the long nights alone while I attended classes; and, for her constant prayers that
keep me safe; sweetheart, thank you for making this journey with me.
To the most beautiful girl in the world, my daughter, Emma, for her silly sense of
humor that can brighten the darkest day, and for always knowing when to have Daddy
read, Love You Forever. Pumpkin, I will love you forever.
To my brothers Phillip, Doug, Alan, and Curtis Barge, thank you for always
believing in me and pushing me to achieve. I know all of you, at some point in your lives,
sacrificed something so that I might have every opportunity to be successful.
To my mother, Norma Rowland Barge Watts, from whom I learned everything
that I need to be successful: hard work, dedication, sacrifice, love, commitment, self-
respect, endurance, a strong work-ethic, grit, determination, and belief in myself. Mom,
you are truly, the greatest teacher I ever had.
To my father, Leland J. “Jerry” Barge, posthumously, thank you. I wish we had
had more time together before your passing; and, to my stepfather, Homer “Billy” Watts,
thank you for taking such good care of my mother and our family.
To my Great Aunt, Mrs. Emma Kate “Bargie” Outlaw, whose support both
financially and emotionally, kept me in college after my father’s death. Kate, with out
your help, I would never have made it here.

v
And, most importantly, I dedicate this work to my Lord and Savior, Jesus Christ.
Apart from Him, I am nothing. I could never have made this journey, nor attained what I
have, had the Lord not changed my life.

vi
ACKNOWLEDGEMENTS
The writer would like to thank the school system, principals, and teachers who
participated in this study. Your cooperation is greatly appreciated.
I would also like to express appreciation to Dr. C. Thomas Holmes for “picking
up” in the middle of this project as my major professor and propelling me forward
through this process. To the other members of my committee, Dr. Kenneth Tanner and
Dr. Bill Swan, for stepping up and serving when everything fell apart and to Dr. Sally
Zepeda, for your encouragement and your ability to cut through the “fluff,” thank you. A
deep expression of gratitude to Linda Edwards in the office of Educational Leadership
and Lifelong Learning for all of her patience in working with our cohort from the State
University of West Georgia. Thank you, Linda, for all the course registrations, billings,
defense schedulings, etc. To other professors from the State University of West Georgia
who supported me, Dr. Nancy Mims and Dr. Cher Hendricks, thank you.
Sincere appreciation goes out to Jim Wilson for all of his help in entering data and
checking over the format of this document; to Jenny Cain for her assistance in organizing
and distributing surveys; and to Dr. Peggy Leland and Rebecca Schacht for their advice
and constructive criticism on the presentation of content.
I would also like to acknowledge some very special mentors who have
encouraged me in my career and from whom I learned many great things: Principals, Dr.
Jimmy Stokes, Jody Puckett, and Dr. Mike Buck; and Superintendents, Dr. Larry Atwell,
Dr. Gayland Cooper, and Dr. Dennis Fordham.

vii
TABLE OF CONTENTS
Page
ACKNOWLEDGEMENTS.............................................................................................. VI
LIST OF TABLES............................................................................................................ IX
CHAPTER
1 INTRODUCTION .............................................................................................1
Statement of the Problem ..............................................................................5
Purpose of the Study......................................................................................6
Hypotheses ....................................................................................................6
Significance of the Problem ..........................................................................7
Definition of Terms .......................................................................................8
Chapter Summary..........................................................................................8
Organization of the Study..............................................................................9
2 REVIEW OF SELECTED, RELATED LITERATURE.................................10
Absenteeism ................................................................................................14
Models of Absenteeism...............................................................................16
Personal and Demographic Factors .............................................................17
Organizational and Work Environment Factors..........................................22
Teacher Absenteeism and Student Achievement ........................................27
Leadership ...................................................................................................29
Job Frustration/Job Satisfaction ..................................................................31

viii
Job Satisfaction and Absenteeism ...............................................................34
Chapter Summary........................................................................................36
3 METHODS ......................................................................................................37
Research Questions .....................................................................................37
Research Design ..........................................................................................38
Null Hypotheses ..........................................................................................39
Limitations...................................................................................................39
Subjects .......................................................................................................40
Attendance Incentive Plan...........................................................................41
Teacher Absence Data.................................................................................43
Measurement Instrumentation.....................................................................43
Data Collection Procedure...........................................................................46
Data Analysis ..............................................................................................47
4. DATA ANALYSIS..........................................................................................48
Description of Absence Data.......................................................................49
Description of Principals .............................................................................50
Description of Data from MPS and OFS.....................................................51
Tests of the Null Hypotheses.......................................................................53
Post-hoc Analysis of “Principal” Items in the Organizational Frustration
Scale ......................................................................................................55
Chapter Summary........................................................................................56
5 FINDINGS, CONCLUSIONS, AND RECOMMENDATIONS.....................57
Summary of Findings and Conclusions.......................................................58

ix
Recommendations for Further Study............................................................62
REFERENCES ..................................................................................................................63
APPENDICES ...................................................................................................................72
A Letters of Approval ..........................................................................................72
B Managerial Philosophies Scale ........................................................................77
C The Organizational Frustration Scale ..............................................................80
D Letters to Principals and Teachers ...................................................................83

x
LIST OF TABLES
Page
Table 1: Number and Percentage of Teachers Responding to the OFS by School...... 42-43
Table 2: Absence Rates by School............................................................................... 49-50
Table 3: Descriptive Data for Principals (N=32)...............................................................51
Table 4: Descriptive Statistics for Schools on Absence, Frustration, Theory X and Theory Y (N=32) ........................................................................................52
Table 5: Correlation Matrix for Hypotheses......................................................................54
Table 6: Post-hoc Correlation of the Six “Principal Item” Frustration Mean with Theory X and Y Scores and Absence Mean ......................................................................56

1
CHAPTER 1
INTRODUCTION
For decades, business and industry have struggled with the problem of employee
absenteeism – a fact that is supported by the vast body of literature that addresses the issue.
From 1977 to 1996, an average of 25.6 academic journal articles appeared each year that dealt
with the issue of employee absenteeism. All told, over 500 behavioral science papers, books,
and chapters that include absenteeism as a major variable have been published during the
period (Harrison & Martocchio, 1998). Mitra, Jenkins, and Gupta (1992) reported that
absenteeism and turnover were the two most frequent outcomes studied in organizational
research. An estimated cost of employee absenteeism in business and industry is placed
between $20-$25 billion dollars a year (Long & Ormsby, 1987).
The body of literature that looks specifically at absenteeism among educational
personnel is not nearly as extensive. Jacobson (1993) stated “while the issue of absenteeism has
received considerable attention in industry, there have been very few conceptual or theoretical
studies pertaining to teachers” (p.78). Studies which have been completed have tended to be
prescriptive, looking for ways to improve teacher absenteeism, or describing the correlates of
demographic factors and teacher absenteeism (Bridges, & Hallinan, 1978; Ferris, Bergin, &
Wayne, 1988; Scott, & McClellan, 1990).
However, the problem of teacher absenteeism is of growing concern. Grant (2001)
called excessive absenteeism among school personnel “one of the most neglected problems in
public education” (p. 44). In 1988, Warren reported that most school districts were reporting

2
teacher absenteeism rates of 8%-10%. In fact, it has been shown that teacher absenteeism has
dramatically increased during the past few decades and that teachers as a group exhibit a higher
rate of absenteeism than employees in most other professions (Pitkoff, 1993).
One of the most difficult aspects in studying absenteeism among school personnel is
that what school systems define as an absence varies from system to system, and often from
school to school. The lack of a consistent definition of absence from work is not surprising
since researchers do not share a common definition (Ramming, 1998). Many researchers
(Gibson, 1966; Jacobson, 1989; Ramming, 1994) suggested that absenteeism be defined as any
absence from work over which the employee exercises some control or discretion. This
definition does not consider, however, absences that might be caused by attendance at required
staff development, conferences, or meetings. Consequently, Ramming (1998) suggested
absenteeism be defined as “any incident of absence for personal reasons that measures two days
or less in duration; such reasons generally include personal illness, family illness, and personal
business” (p. 15).
Regardless of the reason why teachers are absent, they are, and it is a costly problem.
School administrators have long been concerned with reducing teacher absenteeism, but often
without the benefit of really understanding the condition they are trying to remedy (Jacobson,
1993). According to Ehrenberg, Ehrenberg, Rees, and Ehrenberg, (1989), two of the most
costly reasons why research in the field of teacher absenteeism should continue were:
1. Financial cost of teacher absenteeism
2. Teacher absenteeism has a negative affect on student learning
When teachers are absent, substitute teachers must fill in the gap in the classroom. Norton
(1994) reported substitute teachers as the third highest-ranked “serious” problem, and teacher

3
absenteeism as the number one ranked “general” problem facing personnel directors. Finding
qualified substitute teachers is an increasingly difficult task for many administrators. Not only
is student learning jeopardized by the lack of a qualified teacher in the classroom, but the
monetary cost to the school systems was estimated to be in the millions of dollars each year
(Ramming, 1998).
Research on the workplace of teachers continues to demonstrate that in some schools
effective leadership produces higher learning than in other schools (Evans & Johnson, 1990).
Although there is no clear-cut evidence which indicates that teacher job satisfaction and
effectiveness of performance are related, it seems logical that a direct relationship exists. The
evidence indicates that, where teachers have freedom to plan their work and opportunities to
participate in decisions regarding curriculum and teacher welfare, morale is high (Patrick,
1995). The attitude the principal shows toward the teacher is a significant factor affecting
teacher satisfaction. In a 1995 Chicago study, Patrick found a statistically significant
correlation between administrative style and school climate. In a study of 758 teachers from
Illinois, Arizona, and Florida, Anderman, Belzer, and Smith (1991) found that teacher
satisfaction with their job and commitment to the school were positively and strongly
associated with a perceived emphasis on recognition, accomplishment, affiliation in the school,
and a feeling of cohesiveness regarding the mission of the school.
If the leadership of the building principal has a significant effect on teacher satisfaction,
then, at least in an indirect way, principal leadership style might also effect teacher
absenteeism. Few research studies have investigated what impact principal leadership style has
on teacher attendance (Roquemore, 1987). A Dutch study of teacher absence in primary
schools found that collegial relations and leadership style are more friendly and informal in

4
high absenteeism schools. In low absenteeism schools, the principal had a more directive
leadership style (Imants & VanZoelen, 1995). However, an earlier study in a Metro Atlanta
school system found no statistical significant relationship between principal leadership style
and teacher absenteeism (Roquemore, 1987). McGregor (1967) reported that leadership
behavior is related to attendance and productivity.
McGregor (1967) believed that leader behavior was determined by a set of beliefs that
managers hold about workers. Theory X managers believe that employees are motivated by
external rewards like money and promotion, and the fear of punishment. Therefore, leaders
subscribing to Theory X beliefs are more suited to an autocratic leadership style where
decisions are made for them and they are controlled. On the other hand, Theory Y managers
believe people are motivated not only by extrinsic rewards, but also by intrinsic rewards like
freedom to make decisions and freedom to use their imaginations in problem solving. Theory Y
beliefs are more suited for the democratic leadership style where employees are encouraged to
make their own decisions and to find their own place within the organization.
Although little research has been conducted on the effect of leader behavior on
employee attendance, McGregor (2001) noted that authoritarian leader behaviors are
counterproductive to an organization and that employees may engage in behaviors to
purposefully thwart the attainment of the goals and objectives of the organization. Logically,
one behavior employees may engage in is lying out of work. Druss, Schlesinger, and Allen
reported that employees are withdrawing from jobs in which they do not see themselves as
successful by not coming to work (2001).
The National Center for Educational Statistics (1998) reported that across the nation,
one of every five full-time teachers leaves the profession to pursue a career outside the

5
education field. Kyraicou (1987) attributed a great deal of teachers’ dissatisfaction with their
careers to stress, and listed frustration as one of the major causes of stress. Argyris (1964)
explained absenteeism as the employees’ attempt to avoid or express frustration. Flynn and
Stratton (1981) stated that frustration causes absenteeism.
Stress can lead to problems in the workplace such as poor morale, job dissatisfaction,
absenteeism, lowered productivity, and high medical costs (Kedjidjian, 1995). Much of the
available research on teacher workload and stress states that teacher workloads are excessive,
and that the negative effects of stress are having considerable impact on teachers. These effects
include declining job satisfaction, reduced ability to meet students’ needs, significance
incidences of psychological disorders leading to increased absence from work, and a high
proportion of claims for disability caused by stress (Naylor, 2001). Data from a major British
insurance company reveal that teachers were the most depressed category of workers, with 44%
of their disability insurance claims caused by mental problems, compared to 25% from other
groups of workers. A number of British teacher suicides have also been directly related to
anxiety over workloads (Bunting, 2000).
Statement of the Problem
Teacher absenteeism is a “disease approaching epidemic proportions” (Lewis, 1981,
p.29). Norton (1994) found that 71% of personnel directors surveyed reported teacher
absenteeism as one of the leading problems facing them. The U.S. Bureau of Labor Statistics
reported that from 1967 to 1974 the rate of increase in absenteeism for education profession
was double the rate for all U.S. industry (Hedges, 1975). As recent as 1995 it was reported that
teacher absenteeism was on the rise (Wyld, 1995).

6
Following such reports, large school systems across the nation conducted their own
evaluations of absenteeism with in their systems. Studies were conducted in Las Vegas, New
York, California, Illinois, and Indiana. Each study found dramatic increases in teacher
absenteeism (Manlove & Elliott, 1979). A study conducted by the Pennsylvania School Boards
Association reported that the annual mean teacher absence rate was 4.7% (Elliott, 1982). An
earlier study completed for the Illinois State Board of Education showed that there had been an
increase of 16% in the teacher absenteeism rate from 1976 – 1977 (Academy for Educational
Development Public Policy Division, 1977).
Purpose of the Study
The purpose of this study is to examine the relationships among teacher absenteeism,
principals’ leadership styles, and the frustration levels experienced by teachers on the job, and
the extent to which these are related. Individual schools’ teacher attendance rates is one
variable; principals’ scores on the Managerial Philosophies Scale (MPS) is a second correlative
variable; and teachers’ collective scores on the Organizational Frustration Scale (OFS) is a
third correlative variable.
Hypotheses
Five research hypotheses were investigated in this research study:
1A) There is a statistically significant positive relationship between teacher absenteeism and
the X-scores of principals on the Managerial Philosophies Scale.
1B) There is a statistically significant negative relationship between teacher absenteeism and
the Y-scores of principals on the Managerial Philosophies Scale.

7
2) There is a statistically significant positive relationship between teacher absenteeism and
the teachers' frustration levels as evidenced by their scores on the Organizational Frustration
Scale.
3A) There is a statistically siginificant positive relationship between the X-scores of
principals on the Managerial Philosophies Scale and the teachers' frustration levels as
evidenced by their scores on the Organizational Frustration Scale.
3B) There is a statistically siginificant negative relationship between the Y-scores of
principals on the Managerial Philosophies Scale and the teachers' frustration levels as
evidenced by their scores on the Organizational Frustration Scale.
Significance of the Problem
Considering current economic conditions in our country and state, the state of Georgia’s
mandate to improve its educational image, and the difficulty principals have in hiring extremely
well-qualified teachers, it is vitally important that researchers be able to identify causes of
teacher absenteeism to develop solutions to the problem. Although there is no current national
data available, Lewis (1981) reported the cost of hiring substitute teachers and paying the
absent teachers’ salaries nation wide at $2 billion annually. Additionally, 75 million hours of
contact time with students was lost which has a significant impact on student achievement.
Research shows that the substitutes who are asked to fill-in are significantly less-effective than
regular classroom teachers, thereby lowering student achievement. In fact, a study conducted
by the Metropolitan School Study Council of Columbia University concluded that substitute
teachers were educationally ineffective (Olson, 1971).

8
Definition of Terms
The following definitions are provided to assist the reader in understanding the various
terms used in this study.
1. Teacher Attendance Rate. The average number of days teachers as a
whole are absent from school.
2. Managerial Philosophies Scale (MPS). Developed by Jacoby and
Terborg (1975a), this instrument identifies managerial philosophies of managers within
an organization within the context of McGregor’s Theory X and Theory Y assumptions
of the nature of man.
3. Frustration. “The interference with goal attainment, goal-oriented
activity, or goal maintenance” (Spector, 1978, p.816).
4. Organizational Frustration Scale (OFS). An instrument designed by
Spector (1978) to measure the level of frustration that exists among employees.
Chapter Summary
Teacher absenteeism is a growing problem across the U.S. The effects that absenteeism
has on education are clearly defined in research. Teacher absenteeism cost school systems
across the country billions of dollars each year. The greater loss comes in the form of
instructional time. Students across the country spend millions of hours each year with substitute
teachers, many who are unqualified to teach and are nothing more than baby sitters.
Research regarding the influence of principal leadership style on teacher attendance is
limited. Findings that have been reported are mixed at best. Research reveals that leadership
behavior can influence teacher morale, climate, and even lead to increased frustration levels in

9
teachers. Increased frustration levels can lead to greater amounts stress and even teacher burn
out which may even cause teachers to leave the profession.
Absenteeism among teachers is a growing concern to many. The rising costs of teacher
absenteeism, including financial costs and loss of instructional time, compels researchers to
search for correlations between teacher absenteeism and other variables so school principals
and district level personnel can implement the necessary changes to improve the growing
dilemma. Researchers have attempted to identify demographic factors that may cause
absenteeism with little success. By examining additional variables such as principal leadership
style and teacher frustration levels, researchers may help to identify a cause that leads to a
solution.
Organization of Study
This study is comprised of five chapters. Chapter One included an introduction to the
issues, a statement of the problem, researched hypotheses, a report of the significance of the
problem, definition of unfamiliar terms, a summary, and a brief description of the organization
of the study. Chapter Two reviews research literature concerning the topic. Chapter Three
includes research questions, design, and null hypotheses, limitations of the study, descriptions
of subjects and instrumentation, teacher absence data, and data collection and analysis
procedures. Chapter Four consists of an analysis of the data collected, and Chapter Five
consists of findings, conclusions and recommendations of the study.

10
CHAPTER 2
REVIEW OF SELECTED, RELATED LITERATURE
Absenteeism in the workplace is not a new problem. Throughout history, organizations
have had to deal with the short-term replacement of absent employees. Industrial managers
have been much more sensitive to the impact of employee absenteeism, both in terms of dollars
and productivity, than have educators. In fact, in 1978 the direct cost in lost-but-paid-for labor
hit over $25 billion (Capitan, Costanza, & Klucher, 1980). In 2001, Lippman reported that
unscheduled absences in business and industry cost employers approximately $610 per
employee per year in lost productivity costs, which could total into the millions for major
corporations. Mitchell (2001) added that expenditures associated with employee absences
account for approximately 20% of an employer’s payroll costs.
“While employee absenteeism in the industrial sector has received considerable
attention, there is surprisingly little research on the causes and effects of absenteeism in
education” (Jacobson, 1990, p. 78). Though generally aware of the business and industrial
statistics, school managers have benignly thought educators were immune to absenteeism to
such an extent. It was believed that professionalism insulated school employees from trends in
the rest of the workforce (Capitan et al., 1980). Yet, differences in definitions of what
constitutes absences from work and categories used to report information about the national
workforce make it impossible to readily compare rates of teacher absenteeism with those in
other job sectors (Elliott, 1982). However, even when considering these discrepancies, the
national data on teacher absences give rise for concern.

11
Consider the U.S. Bureau of Labor Statistics which reported that from 1967-1974 the
increasing rate of teacher absenteeism was double the rate for the total U.S. industry (Hedges,
1975). Across the nation, school districts are reporting substantial increases in teacher
absenteeism (5% in each of the past 16 years). Some observers call the phenomenon a ‘disease
of epidemic proportions.’ National figures substantiate their claim: “Each day nearly 200,000
teachers call in sick, resulting in an annual loss of 75 million hours of contact time with
students and costing school boards collectively about $2 billion each year” (Lewis, 1981, p.
29).
As a group, teachers exhibit a higher absenteeism rate than employees in most other
professions (Pitkoff, 1993). A survey of 135 Pennsylvania school systems found the average
teacher was absent 8.2 days, a 46% increase over earlier data. The Pennsylvania report also
revealed that educational absence rates were significantly higher than all major industry
classifications and almost double that of the professional and technical absence rate for private
industries (Elliott, 1982). From 1978–1979, the teacher absence rates in the Antioch, Illinois
Community Consolidated School district averaged nearly 10 days per teacher. In fact, the
teacher rate of absence was higher than the student rate of absence of nine days (Skidmore,
1984).
High teacher absenteeism is expensive. Not only does it drive up the costs associated
with paying substitute teachers, but more importantly, it reduces the amount of instruction time
students spend with their regular teacher. “Breaking the rhythm of regular instruction lowers
achievement. It can increase the students’ need for remedial education which, in turn, bumps up
another budgetary category” (Skidmore, 1984, p. 40). In 1980, Bridges reported the cost of
replacing absent teachers totaled half a billion dollars. Lewis (1981) added that when the cost

12
for paying substitutes was combined with the cost of paying the absent teachers’ salaries, the
cost of teacher absenteeism rose to approximately $2 billion annually. During the 1979
calendar year, a suburban Cleveland, Ohio school district of 12,000 students spent $50,000 for
substitute teachers. This was the equivalent to all the funds used to purchase educational
equipment for that year (Capitan et al., 1980). A few years earlier in 1972, New York City,
paying substitute teacher salaries accounted for 9% of all certified teacher salaries (Elliott,
1979). Fifteen years later, in the 1986-1987 school year, teacher absences in one New York
system cost that system over $450,000 for substitute teacher services (Jacobson, 1990).
While the financial cost of teacher absenteeism is staggering, there are other costs to
consider as well, most importantly, reduced student achievement. Teacher absenteeism is a
problem that infiltrates the life of the entire school. It not only creates frustrations for the
principal, but also it affects student learning (Elliott, 1982). Research indicates that higher
teacher absenteeism is related to lower student outcomes (Madden, Flanigan, & Richardson,
1991; Pitkoff, 1993; Woods & Montagno, 1997). Lewis (1981) added, “There is a critical point
at which the rate of teacher absenteeism begins to inhibit student learning” (p. 29). Conversely,
Woods and Montagno (1997) discovered that students with teachers who had fewer absences
exhibited significantly larger improvements in grade equivalency. Additionally, Bamber (1979)
suggests that a study of student and teacher attendance indicates that when student absences
increase dramatically, so do teacher absences in that school. Still, there are other costs to be
considered. The increased amount of details that administrators must handle when it comes to
arranging for substitutes, evaluating substitutes, and addressing the increased discipline
problems that inevitably come from the classrooms of substitute teachers all add to the
managerial costs by taking time away from administrators (Elliot, 1982). When members of

13
committees, councils, or study groups are absent, the groups are unable to work toward the
completion of goals and that increases organizational costs (Elliot, 1982). Student activities
sponsored by teachers do not occur when teachers are absent thereby increasing program costs
(Elliot, 1982).
A 1995 study by the Pacific Resource for Educational Learning indicated that students
felt vulnerable to teacher absenteeism (Hammond & Onikama, 1997). When teachers are
absent, students are left in the hands of substitute teachers. Interruptions in the continuity of the
students’ regular instruction contribute to lower achievement scores and increased remedial
costs of education (Skidmore, 1984). “Literature and experience indicate that substitute
teachers generally provide inferior service” (Pitkoff, 1993, p. 39). In one study of urban
schools, it was discovered that the rate of teacher absenteeism made no discernible difference
in student achievement in those schools classified as high achieving or low achieving.
However, in those schools classified as average achieving, teacher absenteeism did make a
significant difference in student achievement (Lewis, 1981).
In a recent survey conducted by the Substitute Teaching Institute at Utah State
University, it was found that 64.8% of school districts do not require substitutes to attend
orientation or skills training, and 91.8% of school districts provide no ongoing training for
current substitute teachers (Hawkins, 2000). Thus, while permanent teachers are away, their
students are experiencing a lack of instructional continuity due to exposure to untrained
substitutes.
Over the course of their K-12 education, American students spend as much as
5%-10% of their class time with substitute teachers (Billman, 1994). Wyld (1995) estimated
that on any given school day, up to 10% of the nation’s classrooms have substitutes. A study of

14
New York City schools by Elliot and Manlove (1977) confirmed what every student knows:
substitute teachers are significantly less effective than regular teachers. A study conducted by
the Metropolitan School Study Council of Columbia University concluded that substitute
teachers were educationally ineffective (Olson, 1971). This study also found that regular
teachers were 20 times more effective than substitutes in secondary classrooms.
Absenteeism
“Absentee proneness” is defined as the notion that a small percentage of employees are
responsible for a great percentage of absenteeism (Garrrison & Muchinsky, 1977). Yolles,
Carone, and Krinsky (1974) claimed that 10% of the work force is responsible for 90% of
absenteeism. Garrison and Muchinsky (1977) found that absenteeism measured over a short
period of time (e.g., quarter, month, week) would support the notions of Yolles et al. However,
when the duration of absence measurement is lengthened, a larger percentage of employees is
responsible for the majority of the absenteeism, suggesting that the core of absentee-prone
workers shifts over time. Regardless of who is responsible for employee absenteeism, it is a
dilemma of growing concern.
“The paucity of research on the causes of absenteeism is undoubtedly due to the fact
that data on teacher absenteeism are not regularly reported by school districts to state education
departments” (Ehrenberg et al., 1989, p. 73). Another major obstacle in studying teacher
absenteeism is that researchers and school systems alike have a difficult time agreeing on the
best way to measure absenteeism. As early as 1963, Gaudet cited at least 41 different measures
had been used in the past to define absenteeism. Garrison and Muchinsky (1977) believed that
“a major issue underlying most absence measures is whether pay is associated with the

15
absenteeism. Many companies differentiate types of absenteeism on the basis on whether or not
the employee will be paid during the absence” (p. 390).
Employee absences for a short-period of time are classified as an incidental absence.
Absences beyond this period of time are classified as disability. Incidental absenteeism may be
broken down into paid and unpaid absences (Garrison & Muchinsky, 1977). Likely,
absenteeism is defined differently across school districts or even among schools in the same
district, which is not surprising since researchers do not even share a common definition of
absenteeism. Many researchers suggest absenteeism involves those absences over which
employees may exercise some control or discretion (Gibson, 1966; Jacobson, 1989; &
Ramming, 1994).
Regardless of the differing definitions of absenteeism, Lewis (1981) noted the following
symptoms of school systems experiencing problems with absenteeism:
1. There is general lack of direction from the school board and the
superintendent. Absenteeism issues are generally overlooked as they turn to more pressing
issues.
2. School board policy fails to address teacher absenteeism issues. An
examination of several hundred board policies yielded none that contained measures to improve
absenteeism.
3. Systems fail to analyze attendance performance of school employees.
4. School environment is determined by administrators’ leadership styles. Where
absenteeism is high, leadership is lacking and morale drops which leads to widespread job-
dissatisfaction.
5. Systems fail to keep teacher records.

16
Models of Absenteeism
Although research has been conducted on employee absenteeism for the past 50 years,
theories of the phenomenon have been offered from an array of disciplines. Absenteeism is
explained by psychologists as pain avoidance (Steers & Rhodes, 1978), by sociologists as an
organizational socialization and prevailing absence culture (Chadwick-Jones, Nicholson, &
Brown, 1982), and by economists as a way for workers to make trade-offs between labor and
leisure (Allen, 1981).
Absenteeism from the organizational approach views absenteeism as a function of job designs, work unit size, level of interdependence among employees, and practices and norms that arise in the workplace; for example, highly interdependent jobs are thought to foster higher attendance rates since any one worker’s absence increases the workload for co-workers (Jacobson, 1990, p. 81). In the individual model of absenteeism, chronic absenteeism is seen as the
ultimate manifestation of deep-seated employee dissatisfaction. “Absenteeism is an employee
decision process in which alternative attendance behaviors are considered in light of existing
constraints” (Jacobson, 1990, p. 81). Finally, based on previous research in absenteeism, Farrell
and Stamm (1988) concluded that individualistic theories of absenteeism, especially those
emphasizing age, sex, and job satisfaction, do not seem promising.
Steers and Rhodes (1978) developed a model of absenteeism that combines the
individual and organizational approaches. The combined model draws on factors from both the
individual and organizational areas. The Steers and Rhodes model includes individual
characteristics such as education, tenure, age, sex, race, marital status and family size. From the
organizational approach, it includes characteristics such as scope of the job, amount of stress,
leadership style, co-worker relations, and opportunity for advancement. In addition to the
individual and organizational characteristics, Steers and Rhodes consider pressures to attend,

17
such as economic and market conditions, attendance policies and personal work ethic; and the
ability to attend, which is determined by illnesses, accidents, family responsibilities, and
transportation problems. Steers and Rhodes (1990) later revised this model and added the major
components of attendance motivation and perceived ability to attend.
Unfortunately, the problems with research on absenteeism in industry also plague
research on absenteeism in education. Most research has centered on causes and relationships
among variables without an attempt to develop a theory or model of absenteeism that might
explain the findings of these studies (Scott & Wimbush, 1991). Many researchers have
attempted to identify factors related to absenteeism so that appropriate solutions for this
problem can be developed. Much of the research, however, has been conducted in private
sector organizations, even though absenteeism is often more costly in the public sector
(Winkler, 1980).
Personal and Demographic Factors
A review of research on employee absenteeism in business, industry, and education
reveals “inconsistent findings in determining the relationship between absenteeism and the
following variables: age, marital status, educational level, years of employment, job
satisfaction, geographic location, tenure, and salary” (Pitkoff, 1993, pp. 39-40). However,
researchers do find consistency in the relationship between absenteeism and gender.
Gender
Consistent findings have been made in business, industry, and education between
employee absenteeism and gender – females absent more than males, but for fewer days.
Business and government literature indicate a posiitve correlation between gender and
absenteeism (Pitkoff, 1993). In 1973 and 1975, Hedges reported that the absence rate for

18
females in business was approximately twice that of males. Golden and Barton (1980) studied
absence trends in men and women with children over an 11 month period and found a
statistically significant difference. The women in the study averaged 40.58 hours of sick leave
while the men averaged 34.4 hours.
In a study of 502 teachers from a county school system in a mid-Atlantic region, Scott
and Wimbush (1991) found women to be absent more frequently than men, and women were
absent more days than men. Elliot (1982) found that females and minorities appear to have
higher absence rates, but when other variables are factored out, the differences are less clear.
Another study conducted in a school district in Iowa looked at ten demographic
variables and how they related to teacher absenteeism. Of the 10, gender was the only
statistically significant correlate found with females being absent more than males (Redmond,
1978). In a study of 335 Oregon teachers, Sylwester (1979) found women to be absent, on
average, almost 2 times more often than men.
Age
Ramming (1998) reported a study conducted in East Lake School District in New York
where age and leave accumulation were the only factors related to absenteeism. Age exhibited a
statistically significant positive relationship while leave accumulation exhibited a negative
relationship.
A 1981 Educational Research Service study, National Survey on Absenteeism, of 470
school systems during the 1978-1979 school year revealed that the older the employee, the
higher the rate of absence for sickness. For total or uncertified absences, younger employees
have higher rates of absence (Elliot, 1982).

19
In a study of 286 elementary teachers, Marchant (1976) found that as the age of the
teacher increased so did the absence rate. He concluded that there was a statistically significant
positive relationship between age and absence rate. On the other hand, Marlin (1976) noted that
the relationship between age and absence rate of teachers was curvilinear. He found that
middle-aged teachers were absent less than teachers who were both older and younger.
Marital Status
Elliot (1982) found that demographic factors including salary and marital status do not
have a significant impact on amounts of absenteeism. Marital status, family size, level of
education, and amount of experience are not consistently related to absence.
In earlier research, however, Coller (1975) and Shaw (1980) reported that marital status
did have an impact on teacher absence rate. They found that single teachers exhibited a
tendency to be absent more than married teachers.
Time and Place Factors
Much of recent research on teacher absenteeism has focused on when teachers are
absent and the geographical locations where teacher absenteeism is highest. The
preponderance of research indicates that teacher absenteeism is more prevalent on Mondays
and Fridays (Capitan et al., 1980). Pitkoff (1993) also found that absenteeism in education
increased with each progressive month of the school year, culminating in May; the highest rate
of absenteeism occurs on Mondays and Fridays; and that teachers in the Northeastern United
States were absent more frequently than those in any other geographic location. Elliott (1982)
noted that increased teacher absenteeism on Mondays, Fridays, and at the end of the school
year are costing educators a great deal of credibility in the eyes of the community.

20
The National Survey on Teacher Absenteeism (1981) conducted by the Educational
Research Service revealed that the average number of days absent per teacher for all paid
absences in all reporting school systems was 8.0 days. The average days absent per teacher for
large school systems (25,000 or more pupils) was 8.4 days; for medium systems (10,000 to
24,999 pupils) 8.0 days; and for small systems (2,500 to 9,999 pupils) 6.5 days. The average
number of days absent per teacher by type of community served was 8.9 days in urban areas;
8.5 days in suburban areas; 6.7 days in small towns; and 6.5 days in rural areas. Finally, the
teacher absence rates for all paid absences in all reporting school systems by type of
community served was 4.7% in urban areas, 4.6% in suburban areas, 3.6% in small towns, and
3.5% in rural areas. Finally, there is some evidence that teachers in Title I or inner city schools
and those who teach disadvantaged and minority children have higher absence rates (Elliott,
1982).
Job Satisfaction
According to Pellicer (1984), a lack of job satisfaction caused serious withdrawal
problems among teachers that resulted in excessive absenteeism. Pellicer (1984) identified
recognition, delegated responsibilities, and opportunities for success as job satisfiers; and, he
identified job dissatisfiers as ineffective operating procedures, ineffective supervision, low
salaries, poor work relations, and poor working conditions. Before any progress is made toward
reducing teacher absenteeism, work dissatisfiers must be replaced by work satisfiers.
Elliott (1982) identified several characteristics of job satisfaction that he found to be
related to teacher absenteeism. He found that high levels of absenteeism occurred in school
districts where there were low levels of faculty agreement about the goals and policies of the
community and district. However, low levels of absenteeism are reported in districts with high

21
levels of community support and policy agreement, and when there are smaller sub-units within
the school, and the teachers in those units are interdependent.
Job Assignment
Teacher absenteeism is also found to be higher in elementary schools (Pitkoff, 1993;
Elliott, 1982). Marlin (1976) reported that (K-2) teachers are absent the most. Employees with
higher level jobs tend to be absent less often than those with lower level jobs; administrators
are absent significantly fewer days than teachers; and, math and science teachers are absent
fewer days than humanities teachers (Elliott, 1982). Redmond (1978) and Sylwester (1979)
both suggested that the reason more elementary teachers are absent is linked to the fact that
more elementary school teachers are females, who exhibit a higher rate of absenteeism than
males.
Salary
In its 1981 National Survey on Absenteeism, the Educational Research
Service reported teacher absenteeism rates by salary category. The average number of days
absent per teacher by average teacher salary was 9.2 days in systems averaging $17,000 or
more in annual salary; 7.8 days in systems of $15,000 to $16,999; 8.0 days in systems of
$13,000 to $14,999; and 6.8 days in systems less than $13,000. In later research Elliott (1982)
reported that absenteeism continued to increase despite pay increases. However, in 1993,
Pitkoff found that as satisfaction with pay increased, the rate of teacher absenteeism decreased.
Needless to say, findings concerning the relationships of various demographic factors
with teacher absenteeism are mixed. Difficulty arises in finding recent research concerning the
same topic. More recent research focuses on the costs of teacher absenteeism, effects of teacher

22
absenteeism on student achievement, and designing programs that might help alleviate the
problem.
Organizational and Work Environment Factors
Absenteeism and turnover are two of the most popular outcomes studied in
organizational research (Mitra, Jenkins, Douglas, & Gupta, 1992). Several organizational and
workplace environment factors may influence employee absence rates including organization
size, climate, personnel policies and satisfaction with supervisor.
Organization Size
One organizational variable that seems to be directly related to absenteeism is the size
of the district. Small districts tend to have lower absence rates than large districts (Capitan, et
al., 1980). Additionally, teacher absenteeism was viewed as a high or very high management
concern in 64.9% of school systems with 25,000 or more pupils; 45.4% in systems with 10,000
to 24,999 pupils; 38.6% in systems with 2,500 to 9,999 pupils; and 33% in systems with 300 to
2,499 pupils. (Elliot, 1982). Conflicting results were reported by the Pennsylvania School
Boards Association (1978) which found that teachers in small systems (less than 200
employees) were absent at almost the same rate as large districts (more than 200 employees).
Small districts reported an absence rate of 4.7% while large systems reported an absence rate of
4.8%.
Organizational Climate
One of the major underlying causes of teacher absenteeism is considered to be
dissatisfaction with working conditions such as supervision, salary, and policies. When
dissatisfaction with conditions becomes too great, employees may terminate employment,
although some say absenteeism offers an alternative to quitting since it allows them an

23
opportunity to express their dissatisfaction (Herzberg, 1966; Jacobson, 1990). The advantages
of high morale include low turnover, less absenteeism, and a better academic environment for
instruction (Hunter-Boykin, Evans, & Evans, 1995).
Stallings and Mohlman (1981) found statistically significant correlations among several
variables and teacher morale. Briefly, they found that teacher commitment and morale were
higher in schools where rules were clear, clearly communicated, and enforced; and where
principals respected teacher judgment and integrity. Principals who were open to allowing
teacher input into decision-making experienced higher teacher morale in their schools. Stallings
and Mohlman (1981) also noted that one way to improve teacher morale and ultimately teacher
attendance is to clearly define polices and procedures and administer them consistently. As
noted earlier, increased teacher morale and commitment yield lower teacher absenteeism.
Firestone and Rosenblum (1988) identified four important organizational factors which
influence teacher commitment:
1. Sense of purpose about work
2. Mutual respect and affiliation
3. Administrative support
4. Opportunities for decision making
Each of these factors derives from the relationship between the teacher and principal.
Anderman, Belzer, and Smith (1991) also suggested that teachers are more satisfied when the
school fosters teacher involvement in school decisions, respect, encouragement, and the sharing
of information with colleagues, as well as the feeling that teachers and administrators are
working together.
Satisfaction with Supervisor

24
Ultimately, the school principal is the person who establishes the ground rules for the
operational environment in the school and is directly responsible for developing and
maintaining high teacher morale (Hunter-Boykin, et al., 1995). Teachers report greater
satisfaction in their work when they perceive their principal as someone who shares
information with others, delegates authority, and keeps open channels of communication with
the teachers (Rossmiller, 1992). Workload and support from principals influence teacher
burnout, job satisfaction, and occupational commitment (Starnaman and Miller, 1992). There
are statistically significant direct relationships between principal leadership behavior, as
perceived by the teacher, and satisfaction and commitment (Anderman, et al., 1991).
Anderman, et al. (1991) argued that teachers’ perceptions of their principals will have a
direct impact on their perceptions of school culture, and that this school culture will be related
to a teacher’s level of satisfaction and commitment. Schools must give more attention to
increasing teacher job satisfaction (Heller, Clay, & Perkins, 1993).
Personnel Policies
Most school districts are experiencing teacher absenteeism rates of 8% - 10% (Warren,
1988). Excessive absenteeism among school personnel is one of the most neglected problems in
public education (Grant, 2001). In recent years, however, personnel managers and boards of
education have scrambled to develop policies to address the problem.
In its 1981 National Survey on Absenteeism, the Educational Research Service reported
the average number of days absent per teacher by method of absence reporting was 9.1 days in
systems using a telephone answering service, and 7.6 days when a specific person is contacted.
In other words, systems which had a policy in place requiring absent teachers to contact a
specific person experienced fewer absences than those which did not. Winkler (1980) found

25
that policies requiring teachers to provide proof of illness and to report illness directly to the
principal were associated with lower absence rate. Dalton and Perry (1981) found that
organizations that do not require proof of illness have higher rates of employee absenteeism.
They also reported that organizations that do not reimburse earned but unused sick leave have
higher rates of absenteeism. Elliott (1982) also reported that lower levels of teacher absence are
associated with reporting procedures that require the teacher to speak directly with the
immediate supervisor.
School district policies governing the annual usage of teacher leave days that appear in
teacher contracts clearly influence teachers’ usage of leave days (Ehrenberg, et al., 1989).
Similarly, policies that allow teachers to accumulate days and use them toward retirement or
that pay teachers for unused leave are both associated with lower leave usage. These types of
“buy-back” policies were studied in Georgia, which is a non-negotiating state for teachers.
Teachers in Georgia are non-unionized; therefore, collective bargaining does not exist. Boyer
(1994) found that there is no significant relationship between buy-back policies and teacher
attendance rates in Georgia. However, the directionality of the findings tended to support the
idea that buy-back policies reduce teacher absences.
Collective Bargaining.
Absenteeism has continued to increase since the passage of collective bargaining
legislation (Elliot, 1982). Collective bargaining has resulted in contract teachers being provided
with more personal and sick leave time; as a result, students at all levels spend more
instructional time with substitutes (Manlove & Elliot, 1979). Changes in federal or state labor
laws may also result in teachers being eligible for more personal and sick leave days (Billman,
1994).

26
A 1970 Philadelphia study that involved 56 school districts and 12,000 teachers found
that the 11 districts whose sick leave policies matched the minimum allowed by the state had
the lowest rate of teacher absenteeism. Conversely, those systems that allowed more sick leave,
as a result of collective bargaining, experienced higher attendance rates (Bamber, 1979). Yet
another example is Clark County, Nevada which experienced an increase of 41% in teacher
absenteeism in the three years following introduction of collective bargaining for teachers
(Foster, 1987).
Paid sick leave is the widest held fringe benefit in the country. According to surveyed
employers, six in ten sick calls are bogus. Workers typically take sick time to fulfill family
obligations or attend to personal needs or simply because they think they deserve it (Lippman,
2001). A 1974-1975 study of 57 elementary schools in California and Wisconsin found that
income protection plans for long-term sick leave were associated with higher absenteeism
(Winkler, 1980). Elliott and Manlove reported that a nationwide survey revealed that 86% of
responding school systems reported increased demand for substitute teachers following the
establishment of more generous sick leave policies. Research has indicated that this is a direct
result of policy shifts where teachers view these days as an employee benefit (Elliott &
Manlove, 1977).
Simply put, the more sick leave available, the greater the rate of absenteeism (Pitkoff,
1993). The average number of days absent per teacher by personal leave provisions was 7.9
days in systems that provide three days or less of personal leave and 8.8 days in systems that
provided more than three days of personal leave. One example of this is the Antioch
Community Consolidated School System in Illinois which found the attendance rate for
teachers lower than the attendance rate for students and non-certified staff. Teachers averaged

27
10 days absence from work compared to 7 days absence for students and 6 days for non-
certified staff (Skidmore, 1984). In 1981, the National Survey of Absenteeism reported the
average number of days absent per teacher by negotiating status of school system was 8.2 days
in systems that negotiate with teachers and 7.2 days in systems that do not negotiate with
teachers.
Professional Leave.
There are many contributors to the rising rates of teacher absenteeism; however, it
seems that a large contributor to teacher absenteeism is the mandatory leave for professional
development training programs (Griswold & Hughes, 1997; Hawkins, 2000). In fact, the state
of Georgia now includes a required professional development component for every teacher as
part of the teacher’s annual evaluation. Along with the obvious issue of the teacher being
absent from the classroom, there is the added issue that many times the training received by the
teacher is not always useful (Hawkins, 2000). Matthews (2000) reported Teachers in Grosse
Pointe, Michigan were discouraged that their professional development consisted of vague or
irrelevant speeches by college professors or book authors who had never taught a class of
freshmen. Matthews also reported other teachers complained that, although some of the in-
service activities were good, they seemed to be getting what the administration wanted and not
necessarily what the teachers or students needed. Compounding the problem of the teacher
being absent from the classroom is the fact that student learning is interrupted with the use of a
substitute.
Teacher Absenteeism and Student Achievement
After a national survey of selected principals in 1978, Manlove and Elliot found six
major costs associated with teacher absenteeism:

28
(1) Instructional costs
(2) Financial costs
(3) Management costs
(4) Program costs
(5) Organizational costs
(6) Credibility costs.
Financial costs have been discussed previously; however, the loss of instructional time
is the most serious of all the problems associated with teacher absence (Elliot, 1982). The fact
that students are not achieving and that teacher attendance rates are rising reflects the need for
change in the way schools are organized and the way instruction is delivered (Pitkoff, 1993).
“Liberal contracts for teachers, provisions of the Family and Medical Leave Act, and
mandatory in-service training have all led to teachers spending less time in their classrooms and
to a greater need for substitute teachers” (Jones, 1999, p. 2).
Research on effective teaching highlights time-on-task as a significant variable in
student achievement (Anderson, Evertson, & Emmer, 1980). The more time teachers spend
away from class, the more time students spend with substitute teachers. Wiley and
Harnischfeger (1974) found in terms of typical gains in achievement over a year’s period, that
in schools where students receive 24% more schooling, they increase their average gain in
reading comprehension by two-thirds and their gain in mathematics and verbal skills by more
than one-third.
If teachers are dissatisfied with their work lives, not only will they suffer, but their
students will suffer as well (Bryk & Driscoll, 1988). Referring to administrators’ need to
reexamine their roles as instructional leaders and personnel managers, Deay and Bontempo
(1986) suggested that administrators not fail to consider the potential impact of substitute

29
teachers on student learning. “Substitutes are rarely as effective as the regular teachers they
replace; therefore, valuable instruction is lost and student achievement may suffer as a result”
(Jacobson, 1990, p. 78). Rarely do students, teachers, or administrators regard substitutes as full
professionals who meet accepted standards of practice (Abdal-Haqq, 1997). However, most
school systems are not adequately preparing or training their substitutes. In fact, a survey
conducted by the Substitute Teaching Institute at Utah State University found that 64.8% of
school districts do not require substitute teachers to complete an orientation session.
Additionally, 91.8% of school districts provide no ongoing training for current substitute
teachers (Hawkins, 2000). “It would be safe to say that in many districts substitutes are selected
for their availability more often than they are selected for successful teaching” (Capitan et al.,
1980, p. 2).
Pitkoff’s (1993) Brooklyn study revealed significant relationships between increased
teacher absenteeism and the following:
(a) Lower student achievement in reading writing, and math,
(b) poor student attendance,
(c) higher student drop out rates,
(d) high minority enrollment, especially Hispanic students, and
(e) poverty, as measured by eligibility for free lunch.
Leadership
Acknowledgement of the impact of principals’ leadership behaviors on school outcomes
has generated an extensive body of research over the past decade (Leithwood, Bagley, &
Cousins, 1991). The importance of strong leadership at the school level and the effect of certain
leadership behaviors of the principal are both explicit and implicit in professional literature and
30
research. The principal has been singled out as the most important factor in effective schools
(Gallmeier, 1992). Yet, the majority of studies on leaders over the last 50 years were conducted
in industrial and military settings. Early principal studies borrowed heavily from these studies
(Thomas, 1997). A key point in the early development of models and theories of leadership was
made by Lewin and Lippit in 1938. They suggested that three different approaches to
leadership could be:
(1) autocratic, characterized as directive and task-oriented
(2) democratic, characterized as participative and process and relationship
oriented; and
(3) laissez-faire, characterized as non-directive and lacking formal leadership.
In 1960, McGregor developed the Theory X/Theory Y model in which he states that
Theory X leadership resembles authoritarian behavior and is based on the assumption that the
power of the leader comes from the position he occupies, and that people are basically lazy and
unreliable. Theory X leaders also assumes that most people prefer to be directed and desire
safety above all else. Conversely, Theory Y leadership resembles democratic behavior and
assumes that the power of leaders is granted to them by those they are to lead, and that people
are basically self-directed and creative if properly motivated. It would stand to reason then that
the task of management would be to unlock the potential in individuals.
On the surface, one might get the impression that managers who subscribe to Theory X
would usually control, direct and closely supervise individuals, while managers who subscribe
to Theory Y would be more supportive and facilitating of individuals, attempting to unlock
their potential. Hersey and Blanchard (1993) caution against this, though. They suggested that
Theory X and Theory Y are attitudes, or predispositions, managers have toward people.

31
Consequently, although Theory Y assumptions may be the best the attitudes for a manager to
have, it might be necessary to behave in a Theory X manner toward immature employees who
might need “directing” or “controlling.”
Another common model of leadership, situational leadership, was developed by Hersey
and Blanchard (1977). In this model, two dimensions of leadership behavior, task and
relationship behavior, are characterized in one of four ways:
(1) low task and low relationship;
(2) high task and low relationship;
(3) high relationship and low task; and
(4) high task and high relationship.
Hersey and Blanchard (1977) proposed that leaders’ behaviors should be different in terms of
emphasis on task and behavior depending on the maturity of the followers. In other words, a
leader might find it necessary to operate in all four dimensions depending on the readiness of
the individual to follow the leader. For the purposes of this research, principal leadership style
is examined under the Theory X and Theory Y model of leadership proposed by Douglas
McGregor.
Job Frustration/Job Satisfaction
Much research is available on the teaching profession and stress and burn out. However,
little research has been conducted on the symptoms of teacher stress. Derobbio and Iwanicki
(1996) listed frustration, among a cadre of other symptoms, as a symptom of stress and
burnout. Kyraicou (1987) defined teacher stress in terms of experiences by teachers of
unpleasant emotions resulting from aspects of their work. Such emotions might include
tension, frustration, anxiety, anger, and depression. So, although little research has been

32
conducted on teacher frustration, many researchers identify frustration as a symptom of a much
greater and more researched problem – teacher stress and burnout.
Gold and Roth (1993) defined stress as “a condition of disequilibrium within the
intellectual, emotional, and physical state of the individual; it is generated by one’s perceptions
of a situation, which result in physical and emotional reactions. It can be either positive or
negative, depending on one’s interpretations.” The principal plays a key role in teacher burnout
and stress, both as a major source of support and the main source of stress. Teachers often cite
stress as a reason for leaving the profession, including stress caused by negative relationships
with their building principals. These negative relationships may lead to stress-induced illness
behavior in teachers (Blase & Kirby, 1992).
Grossnickle (1980) identified six sources of workplace related teacher stress:
(1) Relationships with colleagues, administrative staff, clerical staff, and students
(2) Complex communication needs
(3) Inattentive students
(4) Discipline
(5) Daily abuse from parents and students
(6) High community standards for teacher conformity to social values.
A number of researchers have studied the relationship between principals’ leadership style and
decision-making processes and teacher satisfaction and performance (Kirby, Paradise, & King,
1992; Koh, Steers, & Terborg, 1995). In a study of metropolitan Washington, D.C. schools,
Hunter-Boykin, et al. (1995) found a low but positive relationship between principals’
leadership styles and teachers’ morale. Broiles (1982) reported that one-third of California
teachers surveyed rated their jobs as stressful or extremely stressful. Long-term exposure to

33
stress in the workplace provokes sickness absence, psychosomatic symptoms, and burnout
(Imants & VanZoelen, 1995).
Teacher stress is not a dilemma that is limited to the United States. “The research
evidence from studies of teacher stress carried out in different countries not only attests to the
endemic and cross-cultural nature of the phenomenon, but also to how serious the problem is”
(Borg, & Riding, 1991, p 263). In a survey of comprehensive school teachers in England,
Kyraicou and Sutcliffe (1979) found that 30.7% of teachers rated teaching as either stressful or
extremely stressful. Researchers also have found a statistically significant, negative relationship
between teacher stress and teacher job satisfaction. In a study of 545 teachers in the Malta
educational system, Borg and Riding (1991) reported statistically significant, positive
relationship between teacher stress and satisfaction in teaching.
Yet another type of stress that teachers must face is the stress of public scrutiny. “The
stress of public scrutiny and educational reforms over the past three decades underscored
teacher burnout as one of the most common and serious afflictions of the nation’s educators,”
according to Dunham (1992, p. 2). Burnout has struck all professions, but a review of
professional literature and news media reports over the past decade reveals that burnout has
struck the teaching profession extremely hard (Kiff, 1986).
Burnout begins as an emotional problem like energy deficiency, nervousness, knots in
the stomach, irritability, anxiety, and difficulty in making the minutest decisions. If the
underlying causes of stress are not dealt with, then burnout may progress to behavioral or
physical problems. According to Kiff (1986), if steps are not taken to alleviate the stressful
situations, burnout can ruin the health of the sufferer. Kiff (1986) also noted the following five
causes of burnout:
34
1. Expectations to conform to a code of conduct which exceeds general
community standards;
2. Parents blaming teachers when progress is not made by children who have
emotional problems or learning disabilities;
3. Threat of direct physical abuse;
4. Pressure applied by administrators in the form of teaching overloads and time
consuming non-instructional activities; and
5. Internal self-imposed stress by teachers who are inadequately trained or those
not suited for the profession.
The effects of teacher burnout are difficult to measure directly, but statistical trends
indicate the problem is significant and widespread. Over the past two decades, large numbers of
teachers have left the profession for jobs they feel are less stressful and more financially
rewarding (Kiff, 1986). Additionally, Kiff noted that teachers with only a few years of
experience on the job are more likely to leave; that a number of career teachers are opting for
early retirement; and that the number of medical claims filed by teachers is rising.
A growing number of researchers report that burnout can result in ulcers, high blood
pressure, headaches, and depression. “Burnout is real, it is insidious, and it robs many teachers
of their hunger to pursue their chosen profession while devastating their health. Simply stated,
burnout is defined as both emotional and physical exhaustion brought on by unalleviated job
strain” (Kiff, 1986, p. 15).
Job Satisfaction and Absenteeism
Absenteeism is not a frequently researched effect of work stress. Additionally, theories
of absenteeism seem to neglect stress at work as a cause of absence behavior (Smulders &
35
Nijhuis, 1999). However, stress has been identified as one of the factors related to teacher
attrition and is believed to be a cause of high teacher turnover and absenteeism (Hammond &
Onikama, 1997).
In 1991, Scott and Wimbush found that job satisfaction was the single most important
factor affecting attendance motivation. Savage (1967) found that achievement, recognition,
interpersonal relations with students, and the work itself were all factors that led to teacher job
satisfaction. However, Sergiovanni (1967) found that interpersonal relations with subordinates,
supervisors, and peers, as well as technical supervision, school policy, administration, and
personal life to be factors contributing to low teacher morale.
As politicians scramble to bring about education reform, teachers find
themselves struggling to adapt to changes that literally change with each political election.
Societal demands and increased public demands on education have produced adverse
classroom situations that have led to increased emotional and physical disabilities among
teachers (Chance, 1992). For example, Dutch researchers discovered that more than 50% of
sickness absence is caused by combinations of psychological factors and the workplace
conditions affecting stress (Imants & VanZoelen, 1995). Druss, Schlesinger, and Allen (2001)
reported, “If absenteeism can be viewed as a form of withdrawal, teachers are withdrawing
from coming to schools in which they themselves are not successful” (2001). For example, A
New York study found that teachers in Brooklyn high schools were absent an average of 7.8
days per school year. Almost one-fourth of the teachers were absent 10 or more days,
exceeding their contractual allowance (Pitkoff, 1993). Additionally, a study conducted for the
American Psychiatric Society (2001) found that absenteeism due to health problems was twice

36
as high for employees with depressive symptoms. It also revealed the likelihood of decreased
performance on the job is seven times higher for depressed employees .
Chapter Summary
While research shows that teacher absenteeism is a growing concern, what little
research that has been conducted reveals inconsistent findings concerning what variables may
contribute to the phenomenon. What is known through inspection of data is that, for whatever
reason, teacher absenteeism continues to rise and so does the expense for paying for those
absences, not only financially, but also in the realm of student achievement.
Very little research has focused on the possible relationships among teacher
absenteeism, principal leadership style, and teacher frustration level. Considering that previous
research on other variables has yielded inconsistent findings, it is vital that researchers continue
their efforts to identify possible causes of the problem so that solutions may be developed to
curb the escalating rate of teacher absenteeism. Solutions would not only save school systems
significant amounts of money, but also student achievement would rise as qualified teachers
spend more time in direct instruction with their students.

37
CHAPTER 3
METHODS
The purpose of this chapter is to present the methods used to complete this study.
Included in this chapter are the research questions, a description of the subjects, a description of
the teacher absence data, a description of assessments used, data collection procedures, and the
method of data analysis.
Research Questions
As already noted in the review of literature, teacher attendance in the public schools
continues to be major problem for administrators and personnel officials around the country.
More generous leave policies as a result of collective bargaining, greater workload demands on
teachers, and difficult working conditions have all been established through research to have
some impact on teacher absenteeism. With the financial costs of paying for substitutes and,
more importantly, the cost in student learning, it is critical that research in the area continue so
that changes may occur. This study looks specifically at the following research questions:
1. Is there a statistically significant relationship between the rate of teacher
absenteeism and the principal’s leadership philosophy?
2. Is there a statistically significant relationship between the rate of teacher
absenteeism and the teachers’ frustration levels?
3. Is there a statistically significant relationship between the principals’ leadership
philosophy and the teachers’ frustration levels?

38
Research Design
The study is a non-experimental ex post facto analysis. Research will try to establish
relationships between pre-existing conditions and whether or not they may relate to subsequent
differences in the group of subjects. Variables in the study include principals' leadership styles,
teachers' frustration levels, and teacher absenteeism. All 32 principals in a suburban Atlanta
school system were surveyed with the Managerial Philosophies Scale (Jacoby & Terborg,
1975a). All teachers (approximately 1,650) in the same system were surveyed with the
Organizational Frustration Scale (Spector, 1975). Teacher attendance data from the previous
semester were obtained from the school system's computerized personnel records. The study
will be concerned with the relationships among these sets of data.
Correlational studies benefit researchers in two ways. First, they indicate the “strength
or amount of the relationship so that a single value will tell us at a glance how two variables are
related” (Bartz, 1999, p. 163). Secondly, they help researchers to predict scores on one variable
based on the knowledge of another. Bartz (1999) reported an additional reason to analyze data
with correlations. He noted that they are informative and descriptive tools that can be easily
understood by nonstatisticians.
Strengths of the Design
Spector (1981) identified the following as strengths in the correlational design: 1. Ease of administration. 2. Usefulness in determining relationships among variables.
3. Ability to be repeated over time and become part of a longitudinal survey.
Weaknesses of the Design
Spector (1981) also identified the following weaknesses in the correlational design:

39
1. Usefulness is only in establishing relationships.
2. Subjects’ failure to respond honestly and accurately could lead to false relationships.
3. The Hawthorne Effect could become an issue as subjects become aware of their
participation in a study.
Null Hypotheses
Hypothesis 1A: There is no statistically significant positive relationship between teacher
absenteeism and the X-scores of principals on the Managerial Philosophies Scale.
Hypothesis 1B: There is no statistically significant negative relationship between
teacher absenteeism and the Y-scores of principals on the Managerial Philosophies Scale.
Hypothesis 2: There is no statistically significant positive relationship between teacher
absenteeism and the teachers’ frustration levels.
Hypothesis 3A: There is no statistically significant positive relationship between the X-
scores of principals on the Managerial Philosophies Scale and the teachers’ frustration levels.
Hypothesis 3B: There is no statistically significant negative relationship between the Y-
scores of principals on the Managerial Philosophies Scale and the teachers’ frustration levels.
Limitations
Like most studies, this research project has its limitations. These limitations are:
1. Correlational studies may only suggest, but they can not establish,
causation (Fraenkel & Wallen, 1990).
2. The MPS (Jacoby & Terborg, 1975a) was the sole instrument used to
determine principal leadership style.
3. Teachers’ frustration levels were determined solely by their responses
on the OFS developed by Spector (1975).

40
4. The study was conducted in a single suburban Atlanta school district
and my not be generalized to other systems.
5. It was impossible to control all of the variables that might have influence on
the results of the study.
6. The validity of the outcomes on the survey instruments depended on the
truthfulness with which subjects responded to their surveys.
Subjects
The school system in which this study was conducted is large, geographically
encompassing 393 square miles. Population in the county is growing at a rapid rate. In the last
four years, the school system has opened five new schools. According to 2000 census data, the
total population for the county was 139,277, an increase of 45.9% over the previous census
period. Of the total population, 80.8% are white and 7.3% are black. Hispanics comprise 19.6%
of the total population (2003, Georgia Department of Community Affairs). The median
household income was $38,438. During the 2002–2003 school year, the school system reported
a total student enrollment, pre-K-12 of 21,533. Slightly more than 40% of the student
enrollment qualified for the federally subsidized free and reduced lunch program. Average
daily attendance for the student population surpassed the 95% mark; the pupil to teacher ratio
was 16.5:1; and the per pupil expenditure for the system was $6,250.
To provide a sample size large enough to insure valid results in this study, every
principal and teacher in a suburban, metropolitan Atlanta school system was asked to
participate in this study. The system is currently undergoing massive demographic changes
moving it rapidly from a rural school system to a suburban school system. The subject pool
consisted of 19 elementary school principals, 6 middle school principals, 6 high school

41
principals, 1 evening school principal, and every teacher from each school. Of the 32 principals
in the system, 3% held master’s degrees, 60% held education specialist degrees, and 37% held
doctoral degrees. The average number of years that the administrators have served in education
is 25. The return rate of the MPS by the principals was 100%. Of the 1,605 teachers employed
in the 32 participating schools, 1,160 returned surveys. The percentage of teachers completing
the OFS ranged from 44.44% to 100% (see Table 1), with the mean participation rate being
77%. Additionally, of the 1605 teachers in the system, 36% held bachelor’s degrees, 46% held
master’s degrees, 16% held specialist’s degrees, and 2% held doctoral degrees. The number of
years experience for the teachers participating in the study was represented by the following:
22.8% of all teachers in the system have taught from 1–5 years; 21% of teachers in the system
taught between 6–10 years; 19.25% of teachers in the system taught between 11-15 years; and
36.95% of teachers in the system taught 16 years or more.
Attendance Incentive Plan
To promote good attendance by teachers, the school system being studied offered
several incentives to personnel. First, any classroom teacher who began the school year with an
accumulated balance of 45 sick leave days and did not miss any days received a bonus of $125.
A person who misses all or a portion of one day received $50. Additionally, a sick leave bank
was available to all employees who have five days of accumulated leave. To join the bank, the
employee must donate one sick leave day to the bank. When an employee is ill, he or she may
withdraw up to 50 days from the bank. Also, the Teacher Retirement System in Georgia now
allows teachers to apply unused sick leave towards early retirement.

42
Table 1
Number and Percentage of Teachers Responding to the OFS by School
Number of Number of Percentage of School Teachers Teachers Teachers Number Employed Responding Responding 1 66 61 92.42 2 62 36 58.06 3 63 40 63.49 4 71 44 61.97 5 72 67 93.05 6 67 49 73.13 7 65 54 83.07 8 58 54 93.10 9 62 42 67.74 10 60 56 93.33 11 68 41 60.29 12 62 48 77.42 13 39 24 61.54 14 39 28 71.95 15 46 36 78.26 16 40 30 75.00 17 42 24 57.14 18 31 31 100.00 19 59 36 61.02 20 54 24 44.44 21 34 20 58.82 22 50 44 88.00 23 54 47 87.04 24 35 29 82.86 25 34 32 94.12 26 44 27 61.36 27 47 37 78.72 28 49 31 63.27 29 52 25 48.07
table continues

43
Number of Number of Percentage of School Teachers Teachers Teachers Number Employed Responding Responding 30 36 27 75.00 31 37 29 78.38 32 7 7 100.00
Teacher Absence Data
Teacher attendance data was obtained from computerized records maintained by the
school system central office. The report reflects all certified teachers in the district by code and
by school. To prevent long-term illnesses, major surgery, maternity leave, and anyone taking
leave under the Family Medical Leave Act (FMLA) from skewing the data, employees who
were absent 30 or more days were excluded from the average teacher absence rate for the
school. Generally speaking, maternity leaves and major surgeries constitute a six-week period,
while use of the FMLA could incorporate as much as 12 weeks; consequently, 30 days of
absences was selected as the cut-off for this study. Absences of 30 or more days are, most
probably, a result of a personal or a family-related major medical condition and not a result of
principal leadership style or teacher frustration level. Absences due to the request of a
government agency were not considered in figuring the teacher absence rate.
Measurement Instrumentation
There were two instruments administered to produce this research: the Managerial
Philosophies Scale and the Organizational Frustration Scale.
44
The Managerial Philosophies Scale (MPS)
Jacoby and Terborg (1975b) used the principles of Douglas McGregor’s Theory X and
Theory Y assumptions of the nature of man to develop the MPS. McGregor (1960) asserted that
the way in which a manager interacts with superiors, peers and especially subordinates depends
on the manager’s philosophy of what motivates human behavior. Prior to the development of
the MPS by Jacoby and Terborg (1975a), little empirical research had been done to confirm or
discount McGregor’s managerial theories. Since that time, a number of studies have confirmed
the validity of McGregor’s assertions (Donnell, & Hall, 1988). Specifically, Hall and Donnell
(1979) found that high achievers held significantly fewer Theory X assumptions than do either
average or low achievers.
Scoring the MPS
The MPS consists of 36 items which subjects respond to on a scale ranging from +3 (I
agree very much) to -3(I disagree very much). Scoring the instrument yields two scores – the
Theory X score indicates the degree to which the respondent subscribes to a more pessimistic
view of human nature and the Theory Y score which indicates the degree to which the
respondent subscribes to a more positive outlook of the nature of human work. Raw scores on
the Theory X scale range from 33 to 130 and from 28 to 85 on the Theory Y scale. Respondents
convert their raw scores into percentiles and, using a philosophy scoring graph, determine the
degree to which they agree or disagree with Theory X and Theory Y philosophies (Jacoby, &
Terborg, 1975c).
Reliability and Validity of the MPS
Based on data collected from 161 supervisors and 275 non-supervisors, the authors
constructed a 24 item X scale and a 12 item Y scale, each having high internal consistency (r =

45
.85 and r = .77, respectively) and acceptable test-retest reliability. In a separate study, Pearson
reported alphas of .89 and .75 for the X and Y scales. The X and Y scales are negatively
correlated (r = -.55, p < .001, N = 436), and X scores are positively correlated with Rokeach’s
Dogmatism Scale, a measure of general authoritarianism (r = .42, p < .01, N = 77), giving
evidence of construct validity.
The Organization Frustration Scale (OFS)
Developed in 1975 by Paul Spector, the OFS was used to measure the level of
frustration experienced by teachers on the job (Appendix A). The OFS is a 29-item, six- choice,
Likert format questionnaire designed to measure the level of frustration experienced by any
employee in their job. An original item pool of 37 was generated from responses of
approximately 25 people responding to the question, “What is frustrating?” The items that were
generated concerned aspects of a job, supervisor, or job environment which fit a very broad
definition of frustration.
Scoring the OFS
Subjects completing the OFS indicated their agreement or disagreement with a
statement by choosing a number on a range from +3 (agree completely) to -3 (disagree
completely). Of the 29 items on the OFS, 24 are positively worded. That is, a +3 indicates
maximum frustration for one of these items while a -3 indicates minimum frustration. The
remaining five items are negatively worded. A +3 for one of these items indicates minimum
frustration while a -3 indicates maximum frustration. A mean score was obtained for each
school.

46
Reliability and Validity of the OFS
To determine reliability, the original 37 item pool was administered to 82 people. Following an
item analysis of the responses, 29 items which exhibited a correlation of .43or greater were
retained. The 29-item scale was readministered to a group of 50 people and the item analysis
repeated. All 29 items were retained. A coefficient alpha of .88 was found.
In testing for validity, 82 people completed the OFS and a response to the OFS.
“Significant correlations were found ranging from .25 to .64 between frustration as measured
by the OFS and behaviors which were predicted a priori to be related to it, such as sabotage,
hostility, and indirect aggression” (Spector, 1975, p. 1). In two additional studies, OFS scores
were found to be correlated with consideration of quitting the job (r = .64, .77). There was also
additional support found that correlated frustration level to turnover (Spector, 1975).
Data Collection Procedure
Principals’ leadership philosophies data were obtained at a regularly held monthly staff
meeting at the central office. Once a month, each school principal in the system meets at the
central office for the purposes of discussing old and new items of business in the areas of
physical operations, fiscal operations, personnel, and curriculum issues. During one of these
meetings, each principal was administered the Managerial Philosophies Scale (MPS). A cover
letter describing the purpose of the study and instructions for completing the MPS was included
(Appendix D).
On completion of the MPS, each principal was given enough Organizational Frustration
Scales (OFS) for each teacher in their respective schools. Included with the OFS was a cover
letter for the teacher describing the purpose of the study and instructions for completing the
OFS (Appendix D). An instruction letter was also included with the packet for the principal.

47
The principal was asked to select a faculty member to administer the OFS during a faculty
meeting and to return the completed forms in a sealed envelope within a four-week period.
Those schools who did not return their instruments within the time period received a follow-up
phone call reminding them to return their surveys. The goal of the study was 100%
participation by the administrators and a minimum of 70% of the teachers.
Data Analysis
The purpose of this study was to identify any statistically significant relationships that
might exist among teacher absenteeism, principal leadership style, and teacher frustration level.
To determine these relationships, absenteeism rates for each school in the system were
compared to the managerial philosophy of each school’s leader, as identified by the Managerial
Philosophy Scale, and to the mean scores of each school’s teachers, as measured by the
Organizational Frustration Scale.
The most often used method to establish relationships among sets of data is
correlational. Because the Pearson-Product-Moment correlation coefficient is the most widely
used measure of relationships existing among data (McMillan, & Schumacher, 1984), it was
used to measure the relationships among the data in this study; that is, principal’s leadership
styles, as determined by the MPS, and the teachers scores on the OFS were correlated to the
absence rate of each school in the system for the Fall semester to determine if a relationship
existed. In this study the Pearson r determined whether relationships found in the study were
positive or negative, strong or weak. All hypotheses were tested using a one-tailed test of
statistical significance at the .05 level.

48
CHAPTER 4
DATA ANALYSIS
The purpose of this study was to examine the relationships among teacher absenteeism,
principals’ leadership styles, and the frustration levels experienced by teachers on the job, and
the extent to which these are related. Variables included the individual schools’ mean absence
rate, the principals’ Theory X scores, the principals’ Theory Y scores and the teachers’ mean
frustration level scores. The data collected in the study was analyzed using the Pearson
product-moment correlation with significance being determined at the .05 level. One hundred
percent of the 32 principals in the participating school system responded to the Managerial
Philosophies Scale and 1160 (72.27%) of the 1605 teachers in the participating system
responded to the Organizational Frustration Scale.
The following were the null hypotheses considered in this study:
Hypothesis 1A: There is no statistically significant positive relationship between teacher
absenteeism and the X-scores of principals on the Managerial Philosophies Scale.
Hypothesis 1B: There is no statistically significant negative relationship between
teacher absenteeism and the Y-scores of principals on the Managerial Philosophies Scale.
Hypothesis 2: There is no statistically significant positive relationship between teacher
absenteeism and the teachers’ frustration levels.
Hypothesis 3A: There is no statistically significant positive relationship between the X-
scores of principals on the Managerial Philosophies Scale and the teachers’ frustration levels.
Hypothesis 3B: There is no statistically significant negative relationship between the Y-
scores of principals on the Managerial Philosophies Scale and the teachers’ frustration levels.

49
Description of the Absence Data
Teacher absence data were collected from the participating school system’s database of
teacher attendance for the fall semester of the 2003-2004 school year. At the 32 participating
schools, the mean absence rate per employee for each school ranged from 1.29 to 6.02 days.
The mean teacher absence rate for the system was 4.51. Of the participating schools, 18 of the
32 posted a mean absence rate below the system average with the remaining 12 posting absence
rates above the system mean (see Table 2).
For the semester, the teachers in the participating system were absent 64.13% of the
time for illness, 15.16% of the time for personal reasons, 16.56% of the time for professional
leave, 3.02% of the time was leave without pay, and 1.13% of their absences were donated to
the system-wide sick bank. The total monetary cost to the school system for paid teacher
absences, not including the cost for paying substitute teachers, for the first semester of the
2003-2004 school year was $352,047.46.
Table 2
Absence Rates by School
School Number Absence Rate
1 5.64 2 4.47 3 3.93 4 4.78 5 4.25 6 3.24 7 4.17 8 4.97 9 4.48 10 5.94
table continues

50
School Number Absence Rate
11 4.08 12 5.87 13 4.56 14 4.24 15 5.64
16 4.49 17 4.01 18 6.02 19 4.75 20 4.38
21 5.22 22 3.7 23 4.91 24 3.69 25 3.93
26 4.91 27 5.03 28 5.11 29 4.24 30 4.44
31 3.97 32 1.29
Description of Principals
The 32 principals in the participating system were asked to respond to a data sheet that
requested their age, sex, years in administration, years in present position, degree, and
undergraduate major. Of the group, the mean age was 49.2 years, the mean number of years in
administration was 14.05, and the mean number of years in current position was 6.3

51
(see Table 3). Principals ranged in age from 34 to 61 years. The number of years in
administration ranged from 3 to 26 years. Years in current position ranged from 1 to 17 years.
Table 3
Descriptive Data for Principals (N=32)
Mean SD
Age 49.8 5.48
Years in Administration 14.53 7.45 Years in Current Position 6.13 4.97 Of the 32 principals responding to the biographical questionnaire, 1 held a Master’s
degree (3.12%), 20 held Specialist’s degrees (62.5%), and 11 held Doctoral degrees (34.38%).
Undergraduate degrees held by the participating principals included the following: Elementary
Education – 10 (31.25%); Physical Education – 7 (21.88%); Music Education – 2 (6.25%);
Social Studies – 2 (6.25%); Art – 1 (3.12%); Biology – 1 (3.12%); Communications – 1
(3.12%); Distributive Education – 1 (3.12%); Economics – 1 (3.12%); English – 1 (3.12%);
Home Economics – 1 (3.12%); Math Education – 1 (3.12%); Middle Grades Education – 1
(3.12%); Sociology – 1 (3.12%); and, Special Education – 1 (3.12%). Considering gender, 17
of the participating principals were males (53.12%), while 16 were females (46.88%).
Description of Data from MPS and OFS
The Managerial Philosophies Scale (MPS) and The Organizational Frustration Scale
(OFS) were the two instruments used in this study. In this study the MPS was administered to
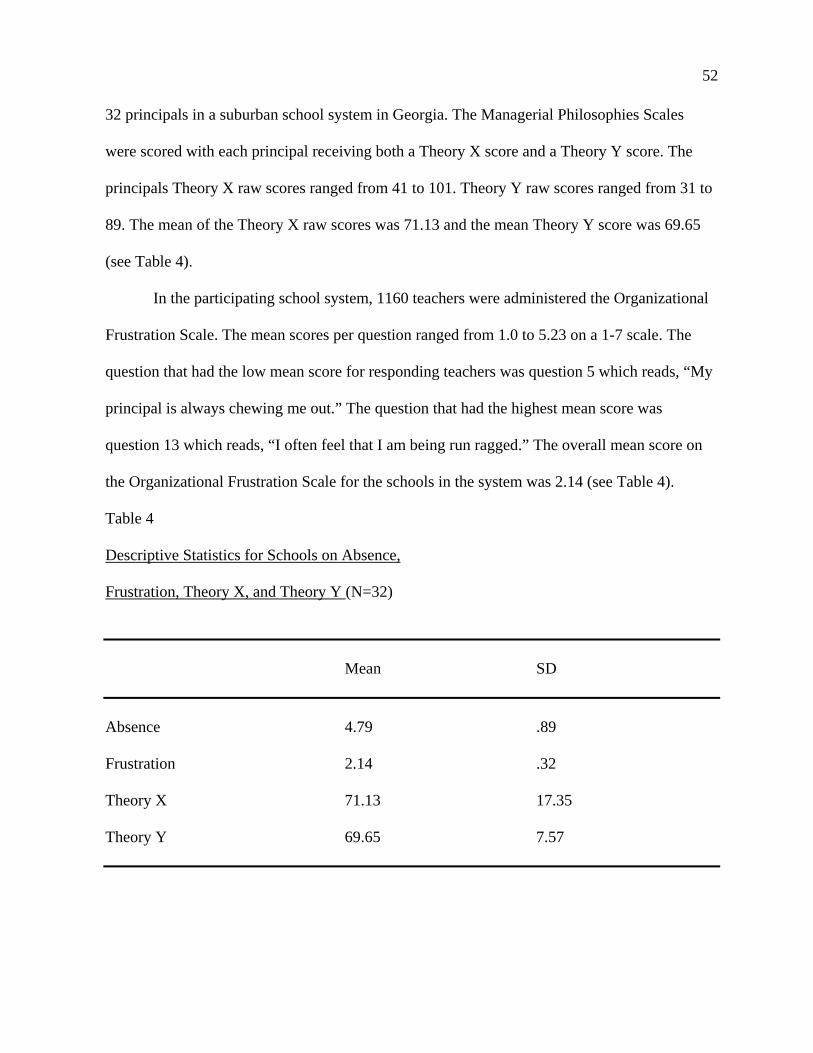
52
32 principals in a suburban school system in Georgia. The Managerial Philosophies Scales
were scored with each principal receiving both a Theory X score and a Theory Y score. The
principals Theory X raw scores ranged from 41 to 101. Theory Y raw scores ranged from 31 to
89. The mean of the Theory X raw scores was 71.13 and the mean Theory Y score was 69.65
(see Table 4).
In the participating school system, 1160 teachers were administered the Organizational
Frustration Scale. The mean scores per question ranged from 1.0 to 5.23 on a 1-7 scale. The
question that had the low mean score for responding teachers was question 5 which reads, “My
principal is always chewing me out.” The question that had the highest mean score was
question 13 which reads, “I often feel that I am being run ragged.” The overall mean score on
the Organizational Frustration Scale for the schools in the system was 2.14 (see Table 4).
Table 4
Descriptive Statistics for Schools on Absence,
Frustration, Theory X, and Theory Y (N=32)
Mean SD Absence 4.79 .89 Frustration 2.14 .32 Theory X 71.13 17.35 Theory Y 69.65 7.57

53
Tests of the Null Hypotheses
Hypothesis 1A – Null Accepted
Hypothesis 1A determined the relationship between teacher absence rates for the
participating schools and the principal’s Theory X-scores on the Managerial Philosophies
Scale. Since the r-value of .195 was not significant at the .05 level, the null hypothesis was
accepted; therefore, no significant, positive relationship existed between teacher absenteeism
and the Theory X-scores of principals on the Managerial Philosophies Scale.
Hypothesis 1B – Null Accepted
Hypothesis 1B determined if a statistically significant negative relationship existed
between teacher absence rates for the participating schools and the principal’s Theory Y-scores
on the Managerial Philosophies Scale. Since the r-value of -.317 was not significant at the .05
level, the null hypothesis was accepted (see Table 5); therefore, no significant positive
relationship existed between teacher absenteeism and the Theory Y-scores of principals on the
Managerial Philosophies Scale.
Hypothesis 2 – Null Accepted
Hypothesis 2 determined if there was a statistically significant, positive relationship
between teacher absence rates for the participating schools and the teachers’ mean scores on the
Organizational Frustration Scale. Since the r-value of .195 was not significant at the.05 level,
the null hypothesis was accepted (see Table 4); therefore, no statistically significant, positive
relationship existed between teacher absence rates and teachers’ frustration levels as measured
by the Organizational Frustration Scale.

54
Table 5
Correlation Matrix for Hypotheses
Theory X Theory Y Frustration Mean Frustration .335* -.163* Mean Absence Mean .195 -.317 .195 *p < .05
Hypothesis 3A – Null Rejected
Hypothesis 3A determined if a significant, positive relationship existed between the X-
scores of principals on the Managerial Philosophies Scale and the teachers mean scores on the
Organizational Frustration Scale. Since the r-value of .335 was significant at the .05 level, the
null hypothesis was rejected (see Table 4); therefore, a statistically significant, positive relation
did exist between the X-scores of principals and the teachers’ frustration levels as measured by
the Organizational Frustration Scale.
Hypothesis 3B – Null Rejected
Hypothesis 3B determined if a statistically significant, negative relationship existed
between the Y-scores of principals on the Managerial Philosophies Scale and the teachers mean
scores on the Organizational Frustration Scale. Since the r-value of -.163 was significant at the
.05 level, the null hypothesis was rejected (see Table 4); therefore, a significant, negative
relation did exist between the Y-scores of principals and the teachers’ level of frustration as
measured by the Organizational Frustration Scale.

55
Post-hoc Analysis of “Principal” Items in the
Organizational Frustration Scale
In the Organizational Frustration Scale, there were six items directly related to the
principal of the school. These questions were:
Question 5 – My principal is always chewing me out.
Question 6 – My principal feels my performance is poorer than it is.
Question 7 – I find it easy to talk to my principal.
Question 17 – My principal always seems to be looking over my shoulder.
Question 18 – My principal does not trust me.
Question 21 – I dread having to interact with my principal.
In an effort to determine if the six “principal” items on the Organizational Frustration
Scale had any statistically significant relationship with teacher absenteeism, Theory-X scores of
principals, and Theory-Y scores of principals, the mean scores of these six items for each of the
participating schools were correlated with the mean absence rate the schools, Theory-X scores
and Theory-Y scores of principals.
Looking at the six “principal” items on the Organizational Frustration Scale, they
correlated to the mean absence rate with an r-value of .258. Since this value was not significant
at the .05 level, it was determined that there was not a significant, positive relationship. An r-
value of .191 was produced when the six “principal” items on the Organizational Frustration
Scale were correlated to Theory-X scores of principals. Since the r-value was not significant at
the .05 level, it was determined that a significant, positive relationship did not exist. Finally,
when correlated to Theory-Y scores of principals, the six “principal” items produced an r-value
of -.163 which was not significant at the .05 level; therefore it was determined that a
significant, positive relationship did not exist (see Table 6).

56
Table 6
Post-hoc Correlation of the Six “Principal Item"
Frustration Mean with Theory X and Y
Scores and Absence Mean
Theory X Theory Y Mean Absence 6 Principal Items .191 -.163 .258
Chapter Summary
Analyzing the data resulted in the acceptance of three of the five null hypotheses. Null
hypotheses 3A and 3B that were rejected suggest that there is a statistically, significant positive
relationship that exists between the Theory-X style of leadership as measured by the MPS and
teacher frustration level and that a statistically, significant negative relationship exists between
Theory-Y leadership and teacher frustration levels as measured by the OFS. Outside of the
relationship between Theory-X and Theory-Y style leadership and teacher frustration, the data
suggests that no significant relationship exists between Theory-X style leadership and teacher
absence rates, Theory-Y leadership style leadership and teacher absence rates, or teacher
frustration level and teacher absence rate.
57
CHAPTER 5
FINDINGS, CONCLUSIONS, AND RECOMMENDATIONS
This study was a replication study of one that was conducted approximately 16 years
ago in a large metropolitan school system in Georgia. Particularly, this study was conducted to
see if data would suggest different findings in a suburban school system in Georgia.
Principally, this study investigated the relationships among teacher absenteeism, principal
leadership styles, and teacher frustration levels. The study was concerned with the following
questions:
1. What relationship exists between teacher absenteeism and the leadership style
of principals? Do schools with Theory-X style leaders have different absence rates than schools
with Theory-Y style leaders?
2. What relationship exists between teacher absenteeism and teacher frustration
levels? Do schools with higher levels of teacher frustration levels experience greater teacher
absenteeism?
3. What relationship exists between principal leadership style and teacher
frustration levels? Specifically, do schools with Theory-X or Theory-Y style leadership
experience greater or smaller levels of teacher frustration?
Based on these questions, the following hypotheses were formed:
1A) There is a statistically significant positive relationship between teacher absenteeism and
the X-scores of principals on the Managerial Philosophies Scale.

58
1B) There is a statistically significant negative relationship between teacher absenteeism and
the Y-scores of principals on the Managerial Philosophies Scale.
2) There is a statistically significant positive relationship between teacher absenteeism and
the teachers' frustration levels as evidenced by their scores on the Organizational Frustration
Scale.
3A) There is a statistically siginificant positive relationship between the X-scores of
principals on the Managerial Philosophies Scale and the teachers' frustration levels as
evidenced by their scores on the Organizational Frustration Scale.
3B) There is a statistically siginificant negative relationship between the Y-scores of
principals on the Managerial Philosophies Scale and the teachers' frustration levels as
evidenced by their scores on the Organizational Frustration Scale.
Summary of Findings and Conclusions
Hypotheses 1A and 1B.
Data determined that a significant positive relationship at the .05 level between teacher
absenteeism and Theory-X style leaders as measured by the Managerial Philosophies Scale did
not exist. Much of the review of literature supports the idea that the school principal has
significant impact on school operations, both positively and negatively (Anderman, Belzer, &
Smith, 1991; Firestone & Rosenblum, 1988; Hunter-Boykin, Evans, & Evans, 1995; Jacobson,
1990; and, Stallings & Mohlman, 1981). Additionally, there is a great deal of literature from
business and industry that supports the notion that managerial style has significant influence on
employee attendance (Capitan, Costanza, & Klucher, 1980; Lippman, 2001; Mitchell, 2001;
Pellicer, 1984, and Steers & Rhodes, 1990). Yet, regardless of what historical research
suggests about managerial style and employee absenteeism, no statistically, significant positive

59
relationship was found to exist between Theory-X or Theory-Y style leaders and teacher
absenteeism.
Hypothesis 2.
Although research has linked teacher frustration to job satisfaction (Pellicer, 1984), this
study found no statistically significant, positive relationship between teacher frustration level,
as measured by the OFS, and teacher absenteeism at the .05 level. According to Pellicer (1984),
a lack of job satisfaction caused serious withdrawal problems among teachers that resulted in
excessive absenteeism. Elliott (1982) also identified several characteristics of job satisfaction
that he found to be related to teacher absenteeism. He found that high levels of absenteeism
occur in school districts where there are low levels of faculty agreement about the goals and
policies of the community and district. However, low levels of absenteeism are reported in
districts with high levels of community support and policy agreement, and when there are
smaller sub-units within the school, and the teachers in those units are interdependent. Other
factors contributing to teacher frustration like job assignment, salary, and organization size and
climate have also been linked to higher levels of job dissatisfaction (Pitkoff, 1993; Elliott,
1982; Rossmiller, 1992; Hunter-Boykin, Evans, & Evans, 1995). Yet, despite the findings of
earlier research in teacher frustration, defined by some as job satisfaction, being linked to
teacher absenteeism, this research study concurs with Rocquemore (1988) in finding that there
is no significant relationship between the two.
Hypotheses 3A.
Unlike Rocquemore’s (1988) study, a significant, positive relationship at the .05 level
was found between Theory X-scores of principals as measured on the MPS and teacher
frustration levels as measured by the OFS. In the participating system, these findings suggest

60
that teachers in schools where principals posted higher Theory-X scores experienced greater
levels of frustration.
Hypothesis 3A intended to determine if a significant, positive relationship existed
between the X-scores of principals on the Managerial Philosophies Scale and the teachers mean
scores on the Organizational Frustration Scale. Since the r-value of .335 was significant at the
.05 level, the null hypothesis was rejected (see Table 4); therefore, a significant, positive
relation did exist between the X-scores of principals and the teachers’ frustration levels as
measured by the Organizational Frustration Scale. Similar findings were found by Blase and
Kirby (1992). They found the principal plays a key role in teacher burnout and stress, both as a
major source of support and the main source of stress.
According to McGregor (1967), managers who subscribe to Theory-X style leadership
hold underlying assumptions about their employees. Among other assumptions, Theory-X style
managers assume most people prefer to be directed, are not interested in assuming
responsibility, and want safety above all else. Managers who accept these assumptions attempt
to control, structure and closely supervise their employees and believe that external control is
appropriate for dealing with unreliable and irresponsible employees. Based on the findings of
this research, principals with higher levels of Theory-X beliefs had teachers with higher levels
of frustration. Literature has already established that frustration is a symptom of stress
(Derobbio & Iwanicki, 1996). Teachers often cite stress as a reason for leaving the profession,
including stress caused by negative relationships with their building principals.
Acknowledgement of the impact of principals’ leadership behaviors on school outcomes has
generated an extensive body of research over the past decade (Leithwood, Bagley, & Cousins,
1991). The importance of strong leadership at the school level and the effect of certain

61
leadership behaviors of the principal are both explicit and implicit in professional literature and
research. The principal has been singled out as the most important factor in effective schools
(Gallmeier, 1992).
Hypothesis 3B – Null Rejected
Hypothesis 3B intended to determine if a significant, negative relationship existed
between the Y-scores of principals on the Managerial Philosophies Scale and the teachers mean
scores on the OFS. Since the r-value of -.163 was significant at the .05 level, the null
hypothesis was rejected (see Table 4); therefore, a significant, negative relation did exist
between the Y-scores of principals and the teachers’ level of frustration as measured by the
OFS.
In contrast to Theory-X beliefs of human nature, managers who adhere to Theory Y
beliefs believe that people are not naturally lazy and unreliable. In fact, Theory Y style
managers believe that people are self-directed, creative, and motivated intrinsically rather than
extrinsically. McGregor (1967) cautioned against oversimplifying his theory by assuming that
Theory-X style leadership is bad and that Theory-Y style leadership is good. However, data
from this research alludes to greater positive outcomes in the form of less teacher frustration
from principals with stronger Theory Y beliefs. A number of research studies over the last
decade have analyzed the relationship between principals’ leadership style and decision-making
processes and teacher satisfaction and performance (Kirby et al., 1992; Koh, Steers, & Terborg,
1995).
62
Recommendations for Further Study
Considering the great financial costs and the loss of instructional time students suffer, the
investigator recommends further study regarding teacher absenteeism. The following
recommendations are recommended based on the findings of this study and previous research:
1. Further research in the area of teacher absenteeism and principal leadership style
is not recommended.
2. Based on the rejection of null hypothesis 3A and 3B in this study, the
researcher recommends additional research be conducted regarding the relationship between
the level of frustration experienced by teachers and the managerial style of principals.
3. Based on the findings of this research and previous research (Roquemore,
1987), the investigator does not believe additional research should be conducted regarding the
relationship between teacher absence rate and teacher frustration level based on school means.

63
REFERENCES
Abdal-Haqq, I. (1997). Not just a warm body: Changing images of the substitute teacher (Report No. EDO-SP-96-6). Washington, DC: Clearinghouse on Teaching and Teacher Education. (ERIC Document Reproduction Service No. ED 412 208)
Academy for Educational Development Public Policy Division (1977). Report on teacher absenteeism in the public schools of Illinois to the State Board of Education. Springfield: Illinois Office of Education. Author.
Allen, S.G. (1981). An empirical model of work attendance. Review of Economics and Statistics, 63(1), 77-87.
Anderman, E.M., Belzer, S., & Smith, J. (1991, April). Teacher commitment and job satisfaction: The role of school culture and the principal. Paper presented at the annual meeting of the American Research Association, Chicago, IL.
Anderson, L., Evertson, D., & Emmer, E. (1980). Dimensions in classroom management derived from recent research. Journal of Curriculum Studies, 12(4), 343-356.
Argyris, C. (1964). Integrating the individual and the organization. New York: John Wiley and Sons
Bamber, C. (1979). Student and teacher absenteeism. Bloomington: Phi Delta Kappa Educational Foundation.
Bartz, A. E. (1999). Basic statistical concepts. Upper Saddle River, NJ: Prentice Hall.
Billman, L.W. (1994). Keep subs afloat. Executive Educator, 16(10), 29-31.
Blase, J. J., & Kirby, P. C. (1992). Bringing out the best in teachers: What effective principals do. Newbury Park, CA: Corwin Press.
Borg, M. G., & Riding, R. J. (1991). Occupational stress and satisfaction in teaching. British Educational Research Journal, 17(3), 263-281.
Boyer, C.E., (1994). The relationship between buy-back provisions and teacher attendance rates. (ERIC Document Reproduction Service No. ED 384 972).
Bridges, E. M. (1980). Job satisfaction and teacher absenteeism. Educational Administration Quarterly, 16(2), 41-56.
Bridges, E., & Hallinan, M. (1978). Subunit size, work system interdependence, and employee absenteeism. Educational Administration Quarterly, 14(2), 24-42.

64
Broiles, P. H. (1982). An inquiry into teacher stress: Symptoms, sources, and prevalence
(Doctoral dissertation, Claremont Graduate School, 1982) Dissertation Abstracts International, 43(4), 1077–1077a.
Bryk, A. S., & Driscoll, M. E. (1988). The high school as community: Contextual influences and consequences for students and teachers. Chicago: National Center on Effective Schools.
Bunting, C. (2000). Stress on the emotional landscape. Are teachers suffering from institutional depression? Times Educational Supplement [On-line]. Available: http://www.tes.co.uk/search/search_display.asp?section=Archive&sub_section=Briefing&id=340592&Type=0
Bureau of Labor Staistics. (1977, October). Absence from work. Monthly Labor Review, 100(10), 16-24. Author.
Capitan, J. H., Costanza, J., & Klucher, J. (1980). Teacher absenteeism. A study of the Ohio Association of School Personnel Administrators. Seven Hills, OH: American Association of School Personnel Administrators. (ERIC Document Reproduction Service No. ED 185 699)
Chadwick-Jones, J. K., Nicholson, N., & Brown, C. (1982). Social psychology of absenteeism. New York: Praeger.
Chance, E. W. (1992). Visionary leadership in schools: Successful strategies for developing and implementing an educational vision. Springfield, IL: Charles C. Thomas.
Coller, R. (1975). An analysis of teacher absenteeism and its relationship to teacher morale and demographic characteristics of teachers. (Doctoral dissertation, The University of Michigan, 1975). Dissertation Abstracts International, 36, 6388A.
Dalton, D. R., & Perry, J. L. (1981). Absenteeism and the collective bargaining agreement: an empirical test. Academy of Management Journal, 24(2), 425-431.
Deay, A. M., & Bontempo, B.T. (1986). Helping substitute teachers contribute to school effectiveness. Clearing House, 59(8), 359-362.
DeRobbio, R. A., & Iwanicki, E. (1996, April). Factors accounting for burnout among secondary school teachers. Paper presented at the Annual Conference for the American Educational Research Association. New York, NY.
Donnell, S. M., & Hall, J., (1988). Men and women as mangers: A significant case of no significant difference. Organizational Dynamics, 8(4), 60-78.
Druss. B.G., Schlesinger, M., & Allen, H.M., Jr. (2001). Depressive symptoms, satisfaction with health care, and 2-year work outcomes in an employed population. American Journal of Psychiatry, 158(5), 731-734.

65
Dunham, J. (1992). Stress in teaching (2nd ed.). New York: Routledge.
Elliott, P. G., & Manlove, D. C. (1977). The cost of skyrocketing teacher absenteeism. Phi Delta Kappan, 59(4), 269-271.
Elliott, P. G. (1979). Where are the students and teachers? Student and teacher absenteeism in secondary schools. Viewpoints in Teaching and Learning, 55(2), 18-29.
Elliott, P.G. (1982). Update on teacher absenteeism. The Practitioner, 8(2), 1-12.
Ehrenberg, R. G., Ehrenberg, R. A., Rees, D. I., & Ehrenberg, E. L. (1989). School district leave policies, teacher absenteeism, and student achievement. Journal of Human Resources, 26(1), 72-105.
Evans, V., & Johnson, D. (1990). The relationship of principals’ leadership behavior and teachers’ job satisfaction and job-related stress. The Journal of Instructional Psychology, 17(1), 11-18.
Farrell, D., & Stamm, C. L. (1988). Meta-analysis of the correlates of employee absence. Human Relations, 41(3), 211-227.
Ferris, G., Bergin, T., & Wayne, S. (1988). Personal characteristics, job performance, and absenteeism of public school teachers. Journal of Applied Social Psychology, 18(7), 179-186.
Firestone, W. A., & Rosenblum, S. (1988). Building commitment in urban high schools. Educational Evaluation and Policy Analysis, 10(4), 285-299.
Flynn, W.R., & Stratton, W. (1981). Managing problem employees. Human Resource Management, 20(2), 28-32.
Foster, L. (1987). An analysis of school boards’ policies and regulations relative to teacher absenteeism. (Doctoral dissertation, University of Nevada, 1987). Dissertation Abstracts International. 5814A.
Fraenkel, J. R., & Wallen, N. E. (1990). How to design and evaluate research in education. New York: McGraw-Hill.
Gallmeier, K. (1992). The effectiveness of principal leadership style on teacher motivation. (ERIC Document Reproduction Service No. ED 354 591)
Garrison, K. R., & Muchinsky, P. M. (1977). Evaluating the concept of absentee-proneness with two measures of absence. Personnel Psychology, 30(3), 389-393.
Gaudet, F. J. (1963). Solving the problem of employee absence. New York: American Management Association.

66
Georgia Department of Community Affairs (2003). Cityscapes. Retrieved January 2003,
from: http://www.dca.state.ga.us/cityscapes/comm.asp?D=1&city=Gainesville&YRID=).
Gibson, R. O. (1966). Toward a conceptualization of absence behavior in organizations. Administrative Science Quarterly, 11(1), 107-133.
Gold, Y., & Roth, R. A. (1993). Teachers managing stress and preventing burnout: The professional health solution. Washington, DC: Farmer Press.
Golden, P. E., & Barton, G. (1980). Sex differences in absence from work: A reinterpretation. Norman, OK: University of Oklahoma.
Grant, F. D. (2001). Staff attendance…The forgotten key! SubJournal, 1(2), 42-47.
Griswold, P. A., & Hughes, W. (1997). The substitute dilemma. Journal of the Ohio School Boards Association, 41(2), 4.
Grossnickle, D. (1980). Teacher burnout: Will talking about it help? Clearing House, 54(1), 16-26.
Hall, J. (1995). Managerial philosophies scale: A self appraisal of the nature of people and work. Waco, TX: Teleometrics International.
Hall, J., & Donnell, S. M., (1979). Managerial achievement: The personal side of behavior theory. Human Relations, 32(1), 1.
Hammond, O. W., & Onikama, D. L. (1997). At risk teachers. Pacific Resources for Education and Learning. Honolulu, HI. (ERIC Document Reproduction Service No. ED 442 796)
Harrison, D.A., & Martocchio, J.J. (1998). Time for absenteeism: A 20-year review of origins, offshoots, and outcomes. Journal of Management, 24(3), 305-350.
Hawkins, A. (2000). Student achievement: Improving our focus (Report No. SP-039-302). Washington, D.C.: Clearinghouse on Teaching and Teacher Education. (ERIC Document Reproduction Service No. ED 442 774)
Hedges, J.N. (1973). Absence from work – a look at some national data. Monthly Labor Review, 96(7), 24-29.
Hedges, J. N. (1975). Unscheduled absence from work – an update. Monthly Labor Review, 98(8), 36-39.
Heller, H. W., Clay, R., & Perkins, C. (1993). The relationship between teacher job satisfaction and principal leadership style. Journal of School Leadership, 3(1), 74-86.

67
Hersey, P., & Blanchard, K. H. (1993). Management of organization behavior (6th ed).
New Jersey: Prentice Hall.
Hersey, P., & Blanchard, K. H. (1977). Management of organization behavior (3rd ed). New Jersey: Prentice Hall.
Herzberg, F. (1966). Work and the nature of man. New York: Cromwell.
Hill, S. T. (1982). You can’t afford for teachers to be out, so take these steps now to stop absenteeism. Updating School Board Policies, 13(3), 1-4.
Hunter-Boykin, H. S., Evans, V., & Evans, A. M., (1995). The relationship between high school principals’ leadership and teachers’ morale. Journal of Instructional Psychology, 22(2), 152-162.
Imants, J., & Van Zoelen, A. (1995). Teachers’ sickness absence in primary schools, school climate and teachers’ sense of efficacy. School Organization, 15(1), 77-86.
Jacobson, S. L. (1989). The effects of pay incentives on teacher absenteeism. Journal of Human Resources, 24(2), 280-286.
Jacobson, S. L. (1990). Attendance incentives and teacher absenteeism. Planning and Changing, 21(2), 78-93.
Jacobson, S. L. (1993, March). Toward a reconception of absence in the school workplace: Teacher absenteeism as invention and social change. Paper presented at the annual meeting of the American Education Finance Association, Albuquerque, NM.
Jacoby, J., & Terborg, J.R. (1975a). Managerial Philosophies Scale. Waco, TX: Teleometrics International.
Jacoby, J., & Terborg, J.R. (1975b). Development and validation of Theory X and Theory Y scales for assessing McGregor’s managerial philosophies. Waco, TX: Teleometrics International.
Jacoby, J., & Terborg, J.R. (1975c). How to interpret your scores on the Managerial Philosophies Scale. Waco, TX: Teleometrics International.
Jones, K. R., (1999). Managing substitute teaching. National Association of Elementary School Principals, 18(2), 2-5.
Kedjidjian, C. B. (1995). Say no to booze and drugs in your workplace. Safety and Health, 152(6), 38-42.
Kiff, S. C., (1986). Combating teacher burnout. Business Education Forum, 40(8), 15-18.
68
Kirby, P. C., Paradise, L. V., & King, M. I. (1992). Extraordinary leaders in education:
Understanding transformational leadership. Journal of Educational Research, 85(5), 303-311.
Koh, W. L., Steers, R. M., & Terborg, J. R. (1995). The effects of transformational leadership on teacher attitudes and teacher performance in Singapore. Journal of Organizational Behavior, 16(4), 319-333.
Kyraicou, C. (1987). Teacher stress and burnout: An international review. Educational Research, 29(2), 89-96.
Kyraicou, C., & Sutcliffe, J. (1979). A note on teacher stress and locus control. Journal of Occupational Psychology, 52(3), 227-228.
Leithwood, K. A., Bagley, P. T., & Cousins, J. B. (1991). The nature causes and consequences of principals’ practices: An agenda for future research. Journal of Education Administration, 28(4), 5-31.
Lewin, K., & Lippit, R. (1938). An experimental approach to the study of autocracy and democracy: A preliminary role. Sociometry, 1(3), 292–300.
Lewis, J., Jr. (1981). Do you encourage teacher absenteeism? American School Board Journal, 168(11), 29-30.
Lippman, H. (2001). Taming the time-off tiger. Business and Health, 19(8), 43-44.
Long, J., & Ormsby, J. G. (1987). Stamp out absenteeism. Personnel Journal, 66(11) 94-96.
Madden, H. D., Flanigan, J. L., & Richardson, M. D. (1991). Teacher absences: Are there implications for restructuring? Paper presented at the annual meeting of the Mid-South Educational Research Association, Lexington, KY. (ERIC Document Reproduction Service No. ED 343 199)
Manlove, D. D., & Elliot, P. (1979). Absent teacher…another handicap for students? The Practitioner, 5(1), 1-13.
Marchant, R. (1976). The effects of selected variables on teacher absenteeism. (Doctoral dissertation, University of Virginia, 1976). Dissertation Abstracts International, 37, 6187A.
Marlin, H. (1976). An analysis of absenteeism and utilization of sick leave by selected full-time ten month professional personnel in a semi-rural school system. (Doctoral dissertation, University of Southern Mississippi, 1976). Dissertation Abstracts International, 37, 5497A.
Matthews, J. (2000). Training isn’t making grade. The Washington Post Online. Available [Online]: http://washingtonpost.com/wp-dyn/education/A50561-2000Apr10.html.
69
McGregor, D. (1960). The human side of enterprise. New York: McGraw-Hill.
McGregor, D. (1967). The professional manager. New York: McGraw-Hill.
McMillan, J.H., & Schumacher, S. (1984). Research in education. Boston: Little, Brown, and Company.
Mitchell, R. W. (2001). Employers taking steps to reduce costs of absenteeism. National Underwriter, 105(15), 57.
Mitra, A., Jenkins, G. D., & Gupta, N. (1992). A meta-analytic review of the relationship between absence and turnover. Journal of Applied Psychology, 77(6), 879–889.
National Center for Educational Statistics. (1998). Compendium: Projections of educational statistics to 2008. Washington, DC: U.S. Government Printing Office. (NCES Publication Number 065-000-01150-6)
Naylor, C. (2001). Teacher workload and stress: An international perspective on human costs and systemic failure. British Columbia Teachers’ Federation, Vancouver. (BCTF-RR-RT01-0043)
Norton, M. S. (1994). The personnel administrator in Arizona: A research study. Tempe, AZ: Arizona State University.
Olson, M. N. (1971). Identifying quality in school classrooms: Some problems and some answers. New York: Columbia University, Metropolitan School Study Council
Patrick, J. E. (1995). Correlation between administrative style and school climate. (ERIC Document Reproduction Service No. ED 387 853)
Pellicer, L. O. (1984). Job satisfaction—Its impact upon teacher attendance, NASSP Bulletin, 68(475), 44-47.
Pennsylvania School Boards Association. (1978). Teacher absenteeism: Professional staff absence study. Harrisburg, PA: (ERIC Document Reproduction Service No. ED 166 816). Author.
Pitkoff, E. (1993). Teacher absenteeism: What administrators can do. NASSP Bulletin, 77(551), 39-45.
Ramming, T. M. (1994). School culture as a mediating variable in the relationship between demographic determinants and teacher absenteeism. Unpublished doctoral dissertation, SUNY at Buffalo, NY.
Ramming, T.M. (1998). A new look at employee absenteeism. School Business Affairs, 64(11), 15-17.

70
Redmond, M.E. (1978). The relationships of selected factors to illness absences in the Fort
Madison Community School District – a case study (Doctoral dissertation, The University of Iowa, 1978) Dissertation Abstracts International, 39, 3291A.
Roquemore, B.C. (1987). Relationships among teacher absenteeism, principals’ leadership styles, and teachers’ frustration levels (Doctoral dissertation, The University of Georgia, 1987).
Rossmiller, R. A. (1992). The secondary school principal and teachers’ quality of work life. Educational Management and Administration, 20(3), 132-146.
Savage, R. (1967). A study of teacher satisfaction and attitudes. Unpublished doctoral dissertation. Auburn University, Auburn.
Scott, D., & McClellan, E. (1990). Gender differences in absenteeism. Public Personnel Management, 2(2), 229-253.
Scott, D. K., & Wimbush, J. C. (1991). Teacher absenteeism in secondary education. Education Administration Quarterly, 27(4), 507-529.
Sergiovanni, T. (1967). Factors which affect satisfaction and dissatisfaction of teachers. Journal of Educational Administration, 5(1), 59-62.
Shaw, J.D. (1980). Leadership behavior, teacher morale, and unexpected teacher absenteeism in selected elementary schools in an urban school district. Dissertation Abstracts International, 42, 495A. University Microfilms No. 81-15, 676.
Skidmore, D. E. (1984). We used these few simple steps to cut absenteeism in half - and increased productive class time and community support in the bargain. American School Board Journal, 171(3), 40-41.
Smulders, P. G. W., & Nijhuis, F. J. N. (1999). The job demands-job control model of absence behaviour: Results of a three year longitudinal study. Work & Stress, 13(2), 115-131.
Spector, P.E. (1978). The organization frustration (o.f.) scale. Unpublished manuscript, University of South Florida.
Spector, P.E. (1981). Research designs. Beverly Hills: Sage Publications, Inc.
Stallings, J.A., & Mohlman, G.G. (1981). School policy, leadership style, teacher change, and student behavior in eight schools: Final report. (Grant No. NIE-G-80-0010). Washington, D.C.: National Institute of Education. (ERIC Reproduction Service No. ED 209 759)
Starnaman, S. M., & Miller, K. I. (1992). A test of a causal model of communication and burnout in the teaching profession. Communication Education, 41(1), 40-53.
71
Steers, R. M., & Rhodes, S. R. (1978). Major influences on employee absenteeism: A
process model. Journal of Applied Psychology, 63(4), 391-407.
Steers, R.M. & Rhodes, S.R. (1990). Managing employee absenteeism. Reading, MA: Addison-Wesley.
Sylwester, R. (1979). Educator absences and stress. OSSC Quarterly Report, 19(1), 18-21.
Thomas, V. (1997). What research says about administrators’ management style, effectiveness, and teacher morale. (ERIC Document Reproduction Service No. ED 411 569)
Warren, R. (1988). Substitute teachers – Education’s relief pitchers. NASSP Bulletin, 72(512), 96-99.
Wiley, D. E., & Harnischfeger, A. (1974). Explosion of a myth: Quantity of schooling and exposure to instruction, major educational vehicles. Educational Researcher, 3(4), 7-12.
Winkler, D. R. (1980). The effects of sick leave policy on teacher absenteeism. Industrial and Labor Relations Review, 33(2), 232-240.
Woods, R. C., & Montagno, R. V. (1997). Determining the negative effect of teacher attendance on student achievement. Education, 188(2), 307.
Wyld, D. C. (1995). The FMLA and the changing demand for substitute teachers. Clearing House, 68(5), 301-306.
Yolles, S. F., Carone, P. A., & Krinsky, L. W. (Eds.). (1974). Absenteeism in industry. Springfield, IL: Charles C. Thomas.

72
APPENDIX A
Letters of Approval

73
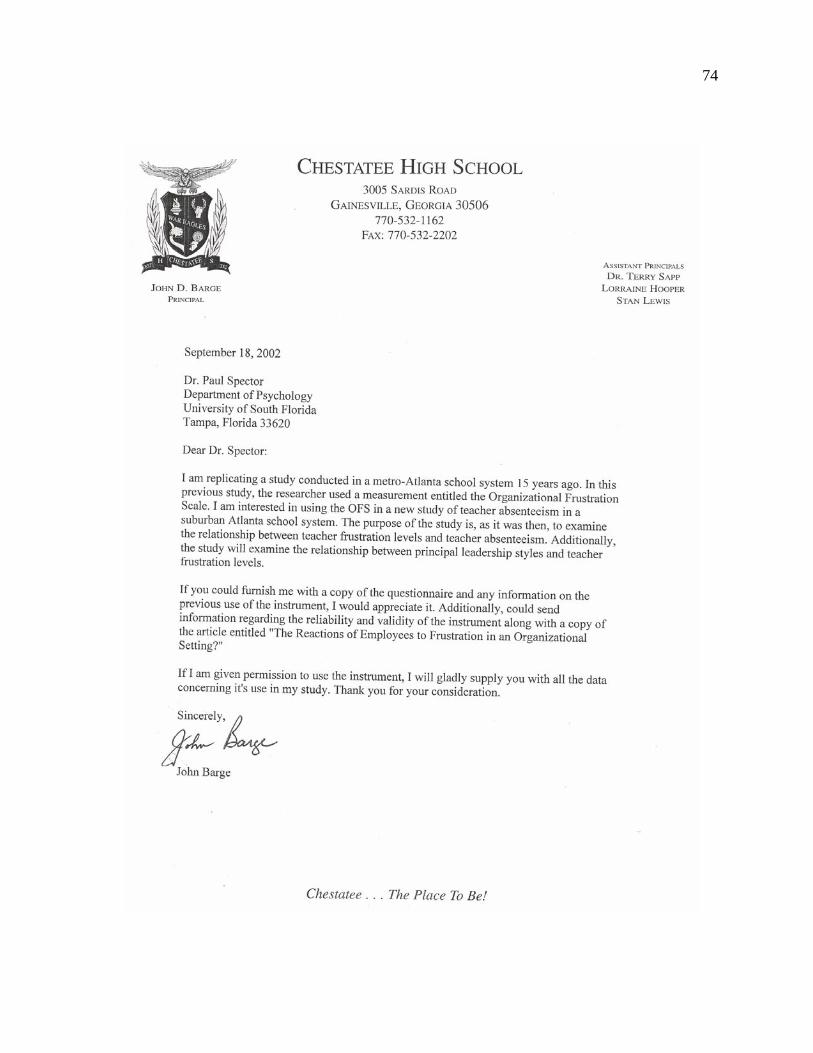
74

75

76

77
APPENDIX B
Managerial Philosophies Scale

78

79

80
APPENDIX C
The Organizational Frustration Scale
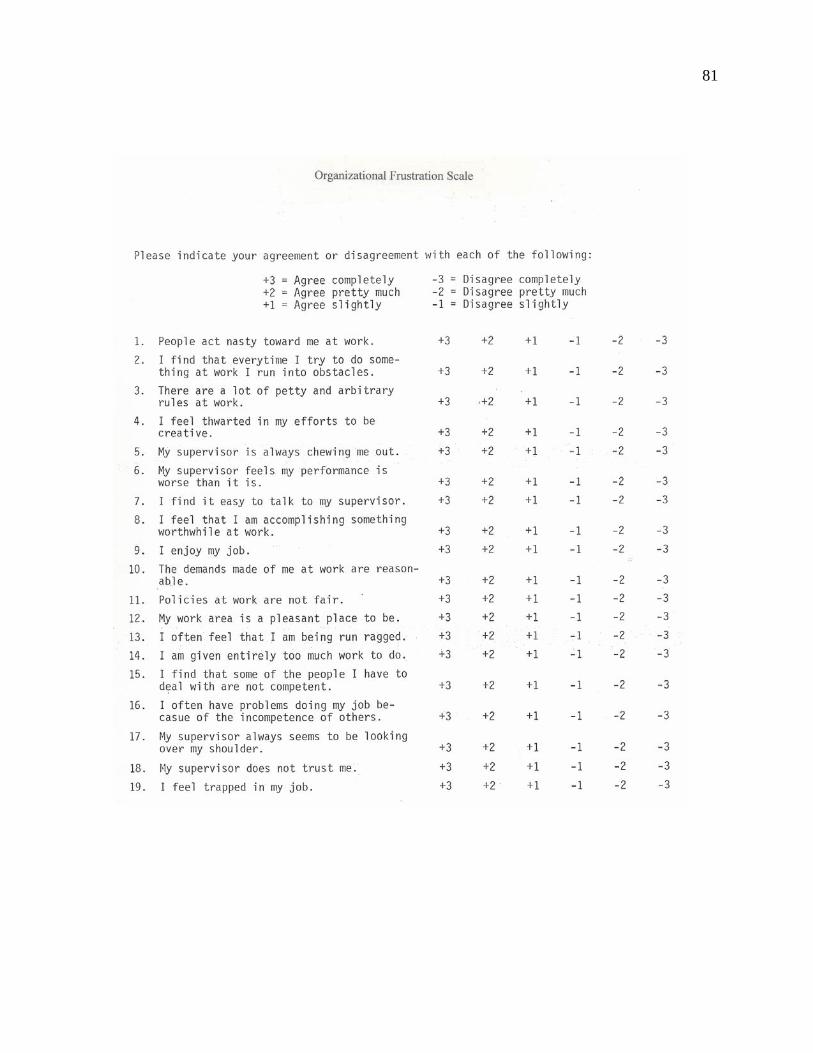
81

82
83
APPENDIX D
Letters to Principals and Teachers

84

85