management’s discussion and analysismedia3.marketwire.com/docs/166mda.pdf · does not necessarily...
TRANSCRIPT

Management’s Discussion and Analysis
For the three months and y March 31, 2014
Strategic Oil & Gas Ltd. (“Strategic” or the “Company
production company, with operations
Management’s Discussion and Analysis (
the three months and year ended
outlook based on currently available information. This
Company’s audited consolidated financial statements
together with the accompanying notes
Reporting Standards (“IFRS”). Further information with respect to the Company can be found on its website at
www.sogoil.com and on the SEDAR website
FINANCIAL AND OPERATIONAL SUMMARY
Financial ($thousands, except per share amounts)
Oil and natural gas sales
Funds from (used in) operations (1)
Per share basic & diluted
Cash flow from operating activities
Per share basic & diluted
Net loss
Per share basic & diluted
Capital expenditures (excluding acquisitions)
Net debt
Operating
Average daily production
Oil and NGL (bbl per day)
Natural gas (mcf per day)
Barrels of oil equivalent (boe per day)
Average prices
Oil & NGL, before risk management ($ per bbl)
Oil & NGL, including risk management ($ per bbl)
Natural gas ($ per mcf)
Natural gas, including risk management ($
mcf)
Netback ($ per boe)
Petroleum and natural gas sales
Royalties
Operating costs
Transportation costs
Operating Netback ($ per boe) (1)
Common Shares (thousands)
Common shares outstanding, end of period
Weighted average common shares (basic)
Weighted average common shares (diluted)
(1) In 2014, revenues are presented net of pipeline tariff charges on oil sales which occur after title to the product has passed
customer. Prior year amounts for revenue and transportation costs have been reclassified to conform to the current period
presentation.
(2) Funds from operations, net debt
MD&A.
Management’s Discussion and Analysis
For the three months and year ended December 31, 2014
(“Strategic” or the “Company”) is a publicly-traded oil and gas exploration and
production company, with operations focused on light oil development in northern Alberta.
Management’s Discussion and Analysis (“MD&A”) of Strategic’s consolidated operating and financial results
year ended December 31, 2014, as well as information concerning the
outlook based on currently available information. This MD&A should be read in conjunction with the
’s audited consolidated financial statements for the years ended December 31, 2014
accompanying notes, which have been prepared in accordance with International Financial
Further information with respect to the Company can be found on its website at
and on the SEDAR website: www.sedar.com.
FINANCIAL AND OPERATIONAL SUMMARY
Three Months Ended December 31 Year Ended
2014 2013 % change 2014
, except per share amounts)
18,790 15,377 22 82,466
4,974 (320) - 12,270
0.01 0.00 100 0.03
8,134 2,122 283 13,396
0.02 0.01 100 0.04
(117,321) (9,852) 1,090 (129,490)
(0.22) (0.04) 450 (0.34)
Capital expenditures (excluding acquisitions) 24,456 29,484 (17) 101,319
48,399 82,547 (41) 48,399
2,694 1,888 43 2,343
7,382 5,753 28 6,715
3,925 2,847 38 3,462
Oil & NGL, before risk management ($ per bbl) 65.67 77.25 (15) 83.56
Oil & NGL, including risk management ($ per bbl) 70.49 74.67 (6) 76.66
3.70 3.71 - 4.49
Natural gas, including risk management ($ per
3.76 3.71 1 4.32
52.04 58.72 (11) 65.26
9.19 11.93 (22) 13.80
22.83 34.54 (34) 25.73
1.55 3.64 (58) 2.50
18.47 8.61 115 23.23
Common shares outstanding, end of period 542,319 260,601 108 542,319
539,483 258,318 109 381,240
Weighted average common shares (diluted) 539,483 258,318 109 381,240
In 2014, revenues are presented net of pipeline tariff charges on oil sales which occur after title to the product has passed
amounts for revenue and transportation costs have been reclassified to conform to the current period
, net debt and operating netback are non-IFRS measurements; see “Non-IFRS Measurements” in this
1
December 31, 2014
traded oil and gas exploration and
focused on light oil development in northern Alberta. The following is
rating and financial results for
concerning the Company’s future
MD&A should be read in conjunction with the
December 31, 2014 and 2013,
, which have been prepared in accordance with International Financial
Further information with respect to the Company can be found on its website at
Year Ended December 31
2013 % change
78,738 5
17,162 (29)
0.08 (63)
18,493 (28)
0.08 (50)
(22,316) 480
(0.10) 240
119,151 (15)
82,547 (41)
2,339 -
5,588 20
3,270 6
84.35 (1)
81.31 (6)
3.30 36
3.30 31
65.97 (1)
14.51 (5)
24.02 7
3.56 (30)
23.88 (3)
260,601 108
217,604 75
217,604 75
In 2014, revenues are presented net of pipeline tariff charges on oil sales which occur after title to the product has passed to the
amounts for revenue and transportation costs have been reclassified to conform to the current period
IFRS Measurements” in this

2
About Strategic
Strategic is a junior oil and gas company committed to growth by exploiting its light oil assets primarily in
northern Alberta. The Company relies on its extensive subsurface and reservoir experience to develop its asset
base and grow production and cash flows while managing risk. The Company maintains control over its
resource base through high-working interest ownership in wells, construction and operation of its own
processing facilities and a significant undeveloped land base and opportunity inventory. Strategic’s primary
operating area is at Marlowe, Alberta. The Company also operates oil and gas production and processing
facilities at Bistcho, Alberta and Cameron Hills in the Northwest Territories, as well as minor non-core oil
properties in southern Alberta.
FOURTH QUARTER SUMMARY
• Production increased 38 percent from 2,847 boed for the three months ended December 31, 2013 to
3,925 boed for the current quarter, primarily due to the Company’s successful Muskeg drilling program
at Marlowe. Production for the fourth quarter of 2013 was affected by a 25 day shutdown related to a
plant turnaround and facility expansion at Marlowe. Production volumes for the current period were
also positively impacted by the sale of 24,000 barrels of oil (260 bbl/d) from inventories held at
September 30, 2014 which could not be sold in the third quarter as a result of a temporary shut-down
of a third party sales oil pipeline. Strategic routed Marlowe oil production to its company-owned
storage facility at Bistcho during the shut-down and was able to avoid curtailing production due to this
event.
• Funds from (used in) operations increased significantly to $5.0 million from $(0.3) million for the
comparable quarter in 2013, due to higher production levels and lower production and finance costs.
The operating netback increased to $18.47/boe from $8.61/boe for the fourth quarter of 2013 despite
an 11 percent reduction in realized prices.
• Capital expenditures of $24.5 million for the current quarter included drilling five wells at Marlowe, as
well as completion of road construction and other projects required to continue development of the
Muskeg fairway in north Marlowe throughout 2015.
• Strategic completed a private placement of common shares at $0.40 per common share and flow-
through common shares at $0.44 per flow-through share, issuing a total of 181.3 million shares for
total net proceeds of $73.0 million. Approximately 90 percent of the private placement closed on
September 30, 2014 with the remainder closing on October 15, 2014.
ANNUAL SUMMARY
• Production increased by 6 percent from 3,270 boed in 2013 to an average of 3,462 boed in 2014.
• Funds from operations decreased 29 percent from $17.2 million in 2013 to $12.3 million in 2014 as
higher revenues due to increased production levels were more than offset by increases in realized
losses on risk management contracts and operating costs. The operating netback at Bistcho/Cameron
Hills was challenged in 2014 as a result of declining production and higher repair & maintenance
expenses compared to 2013, reducing funds from operations for the current year.
• Capital expenditures totaled $101.3 million for the twelve months ended December 31, 2014 as
compared to $119.2 million for 2013. Approximately 91 percent of capital spending was directed to
the Company’s light oil asset at Marlowe. Drilling, completions and equipping expenditures decreased
6 percent to $68.5 million for the current year from $72.7 million for 2013 despite an increase in the
number of wells drilled to 14 in 2014 from 12 the previous year. Pipeline and facility expenditures

3
decreased 24 percent from 2013 levels to $29.9 million, and included construction of a major sales
pipeline to transport oil from Marlowe to the Rainbow sales pipeline system, as well as a gathering line
from West Marlowe to one of the Company’s oil processing facilities and major plant turnarounds at
Bistcho/Cameron Hills.
• The sales oil pipeline, a key aspect of the Company’s growth strategy, was completed in the first
quarter of 2014. The pipeline was operational on March 31, 2014 and contributed to a reduction of 30
percent in transportation costs over 2013 levels, and a 58 percent reduction in the fourth quarter of
2014 relative to the last three months of 2013. In 2015 the Company has discontinued the use of
railcars for a portion of oil sales in order to take full advantage of the lower costs of the sales oil
pipeline.
• Strategic increased its proved and probable oil and gas reserves by 1.2 MMboe compared to the
previous year, despite a reserves reduction due to economic factors of 2.1 MMboe related primarily to
Bistcho/Cameron Hills, as determined by the Company’s independent reserve evaluators McDaniel
and Associates Consultants Ltd. (“McDaniel”) at December 31, 2014. The Company added 4.7 MMboe
of proved and probable reserves in 2014 at Marlowe, excluding production, for a reserve replacement
ratio of 403 percent.
• Net loss increased to $129.5 million for 2014 compared to a loss of $22.3 million for 2013, primarily as
a result of an impairment charge of $114.0 million for the current year driven by the significant decline
in oil prices in the fourth quarter.
ADVISORIES
Basis of Presentation
This discussion and analysis of Strategic’s oil and natural gas production, reserves and related performance
measures is presented on a working-interest, before royalty basis. For the purpose of calculating unit
information, the Company's production and reserves are reported in barrels of oil equivalent (boe). Boe may be
misleading, particularly if used in isolation. A boe conversion ratio for natural gas of 6 Mcf: 1 boe has been
used, which is based on an energy equivalency conversion method primarily applicable at the burner tip and
does not necessarily represent a value equivalency at the wellhead. As the value ratio between natural gas and
crude oil based on the current prices of natural gas and crude oil is significantly different from the energy
equivalency of 6:1, utilizing a conversion on a 6:1 basis may be misleading as an indication of value.
Management makes estimates and assumptions that affect the reported amounts of assets and liabilities and
the disclosure of contingent assets and liabilities at the date of the consolidated financial statements and our
revenues and expenses during the reporting period. Management reviews these estimates, including those
related to accruals, environmental and decommissioning liabilities, income taxes, and the determination of
proved and probable reserves on an ongoing basis. Changes in facts and circumstances may result in revised
estimates and actual results may differ from these estimates.
Non-IFRS Measurements
The Company utilizes the following terms for measurement within the MD&A that do not have a standardized
meaning or definition as prescribed by IFRS and therefore may not be comparable with the calculation of
similar measures by other entities.
“Funds from operations” is a term used to evaluate operating performance and assess leverage. The Company
considers funds from operations an important measure of its ability to generate funds necessary to finance
operating activities, capital expenditures and debt repayments if any. Funds from operations are calculated
based on cash flow from operating activities before changes in non-cash working capital and decommissioning
expenditures. Funds from operations as presented is not intended to represent cash flow from operating
activities, net earnings, or other measures of financial performance calculated in accordance with IFRS.

4
The following table reconciles funds from operations to cash provided by operating activities:
Three months ended
December 31 Year ended December 31
($thousands) 2014 2013 2014 2013
Cash generated by operating activities 8,134 2,122 13,396 18,493
Expenditures on decommissioning liabilities (2) 103 1,745 762
Change in non-cash working capital (3,158) (2,545) (2,871) (2,093)
Funds from operations 4,974 (320) 12,270 17,162
“Operating Netback” is used to evaluate operating performance of crude oil and natural gas assets. The term
netback is calculated as oil and gas sales revenue excluding realized and unrealized gains and losses on risk
management contracts, less royalties, operating and transportation costs. There is no IFRS measurement that
would be directly comparable to operating netbacks.
“Adjusted net working capital (deficiency)” and “net debt” are used to assess capital requirements and
leverage, as well as evaluate funds available on the Company’s credit facility. Adjusted net working capital
(deficiency) is calculated as current assets less current liabilities, excluding bank debt, deferred price premium
on flow through shares and any assets or liabilities related to risk management contracts. Net debt is calculated
as bank debt plus adjusted net working capital deficiency, or less adjusted net working capital. A reconciliation
of adjusted net working capital and net debt to working capital deficiency is as follows:
($thousands) December 31, 2014 December 31, 2013
Current assets 14,899 9,685
Current liabilities (59,838) (101,127)
Working capital deficiency (44,939) (91,442)
Add back: deferred price premium on flow-through shares - 1,619
risk management contract liability (asset) (3,460) 7,276
Net debt (48,399) (82,547)
Bank debt 29,016 63,775
Adjusted net working capital (deficiency) (19,383) (18,772)
Going Concern
Strategic’s consolidated financial statements have been prepared on a going concern basis. The going concern
basis of presentation assumes that the Company will continue in operation for the foreseeable future and will
be able to realize its assets and discharge its liabilities and commitments in the normal course of business. For
the year ended December 31, 2014, the Company reported a net loss of $129.5 million. At December 31, 2014,
the Company had net debt of $48.4 million and an accumulated deficit of $201.0 million. Strategic’s cash flows
and compliance with debt covenants are highly dependent on realized oil pricing in 2015. Sustained low
commodity prices will put pressure on the Company’s cash flows, and will lead to a material uncertainty that
may cast significant doubt upon the Company’s ability to continue as a going concern.
The Company anticipates being in violation of the working capital covenant of its credit facility as at March 31,
2015. Strategic is working proactively with its lenders regarding the facility and the covenants. In order to
address the working capital violation, the Company is evaluating measures such as asset sales, other third party
funding alternatives and elimination of all non-critical capital spending programs. There can be no assurance
that these initiatives will be successful.
The consolidated financial statements do not reflect adjustments that would be necessary if the going concern
basis was not appropriate. The appropriateness of the going concern basis is dependent upon, among other
things, the ability to obtain debt or equity financing, a joint venture or a sale of assets in order to have
sufficient funding to meet its obligations that enables the Company to continue as a going concern, the ability
to generate sufficient cash from operations and future profitable operations.

5
PERFORMANCE OVERVIEW
In 2014 the Company continued to execute on its corporate strategy to pursue its light oil development
opportunities at Marlowe in northern Alberta, as well as constructing a pipeline to connect Marlowe to the
Rainbow sales pipeline system and increase the handling capacity of its existing infrastructure. The Company’s
focus in the first quarter of the year was on completing the Bistcho sales oil pipeline, which connects oil
production from Marlowe to the Rainbow pipeline system over a total distance of 115 kilometers. Strategic also
drilled 3 Muskeg wells in the first quarter of 2014, and followed up on its success with an 11 well program at
Marlowe in the second half of the year, comprised of 9 horizontal wells and 2 Keg River vertical wells. The
Company’s drilling success rate was 100 percent for the year.
Average daily production increased 6 percent from 3,270 boed in 2013 to 3,462 boed in 2014 due to Muskeg
drilling activities and a full year of production from assets acquired at Bistcho/Cameron Hills in February 2013.
Corporate operating netbacks decreased slightly to $23.23 per boe in 2014 from $23.88 per boe in 2013, due to
an increase in workovers and higher than expected costs at Bistcho/Cameron Hills, partially offset by a lower
royalty rate per boe as a higher proportion of the Company’s production was contributed by newly drilled
wells, which benefit from a reduced first-year royalty rate. Strategic continued to generate a competitive
netback at Marlowe, where it has assembled a concentrated base of land and infrastructure and achieved
substantial success in delineating the Muskeg resource in 2014. This area will be the focus of development for
the Company in future years.
Reserves
In accordance with National Instrument 51-101 - Standards of Disclosure for Oil and Gas Activities ("NI
51-101"), the Company's oil, natural gas and natural gas liquids ("NGL") reserves were evaluated by McDaniel
as at December 31, 2014. The reserves report has been prepared in accordance with the definitions,
procedures and standards contained in the Canadian Oil and Gas Evaluation Handbook and National Instrument
51-101 - Standards of Disclosure for Oil and Gas Activities. Gross reserves included below are Strategic's
working interest reserves before royalty burdens.
Strategic’s reserves at December 31, 2014 are summarized below.
Reserves (1)
Light and
Medium
Crude Oil
(Mbbl)
Heavy Oil
(Mbbl)
Natural Gas
(MMcf)
Natural
Gas Liquids
(Mbbl)
Oil
Equivalent
(Mboe)
Proved Producing 3,013 70 6,131 - 4,105
Proved Non-Producing 545 27 1,168 - 767
Proved Undeveloped 1,756 - 3,435 - 2,329
Total Proved 5,314 98 10,733 - 7,201
Total Probable 4,904 36 10,711 - 6,724
Total Proved and Probable 10,218 133 21,444 - 13,925 (1)
The recovery and reserve estimates of Strategic's oil, natural gas and NGL reserves provided herein are estimates only and there is no
guarantee that the estimated reserves will be recovered. Actual reserves may be greater than or less than the estimates provided
herein. Tables may not add due to rounding.
Strategic added 4.6 MMboe of proved and probable reserves in 2014 through drilling activities and well
optimization. However low commodity prices contributed to a reduction in reserves due to economic factors of
2.1 MMboe, 99 percent of which occurred outside of Marlowe. The Company’s reserve replacement ratio after
considering the reduction due to economic factors was 196 percent. Proved reserves increased 8 percent to 7.2
MMboe (75 percent oil) from 6.7 MMboe at year-end 2013. Proved and probable reserves increased 1.2
MMboe (9 percent) from 12.7 MMboe at year-end 2013 to 13.9 MMboe (74 percent oil) at December 31, 2014.
Pre-tax net asset value of the Company’s proved and probable reserves, using McDaniel’s forecast pricing and
discounted at 10 percent, increased to $196 million at December 31, 2014 from $180 million at December 31,
2013 despite the precipitous drop in commodity prices during the year.

6
Muskeg Stack Resource Assessment
In order to quantify the future reserve potential, a resource assessment was conducted on the Muskeg Stack,
which covers the Company's assets in the Marlowe area, by McDaniel with an effective date of January 1, 2015.
The assessment identified an additional 198 Muskeg drilling locations not currently reflected in the Company’s
reserve report. The results of this assessment are summarized below.
Petroleum Initially in Place(1,2)
Category
Exploitable
Mbbl
Non-Exploitable
Mbbl
Total
MMbbl
Discovered Resources 113,551 65,225 178,776
Undiscovered Resources 215,248 522,241 737,489
Total Resources 328,799 587,466 916,265
Contingent Resources(3,5)
Category
Contingent
Resource
Oil
(Mbbl)
Contingent
Resource
Natural gas
(MMcf)
Contingent
Resource
Oil equivalent
(Mboe)
Low estimate 2,635 6,423 3,706
Best estimate 4,185 11,718 6,138
High estimate 6,200 19,763 9,494
Prospective Resources(4,5)
Category
Prospective
Resource
Oil
(Mbbl)
Prospective
Resource
Natural gas
(MMcf)
Prospective Resource
Oil equivalent
(Mboe)
Low estimate 14,195 34,600 19,961
Best estimate 22,545 63,126 33,066
High estimate 33,400 106,463 51,144
(1) The exploitable component of the Petroleum Initially in Place was constrained to areas with greater than 4,000 Mbbl per section as a
means to high grade lands that are amenable to exploitation. No recoverable resources were assigned to lands outside this
exploitable region.
(2) Discovered resources have been assigned on those lands that are proximal to existing production. Undiscovered resources have been
assigned on those lands where there is a strong indication of the presence of the resource by way of existing vertical penetrations, but
productivity has not yet been demonstrated.
(3) Contingent resources have an associated chance of development. Contingencies include economic, regulatory, market and facility,
and corporate commitment considerations. There is no certainty that any portion of the contingent resources will be developed, nor
whether it will be commercially viable to produce any portion of the resources.
(4) Prospective resources have both an associated chance of discovery (geological chance of success) and a chance of development.
There is no certainty that any portion of the prospective resources will be discovered and developed, nor whether it will be
commercially viable to produce any portion of the resources.
(5) The resource estimates may differ materially upon consideration of discovery and development risk and consideration of economics
and financing.
Discovered Petroleum Initially In Place (DPIIP), as defined in the Canadian Oil and Gas Evaluation Handbook
("COGE Handbook") means that quantity of petroleum that is estimated, as of a given date, to be contained in
known accumulations prior to production. The recoverable portion of discovered petroleum initially-in-place
includes production, reserves and contingent resources; the remainder is unrecoverable. Contingent Resources
are defined in COGE Handbook as those quantities of petroleum estimated to be potentially recoverable from
known accumulations using established technology or technology under development, but which are not
currently considered to be commercially recoverable due to one or more contingencies. Contingencies may
include factors such as economic, legal, environmental, political, and regulatory matters, or a lack of markets.
Prospective Resources are those quantities of petroleum estimated, as of a given date, to be potentially

7
recoverable from undiscovered accumulations by application of future development projects. Prospective
resources have both an associated chance of discovery and a chance of development. Prospective resources are
further subdivided in accordance with the level of certainty associated with recoverable estimates assuming
their discovery and development and may be sub-classified based on project maturity. Undiscovered Petroleum
Initially-In-Place (UPIIP) (equivalent to Undiscovered Resources) is that quantity of petroleum that is estimated,
on a given date, to be contained in accumulations yet to be discovered. The recoverable portion of UPIIP is
referred to as Prospective Resources; the remainder is classified as unrecoverable. The estimates for
Contingent Resources, Prospective Resources, DPIIP and UPIIP are estimates only and the actual results may be
greater or less than the estimates provided. There is no certainty that it will be commercially viable to produce
any portion of the resources except to the extent identified as proved or probable reserves.
Uncertainty Categories for Resource Estimates
The range of uncertainty of estimated recoverable volumes may be represented by either deterministic
scenarios or by a probability distribution. Resources should be provided as low, best, and high estimates as
follows:
Low Estimate: This is considered to be a conservative estimate of the quantity that will actually be recovered. It
is likely that the actual remaining quantities recovered will exceed the low estimate. If probabilistic methods
are used, there should be at least a 90 percent probability (P90) that the quantities actually recovered will
equal or exceed the low estimate.
Best Estimate: This is considered to be the best estimate of the quantity that will actually be recovered. It is
equally likely that the actual remaining quantities recovered will be greater or less than the best estimate. If
probabilistic methods are used, there should be at least a 50 percent probability (P50) that the quantities
actually recovered will equal or exceed the best estimate.
High Estimate: This is considered to be an optimistic estimate of the quantity that will actually be recovered. It
is unlikely that the actual remaining quantities recovered will exceed the high estimate. If probabilistic methods
are used, there should be at least a 10 percent probability (P10) that the quantities actually recovered will
equal or exceed the high estimate.
There may be significant risk that sub-commercial and undiscovered accumulations will not achieve commercial
production. However, it is useful to consider and identify the range of potentially recoverable quantities
independently of such risk. OUTLOOK
On November 18, 2014 Strategic’s Board of Directors approved a capital expenditure budget of $52 million for
the first six months of 2015, focused on accelerated development and extension of the Muskeg fairway at
Marlowe. The budget included a two-rig drilling program in the first quarter of 2015, drilling up to 14 wells in
the first six months of the year.
Crude oil prices experienced a precipitous fall in late 2014, ending the year at US$53/bbl at WTI. In response to
low commodity prices, Strategic has made several changes to its cost structure and 2015 capital spending
budget to preserve financial flexibility:
• The Company prudently elected to stop the winter Muskeg drilling program in order to preserve
capital. One Muskeg horizontal well (13-31) was drilled and completed in January 2015 and is currently
on production.
• Strategic's revised capital expenditure budget for the first half of 2015 is $11 million.
• Approximately 700 boed of production has been shut-in by suspending operations at Bistcho, Cameron
Hills and Larne, which are not economic at current commodity prices.
• The Company has reduced its office and field staff by approximately 35 percent in order to remain
competitive. Staff reductions were primarily related to the suspension of operations, realignment of
the management team structure and the reduction in budgeted capital spending in 2015 compared to
previous years.

8
With the shut-in of production at Bistcho and Cameron Hills, the Company estimates that production for the
first six months of 2015 will average 3,000 boed (73 percent oil). Approximately 35 percent of expected oil
production for the first half of 2015 is hedged at CAD $90.15/bbl at WTI, and the Company’s production is
unhedged after that date.
Despite a difficult commodity price environment, Strategic has continued to experience success with its Muskeg
drilling program, improving production performance and reducing drilling days and costs. The Company drilled
and completed 1 Muskeg Stack horizontal well in January 2015 and completed another well drilled in December
2014 before curtailing its capital program due to low oil prices and financial constraints. These wells are
currently on production and meeting the Company’s internal type curve.
Strategic is committed to continue its development at Marlowe and remains focused on adjusting its cost
structure to fit this current low price environment, remaining competitive, and positioning the Company for
when commodity prices improve.

9
FOURTH QUARTER RESULTS
Fourth quarter information Three months ended December 31
($thousands, except where noted) 2014 2013
Average daily production volumes
Oil & NGL (bbl/d) 2,694 1,888
Natural Gas (mcf/d) 7,382 5,753
Total (boed) 3,925 2,847
Net loss
Petroleum and natural gas sales (1)
18,790 15,377
Royalties (3,320) (3,126)
Unrealized gain (loss) on risk management contracts 8,055 (1,501)
Realized gain (loss) on risk management contracts 1,232 (447)
24,757 10,303
Operating costs 8,242 9,046
Transportation costs (1)
559 953
Exploration 399 -
General and administrative 2,234 1,550
Finance costs 966 823
Stock-based compensation 244 423
Depletion, depreciation and amortization (“DD&A”) 16,340 6,961
Gain on disposition of PP&E (6) -
Impairment of PP&E 114,000 1,098
Net loss before taxes (118,221) (10,551)
Deferred tax recovery 900 699
Net loss (117,321) (9,852)
Net loss per common share (0.22) (0.04)
Average prices
West Texas Intermediate (“WTI”) Oil (US$/bbl) 73.15 97.46
Oil & NGL price ($/bbl) 65.67 77.25
Natural gas price ($/mcf) 3.70 3.71
Oil equivalent ($/boe) 52.04 58.72
Funds from operations (2) 4,974 (320)
($/common share) 0.01 (0.00)
Cash flow provided by operating activities 8,134 2,122
($/common share) 0.02 0.01
Exploration and development expenditures 24,456 29,484
(1) In 2014, revenues are presented net of pipeline tariff charges on oil sales which occur after title to the product has passed to the
customer. Prior year amounts for revenue and transportation costs have been reclassified to conform to the current period
presentation. (2) Funds from operations is a Non-IFRS measure, see “Non-IFRS Measures” in this MD&A

10
In comparing the fourth quarter of 2014 with the fourth quarter of 2013:
• Production increased 38 percent to 3,925 boed for the current quarter, primarily due to the
Company’s successful Muskeg drilling program at Marlowe. Production volumes for the current period
were also positively impacted by the sale of 24,000 barrels of oil (260 bbl/d) from inventories held at
September 30, 2014 which could not be sold in the third quarter as a result of a temporary shut-down
of a third party sales oil pipeline. The higher production volumes drove an increase in revenue of $3.4
million or 22 percent over 2013 levels.
• Oil prices decreased 15 percent increase as a result of a 25 percent drop in WTI prices, partially offset
by an increase in the CAD/US foreign exchange rate. Natural gas prices were relatively stable from
period to period.
• Realized and unrealized gains on risk management contracts increased to $1.2 million and $8.0 million,
respectively from losses of $0.4 million and $1.5 million in 2013 due to the decline in WTI oil prices in
the last two months of 2014.
• Royalty rates decreased from 20.3 percent of revenues in 2013 to 17.7 percent of revenues in 2014,
due to a higher percentage of production from new wells in the current period. Newly drilled wells in
Alberta benefit from a 5 percent first year royalty rate.
• Operating costs decreased 9 percent from 2013 and 34 percent on a per boe basis, due to lower
turnaround costs in the current period and significantly higher production levels. Turnaround costs for
the 9-17 facility at Marlowe totaled $1.2 million for the fourth quarter of 2013, whereas no major
plant turnaround was performed in 2014. Fourth quarter 2014 operating costs included $0.5 million
for a well casing repair at Cameron Hills, which is not expected to recur in 2015.
• Transportation costs decreased 58 percent to $1.55 per boe from $3.64 per boe for the fourth quarter
of 2013 due to the impact of the Bistcho sales pipeline, which was operational in early 2014.
• Exploration costs increased to $0.4 million from nil in 2013 as a result of impairment charges related to
exploration and evaluation (“E&E”) assets in southern Alberta.
• G&A expenses increased by $0.7 million due to costs related to the third party resource report, higher
incentive compensation payments and lower overhead recoveries.
• Funds from (used in) operations increased to $5.0 million or $0.01 per common share from $(0.3)
million or $(0.00) per share for the fourth quarter of 2013 due primarily to higher revenues and lower
operating costs, partially offset by higher G&A expenses.
• DD&A expense increased by $9.4 million as a result of reserve write-downs at Maxhamish,
Bistcho/Cameron Hills and Larne, which increased the DD&A expense in those areas by $6.4 million, as
well as higher production levels at Marlowe. DD&A is calculated on a unit of production basis for most
items of PP&E and fluctuates with production and reserves over time.
• Strategic recorded an impairment charge of $114.0 million in the fourth quarter of 2014, related to
declining oil prices and deferred costs and affecting the Company’s Marlowe, Bistcho/Cameron Hills
and other minor oil-producing assets.
• Net loss increased to $117.3 million ($0.22 per basic and diluted common share) from $9.9 million
($0.04 per basic and diluted common share) due to impairment charges and higher DD&A expense,
partially offset by increased funds from operations and unrealized gains on risk management
contracts.
• Exploration and development expenditures totalled $24.5 million for the three months ended
December 31, 2014 as compared to $29.5 million for the comparable quarter in 2013. Strategic has

11
been successful in reducing drilling costs and times at Marlowe, drilling 5 wells in the current period
with one rig. Other projects included road construction and lease preparation activities required to
continue development of the Muskeg fairway in north Marlowe throughout 2015.
RESULTS OF OPERATIONS
Production
2,343 2,339
6,715 5,588
3,462 3,270
Oil & NGL production in 2014 was consistent with 2013 levels, as new production from Muskeg drilling was
offset by natural declines from existing Keg River oil production at Marlowe and Cameron Hills. Production
earlier in 2014 was affected by oil volumes used to fill the Bistcho sales pipeline, facility downtime at
Bistcho/Cameron Hills and a lack of new drilling activities at Marlowe as a result of financial constraints.
Strategic commenced an 11-well drilling program in June 2014 which drove an increase in oil and gas volumes
up to 3,925 boed for the fourth quarter of 2014.
Gas production increased 20 percent in 2014 due to associated gas production from Muskeg Stack oil drilling at
Marlowe.
Average production volumes for the last six months of 2014 were 3,580 boed, 6 percent short of production
guidance of 3,800 boed, as a result of production downtime on flowing Muskeg wells caused by cold weather in
December, as well as a delay in receiving new well licenses early in the fourth quarter which resulted in delays
in drilling and bringing new wells on production relative to the Company’s forecast.
Revenue
($thousands, except where noted)
71,461 72,012
11,005 6,726
82,466 78,738
Unrealized gain (loss) on risk management contracts 12,217 (8,533)
(6,322) (2,621)
- 94
88,361 67,678
93.00 97.97
4.48 3.16
83.56 84.35
76.66 81.31
4.49 3.30
4.32 3.30
Oil equivalent ($/boe) 65.26 65.97 (1) Average prices do not include unrealized losses on risk management contracts or other revenue.
(2) In 2014, revenues are presented net of pipeline tariff charges on oil sales which occur after title to the product has passed to the
customer. Prior year amounts for revenue and transportation costs have been reclassified to conform to the current period
presentation.
The Company’s oil and natural gas sales for the year ending December 31, 2014 increased 5 percent to $82.5
million from $78.7 million in 2013, primarily driven by higher production levels and a 36 percent increase in
natural gas prices.

12
The average price realized for oil and NGLs in 2013 decreased to $83.56 per bbl from $84.35 per bbl in 2013, as
a decline in WTI oil prices was offset by a higher CAD/US foreign exchange rate. Strategic also sold its non-
operated NGL production in June 2014, which received a lower price per bbl than the Company’s light oil
production at Marlowe and Cameron Hills. Average natural gas prices increased 36 percent to $4.49 per mcf in
2014 from $3.30 per mcf in 2013, consistent with the 41 percent increase in AECO daily index prices over the
same period.
Risk Management Contracts
The Company’s net income and funds from operations are exposed to fluctuations in commodity prices,
interest rates and foreign exchange rates. As part of its risk management program, Strategic may enter into
financial commodity price management contracts for up to 60 percent of expected production levels,
depending on current commodity prices, price volatility and the size and nature of the Company’s capital
spending programs.
A summary of Strategic’s commodity price risk management contracts as at December 31, 2014 is as follows:
Financial WTI Crude Oil Contracts
Term
Contract
Type
Volume
(bbl/d)
Fixed Price
(CAD$/bbl)
Index
01-Jan-2015 30-Jun-2015 Swap 750 90.15 WTI - NYMEX
01-Jul-2015 31-Dec-2015 Option (1)
250 90.00 WTI - NYMEX (1) Counterparty has an option to convert into a swap at the fixed price indicated. The option expires monthly during the contract
term.
The Company recorded an unrealized gain on risk management contracts of $12.2 million for 2014, as a result
of the reversal of unrealized risk management liabilities on the statement of financial position at December 31,
2013 and a significant decrease in the forward price curve for WTI oil in late 2014. Unrealized gains and losses
on risk management activities do not affect Strategic’s funds from operations or cash available for capital
spending programs.
Royalties
Year ended December 31
($thousands, except where noted) 2014 2013
Crown royalties 16,531 16,536
Freehold and overriding royalties 904 781
Total royalties 17,435 17,317
Per boe 13.80 14.51
Percentage of oil & natural gas revenues 21.1% 22.0%
Royalty expense consists of royalties paid to provincial governments (including the effect of the Crown royalty
initiative program), freehold land owners and overriding royalty owners. Royalty expense also includes the
impact of gas cost allowance, which is the reduction of natural gas royalties payable to the Government of
Alberta to recognize capital and operating expenditures incurred in the gathering and processing of its royalty
share of production. Crown royalties on oil production are paid in product, which is taken in kind and marketed
separately by the provincial government. Generally royalty rates in western Canada vary based on volume
produced by individual wells, prices received and the area the production is derived from. Revenues from newly
drilled wells benefit from a crown royalty reduction to five percent for the first year of production, up to a
maximum of 500,000 Mcf of natural gas or 50,000 bbls of crude oil for a well up to 2,500 metres of total depth.
The time frame and maximum production amounts are increased by six months and 100,000 Mcf or 10,000 bbls
for each additional 500 metres of total depth. Strategic’s wells are typically from 2,500 to 3,000 metres in total
depth.
Royalties decreased in 2014 as a percentage of revenues and on a per boe basis royalties from 2013 as a result
of an increasing proportion of revenues being derived from Muskeg wells drilled in 2014 and late 2013.
13
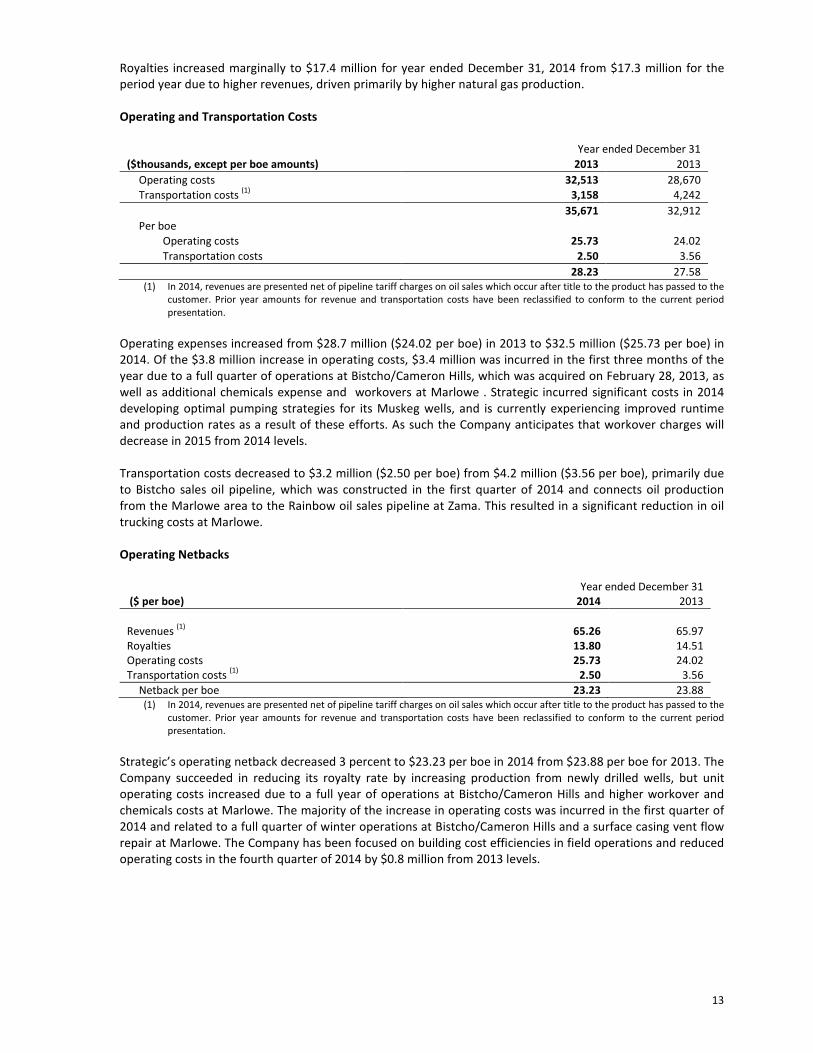
Royalties increased marginally to $17.4 million for year ended December 31, 2014 from $17.3 million for the
period year due to higher revenues, driven primarily by higher natural gas production.
Operating and Transportation Costs
Year ended December 31
($thousands, except per boe amounts) 2013 2013
Operating costs 32,513 28,670
Transportation costs (1)
3,158 4,242
35,671 32,912
Per boe
Operating costs 25.73 24.02
Transportation costs 2.50 3.56
28.23 27.58
(1) In 2014, revenues are presented net of pipeline tariff charges on oil sales which occur after title to the product has passed to the
customer. Prior year amounts for revenue and transportation costs have been reclassified to conform to the current period
presentation.
Operating expenses increased from $28.7 million ($24.02 per boe) in 2013 to $32.5 million ($25.73 per boe) in
2014. Of the $3.8 million increase in operating costs, $3.4 million was incurred in the first three months of the
year due to a full quarter of operations at Bistcho/Cameron Hills, which was acquired on February 28, 2013, as
well as additional chemicals expense and workovers at Marlowe . Strategic incurred significant costs in 2014
developing optimal pumping strategies for its Muskeg wells, and is currently experiencing improved runtime
and production rates as a result of these efforts. As such the Company anticipates that workover charges will
decrease in 2015 from 2014 levels.
Transportation costs decreased to $3.2 million ($2.50 per boe) from $4.2 million ($3.56 per boe), primarily due
to Bistcho sales oil pipeline, which was constructed in the first quarter of 2014 and connects oil production
from the Marlowe area to the Rainbow oil sales pipeline at Zama. This resulted in a significant reduction in oil
trucking costs at Marlowe.
Operating Netbacks
Year ended December 31
($ per boe) 2014 2013
Revenues (1)
65.26 65.97
Royalties 13.80 14.51
Operating costs 25.73 24.02
Transportation costs (1)
2.50 3.56
Netback per boe 23.23 23.88
(1) In 2014, revenues are presented net of pipeline tariff charges on oil sales which occur after title to the product has passed to the
customer. Prior year amounts for revenue and transportation costs have been reclassified to conform to the current period
presentation.
Strategic’s operating netback decreased 3 percent to $23.23 per boe in 2014 from $23.88 per boe for 2013. The
Company succeeded in reducing its royalty rate by increasing production from newly drilled wells, but unit
operating costs increased due to a full year of operations at Bistcho/Cameron Hills and higher workover and
chemicals costs at Marlowe. The majority of the increase in operating costs was incurred in the first quarter of
2014 and related to a full quarter of winter operations at Bistcho/Cameron Hills and a surface casing vent flow
repair at Marlowe. The Company has been focused on building cost efficiencies in field operations and reduced
operating costs in the fourth quarter of 2014 by $0.8 million from 2013 levels.

14
Strategic’s 100 percent owned and operated focus area is Marlowe, which continued to generate competitive
netbacks in 2014. With the shut-down of Bistcho/Cameron Hills in February 2015, corporate netbacks are
expected to be similar to the netback at Marlowe, where operating costs were $15 per boe in the fourth
quarter of 2014 as sales volumes increased. The breakdown of Strategic’s operating netback by area for 2014 is
as follows:
Operating netback ($/boe) Marlowe
Bistcho/Cameron
Hills Other Total
Revenue 72.36 40.92 63.65 65.26
Royalties (17.82) (2.08) (3.48) (13.80)
Operating costs (19.84) (40.47) (51.65) (25.73)
Transportation costs (2.63) (2.36) (1.13) (2.50)
Operating netback 32.07 (3.99) 7.39 23.23
Exploration and Evaluation Expense
The Company’s E&E expense represents all pre-license costs and capitalized exploration and evaluation costs
that have been subsequently expensed due to a lack of technical feasibility and commercial viability. For the
year ended December 31, 2014, the Company recorded $0.4 million of E&E expense compared to $nil for the
prior year. Current period expenses related to seismic costs incurred in southern Alberta and the Zama area.
General and Administrative Expenses
Year ended December 31
($thousands, except per boe amounts) 2014 2013
Gross general and administrative expenses 10,145 9,420
Overhead recoveries (978) (972)
Capitalized G&A (1,774) (2,248)
Net general and administrative expenses 7,393 6,200
Per boe 5.85 5.19
General and administrative (“G&A”) expenses reflect all head office costs, a portion of which are charged to
operated wells and facilities through overhead recoveries. Costs related to technical office staff that are directly
involved in the Company’s capital spending programs are capitalized to PP&E. Net G&A expenses increased to
$7.4 million ($5.85 per boe) for 2014 from $6.2 million ($5.19 per boe) in 2013 as a result of increased office
staff to manage the Muskeg drilling program and increasing production base at Marlowe and higher incentive
compensation payments, partially offset by lower legal and consulting expenses. Capitalized G&A was also
lower in 2014 compared to 2013 due to lower capital expenditures.
Finance Expense
Year ended December 31
($thousands, except per boe amounts) 2014 2013
Interest expense 3,375 2,540
Accretion expense 1,188 869
Total 4,563 3,409
Per boe 3.61 2.86
Interest expense increased to $3.4 million for 2014 from $2.5 million for 2013 due to higher average interest
rates on the bank credit facility during the year, as well as interest expense paid on a short-term promissory
note to a director of the Company. Accretion expense increased by $0.3 million in 2014 due to the increase in
cost estimates for Strategic’s decommissioning liabilities.
Stock Based Compensation
Stock based compensation is a non-cash charge which reflects the estimated value of stock options granted.
The Company uses the fair value method of accounting for stock options granted to directors, officers,

15
employees and consultants. The fair value of all stock options granted is recorded as a charge to net loss over
the period from the grant date to the vesting date of the option. The fair value of common share options
granted is estimated on the date of grant using the Black-Scholes options pricing model.
During the year ended December 31, 2014 the Company recorded $1.0 million in stock based compensation
expense as compared to $1.7 million recorded in the previous year. Black-Scholes values of the Company’s
stock options have decreased in line with the decrease in share price over the past year, leading to lower stock-
based compensation expense.
Depletion, Depreciation and Amortization
Year ended December 31
($thousands, except per boe amounts) 2014 2013
Depreciation, depletion, and amortization 42,011 28,033
Per boe 33.25 23.49
Depletion, depreciation and amortization (“DD&A”) is computed individually for each producing area on a unit
of production basis, using proved and probable reserves and including future development expenditures in the
cost base subject to depletion. DD&A expense for the year ended December 31, 2014 increased by 50 percent
to $42.0 million compared to $28.0 million for 2013, and increased by 42 percent on a boe basis, as a result of
significant capital spending on facilities over the past two years, as well as reserve writedowns at
Bistcho/Cameron Hills and Maxhamish, which resulted in depletion charges for these assets of $6.9 million in
the fourth quarter of 2014 compared to $0.5 million for the corresponding period in 2013.
Impairment Loss
Impairment testing is required when there are indicators of impairment such as a significant drop in commodity
prices or a downward revision of proved and probable oil and gas reserves. When indicators of impairment
exist, impairment testing is performed at the cash generating unit (“CGU”) level and is a point in time process
for testing and measuring a potential impairment of assets, whereby the carrying value of each CGU is
compared to the CGU’s recoverable amount, which is the greater of its value in use and its fair value less costs
to sell. The Company’s development and production assets are aggregated into CGUs based on their ability to
generate largely independent cash flows. At December 31, 2014, the Company identified indicators of
impairment for the Marlowe, Bistcho/Cameron Hills and other Canadian CGUs based on a precipitous decline in
oil prices in the fourth quarter and decreases in recognized reserves in certain areas from 2013 levels.
The recoverable amount was determined based on the fair value less costs to sell method for reserves as well
as resources estimated by management to be realized based on planned future drilling locations not considered
in the reserve report. The key assumptions used in determining the recoverable amount include the future cash
flows using reserve and resource forecasts, forecasted commodity prices, discount rates, inflation rates and
future development costs estimated for reserves by independent reserve engineers and by internal estimates
based on historical experiences and trends for planned future drilling locations.
The values assigned to the future cash flows, forecasted commodity prices and future development costs were
obtained from Strategic’s year-end reserve report, which was evaluated or audited by its independent reserve
engineers. The commodity prices used for 2015 were the prices used for the Company’s revised budget
released in February 2015. These values were based on future cash flows of proved plus probable reserves
discounted at a pre-tax rate of 10 percent (2013 – 10 percent). The future cash flows also consider, when
appropriate, past capital activities, observable market conditions, comparable transactions and future
development costs primarily based on anticipated development capital programs.
The value of resources incremental to the reserve report was obtained from internal analysis completed by
management most notably through the review of its drilling program results and future drilling plans outlined
in its current five-year plan. This was further supported by contingent and prospective resource studies that
were compiled by independent reserve engineers. Based on this internal analysis, Strategic identified and
risked potential drilling locations that were not assigned any proved plus probable reserves. The value of these
additional drilling locations was included in the recoverable amount, based on the net present value of proved
16
undeveloped locations within the same resource play from the Company’s most recent annual reserve report. A
discount rate of 10 percent and risk factors of 50 to 75 percent were applied to determine an estimate of the
present value of the future cash flows from these future drilling locations.
For the year ended December 31, 2014, the Company recognized an impairment charge of $114.0 million,
including $97.1 million related to Marlowe, $14.8 million related to Bistcho/Cameron Hills and $2.1 million
related to the Other Canadian CGU, compared to $1.1 million in 2013 related to the other Canadian CGU.
Impairment at Marlowe was primarily related to the decline in oil prices as well as a $5.0 million charge for
deferred costs related to environmental liabilities, while impairment charges in other CGUs were caused by
commodity price declines and decreases in reserves from the previous year-end.
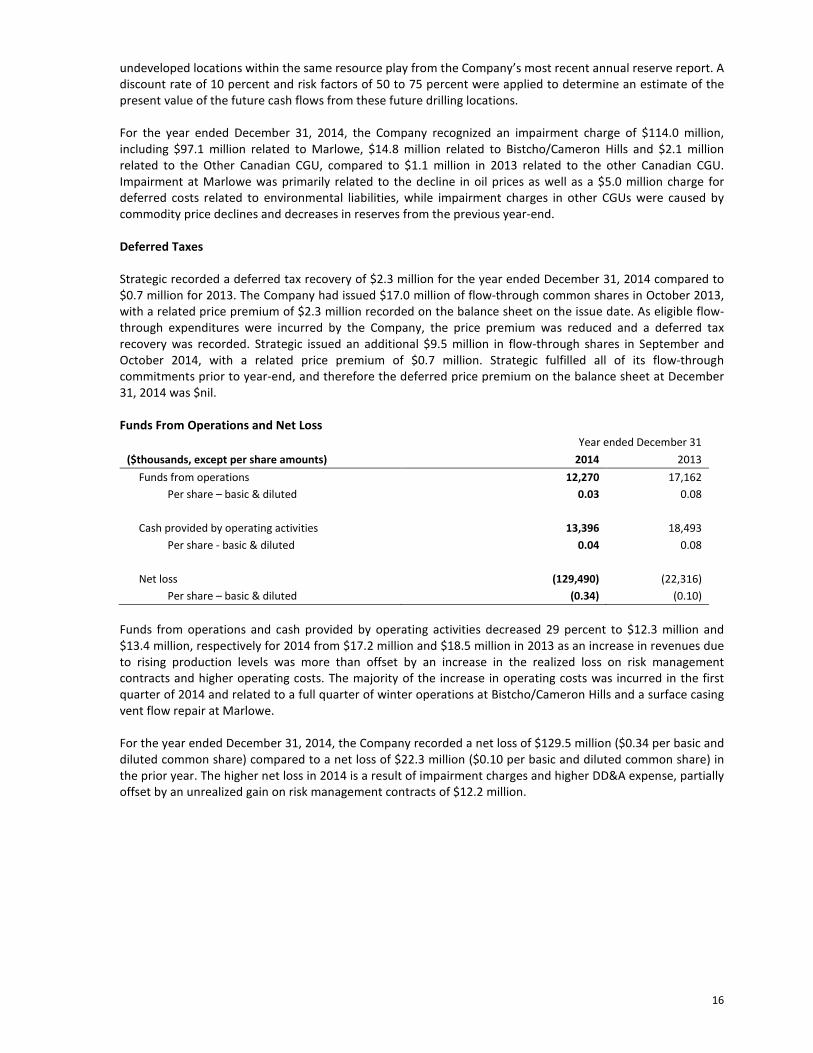
Deferred Taxes
Strategic recorded a deferred tax recovery of $2.3 million for the year ended December 31, 2014 compared to
$0.7 million for 2013. The Company had issued $17.0 million of flow-through common shares in October 2013,
with a related price premium of $2.3 million recorded on the balance sheet on the issue date. As eligible flow-
through expenditures were incurred by the Company, the price premium was reduced and a deferred tax
recovery was recorded. Strategic issued an additional $9.5 million in flow-through shares in September and
October 2014, with a related price premium of $0.7 million. Strategic fulfilled all of its flow-through
commitments prior to year-end, and therefore the deferred price premium on the balance sheet at December
31, 2014 was $nil.
Funds From Operations and Net Loss
Year ended December 31
($thousands, except per share amounts) 2014 2013
Funds from operations 12,270 17,162
Per share – basic & diluted 0.03 0.08
Cash provided by operating activities 13,396 18,493
Per share - basic & diluted 0.04 0.08
Net loss (129,490) (22,316)
Per share – basic & diluted (0.34) (0.10)
Funds from operations and cash provided by operating activities decreased 29 percent to $12.3 million and
$13.4 million, respectively for 2014 from $17.2 million and $18.5 million in 2013 as an increase in revenues due
to rising production levels was more than offset by an increase in the realized loss on risk management
contracts and higher operating costs. The majority of the increase in operating costs was incurred in the first
quarter of 2014 and related to a full quarter of winter operations at Bistcho/Cameron Hills and a surface casing
vent flow repair at Marlowe.
For the year ended December 31, 2014, the Company recorded a net loss of $129.5 million ($0.34 per basic and
diluted common share) compared to a net loss of $22.3 million ($0.10 per basic and diluted common share) in
the prior year. The higher net loss in 2014 is a result of impairment charges and higher DD&A expense, partially
offset by an unrealized gain on risk management contracts of $12.2 million.

17
Capital Expenditures
Year ended December 31
($thousands) 2014 2013
Drilling, completions and equipping 68,467 72,746
Pipelines and facilities 29,881 39,230
Other 66 248
98,414 112,224
Net acquisitions (dispositions) (3,828) 10,011
Total property, plant and equipment 94,586 122,235
Exploration and evaluations 2,905 6,927
Total net capital expenditures 97,491 129,162
Drilling, completions, equipping and facilities expenditures decreased to $98.4 million in 2014 from $112.2
million in 2013. Strategic achieved a 6 percent reduction in drilling, completions and equipping expenditures
despite drilling 14 wells in 2014 compared to 12 wells in 2013, as Muskeg drilling cost efficiencies were
identified and implemented over the last year. Average drilling days per well were reduced from 29 days in the
first quarter of 2014 to 14 days for the last two wells in the Muskeg program.
Facility projects in 2014 included the construction of the Bistcho sales oil pipeline to connect Marlowe oil
production to the Rainbow sales pipeline at Zama in northern Alberta, as well as a pipeline from West Marlowe
to one of the Company’s oil processing facilities and major plant turnarounds at Bistcho/Cameron Hills. Prior
year projects included a major expansion of the Marlowe oil processing facility at 9-17, installation of water
disposal facilities, and a pipeline connecting the 9-17 and 1-28 plants. Going forward the Company has
processing capacity at Marlowe of 8,000 bbl/d of oil, 18,000 bbl/d of total fluid and 40 MMcf/d of natural gas,
and will be able to devote the vast majority of its capital spending towards drilling and completion activities at
Marlowe.
Dispositions include the sale of minor gas-weighted assets in central Alberta for $3.4 million in June 2014, as
well as the sale of an interest in a wellbore to a related party for $0.3 million.
Exploration and evaluation (“E&E”) costs are area expenditures where technical feasibility and commercial
viability has not yet been determined. E&E costs decreased to $2.9 million in 2014 from $6.9 million in 2013
due to lower seismic spending. In 2013 2D and 3D seismic programs were conducted at Marlowe.
Decommissioning Liabilities
Decommissioning liabilities increased to $54.9 million at December 31, 2014 from $35.9 million at December
31, 2013, and accretion expense increased accordingly, as a result of a soil remediation estimate for a prior year
pipeline spill at Marlowe, an increase in estimates for pipeline reclamation liabilities and a lower discount rate.
As the pipeline spill was claimed under the Company’s insurance coverage, a receivable of $3.7 million has been
recorded representing the estimated cost of remediation work completed in 2015 and ongoing monitoring
costs, of which $2.9 million is included in current assets.
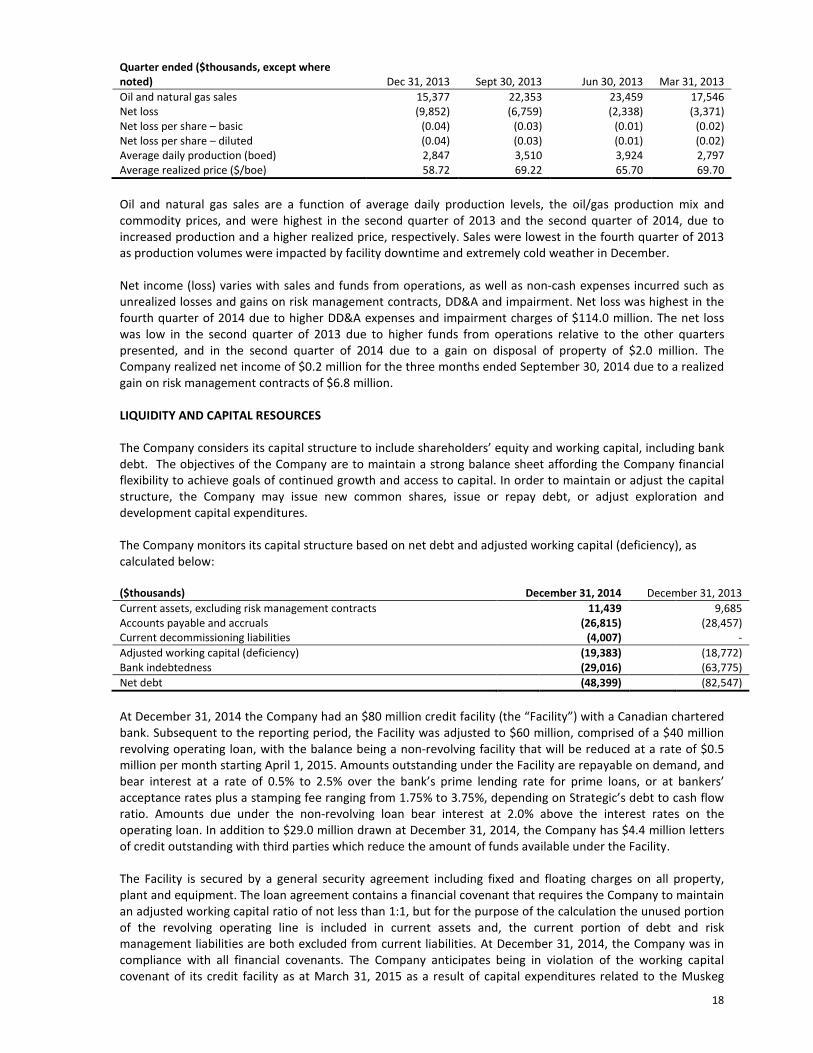
SUMMARY OF QUARTERLY FINANCIAL DATA
The following table summarizes quarterly financial results:
Quarter ended ($thousands, except where
noted) Dec 31, 2014 Sept 30, 2014 Jun 30, 2014 Mar 31, 2014
Oil and natural gas sales 18,790 19,394 23,373 20,908
Net income (loss) (117,321) 213 (2,717) (9,664)
Net income (loss) per share – basic (0.22) 0.00 (0.01) (0.04)
Net income (loss) per share – diluted (0.22) 0.00 (0.01) (0.04)
Average daily production (boed) 3,925 3,234 3,538 3,147
Average realized price ($/boe) 52.04 65.18 72.61 73.82
18
Quarter ended ($thousands, except where
noted) Dec 31, 2013 Sept 30, 2013 Jun 30, 2013 Mar 31, 2013
Oil and natural gas sales 15,377 22,353 23,459 17,546
Net loss (9,852) (6,759) (2,338) (3,371)
Net loss per share – basic (0.04) (0.03) (0.01) (0.02)
Net loss per share – diluted (0.04) (0.03) (0.01) (0.02)
Average daily production (boed) 2,847 3,510 3,924 2,797
Average realized price ($/boe) 58.72 69.22 65.70 69.70
Oil and natural gas sales are a function of average daily production levels, the oil/gas production mix and
commodity prices, and were highest in the second quarter of 2013 and the second quarter of 2014, due to
increased production and a higher realized price, respectively. Sales were lowest in the fourth quarter of 2013
as production volumes were impacted by facility downtime and extremely cold weather in December.
Net income (loss) varies with sales and funds from operations, as well as non-cash expenses incurred such as
unrealized losses and gains on risk management contracts, DD&A and impairment. Net loss was highest in the
fourth quarter of 2014 due to higher DD&A expenses and impairment charges of $114.0 million. The net loss
was low in the second quarter of 2013 due to higher funds from operations relative to the other quarters
presented, and in the second quarter of 2014 due to a gain on disposal of property of $2.0 million. The
Company realized net income of $0.2 million for the three months ended September 30, 2014 due to a realized
gain on risk management contracts of $6.8 million.
LIQUIDITY AND CAPITAL RESOURCES
The Company considers its capital structure to include shareholders’ equity and working capital, including bank
debt. The objectives of the Company are to maintain a strong balance sheet affording the Company financial
flexibility to achieve goals of continued growth and access to capital. In order to maintain or adjust the capital
structure, the Company may issue new common shares, issue or repay debt, or adjust exploration and
development capital expenditures.
The Company monitors its capital structure based on net debt and adjusted working capital (deficiency), as
calculated below:
($thousands) December 31, 2014 December 31, 2013
Current assets, excluding risk management contracts 11,439 9,685
Accounts payable and accruals (26,815) (28,457)
Current decommissioning liabilities (4,007) -
Adjusted working capital (deficiency) (19,383) (18,772)
Bank indebtedness (29,016) (63,775)
Net debt (48,399) (82,547)
At December 31, 2014 the Company had an $80 million credit facility (the “Facility”) with a Canadian chartered
bank. Subsequent to the reporting period, the Facility was adjusted to $60 million, comprised of a $40 million
revolving operating loan, with the balance being a non-revolving facility that will be reduced at a rate of $0.5
million per month starting April 1, 2015. Amounts outstanding under the Facility are repayable on demand, and
bear interest at a rate of 0.5% to 2.5% over the bank’s prime lending rate for prime loans, or at bankers’
acceptance rates plus a stamping fee ranging from 1.75% to 3.75%, depending on Strategic’s debt to cash flow
ratio. Amounts due under the non-revolving loan bear interest at 2.0% above the interest rates on the
operating loan. In addition to $29.0 million drawn at December 31, 2014, the Company has $4.4 million letters
of credit outstanding with third parties which reduce the amount of funds available under the Facility.
The Facility is secured by a general security agreement including fixed and floating charges on all property,
plant and equipment. The loan agreement contains a financial covenant that requires the Company to maintain
an adjusted working capital ratio of not less than 1:1, but for the purpose of the calculation the unused portion
of the revolving operating line is included in current assets and, the current portion of debt and risk
management liabilities are both excluded from current liabilities. At December 31, 2014, the Company was in
compliance with all financial covenants. The Company anticipates being in violation of the working capital
covenant of its credit facility as at March 31, 2015 as a result of capital expenditures related to the Muskeg

19
drilling program and reduced cash flows due to low commodity prices for the first quarter of 2015 (see “Going
concern” in this MD&A). The Facility has a renewal date of May 1, 2015.
The Company has a working capital deficiency at December 31, 2014 and 2013 as capital spending has
exceeded cash flows for both periods. In addition, invoices related to capital spending and operating costs are
typically paid on 60 to 90 day terms, whereas receivables related to oil and gas production are collected after
25 days, per normal industry terms.
In light of the reduction in the Company’s credit facility and low commodity prices, Strategic has curtailed the
winter drilling program and reduced planned capital expenditures in the first half of 2015 to $11 million. Future
capital expenditure programs will be dependent on obtaining additional financing, a joint venture or a sale of
assets as funds from operations will be diverted towards repayment of the non-revolving portion of the
Company’s credit facility.
SHARE CAPITAL
Year ended December 31
2014 2013
Weighted average common shares outstanding (thousands)
Basic 381,240 217,604
Diluted 381,240 217,604
December 31, 2014 December 31, 2013
Outstanding securities (thousands)
Common shares 542,319 260,601
Stock options 15,313 13,235
On March 31, 2014, the Company issued 100.0 million common shares via a private placement at a price of
$0.50 per common share for gross proceeds of $50.0 million (net proceeds of $49.3 million after transaction
costs). Of the $50.0 million gross proceeds, $40.0 million (80.0 million common shares) were acquired by
entities controlled by a director of the Company and another $0.29 million (0.6 million common shares) were
acquired by directors and officers of the Company. Proceeds from the private placement were primarily used to
repay accounts payable and accrued liabilities incurred in executing the first quarter 2014 capital program.
The Company also completed a $73 million private placement of common shares in 2014, closing the first
tranche on September 30, 2014 and the second tranche on October 15, 2014. Strategic issued a total of 159.7
million common shares priced at $0.40 per share and 21.6 million shares issued on a flow-through basis
pursuant to the Income Tax Act (Canada) at $0.44 per share, for gross proceeds of $73.4 million ($73.0 million
after transaction costs). As part of the private placement, 132.5 million common shares ($53.0 million) were
acquired by entities controlled by a director of the Company, and another 7.1 million common shares ($2.7
million) were acquired by directors and officers of the Company. Proceeds from the private placement were
used to fund Strategic’s capital programs for the second half of 2014, reduce bank indebtedness and repay a
U.S. $10 million promissory note outstanding to an entity controlled by a director.
For the year ended December 31, 2014, 6.6 million stock options were granted at an average price of $0.42 per
common share, and 400,000 stock options were exercised for common shares of the Company for total
proceeds of $0.14 million.
As of March 15, 2015 there were 542,318,629 common shares outstanding and 14,855,000 stock options
outstanding.

20
SUMMARY OF ANNUAL INFORMATION
Year ended December 31
($000, except per share amounts) 2014 2013 2012
Total revenue 82,466 78,738 56,512
Net income (loss) (129,490) (22,316) (4,788)
Per common share basic) (0.34) (0.10) (0.03)
Per common share (diluted) (0.34) (0.10) (0.03)
Total assets 239,601 274,221 159,718
Total long-term liabilities 50,904 37,413 18,773
Net revenues have increased over the past three years as a result of production additions from successful
capital programs, primarily at Marlowe, and through the acquisition of Bistcho/Cameron Hills in February 2013.
Net loss was lowest in 2012 due to lower DD&A expense, finance costs and impairment charges compared to
2013 and 2014. The loss in 2014 was affected by an impairment charge of $114.0 million related to a significant
decline in oil prices. Total assets have increased in 2013 due to capital spending and acquisitions exceeding
DD&A expense, and decreased in 2014 due to asset impairment charges. Long-term liabilities consist primarily
of decommissioning obligations, and have increased over the two-year period as the Company’s oil and gas
asset base has also increased.
TRANSACTIONS WITH RELATED PARTIES
Legal fees in the amount of $0.37 million (2013 - $0.45 million) were incurred to a legal firm of which a director
is a partner, and are included as general and administrative expenses or share issue costs. Software charges of
$0.20 million (2013 - $0.20 million) were incurred to a software firm which is controlled by an officer of the
Company. Accounts payable and accrued liabilities at 2014 include $0.09 million (2013 - $0.31 million) due to
related parties. The above transactions were conducted in the normal course of operations and were recorded
at exchange amounts which were agreed upon between the Company and the related parties. Transaction
amounts reflect fair values.
Entities controlled by directors of the Company and directors and officers of the Company have also
participated in share offerings in 2014 as discussed in this MD&A.
COMMITMENTS
The Company has lease agreements for office space, office equipment and natural gas transportation resulting
in the following commitments:
SENSITIVITY ANALYSIS
The following table analyses the Company’s sensitivity of funds from operations to changes in commodity
prices and interest rates:
For the year ended December 31
($000) 2014 2013
$1.00 increase in oil price 659 687
$0.25 increase in gas price 487 399
1% increase in interest rate 464 489
Year Office ($000) Gas transportation ($000)
2015 $ 311 $ 452
2016 10 416
2017 - 388
2018 - 282
$ 321 $ 1,538

21
FUTURE ACCOUNTING PRONOUNCEMENTS
In May 2014, the IASB issued IFRS 15 "Revenue from Contracts with Customers," which replaces IAS 18
"Revenue," IAS 11 "Construction Contracts," and related interpretations. The standard is required to be
adopted either retrospectively or using a modified transition approach for fiscal years beginning on or after
January 1, 2017, with earlier adoption permitted. IFRS 15 will be applied by the Company on January 1, 2017
and the Company is currently evaluating the impact of the standard on its financial statements.
In July 2014, the IASB completed the final elements of IFRS 9 "Financial Instruments." The standard supersedes
earlier versions of IFRS 9 and completes the IASB’s project to replace IAS 39 "Financial Instruments: Recognition
and Measurement." IFRS 9, as amended, includes a principle-based approach for classification and
measurement of financial assets, a single 'expected loss’ impairment model and a substantially-reformed
approach to hedge accounting. The standard will come into effect for annual periods beginning on or after
January 1, 2018, with earlier adoption permitted. IFRS 9 will be applied by the Company on January 1, 2018 and
the Company is currently evaluating the impact of the standard on its financial statements.
CHANGES IN ACCOUNTING POLICIES
As of January 1, 2014, the Company adopted several new IFRS standards and amendments in accordance with
the transitional provisions of each standard. A brief description of each new standard and its impact on the
Company's consolidated financial statements follows below:
IAS 36 “Impairment of Assets”
This standard has been amended to reduce the circumstances in which the recoverable amount of CGUs is
required to be disclosed and clarify the disclosures required when an impairment loss has been recognized or
reversed in the period. The retrospective adoption of these amendments impact the Company’s disclosures in
the notes to the consolidated financial statements in periods when an impairment loss or impairment reversal
is recognized.
IAS 39 “Financial Instruments: Recognition and Measurement”
This standard has been amended to clarify that there would be no requirement to discontinue hedge
accounting if a hedging derivative was novated, provided certain criteria are met. The retrospective adoption of
the amendments does not have any impact on the Company’s consolidated financial statements.
IFRIC 21 “Levies”
This standard was developed by the IFRS Interpretations Committee (“IFRIC”) and is applicable to all levies
imposed by governments under legislation, other than outflows that are within the scope of other standards
(e.g., IAS 12 “Income Taxes”) and fines or other penalties for breaches of legislation. The interpretation clarifies
that an entity recognizes a liability for a levy when the activity that triggers payment as identified by the
relevant legislation, occurs. It also clarifies that a levy liability is accrued progressively only if the activity that
triggers payment occurs over a period of time, in accordance with the relevant legislation. Lastly, the
interpretation clarifies that a liability should not be recognized before the specified minimum threshold to
trigger that levy is reached. The retrospective adoption of this interpretation does not have any impact on the
Company’s financial statements.
CRITICAL ACCOUNTING ESTIMATES
A summary of the Company’s significant accounting policies is contained in Note 3 to the consolidated financial
statements. These accounting policies are subject to estimates and key judgments about future events, many
of which are beyond the Company’s control. The following is a discussion of the accounting policies that are
critical to the financial statements.
Reserves Estimates
The Company retained McDaniel to evaluate its crude oil and natural gas reserves, prepare an evaluation
report, and report to the Company. The process of estimating crude oil and natural gas reserves is subjective

22
and involves a significant number of decisions and assumptions in evaluating available geological, geophysical,
engineering and economic data. These estimates will change over time as additional data from ongoing
development and production activities becomes available and as economic conditions affecting crude oil and
natural gas prices and costs change. Reserves can be classified as prove, probable or possible with decreasing
levels of likelihood that the reserve will be ultimately produced.
Reserve estimates are a key input to the Company’s depletion calculations and impairment tests. Property,
plant and equipment within each area are depleted using the unit-of-production method based on proved plus
probable reserves using estimated future prices and costs. In addition, the costs subject to depletion include an
estimate of future costs to be incurred in developing proved reserves. A revision in reserve estimates or future
development costs could result in the recognition of higher depletion charged to net income.
E&E Costs
Capitalized costs that are exploratory in nature such as undeveloped land acquisitions, seismic expenditures
and exploration drilling are included in E&E costs. Costs are transferred from E&E to property, plant and
equipment once technical feasibility and commercial viability of the underlying resource have been established.
The results of a drilling operation can take considerable time to analyze and the determination that commercial
reserves have been discovered requires both judgment and application of industry experience. The evaluation
of petroleum and natural gas leasehold acquisition costs requires management’s judgment to evaluate the fair
value of land in a given area.
Impairment
Under IFRS, the carrying amount of property, plant and equipment and E&E assets are reviewed at each
reporting date to determine whether there is any indication of impairment. Management’s judgement is
required to perform such reviews. If there are indications of impairment, carrying values of assets are
compared to related recoverable amounts. Reserves, revenue, royalty and operating cost estimates and the
timing of future cash flows are all critical components of the recoverable amount. Revisions of these estimates
could result in significant changes to impairment charges recorded in a reporting period, as well as the carrying
value of the Company’s assets.
Decommissioning Liabilities
Decommissioning liabilities are measured based on the estimated costs of decommissioning and estimated
timing to reclamation, discounted to their net present value using a credit-adjusted risk-free rate.
Decommissioning liabilities are reassessed at each reporting date, and these estimates may change.
By nature of its oil and gas operations in Northern Alberta, the Company is subject to numerous safety and
environmental regulations, with which non-compliance may result in adverse financial impact. The Company
mitigates these risks through the adherence to formal safety and environmental policies, as well as adequate
insurance coverage. The Company is currently remediating an environmental spill at Marlowe and is subject to
a claim from the Occupational, Health and Safety division of the Government of Alberta. While the Company
believes it has recorded its best estimate of the impact of these contingencies in these financial statements, the
ultimate outcome of these incidents is uncertain.
Business Combinations
The acquisition method of accounting is used to account for acquisitions of subsidiaries and assets that meet
the definition of a business under IFRS. The cost of an acquisition is measured as the fair value of the assets
given, equity instruments issued and liabilities incurred or assumed at the date of acquisition of control.
Identifiable assets acquired and liabilities and contingent liabilities assumed in a business combination are
measured at their recognized amounts (generally fair value) at the acquisition date. The excess of the cost of
acquisition over the recognized amounts of the identifiable assets, liabilities and contingent liabilities acquired
is recorded as goodwill. If the cost of acquisition is less than the recognized amount of the net assets acquired,
the difference is recognized as a bargain purchase gain in net income or loss.

23
Risk Management Contracts
Estimated fair values of financial instruments are subject to fluctuation depending upon the underlying
commodity prices, interest rates, volatility curves and the risk of non-performance.
Stock Based Compensation
Stock based compensation expense is based on estimated fair values of stock options as of the grant date,
which are calculated using a Black-Scholes option pricing model and involves assumptions such as volatility,
expected option life and expected dividend yield.
Other Estimates
The accrual method of accounting requires management to incorporate certain estimates including estimates
of revenue, royalties and operating costs at a specific report date, but for which actual revenues and costs have
not yet been received. In addition, estimates are made on capital projects which are in process or recently
completed where actual costs have not been received by the reporting date. The Company obtains the
estimates from the individuals with the most knowledge of the activity and from all project documentation
received. The estimates are reviewed for reasonableness and compared to past performance to assess the
reliability of the estimates. Past estimates are compared to actual results in order to make informed decisions
on future estimates.
BUSINESS RISKS
There are numerous risks facing participants in the oil and gas industry. Some of the risks are common to all
businesses while others are specific to a sector. While Strategic realizes that these risks cannot be eliminated, it
is committed to monitoring and mitigating these risks. The following reviews the general and specific risks to
which the Company is exposed.
Acquisition and Development of Additional Reserves
The Company’s future success is dependent upon its ability to develop or acquire additional oil and natural gas
reserves that are economically recoverable at attractive prices. Except to the extent that the Company
conducts successful activities or acquires properties containing proved reserves, or both, the proved reserves
and production will generally decline as reserves are produced. The drilling of oil and natural gas wells involves
a high degree of risk, especially the risk of a well that is not sufficiently productive to provide an economic
return on the capital expended to drill the well or of its ongoing operational costs.
Exploration and development risks are due to the uncertain results of searching for and producing oil and
natural gas using imperfect scientific methods. These risks are mitigated by using highly skilled staff, focusing
activities in areas in which the Company has existing knowledge and expertise or access to such expertise, using
up-to-date technology to enhance methods and controlling costs to maximize returns. Advanced oil and natural
gas related technologies such as three dimensional seismography, reservoir simulation studies and horizontal
drilling might, where appropriate, be used by the Company to improve its ability to find, develop and produce
oil and natural gas. However, notwithstanding this, the combination of technology, knowledge and skilled
people may not eliminate these risks.
Acquisitions of resource issuers and resource assets by the Company will be based on engineering and
economic assessments made by management. These assessments include a series of assumptions regarding
such factors as recoverability and marketability of oil and natural gas, future prices of oil and natural gas and
operating costs, future capital expenditures and royalties and other governmental levies which will be imposed
over the producing life of the reserves. Many of these factors are subject to change and are beyond the control
of the Company. In particular, changes in the prices of and markets for oil and natural gas from those
anticipated at the time of making such assessments will affect the value of the Company’s common shares. In
addition, all such assessments involve a measure of geological and engineering uncertainty that could result in
lower production and reserves than anticipated.

24
Resource Estimates
In general, estimates of gross original resources and recoverable resources are based upon a number of factors
and assumptions made as of the date on which the estimates were determined, such as geological,
technological and engineering estimates and are subject to a variety of risks and uncertainties and other factors
that could cause actual events or results to differ materially from those anticipated in forward-looking
estimates.
These risks and uncertainties include but are not limited to: (1) the fact that there is no certainty that the zones
of interest will exist to the extent estimated or that the zones will be found to have oil with characteristics that
meet or exceed the minimum criteria in terms of net pay thickness, porosity or oil saturation, or that the oil will
be commercially recoverable to the extent estimated; (2) the lack of additional financing to fund the
Corporation's exploration activities and continued operations; (3) fluctuations in foreign exchange and interest
rates; (4) the number of competitors in the oil and gas industry with greater technical, financial and operations
resources and staff; (5) fluctuations in world prices and markets for oil and gas due to domestic, international,
political, social, economic and environmental factors beyond the Corporation's control; (6) changes in
government regulations affecting oil and gas operations and the high compliance cost with respect to
governmental regulations; (7) potential liabilities for pollution or hazards against which the Corporation cannot
adequately insure or which the Corporation may elect not to insure; (8) the Corporation's ability to hire and
retain qualified employees and consultants; (9) contingencies affecting the classification as reserves versus
resources which relate to the following issues as detailed in the COGEH: ownership considerations, drilling
requirements, testing requirements, regulatory considerations, infrastructure and market considerations,
timing of production and development, and economic requirements; (10) the fact that there is no certainty that
any portion of contingent resources will be commercially viable to produce; (11) the fact that there is no
certainty that any portion of the prospective resources will be discovered and if discovered, there is no
certainty that it will be commercially viable to produce any portion of the resources; and (12) other factors
beyond the Corporation's control. Any reference in this MD&A to DPIIP, UPIIP, contingent resources and
prospective resources are not, and should not be confused with oil and gas reserves.
Oil and Natural Gas Prices and Marketing
The marketability and price of oil and natural gas that may be acquired or discovered by the Company will be
affected by numerous factors beyond its control. The Company's ability to market its natural gas and oil may
depend upon its ability to acquire space on pipelines that deliver natural gas and oil to commercial markets.
The Company may also be affected by deliverability uncertainties related to the proximity of its reserves to
pipelines and processing facilities, and related to operational problems with such pipelines and facilities as well
as extensive government regulation relating to price, taxes, royalties, land tenure, allowable production, the
export of oil and natural gas and many other aspects of the oil and natural gas business.
The Company's revenues, profitability and future growth and the carrying value of its oil and gas properties are
substantially dependent on prevailing prices of oil and gas which are volatile and subject to fluctuations. The
Company's ability to borrow and to obtain additional capital on attractive terms is also substantially dependent
upon oil and gas prices. Petroleum prices have fallen precipitously over the last 4 months due to global
oversupply, caused primarily by growth in North American oil production and lack of a voluntary production
curtailment by the Organization of Petroleum Exporting Countries (“OPEC”). Continued low commodity prices
may have an adverse effect on the Company’s cash flows, reserves values and capital resources, including the
availability of its credit facilities.
Prices for oil and gas are subject to large fluctuations in response to relatively minor changes in the supply of
and demand for oil and gas, market uncertainty and a variety of additional factors beyond the control of the
Company. These factors include economic conditions in the United States and Canada, the actions of OPEC,
governmental regulation, political stability in the Middle East and elsewhere, the foreign supply of oil and gas,
the price of foreign imports and the availability of alternative fuel sources. Petroleum prices are expected to
remain volatile for the near future as a result of market uncertainties over the supply and the demand of these
commodities due to the current state of the global economy, OPEC actions, instability in the Middle East and
the impact of emerging countries such as China and India on the demand for crude oil and natural gas.

25
Volatile oil and gas prices make it difficult to estimate the value of producing properties for acquisition and
often cause disruption in the market for oil and gas producing properties, as buyers and sellers have difficulty
agreeing on such value. Price volatility also makes it difficult to budget for and project the return on
acquisitions and development and exploitation projects.
Substantial Capital Requirements and Liquidity
The Company anticipates that it will make substantial capital expenditures for the acquisition, exploration,
development and production of oil and natural gas reserves in the future. The Company’s credit facilities are
fully utilized and cash flows are being adversely affected by low commodity prices. As such, the Company’s
ability to expend the capital necessary to undertake or complete future drilling programs in order to replace
reserves and maintain production will be limited without additional financing. There can be no assurance that
debt or equity financing will be available or sufficient to meet these requirements or for other corporate
purposes or, if debt or equity financing is available, that it will be on terms acceptable to the Company.
Moreover, the Company anticipates being in violation of its debt covenants at March 31, 2015, and its credit
facility will be reduced by $0.5 million per month starting April 1, 2015. In order to address the violation and
fund future capital programs Strategic may be required to alter its capitalization significantly, or obtain
alternative financing at a higher cost or with more restrictive terms than the Company’s existing credit facility.
The inability of the Company to access sufficient capital for its operations could have a material adverse effect
on the Company’s financial condition, results of operations or prospects.
Environmental Concerns
The operation of oil and natural gas wells involves a number of natural hazards that may result in blowouts,
environmental damage or other unexpected or dangerous conditions resulting in liability to the Company and
possibly liability to fourth parties. The oil and natural gas industry is subject to extensive environmental
regulation that provides for restrictions and prohibitions on releases or emissions of various substances
produced in association with certain oil and natural gas industry operations, and such regulations may be
expanded to include regulation of, among other things, emissions of carbon dioxide. In addition, legislation
requires that well and facility sites are abandoned and reclaimed to the satisfaction of provincial authorities. A
breach of such legislation may result in fines or the issuance of clean-up orders. The Company carries insurance
to mitigate the cost of remediating damage from environmental incidents, but there can be no assurance that
the insurance will cover all types of incidents or that remediation costs will not exceed the limit of the
insurance carried. In addition, the Company will make reasonable provisions for well abandonment, facility
decommissioning and site remediation where appropriate, however there can be no assurance that such
provisions will be sufficient to satisfy all such obligations. Permits and Licenses
Strategic’s operations may require licenses and permits from various governmental authorities. There can be
no assurance that Strategic will be able to obtain all necessary licenses and permits that may be required to
carry out exploration and development at its projects.
Reliance on Operators and Key Employees
To the extent the Company is not the operator of its oil and gas properties, the Company will be dependent on
such operators for the timing of activities related to such properties and will largely be unable to direct or
control the activities of the operators. In addition, the success of the Company will be largely dependent upon
the performance of its management and key employees. The Company does not have any key man insurance
policies, and therefore there is a risk that the death or departure of any member of management or any key
employee could have a material adverse effect on the Company. In addition, the competition for qualified
personnel in the oil and natural gas industry is intense and there can be no assurance that the Company will be
able to continue to attract and retain all personnel necessary for the development and operation of the
business. Investors must rely upon the ability, expertise, judgment, discretion, integrity and good faith of
Strategic’s management.

26
Third Party Credit Risk
The Company is or may be exposed to third party credit risk through its contractual arrangements with its
current or future joint venture partners, marketers of its petroleum and natural gas production, operators of
facilities, pipelines, terminals and other infrastructure used by Strategic and other parties. In the event such
entities fail to meet their contractual obligations to the Company, such failures could have a material adverse
effect on the Company and its cash flow from operations.
Title to Properties
Although title reviews will be done according to industry standards prior to the purchase of most oil and natural
gas producing properties or the commencement of drilling wells as determined appropriate by management,
such reviews do not guarantee or certify that an unforeseen defect in the chain of title will not arise to defeat a
claim of Strategic which could result in a reduction of the revenue received by the Company.
Competition
Strategic competes with numerous other organizations in the search for, and the acquisition of, oil and natural
gas properties and in the marketing of oil and natural gas. The Company also competes with other companies
for all of its business inputs including exploitation and development prospects, access to commodity markets,
property and corporate acquisitions, and available capital. The Company endeavors to be competitive by
maintaining a strong financial condition, by attracting and retaining technically competent and accountable
staff, by refining and enhancing business processes on an ongoing basis and by utilizing current technologies to
enhance exploitation, development and operational activities.
FORWARD-LOOKING STATEMENTS
This report includes certain information, with management’s assessment of Strategic’s future plans and
operations, and contains forward-looking statements which may include some or all of the following: (i)
forecasted capital expenditures and plans; (ii) exploration, drilling and development plans, (iii) prospects and
drilling inventory and locations; (iv) anticipated production rates; (v) expected violations of credit facility
covenants; (vi) anticipated production and service costs; (vii) incremental development opportunities; (viii)
total shareholder return; (ix) anticipated compliance with credit facility covenants; (x) asset disposition plans;
(xi) potential sources of funding, which are provided to allow investors to better understand Strategic’s
business. By their nature, forward-looking statements are subject to numerous risks and uncertainties; some
of which are beyond Strategic’s control, including the impact of general economic conditions, industry
conditions, volatility of commodity prices, currency fluctuations, imprecision of reserve estimates,
environmental risks, changes in environmental tax and royalty legislation, competition from other industry
participants, the lack of availability of qualified personnel or management, stock market volatility and ability to
access sufficient capital from internal and external sources, and other risks and uncertainties described under
the heading ‘Risk Factors’ and elsewhere in the Company’s Annual Information Form for the year ended
December 31, 2014 and other documents filed with Canadian provincial securities authorities and are available
to the public at www.sedar.com. Readers are cautioned that the assumptions used in the preparation of such
information, although considered reasonable at the time of preparation, may prove to be imprecise and, as
such, undue reliance should not be placed on forward-looking statements. The principal assumptions Strategic
has made includes security of land interests; drilling cost stability; royalty rate stability; oil and gas prices to
remain in their current range; finance and debt markets continuing to be receptive to financing the Company
and industry standard rates of geologic and operational success. Strategic’s actual results, performance or
achievement could differ materially from those expressed in, or implied by, these forward-looking statements
or if any of them do so, what benefits that Strategic will derive there from. Strategic disclaims any intention or
obligation to update or revise any forward-looking statements, whether as a result of new information, future
events or otherwise, except as required by law.