management of wastewater in japan -...
TRANSCRIPT

Management of Wastewater in Japan
April 2016

Contents
1. Preface ・・・・・・・・・・・・・・・・・・・・・・・・・・・・・・・・・・・・ 1
2. History ・・・・・・・・・・・・・・・・・・・・・・・・・・・・・・・・・・・・ 2
3. Challenges and Solutions ・・・・・・・・・・・・・・・・・・・・・・ 4
3.1 Flood Control ・・・・・・・・・・・・・・・・・・・・・・・・・・・・ 4
3.2 Earthquake Resilience ・・・・・・・・・・・・・・・・・・・・・・ 6
3.3 Asset Management ・・・・・・・・・・・・・・・・・・・・・・・・ 8
3.4 Pollution Control・・・・・・・・・・・・・・・・・・・・・・・・・・・ 9
3.5 Waterfront Restoration ・・・・・・・・・・・・・・・・・・・・ 11
3.6 CSO Control ・・・・・・・・・・・・・・・・・・・・・・・・・・・・・・ 12
3.7 Service Expansion ・・・・・・・・・・・・・・・・・・・・・・・・・ 14
3.8 Full Use of Asset ・・・・・・・・・・・・・・・・・・・・・・・・・・ 14
3.9 Resource Recovery ・・・・・・・・・・・・・・・・・・・・・・・・ 15
3.10 International Cooperation ・・・・・・・・・・・・・・・・・ 18
3.11 Financial Sustainability ・・・・・・・・・・・・・・・・・・・・ 18

4. Wastewater Works Data ・・・・・・・・・・・・・・・・・・・・・・・・ 19
4.1 Coverage rate of sewered population ・・・・・・・・・・ 19
4.2 Number of wastewater treatment plants by process ・・・・・・・・・・・・・・・・・・・・・・・・・・・・・・・・・・ 19
4.3 Number of sludge treatment plants by process ・・・ 20
4.4 Number of locations by use of above space of facility ・・・・・・・・・・・・・・・・・・・・・・・・・・・・・・・・・・・ 20
4.5 Total length of sewers by size ・・・・・・・・・・・・・・・・・ 20
4.6 Number of stormwater storage facilities by category and by storage volume ・・・・・・・・・・・・・・・ 21
4.7 Annual volume of treated wastewater ・・・・・・・・・ 21
4.8 State of recycling/reclamation of treated water ・・ 21
4.9 Volume of sludge by method of final disposal ・・・・ 22
4.10 Volume of reused sludge by application ・・・・・・・ 22

Preface
This booklet is intended to show what is happening to wastewater management in Japan andhow utilities of local governments and national government office in charge of publicwastewater service are trying to handle the issues. Furthermore, brief history appears asintroduction at the beginning.
For the last half of century, national and local governments have invested a lot of money intobuilding physical infrastructure to manage wastewater. Current situations are much better thanthey used to be on the issues of pollution and floods.
On the other hand, having built and owning huge amount of assets has brought new issues suchas sustainability of the service and earthquake resilience. In addition, climate change, energyprice increase, and depopulation, which are beyond control of utilities, affect wastewater servicenegatively. As long as people live, wastewater service must continue. Our mission is sustainingand improving the service for good.
JSWA is a government registered pubic interest organization supported by wastewater utilities oflocal governments, private companies in wastewater industry, and individual wastewaterprofessionals. JSWA is committed to work together with our members to achieve sustainabilityand improvements of wastewater service.
I hope this booklet gives international readers some insight on the issues and solutions in Japanand helps exchange views and opinions internationally. For more information, please contact mystaff members ([email protected]).
Last but not least, I thank those who helped us to publish this booklet, officials of Ministry ofInfrastructure, Land, and Transportation, utility members, and the members of committee oninternational relations, JSWA.
曽小川 久貴Hisataka Sokawa
Director General
Japan Sewage Works Association
-1-

2. History
The mission of wastewater service has grown over the course of history. Here is a shortdescription of its evolving roles.
Development of wastewater works in Japan
Since the beginning of 20th century until the early 1960s, wastewater service was designed tokeep sanitation of urban areas because the infectious water borne diseases killed many people.The priority was removing both sanitary wastewater and storm water from where people lived.
In the 1970’s, public water pollution was so severe that expansion of wastewater treatmentservice was in dire need. Necessary measures were taken one after another for funding andimplementation of wastewater projects.
In 1996, the sewerage law was revised to promote beneficial use of sludge. Wastewater serviceexpansion led to increase in sludge generation and need to recycle due to shortage of disposalsites
In 2003, requirement of CSO control was added to the sewerage law. Expansion of wastewaterservice achieved clean water environment on dry weather days. Clean water allowed waterfrontdevelopment and led to make CSO pollution stand out after wet weather days.
In 2015, the law was revised to ensure asset management for all the wastewater serviceoperators, namely local governments. Aging wastewater infrastructure was highlighted inrelation to sinkholes from failed sewers.
-2-
Improvement of sanitation
Healthy urban
development Water quality
conservationResource recovery from
wastewater Enhance flood controls
in urban areas
Asset management for sustainability
1900
1960
1970
1990
2000
2010
Since1884

2. History
1960s severely polluted Dokai bay (left) and at present (right), Kitakyushu city
Landscape streams with treated waste water from Tsuzuki WWTP, Yokohama.
-3-

3. Challenges and Solutions
3.1 Flood Control
• Repeated extreme weather events by climate change
• High runoff ratio by increased impervious surfaces
• Increased damage-prone structures
0
50
100
150
200
250
300
350
400
1976 1981 1986 1991 1996 2001 2006 2011
Number of Annual Extreme Rainfall Events, >50mm/hrEdited from data of Japan Meteorological Agency
Times/Year
1976~1985
Average 174 times
2004~2013
Average 241 times1.4 times
The risk of urban flood has increased. Themagnitude of damage is increasing because ofurbanization. Underground structures such assubway systems and basement floors aregrowing, which are vulnerable to flooding.Development from urbanization replaces urbangreenery with impermeable surfaces, leading tohigh runoff ratio. The extreme rainfall intensityevents are frequently observed because ofclimate change. Therefore, chances are gettinghigher for a local sewer network to beoverwhelmed. Three main reasons of recent flood damages
-4-

3. Challenges and Solutions
In light of these circumstances, the utilities take comprehensive measures to deal with flooding,combining structural, non-structural and self-help measures.
The traditional solution for flood control has been an augmentation of network drainagecapacity such as installation of new sewer line and pumps. However, limited fund and frequentextreme rainfall events have led to alternative solutions such as BMPs and citizens’ self-helpmeasures assisted by public non-structural solutions including flood map and alert system.
Flood into underground mall, Fukuoka City, 2000
Urban flood, Nagoya City, 2000
Concept of integrated flood controls
Infiltration drain
Urban flood map
River
Storage sewer Storage tank
storm sewer
Rainfall radar information service
Flood barrierBackflow preventionInfiltration drain
Flood barrier
Underground mall
Prioritized investment and sure operation- Built of storage and infiltration systems
Information to assist self-help by citizens-Urban flood map-Real time rainfall info service-Flood alert
Damage control by citizens-Voluntary evacuation-Flood barrier
Flood alert
Public structure
Public non-structure
Self help, structural and non-structural
・・・Self-help
・・・Public structural
・・・Public non-structural
-5-
Infiltration drain

3. Challenges and Solutions
3.2 Earthquake Resilience
Wastewater spillage and overflow
Flush toilets unusable
Traffic hindrance due to protrusion of manholes by liquefaction
Catastrophic earthquake is a thing in life in Japan. All we haveto do is to build resiliency.
In the past earthquakes, the spill and overflow of untreatedwastewater and unusable toilets posed a serious threat topublic health and sanitation. Furthermore, soil liquefactiondestroyed highways and streets due to the protrusion ofmanholes and sewers, resulting in severe disruption to trafficfor emergency vehicles.
Therefore, critical components of wastewater systems needto be earthquake-proof. However, there are a lot of facilitiesthat do not meet the requirement. As of March 2014, the55% of trunk sewers and 59% of disinfection facilities werenot earthquake-proofed according to Ministry of Land,Infrastructure, and Transportation (MLIT).
Problem caused by earthquake damages
Manhole protrusion caused by liquefaction (Above)Installation of manhole toilets (Below)
-6-
Valve socket
Installation of flexible joints between Manhole & Pipe
Installation of Buoyancy Remover on Manholes
Excess Pore water Pressure
Pressure Cap

3. Challenges and Solutions
MLIT is addressing this situation with subsidy for structural proofing while calling for the utilitiesto make the business continuity plans (BCPs).
Priority sewerage structures for earthquake proofing
Heavily urbanized area
Disaster Management Base
Nursing home
National road
Railway
Evacuation (EV) shelter atElementary school
River
WWTP
Priority sanitary sewer: grey line
Non-priority storm sewer: white line
Non-priority sanitary sewer: white line
Priority storm sewer: grey line
Sanitary sewer Storm sewer
Disinfection facility
-7-

3. Challenges and Solutions
3.3 Asset Management
Sinkholes caused by failed sewers
Japan has built a total of 460,000 km of sewer linesand 2,200 treatment plants for public wastewaterservice. The deterioration from aging may threatsustainability of wastewater service in the years ahead.The failed sewers cause around 4,000 cases ofsinkholes annually.
To improve this situation, asset management havebeen discussed and implemented.
The emphasis is placed on minimization of life cyclecost and longevity of individual assets, andequalization of future annual capital spending.
In 2015, the sewerage law was amended to ensuresafety and sustainability of wastewater service. Underthe law, local governments are required to investigatea critical asset at a certain interval such as concretegravity sewer connecting down to pressure sewer.
-8-
1957 1977 1997 2013
Sewer Age Distribution & Total Length

3. Challenges and Solutions
3.4 Pollution ControlRivers are much cleaner than they used to be in the 70’s and 80’s due to the expansion ofwastewater service up to 80% of population. However, the problems of eutrophication instagnant coastal and fresh water bodies remain a challenge. Bay of Tokyo, Bay of Nagoya, Bay ofOsaka, Lake Biwa, and Lake Kasumigaura do not meet their EQSs. In those water bodies, red tide,blue tide, and other forms of blooming have been observed. The pollution affects fisheries,ecosystems, and recreational use and drinking water treatment. The progresses of advancedtreatment with nutrient removal are 27% in the watershed of Bay of Tokyo, 65% in Nagoya, and65% in Osaka as of the end of March 2013. In this evaluation, advanced treatment is defined tothe law-designated BNRs such as A₂O and AO processes.
One of the reasons for slow progress for nutrient removal is costly remodeling works fromcurrent conventional activated sludge process to BNRs. To solve this problem, the newapproaches are taken for operational optimization to remove nutrients with the conventionalactivated sludge process.
Compliance Rate of EQS (BOD or COD)
Source: MOE
100
90
80
70
60
50
40
30
20
10
0
Rivers 94%Total 90%
Coastal waters 80%
Lakes and reservoirs 56%
Total Rivers
Coastal Waters
Lakes and reservoirs
Compliance Rate (%)
-9-

3. Challenges and Solutions
Blue tide, Red tide, and Water bloom
Nitrogen removal by minor modification to conventional activated sludge process
Blue tide Red tide
Return sludgeExcess sludge
Return sludge + recirculation Excess sludge
Modification
Final sedimentation
tank
Final sedimentation
tank
Aerobic tank
Aerobic tankAnoxic zone
Water bloom (Cyanobacteria)
-10-
3. Challenges and Solutions
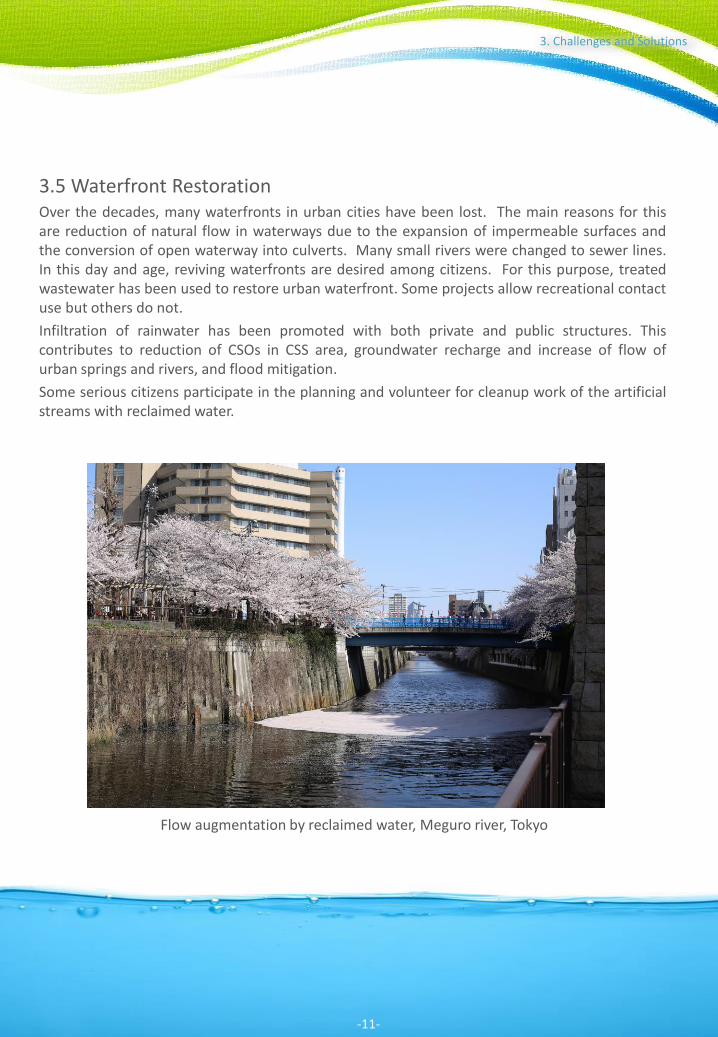
3.5 Waterfront RestorationOver the decades, many waterfronts in urban cities have been lost. The main reasons for thisare reduction of natural flow in waterways due to the expansion of impermeable surfaces andthe conversion of open waterway into culverts. Many small rivers were changed to sewer lines.In this day and age, reviving waterfronts are desired among citizens. For this purpose, treatedwastewater has been used to restore urban waterfront. Some projects allow recreational contactuse but others do not.
Infiltration of rainwater has been promoted with both private and public structures. Thiscontributes to reduction of CSOs in CSS area, groundwater recharge and increase of flow ofurban springs and rivers, and flood mitigation.
Some serious citizens participate in the planning and volunteer for cleanup work of the artificialstreams with reclaimed water.
Flow augmentation by reclaimed water, Meguro river, Tokyo
-11-

3. Challenges and Solutions
3.6 CSO controlCombined sewer systems (CSS) serve around 25% of population and 13% of a total of 1,430municipalities with wastewater service in Japan. CSOs are a threat to public health and cleanwater environment. CSS are designed to carry both sanitary wastewater and storm water in thesame pipeline. Utilities had chosen CSS until 1972 as an economical solution for controlling floodand pollution together.
CSS makes CSOs at overflow structures or at pumping stations on wet weather days when acertain rainfall intensity or over.
In 2001, a major daily covered a story of CSO on its front page. In the article, it revealed thatstinky FOG solids, which had been spotted at a popular beach in downtown Tokyo, came fromsewers. It ignited a major controversy. Since then, the utilities started making serious efforts tocontrol CSOs. Local utilities and MLIT agreed to improve CSS to achieve the three goals below.
The total pollutant load from a CSSsystem shall be equal to or less thanpollution load from the separate sewersystem hypothetically applied on thesame area.
The number of CSO events shall behalved at all overflow and dischargeoutfalls.
All overflow structures shall havemeasures to control gross solids.
1.
2.
3.
………………………………………
CSO to a river loved by citizens
………………………………………
-12-

3. Challenges and Solutions
Example of CSO control measures
Stormwater
Stormwater
Sanitarywastewater
Sanitarywastewater
Infiltration drain, catch basin, and pavement
CSO storage structure
Floatables control at overflow structures
Increase of interceptor capacity
Improvement of primary treatment for wet weather
flow
Reduction of wet weather pollution
End-of-pipe net
Sewer separation
Combined sewer
CSO outfall
WWTP
-13-

3. Challenges and Solutions
Later, the sewerage law was amended in 2003, making the three goals mandatory requirementwithin a specified time period. A total of 170 small and midsize municipalities were obligated toimplement improvements by FY2013 while a total of 21 of large municipalities by FY2023. Up tonow, 169 small and midsize municipalities have completed their requirements. Two largemunicipalities have also completed improvements.
3.7 Service ExpansionApproximately 89% of Japan’s population has access to sanitary wastewater treatment as ofFY2013 by centralized or onsite wastewater systems. However, there still remain around 14million people whose wastewater is discharged to the environment without treatment. Forthose people, only human waste is treated and greywater is discharged directly. Sanitation forall is an urgent task. Current discussion focuses on low cost technology for centralized seweragesystem and revision of masterplan to downsize centralized system while increasing onsitesystems. This is the consequence of recent socioeconomic conditions such as public spendingreduction and population decline.
3.8 Full Use of Asset
In some areas with substantial snowfall, wastewater systems are used to help clear snow. Someof the methods employed are direct dumping of snow into sewers, installation of snow meltingtanks at treatment plants and diversion of treated water into snow removal gutters.
Garden and High-rise atop WWTP, Tokyo
Wastewater assets have been used forpublic purposes in a variety of ways all overJapan. The examples include; sports fieldsatop WWTPs, recreational waterfronts atflood control ponds, snow clearance ormelting by wastewater systems, andoptical fiber cables inside sewer lines.
A total of 369 WWTPs allow the public touse their open spaces as recreational parks,sports field, car parks, and so on as ofFY2012.
-14-

3. Challenges and Solutions
3.9 Resource Recovery
Wastewater service is shifting from disposal ofunwanted material to production of useful things.
Clean water, organic and inorganic fertilizer, energy inthe forms heat, fuel, and electricity are produced andrecovered from collection and treatment ofwastewater.
However, currently only 1.4% of the total amount oftreated wastewater is intentionally reused. Watershortage is not serious with some exceptions. Muchof the reuse applications are landscape use, rivermaintenance, and snow melting. Water scarce majorcities are Tokyo with 14 million and Fukuoka with 1.6million of population. They experienced severeshortage during the 20th century and started reuseprojects extensively.
The space inside sewers is used for installing opticalfiber cables. Total length reached 2,223 km as ofFY2012. In addition to its use for monitoring andcontrol of wastewater systems, extra capacity ofoptical fiber is rented to the private sector and physicalspace within sewers is also leased out to privatecompanies for the installation of their own opticalfiber cables.
They have local laws to require developers to use recycled water, either treated wastewater orharvested rainwater. The recycled water is used for flushing toilets and landscape irrigation atnewly developed large properties.
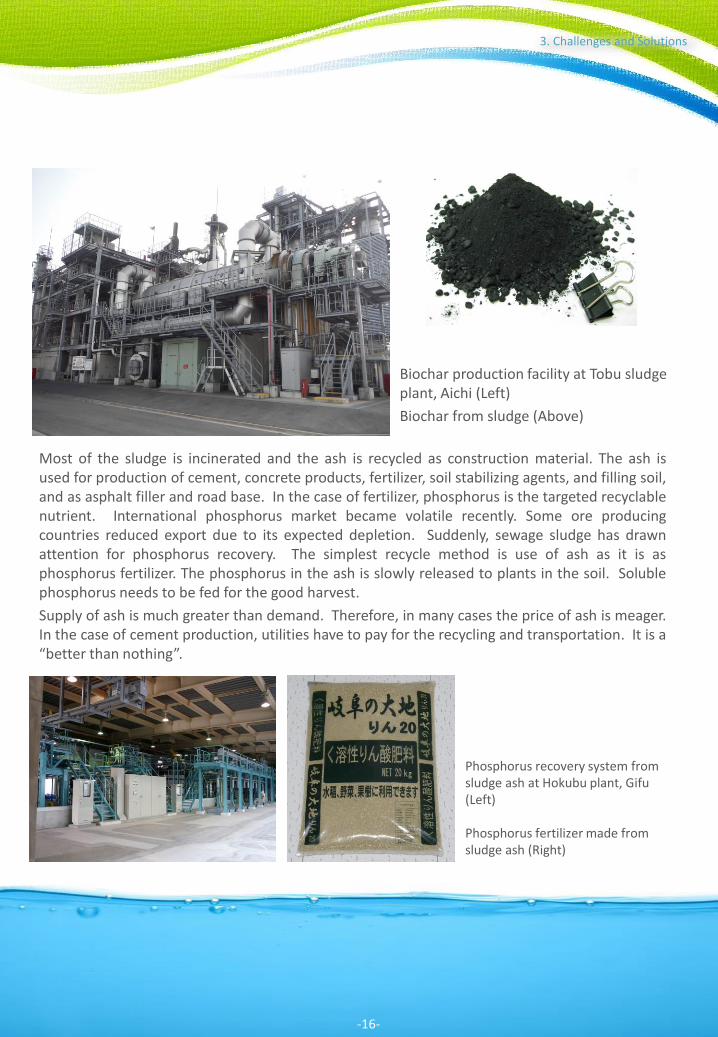
A variety of new projects have been implemented for sludge recycle. Many projects failed dueto poor marketability of recycle products. Currently, the biochar projects are increasing as theycan reduce marketability issue. In those projects, the biochar is sold to the power companies.The power companies are obliged to use green energy to reduce GHGs emission for powergeneration. The biochar is used at coal fire power plants.
Installation of optical fiber (Above)Reclaimed water production facility with ceramic filter at Shibaura Water Reclamation Center, Tokyo (Below)
-15-
3. Challenges and Solutions
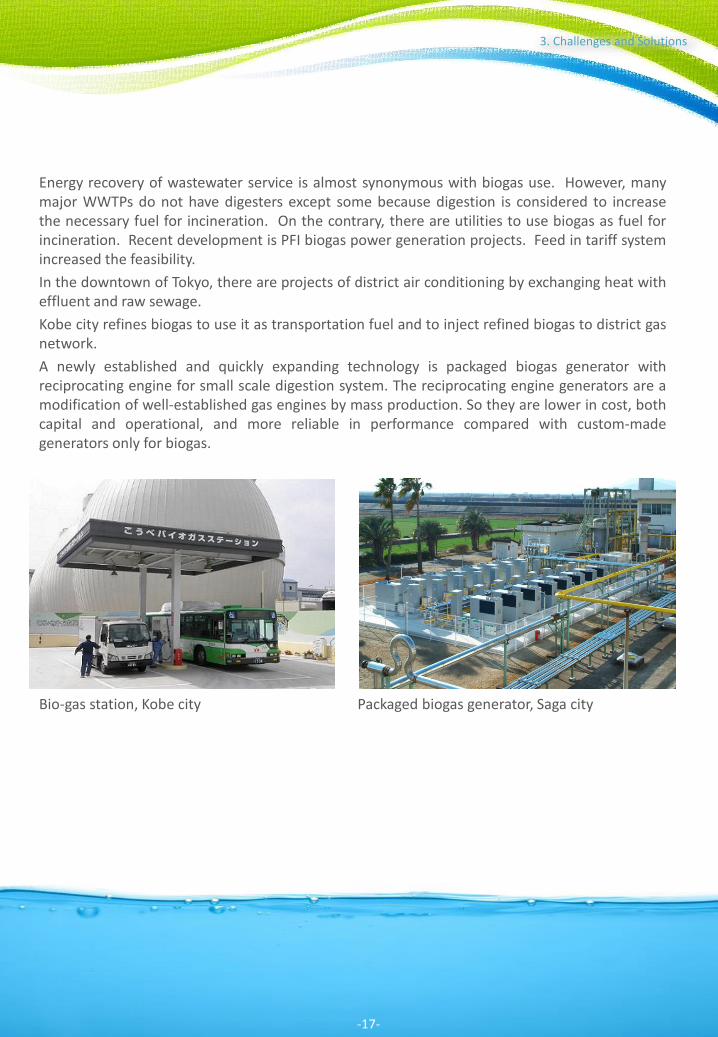
Most of the sludge is incinerated and the ash is recycled as construction material. The ash isused for production of cement, concrete products, fertilizer, soil stabilizing agents, and filling soil,and as asphalt filler and road base. In the case of fertilizer, phosphorus is the targeted recyclablenutrient. International phosphorus market became volatile recently. Some ore producingcountries reduced export due to its expected depletion. Suddenly, sewage sludge has drawnattention for phosphorus recovery. The simplest recycle method is use of ash as it is asphosphorus fertilizer. The phosphorus in the ash is slowly released to plants in the soil. Solublephosphorus needs to be fed for the good harvest.
Supply of ash is much greater than demand. Therefore, in many cases the price of ash is meager.In the case of cement production, utilities have to pay for the recycling and transportation. It is a“better than nothing”.
Biochar production facility at Tobu sludge plant, Aichi (Left)
Biochar from sludge (Above)
Phosphorus recovery system from sludge ash at Hokubu plant, Gifu (Left)
Phosphorus fertilizer made from sludge ash (Right)
-16-
3. Challenges and Solutions
Energy recovery of wastewater service is almost synonymous with biogas use. However, manymajor WWTPs do not have digesters except some because digestion is considered to increasethe necessary fuel for incineration. On the contrary, there are utilities to use biogas as fuel forincineration. Recent development is PFI biogas power generation projects. Feed in tariff systemincreased the feasibility.
In the downtown of Tokyo, there are projects of district air conditioning by exchanging heat witheffluent and raw sewage.
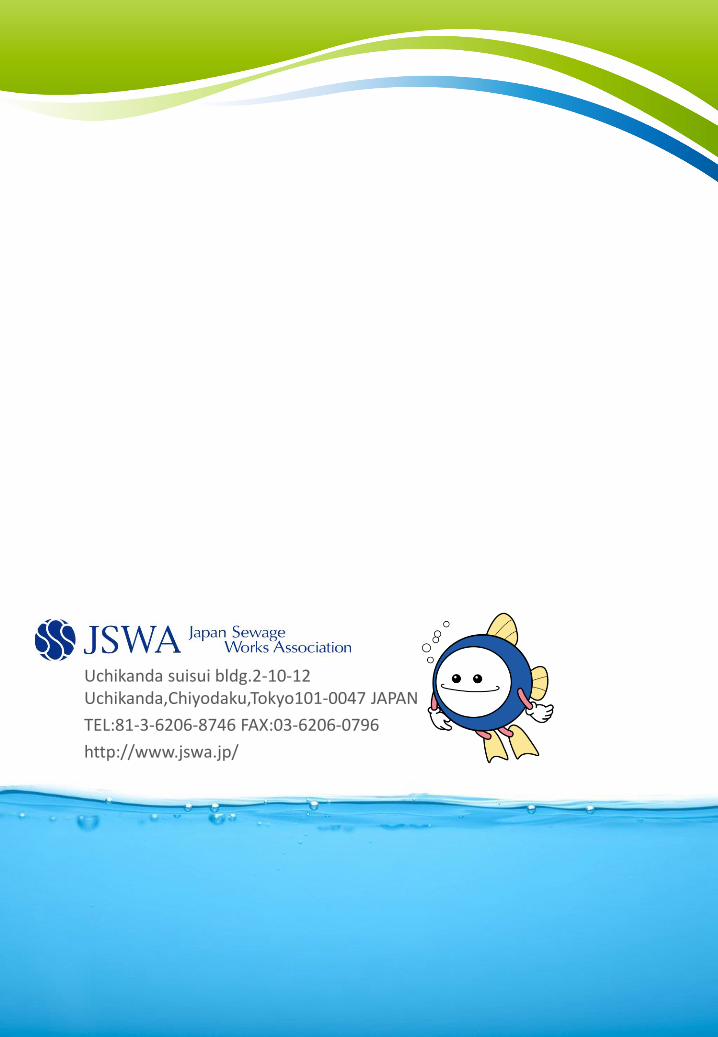
Kobe city refines biogas to use it as transportation fuel and to inject refined biogas to district gasnetwork.
A newly established and quickly expanding technology is packaged biogas generator withreciprocating engine for small scale digestion system. The reciprocating engine generators are amodification of well-established gas engines by mass production. So they are lower in cost, bothcapital and operational, and more reliable in performance compared with custom-madegenerators only for biogas.
Bio-gas station, Kobe city Packaged biogas generator, Saga city
-17-

3. Challenges and Solutions
3.10 International Cooperation
3.11 Financial SustainabilityJapan has a clear principle for financing wastewater service as follows.
Rural and semi urban utilities face difficulty in financial sustainability of wastewater service.Their tariff revenue is not enough to cover the necessary cost because of depopulation,decreasing water use per capita, and neglected connection to public sewer by potentialcustomers. On the other hand, their debt is huge because of past capital investment with loans.They need to seek efficient management while identifying necessary tariff level for the hike andensuring sewer connection for all within service area. Ministry of Internal Affairs has mandatedthe local governments with the population of 30,000 or over to adopt private sector accountingfor wastewater service by 2019. Most of them have used government accounting method.Private accounting is necessary to analyze financial sustainability of utility service.
Japan has been a leading donor in the field of water and sanitation. About 2 billion US dollars ofassistance has been provided annually. Japan works together with international community tohelp ensure availability and sustainability of sanitation service for all. This is the goal in the 2030Agenda for Sustainable Development made by UN.
Japan established the Global Center for Urban Sanitation (GCUS) in 2009. It is a platform forachieving the UN development goal by concerted wastewater expertise of Japan amongdifferent stakeholders. The membership of GCUS includes MLIT, public research institutions,local utilities, professional associations, and private companies. JSWA takes the secretariat rolewith MLIT. GCUS activities include local and international networking, ISO standardization, andparticipation in international water events.
1.
………
Government tax shall cover the cost forstorm water drainage
Utility fee shall cover the cost for sanitarywastewater service2.
Business matching with Asian government officials (Left)Exhibition in Myanmar (Right)
-18-

4. Wastewater Works Data
4.1 Coverage rate of sewered population
4.2 Number of wastewater treatment plants by process(As of end of FY2012)
Treatment processDesign daily maximum dry weather flow (1,000s m3/day)
0-5 5-10 10-50 50-100 100-500 500+ Total
Primary Sedimentation - -
1
- - -
1
Secondary/
advanced
A2/O process -
4 12 8 18
-
42
Pre-denitrification process4 5 14 3 8
-
34
Post-denitirification process2 2
- - - -
4
Step feed denitrification process1 1 17 7 10
-
36
A/O process12
-
6 4 12 1 35
Conventional activated sludge process42 65 318 110 102 11 648
Extended aeration process41 6 1
- - -
48
Pure oxygen activated sludge process2 2 3 3 1
-
11
Step-feed aeration process - -
1 3 2
-
6
Sequencing batch reactor (SBR) process66 4 2
- - -
72
Biological aerated filter29 1
- - - -
30
Biological anaerobic-aerobic filters41 1
- - - -
42
High-rate trickling filter -
1 2
- - -
3
Submerged attached-growth process10
- - - - -
10
Rotating biological contactor process10 4 1 1
- -
16
Soil-covered gravel contact process32
- - - - -
32
Oxidation ditch advanced treatment44 8 3
- - -
55
Oxidation ditch process856 92 26
- - -
974
Other treatment methods22 4 9 1 6
-
42
Total1,214 200 416 140 159 12 2,141
Advanced treatment 96 36 91 47 111 7 388
-19-
0
10
20
30
40
50
60
70
80
4,000
6,000
8,000
10,000
12,000
14,000
16,000
Total population (10,000s)
Sewered population (10,000s)
Coverage rate (%)
Year (FY)
Co
vera
ge r
ate
(%)
Po
pu
lati
on
(1
0,0
00
s)

4. Wastewater Works Data
4.3 Number of sludge treatment plants by process
4.4 Number of locations by use of above space of facility
4.5 Total length of sewers by size
(As of end of FY2012)
UseBy facility
Plant (location) Pumping station (location) Total
Park/plaza 116 30 146
Sports facility 104 15 119
Parking lot 23 4 27
Building 15 17 32
Evacuation zone 12 1 13
Other uses 23 9 32
Total 293 76 369
(As of end of FY2012)
Sludge treatment process No. of plants Sludge treatment process No. of plants
Thickening+Chemical conditioning+Mechanical dewatering 846 Thickening+Chemical conditioning+Dewatering truck 41
Chemical conditioning+Mechanical dewatering 314 Mechanical dewatering 25
Thickening 188 Thickening+Digestion+Chemical
conditioning+Mechanical dewatering+Incineration
22
Thickening+Digestion+Chemical conditioning+Mechanical
dewatering
187
Thickening+Chemical conditioning+Mechanical
dewatering+Incineration
76 Others 220
Thickening+Dewatering truck 57 Total 1,976
(As of end of FY2012 Units: km)
Year (FY)
Category
0-600 mm 600-2,000 mm 2,000+ mm Total
% % % %
2003318,440 85.7 44,752 12.0 8,380 2.3 371,572 100.0
2004329,611 85.9 45,821 11.9 8,401 2.2 383,833 100.0
2005342,729 86.3 46,228 11.6 8,268 2.1 397,225 100.0
2006351,047 86.1 48,506 11.9 8,231 2.0 407,784 100.0
2007360,263 86.3 48,650 11.7 8,304 2.0 417,217 100.0
2008368,224 86.5 49,314 11.6 8,333 1.9 425,897 100.0
2009376,990 86.8 48,932 11.3 8,383 1.9 434,305 100.0
2010385,096 86.9 49,231 11.1 8,625 1.9 442,952 100.0
2011389,268 87.0 49,332 11.0 8,734 2.0 447,334 100.0
2012395,287 87.1 49,803 11.0 8,835 1.9 453,925 100.0
-20-

4. Wastewater Works Data
4.6 Number of stormwater storage facilities by category and by storage volume
4.7 Annual volume of treated wastewater
4.8 State of recycling/reclamation of treated water
(As of end of FY2012)
Storage volume (m3)
Category
Peak flow detention Combined sewer overflow
storage
Both together Total
0-1,000 155 2 - 157
1,000-5,000 331 22 3 356
5,000-10,000 151 14 7 172
10,000-50,000 194 46 16 256
50,000-100,000 29 4 3 36
100,000+ 22 2 1 25
Total 882 90 30 1,002
(As of end of FY2012 Units: 1,000s m3)
Final effluent typetotal
%
Primary treatment 474,207 3.3
Secondary treatment 10,228,463 70.7
Advanced treatment 3,752,440 26.0
Total 14,455,110 100.0
(As of end of FY2012)
Recycling/reclamation No. of plants
Volume of recycled water
(10,000s m3/year)
(%)
1. Water for flush toilets 61 776 3.7
2. Water for environmental use 1) Landscape remodeling 110 4,749 22.6
2) Recreational use 23 524 2.5
3) River maintenance 11 6,163 29.3
3. Water for snow melting 35 5,265 25.1
4. Water for trees/plants 86 26 0.1
5. Water for cleaning of roads, streets, and construction sites 90 11 0.1
6. Water for agricultural use 27 1,164 5.5
7. Water for industrial water supply 3 249 1.2
8. Water for direct supply to businesses and factories 57 2,088 9.9
Total 301 21,015 100.0
-21-

4. Wastewater Works Data
4.9 Volume of sludge by method of final disposal
4.10 Volume of reused sludge by application
Project category Condition
Volume of sludge at final disposal
Direct final disposal Handover
Landfill reuse To other gov. dept./facility To private sector
Total
Raw sludge (m3) 10 - 10 - -
Thickened sludge (m3) 45,066 - - 38,161 6,905
Digested sludge (m3) - - - - -
Subtotal (m3)(% composition) 45,076
(100.0)
-
(0.0)
10
(0.0)
38,161
(84.7)
6,905
(15.3)
Dewatered sludge (t) 2,073,549 - 18,438 117,478 1,937,633
Mobile dewatering truck
sludge (t)
8,750 - - 1,243 7,507
Mechanically dried sludge (t) 60,340 - 13,704 22,479 24,157
Sun-dried sludge (t) 845 - 150 131 564
Carbonized sludge (t) 1,406 - 200 3 1,203
Incinerated sludge (t) 157,535 283 220 65,136 91,896
Molten slag (t) 11,282 - 926 147 10,209
Compost (t) 31,208 - 19,003 3,450 8,755
Total (t)
(% composition)
2,344,915
(100.0)
283
(0.0)
52,641
(2.2)
210,067
(9.0)
2,081,924
(88.8)
(As of end of FY2012)
Application Quantity (m3) Quantity (t) No. of plants Application Quantity (m
3) Quantity (t) No. of plants
Fertilizer 33,020 763,561 1,138 Testing 0 2,264 15
Cement ingredient 3,148 848,117 708 Artificial soil (including
slope spraying materials)
0 11,110 14
Soil improvement 1,487 73,968 99 Concrete aggregate 0 16,638 11
Construction materials,
etc.
394 60,234 71 Asphalt filler 0 10,939 10
Roadbed material 756 71,046 62 Concrete precast
products
0 2,778 10
Solid fuel 170 58,525 38 Interlocking blocks 40 17,459 6
Backfill material 111 24,470 27 Burned bricks 0 320 2
Soil conditioner 0 10,820 24 Other 31,427 489,032 632
Lightweight aggregate 0 18,152 16 Total 70,553 2,479,433 2,883
-22-
Uchikanda suisui bldg.2-10-12 Uchikanda,Chiyodaku,Tokyo101-0047 JAPAN
TEL:81-3-6206-8746 FAX:03-6206-0796
http://www.jswa.jp/