management of tuberculosis training for health facility...
TRANSCRIPT

H. Monitor TB Case Detection and Treatment
Management of Tuberculosis Training for Health Facility StaffSECOND EDITION


Management of Tuberculosis
Training for Health Facility Staff Second Edition
MONITOR TB CASE DETECTION AND TREATMENT
H

WHO Library Cataloguing-in-Publication Data Management of tuberculosis: training for health facility staff -- 2nd ed.
Contents: Modules: A: Introduction - B: Detect Cases of TB - C: Treat TB Patients - D: Inform Patients about TB - E: Identify and Supervise Community TB Treatment Supporters - F: Manage Drugs and Supplies for TB - G: Ensure Continuation of TB Treatment - H: Monitor TB Case Detection and Treatment - I: TB Infection Control in your Health Facility - J: Field Exercise – Observe TB Management - K: Management of Tuberculosis – Reference Booklet - L: Facilitator Guide - M: Answer Sheets. 1.Tuberculosis, Pulmonary - therapy 2.Health personnel - education 3.Health facilities 4.Teaching materials I.World Health Organization.
ISBN 978 92 4 159873 6 (NLM classification: WF 210)
© World Health Organization 2010
All rights reserved. Publications of the World Health Organization can be obtained from WHO Press, World Health Organization, 20 Avenue Appia, 1211 Geneva 27, Switzerland (tel.: +41 22 791 3264; fax: +41 22 791 4857; e-mail: [email protected]). Requests for permission to reproduce or translate WHO publications – whether for sale or for noncommercial distribution – should be addressed to WHO Press, at the above address (fax: +41 22 791 4806; e-mail: [email protected]).
The designations employed and the presentation of the material in this publication do not imply the expression of any opinion whatsoever on the part of the World Health Organization concerning the legal status of any country, territory, city or area or of its authorities, or concerning the delimitation of its frontiers or boundaries. Dotted lines on maps represent approximate border lines for which there may not yet be full agreement. The mention of specific companies or of certain manufacturers’ products does not imply that they are endorsed or recommended by the World Health Organization in preference to others of a similar nature that are not mentioned. Errors and omissions excepted, the names of proprietary products are distinguished by initial capital letters. All reasonable precautions have been taken by the World Health Organization to verify the information contained in this publication. However, the published material is being distributed without warranty of any kind, either expressed or implied. The responsibility for the interpretation and use of the material lies with the reader. In no event shall the World Health Organization be liable for damages arising from its use. WHO/HTM/TB/2009.423h

Monitor TB Case Detection and Treatment
Contents
Page Introduction..........................................................................................................................1 Objectives of this module ....................................................................................................1 Overview of monitoring.......................................................................................................2 1. Collect and compile data on TB case detection ..............................................................5
Worksheet 1: Data on TB case detection ....................................................................7 2. Collect and compile data on HIV testing and status of TB patients ...............................8
Worksheet 2: Data on HIV testing and status of TB patients .....................................9 3. Collect and compile data on TB treatment ...................................................................10 Worksheet 3: Data on TB treatment .........................................................................12 4. Calculate indicators.......................................................................................................14
Summary Worksheet A: Indicators to monitor TB case detection and HIV testing ................................................................................................................15 Summary Worksheet B: Indicators to monitor TB treatment....................................16
5. Analyse indicators.........................................................................................................17 6. Solve problems..............................................................................................................21 Summary of important points ............................................................................................25 Self-assessment questions..................................................................................................27 Answers to self-assessment questions ...............................................................................30 Exercises ............................................................................................................................33
Optional Exercise A...............................................................................................35 Exercise B ..............................................................................................................45 Exercise C ..............................................................................................................57 Exercise D..............................................................................................................71

Exercise E ..............................................................................................................79 Exercise F...............................................................................................................83 Exercise G..............................................................................................................87

Acknowledgements Management of Tuberculosis: Training for Health Facility Staff, 2nd ed. This second edition of training modules was prepared by the Stop TB Department of the World Health Organization (Geneva, Switzerland) and Patricia Whitesell Shirey of ACT International (Atlanta, GA, USA). The project was coordinated by Karin Bergstrom. Fabio Luelmo and Malgorzata Grzemska were the main technical advisers. The modules were edited by Karen Ciceri. Natacha Barras provided administrative support and coordinated the layout and printing of the modules. The following organizations contributed to the development of the modules through the Tuberculosis Control Assistance Program (TB-CAP): the American Thoracic Society (ATS), Management Sciences for Health (MSH), the United States Centers for Disease Control and Prevention (CDC), and the KNCV Tuberculosis Foundation. The original versions of the training modules (published by the World Health Organization in 2003) were field-tested in Malawi through the support of the National Tuberculosis Control Programme of Malawi. This updated version was tested through the support of the Division of Tuberculosis Elimination of the United States Centers for Disease Control and Prevention. The United States Agency for International Development financially supported the development of these training modules through its Grant to the World Health Organization and through the sub-agreement to WHO of the Cooperative Agreement with the KNCV Tuberculosis Foundation for the Tuberculosis Control Assistance Program (TB-CAP).


1
Monitor TB Case Detection and Treatment
Introduction To monitor is to “watch closely.” In your health facility, you may already monitor health-care activities such as immunizations or antenatal visits. You will also want to monitor the success of TB case detection and treatment activities. Such monitoring involves:
– keeping good records at your health facility, – reviewing your health facility’s records regularly, – compiling data, and – analysing key indicators1 related to TB case detection and treatment. This module focuses on how a health facility should monitor some of its own activities. This monitoring will reveal the health facility’s successes and any problems that need to be solved. The results of this self-monitoring are for the health facility’s own use. When problems are identified, the health facility should investigate the causes and take action to solve the problems. This module does not describe additional monitoring done by the District TB Coordinator as part of monitoring the entire district. Monitoring by the District TB Coordinator will require some of the same data collected for the health facility’s use. At the district level, since there are larger numbers of cases, more indicators may be analysed than at the health facility level.
Objectives of this module All objectives relate to data collection, compilation and analysis at the health facility level.
Participants will learn: Refer to section:
Key indicators related to TB case detection and how to compile data to monitor them 1
Key indicators related to HIV testing and status of TB patients and how to compile data to monitor them 2
Key indicators related to TB treatment and how to compile data to monitor them 3
• How to calculate indicators 4
• How to analyse indicators 5
• How to plan appropriate actions to solve problems 6 If you need to look up an unfamiliar word, refer to the glossary at the end of module A: Introduction.
1 An indicator is a measurable number, proportion, percentage or rate that suggests the extent of achievement of a programme, or the level of some condition in the population.

2
Overview of monitoring Before learning the detailed steps of monitoring, it will be helpful to have an overview of the purpose of monitoring and the indicators to be measured. Turn to the Summary Worksheets A: Indicators to monitor TB case detection and HIV testing and B: Indicators to monitor TB treatment on pages 15 and 16. The worksheets summarize the indicators related to TB that a health facility should monitor. The top part of Summary Worksheet A shows three indicators related to TB case detection. These indicators should be measured soon after the end of each quarter:
Proportion of outpatients aged 15 years and older who were identified as TB suspects Proportion of TB suspects whose sputum was examined Proportion of TB suspects tested who were sputum smear-positive.2
The bottom part of Summary Worksheet A shows three indicators related to HIV testing and HIV status of TB patients. These indicators should also be measured soon after the end of each quarter:
Proportion of all TB patients who were tested for HIV before or during TB treatment
Proportion of all HIV-tested TB patients with HIV-positive results Proportion of all HIV-positive TB patients who are on CPT (co-trimoxazole
preventive therapy). Summary Worksheet B shows indicators related to TB treatment at the health facility:
Proportion of new sputum smear-positive TB cases that converted (had negative sputum smears) at 2 or 3 months (also called the “conversion rate”)
This indicator is measured for the patients who began treatment in the quarter that ended 3 months ago, so that enough time has passed for conversion to occur.
Proportion of new sputum smear-positive cases that:
– were cured – completed treatment – defaulted – were treatment failures – that died – that transferred out
These treatment outcome indicators are measured for TB patients who began treatment in the quarter that ended 12 months ago, so that enough time has passed for treatment to be completed, patients to be cured or another outcome to be determined.
2 In this module, the word microscopy is often omitted for ease of reading, but the assumption is that the data refer to suspects whose sputum was examined by sputum smear microscopy. Sputum smear-positive cases are sputum smear microscopy-positive.
treatment outcome indicators

3
All of the indicators on the Summary Worksheets can be calculated from data compiled from the health facility’s outpatient records, the Register of TB Suspects and TB Treatment Cards. In section 1 of this module, you will learn to compile data using Worksheet 1: Data on TB case detection. In section 2, you will learn to compile data using Worksheet 2: Data on HIV testing and HIV status of TB patients. In section 3, you will learn to compile data using Worksheet 3: Data on TB treatment.3 The results of Worksheets 1, 2 and 3 will be the numerators and denominators listed in the column of Summary Worksheets A and B titled “How to calculate.” You will learn how to calculate the indicators in section 4 of the module. Worksheets 1, 2 and 3 and Summary Worksheets A and B present generic steps in compiling data and calculating indicators. The worksheets are tools for learning in this course, not required programme forms. You may not need these worksheets later when you are used to calculating the indicators. When calculated and compared over time, the indicators will help you to answer questions such as: • Are we detecting the number of sputum smear-positive cases expected at our health
facility? If not, why not? – Are we identifying the expected number of TB suspects? – Are all TB suspects having sputum examination? If the number of TB suspects is lower than expected, it is important to find out why. Are all adult patients being asked about cough? Are many adult patients using another facility? If TB suspects are not being tested, it is also important to find out why.
• Are we testing all TB patients for HIV?
If not, health workers are not successfully implementing the recommendation. It is important to investigate why.
• What proportion of TB patients are HIV-positive?
If the proportion of HIV-positive TB patients is significant or increasing, this shows the risk of TB patients dying during TB treatment will be high and that HIV testing, CPT and ART should be given priority.
• What proportion of new sputum smear-positive cases convert (have negative sputum smears) at 2 or 3 months?
If all cases are treated correctly, this proportion should be over 80%. If the health facility has a lower result, it is important to investigate why. Is the correct drug regimen being chosen for patients? Is treatment being directly observed? Are patients taking their drugs regularly (daily or 3 times per week)? Are patients defaulting before the second month follow-up sputum examination?
3 Patients with multidrug-resistant TB, or MDR-TB, have a separate recording system and definitions for registration and treatment outcomes.

4
• Of new sputum smear-positive cases, how many:
– are cured? – complete treatment? – default? – are treatment failures? – died? – transferred out?
The health facility should see an increase in the number cured and completing treatment, and a decrease in the number defaulting.
If there are many defaults, it is important to ask why. Could directly-observed treatment be made more convenient? Should community TB treatment supporters be used more effectively? Have the treatment outcomes for transferred patients been accounted for?
If there are many treatment failures, patients may not be taking the drugs, the drugs may be of poor quality, or there is a high proportion of drug-resistant (MDR-TB) cases.
If there are many deaths, patients may be arriving to diagnosis too late, or there may be a high proportion of HIV-infected patients not receiving appropriate CPT or ART.
Each of these reasons can be explored, the corrective measure implemented and the indicator monitored to see if the measure was effective.
Notice that monitoring is the first step towards identifying and solving problems. However, more investigation may be needed to find the causes of problems before they can be solved.
Explanation of Summary Worksheets
Tell a facilitator when you reach this point in the module. There will be an explanation of Summary Worksheets A and B that will provide a framework for the rest of the module.
Optional Exercise A – Written Exercise
The Register of TB Suspects is an important source of data for monitoring. This exercise provides practice in completing the Register of TB Suspects. If you have just completed module B: Detect Cases of TB as part of a comprehensive course, omit this exercise.
If you have not recently completed module B: Detect Cases of TB, then this exercise is necessary. Turn to page 35 and follow the instructions for Exercise A.
STOP

5
1. Collect and compile data on TB case detection On Summary Worksheet A (page 15), you have seen the following key indicators for monitoring TB case detection in the health facility. Soon after the end of each quarter, these indicators should be measured for the previous quarter:
Proportion of outpatients aged 15 years and older who were identified as TB suspects Proportion of TB suspects whose sputum was examined (by sputum smear
microscopy) Proportion of TB suspects tested who were sputum smear-positive.
The following data from the previous quarter are needed to measure these indicators:
– Total outpatients aged 15 years and older – Number of TB suspects identified (aged 15 years and older) – Number of suspects whose sputum was examined – Number of sputum smear-positive cases detected.
To determine the total outpatients aged 15 years and older, count from the health facility’s Outpatient Register or other relevant health facility records or tally sheets. The rest of the totals can be compiled from the Register of TB Suspects described in module B: Detect Cases of TB. It is important to maintain the Register of TB Suspects completely and carefully in order to collect the necessary data to calculate indicators, and thereby identify successes and problems. You need not wait until the end of the quarter to notice problems that can affect the health facility’s indicators. One common problem, easily apparent in the Register of TB Suspects, is failure of the laboratory to return a patient’s test results.
Regularly look at the Register of TB Suspects and ask:
Have results been received from the laboratory for all sputum samples sent?
If the laboratory fails to return results, contact the laboratory, ask for the missing results and find out why they were not sent. Make sure that the laboratory knows that the health facility wants these reports and uses them. Another common problem is the failure of smear-positive cases to return for their test results and to begin treatment. This problem can also be identified by reviewing the Register of TB Suspects.
Regularly look at the Register of TB Suspects and ask:
Has a treatment card been opened for all sputum smear-positive cases?

6
Household visits may be needed to find sputum smear-positive cases who have not begun treatment. It is critical to contact these patients, inform them about TB and begin treatment. At the end of a quarter, the first step in monitoring is to compile or summarize the data recorded in the Register of TB Suspects. Worksheets 1 and 2, shown on pages 7 and 9 (and in the Reference Booklet) will guide you through the steps. By reading and following the instructions, step by step, you will compile the data on TB case detection and on HIV testing and status of TB patients. The resulting numbers are then used to calculate the indicators on Summary Worksheet A. Worksheets 1 and 2 and Summary Worksheet A are not required TB forms, but are simply learning tools for use in this course. Note: The case detection indicators calculated in this module are intended to reflect the efforts of the health facility and are thus limited to suspects identified at the health facility and cases detected by sputum smear microscopy examination. Other cases may be diagnosed by clinicians.
Worksheet 1: Data on case
detection
and
Worksheet 2: Data on HIV testing
of TB cases
Summary Worksheet A
are compiled by following steps on these worksheets…
and then used to calculate TB case detection indicators and HIV testing indicators on this worksheet.
TB Treatment Card
TB Treatment Card
TB Treatment Card
and these cards…
Outpatient Register
Data from this register…
Register of TB Suspects
Data from this register…

7
Worksheet 1: Data on TB case detection
Case detection in the previous quarter (the quarter that just ended) Soon after the end of a quarter, use this worksheet to compile data on TB case detection at the health facility during that quarter. Use the results of this worksheet to calculate indicators related to TB case detection. See Summary Worksheet A: Indicators to monitor TB case detection and HIV testing. Circle the previous quarter: 1 2 3 4 of year: __________ Record the dates included in the previous quarter: 1 April – 30 June 2009
Write answers in the blanks to the left of each step: 1a. 2 800 Determine the total number of outpatients aged 15 years and older seen
for any reason during the quarter. To do this, use whatever health facility records are available.
1b. 125 Determine the number of TB suspects aged 15 years and older identified during the quarter. To do this, mark the beginning and ending dates for the quarter in the Register of TB Suspects. Then count the entries for suspects aged 15 years and older.*
1c. 118 Determine the number of these TB suspects whose sputum was examined.4 Do this by counting the number of entries in the column headed “Date sputum sent to laboratory.”
1d. 13 Count the number of these TB suspects who had one or more smear-positive results. Do this by looking in the columns headed “Results of sputum examinations.”
* Be careful not to count any entries for children aged under 15 years. If there were any TB suspects aged under 15 years during the quarter, lightly cross through the entire row for these younger TB suspects so that you do not count them in this step.
4 By sputum smear microscopy.
Example for Malini Health Centre
2009
8
Now do Exercise B – Written Exercise
When you have reached this point in the module, you are ready to do Exercise B. Turn to page 45 and follow the instructions for Exercise B. Do this exercise by yourself. Then discuss your answers with a facilitator.
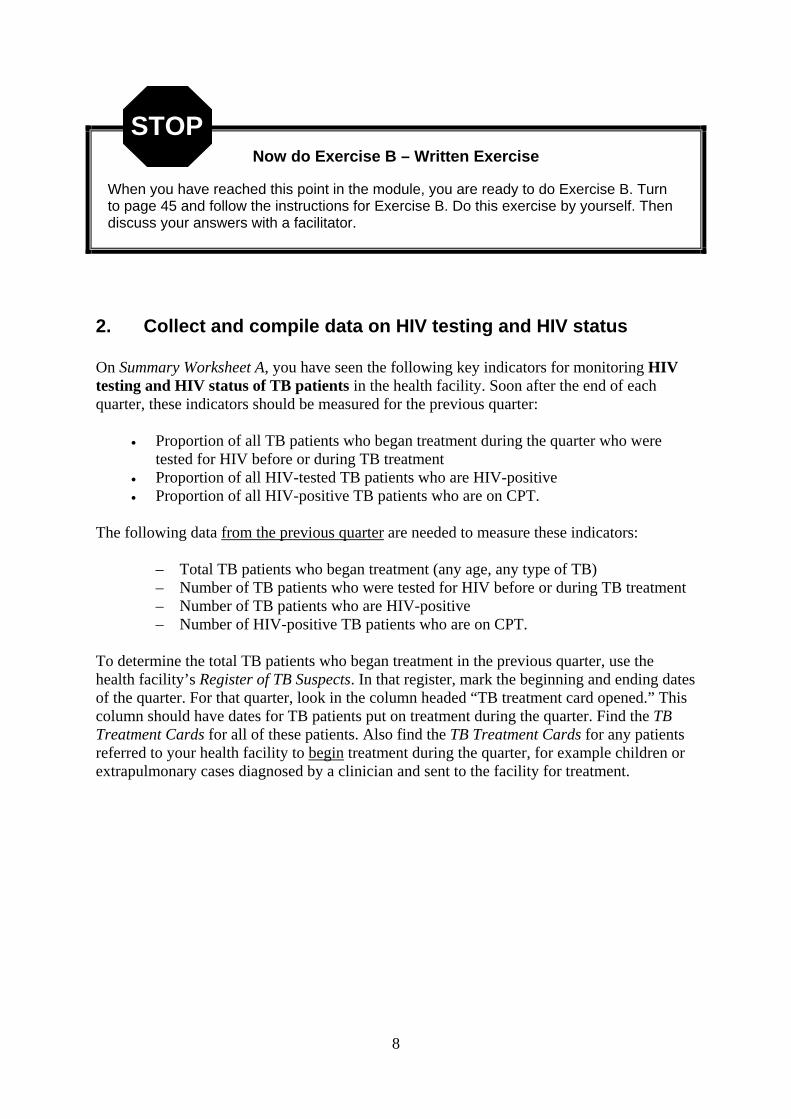
2. Collect and compile data on HIV testing and HIV status On Summary Worksheet A, you have seen the following key indicators for monitoring HIV testing and HIV status of TB patients in the health facility. Soon after the end of each quarter, these indicators should be measured for the previous quarter:
Proportion of all TB patients who began treatment during the quarter who were tested for HIV before or during TB treatment
Proportion of all HIV-tested TB patients who are HIV-positive Proportion of all HIV-positive TB patients who are on CPT.
The following data from the previous quarter are needed to measure these indicators:
– Total TB patients who began treatment (any age, any type of TB) – Number of TB patients who were tested for HIV before or during TB treatment – Number of TB patients who are HIV-positive – Number of HIV-positive TB patients who are on CPT.
To determine the total TB patients who began treatment in the previous quarter, use the health facility’s Register of TB Suspects. In that register, mark the beginning and ending dates of the quarter. For that quarter, look in the column headed “TB treatment card opened.” This column should have dates for TB patients put on treatment during the quarter. Find the TB Treatment Cards for all of these patients. Also find the TB Treatment Cards for any patients referred to your health facility to begin treatment during the quarter, for example children or extrapulmonary cases diagnosed by a clinician and sent to the facility for treatment.
STOP

9
Worksheet 2: Data on HIV testing
HIV testing in the previous quarter (the quarter that just ended) Soon after the end of a quarter, use this worksheet to compile data on HIV testing and HIV status of TB patients who began treatment at the health facility during the previous quarter. Use the results of this worksheet to calculate indicators related to HIV testing and HIV status. See Summary Worksheet A: Indicators to monitor TB case detection and HIV testing. Circle the previous quarter: 1 2 3 4 of year: __________ Record the dates included in the previous quarter: 1 April – 30 June 2009
Write answers in the blanks to the left of each step: 2a. Determine the total number of TB patients (any age, any type of TB) who began
treatment in the previous quarter.
In the Register of TB Suspects, mark the beginning and ending dates of the quarter. For that quarter, look in the column headed “TB treatment card opened.” This column should have dates for most TB patients who began treatment during the quarter. Find the TB Treatment Cards for all of these patients. (Remember to omit any patient whose TB Treatment Card was opened after the quarter ended.) Also look back in the Register of TB Suspects for suspects identified shortly before the quarter began but who began treatment during the quarter. Find the TB Treatment Cards for all of these patients.
Also find the TB Treatment Cards for any patients referred to your health facility to begin treatment during the quarter.
2b. 16 Look at the TB Treatment Cards found in step 2a. Count the cards remaining. This
is the number of TB patients who began treatment in the quarter. 2c. 12 On these TB Treatment Cards, look at the box “TB/HIV” to see whether each TB
patient was tested for HIV. Count the patients who have an HIV test date and result recorded. This is the number of TB patients who were HIV-tested before or during TB treatment.
2d. 1 On these same cards, look at the box “TB/HIV” and count the patients
who had a positive HIV test result. This is the number of HIV-positive TB patients.
2e. 1 Determine the number of HIV-positive TB patients on CPT. On these
same cards (all HIV-positive TB patients), look at the box “TB/HIV” and count the patients who have a date recorded for CPT start. This is the number of HIV-positive TB patients on CPT.
Example for Malini Health Centre
2009

10
Now do Exercise C – Written Exercise
When you have reached this point in the module, you are ready to do Exercise C. Turn to page 57 and follow the instructions for Exercise C. Do this exercise by yourself. Then discuss your answers with a facilitator.
3. Collect and compile data on TB treatment On the Summary Worksheet B (page 16), you have seen the following key indicators for monitoring TB treatment: • Proportion of new sputum smear-positive TB cases that converted (had negative smears)
at 2 or 3 months (also called the “conversion rate”)
• Proportion of new smear-positive cases that: – were cured – completed treatment – defaulted – were treatment failures – died – transferred out
The above indicators cannot be measured immediately after the end of a quarter. It is necessary to wait 3 months to measure the conversion rate. Since TB treatment takes 6–8 months, it is necessary to wait about 9 months to know the treatment outcome for a TB patient. To allow plenty of time for all TB patients to achieve outcomes, this module suggests waiting 1 year from the end of a quarter to measure the treatment outcome indicators for TB patients who began treatment in that quarter. Thus, at the end of a given quarter, you will review not only data on TB patients who began treatment during that quarter (as taught in sections 1 and 2 and on Worksheets 1 and 2), but also data on TB patients who began treatment during the quarter that ended 3 months ago and those who began treatment during the quarter that ended 1 year ago: • For the quarter that ended 3 months ago, to measure the conversion rate:
– Number of new sputum smear-positive (aged 15 years and older) cases put on treatment
– Number of these cases that converted at 2 or 3 months. • For the quarter ending 1 year ago, to measure treatment outcome indicators:
– Number of new smear-positive cases (aged 15 years and older) put on treatment – Number of these cases cured – Number of these cases that completed treatment – Number of these cases that defaulted – Number of these cases that were treatment failures
treatment outcome indicators
STOP

11
– Number of these cases that died – Number of these cases that transferred out.
All of these totals can be compiled from the health facility’s Register of TB Suspects and TB Treatment Cards. Maintain these records completely and carefully. File TB Treatment Cards in order by patient name or case number, so that they can easily be found and reviewed. Worksheet 3 (page 12) describes the steps in compiling the data on conversion and TB treatment outcomes. The results are then used to complete the Summary Worksheet B (page 16). Like Worksheets 1 and 2, Worksheet 3 is a learning tool, not a required TB form. The following time line summarizes the data compiled at a given point in time to measure indicators. In this example, the second quarter of 2009 has just ended. It is now time to compile and analyse data on case detection, HIV testing, conversion and treatment outcomes for the different quarters shown. 2008 quarters: 2009 quarters:
1 2 3 4 1 2 3 4 1
Time of compilation and analysis
Case detection,Worksheet 1;
HIV testing, Worksheet 2
Sputum conversion, Worksheet 3, Part A
Treatment outcomes, Worksheet 3, Part B
Register of TB Suspects
Worksheet 3: Data
on TB treatment
Summary Worksheet B Data from this register…
are compiled by following steps on this worksheet…
and then used to calculate TB treatment indicators on this worksheet. TB Treatment Card
TB Treatment Card
TB Treatment Card
and these cards…
Example

12
Worksheet 3: Data on TB treatment
Use this worksheet to compile data on TB treatment. Use the results to complete Summary Worksheet B: Indicators to monitor TB treatment.
Part A – Conversion (for the quarter that ended 3 months ago) Circle the quarter that ended 3 months ago: 1 2 3 4 of year: ________
Record the dates in that quarter: 1 January – 31 March 2009 Find the number of new, sputum smear-positive cases put on treatment in the quarter. Then find the number of these cases that converted at 2 or 3 months. To do this, complete steps 3a–3e below. Write answers in the blanks for 3d and 3e. 3a. In the Register of TB Suspects, mark the beginning and ending dates of the quarter. For
that quarter, look in the column headed “TB treatment card opened?” This column should have dates for most TB patients put on treatment during the quarter. Find the TB Treatment Cards for all of these patients. Also find the TB Treatment Cards for any patients referred to your health facility to begin treatment during the quarter. (Omit any children aged under 15 years.)
3b. Look at the TB Treatment Cards found in step 3a. Put the cards for any extrapulmonary or
sputum smear-negative cases back into the files. 3c. On each TB Treatment Card remaining in your hand, look in the section titled “Type
of Patient” to see whether the case was new. If new, keep the card out. If not new (anything else ticked), put the card back in the files.
3d. 7 Count the cards remaining in your hand. This is the number of new,
sputum smear-positive cases put on treatment in the quarter. Important: Mark or tag these cards so that you can easily find them later (to determine treatment outcomes 12 months after starting treatment).
3e. 5 On these same cards, look at the “Results of sputum examination”
in the row for month 2 or 3. Count the cases who had a negative result for month 2 or 3. This is the number of new smear-positive cases that converted at 2 or 3 months.
Part B – Treatment outcomes (for the quarter that ended 12 months ago) Circle the quarter that ended 12 months ago: 1 2 3 4 of year: ________
Record the dates in that quarter: 1 April – 30 June 2008 3f. 6 Determine the number of new smear-positive cases put on treatment during the
quarter that ended 12 months ago. To do this, find the TB Treatment Cards for these cases. (The cards should have been tagged or marked.) Count the cards. How many cards are there?
Determine the number of these cases with each outcome. To do this, look at treatment outcomes recorded on the back of the TB Treatment Cards. Count the number of cases with each outcome: 3g. 2 Cure 3h. 3 Treatment completed 3i. 1 Default
3j. 0 Treatment failure 3k. 0 Died 3l. 0 Transfer out
Example for Malini Health Centre
2009
2008

13
Explanation of time line
Tell a facilitator when you have reached this point in the module. There will be an explanation of the time line for compiling data and analysing indicators.
Now do Exercise D – Written Exercise
When you have reached this point in the module, you are ready to do Exercise D. Turn to page 71 and follow the instructions for Exercise D. Do this exercise by yourself. Then discuss your answers with a facilitator.
STOP

14
4. Calculate indicators Formulae for all of the indicators are on Summary Worksheets A and B (pages 15 and 16). In each formula, a numerator (top number) is divided by a denominator (bottom number) to obtain a proportion. The column headed “How to Calculate” describes the numerator and denominator. Step numbers from Worksheets 1, 2 and 3 are given in parentheses to show where to find the numerator and denominator.
If you use a calculator to calculate a proportion, the result is usually expressed as a decimal fraction, for example, 0.94. You may wish to express the proportion as a percentage. To do this, multiply by 100 (move the decimal point two places to the right). Thus, the decimal fraction 0.94 can be expressed as 94%. Numerator = Proportion Proportion 100 = percentage Denominator
The first indicator, the proportion of outpatients aged 15 and older in the previous quarter who were identified as TB suspects, is calculated as follows: Number TB suspects identified = 125 = 0.04 0.04 100 = 4%
Total outpatients 2 800 aged 15 years and older
The Summary Worksheets show how to calculate the indicators. These worksheets should be completed soon after the end of every quarter; however, at that time you are looking back at health centre activities related to four different groups of people:
• TB suspects (aged 15 years and older) identified and tested in the previous quarter (that is, the quarter that just ended)
• TB patients (any age, any type of TB) who began treatment in the previous quarter • New smear-positive TB cases (aged 15 years and older) who began treatment in the
quarter that ended 3 months ago • New smear-positive TB cases (aged 15 years and older) who began treatment in the
quarter that ended 12 months ago.
Example

15
Summary Worksheet A: Indicators to monitor TB case detection and HIV testing
To monitor: Measure these indicators: Record
time frame:a
How to calculate
(numerator / denominator)b
Calculate and record result here:
Proportion of outpatients aged 15 years and older who were identified as TB suspects
Number TB suspects identified (1b)
Total outpatients aged 15 years and older (1a)
= 125
2 800 0.04 = 4%
Proportion of TB suspects whose sputum was examined for TB
Number TB suspects whose sputum was examined (1c)
Number TB suspects identified (1b)
= 118
125 0.94 = 94%
TB case detection
(using data from Register of TB Suspects, compiled on Worksheet 1)
Proportion of TB suspects tested who were sputum smear-positive
Number smear-positive cases detected (1d)
Number TB suspects whose sputum was examined (1c)
= 13
118 0.11 = 11%
Proportion of all TB patients who were tested for HIV before or during TB treatment
Number of TB patients tested for HIV (2c)
Number of TB patients (2b)
= 12
16 0.75 = 75%
Proportion of all HIV-tested TB patients who are HIV-positive
Number of HIV-positive TB patients (2d)
Number of HIV-tested TB patients (2c)
= 2
12 0.08 = 8%
HIV testing and HIV status
(Using data from TB Treatment Cards, compiled on Worksheet 2)
Proportion of all HIV-positive TB patients who are on CPT
previous quarter:
2nd
quarter, 2008
Number of HIV-positive TB patients on CPT (2e)
Number of HIV-positive TB patients (2d)
= 1
1 1.0 = 100%
a The time frame applies to the denominator. The persons in the numerator are part of this group.
b Numbers in parentheses tell where to find the numerator and denominator on Worksheet 1, 2 or 3.
Example for Malini Health Centre

16
Summary Worksheet B: Indicators to monitor TB treatment
Conversion rate:
Proportion of new sputum smear-positive TB cases that converted at 2 or 3 months
quarter that ended 3
months ago:
1st quarter, 2008
Number new smear-positive cases that converted at 2 or 3 months (3e)
Number new smear-positive cases put on treatment (3d)
= 5
7 0.71 = 71%
Treatment outcomes: Proportion of new sputum smear-positive cases that:
– were cured
Number new smear-positive cases cured (3g)
Number new smear-positive cases put on treatment (3f)
= 2
6 0.33 = 33%
– completed treatment Number new smear-positive cases that completed treatment (3h)
Number new smear-positive cases put on treatment (3f)
= 3
6 0.50 = 50%
– defaulted Number new smear-positive cases that defaulted (3i)
Number new smear-positive cases put on treatment (3f)
= 1
6 0.16 = 16%
– were a treatment failure Number new smear-positive cases that failed treatment (3j)
Number new smear-positive cases put on treatment (3f)
= 0
6 0.0 = 0%
– died Number new smear-positive cases that died (3k)
Number new smear-positive cases put on treatment (3h)
= 0
6 0.0 = 0%
TB treatment
(using data from Register of TB Suspects and TB Treatment Cards, compiled on Worksheet 3)
– transferred out
quarter that ended 12
months ago:
2nd quarter, 2007
Number new smear-positive cases that transferred out (3l)
Number new smear-positive cases put on treatment (3f)
= 0
6 0.0 = 0%
a The time frame applies to the denominator. The persons in the numerator are part of this group. b Numbers in parentheses tell where to find the numerator and denominator on Worksheet 1, 2 or 3.
Example for Malini Health Centre

17
Now do Exercise E – Written Exercise
When you have reached this point in the module, you are ready to do Exercise E. Turn to page 81; fold out pages 83 and 85; and follow the instructions for Exercise E. Do this exercise by yourself. Then discuss your answers with a facilitator.
5. Analyse indicators It is not enough just to calculate indicators. You must also analyse them, that is, interpret what they mean. For some indicators, analysis may involve comparing the actual proportion achieved to the expected or desired proportion. For example, it is desired that 100% of TB suspects have their sputum tested. Any result less than 100% is less than desired. Analysis may also involve comparing results achieved from one quarter to the next. For example, if the proportion of TB suspects whose sputum was tested increases from 50% in one quarter to 85% in the next, the health facility has improved. However, the health facility should continue to try to reach 100%. To see the health facility’s improvement, it is helpful to keep a line graph of the following numbers from quarter to quarter:
– the number of TB suspects tested – the number of sputum smear-positive cases detected.
The graph may be kept on the wall of the health facility as a reminder of the importance of TB case detection. See the example of a graph on the next page. Indicators must also be considered in relation to each other. For example, you will want to look at the proportion of cases cured in relation to the proportion who completed treatment and the proportion who defaulted.
If the proportion cured is low, but the proportion who completed treatment is high, the reason may be that the final follow-up sputum examinations are not being done.
If the proportion who defaulted is high, this suggests other reasons for the low proportion cured.
A high proportion of deaths may be caused by TB severity (late diagnosis) or HIV.
A high proportion of failures may be caused by poor compliance with treatment, inadequate drugs, or high proportion of drug-resistant cases (MDR-TB).
The table on page 19 shows possible ways to analyse the indicators related to case detection, HIV testing and TB treatment. You may think of other comparisons and interpretations that could be made.
STOP

18
Graph of TB suspects tested and smear-positive cases detected at a health facility There are two lines drawn on the graph below: – The upper line shows numbers of TB suspects tested at a health facility over 5
consecutive quarters. On this line, a triangle () is used to show the number of TB suspects tested in a quarter.
– The lower line shows numbers of smear-positive cases detected in the same 5 quarters.
On this line, a cross (X) is used to show the number of smear-positive cases in a quarter. The dates of the quarters are written under the bottom axis. The vertical axis shows the number of TB suspects tested () or smear-positive cases (X).
The above example shows that, over five quarters, both the number of TB suspects tested and the number of smear-positive cases increased greatly. The number of TB suspects tested has more than doubled; the number of cases identified has doubled. For the first quarter of 2008, the graph shows that 90 TB suspects were tested. In that same quarter, 12 smear-positive cases were identified. This means that the proportion of TB suspects tested who were smear-positive was about 13% (12/90). In the table on the next page, you will see that the expected proportion for this indicator is 2–15%. So 13% is high but within the expected range. It is possible that this health facility is still finding mostly the obviously coughing TB suspects. This health facility should continue to increase efforts to ask all adult outpatients about cough in order to identify all TB suspects.
Example
Quarter: 1 2 3 4 1
2007 2008 = TB suspects tested
X = Smear-positive cases

19
Analysing indicators
Indicator Compare to: Possible interpretation, or investigation needed:
Proportion of outpatients aged 15 years and older who were TB suspects
Expected result:a
2–10%
If lower than 2%, it is likely that patients are not routinely being asked about cough.
If higher than 10%, consider whether patients with cough less than 2 weeks are being recorded.
Desired result:
100%
If less than 100%, find out why. Have suspects failed to produce sputum samples? Has the laboratory failed to return test results? Proportion of TB
suspects whose sputum was tested for TB
Results from previous quarters
If the proportion is less than previous quarters, find out what new problems are occurring.
If the proportion has increased, find out what made the difference.
Expected result:a
2–15%
If higher, check procedures used to identify TB suspects. It is possible that only people with severe respiratory symptoms have sputum samples sent for testing. Proportion of TB
suspects tested who were sputum smear-positive
Results from previous quarters
If the proportion varies greatly from one quarter to the next, check procedures used to identify TB suspects and send sputum samples. There may have been a change.
Over a longer period of time, an increase or decrease could indicate a change in the actual level of TB in the community.
Desired result in countries with high HIV prevalence:
100%
If less than 100%, find out why. Do health workers recommend HIV testing to all TB cases? Is this a TB programme policy? Do patients decline HIV testing? Is testing difficult for patients to access (distance, cost)? Are supplies and trained staff consistently available to do HIV testing?
Proportion of all TB patients who were tested for HIV before or during TB treatment
Results from previous quarters
If the proportion is less than previous quarters, find out whether new problems are occurring.
If the proportion has increased, find out what made the difference.
Proportion of all HIV-tested TB patients who are HIV-positive
Expected result:
About five times the HIV prevalence in the general population
There is no target, because the proportion depends on the HIV prevalence in the population. The indicator is useful to evaluate the workload (drugs, staff) and priority of TB/HIV co-treatment, and the expected impact of HIV on the TB treatment outcomes.
Desired result:
100%
If less than 100%, find out why. Do health workers recommend and give CPT to HIV-positive patients? Is co-trimoxazole consistently available? Proportion of all
HIV-positive TB patients who are on CPT
Results from previous quarters
If the proportion is less than previous quarters, find out what new problems are occurring.
If the proportion has increased, find out what made the difference.
(continued on next page)

20
Indicator Compare to: Possible interpretation, or investigation needed:
Desired result: more than 80%
(8 out of 10)
If patient compliance is high and treatment is consistently done correctly, more than 80% should convert. If the proportion is 80% or less, look for reasons such as follow-up sputum examinations not done, defaults, or transfers.
Proportion of new sputum smear-positive cases that converted at 2 or 3 months
(conversion rate)
Results from previous quarters
An increase in this proportion suggests that patient compliance and treatment are improving.
A decrease suggests problems. Look for problems related to monitoring, patient compliance and treatment.
Proportion of new sputum smear-positive cases that:
-- were cured
Results from previous quarters
An increase suggests that patient compliance and treatment are improving and/or that follow-up sputum examinations are being done to confirm cures. A decrease suggests problems in one or both of these areas. (See below.)
-- completed
treatment
For the same quarter, the proportion of cases with other outcomes
Added together, the proportion cured plus the proportion that completed treatment (called “treatment success”) should increase towards 100% and reach at least 85% with good case management.
Considered separately, the proportion that completed treatment should be much lower than the proportion cured. Otherwise, it is likely that the final follow-up sputum examinations are not being done to confirm cures.
-- defaulted Desired result:
less than 5% If greater than 5% default, investigate problems related to patient compliance, organization of services, etc.
– were a treatment failure
Results from previous quarters
An increase may suggest that patient compliance is declining or that the incidence/prevalence of MDR-TB is increasing.
– died Results from previous quarters
An increase may suggest that more TB cases are HIV-positive and are dying during treatment. An increase may indicate problems with delays in diagnosis or quality of care that should be investigated.
A decrease may suggest that TB cases are being diagnosed earlier and treated more effectively.
– transferred out Results from previous quarters
A high proportion of transfers usually indicates poor follow-up of patients that have moved to other facilities or districts, and lack of reclassification of the outcome based on the information received.
a Based on results from well-organized TB control programmes worldwide.
Now do Exercise F – Written Exercise
When you have reached this point in the module, you are ready to do Exercise F. Turn to page 87 and follow the instructions for Exercise F.
STOP
21
6. Solve problems The purpose of monitoring and calculating indicators is to recognize success and solve problems. The steps in problem solving are as follows: 6.1 Identify the problem 6.2 Investigate the causes of problems 6.3 Determine solutions 6.4 Implement solutions This section of the module will describe the problem-solving process in relation to TB case detection and treatment. 6.1 Identify the problem Based on analysis of indicators, you find some successes. On the other hand, you may discover some problems. For example, you may find that: • Health workers do not routinely ask outpatients whether they have cough, or • Of new smear-positive cases who began treatment in a quarter, 10% defaulted.
Both of these are problems, but the first example is more focused than the second. In the first example, it is clear that a certain task is not being done. In the second, it is not clear what problems have led to the high default rate; there could be many. Investigation is needed. Upon investigation, you may find that: • Patients have to wait in long queues at the health facility; they resent the waste of time
and thus stop coming for treatment. • Health workers behave in a rude and hurried way when TB patients come for treatment. • Community TB treatment supporters are sometimes not identified for patients who live
far from the health facility. The above problems are more focused. If solved, they will probably lead to a decrease in the proportion of cases defaulting. When a problem is identified, describe it in as much detail as possible. Try to determine when, where and with whom the problem occurs. 6.2 Investigate the causes of problems Find the causes of a problem before trying to solve it. Different causes require different solutions. Keep asking “why” until you find the root causes of a problem. Investigation of causes may involve observing and asking questions, visiting or talking with patients (including those who default) or reviewing records.

22
6.3 Determine solutions Solutions will depend on the causes of the problem. For example, if someone does not know how to do a task, a solution may be training. On the other hand, if the cause is a lack of equipment or supplies, a different solution is needed. Solutions should: • remove the cause of the problem (or reduce its effects) • be feasible (affordable, practical, realistic) • not create another problem. Following are two examples of the problem-solving process. Problem: Sputum smear examination results were recorded for only 75% of TB suspects identified in the previous quarter. Review of records showed that 32 out of 130 TB suspects (25%) did not have sputum samples tested. Some (17) did not provide the first sputum sample. Others (15) did not return the next day with the second sputum sample.
Possible cause: Possible solution:
Some TB suspects were unable to cough up the first sputum sample when requested, so they left the health facility.
In the future, tell TB suspects that, if they cannot produce sputum at the moment, they should try again at home in the morning and then bring the sputum sample in.
After producing the first sputum sample, some TB suspects were not told to return with another sputum sample the next day.
Clearly explain to TB suspects the need to return with a sputum sample. This should be the last instruction given.
Suspects were afraid of being diagnosed with TB, so they did not return.
Reassure TB suspects that TB can be cured. Tell them that it is important to be diagnosed in order to be cured and protect their families.
Suspects did not return with the second sputum sample because they could not take the time from home or work duties.
Ensure that suspects do not have to wait in line when they return. Tell them that they will not have to wait. If more samples are needed for diagnosis by a clinician, send a health worker to collect the samples, or have a family member bring them.
If suspects do not return with the second sputum sample, send the first sample to the laboratory anyway.
Teach health workers to submit a suspect’s first sputum sample to the laboratory if the sustpect does not return with the second sample within 3 days.
Example 1

23
On the surface, the following problem seems similar, but the details and the causes are very different. Thus, the solutions must also be different. By investigating the causes of a problem, one can avoid wasting time, effort and money on the wrong solutions. Problem: Sputum smear examination results were recorded for only 75% of TB suspects identified in the previous quarter. Review of records showed that test results for 32 out of 130 (25%) TB suspects were not available even though sputum samples were sent to the laboratory.
Possible cause: Possible solution:
The laboratory did not know where to send the results.
Provide an addressed return envelope with the “Request for Sputum Examination.”
The laboratory was too busy to send reports on a timely basis, or the results were lost.
Assign a health worker to deliver samples and also pick up reports at the laboratory.
Results were received from the laboratory but were never recorded in the Register of TB Suspects.
Make sure that someone is assigned to record the results and knows how to do so. If that person must be away, prepare another person to do this task.
6.4 Implement solutions Implementing a solution may be relatively simple (such as speaking with an individual health worker) or more complex (such as changing health facility procedures). Good communication with other health facility staff is important whenever any change is made.
To promote good communication when solving problems:
• Provide clear instructions whenever any change is made.
• Prepare and post “job-aids” such as checklists or instructions for any complex tasks.
Follow up to determine whether a solution is implemented as intended. Then continue monitoring to determine whether the problem is solved. Post and discuss results of monitoring so that health workers are aware of both successes and problems.
Example 2

24
Now do Exercise G – Group Discussion
Turn to page 91 to read the questions to be discussed. When everyone is ready, there will be a group discussion.
STOP

25
Summary of important points
Each health facility should monitor its TB case detection and treatment activities. Monitoring involves keeping good health facility records, reviewing records regularly, compiling data and analysing key indicators.
Regularly review the Register of TB Suspects and ask:
– Have results been received for all sputum samples sent? – Has a treatment card been opened for all sputum smear-positive cases?
If not, take action to find causes of the problems and solve them. Worksheets are provided in this module and in the Reference Booklet to help you compile
data and calculate indicators. After the end of each quarter, use the worksheets to compile data on health facility activities related to four different groups of people:
– TB suspects aged 15 years and older identified and tested in the previous quarter (i.e. the quarter that just ended)
– TB patients (any age, any type of TB) who began treatment in the previous quarter who were tested for HIV before or during TB treatment
– TB cases (sputum smear-positive, aged 15 years and older) who began treatment in the quarter that ended 3 months ago
– TB cases (sputum smear-positive, aged 15 years and older) who began treatment in the quarter that ended 12 months ago.
Key indicators related to TB case detection are:
– Proportion of outpatients aged 15 years and older who were identified as TB suspects – Proportion of TB suspects whose sputum was tested – Proportion of TB suspects tested who were sputum smear-positive.
Key indicators related to HIV testing and status of TB patients are:
– Proportion of TB patients (any age, any type of TB) who were tested for HIV before or
during TB treatment – Proportion of HIV-tested TB patients who are HIV-positive – Proportion of HIV-positive TB patients who are on CPT.
Key indicators related to TB treatment are:
– Proportion of new sputum smear-positive TB cases (aged 15 years and older) that converted at 2 or 3 months (conversion rate)
– Proportion of new sputum smear-positive cases (aged 15 years and older) that:
- were cured - completed treatment - defaulted - were treatment failures - died - transferred out
treatment outcome indicators

26
Analysis of indicators may involve:
– comparing the actual proportion achieved to the expected or desired proportion – comparing one indicator to other indicators (such as by comparing the proportion of
cases that defaulted to the proportion that completed treatment or were cured) – comparing results achieved from one quarter to the next.
To see the health facility’s improvement keep a line graph of:
– the number of TB suspects tested each quarter – the number of sputum smear-positive cases detected each quarter.
The purpose of monitoring is to recognize success and solve problems. It is important to
thoroughly describe the problem and investigate its causes before identifying and implementing solutions. Solutions must be appropriate for the causes of a problem.

27
Self-assessment questions Answer the self-assessment questions below to check what you have learnt. Then compare your answers to those provided on pages 30–31. 1. Tick the indicators below that are related to TB case detection: ___ Proportion of outpatients aged 15 years and older who were identified as TB suspects
___ Proportion of TB cases that were cured
___ Proportion of TB suspects whose sputum was tested for TB
___ Proportion of cases that defaulted
___ Proportion of suspects tested who were sputum smear-positive
___ Proportion of TB patients who were tested for HIV before or during TB treatment
2. What two registers are used to compile data on TB case detection on Worksheet 1?
3. The data needed to calculate indicators related to HIV testing and HIV status of TB
patients can be compiled on Worksheet 2 from the health facility’s
______________________ and from _____________________________ kept for
each patient.
4. To measure the proportion of new sputum smear-positive cases in a quarter that
converted at 2 or 3 months, it is necessary to wait at least ___ months after the end of
the quarter in which they started treatment. Indicators related to treatment outcomes
(cure, treatment completed, default) can be measured for the group of patients who
began treatment in the quarter ending _____________ago.
5. What records are used to compile data on TB treatment on Worksheet 3?

28
6. During a quarter, 120 TB suspects were identified. Of these suspects, 90 had their sputum tested. What is the proportion of TB suspects whose sputum was tested for TB?
Should the health facility be satisfied with this result? Why or why not?
7. During the previous quarter, of 10 TB cases who began treatment at Panola Health Centre, 7 were tested for HIV before or during TB treatment. One of the TB patients was HIV-positive. She has not started CPT. Calculate the following indicators:
_____ % of TB patients have been tested for HIV
_____ % of HIV-tested TB patients are HIV-positive
_____ % of HIV-positive TB patients are on CPT
Should the health facility be satisfied with its performance related to the three indicators related to HIV-testing and HIV status of TB patients?
8. During a quarter at the outpatient department of a hospital, 60 new sputum smear-positive cases were put on treatment. Of these cases, 65% were eventually cured; 10% completed treatment; and 10% defaulted.
What are two possible explanations for the low proportion of cases cured?

29
Suggest two questions that should be asked to investigate problems and their causes:
9. Before trying to solve a problem, it is important to determine the ___________ of the problem.
Now compare your answers with those on the next page.

30
Answers to self-assessment questions If you had difficulty answering any question, turn back and study the section indicated. If you do not understand something, discuss it with a facilitator. 1. The following indicators should be ticked: (See section 1)
Proportion of outpatients aged 15 years and older who were identified as TB suspects Proportion of TB suspects whose sputum was tested for TB Proportion of TB suspects tested who were sputum smear-positive
2. Outpatient Register and Register of TB Suspects (See section 1) 3. The data needed to calculate indicators related to HIV testing and HIV status of TB
patients can be compiled on Worksheet 3 from the health facility’s Register of TB Suspects and from TB Treatment Cards kept for each patient. (See section 2)
4. To measure the proportion of new sputum smear-positive cases in a quarter that converted at 2 or 3 months, it is necessary to wait at least 3 months after the end of the quarter in which they started treatment. Indicators related to treatment outcomes (cure, treatment completed, default) can be measured for the group of patients who began treatment in the quarter ending 1 year ago. (See section 3)
5. Register of TB Suspects and TB Treatment Cards (See section 3) 6. 90/120 = 0.75 = 75%
The health facility should not be satisfied. 100% of TB suspects should have their sputum tested. (See sections 4–5)
7. 7/10 = 0.70 = 70% of TB patients have been tested for HIV. The health facility should not be satisfied with this.
1/7 = 0.14 = 14% of HIV-tested TB patients are HIV-positive. The health facility’s performance has no impact on the proportion of TB cases who are HIV-positive.
0/1 = 0 = 0% of HIV-positive TB patients are on CPT. The health facility should not be satisfied because it has failed to put the HIV-positive TB patient on CPT (or to successfully refer the patient for HIV care including CPT). (See sections 4–5)
8. You may have other answers, but here are some possible explanations:
Follow-up sputum examinations are not being done to prove cures. Too many cases are defaulting. There may be treatment failures, either because of poor compliance or MDR-TB. Outcomes are not known for patients who transfer out. There were a number of HIV-related deaths.

31
Possible questions to investigate:
Why are final sputum examinations not being done? (Is it because health workers do not insist on them, or because patients do not cooperate?)
What are the reasons that patients default? (Are they related to lack of convenience, attitudes of health workers, other?) How many treatment failures were there? Were they caused by poor compliance? Could they have MDR-TB?
Is an effort made to find out the treatment outcomes of transferred patients? If not, why not?
What were the causes of death among TB patients?
(See section 6) 9. Before trying to solve a problem, it is important to determine the cause(s) of the
problem. (See section 6)
The End
Congratulations on finishing this
module!

32

33
Exercises for Module H:
Monitor TB Case Detection and Treatment

34

35
Optional Exercise A
Written Exercise – Recording in the Register of TB Suspects
This is the same as Exercise B of Module B: Detect Cases of TB. If that module has recently been done, participants will skip this exercise. Otherwise, follow the instructions below. Work individually on this exercise. Ask your facilitator for help if you do not understand what to do. 1. Fold out page 43, a blank Register of TB Suspects. Fill in the year (2009) and the name of
the health facility (Veld Health Centre). 2. The people below were identified as TB suspects during a two-day period at Veld Health
Centre.
List each suspect in the Register of TB Suspects. Assign each, in sequence, a TB suspect number. The first will be TB suspect
number 489. Fill in the rest of the information about each suspect and when the sputum was
collected and sent to the laboratory.
Anna Abouya: She came to the health facility complaining of cough, fever and headache on 13 November. She is female, aged 27 years. Her address is 192 Market Road, Apartment 3, Veld. When asked, she said that she and her husband had been tested for HIV and were negative, and promised to bring the written results. Her first sputum was collected on 13 November; her samples were sent to the laboratory on 15 November.
Nyore Lori: He came to the health facility on 13 November because he was referred
by the HIV clinic for sputum examination. He is HIV-positive and says he has coughed for weeks. He is male, aged 40 years. His address is Bader House, 200 Airport Road, Veld. His first sputum sample was collected on 13 November; his samples were sent to the laboratory on 15 November.
Kumante Waweru: Identified during routine screening on 14 November with cough
lasting more than 2 weeks. He is male, aged 31 years. His address is 21 Middle Street, Raman. His first sputum sample was collected on 14 November. He declined an HIV test. After several days, he had not returned with the second sample. His single sputum sample was sent to the laboratory on 19 November.
Pooran Singh: He came to the health facility on 14 November because of fever and
trouble sleeping. He says that he has night sweats and has lost weight recently. He is male, aged 65 years. His address is 5 President Street, Veld. His first sputum sample was collected on 14 November. He said that he had an HIV

36
test some years ago and it was negative. He declined another test. His sputum samples were sent to the laboratory on 16 November.
Esna Josephus: She came to the health facility on 14 November for an antenatal visit
that included an HIV test. It was negative. Routine screening identified her as having cough for more than 2 weeks. She is female, aged 21 years. She lives at 77 Kingsway Park, Veld. Her first sputum sample was collected on 14 November. Her sputum was sent to the laboratory on 16 November.
3. On the next pages are four Request for Sputum Smear Microscopy Examination forms
that were returned to the health centre on 22 November with the results of sputum examination for the above TB suspects. The form for TB suspect #491, Kumante Waweru, was not returned.
For each TB suspect, record in the Register of TB Suspects the date the results were received (that is, 22 November). Then record the results of the sputum examination.

37
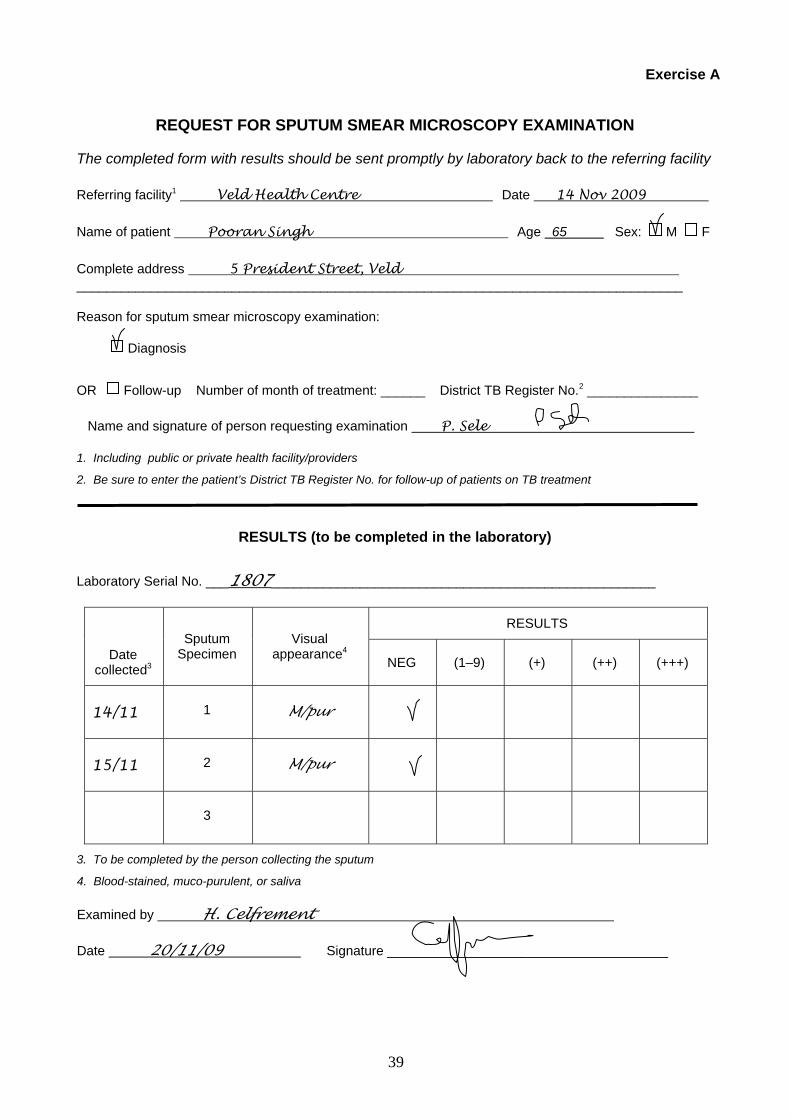
REQUEST FOR SPUTUM SMEAR MICROSCOPY EXAMINATION
The completed form with results should be sent promptly by laboratory back to the referring facility
Referring facility1 Veld Health Centre Date 13 Nov 2009
Name of patient Anna Abouya Age 27 Sex: M F
Complete address 192 Market Road, Apt 3
Veld
Reason for sputum smear microscopy examination:
Diagnosis
OR Follow-up Number of month of treatment: ______ District TB Register No. 2 ______________
Name and signature of person requesting examination P. Sele___________________________
1. Including public or private health facility/providers
2. Be sure to enter the patient’s District TB Register No. for follow-up of patients on TB treatment
RESULTS (to be completed in the laboratory)
Laboratory Serial No. ____1793_____________________________________________________
RESULTS
Date collected3
Sputum Specimen
Visual appearance4
NEG (1–9) (+) (++) (+++)
13/11 1 m/pur
15/11 2 m/pur
3
3. To be completed by the person collecting the sputum
4. Blood-stained, muco-purulent, or saliva
Examined by H. Celfrement
Date 18/11/09 Signature
Exercise A

38
REQUEST FOR SPUTUM SMEAR MICROSCOPY EXAMINATION
The completed form with results should be sent promptly by laboratory back to the referring facility
Referring facility1 Veld Health Centre Date 13 Nov 2009
Name of patient Nyore Lori Age 40 Sex: M F
Complete address Bader House, 200 Airport Rd
Veld
Reason for sputum smear microscopy examination:
Diagnosis
OR Follow-up Number of month of treatment: ______ District TB Register No.2 _______________
Name and signature of person requesting examination P. Sele
1. Including public or private health facility/providers
2. Be sure to enter the patient’s District TB Register No. for follow-up of patients on TB treatment
RESULTS (to be completed in the laboratory)
Laboratory Serial No. ___1794_______________________________________________________
RESULTS Date collected3
Sputum Specimen
Visual appearance4
NEG (1–9) (+) (++) (+++)
13/11 1 M/PUR
14/11 2
7
3
3. To be completed by the person collecting the sputum
4. Blood-stained, muco-purulent, or saliva
Examined by H. Celfrement
Date 18/11/09 Signature ______________________________________
39
REQUEST FOR SPUTUM SMEAR MICROSCOPY EXAMINATION
The completed form with results should be sent promptly by laboratory back to the referring facility
Referring facility1 Veld Health Centre Date 14 Nov 2009
Name of patient Pooran Singh Age 65 Sex: M F
Complete address 5 President Street, Veld __________________________________________________________________________________
Reason for sputum smear microscopy examination:
Diagnosis
OR Follow-up Number of month of treatment: ______ District TB Register No.2 _______________
Name and signature of person requesting examination P. Sele
1. Including public or private health facility/providers
2. Be sure to enter the patient’s District TB Register No. for follow-up of patients on TB treatment
RESULTS (to be completed in the laboratory)
Laboratory Serial No. ___1807____________________________________________________
RESULTS
Date collected3
Sputum Specimen
Visual appearance4
NEG (1–9) (+) (++) (+++)
14/11 1 M/pur
15/11 2 M/pur
3
3. To be completed by the person collecting the sputum
4. Blood-stained, muco-purulent, or saliva
Examined by H. Celfrement
Date 20/11/09 Signature ______________________________________
Exercise A

40
REQUEST FOR SPUTUM SMEAR MICROSCOPY EXAMINATION
The completed form with results should be sent promptly by laboratory back to the referring facility
Referring facility1 Veld Health Centre Date 14 Nov 2009
Name of patient Esna Josephus Age 21 Sex: M F
Complete address 77 Kingsway Park
Veld
Reason for sputum smear microscopy examination:
Diagnosis
OR Follow-up Number of month of treatment: ______ District TB Register No.2 _______________
Name and signature of person requesting examination P. Sele
1. Including public or private health facility/providers
2. Be sure to enter the patient’s District TB Register No. for follow-up of patients on TB treatment
RESULTS (to be completed in the laboratory)
Laboratory Serial No. ____1808___________________________________________________
RESULTS
Date collected3
Sputum Specimen
Visual appearance4
NEG (1–9) (+) (++) (+++)
14/11 1 M/pur
16/11 2 M/pur
3
3. To be completed by the person collecting the sputum
4. Blood-stained, muco-purulent, or saliva
Examined by H. Celfrement
Date 20/11/09 Signature ______________________________________

41
4. Beside each TB suspect’s name listed below, write the next action that you should take
for the TB suspect (for example, informing the patient and opening a TB Treatment Card, or referring the patient to a clinician for assessment). Base your answer on laboratory results and other information given. For Anna Abouya: (She is no longer coughing and feels quite well.)
For Nyore Lori:
For Kumante Waweru:
For Pooran Singh: (He is still coughing and does not look well.)
For Esna Josephus:
When you have finished this exercise, please discuss your answers with a facilitator.
Then GO BACK to page 5, section 1, and read until the next stop sign.
Exercise A

42

43
REGISTER OF TB SUSPECTS
Date (dd/mm)
TB suspect number
Name of TB suspect
Age
M F
Complete address
Result of
HIV test *
Date first
sputum collected
Date sputum sent to
laboratory
Date results
received
Results of sputum
examinations
1 2 3
TB Treatment
Card opened (record date)
Observations/ Clinician’s diagnosis
* (Pos) Positive; (Neg) Negative; (I) Discordant/Inconclusive; (ND) Not Done / unknown. Documented evidence of HIV test performed during or before TB treatment is reported here.
Optional Exercise A
Facility __________________________ Year _________

44

45
Exercise B
Written Exercise – Compiling data related to case detection
In this exercise, you will practise compiling general outpatient data and data from a Register of TB Suspects onto Worksheet 1. 1. Fold out Worksheet 1 on page 55. You will complete this worksheet for Nikobo Health
Centre.
2. Use the information below to record the quarter and complete step 1a of the worksheet:
The first quarter of 2009 has just ended. The dates in that quarter were: 1 January–31 March 2009.
– Tally sheets kept at Nikobo Health Centre show that there were 3000 outpatients aged 15 years and older during the quarter.
3. Following are eight pages from a Register of TB Suspects for the same quarter. Use the
pages from the Register of TB Suspects to complete the rest of Worksheet 1. Begin by marking the beginning and ending dates of the quarter.

46

47
REGISTER OF TB SUSPECTS
Date (dd/mm)
TB suspect number
Name of TB suspect Age
M F
Complete address Result of HIV test*
Date first
sputum collected
Date sputum sent to
laboratory
Date results
received
Results of sputum examinations 1 2 3
TB Treatment
Card opened
(record date)
Observations/ Clinician’s diagnosis
2 Jan 1 Chris Mbeya 48 4 Ramalyn Road, Nikobo Neg 2-1 4-1 7-1 neg neg
2-1 2 Varma Knallyo 34 10 Yalta Road, Emeru Village Neg 2-1 4-1 7-1 neg neg
3-1 3 Ella Pneuya 19 by newstand, Charko Rd, Nikobo ND 3-1 4-1 7-1 neg neg
5-1 4 Joseph Pudro 24 24 Market Street, Nikobo Neg 5-1 7-1 9-1 neg neg
5-1 5 Cecile Junga 40 Rim Road, Kangetu Neg 5-1 7-1 9-1 neg neg
7-1 6 Alia Mindalo 31 28 Long Street, Nikobo ND 7-1 9-1 11-1 neg neg
7-1 7 Salim Dubaro 44 86 Ramalyn Road, Nikobo Neg 7-1 9-1 11-1 + ++ 15-1
8-1 8 Toni Bundri 38 6 Ramalyn Road, Nikobo Neg 8-1 9-1 11-1 neg neg
9-1 9 Lucy Aramban 27 Rim Rd, Kangetu, near flower shop Neg 9-1 11-1 14-1 neg neg
9-1 10 Arman Kwanob 41 Rupana Road, Malari Neg 9-1 11-1 14-1 neg neg
10-1 11 Malina Nkindo 22 over grocery, 48 Charko Rd, Nikobo ND 10-1 11-1 14-1 neg neg
10-1 12 Wambui Saguka 39 32 Main Street, Nikobo ND 10-1 14-1 16-1 neg
12-1 13 Ramesha Wundamo 24 11 Tugo Road, Nikobo Neg 12-1 16-1 21-1 neg
14-1 14 John Butswali 49 30 Wander Road, Kangetu Neg 14-1 16-1 21-1 neg neg
14-1 15 Joshua Nkonge 44 42 Main Street, Nikobo Neg 14-1 16-1 21-1 neg neg
14-1 16 Christina Karnga 32 12 Yalta Road, Emeru Village ND
15-1 17 Joshua Karnga 14 12 Yalta Road, Emeru Village Pos 15-1 16-1 21-1 neg neg 26-1 EP TB (pleurisy)
15-1 18 Mary Karimi 24 Rupana Road, Malari Neg 15-1 16-1 21-1 neg neg
16-1 19 Chris Mwala 46 18 Long Street, Nikobo ND 16-1 18-1 21-1 neg
16-1 20 Salima Kunga 36 56 Market Circle, Parmu ND 16-1 21-1 23-1 neg neg
Year ____________ Facility ________________________ 2009 Nikobo Health Centre
Exercise B

48
REGISTER OF TB SUSPECTS
Date (dd/mm)
TB suspect number
Name of TB suspect Age
M F
Complete address Result of HIV test*
Date first
sputum collected
Date sputum sent
to laboratory
Date results
received
Results of sputum examinations 1 2 3
TB Treatment
Card opened
(record date)
Observations/ Clinician’s diagnosis
17-1 21 Joseph Yamta 54 15 Station Square, Nikobo Neg 17-1 18-1 21-1 +++ +++ 24-1
17-1 22 Cristal Mwenda 47 38 Main Street, Nikobo Neg 17-1 18-1 21-1 neg neg
17-1 23 Abdullah Mbayo 28 72 Long Street, Nikobo neg 17-1 21-1 23-1 neg neg
17-1 24 Mohammed Arata 58 24 Rumolo Road, Emeru ND 17-1 21-1 23-1 neg neg
19-1 25 Yasser Mereno 49 46 Ugana Road, Malari ND 19-1 23-1 25-1 neg
19-1 26 Christina Koffi 57 10 Centre Street, Parmu Neg 19-1 21-1 23-1 neg neg
19-1 27 John Nusuyu 40 18 Centre Street, Parmu ND 19-1 21-1 23-1 neg neg
21-1 28 Elizabeth None 21 450 Charko Road, Nikobo
21-1 29 Mohammed Mbeya 34 over tea shop, Market Circle, Parmu neg 21-1 23-1 25-1 neg neg
21-1 30 Sebu Kwanda 40 71 Tugo Road,Nikobo ND 21-1 23-1 25-1 neg neg
22-1 31 Anna Koffi 30 10 Centre Street, Parmu ND 22-1 25-1 28-1 neg
22-1 32 Paul Nkonge 38 44 Main Street, Nikobo neg 22-1 23-1 25-1 neg neg
22-1 33 Angelina Kwari 62 8 Inenya Road, Kangetu ND 22-1 25-1 28-1 neg neg
23-1 34 Ramesh Rambuku 45 11 Wander Road, Kangetu Pos 23-1 25-1 28-1 neg + 1-2 TBP (Xray)
23-1 35 Jane Mwala 38 18 Long Street, Nikobo ND 23-1 25-1 28-1 neg neg
24-1 36 Anthony Mbeya 18 32 Yalta Road, Emeru neg 24-1 25-1 28-1 neg neg
24-1 37 Omar Nasser 68 30 Yalta Road, Emeru neg 24-1 28-1 30-1 neg neg
26-1 38 Mary Mwarecki 39 20 Station Square, Nikobo neg 26-1 28-1 30-1 neg
26-1 39 Anna Nkonge 60 44 Main Street, Nikobo neg 26-1 30-1 1-2 neg
28-1 40 Mohammed Nkone 56 10 Tugo Road, Nikobo ND
Year _______________ Facility ________________________ 2009 Nikobo Health Centre

49
REGISTER OF TB SUSPECTS
Date (dd/mm)
TB suspect number
Name of TB suspect Age
M F
Complete address Result of HIV test*
Date first
sputum collected
Date sputum sent to
laboratory
Date results
received
Results of sputum examinations 1 2 3
TB Treatment
Card opened
(record date)
Observations/ Clinician’s diagnosis
28-1 41 Anne Kofti 43 End of Bicycle Lane, Malari neg 28-1 30-1 1-2 neg neg
29-1 42 John Mwarena 42 56 Third Street, Parmu neg 29-1 30-1 1-2 neg neg 10-2 S-neg PTB
29-1 43 Adul Kwandullah 40 76 Charko Road, Nikobo neg 29-1 30-1 1-2 neg neg
30-1 44 Salima Nkone 50 10 Tugo Road, Nikobo neg 30-1 1-2 4-2 neg neg
30-1 45 Christina Karimi 49 Rupana Road, Malari ND 30-1 4-2 6-2 neg
31-1 46 Peter Patel 33 12 Centre Street, Parmu neg 31-1 4-2 6-2 neg
31-1 47 Indira Patel 67 12 Centre Street, Parmu ND 31-1 1-2 4-2 neg neg
2 Feb 48 Joseph Hoda 42 32 Market Street, Nikobo Pos 2 - 2 4-2 6-2 + ++ 11-2
2-2 49 Abdulla Koffi 37 Inenya Road, Kangetu Neg 2-2 4-2 6-2 neg neg
2-2 50 Anthony Karimi 60 Rupana Road, Malari ND 2-2 6-2 8-2 neg neg
3-2 51 Emma Wambuka 22 Behind Post Office, Kangetu ND
3-2 52 Joseph Njeri 47 by cheese shop, Market Cir, Parmu Neg 2-2 4-2 6-2 neg neg
4-2 53 Mary Hoda 7 32 Market Street, Nikobo neg 4-2 6-2 9-2 neg neg 7-2 EP-neck lymphatic TB
4-2 54 Pauline Hoda 30 32 Market Street, Nikobo Neg 4-2 6-2 8-2 neg neg
4-2 55 Marc Kawera 39 420 Ramalyn Road, Nikobo
5-2 56 Thomas Kinyata 52 68 Long Street, Nikobo ND 5-2 6-2 8-2 neg neg
5-2 57 Mary Mareto 50 Bakery, Ugana Road, Malari neg 5-2 8-2 11-2 neg
5-2 58 John Wmendwa 29 28 Rumolo Road, Emeru neg 5-2 6-2 8-2 neg neg
6-2 59 Anya Patel 60 10 Centre Street, Parmu neg 6-2 8-2 11-2 ++ ++ 13-2
6-2 60 Emma Koffi 30 Inenya Road, Kangetu neg 6-2 8-2 11-2 neg neg
Year _______________ Facility ________________________ Nikobo Health Centre 2009
Exercise B

50
REGISTER OF TB SUSPECTS
Date (dd/mm)
TB suspect number
Name of TB suspect Age
M F
Complete address Result of HIV test*
Date first
sputum collected
Date sputum sent to
laboratory
Date results
received
Results of sputum examinations 1 2 3
TB Treatment
Card opened
(record date)
Observations/ Clinician’s diagnosis
7-2 61 Omar Andino 56 18B Station Square, Nikobo ND 7-2 8-2 11-2 neg
7-2 62 Paul Kwabari 34 114 Memorial Drive, Nikobo neg 7-2 11-2 13-2 neg neg
7-2 63 Antonina Njeri 52 520 Main Street, Nikobo neg 7-2 11-2 13-2 neg neg
9-2 64 Fati Patel 30 10 Centre Street, Parmu ND 8-2 11-2 13-2 neg neg
9-2 65 Rachael Mwenda 34 212 Market St, upstairs, Nikobo neg 9-2 11-2 13-2 neg neg
11-2 66 Joshua Ayro 43 14 Yalta Road, Emeru neg 11-2 13-2 15-2 neg neg
11-2 67 Paul Njeri 41 by cheese shop, Market Cir, Parmu ND
12-2 68 Ayo Patel 33 10 Centre Street, Parmu neg 12-2 13-2 15-2 + +++ 19-2
13-2 69 John Andino 38 Rupana Rd,north end, Malari ND 13-2 15-2 18-2 neg neg
14-2 70 Anne Njeri 24 by cheese shop, Market Cir, Parmu Neg 14-2 15-2 18-2 neg neg
14-2 71 Christopher Kwanda 40 Inenya Road West, Kangetu Neg 14-2 15-2 18-2 neg neg
14-2 72 Emma Mbaye 41 Schoolhouse Road, Malari Neg 14-2 18-2 20-2 neg
16-2 73 Lola Okrong 37 Creek Path, Kangetu ND 15-2 18-2 20-2 neg
16-2 74 Okal Curanda 32 48 Liberation way, Nikobo Neg 16-2 18-2 20-2 neg
18-2 75 Anton Nkobi 28 68 Ramalyn Road, Nikobo Neg 18-2 20-2 22-2 neg neg
19-2 76 Ruth karishma 35 82 Market Street, Nikobo ND 19-2 22-2 25-2 neg
19-2 77 Fati Pakuka 50 Creek Path, Kangetu Neg 19-2 20-2 22-2 neg neg
19-2 78 Ramesh Arojalal 50 12 Yalta Road, Emeru Pos 19-2 22-2 26-2 neg ++ 4-3
20-2 79 Mary Swanya 45 88 Tugo Road, Nikobo ND 20-2 22-2 26-2 neg neg
21-2 80 Kala Nkuka 23 748 Long Street, Nikobo neg 21-2 22-2 26-2 + +++ 4-3 Moved –Bulawayo HC
Year _______________ Facility ________________________ Nikobo Health Centre 2009

51
REGISTER OF TB SUSPECTS
Date (dd/mm)
TB suspect number
Name of TB suspect Age
M F
Complete address Result of HIV test*
Date first
sputum collected
Date sputum sent to
laboratory
Date results
received
Results of sputum
examinations 1 2 3
TB Treatment
Card opened
(record date)
Observations/ Clinician’s diagnosis
23-2 81 Anthony Twanda 33 65 Charko Rd, Nikobo Neg 23-2 26-2 27-2 neg
23-2 82 Cecile Wrang 28 111B Tugo Road, Nikobo Neg 23-2 26-2 27-2 neg neg
23-2 83 Teewa Woffi 40 River Settlement, Row 4, Nikobo ND 23-2 26-2 27-2 neg
25-2 83 Wambui Nbaku 35 10 Rumolo Road, Emeru Neg 25-2 27-2 1-3 neg neg
25-2 85 Toni Petaka 19 Schoolhouse Road, Malari ND 28-2 1-3 4-3 neg
26-2 86 Paul Lowaka 42 48 Station Square, Nikobo Neg 26-2 27-2 1-3 neg neg
26-2 87 Ella Nkonga 50 12 Fourth Street, Parmu Neg 26-2 1-3 4-3 neg
26-2 88 Jun Swandu 36 Split Tree Road, Bornu ND 26-2 27-2 1-3 + + Referred 3-3 to Bornu HC
27-2 89 Nona Wambuki 38 end of Dubano Road, Nikobo ND 27-2 1-3 4-3 neg neg
28-2 90 Matthew Mahon 34 behind Government house, Nikobo ND 28-2 1-3 4-3 neg neg
28-2 91 Johanna Karone 25 520 Liberation Way, Nikobo Neg 28-2 1-3 4-3 neg neg 12-3 S-neg PTB
2 Mar 92 Angelina Kwari 62 44 High Street, Nikobo Neg 2-3 4-3 6-3 neg
2-3 93 Thomas Rundako 38 240 Memorial Drive, Nikobo Neg 2-3 4-3 6-3 neg neg
2-3 94 Koling Nkuna 39 6 Centre Street, Parmu ND 2-3 4-3 6-3 neg
2-3 95 Nana Korba 18 411 Market St, Nikobo POS 2-3 4-3 6-3 + ++ 7-3
4-3 96 Peter Swalno 27 15 Rim Road, Kangetu ND 5-3 8-3 11-3 neg
4-3 97 Jean Sinalon 30 98 Ramalyn Road, Nikobo Neg 4-3 6-3 8-3 neg neg
5-3 98 John Gorenta 43 River Settlement, Row 6, Nikobo Neg 5-3 6-3 8-3 neg neg
5-3 99 Marta Kumbo 46 80 Long Street, Nikobo Neg 5-3 8-3 11-3 neg
5-3 100 Esna Josephus 40 Main Street at bus term, Nikobo ND 5-3 6-3 8-3 neg neg
Year _______________ Facility ________________________ Nikobo Health Centre 2009
Exercise B

52
REGISTER OF TB SUSPECTS
Date (dd/mm)
TB suspect number
Name of TB suspect Age
M F
Complete address Result of HIV test*
Date first
sputum collected
Date sputum sent to
laboratory
Date results
received
Results of sputum examinations 1 2 3
TB Treatment
Card opened
(record date)
Observations/ Clinician’s diagnosis
6-3 101 Florence Corlei 21 62 Yalta Road, Emeru ND
6-3 102 Amir Khan 42 11 College Street, Nikobo Neg 6-3 8-3 11-3 neg neg
7-3 103 Asma Elsony 51 Circle St. coffee house, Nikobo neg 7-3 8-3 11-3 neg neg
7-3 104 Vanesia Dutoit 40 80 High Street, Nikobo Neg 7-3 8-3 11-3 neg neg
7-3 105 Hatim Haseeb 39 52 Cross Street, Emeru Neg 7-3 8-3 11-3 neg neg
9-3 106 Kamau Morefu 34 32 Wander Road, Kangetu ND 8-3 11-3 18-3 neg neg
9-3 107 Stella Machu 32 16 New Lane, Parmu POS 11-3 13-3 18-3 neg neg 24-3 PTB (X-ray)
11-3 108 Thomas Machu 34 16 New Lane, Parmu POS 11-3 13-3 18-3 neg neg 24-3 PTB (X-ray)
11-3 109 Jama Salu 22 River Settlement, Row 2, Nikobo neg 11-3 13-3 18-3 + ++ 21-3
11-3 110 Nyore Ria 45 Auto shop, Main Street, Nikobo ND
11-3 111 Margaret Masinda 29 72 Cemetery Road, Nikobo ND 11-3 13-3 18-3 neg neg
12-3 112 Farah Simba 32 by tobacco shop, Rim Rd, Kangetu neg 12-3 15-3 18-3 neg
12-3 113 Marian Simba 30 by tobacco shop, Rim Rd, Kangetu ND 12-3 15-3 18-3 neg
13-3 114 Louisa Carol 42 28 Old Fort Road, Parmu Neg 13-3 15-3 18-3 neg
13-3 115 Ismail Fatua 62 Village Way, Malari ND 13-3 15-3 18-3 neg neg
14-3 116 Kamante Masunga 30 28 River Street, Nikobo Neg 15-3 18-3 20-3 +++ +++ 23-3
14-3 117 Esa Ngore 36 Bicycle Lane, Malari Neg 14-3 15-3 18-3 neg neg
14-3 118 Margaret Naidoo 61 15 Town Park, Nikobo ND 15-3 18-3 20-3 neg neg
16-3 119 Lulu Ngufu 28 Station Square Newstand, Nikobo Neg 15-3 18-3 20-3 neg
16-3 120 Bernice Willems 52 90 Tower Road, Nikobo
Year _______________ Facility ________________________ Nikobo Health Centre 2009

53
REGISTER OF TB SUSPECTS
Date (dd/mm)
TB suspect number
Name of TB suspect Age
M F
Complete address Result of HIV test*
Date first
sputum collected
Date sputum sent to
laboratory
Date results
received
Results of sputum examinations 1 2 3
TB Treatment
Card opened
(record date)
Observations/ Clinician’s diagnosis
16-3 121 Annalene Retia 26 27 Garden Street, Nikobo Neg 16-3 18-3 20-3 neg neg
16-3 122 Joseph Waweru 42 112 South Street, Nikobo Neg 16-3 18-3 20-3 neg neg
18-3 123 Sakib Wamai 32 60 Yalta Road, Emeru Neg 18-3 20-3 22-3 neg neg
18-3 124 Delip Singh 20 48 High Street, Nikobo ND 18-3 20-3 22-3 neg
18-3 125 Pooran Singh 18 48 High Street, Nikobo Neg 18-3 20-3 22-3 neg neg
18-3 126 Jana kanyagga 30 Cross Street Grocery, Emeru ND 18-3 20-3 22-3 neg
19-3 127 Annzita Numari 44 Inenya Road Bakery, Kangetu Neg 19-3 22-3 25-3 neg neg
20-3 128 Opu Kaninu 34 4 Ugana Road, Malari ND 20-3 22-3 25-3 neg neg
21-3 129 Panir Wamai 18 60 Yalta Road, Emeru neg 21-3 25-3 27-3 neg 31-3 PTB (X-ray)
21-3 130 Mariamo Rohkal 38 98 West Street, Nikobo ND 21-3 22-3 25-3 neg neg
21-3 131 Carolina Corlei 43 62 Yalta Road, Emeru ND 22-3 25-3 27-3 neg neg
23-3 132 James Corlei 46 62 Yalta Road, Emeru Neg 22-3 25-3 27-3 neg
23-3 133 Kamau Morefu 48 12 Second Street, Parmu Neg 23-3 25-3 27-3 neg neg
23-3 134 Tahmeed Arif 29 56 Circle Street, Nikobo ND 23-3 25-3 27-3 neg neg
23-3 135 Ahad Kaninu 60 4 Ugana Road, Malari neg 23-3 27-3 29-3 neg
25-3 136 Ndwetti Lori 31 Malari-Parmu Road Guesthouse ND 25-3 29-3 1-4 neg
25-3 137 Vivi larena 62 14 College Street, Nikobo neg 25-3 27-3 29-3 neg neg
26-3 138 Paul Kinanjui 28 33 Main Street, Nikobo ND 26-3 27-3 29-3 neg neg
26-3 139 Rebecca Kinanjui 20 33 Main Street, Nikobo neg 26-3 29-3 1-4 neg ++ 4-4
26-3 140 Sonia Kaninu 30 4 Ugana Road, Malari ND 26-3 27-3 29-3 neg neg
Year _______________ Facility ________________________ Nikobo Health Centre 2009
Exercise B

54
REGISTER OF TB SUSPECTS
Date (dd/mm)
TB suspect number
Name of TB suspect Age
M F
Complete address Result of HIV test*
Date first
sputum collected
Date sputum sent to
laboratory
Date results
received
Results of sputum examinations 1 2 3
TB Treatment
Card opened
(record date)
Observations/ Clinician’s diagnosis
26-3 141 Elena Faru 43 22 Market St, upstairs, Nikobo Neg 26-3 27-3 29-3 neg neg
27-3 142 Sarina Padma 24 45 East Street, Nikobo Neg 27-3 29-3 1-4 + ++
27-3 143 Joseph Abouya 40 142 Tower Road, Nikobo ND 27-3 29-3 1-4 neg neg
27-3 144 Lovely Zida 18 Station Sq., above jeweler, Nikobo ND 27-3 29-3 1-4 neg neg
28-3 145 Rezwan Rasel 32 38 Town Park, Nikobo Neg 28-3 1-4 5-4 neg
28-3 146 Sowroy Patel 61 w/ Chan family, Rim Rd, Kangetu ND 28-3 29-3 1-4 neg neg
28-3 147 Kalim Shuva 38 260 Memorial Drive, Nikobo Neg 28-3 1-4 5-4 neg
28-3 148 Peter Faru 44 22 Market St., upstairs, Nikobo ND
30-3 149 Marian Faru 54 22 Market St, downstairs, Nikobo ND 30-3 1-4 5-4 neg
30-3 150 Lucien Jamil 24 High St. Flower shop, NIkobo Neg 30-3 1-4 5-4 neg neg
30-3 151 Diana Faru Mwande 36 82 North Street, Nikobo ND 30-3 1-4 5-4 neg neg
30-3 152 Tomas Mwande 38 82 North Street, Nikobo Neg 30-3 3-4 5-4 neg neg
1 Apr 153 Masud Riat 51 92 Cemetery Road, Nikobo ND 1-4 3-4 5-4 neg neg
1-4 154 Jolie Aleem 21 Basket stall, Market Circle, Parmu Neg 1-4 5-4 8-4 neg
2-4 155 Shila Tareef 34 20 Old Fort Way, Parmu ND 2-4 5-4 8-4 neg neg
3-4 156 Mark Msunga 42 Tool Shop, Bicycle Lane, Malari Neg 3-4 5-4 8-4 neg
3-4 157 Kalam Arende 20 78 River Street, Nikobo Neg 3-4 8-4 10-4 ++ 12-4
4-4 158 Ria Sanee 31 River Settlement, Row 2, Nikobo ND 4-4 5-4 8-4 neg neg
4-4 159 Ratma Sakib 26 59 Circle Street, Nikobo Neg 4-4 5-4 8-4 neg neg
4-4 160 Mukti Shakur 38 Next to church, Emeru Neg 4-4 8-4 10-4 neg neg
Year _______________ Facility ________________________ Nikobo Health Centre 2009

55
Worksheet 1: Data on TB case detection
Case detection in the previous quarter (the quarter that just ended) Soon after the end of a quarter, use this worksheet to compile data on TB case detection at the health facility during that quarter. Use the results of this worksheet to calculate indicators related to TB case detection. See Summary Worksheet A: Indicators to monitor TB case detection and HIV testing. Circle the previous quarter: 1 2 3 4 of year: ___________ Record the dates included in the previous quarter: ___________ –____________
Write answers in the blanks to the left of each step: 1a. _____ Determine the total number of outpatients aged 15 years and older seen
for any reason during the quarter. To do this, use whatever health facility records are available.
1b. _____ Determine the number of TB suspects aged 15 years and older
identified during the quarter. To do this, mark the beginning and ending dates for the quarter in the Register of TB Suspects. Then count the entries for suspects aged 15 years and older.*
1c. _____ Determine the number of these TB suspects whose sputum was
examined. Do this by counting the number of entries in the column headed “Date sputum sent to laboratory.”
1d. _____ Count the number of these TB suspects who had one or more smear-
positive results. Do this by looking in the columns headed “Results of sputum examination.”
* Be careful not to count any entries for children aged under 15 years. If there were any TB suspects aged under 15 years during the quarter, lightly cross through the entire row for these younger TB suspects so that you do not count them in this step.
When you have finished completing Worksheet 1, discuss your answers with a facilitator.
Then GO BACK to page 8, section 2, and read until the next stop sign.
Exercise B

56

57
Exercise C
Written Exercise – Compiling data related to HIV testing and HIV status of TB
patients In this exercise, you will practise compiling data from a Register of TB Suspects and TB Treatment Cards onto Worksheet 2. 1. Fold out Worksheet 2 on page 69. You will complete this worksheet for Nikobo Health
Centre.
2. Use the information below to record the quarter on the worksheet:
The second quarter of 2009 has recently begun. The dates in the previous quarter were:
1 January–31 March 2009.
3. To determine the total number of TB patients (any age, any type of TB) who began treatment in the previous quarter (step 2a), look back at the Register of TB Suspects for the quarter for the names of all TB patients who began treatment, and then locate the TB Treatment Cards for those cases. Also look for the TB Treatment Cards for any patients who were referred to your facility to begin treatment.
Note: The indicators to monitor HIV testing (Worksheet 2) are measured for the same
quarter as the indicators to monitor TB case detection (Worksheet 1). However, the individuals counted may be different: TB suspects age 15 and older are the focus of Worksheet 1, whereas TB patients (any age, any type of TB) are the focus of Worksheet 2.
Step 2a of the worksheet has been done for you as described below:
The Register of TB Suspects (pages 47–54) showed that 19 patients had TB
Treatment Cards opened (began treatment) in the 1st quarter of 2009. In addition, there was one TB patient who was referred to the Nikobo Health Centre to begin treatment.
The TB Treatment Cards for all of these TB patients were found and are copied on
the next 10 pages.
4. Use the TB Treatment Cards on the following 10 pages to complete steps 2b–2e of Worksheet 2.

58

59
Exercise C

60

61
Exercise C

62

63
Exercise C

64

65
Exercise C

66

67
Exercise C

68
Worksheet 2: Data on HIV testing
HIV testing in the previous quarter (the quarter that just ended) Soon after the end of a quarter, use this worksheet to compile data on HIV testing and HIV status of TB patients who began treatment at the health facility during the previous quarter. Use the results of this worksheet to calculate indicators related to HIV testing and HIV status. See Summary Worksheet A: Indicators to monitor TB case detection and HIV testing. Circle the previous quarter: 1 2 3 4 of year: __________ Record the dates included in the previous quarter: _______________ – _________________ Write answers in the blanks to the left of each step: 2a. Determine the total number of TB patients (any age, any type of TB) who began
treatment in the previous quarter.
In the Register of TB Suspects, mark the beginning and ending dates of the quarter. For that quarter, look in the column headed “TB treatment card opened.” This column should have dates for most TB patients who began treatment during the quarter. Find the TB Treatment Cards for all of these patients. (Remember to omit any patient whose TB Treatment Card was opened after the quarter ended.) Also look back in the Register of TB Suspects for suspects identified shortly before the quarter began but who began treatment during the quarter. Find the TB Treatment Cards for all of these patients. Also find the TB Treatment Cards for any patients referred to your health facility to begin treatment during the quarter.
2b. ______ Look at the TB Treatment Cards found in step 2a. Count the cards. This is the
number of TB patients who began treatment in the quarter. 2c. ______ On these TB Treatment Cards, look at the box “TB/HIV” to see whether each TB
patient was tested for HIV. Count the patients who have an HIV test date and result recorded. This is the number of TB patients who were HIV-tested before or during TB treatment.
2d. On these same cards, look at the box “TB/HIV” and count the patients
who had a positive HIV test result. This is the number of HIV-positive TB patients.
2e. Determine the number of HIV-positive TB patients on CPT. On these
same cards (all HIV-positive TB patients), look at the box “TB/HIV” and count the patients who have a date recorded for CPT start. This is the number of HIV-positive TB patients on CPT.
When you have finished completing Worksheet 2, discuss your answers with a facilitator.
GO BACK to page 10, section 3, and read until the next stop sign.
Exercise C

69
Exercise D
Written Exercise – Compiling data related to TB treatment
In this exercise, you will practise compiling data on TB treatment from a Register of TB Suspects and TB Treatment Cards onto Worksheet 3. 1. Fold out the copy of Worksheet 3 on page 79. First you will complete Part A –
Conversion for Nikobo Health Centre.
2. The quarter that ended 3 months ago was the 4th quarter of 2008 (dates: 1 October–31 December 2008). Circle the quarter and enter the dates in Part A of the worksheet.
3. Steps 3a and 3b of the worksheet have been done and are described below:
3a. The Register of TB Suspects showed that 10 patients had TB Treatment Cards opened (were put on treatment) in the 4th quarter of 2008. You found the TB Treatment Cards for all of these 10 patients. There were no cards for additional patients referred in to begin treatment during that quarter.
3b. Looking at the cards for the 10 patients put on treatment, you found that 9 were
smear-positive. The other patient was a case of extrapulmonary TB diagnosed by a clinician. You put the card for the extrapulmonary case back in the files. The front sides of the remaining TB Treatment Cards (for the 9 smear-positive patients) are shown on the following pages.
4. Using the 9 TB Treatment Cards that follow, complete steps 3c, 3d and 3e of
Worksheet 3.

70

71
Exercise D

72

73
Exercise D

74

75
Exercise D (continued)
Next complete Part B – Treatment Outcomes of Worksheet 3 for Nikobo Health Centre. Leave Worksheet 3 (page 79) folded out and continue to write on it. Note that Part B is about a different group of patients than Part A. Part B is about cases who began treatment in the quarter that ended 12 months ago. Enough time has now passed for these cases to have completed treatment. Use the following information to complete Part B: 1. The quarter that ended 12 months ago was the 1st quarter of 2008 (dates: 1 January–31
March 2008). Circle the quarter and enter the dates in Part B of the worksheet. 2. You found TB Treatment Cards for 10 new smear-positive cases put on treatment in the
1st quarter of 2008. Cards for these cases had been tagged earlier so they could easily be found. Record the number of cases in step 3f.
3. You looked on the back of the TB Treatment Cards and found the following treatment
outcomes for these 10 cases. Record the outcomes in steps 3g–3l of Worksheet 3:
Cure: 4 Treatment completed: 2 Default: 2 Treatment failure: 0 Died: 1 Transfer out: 1
When you have finished completing Worksheet 3, discuss your answers with a facilitator.
GO BACK to page 14, section 4, and read until the next stop sign.

76

77
Worksheet 3: Data on TB treatment
Use this worksheet to compile data on TB treatment. Use the results to complete the bottom half of the Summary Worksheet B: Indicators to monitor TB case detection and treatment. Part A – Conversion (for the quarter that ended 3 months ago) Circle the quarter that ended 3 months ago: 1 2 3 4 of year: _________
Record the dates in that quarter: ___________ – _____________ Find the number of new, sputum smear-positive cases put on treatment in the quarter. Then find the number of these cases that converted at 2 or 3 months. To do this, complete steps 3a–3e below. Write answers in the blanks for 2d and 2e. 3a. In the Register of TB Suspects, mark the beginning and ending dates of the quarter. For
that quarter, look in the column headed “TB Treatment Card opened?” This column should have dates for most TB patients put on treatment during the quarter. Find the TB Treatment Cards for all of these patients. Also find the TB Treatment Cards for any patients referred to your health facility to begin treatment during the quarter. (Omit any children aged under 15 years.)
3b. Look at the TB Treatment Cards found in step 3a. Put the cards for any extrapulmonary or
sputum smear-negative cases back in the files. 3c. On each TB Treatment Card remaining in your hand, look in the section titled “Type
of Patient” to see whether the case was new. If new, keep the card out. If not new (anything else ticked), put the card back in the files.
3d. _____ Count the cards remaining in your hand. This is the number of new,
sputum smear-positive cases put on treatment in the quarter. Important: Mark or tag these cards so that you can easily find them later (to determine treatment outcomes 12 months after starting treatment).
3e. _____ On these same cards, look at the “Results of sputum examination”
in the row for month 2 or 3. Count the cases who had a negative result for month 2 or 3. This is the number of new smear-positive cases that converted at 2 or 3 months.
Part B – Treatment outcomes (for the quarter that ended 12 months ago) Circle the quarter that ended 12 months ago: 1 2 3 4 of year: _________
Record the dates in that quarter: ___________–_____________ 3f. _____ Determine the number of new smear-positive cases put on treatment during the
quarter that ended 12 months ago. To do this, find the TB Treatment Cards for these cases. (The cards should have been tagged or marked.) Count the cards. How many cards are there?
Determine the number of these cases with each outcome. To do this, look at treatment outcomes recorded on the back of the TB Treatment Cards. Count the number of cases with each outcome: 3g. _____ Cure 3h. _____ Treatment completed 3i. _____ Default
3j. _____ Treatment failure 3k. _____ Died 3l. _____ Transfer out
Exercise D

78

79
Exercise E
Written Exercise – Calculating indicators In this exercise, you will practise calculating indicators using the Summary Worksheets.
1. Fold out the copies of Summary Worksheets A and B provided on pages 83 and 85. 2. Complete the Summary Worksheets for Nikobo Health Centre:
Complete the top part of Summary Worksheet A using results from Worksheet 1, completed in Exercise B. Remember to record the time frame in the middle column.
Complete the bottom part of Summary Worksheet A using results from Worksheet 2 completed in Exercise C.
Complete Summary Worksheet B using results from Worksheet 3, completed in Exercise D. Remember to record the time frames in the appropriate column.
3. When you have finished Summary Worksheets A and B, answer the following questions
or fill in the blanks:
a) In the previous quarter, how many TB suspects had sputum tested? What percentage of TB suspects had their sputum tested? b) In the previous quarter, how many TB patients were tested for HIV? What percentage of these TB patients are HIV-positive? What percentage of the HIV-positive TB patients are on CPT? c) In the quarter that ended 3 months ago, ______ new sputum smear-positive cases
were put on treatment. Of these cases, ____ converted at 2 or 3 months. This means that _____% of the cases converted.
d) How many new sputum smear-positive cases were put on treatment in the quarter
that ended 12 months ago? e) What percentage of cases were cured?
f) What percentage of cases completed treatment?

80
g) Sometimes, the percentage cured plus the percentage that completed treatment are added together as an indicator of “treatment success.” For Nikobo, what is the percentage cured plus the percentage that completed treatment?
h) What percentage defaulted?
When you have finished this exercise, discuss your answers with a facilitator.
GO BACK to page 17, section 5, and read until the next stop sign.

81
Summary Worksheet A: Indicators to monitor TB case detection and HIV testing
To monitor: Measure these indicators: Record
time frame:a
How to calculate
(numerator / denominator)b
x____
y
Calculate and record result (%)
here:
Proportion of outpatients aged 15 years and older who were identified as TB suspects
Number TB suspects identified (1b)
Total outpatients aged 15 years and older (1a)
________
Proportion of TB suspects whose sputum was examined for TB
Number TB suspects whose sputum was examined (1c)
Number TB suspects identified (1b)
________
TB case detection
(using data from Register of TB Suspects, compiled on Worksheet 1)
Proportion of TB suspects tested who were sputum smear-positive
Number smear-positive cases detected (1d)
Number TB suspects whose sputum was examined (1c)
________
Proportion of all TB patients who were tested for HIV before or during TB treatment
Number of TB patients tested for HIV (2c)
Number of TB patients (2b)
________
Proportion of all HIV-tested TB patients who are HIV-positive
Number of HIV-positive TB patients (2d)
Number of HIV-tested TB patients (2c)
________
HIV testing and status
(Using data from TB Treatment Cards, compiled on Worksheet 2) Proportion of all HIV-positive TB patients
who are on CPT
previous quarter:
Number of HIV-positive TB patients on CPT (2e)
Number of HIV-positive TB patients (2d)
________
a The time frame applies to the denominator. The persons in the numerator are part of this group.
b Step numbers in parentheses tell where to find the numerator and denominator on Worksheet 1, 2 or 3.
Exercise E

82
Summary Worksheet B: Indicators to monitor TB treatment
To monitor: Measure these indicators: Record
time frame:a
How to calculate
(numerator / denominator)b
_ x___
y
Calculate and record result (%)
here:
Conversion rate:
Proportion of new sputum smear-positive TB cases that converted at 2 or 3 months
quarter that ended 3
months ago:
Number new smear-positive cases that converted at 2 or 3 months (3e)
Number new smear-positive cases put on treatment (3d)
________
Treatment outcomes:
Proportion of new sputum smear-positive cases that:
– were cured
Number new smear-positive cases cured (3g)
Number new smear-positive cases put on treatment (3f)
________
– completed treatment Number new smear-positive cases that completed treatment (3h)
Number new smear-positive cases put on treatment (3f)
________
– defaulted Number new smear-positive cases that defaulted (3i)
Number new smear-positive cases put on treatment (3f)
________
– were a treatment failure Number new smear-positive cases that failed treatment (3j)
Number new smear-positive cases put on treatment (3f)
________
– died Number new smear-positive cases that died (3k)
Number new smear-positive cases put on treatment (3f)
________
TB treatment
(using data from Register of TB Suspects and TB Treatment Cards, compiled on Worksheet 3)
– transferred out
quarter that ended 12
months ago:
Number new smear-positive cases that transferred out (3l)
Number new smear-positive cases put on treatment (3f) ________
a The time frame applies to the denominator. The persons in the numerator are part of this group. b Step numbers in parentheses tell where to find the numerator and denominator on Worksheet 1, 2 or 3.
Exercise E
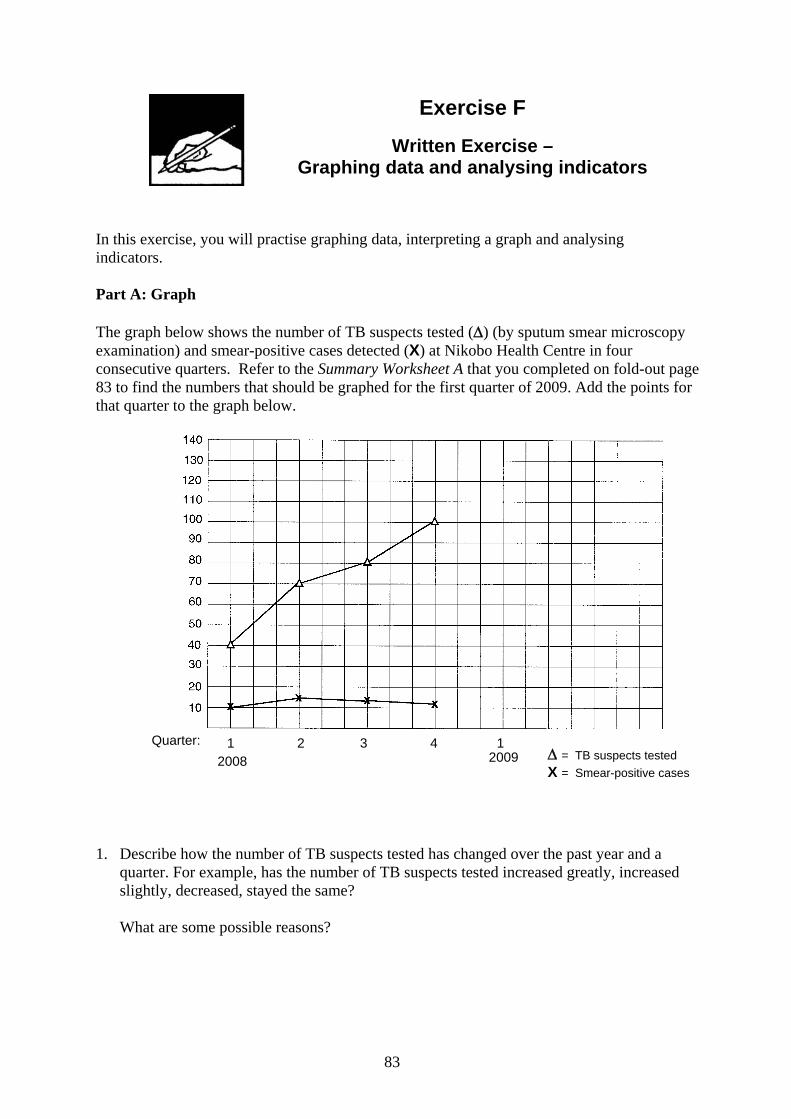
83
Exercise F
Written Exercise – Graphing data and analysing indicators
In this exercise, you will practise graphing data, interpreting a graph and analysing indicators. Part A: Graph The graph below shows the number of TB suspects tested () (by sputum smear microscopy examination) and smear-positive cases detected (X) at Nikobo Health Centre in four consecutive quarters. Refer to the Summary Worksheet A that you completed on fold-out page 83 to find the numbers that should be graphed for the first quarter of 2009. Add the points for that quarter to the graph below.
1. Describe how the number of TB suspects tested has changed over the past year and a
quarter. For example, has the number of TB suspects tested increased greatly, increased slightly, decreased, stayed the same?
What are some possible reasons?
Quarter: 1 2 3 4 1 2008 2009 = TB suspects tested
X = Smear-positive cases

84
2. Describe how the number of sputum smear-positive cases detected has changed over the past year and a quarter. For example, has the number of sputum smear-positive cases detected increased greatly, increased slightly, decreased, stayed the same?
What are some possible reasons? Part B: Analysing Indicators Refer to Summary Worksheets A and B from Exercise E and to the table titled “Analysing Indicators” (pages 19–20 of this module) to answer the following questions. 1. In past quarters, Nikobo Health Centre had the following rates for HIV testing of TB
patients and HIV-positive patients on CPT. Complete the last row below with data from the Summary Worksheet A completed in Exercise E:
Quarters Proportion of all TB patients who
were tested for HIV before or during TB treatment
Proportion of all HIV-positive TB patients who
are on CPT
2nd quarter 2008 2 out of 20 = 0.1 0 out of 1 = 0
3rd quarter 2008 10 out of 16 = 0.625 1 out of 4 = 0.25
4th quarter 2008 15 out of 18 = 0.83 5 out of 5 = 1.0
1st quarter 2009
In 2008, the facility’s nurses were trained to recommend HIV testing to all TB patients
and to start CPT for all HIV-positive TB patients. The drug storeroom’s supply of co-trimoxazole was increased after the training.
a) The desired result for both of these measures is 100%. Has HIV testing of TB
patients reached the desired level? Would you say that the training was successful?
b) Has the proportion of all HIV-positive patients who are on CPT reached the desired level? Why do you say that?
If the proportion decreased later in 2009, what might be an explanation?

85
2. In past quarters, Nikobo Health Centre had the following conversion rates (proportion of new smear-positive cases that converted at 2 or 3 months). Complete the last row below with data from the Summary Worksheet B completed in Exercise E:
Quarters in 2008:
Number of cases that converted at 2 or 3 months, out of number of
new sputum smear-positive cases put on treatment:
Conversion rate:
1st 4 out of 8 cases 50%
2nd 6 out of 12 cases 50%
3rd 6 out of 10 cases 60%
4th
a) Has the conversion rate increased or decreased over these quarters? What could be an explanation for this change? b) Has the conversion rate reached the desired level? What could be a possible reason?
3. Data on treatment outcomes are just now available for the first quarter of 2008. (Before
that quarter, treatment outcomes were not monitored at Nikobo Health Centre.) Look at the Summary Worksheet B and consider the proportion of cases with different treatment outcomes.
a) Which is higher, the proportion of cases that were cured, or the proportion that
completed treatment? What does this suggest about final follow-up sputum exams? b) Added together, what is the proportion of cases that completed treatment plus the
proportion cured? What is the proportion of cases that defaulted?

86
c) Given the above proportions, does it seem that improvements may be needed at
Nikobo Health Centre? If so, what types of problems should be investigated?
When you have finished this exercise, discuss your answers with a facilitator.
GO BACK to page 21, section 6, and read until the next stop sign.

87
Exercise G
Group Discussion – Monitoring and problem solving
In this exercise, the group will discuss monitoring and problem solving in relation to their own health facilities. To prepare for the discussion, think about the questions below: 1. Have you monitored TB case detection, HIV testing of TB patients and TB treatment at
your health facility in the past? If so, how? What indicators have you used, if any? 2. What problems have you identified with TB case detection, HIV testing of TB patients,
or TB treatment at your health facility? 3. What are the likely causes of these problems? What would be logical solutions?
Tell a facilitator when you are ready for the group discussion.
GO BACK to page 25. Read and work to the end of the module (page 31).


