management of annual bluegrass putting greens in california · research program march 1998 to...
TRANSCRIPT
UCRTURF
GCSAA CHAPTER COOPERATIVERESEARCH PROGRAM
March 1998 to November 2001
Final Report
21 December 2001
Management of Annual BluegrassPutting Greens in California
Investigators:Robert Green, University of California, RiversideGrant Klein, University of California, RiversideBill Richie, University of California, Riverside
Victor Gibeault, University of California, Riverside
Cooperators:Bert Spivey, Industry Hills Golf Courses
Steve Cockerham, University of California, RiversideVan Cline, The Toro Company
Janet Hartin, UCCE San Bernardino and Los Angeles Counties

i
TABLE OF CONTENTS
Acknowledgment ................................................................................................................................................................................ v
Executive Summary ........................................................................................................................................................................... 1
Introduction ......................................................................................................................................................................................... 5
Objectives .......................................................................................................................................................................................... 5
Location of Project ............................................................................................................................................................................ 6
Methods for Treatments ..................................................................................................................................................................... 6
Methods for Measurements ................................................................................................................................................................ 9
Methods for Plot Maintenance .......................................................................................................................................................... 11
Results ................................................................................................................................................................................................ 12
Discussion .......................................................................................................................................................................................... 17
Appendix ............................................................................................................................................................................................ A1
List of Tables
1. Eight liquid-applied fertility treatments tested in the annual bluegrass putting green management study. .......................... 6
2. N, P O , and K O application schedule for the annual bluegrass putting green management study. .................................... 72 5 2
3. Water injection cultivation treatments for the annual bluegrass putting green management study. ..................................... 7
4. Approximate schedule for routine measurement collection during the annual bluegrass management study. .................... 9
5. Brief description of the methods for the measurements taken during the annual bluegrass putting green management study. ........................................................................................................................................................................................ 10
6. Plot maintenance protocol for the annual bluegrass management study from June 1998 to Sept. 2000. .............................. 11
7. The effect of water injection cultivation, N, K O, and FeSO treatments on visual turfgrass putting green quality (1 2 4
to 9 scale, with 1=worst, 5=minimally acceptable, and 9=best quality putting green) of an annual bluegrass putting green from 12 Aug. 1998 to 18 Aug. 2000. ............................................................................................................................. 21
8. The effect of water injection cultivation, N, K O, and FeSO treatments on overall visual turfgrass putting green 2 4
quality (1 to 9 scale, with 1=worst, 5=minimally acceptable, and 9=best quality putting green), overall visual turfgrass color (1 to 9 scale, with 1=brown, 5=minimally acceptable, and 9=darkest green), and overall percent coverage of seedheads of an annual bluegrass putting green from 1998 to 2000. .................................................................. 22
9. The effect of water injection cultivation, N, K O, and FeSO treatments on visual turfgrass color (1 to 9 scale, 2 4
with 1=brown, 5=minimally acceptable, and 9=darkest green) of an annual bluegrass putting green from 12 Aug. 1998 to 5 Sept. 2000. ................................................................................................................................................................ 24

ii
List of Tables (continued)
10. The effect of water injection cultivation, N, K O, and FeSO treatments on percent coverage of seedheads of an 2 4
annual bluegrass putting green from 2 Mar. 1999 to 19 Sept. 2000. ...................................................................................... 26
11. The effect of water injection cultivation, N, K O, and FeSO treatments on percent coverage of mottling/patchiness 2 4
of an annual bluegrass putting green from 6 July 1999 to 19 Sept. 2000. ............................................................................. 28
12. The effect of water injection cultivation, N, K O, and FeSO treatments on coverage of cool-season brown patch, 2 4
leaf wilting and rolling, and scalping of an annual bluegrass putting green from 28 May 1999 to 26 Sept. 2000. .............. 30
13. The effect of N, K O, and FeSO treatments on clipping yields [g dry clippings/2.0 m (22.0 ft ) per 1 d] of an2 42 2
annual bluegrass putting green from 21 Dec. 1998 to 26 July 2000. ...................................................................................... 32
14. The effect of water injection cultivation, N, K O, and FeSO treatments on shoot number and root mass density of 2 4
an annual bluegrass putting green as determined by samples taken in 1999 and 2000. ......................................................... 34
15. The effect of water injection cultivation, N, K O, and FeSO treatments on root mass, crown mass, and total plant 2 4
mass of an annual bluegrass putting green as determined by samples taken in 1999 and 2000. ........................................... 35
16. The effect of N, K O, and FeSO treatments on clipping nitrogen content of an annual bluegrass putting green from 2 4
12 Aug. 1998 to 26 Sept. 2000. ............................................................................................................................................... 37
17. The effect of N, K O, and FeSO treatments on clipping potassium content of an annual bluegrass putting green 2 4
from 12 Aug. 1998 to 26 Sept. 2000. ...................................................................................................................................... 39
18. The effect of N, K O, and FeSO treatments on clipping phosphorus content of an annual bluegrass putting green 2 4
from 12 Aug. 1998 to 26 Sept. 2000. ...................................................................................................................................... 41
19. The effect of N, K O, and FeSO treatments on clipping iron content of an annual bluegrass putting green from 12 2 4
Aug. 1998 to 26 Sept. 2000. .................................................................................................................................................... 43
20. The effect of N, K O, and FeSO treatments on soil salinity and fertility as determined by samples taken 7 May 2 4
1999. ......................................................................................................................................................................................... 44
21. The effect of N, K O, and FeSO treatments on soil salinity and fertility as determined by samples taken 10 Sept. 2 4
1999. ......................................................................................................................................................................................... 45
22. The effect of N, K O, and FeSO treatments on soil salinity and fertility as determined by samples taken 5 May 2 4
2000. ......................................................................................................................................................................................... 46
23. The effect of N, K O, and FeSO treatments on soil salinity and fertility as determined by samples taken 8 Sept. 2 4
2000. ......................................................................................................................................................................................... 47
A-1. Analyses of irrigation water samples taken in 1999 and 2000 (see Table A-9 for analyses methodology details). .............. A2
A-2. Estimation of nitrogen applied to the research plot through the irrigation water over a 12-month period. .......................... A3
A-3. Monthly average concentrations of N at Industry Hills Golf Courses from May 2000 to Aug. 2001. .................................. A4
A-4. Monthly average concentrations of N at the San Jose Creek Water Reclamation Plant, East (SJC-WRP) from May 2000 to Aug. 2001. ........................................................................................................................................................... A4

iii
List of Tables (continued)
A-5. Annual average (January to December) concentrations of N at the San Jose Creek Water Reclamation Plant, East. .......................................................................................................................................................................................... A6
A-6. Overview of major activities for the annual bluegrass management study. ........................................................................... A7
A-7. Calendar of activities for the annual bluegrass management study. ....................................................................................... A8
A-8. Toro Research and Development Laboratory methods. .......................................................................................................... A13
A-9. DANR Analytical Laboratory soil, plant and water analyses methods. ................................................................................. A14
A-10. The effect of N, K O, and FeSO treatments on clipping carbon content of an annual bluegrass putting green 2 4
from 12 Aug. 1998 to 26 Sept. 2000. ..................................................................................................................................... A17
A-11. The effect of N, K O, and FeSO treatments on clipping sulfur content of an annual bluegrass putting green from 2 4
12 Aug. 1998 to 26 Sept. 2000. ............................................................................................................................................... A18
A-12. The effect of N, K O, and FeSO treatments on clipping calcium content of an annual bluegrass putting green 2 4
from 12 Aug. 1998 to 26 Sept. 2000. ..................................................................................................................................... A19
A-13. The effect of N, K O, and FeSO treatments on clipping magnesium content of an annual bluegrass putting green2 4
from 12 Aug. 1998 to 26 Sept. 2000. ..................................................................................................................................... A20
A-14. The effect of N, K O, and FeSO treatments on clipping manganese content of an annual bluegrass putting green2 4
from 12 Aug. 1998 to 26 Sept. 2000. ..................................................................................................................................... A21
A-15. The effect of N, K O, and FeSO treatments on clipping boron content of an annual bluegrass putting green from2 4
12 Aug. 1998 to 26 Sept. 2000. ............................................................................................................................................... A22
A-16. The effect of N, K O, and FeSO treatments on clipping copper content of an annual bluegrass putting green2 4
from 12 Aug. 1998 to 26 Sept. 2000. ..................................................................................................................................... A23
A-17. The effect of N, K O, and FeSO treatments on clipping zinc content of an annual bluegrass putting green from 2 4
12 Aug. 1998 to 26 Sept. 2000. .............................................................................................................................................. A24
A-18. The effect of N, K O, and FeSO treatments on clipping molybdenum content of an annual bluegrass putting 2 4
green from 12 Aug. 1998 to 26 Sept. 2000. ........................................................................................................................... A25
A-19. The effect of N, K O, and FeSO treatments on clipping sodium content of an annual bluegrass putting green 2 4
from 12 Aug. 1998 to 26 Sept. 2000. ..................................................................................................................................... A26
A-20. The effect of N, K O, and FeSO treatments on clipping aluminum content of an annual bluegrass putting green 2 4
from 12 Aug. 1998 to 26 Sept. 2000. ...................................................................................................................................... A27
A-21. The effect of N, K O, and FeSO treatments on clipping titanium content of an annual bluegrass putting green2 4
from 12 Aug. 1998 to 26 Sept. 2000. ..................................................................................................................................... A28

iv
List of Figures
1. Plot plan for the annual bluegrass management study. ........................................................................................................... 8
2a. Weekly mean warm [1200 HR to 1600 HR (12 noon to 4 p.m.)] and cool [0200 HR to 0600 HR (2 a.m. to 6 a.m.)] airtemperatures [at a 1.8-m (6-ft) height] on-site at Industry Hills Golf Courses, Industry, Calif., from 7 June 1998 to23 Sept. 2000. ........................................................................................................................................................................... 19
2b. Weekly mean warm [1200 HR to 1600 HR (12 noon to 4 p.m.)] and cool [0200 HR to 0600 HR (2 a.m. to 6 a.m.)] soil temperatures [at a 5.1-cm (2-inch) height] on-site at Industry Hills Golf Courses, Industry, Calif., from 7 June 1998 to 23 Sept. 2000. .............................................................................................................................................................. 19
3. The effect of N treatments on visual turfgrass quality (1 to 9 scale, with 1=worst, 5=minimally acceptable, and 9=best quality putting green) of an annual bluegrass putting green from 12 Aug. 1998 to 18 Aug. 2000. .............................. 20
4. The effect of N and Fe treatments on visual turfgrass color (1 to 9 scale, with 1=brown, 5=minimally acceptable, and 9=darkest green) of an annual bluegrass putting green from 12 Aug. 1998 to 5 Sept. 2000. ......................................... 23
5. The effect of N treatments on percent coverage of seedheads of an annual bluegrass putting green from 2 Mar. 1999to 19 Sept. 2000. ....................................................................................................................................................................... 25
6. The effect of N treatments on percent coverage of mottling/patchiness of an annual bluegrass putting green from 6 July 1999 to 19 Sept. 2000. ...................................................................................................................................................... 27
7. The effect of N and water injection cultivation treatments on percent coverage of leaf wilting and rolling of an annual bluegrass putting green in 1999 and 2000. .................................................................................................................. 29
8. The effect of N treatments on clipping yields [g dry clippings/2.0 m² (22.0 ft²) per 1 d] of an annual bluegrass putting green from 21 Dec. 1998 to 26 July 2000. .................................................................................................................. 31
9. The effect of N treatments on shoot number (shoots per 14.2 cm²) and root mass density (mg·cm ) in the 1.3- to -3
8.9-cm (0.5- to 3.5-inch) deep root zone of an annual bluegrass putting green in 1999 and 2000. ....................................... 33
10. The effect of N treatments on total nitrogen content of clippings of an annual bluegrass putting green from 12 Aug.1998 to 26 Sept. 2000. ............................................................................................................................................................. 36
11. The effect of N and K treatments on total potassium content of clippings of an annual bluegrass putting green from 12 Aug. 1998 to 26 Sept. 2000. .............................................................................................................................................. 38
12. The effect of N treatments on total phosphorus content of clippings of an annual bluegrass putting green from 12 Aug. 1998 to 26 Sept. 2000. ................................................................................................................................................... 40
13. The effect of N and Fe treatments on total iron content of clippings of an annual bluegrass putting green from 12 Aug. 1998 to 26 Sept. 2000. ................................................................................................................................................... 42
A-1. Concentrations of total N from Industry Hills Golf Courses from May 2000 to Aug. 2001 and San Jose Creek Water Reclamation Plant, East from Oct. 1997 to Aug. 2001. .............................................................................................. A5

v
AcknowledgmentThanks are given to the CGCSA and GCSAA forfunding this project. Thanks are given to Industry HillsGolf Courses for the use of a practice putting green andinvaluable assistance with the research project. Thanksalso are given to The Toro Company for providinglaboratory analyses of clipping tissues. Also, thanks aregiven to Western Farm Service for providing all liquidfertilizers.

1
Executive SummaryMost golf course superintendents in California are managing annual bluegrass as their putting greenturfgrass. The major reason for this norm is the relatively mild climate of the region which usually results innewly established creeping bentgrass putting greens converting to annual bluegrass putting greens in 5 to7 years. An exception to this rule is the more inland, hotter locations, such as Palm Springs, wherebermudagrass and, less frequently, creeping bentgrass putting greens are maintained.
The major problems of managing annual bluegrass putting greens include: summer decline, which includesseveral issues, such as high temperature stress, disease activity, and salinity stress; seedhead production,especially in the spring; and puffiness during the growing season (October to December and February toJune). We investigated fertility and water injection cultivation (WIC) treatments to improve plantperformance and soil conditions during the warm season. However, it is possible that these treatments alsomay influence important plant characteristics during the cool season.
The objectives of this study were: 1) to determine the influence of the annual nitrogen and potassium fertilityprograms and foliar iron applications on plant performance [visual estimates of turfgrass quality and color,plant stress (e.g. mottling/patchiness and leaf wilting and rolling), disease activity, scalping, and seedheadcoverage; root mass density, crown mass, and shoot density counts from plant cores; clipping yield; andconcentrations of key nutrients in clipping tissue and soil]; 2) to determine the influence of WIC treatmentsduring the warm season on plant performance; 3) to determine the influence of the fertility and WICtreatments on plant performance during the cool season; and 4) to determine fertility treatment effects onkey nutrients in clipping tissue once every 6 weeks, utilizing both standard laboratory and near infraredreflectance spectroscopy (NIRS) methodologies. It should be noted that target ranges for elements in theclipping tissue of annual bluegrass basically have not been reported.
The location of this study was at Industry Hills Golf Courses, City of Industry, California, on an annualbluegrass practice putting green constructed to USGA specifications in 1978. The climate of this location,like much of southern California, is Mediterranean. Visual estimates indicated that the putting green wasapproximately 80% annual bluegrass and 20% creeping bentgrass. Results from a soil test taken on 3 June1998, prior to the application of fertility treatments, showed: pH=6.7; EC =1.07 dS·m (685 ppm totale
-1
dissolved salts); SAR=2; ESP=2%; Fe=78.9 ppm; CEC=12.0 meq/100 g; OM=3.21%; Olsen-P=45.5ppm; exchangeable K, Ca, Mg, Na=39, 1443, 170 and 115 ppm, respectively; and 88%, 10%, and 2%sand, silt, clay, respectively. The putting green was irrigated with effluent water with 1999 to 2000 averagevalues as follows: pH=7.2; EC=1.01 dS·m (646 ppm total dissolved salts); and SAR=3.2. The effluent-1
irrigation annually supplied N at the approximate rate of 1.0 lb/1000 ft .2
Eight liquid-applied fertility treatments and two summer-applied WIC treatments were arranged in a strip-plot design with four blocks (replications). Two nitrogen, two potassium, and two iron levels werefactorially arranged into eight fertility treatments and were randomly assigned to 5.5- x 12.0-ft main plotsthat were within each 44.0- x 12.0-ft block. The fertility treatments are shown in a table below. The twoWIC treatments were: a Toro HydroJect operated in the raised position once every 3 to 4 weeks fromApril through October and no WIC treatment. There were a total of 64, 5.5- x 6.0-ft subplots in this study.

2
Eight liquid-applied fertility treatments were tested in the annual bluegrass putting green management study.Fertility treatments were applied once every 3 weeks.
Treatment designation lb/1000 ft per year2
N K O Fe N P O K O2z
2 5 2
High High + 10.0 3.0 12.0
High High – 10.0 3.0 12.0
High Low + 10.0 3.0 4.0
High Low – 10.0 3.0 4.0
Low High + 5.0 3.0 12.0
Low High – 5.0 3.0 12.0
Low Low + 5.0 3.0 4.0
Low Low – 5.0 3.0 4.0Fe only applied to treatments indicated with “+” at 2.0 oz/1000 ft FeSO applied foliarly every 3 weeks.z 2
4
Measurements that were collected during the study included: visual turfgrass quality and color ratings;Minolta spectrophotometer readings; elemental analyses of clippings; clipping yield; irrigation wateranalyses; soil elemental analyses; shoot density, crown mass, and root mass density from plant cores; andon-site air and soil temperatures. Visual estimates of turfgrass plant stress (e.g. coverage ofmottling/patchiness and leaf wilting and rolling), disease activity coverage, seedhead coverage, and scalpingcoverage were taken on an as-needed basis. The purpose of these measurements was to help adequatelydescribe plant and soil status and plant and soil responses to treatments and other effects, such astemperatures and turfgrass management practices. The practice putting green was managed in a similarmanner as the greens on the golf course.
In terms of the results of this study, it should be noted that the Mediterranean climate of this region is veryconducive to the growth of annual bluegrass, resulting in it being more competitive than creeping bentgrasson putting greens. A second point that should be made is that the practice putting green was irrigated witheffluent. This resulted in the constant spoon-feeding of numerous plant nutrients, including N, P, K, Ca, Mg,and others. The approximate annual 889 mm (35 inches) of irrigation supplied N at the annual rate of 1.0lb/1000 ft . Thus, the high and low N treatment rates were actually 11.0 and 6.0 lb/1000 ft per year,2 2
respectively.
NitrogenThe high N treatment rate was excessive, resulting in plant stress compared to the low N treatment rate.The high N treatment rate had: a similar overall average visual turfgrass quality rating (6.1 on a 1 to 9 scale)with lower ratings during late spring and summer; a higher overall average visual turfgrass color rating (6.8on a 1 to 9 scale); an overall average of 106% more seedhead coverage; an overall average of 313% more

3
mottling/patchiness coverage (an indicator of plant stress, characterized by areas of turfgrass with a lightergreen visual leaf color, lower visual shoot density, and greater vertical leaf extension rate); an overallaverage of 273% more leaf wilting and rolling coverage; an overall average of 55% more clipping yield;an overall average of 37% less root mass density of the 0.5- to 3.5-inch root zone; and an overall averageof 17% less crown and plant mass.
The low N treatment rate may be close to the optimal N fertilizer rate for annual bluegrass. This is basedon visual turfgrass quality (an overall average rating of 6.2) and color (an overall average rating of 6.3) andtotal N content of clippings. Both N treatments were basically within or higher than the target range of 4.5%to 6.0% total N in clippings of creeping bentgrass. The N rate of 6.0 lb/1000 ft per year may need to be2
adjusted for other golf courses, depending on numerous conditions, such as: soil type, quality of irrigationwater, infiltration rates, salinity and leaching requirements, climate, amount of rainfall, rounds of golf, Napplication schedule and N source, and Fe applications. Lastly, there is a need to define the minimal annualN fertilizer rate for annual bluegrass.
IronThe foliar application of Fe as FeSO at the rate of 2.0 oz/1000 ft per 3 weeks increased visual turfgrass4
2
color ratings (plots treated with Fe had an overall average visual turfgrass color rating of 6.7 while plotsnot treated had a rating of 6.4) and total Fe content of clippings (however, both Fe treatments werebasically within the target range of 100 to 300 ppm total Fe in clippings of creeping bentgrass). An Feapplication once every 2 weeks would provide additional color improvement because our observationsindicated that the turfgrass color response to FeSO lasts for about 2 weeks. It is not unreasonable to4
believe that, in terms of visual turfgrass color, the amount of N fertilization may be reduced when asuccessful Fe fertilization program is used. This assumes that necessary growth is maintained.
PotassiumOther than total K content in clippings, we observed no difference between the high and low K treatmentsfor all plant measurements. The high K O rate was 12.0 lb/1000 ft per year while the low K O rate was2 2
2
4.0 lb/1000 ft per year. Our plant data were in spite of the fact that the low K treatment resulted in2
relatively low exchangeable K levels in the soil (overall average exchangeable K levels in the soil during1999 and 2000 were 106.4 and 66.2 ppm for high and low K treatments, respectively). It should be notedthat the effluent irrigation annually applied K at the approximate rate of 2.8 lb/1000 ft . Both K treatments2
were basically within or higher than the target range of 2.2% to 2.6% total K in clippings of creepingbentgrass. These data most likely support the approximate ratio of 3N:2 to 3 K O for a fertilizer schedule2
of a sand-based annual bluegrass putting green. Additional amounts of K above this ratio probably do notenhance the stress resistance of annual bluegrass.

4
Water injection cultivation during the summerThe summer WIC treatment significantly reduced leaf wilting and rolling during two of four rating dates.However, WIC treatments basically did not affect root mass density. Stated in the positive, WIC summertreatments neither harmed nor enhanced root mass density. This is notable because in a previous study onthe same practice putting green, WIC treatments during the summer significantly increased field infiltrationrates and lowered soil EC compared to check plots; also, root mass density was neither harmed nore
enhanced by WIC treatments.

5
Introduction
Most golf course superintendents in California are managing annual bluegrass as their putting greenturfgrass. The major reason for this norm is the relatively mild climate of the region which usually results innewly established creeping bentgrass putting greens converting to annual bluegrass putting greens in 5 to7 years. An exception to this rule is the more inland, hotter locations, such as Palm Springs, wherebermudagrass and, less frequently, creeping bentgrass putting greens are maintained.
The major problems of managing annual bluegrass putting greens include: summer decline, which includesseveral issues, such as high temperature stress, disease activity, and salinity stress; seedhead production,especially in the spring; and puffiness during the growing season (October to December and February toJune). We investigated fertility and water injection cultivation (WIC) treatments to improve plantperformance and soil conditions during the warm season. However, it is possible that these treatments alsomay influence important plant characteristics during the cool season.
Objectives
1. To determine the influence of the annual nitrogen and potassium fertility programs and foliar ironapplications on plant performance [visual estimates of turfgrass quality and color, plant stress (e.g.mottling/patchiness and leaf wilting and rolling), disease activity, scalping, and seedhead coverage; rootmass density, crown mass, and shoot density counts from plant cores; clipping yield; and concentrationsof key nutrients in clipping tissue and soil]. Plant performance during the warm season was of specialinterest.
2. To determine the influence of WIC treatments during the warm season on plant performance (visualestimates of turfgrass quality and color, plant stress, disease activity, scalping, and seedhead coverage;root mass density, crown mass, and shoot density counts from plant cores).
3. To determine the influence of the fertility and WIC treatments on important plant characteristics (visualestimates of turfgrass quality, color, seedhead coverage, and disease activity; clipping yield; andconcentrations of key nutrients in clipping tissue) during the cool season.
4. To determine fertility treatment effects on key nutrients in clipping tissue once every 6 weeks, utilizingboth standard laboratory and near infrared reflectance spectroscopy (NIRS) methodologies. It shouldbe noted that target ranges for elements in the clipping tissue of annual bluegrass basically have notbeen reported.

6
Location of Project
The location of this study was at Industry Hills Golf Courses, City of Industry, California, on an annualbluegrass practice putting green constructed to USGA specifications in 1978. The climate of this location,like much of southern California, is Mediterranean. Visual estimates indicated that the putting green wasapproximately 80% annual bluegrass and 20% creeping bentgrass. Results from a soil test taken on 3 June1998, prior to the application of fertility treatments, showed: pH=6.7; EC =1.07 dS·m (685 ppm totale
-1
dissolved salts); SAR=2; ESP=2%; Fe=78.9 ppm; CEC=12.0 meq/100 g; OM=3.21%; Olsen-P=45.5ppm; exchangeable K, Ca, Mg, Na=39, 1443, 170 and 115 ppm, respectively; and 88%, 10%, and 2%sand, silt, clay, respectively. The putting green was irrigated with effluent water with 1999 to 2000 averagevalues as follows: pH=7.2; EC=1.01 dS·m (646 ppm total dissolved salts); and SAR=3.2 (Table A-1).-1
The effluent irrigation annually supplied N at the approximate rate of 48.8 kg·ha (1.0 lb/1000 ft ) (Fig.-1 2
A-1, Tables A-2 to A-5).
Methods for Treatments
Eight liquid-applied fertility treatments and two WIC treatments were arranged in a strip-plot design withfour blocks (replications). Two nitrogen, two potassium, and two iron levels were factorially arranged intoeight fertility treatments and were randomly assigned to 1.7- x 3.7-m (5.5- x 12.0-ft) main plots that werewithin each 13.4- x 3.7-m (44.0- x 12.0-ft) block. Two WIC treatments were stripped across the fertilitymain plots and formed subplots. There were a total of 64, 1.7- x 1.8-m (5.5- x 6.0-ft) subplots in thisstudy. More details concerning these treatments can be seen in Tables 1 to 3 and Figure 1. Tables A-6 andA-7 show when treatments were applied during the study.
Table 1. Eight liquid-applied fertility treatments tested in the annual bluegrass putting green managementstudy.
Treatment designation kg·ha per year (lb/1000 ft per year)-1 2
N K O Fe N P O K O2z
2 5 2
High High + 487.9 (10.0) 146.4 (3.0) 585.5 (12.0)
High High – 487.9 (10.0) 146.4 (3.0) 585.5 (12.0)
High Low + 487.9 (10.0) 146.4 (3.0) 195.2 (4.0)
High Low – 487.9 (10.0) 146.4 (3.0) 195.2 (4.0)
Low High + 244.0 (5.0) 146.4 (3.0) 585.5 (12.0)
Low High – 244.0 (5.0) 146.4 (3.0) 585.5 (12.0)
Low Low + 244.0 (5.0) 146.4 (3.0) 195.2 (4.0)
Low Low – 244.0 (5.0) 146.4 (3.0) 195.2 (4.0)Fe only applied to treatments indicated with “+” at 6.1 kg·ha (2.0 oz/1000 ft ) FeSO applied foliarly every 3 weeks.z -1 2
4
Fe treatments were individually applied to each plot, utilizing a CO sprayer mounted on a cart, and not watered in.2
Finish spray volume was 855.3 L·ha (2.1 gal/1000 ft ).-1 2

7
Methods for Treatments
Table 2. N, P O , and K O application schedule for the annual bluegrass putting green management study.2 5 2
Fertilizer Annual6 27 17 10 31 21 12 2 23 14 4 25 15 6 27 17 8 22component totalJan. Jan. Feb. Mar. Mar. Apr. May June June July Aug. Aug. Sept. Oct. Oct. Nov. Dec. Dec.
Application date
------------------------------------------------------------------------------ kg·ha (lb/1000 ft ) --------------------------------------------------------------------------------1 2
N 24.4 29.3 36.6 36.6 36.6 36.6 26.8 19.5 14.6 14.6 14.6 14.6 14.6 41.5 36.6 36.6 29.3 24.4 487.9 (high rate) (.50) (.60) (.75) (.75) (.75) (.75) (.55) (.40) (.30) (.30) (.30) (.30) (.30) (.85) (.75) (.75) (.60) (.50) (10.0)
N 6.1 9.8 9.8 23.2 14.6 14.6 14.6 9.8 9.8 9.8 9.8 9.8 9.8 34.2 19.5 19.5 19.5 244.0(low rate) (.125) (.20) (.20) (.475) (.30) (.30) (.30) (.20) (.20) (.20) (.20) (.20) (.20) (.70) (.40) (.40) (.40) (5.0)
–
P O – – – – – – – – – – – –2 524.4 24.4 24.4 24.4 24.4 24.4 146.4(.50) (.50) (.50) (.50) (.50) (.50) (3.0)
K O 48.8 48.8 48.8 48.8 48.8 48.8 48.8 36.6 14.6 14.6 14.6 14.6 14.6 39.0 36.6 34.2 24.4 585.52
(high rate) (1.0) (1.0) (1.0) (1.0) (1.0) (1.0) (1.0) (.75) (.30) (.30) (.30) (.30) (.30) (.80) (.75) (.70) (.50) (12.0)–
K O 36.6 36.6 36.6 31.7 14.6 9.8 9.8 9.8 9.8 195.22
(low rate) (.75) (.75) (.75) (.65) (.30) (.20) (.20) (.20) (.20) (4.0)– – – – – – – – –
Note: N sources were ammonium nitrate [20-0-0; 1.27 kg·L (10.55 lb/gal)] for December, January, and February; ammonium sulfate [8-0-0-9S; 1.23 kg·L-1 -1
(10.22 lb/gal)] for March and April; and low biuret urea [20-0-0; 1.12 kg·L (9.35 lb/gal)] from May through November. P source was ammonium-1
polyphosphate [10-34-0; 1.38 kg·L (11.5 lb/gal)]. K source was potassium sulfate ESP-K [1-0-8-2.5S; 1.17 kg·L (9.7 lb/gal)]. Finish spray volume for-1 -1
each treatment application was 855.3 L·ha (2.1 gal/1000 ft ). All treatments were applied with a CO sprayer mounted on a cart. N, P O , and K O treatments-1 22 2 5 2
were watered in.
Table 3. Water injection cultivation treatments for the annual bluegrass putting green managementstudy.
Treatment level Treatment specifications
Cultivation Equipment: Toro HydroJect 3000; #53 nozzles, 11 operating.
Settings: Run in the raised (transport) position; set to second greatesthole density.
Result: Hole spacing approximately 7.6 x 7.6 cm (3.0 x 3.0 inch).
Holes created by the WIC treatment were ≈3 (0.1 inch)diameter x 108 mm (4.3 inches) deep. They also had a surfaceentry [≈9 mm (0.4 inch)] that was wider than the hole.
Frequency: Once every 3 to 4 weeks from April through October .z
No cultivation No WIC treatment.
Cultivation treatments applied as follows: in 1998, once every 4 weeks from June through October; in 1999, once every 3 weeks from May throughz
October; and in 2000, once every 3 weeks from April through September.

1A 1B 2A 2B 3A 3B 4A 4B
13.4
m (
44.0
ft)
I II III IV
1.7
m
(5.5
ft)
3
4
8
2
6
5
1
7
6
4
1
5
8
7
3
2
2
4
3
6
5
8
1
7
7
1
2
6
4
3
8
5
5A 5B 6A 6B 7A 7B 8A 8B
9A 9B 10A 10B 11A 11B 12A 12B
13A 13B 14A 14B 15A 15B 16A 16B
17A 17B 18A 18B 19A 19B 20A 20B
21A 21B 22A 22B 23A 23B 24A 24B
25A 25B 26A 26B 27A 27B 28A 28B
29A 29B 30A 30B 31A 31B 32A 32B
HydroJect
No HydroJect17.4 m (57 ft)
1.8 m(6 ft)
0.9 m(3 ft)
3.7 m (12 ft)
N9
8
Figure 1. Plot plan for the annual bluegrass management study.
kg·ha per year kg·ha per year-1
(lb/1000 ft per year) (lb/1000 ft per year)2
-1
2
Treatment designation Treatment designationN P O K O N P O K O2 5 2 2 5 2
1. High N/High K/+ Fe 487.9 (10.0) 146.4 (3.0) 585.5 (12.0) 5. Low N/High K/+ Fe 244.0 (5.0) 146.4 (3.0) 585.5 (12.0)2. High N/High K/– Fe 487.9 (10.0) 146.4 (3.0) 585.5 (12.0) 6. Low N/High K/– Fe 244.0 (5.0) 146.4 (3.0) 585.5 (12.0)3. High N/Low K/+ Fe 487.9 (10.0) 146.4 (3.0) 195.2 (4.0) 7. Low N/Low K/+ Fe 244.0 (5.0) 146.4 (3.0) 195.2 (4.0)4. High N/Low K/– Fe 487.9 (10.0) 146.4 (3.0) 195.2 (4.0) 8. Low N/Low K/– Fe 244.0 (5.0) 146.4 (3.0) 195.2 (4.0)
+ Fe =6.1 kg·ha (2 oz/1000 ft ) FeSO applied foliarly every 3 weeks.-1 24

9
Methods for Measurements
Measurements that were collected during the annual bluegrass putting green management study included:visual ratings; Minolta spectrophotometer readings; elemental analyses of clippings; clipping yield; irrigationwater analyses; soil elemental analyses; shoot density, crown mass, and root mass density from plant cores;and on-site air and soil temperatures. The purpose of these measurements was to help adequately describeplant and soil status and plant and soil responses to treatments and other effects, such as temperatures andturfgrass management practices. An approximate schedule for routine measurement collection during thestudy is show in Table 4 while a brief description of the methods for the measurements is shown in Table 5.Tables A-6 and A-7 show when measurements were taken during the study.
Table 4. Approximate schedule for routine measurement collection during the annual bluegrass management study.
Date color analyses
Visualestimates Plant
of turfgrass morph-quality and ological
Minolta spectro- Clipping Irrigation Soil
photometer elemental Clipping water elementalreadings analyses yield analyses analyses
19 Jan. * * *
2 Mar. * * *
23 Mar. * *
13 Apr. * * *
7 May * *
25 May * * *
6 July * * *
28 July * *
17 Aug. * * *
10 Sept. * *
28 Sept. * * *
9 Nov. * * *
21 Dec. * *
Note: Visual estimates of turfgrass plant stress (e.g. coverage of mottling/patchiness and leaf wilting and rolling), disease activity coverage, seedhead coverage,and scalping coverage were taken on an as-needed basis.

10
Methods for Measurements
Table 5. Brief description of the methods for the measurements taken during the annual bluegrass putting green management study.
1. Visual estimates of turfgrass putting green quality and color were taken every 6 weeks from subplots. Ratings were taken on a1 to 9 scale, with 9=best quality putting green or darkest green color, 5=minimally acceptable quality or color, and 1=worst qualityputting green or brown color. Starting 9 Feb. 2000, color ratings were normally taken every 3 weeks. Measurements were normallytaken 13 to 14 d after fertilizer treatment applications.
2. Spectrophotometer readings were taken with a Minolta CM-525i using L*a*b* color space. Measurements were taken once every6 weeks from main plots, three subsamples per main plot (one from each of the subplots and one between the two subplots).Starting 9 Feb. 2000, spectrophotometer readings were normally taken every 3 weeks. Measurements were normally taken 13 to14 d after fertilizer treatment application.
3. Visual estimates of percent coverage of mottling/patchiness, leaf wilting and rolling, disease activity, seedheads, and scalpingwere taken from subplots on an as-needed basis. Mottling/patchiness coverage was an indicator of plant stress and characterizedby areas of turfgrass with a lighter green visual leaf color, lower visual shoot density, and greater vertical leaf extension rate (datanot shown).
4. Elemental analyses of clippings were collected from main plots once every 6 weeks. Analyses were conducted by laboratorymethodology: total N, C, and S using the combustion gas analyzer method; total P, K, Ca, Mg, Na, Fe, Zn, Mn, Cu, B, Mo, Al,and Ti using the dry ashing, leachate, and inductively coupled Ar plasma (ICAP) emission spectrometry method (Table A-8).Samples were normally collected 13 to 14 d after fertilizer treatment applications.
5. Clipping yield of 1 d growth was collected from each main plot on 21 Dec. 1998; 23 Mar., 30 July, and 21 Dec. 1999; and 22 Mar.and 26 July 2000. Samples represented 66% of the total surface area of the main plots and were reported as g dry clippings/2.0m (22 ft ) per day. Samples were collected 13 to 16 d after fertilizer treatment application.2 2
6. Irrigation water samples were collected on the same dates as clipping yield. Frozen samples were sent to Division of Agricultureand Natural Resources (DANR) Analytical Laboratory and analyzed for pH, EC, Ca, Mg, Na, SAR, ESP, Cl, B, HCO , CO , SO -S,3 3 4
NH -N, NO -N, P, K-soluble, Cu, Fe, Mn, Se, and Zn (Table A-9). Irrigation water samples also were collected from May 2000 to4 3
Aug. 2001 and analyzed for ammonia N, organic N, nitrate N, and nitrite N at the laboratory of the San Jose Creek WaterReclamation Plant, East (Fig. A-1, Tables A-2 to A-5).
7. Analyses were made of the 1.3- to 8.9-cm (0.5- to 3.5-inch) root-zone soil for TKN; Olsen-P; exchangeable K; exchangeable Ca;exchangeable Mg; exchangeable Na; EC ; SAR; and soluble Ca, Mg, and Na (pH and CEC were included in analyses for 2000)e
(see Table A-9 for methodology details). Samples included 14 to 20, 2-cm diameter cores taken with Oakfield tubes collected fromeach main plot over three of the four replications. A grid was used to ensure that no portion of the plot was sampled more thanonce for the duration of the study. Sample dates were 7 May and 10 Sept. 1999; and 5 May and 8 Sept. 2000 (16 d after fertilizertreatment applications). Samples were sent to the DANR Analytical Laboratory for analyses.
8. Analyses of shoot density, crown mass, and root mass density [1.3- to 8.9 cm (0.5- to 3.5-inch root zone)] were made from five2-cm diameter cores taken with Oakfield tubes. Samples were collected from each subplot over three of the four replications. Agrid was used to ensure that no portion of the subplot was sampled more than once for the duration of the study. Samples werecollected on the same dates as soil analyses (16 d after fertilizer treatment applications). Samples analyzed at the UC RiversideTurfgrass Project laboratory facility.
9. On-site air and soil temperatures were taken hourly with Onset Stowaway XTI data microloggers and downloaded every 3 weeks.The air temperature sensor was located at a 1.83 m (6.0 ft) height within the canopy of a tree adjacent to the research plot, andwas protected from the direct light of the sun with a lamp-shade-shaped metal shield. The soil temperature sensor was installed5.1 cm (2.0 inches) below the soil surface of the research plot. These data were collected from 7 June 1998 to 23 Sept. 2000.

11
Methods for Plot Maintenance
The practice putting green was managed in a similar manner as the greens on the golf course. Table 6 shows the turfmanagement practices. Tables A-6 and A-7 also show when turf management practices occurred.
Table 6. Plot maintenance protocol for the annual bluegrass management study from June 1998 to Sept. 2000.
1. Depending on the season of the year, mowed at a 3.30- to 4.75-mm (0.130- to 0.187-inch) height of cut, four or more times perweek with a Jacobsen 56-cm (22-inch) walking greensmower or a Toro triplex mower (used on weekends, except prior totournaments).
2. Cultivation in October with 1.59-cm (0.625-inch) hollow tines (cores removed) followed by topdressing with sand with a TurfcoMetr-Matic at setting 4 (total sand applied = 1.25 hoppers of sand; total of 10 passes with topdresser). Plots also cultivated,according to protocol, with Toro HydroJect once every 4 weeks from June through Oct. 1998, once every 3 weeks from Maythrough Oct. 1999, and once every 3 weeks from Apr. through Sept. 2000.
3. Verticut [1.59-mm (0.063-inch) bench setting] and topdressed June, July, September, November, December, February, Marchand April. In 1998, verticut on 16 June, 29 June, 27 July, 8 Sept., 19 Nov., and 11 Dec. (with groomers); in 1999 on 2 Feb., 2 Mar.,29 Mar., 9 Apr., 4 May, 10 May, 1 June, 22 June, and 31 Aug.; and in 2000 on 4 Jan., 3 Feb., 7 Mar., 10 Apr., 26 Apr., 8 May, 6June, and 5 Sept.
4. Grooming as needed.
5. Light topdressing as needed. Applied Oct., Nov., Dec. 1998; Feb., Mar., May, July, Aug., Oct. 1999; and Jan., Feb., Mar., May,June, July, and Sept. 2000.
6. Insecticides and herbicides applied as needed (from June 1998 to Sept. 2000); fungicides applied to prevent moderate to severedisease activity. Applications were made to control cutworms (Dursban or Scimitar); to prevent anthracnose (Banner or acombination of Heritage and Daconil); to control cool-season brown patch (combination of Prostar and Banner); to preventdollar spot (Heritage or Heritage in combination with Curalain or Fore); to control dollar spot (Chipco, Daconil, or Eagle); tocontrol pink snow mold [Terraclor (PCNB)]; to prevent summer patch (Banner, Heritage, or Heritage in combination withCuralain, Daconil or Fore); and crabgrass preemergence (Betasan 4E).
7. Plots irrigated for optimum growth and playability.
8. Plots syringed and hand-watered to prevent drought symptoms, as needed.
9. Plots leached with 39 to 78 mm (1.5 to 3.0 inches) of water the last Sunday of each summer month, or as needed. Leachingoccurred in June, July, Sept. 1998; Feb., June, July, Aug., Sept. 1999; and May 2000 (a natural leaching occurred in Apr. 2000due to rainfall and leaching events scheduled for June and July 2000 were canceled due to high temperatures).

12
Results
In the results and discussion sections it will be assumed that effluent irrigation annually supplied N at the rate of 48.8kg·ha (1.0 lb/1000 ft ) (Fig. A-1, Tables A-2 to A-5). Thus, the high and low N fertility treatments rates were-1 2
actually 536.7 and 292.8 kg·ha (11.0 and 6.0 lb/1000 ft ) per year, respectively.-1 2
Visual turfgrass qualityConsidering all the treatments, basically only N significantly affected visual turfgrass quality ratings (Fig. 3, Tables 7and 8). One notable exception was that the overall Fe effect was significant. The additional N from the high Ntreatment did not improve visual turfgrass quality and in fact decreased it, especially during late spring and summer.Ratings for the high N treatment ranged from 5.0 to 7.2 with lower ratings during late spring and summer. Ratings forthe low N treatment ranged from 5.7 to 7.0. Under the conditions of this study and in terms of visual turfgrass quality,the high N rate [536.7 kg·ha (11.0 lb/1000 ft ) per year] was excessive and the low N rate [292.8 kg·ha (6.0-1 2 -1
lb/1000 ft ) per year] was sufficient to optimal.2
Visual turfgrass colorNitrogen and iron were the only treatments to significantly affect visual turfgrass color ratings (Fig. 4, Tables 8 and 9).Treatment with the high N rate and application of Fe [FeSO at 6.1 kg·ha (2.0 oz/1000 ft ) per 3 weeks] resulted4
-1 2
in higher color ratings. Ratings for the high N treatment ranged from 5.8 to 7.9 while ratings for the low N treatmentranged from 5.6 to 7.5. The high N treatment effect was associated with the cool season when more N fertilizer wasapplied (Table 2). This was especially evident during the winter and early spring. Visual turfgrass color ratings for plotstreated with Fe ranged from 5.9 to 7.9 while ratings for plots not treated with Fe ranged from 5.8 to 7.5. The Fetreatment effect was more evident during 1998 and 1999 than during 2000.
Seedhead coverageNitrogen was the only treatment to significantly effect percent coverage of seedheads (Fig. 5, Tables 8 and 10).Considering the overall percent seedhead coverage (Table 8), plots receiving the high N treatment had an average of106% more seedhead coverage than plots receiving the low N treatment. This was calculated as follows:[(observation–control)/control] x 100, where the low N treatment was considered the control. Plots receiving the highN treatment ranged from 4% to 66% seedhead coverage while plots receiving the low N treatment ranged from 3%to 45%. Seedhead coverage appeared to be highest during the spring and fall.
Increased seedhead production can be associated with undesirable growing conditions and plant stress. Consideringother significant effects associated with the high N treatment (reduced visual turfgrass quality, increasedmottling/patchiness, increased leaf wilting and rolling, increased clipping yield, and reduced root and crown mass), theincreased seedhead coverage was most likely due to plant stress induced by excessive N fertilization.

13
Mottling/patchiness coverageMottling/patchiness coverage was an indicator of plant stress and characterized by areas of turfgrass with lighter greenvisual leaf color, lower visual shoot density, and greater vertical leaf extension rate (data not shown). Basically, onlyN treatments significantly affected percent coverage of mottling/patchiness (Fig. 6, Table 11). Plots receiving the highN treatment had an overall average 313% more mottling/patchiness coverage than plots receiving the low N treatment.Plots receiving the high N treatment ranged from 15% to 80% coverage of mottling/patchiness while plots receivingthe low N treatment ranged from 4% to 40%. Mottling/patchiness appeared to be most prominent during late springand summer.
Coverage of disease activity, leaf wilting and rolling, and scalpingBasically, only N and WIC treatments significantly affected percent coverage of leaf wilting and rolling (Fig. 7, Table12). Plots receiving the high N treatment had an overall average 273% more leaf wilting and rolling coverage than plotsreceiving the low N treatment. Plots receiving the high N treatment ranged from 27% to 56% coverage of leaf wiltingand rolling while plots receiving the low N treatment ranged from 6% to 26%.
On two of the four rating dates the cultivation effect was significant. Plots which were cultivated by WIC had an overallaverage 21% less percent coverage of leaf wilting and rolling. Plots cultivated by WIC ranged from 14% to 33%coverage of leaf wilting and rolling while plots which were not cultivated by WIC ranged from 19% to 49%.
Only N treatments significantly affected percent coverage of cool-season brown patch (Table 12). Plots receiving thehigh N treatment had lower cool-season brown patch coverage than plots receiving the low N treatment. Plotsreceiving the high N treatment ranged from 0.8% to 1.4% coverage of cool-season brown patch while plots receivingthe low N treatment had 2.9%. Cool-season brown patch only occurred during the spring and summer of 1999.
Only N treatments significantly affected percent coverage of scalping (Table 12). Plots receiving the high N treatmenthad an overall average 267% more scalping coverage than plots receiving the low N treatment. Plots receiving the highN treatment ranged from 3% to 15% coverage of scalping while plots receiving the low N treatment ranged from 0%to 6%. Scalping only occurred during the summer of 2000.
Clipping yieldNitrogen was the only treatment to significantly affect clipping yield (Fig. 8, Table 13). Since data were collected frommain plots, the cultivation effect could not be tested. Plots receiving the high N treatment had an overall average 55%more clipping yield than plots receiving the low N treatment. Clipping yield for plots receiving the high N treatmentranged from 1.53 to 19.61 g/2.0 m per 1 d while clipping yield for plots receiving the low N treatment ranged from2
0.83 to 17.34 g/2.0 m per 1 d. It should be noted that sample date had a much greater effect on clipping yield than2
N treatments. Clipping yield was highest in July and lowest in December. Differences in air and soil temperatures (Fig.2) coupled with a Mediterranean climate versus differences in N applications (Tables 2 and A-2) most likely were thecause for clipping yield differences between sample dates. Mowing height ranged from 3.30 to 3.96 mm (0.130 to0.156 inch) during the collection of clipping yield (Table A-6) and was most likely not a major factor contributing toclipping yield differences among sample dates.
Shoot number; root mass density; root, crown, and total plant massIt should be noted that these data were taken from cores that were collected in early May and September. Nitrogen,

14
K, Fe, and cultivation treatments basically did not affect shoot number (Fig. 9, Table 14).
Nitrogen was basically the only treatment to significantly affect root mass density and root mass (Fig. 9, Tables 14 and15). Plots treated with the high N treatment had an overall average 37% less root mass density and root mass thanplots treated with the low N treatment. Root mass density for plots receiving the high N treatment ranged from 0.039to 0.130 mg·cm while root mass density for plots receiving the low N treatment ranged from 0.048 to 0.329 mg·cm .-3 -3
It should be noted that there was a dramatic decrease in root mass density from May to September 1999 for both Ntreatments. The May 1999 sample date was the highest among all 1999 and 2000 sample dates for root mass density.
Nitrogen was basically the only treatment to significantly affect crown mass and total plant mass (Table 15). Plotstreated with the high N treatment had an overall average 17% less crown and plant mass. Crown mass for plotsreceiving the high N treatment ranged from 0.5122 to 0.6843 g/14.2 cm while plots receiving the low N treatment2
ranged from 0.6164 to 0.8323 g/14.2 cm . Total plant mass for plots receiving the high N treatment ranged from2
0.5190 to 0.6885 g while plots receiving the low N treatment ranged from 0.6250 to 0.8422 g.
Total N content of clippingsNitrogen was basically the only treatment to significantly affect total N content of clippings (Fig. 10, Table 16). Sinceclippings were collected from main plots, the cultivation effect could not be tested. Plots receiving the high N treatmenthad a higher total N content of clippings than plots receiving the low N treatment. Plots treated with the high Ntreatment ranged from 4.50% to 6.96% total N while plots treated with the low N treatment ranged from 4.24% to5.81%. Total N content of clippings appeared to be highest during the winter and lowest during late spring and earlysummer. Both N treatments were basically within or higher than the target range of 4.5% to 6.0% total N in clippingsof creeping bentgrass.
Total K content of clippingsNitrogen and K were basically the only treatments to significantly affect total K content of clippings (Fig. 11, Table17). Plots receiving the high N or high K treatments had a higher total K content of clippings than plots receiving thelow N or K treatments, respectively. Plots treated with the high N treatment ranged from 2.20% to 3.91% total Kwhile plots receiving the low N treatment ranged from 2.18% to 3.84%. Plots treated with the high K treatment [585.5kg·ha (12.0 lb/1000 ft ) K O per year] ranged from 2.22% to 3.89% total K while plots receiving the low K-1 2
2
treatment [195.2 kg·ha (4.0 lb/1000 ft ) K O per year] ranged from 2.16% to 3.86%. The high N treatment resulted-1 22
in significantly higher total K content of clippings during November, January, and July during 1998 to 2000. The highK treatment resulted in significantly higher total K content of clippings basically during January to May. All N and Ktreatments were basically within or higher than the target range of 2.2% to 2.6% total K in clippings of creepingbentgrass.
Total P content of clippingsAll treatments received the same amount of P [146.4 kg·ha (3.0 lb/1000 ft ) P O per year] (Tables 1 and 2).-1 2
2 5
However, N treatments significantly affected total P content of clippings (Fig. 12 and Table 18). There was not a cleartrend of one N treatment having a higher total P content of clippings than the other. Plots treated with the high Ntreatment ranged from 0.39% to 0.66% total P while plots receiving the low N treatment ranged from 0.43% to0.62%. Both N treatments were basically within the target range of 0.3% to 0.6% total P in clippings for creepingbentgrass.

15
Total Fe content of clippingsNitrogen and Fe were the only treatments to significantly affect total Fe content of clippings (Fig. 13, Table 19). Plotswhich received the high N treatment or were treated with Fe [6.1 kg·ha (2.0 oz/1000 ft ) FeSO per 3 weeks] had-1 2
4
a higher total Fe content of clippings than plots which received the low N treatment or were not treated with Fe,respectively. Plots treated with the high N treatment ranged from 97 to 234 ppm total Fe while plots receiving the lowN treatment ranged from 91 to 214 ppm. Plots treated with Fe ranged from 97 to 253 ppm total Fe while plots nottreated with Fe ranged from 90 to 221 ppm. The high N treatment resulted in significantly higher total Fe content ofclippings during the spring and summer while the application of Fe resulted in significantly higher total Fe content ofclippings during all seasons of the year. All N and Fe treatments were basically within the target range of 100 to 300ppm total Fe in clippings of creeping bentgrass.
Total C, S, Ca, Mg, Mn, B, Cu, Zn, Mo, Na, Al, and Ti content of clippingsThough these elements were not directly related to the objectives of this study, they were analyzed and are reportedin Tables A-10 to A-21. Nitrogen, K, and Fe treatments significantly affected the clipping concentration of a numberof these elements. It is possible that these data will be reported in a technical paper.
Determination of key nutrients in clipping tissue utilizing near infrared reflectance spectroscopy (NIRS)and Minolta spectrophotometer readingsCurrently, the Toro Company has determined that NIRS is reliable for N clipping content but not for P and K. Theyare in the process of trying to improve the prediction equations for P and K. Thus, the NIRS objective of this studywas not feasible.
Though the Minolta spectrophotometer readings were collected, they were not reported because these readings werepart of the NIRS objective.
Soil and water test resultsSoil in the 1.3- to 8.9-cm (0.5- to 3.5-inch) deep root zone was sampled during the early part of May and Septemberduring 1999 and 2000 (Tables 20 to 23). The May and September sample dates were chosen to bracket the summerand to determine the effects of the relatively heavy fertilizer schedule during the fall through spring versus the relativelylight fertilizer schedule during the summer (Table 2).
In terms of consistent effects of treatments, the high K treatment resulted in significantly higher levels of exchangeableK on three of four sample dates. The high K treatment had significantly higher soil exchangeable K than the low Ktreatment in both May sample dates. This shows that exchangeable K was built up in the soil following the heavyfertilization schedule from the fall through spring.
The following is a list of selected overall average soil salinity and fertility levels. Table A-9 describes soil analysesmethodologies:
EC 1.59 dS·m Low total salinitye-1
SAR 3.4 No Na-induced permeability problems
ESP (%) 3 No Na-induced permeability problems
Olsen-P 58.5 ppm High P sufficiency level

16
Exchangeable KHigh K treatment 106.4 ppm Moderate K sufficiency levelLow K treatment 66.2 ppm Low K sufficiency level
Exchangeable Ca 1572.1 ppm High Ca sufficiency level
Exchangeable Mg 197.1 ppm Sufficient Mg sufficiency level
Exchangeable Na 174.3 ppm Very low Na level
pH 6.7 Desirable pH
CEC 22.1 meq/100 g Desirable CEC
Table A-1 shows the results of the irrigation water analyses and Table A-2 shows that approximately 889 mm (35inches) of irrigation water was applied annually on the putting green. The following is a list of several nutrients and Nathat are annually applied through the irrigation water:
P 4.9 kg·ha (0.1 lb/1000 ft )-1 2
K 136.6 kg·ha (2.8 lb/1000 ft )-1 2
Ca 487.9 kg·ha (10.0 lb/1000 ft )-1 2
Mg 165.9 kg·ha (3.4 lb/1000 ft )-1 2
Na 1014.8 kg·ha (20.8 lb/1000 ft )-1 2

17
Discussion
This study tested spray-applied N, K, and Fe, and WIC treatments on an annual bluegrass practice putting greenwhich was constructed to USGA specifications in 1978. The practice putting green was located on a golf course insouthern California. It should be noted that the Mediterranean climate of this region is very conducive to the growthof annual bluegrass, resulting in it being more competitive than creeping bentgrass on putting greens. A second pointthat should be made is that the practice putting green was irrigated with effluent. This resulted in the constant spoon-feeding of numerous plant nutrients, including N, P, K, Ca, Mg, and others. The approximate annual 889 mm (35inches) of irrigation supplied N at the annual rate of 48.8 kg·ha (1.0 lb/1000 ft ). Thus, the high and low N treatment-1 2
rates were actually 536.7 and 292.8 kg·ha (11.0 and 6.0 lb/1000 ft ) per year, respectively.-1 2
NitrogenThe high N treatment rate was excessive, resulting in plant stress compared to the low N treatment rate. The high Ntreatment rate had: a similar overall average visual turfgrass quality rating (6.1 on a 1 to 9 scale) with lower ratingsduring late spring and summer; a higher overall average visual turfgrass color rating (6.8 on a 1 to 9 scale); an overallaverage of 106% more seedhead coverage; an overall average of 313% more mottling/patchiness coverage (anindicator of plant stress, characterized by areas of turfgrass with a lighter green visual leaf color, lower visual shootdensity, and greater vertical leaf extension rate); an overall average of 273% more leaf wilting and rolling coverage;an overall average of 55% more clipping yield; an overall average of 37% less root mass density of the 1.3- to 8.9-cm(0.5- to 3.5-inch) root zone; and an overall average of 17% less crown and plant mass.
The low N treatment rate may be close to the optimal N fertilizer rate for annual bluegrass. This is based on visualturfgrass quality (an overall average rating of 6.2) and color (an overall average rating of 6.3) and total N content ofclippings. Both N treatments were basically within or higher than the target range of 4.5% to 6.0% total N in clippingsof creeping bentgrass. The N rate of 292.8 kg·ha (6.0 lb/1000 ft ) per year may need to be adjusted for other golf-1 2
courses, depending on numerous conditions, such as: soil type, quality of irrigation water, infiltration rates, salinity andleaching requirements, climate, amount of rainfall, rounds of golf, N application schedule and N source, and Feapplications. Lastly, there is a need to define the minimal annual N fertilizer rate for annual bluegrass.
IronThe foliar application of Fe as FeSO at the rate of 6.1 kg·ha (2.0 oz/1000 ft ) per 3 weeks increased visual turfgrass4
-1 2
color ratings (plots treated with Fe had an overall average visual turfgrass color rating of 6.7 while plots not treatedhad a rating of 6.4) and total Fe content of clippings (however, both Fe treatments were basically within the targetrange of 100 to 300 ppm total Fe in clippings of creeping bentgrass). An Fe application once every 2 weeks wouldprovide additional color improvement because our observations indicated that the turfgrass color response to FeSO4
lasts for about 2 weeks. It is not unreasonable to believe that, in terms of visual turfgrass color, the amount of Nfertilization may be reduced when a successful Fe fertilization program is used. This assumes that necessary growthis maintained.
PotassiumOther than total K content in clippings, we observed no difference between the high and low K treatments for all plantmeasurements. The high K O rate was 585.5 kg·ha (12.0 lb/1000 ft ) per year while the low K O rate was 195.22 2
-1 2
kg·ha (4.0 lb/1000 ft ) per year. Our plant data were in spite of the fact that the low K treatment resulted in relatively-1 2

18
low exchangeable K levels in the soil (overall average exchangeable K levels in the soil during 1999 and 2000 were106.4 and 66.2 ppm for high and low K treatments, respectively). It should be noted that the effluent irrigation annuallyapplied K at the approximate rate of 136.6 kg·ha (2.8 lb/1000 ft ). Both K treatments were basically within or higher-1 2
than the target range of 2.2% to 2.6% total K in clippings of creeping bentgrass. These data most likely support theapproximate ratio of 3N:2 to 3 K O for a fertilizer schedule of a sand-based annual bluegrass putting green. Additional2
amounts of K above this ratio probably do not enhance the stress resistance of annual bluegrass.
Water injection cultivation during the summerThe summer WIC treatment significantly reduced leaf wilting and rolling during two of four rating dates. However, WICtreatments basically did not affect root mass density. Stated in the positive, WIC summer treatments neither harmednor enhanced root mass density. This is notable because in a previous study on the same practice putting green, WICtreatments during the summer significantly increased field infiltration rates and lowered soil EC compared to checke
plots; also, root mass density was neither harmed nor enhanced by WIC treatments.

Figure 2a. Weekly mean warm [1200 HR to 1600 HR (12 noon to 4 p.m.)] and cool [0200 HR to 0600 HR (2 a.m. to 6 a.m.)] air temperatures [at a 1.8-m (6-ft)height] on-site at Industry Hills Golf Courses, Industry, Calif., from 7 June 1998 to 23 Sept. 2000.
Figure 2b. Weekly mean warm [1200 HR to 1600 HR (12 noon to 4 p.m.)] and cool [0200 HR to 0600 HR (2 a.m. to 6 a.m.)] soil temperatures [at a 5.1-cm (2-inch)depth] on-site at Industry Hills Golf Courses, Industry, Calif., from 7 June 1998 to 23 Sept. 2000.
19
0
5
10
15
20
25
30
35
407-
Jun-
98
5-Ju
l-98
2-A
ug-9
8
30-A
ug-9
8
27-S
ep-9
8
25-O
ct-9
8
22-N
ov-9
8
20-D
ec-9
8
17-J
an-9
9
14-F
eb-9
9
14-M
ar-9
9
11-A
pr-9
9
9-M
ay-9
9
6-Ju
n-99
4-Ju
l-99
1-A
ug-9
9
29-A
ug-9
9
26-S
ep-9
9
24-O
ct-9
9
21-N
ov-9
9
19-D
ec-9
9
16-J
an-0
0
13-F
eb-0
0
12-M
ar-0
0
9-A
pr-0
0
7-M
ay-0
0
4-Ju
n-00
2-Ju
l-00
30-J
ul-0
0
27-A
ug-0
0
24-S
ep-0
0
Date
Tem
per
atu
re (
ºC) Warm Cool
0
5
10
15
20
25
30
35
40
7-Ju
n-98
5-Ju
l-98
2-A
ug-9
8
30-A
ug-9
8
27-S
ep-9
8
25-O
ct-9
8
22-N
ov-9
8
20-D
ec-9
8
17-J
an-9
9
14-F
eb-9
9
14-M
ar-9
9
11-A
pr-9
9
9-M
ay-9
9
6-Ju
n-99
4-Ju
l-99
1-A
ug-9
9
29-A
ug-9
9
26-S
ep-9
9
24-O
ct-9
9
21-N
ov-9
9
19-D
ec-9
9
16-J
an-0
0
13-F
eb-0
0
12-M
ar-0
0
9-A
pr-0
0
7-M
ay-0
0
4-Ju
n-00
2-Ju
l-00
30-J
ul-0
0
27-A
ug-0
0
24-S
ep-0
0
Date
Tem
per
atu
re (
ºC)
Warm Cool
Tem
peratu
re (ºF)
104
95
86
77
68
59
50
41
32
Tem
peratu
re (ºF)
104
95
86
77
68
59
50
41
32

Note: Mean comparisons conducted by a Fishers protected LSD test.
20
Note: K, Fe, and culitvation treatments basically did not affect visual turfgrass quality; Fe had aminimal effect.
Figure 3. The effect of N treatments on visual turfgrass quality (1 to 9 scale, with 1=worst,5=minimally acceptable, and 9=best quality putting green) of an annual bluegrass putting green from12 Aug. 1998 to 18 Aug. 2000.
1
2
3
4
5
6
7
8
9
4-A
ug-9
8
13-O
ct-9
8
22-D
ec-9
8
2-M
ar-9
9
11-M
ay-9
9
20-J
ul-9
9
28-S
ep-9
9
7-D
ec-9
9
15-F
eb-0
0
25-A
pr-0
0
4-Ju
l-00
Date
Vis
ual
tu
rfg
rass
qu
alit
y
487.9 kg/ha (10.0 lb/1000 ft²) N/yr
244.0 kg/ha (5.0 lb/1000 ft²) N/yr
(NS)(NS) (0.2) (0.1) (0.2) (0.2) (0.1) (0.2) (0.3) (NS)(LSD, P =0.05)
(0.1) (0.2) (0.2) (NS)

21
Table 7. The effect of water injection cultivation, N, K O, and FeSO treatments on visual turfgrass putting green quality (1 to 9 scale, with 1=worst, 5=minimally acceptable, and2 4
9=best quality putting green) of an annual bluegrass putting green from 12 Aug. 1998 to 18 Aug. 2000.
Visual turfgrass quality
Treatments 1998 1998 1999 1999 1999 1999 1999 1999 2000 2000 2000 2000 2000 2000
Date
12 Aug. 22 Dec. 19 Jan. 2 Mar. 28 May 6 July 17 Aug. 28 Sept. 18 Jan. 29 Feb. 11 Apr. 23 May 5 July 18 Aug.
Cultivation level treatmentsz
No cultivation 7.0 7.0 6.4 6.5 5.3 6.4 6.3 5.5 6.8 6.0 6.1 5.5 5.9 5.8y
With cultivation 7.2 7.0 6.4 6.5 5.4 6.4 6.3 5.5 6.8 6.0 6.1 5.3 5.9 5.7LSD, P=0.05 .NS NS NS NS NS NS NS NS NS NS NS NS NS
N-fertility rate treatmentsx
487.9 kg·ha (10.0 lb/1000 ft ) N/yr 7.2 7.0 7.0 7.0 5.0 5.9 6.1 5.0 7.2 6.1 6.0 5.1 5.7 5.7-1 2
244.0 kg·ha (5.0 lb/1000 ft ) N/yr 7.0 7.0 5.9 6.0 5.8 6.9 6.5 6.0 6.4 6.0 6.2 5.7 6.1 5.8-1 2
LSD, P=0.05 . 0.2 0.1 0.2 0.2 0.1 0.2 0.3 0.1 0.2 0.2NS NS NS
K O-fertility rate treatments2x
585.5 kg·ha (12.0 lb/1000 ft ) K O/yr 7.2 7.0 6.4 6.4 5.4 6.4 6.4 5.5 6.6 6.0 6.1 5.5 5.9 5.8-1 22
195.2 kg·ha (4.0 lb/1000 ft ) K O/yr 7.0 7.0 6.5 6.5 5.4 6.4 6.2 5.4 6.9 6.0 6.1 5.3 5.9 5.7-1 22
LSD, P=0.05 . 0.2NS NS NS NS NS NS NS NS NS NS NS NS
FeSO level treatments4w
With FeSO 7.2 7.0 6.5 6.5 5.4 6.5 6.4 5.5 7.2 6.0 6.1 5.5 5.9 5.84
No FeSO 7.0 7.0 6.3 6.5 5.3 6.3 6.3 5.5 6.3 6.0 6.1 5.3 5.9 5.74
LSD, P=0.05 . 0.2 0.3NS NS NS NS NS NS NS NS NS NS NS
Summary of ANOVA effectsv
Nitrogen (N) . *** *** *** *** *** *** *** *** *** ***NS NS NS
Potassium (K) . *NS NS NS NS NS NS NS NS NS NS NS NS
N x K .NS NS NS NS NS NS NS NS NS NS NS NS NS
Iron (Fe) . * ***NS NS NS NS NS NS NS NS NS NS NS
N x Fe . *NS NS NS NS NS NS NS NS NS NS NS NS
K x Fe . * **NS NS NS NS NS NS NS NS NS NS NS
N x K x Fe . **NS * NS NS NS NS NS NS NS NS NS NS
Cultivation (C) .NS NS NS NS NS NS NS NS NS NS NS NS NS
C x N . *NS NS NS NS NS NS NS NS NS NS NS NS
C x K .NS NS NS NS NS NS NS NS NS NS NS NS NS
C x N x K .NS NS NS NS NS NS NS NS NS NS NS NS NS
C x Fe .NS NS NS NS NS NS NS NS NS NS NS NS NS
C x N x Fe .NS NS NS NS NS NS NS NS NS NS NS NS NS
C x K x Fe .NS NS NS NS NS NS NS NS NS NS NS NS NS
C x N x K x Fe .NS NS NS NS NS NS NS NS NS NS NS NS NS
Cultivation with Toro HydroJect 3000, #53 nozzles (11 operating), run in the raised (transport) position and set to second greatest hole density. In 1998, applied once every 4 weeks from June through October; in 1999, applied oncez
every 3 weeks from May through October; and in 2000, applied once every 3 weeks from April through September.Mean separation with Fisher’s Protected LSD test.y
N-P O -K O fertility treatments applied foliarly to each main plot every 3 weeks, utilizing a CO sprayer mounted on a cart, and watered in [finish spray volume 855.3 L·ha (2.1 gal/1000 ft )]. N and K O applied at specified annualx -1 22 5 2 2 2
rates. P O applied at 146.4 kg·ha (3.0 lb P O /1000 ft ) per year. See Table 2 for more details.2 5 2 5-1 2
Fe applied foliarly to each main plot every 3 weeks, at 6.1 kg·ha FeSO (2.0 oz/1000 ft FeSO ) per application, utilizing a CO sprayer mounted on a cart, immediately after N- P O -K O fertility treatments, and not wateredw -1 24 4 2 2 5 2
in [finish spray volume 855.3 L·ha (2.1 gal/1000 ft )]-1 2
Strip-plot design: N, K, Fe treatments were the main plot factor (2x2x2 factorial) and cultivation treatments were the subplot factor.v
Nonsignificant or significant at P ≤ 0.05, 0.01, 0.001, respectively.NS, *, **, ***

22
Table 8. The effect of water injection cultivation, N, K O, and FeSO treatments on overall visual turfgrass putting green quality (12 4
to 9 scale, with 1=worst, 5=minimally acceptable, and 9=best quality putting green), overall visual turfgrass color (1 to 9 scale, with1=brown, 5=minimally acceptable, and 9=darkest green), and overall percent coverage of seedheads of an annual bluegrass puttinggreen from 1998 to 2000.
Treatments Overall visual turfgrass quality Overall visual turfgrass color Overall seedhead coverage (%)
Cultivation level treatmentsz
No cultivation 6.2 6.5 24y
With cultivation 6.2 6.5 25LSD, P=0.05 NS NS NS
N-fertility rate treatmentsx
487.9 kg·ha (10.0 lb/1000 ft ) N/yr 6.1 6.8 33-1 2
244.0 kg·ha (5.0 lb/1000 ft ) N/yr 6.2 6.3 16-1 2
LSD, P=0.05 0.04 0.1 4
K O-fertility rate treatments2x
585.5 kg·ha (12.0 lb/1000 ft ) K O/yr 6.2 6.5 24-1 22
195.2 kg·ha (4.0 lb/1000 ft ) K O/yr 6.2 6.6 25-1 22
LSD, P=0.05 NS NS NS
FeSO level treatments4w
With FeSO 6.2 6.7 234
No FeSO 6.1 6.4 264
LSD, P=0.05 0.04 0.1 NS
Summary of ANOVA effectsv
Nitrogen (N) *** *** ***Potassium (K) NS NS NS
N x K NS NS NS
Iron (Fe) *** *** NS
N x Fe * NS NS
K x Fe *NS NS
N x K x Fe NS NS NS
Cultivation (C) NS NS NS
C x N NS NS NS
C x K NS NS NS
C x N x K NS NS NS
C x Fe * NS NS
C x N x Fe NS NS NS
C x K x Fe * NS NS
C x N x K x Fe NS NS NS
Date (D) *** *** ***C x D * NS NS
N x D *** *** ***K x D * NS NS
N x K x D *NS NS
Fe x D *** *** NS
N x Fe x D NS NS NS
K x Fe x D *NS NS
N x K x Fe x D NS NS NS
C x N x D * * NS
C x K x D NS NS NS
C x N x K x D * *NS
C x Fe x D NS NS NS
C x N x Fe x D NS NS NS
C x K x Fe x D NS NS NS
C x N x K x Fe x D NS NS NS
Cultivation with Toro HydroJect 3000, #53 nozzles (11 operating), run in the raised (transport) position and set to second greatest hole density. In 1998, applied oncez
every 4 weeks from June through October; in 1999, applied once every 3 weeks from May through October; and in 2000, applied once every 3 weeks from April through September.
Mean separation with Fisher’s Protected LSD test.y
N-P O -K O fertility treatments applied foliarly to each main plot every 3 weeks, utilizing a CO sprayer mounted on a cart, and watered in [finish spray volume 855.3x2 5 2 2
L·ha (2.1 gal/1000 ft )]. N and K O applied at specified annual rates. P O applied at 146.4 kg·ha (3.0 lb P O /1000 ft ) per year. See Table 2 for more details.-1 2 -1 22 2 5 2 5
Fe applied foliarly to each main plot every 3 weeks, at 6.1 kg·ha FeSO (2.0 oz/1000 ft FeSO ) per application, utilizing a CO sprayer mounted on a cart, immediatelyw -1 24 4 2
after N- P O -K O fertility treatments, and not watered in [finish spray volume 855.3 L·ha (2.1 gal/1000 ft )].2 5 2-1 2
Overall ANOVA via repeated measures, with date as the repeated measures factor [by date analyses via strip-plot design: N, K, Fe treatments were the main plot factorv
(2x2x2 factorial) and cultivation treatments were the subplot factor].
Nonsignificant or significant at P ≤ 0.05, 0.01, 0.001, respectively.NS, *, **, ***

Note: Mean comparisons conducted by a Fishers protected LSD test.
23
Figure 4. The effect of N and Fe treatments on visual turfgrass color (1 to 9 scale, with 1=brown,5=minimally acceptable, and 9=darkest green) of an annual bluegrass putting green from 12 Aug. 1998to 5 Sept. 2000.
Note: K and culitvation treatments did not affect visual turfgrass color.
1
2
3
4
5
6
7
8
9
4-A
ug-9
8
13-O
ct-9
8
22-D
ec-9
8
2-M
ar-9
9
11-M
ay-9
9
20-J
ul-9
9
28-S
ep-9
9
7-D
ec-9
9
15-F
eb-0
0
25-A
pr-0
0
4-Ju
l-00
12-S
ep-0
0
Date
Vis
ual
tu
rfg
rass
co
lor
487.9 kg/ha (10.0 lb/1000 ft²) N/yr
244.0 kg/ha (5.0 lb/1000 ft²) N/yr
1
2
3
4
5
6
7
8
9
4-A
ug-9
8
13-O
ct-9
8
22-D
ec-9
8
2-M
ar-9
9
11-M
ay-9
9
20-J
ul-9
9
28-S
ep-9
9
7-D
ec-9
9
15-F
eb-0
0
25-A
pr-0
0
4-Ju
l-00
12-S
ep-0
0
Date
Vis
ual
tu
rfg
rass
co
lor
6.4 L/ha (2.0 oz/1000 ft²) FeSO4/3 weeks
No FeSO4
(0.2)(0.4) (0.2) (0.2) (0.2) (0.2) (NS) (NS) (0.4) (0.2)(LSD, P =0.05)
(0.3) (0.3) (NS)(0.4)
(0.2)(0.4) (0.2) (0.2) (NS) (0.2) (0.1) (NS) (0.4) (NS)(LSD, P =0.05)
(NS) (NS) (NS)(NS)
(0.3)
(NS)
(0.1)
(NS)
(0.2)(0.2) (0.2)
(NS)(NS) (0.2)
(NS)(NS)
(NS)(NS)
(NS)
(NS)
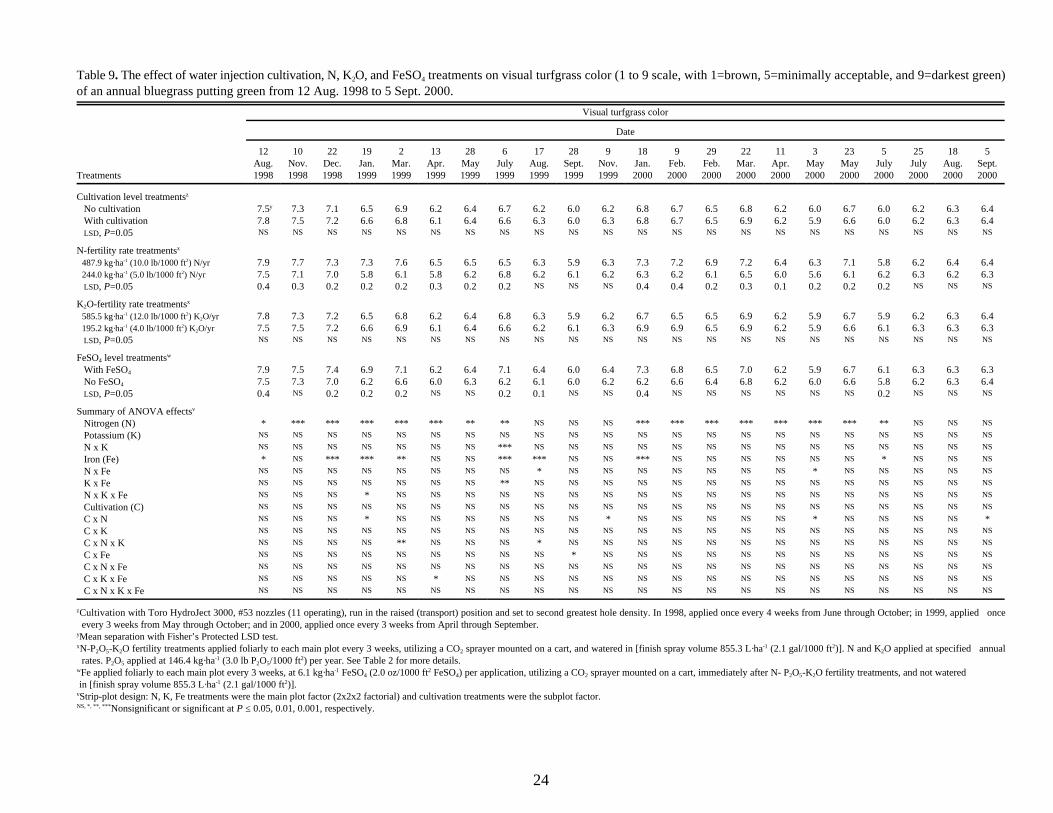
24
Table 9. The effect of water injection cultivation, N, K O, and FeSO treatments on visual turfgrass color (1 to 9 scale, with 1=brown, 5=minimally acceptable, and 9=darkest green)2 4
of an annual bluegrass putting green from 12 Aug. 1998 to 5 Sept. 2000.
Visual turfgrass color
Treatments 1998 1998 1998 1999 1999 1999 1999 1999 1999 1999 1999 2000 2000 2000 2000 2000 2000 2000 2000 2000 2000 2000
Date
12 10 22 19 2 13 28 6 17 28 9 18 9 29 22 11 3 23 5 25 18 5Aug. Nov. Dec. Jan. Mar. Apr. May July Aug. Sept. Nov. Jan. Feb. Feb. Mar. Apr. May May July July Aug. Sept.
Cultivation level treatmentsz
No cultivation 7.5 7.3 7.1 6.5 6.9 6.2 6.4 6.7 6.2 6.0 6.2 6.8 6.7 6.5 6.8 6.2 6.0 6.7 6.0 6.2 6.3 6.4y
With cultivation 7.8 7.5 7.2 6.6 6.8 6.1 6.4 6.6 6.3 6.0 6.3 6.8 6.7 6.5 6.9 6.2 5.9 6.6 6.0 6.2 6.3 6.4LSD, P=0.05 NS NS NS NS NS NS NS NS NS NS NS NS NS NS NS NS NS NS NS NS NS NS
N-fertility rate treatmentsx
487.9 kg·ha (10.0 lb/1000 ft ) N/yr 7.9 7.7 7.3 7.3 7.6 6.5 6.5 6.5 6.3 5.9 6.3 7.3 7.2 6.9 7.2 6.4 6.3 7.1 5.8 6.2 6.4 6.4-1 2
244.0 kg·ha (5.0 lb/1000 ft ) N/yr 7.5 7.1 7.0 5.8 6.1 5.8 6.2 6.8 6.2 6.1 6.2 6.3 6.2 6.1 6.5 6.0 5.6 6.1 6.2 6.3 6.2 6.3-1 2
LSD, P=0.05 0.4 0.3 0.2 0.2 0.2 0.3 0.2 0.2 0.4 0.4 0.2 0.3 0.1 0.2 0.2 0.2NS NS NS NS NS NS
K O-fertility rate treatments2x
585.5 kg·ha (12.0 lb/1000 ft ) K O/yr 7.8 7.3 7.2 6.5 6.8 6.2 6.4 6.8 6.3 5.9 6.2 6.7 6.5 6.5 6.9 6.2 5.9 6.7 5.9 6.2 6.3 6.4-1 22
195.2 kg·ha (4.0 lb/1000 ft ) K O/yr 7.5 7.5 7.2 6.6 6.9 6.1 6.4 6.6 6.2 6.1 6.3 6.9 6.9 6.5 6.9 6.2 5.9 6.6 6.1 6.3 6.3 6.3-1 22
LSD, P=0.05 NS NS NS NS NS NS NS NS NS NS NS NS NS NS NS NS NS NS NS NS NS NS
FeSO level treatments4w
With FeSO 7.9 7.5 7.4 6.9 7.1 6.2 6.4 7.1 6.4 6.0 6.4 7.3 6.8 6.5 7.0 6.2 5.9 6.7 6.1 6.3 6.3 6.34
No FeSO 7.5 7.3 7.0 6.2 6.6 6.0 6.3 6.2 6.1 6.0 6.2 6.2 6.6 6.4 6.8 6.2 6.0 6.6 5.8 6.2 6.3 6.44
LSD, P=0.05 0.4 0.2 0.2 0.2 0.2 0.1 0.4 0.2NS NS NS NS NS NS NS NS NS NS NS NS NS NS
Summary of ANOVA effectsv
Nitrogen (N) * *** *** *** *** *** ** ** *** *** *** *** *** *** *** **NS NS NS NS NS NS
Potassium (K) NS NS NS NS NS NS NS NS NS NS NS NS NS NS NS NS NS NS NS NS NS NS
N x K ***NS NS NS NS NS NS NS NS NS NS NS NS NS NS NS NS NS NS NS NS NS
Iron (Fe) * *** *** ** *** *** *** *NS NS NS NS NS NS NS NS NS NS NS NS NS NS
N x Fe * *NS NS NS NS NS NS NS NS NS NS NS NS NS NS NS NS NS NS NS NS
K x Fe **NS NS NS NS NS NS NS NS NS NS NS NS NS NS NS NS NS NS NS NS NS
N x K x Fe *NS NS NS NS NS NS NS NS NS NS NS NS NS NS NS NS NS NS NS NS NS
Cultivation (C) NS NS NS NS NS NS NS NS NS NS NS NS NS NS NS NS NS NS NS NS NS NS
C x N * * * *NS NS NS NS NS NS NS NS NS NS NS NS NS NS NS NS NS NS
C x K NS NS NS NS NS NS NS NS NS NS NS NS NS NS NS NS NS NS NS NS NS NS
C x N x K ** *NS NS NS NS NS NS NS NS NS NS NS NS NS NS NS NS NS NS NS NS
C x Fe *NS NS NS NS NS NS NS NS NS NS NS NS NS NS NS NS NS NS NS NS NS
C x N x Fe NS NS NS NS NS NS NS NS NS NS NS NS NS NS NS NS NS NS NS NS NS NS
C x K x Fe *NS NS NS NS NS NS NS NS NS NS NS NS NS NS NS NS NS NS NS NS NS
C x N x K x Fe NS NS NS NS NS NS NS NS NS NS NS NS NS NS NS NS NS NS NS NS NS NS
Cultivation with Toro HydroJect 3000, #53 nozzles (11 operating), run in the raised (transport) position and set to second greatest hole density. In 1998, applied once every 4 weeks from June through October; in 1999, applied oncez
every 3 weeks from May through October; and in 2000, applied once every 3 weeks from April through September.Mean separation with Fisher’s Protected LSD test.y
N-P O -K O fertility treatments applied foliarly to each main plot every 3 weeks, utilizing a CO sprayer mounted on a cart, and watered in [finish spray volume 855.3 L·ha (2.1 gal/1000 ft )]. N and K O applied at specified annualx -1 22 5 2 2 2
rates. P O applied at 146.4 kg·ha (3.0 lb P O /1000 ft ) per year. See Table 2 for more details.2 5 2 5-1 2
Fe applied foliarly to each main plot every 3 weeks, at 6.1 kg·ha FeSO (2.0 oz/1000 ft FeSO ) per application, utilizing a CO sprayer mounted on a cart, immediately after N- P O -K O fertility treatments, and not wateredw -1 24 4 2 2 5 2
in [finish spray volume 855.3 L·ha (2.1 gal/1000 ft )].-1 2
Strip-plot design: N, K, Fe treatments were the main plot factor (2x2x2 factorial) and cultivation treatments were the subplot factor.v
Nonsignificant or significant at P ≤ 0.05, 0.01, 0.001, respectively.NS, *, **, ***

Note: Mean comparisons conducted by a Fishers protected LSD test.
25
Note: K, Fe, and culitvation treatments basically did not affect percent coverage of seedheads.
Figure 5. The effect of N treatments on percent coverage of seedheads of an annual bluegrass puttinggreen from 2 Mar. 1999 to 19 Sept. 2000.
0102030405060708090
100
16-F
eb-9
9
27-A
pr-9
9
6-Ju
l-99
14-S
ep-9
9
23-N
ov-9
9
1-F
eb-0
0
11-A
pr-0
0
20-J
un-0
0
29-A
ug-0
0
Date
See
dh
ead
co
vera
ge
(%)
487.9 kg/ha (10.0 lb/1000 ft²) N/yr
244.0 kg/ha (5.0 lb/1000 ft²) N/yr
(9) (9) (6) (3) (5) (9) (8)(NS) (2)
(LSD, P =0.05)
(8) (13) (NS) (6) (9) (9)(10)

26
Table 10. The effect of water injection cultivation, N, K O, and FeSO treatments on percent coverage of seedheads of an annual bluegrass putting green from 2 Mar. 1999 to 192 4
Sept. 2000.
Seedhead coverage (%)
Treatments 1999 1999 1999 1999 1999 1999 1999 1999 2000 2000 2000 2000 2000 2000 2000 2000
Date
2 Mar. 31 Mar. 13 Apr. 28 May 6 July 17 Aug. 28 Sept. 9 Nov. 29 Feb. 22 Mar. 11 Apr. 3 May 23 May 5 July 18 Aug. 19 Sept.
Cultivation level treatmentsz
No cultivation 14 11 52 35 8 13 40 29 5 9 32 29 43 26 18 20y
With cultivation 15 11 59 36 10 14 39 27 5 12 31 28 43 27 15 23LSD, P=0.05 NS NS NS NS NS NS NS NS NS NS NS NS NS NS NS NS
N-fertility rate treatmentsx
487.9 kg·ha (10.0 lb/1000 ft ) N/yr 5 11 66 45 14 20 66 33 4 15 47 31 63 37 28 41-1 2
244.0 kg·ha (5.0 lb/1000 ft ) N/yr 25 11 45 26 4 7 14 23 6 6 16 27 22 15 5 3-1 2
LSD, P=0.05 9 9 6 3 5 9 8 2 8 13 6 9 10 9NS NS
K O-fertility rate treatments2x
585.5 kg·ha (12.0 lb/1000 ft ) K O/yr 14 10 50 33 9 13 39 29 5 9 34 28 42 27 19 21-1 22
195.2 kg·ha (4.0 lb/1000 ft ) K O/yr 15 12 61 38 9 14 41 27 5 12 30 29 44 26 14 22-1 22
LSD, P=0.05 9NS NS NS NS NS NS NS NS NS NS NS NS NS NS NS
FeSO level treatments4w
With FeSO 16 11 54 34 7 12 40 25 5 10 33 27 40 22 17 184
No FeSO 13 11 56 37 11 15 40 32 5 11 31 30 46 31 16 254
LSD, P=0.05 3NS NS NS NS NS NS NS NS NS NS NS NS NS NS NS
Summary of ANOVA effectsv
Nitrogen (N) *** *** *** *** *** *** * * * *** *** *** *** ***NS NS
Potassium (K) *NS NS NS NS NS NS NS NS NS NS NS NS NS NS NS
N x K *NS NS NS NS NS NS NS NS NS NS NS NS NS NS NS
Iron (Fe) **NS NS NS NS NS NS NS NS NS NS NS NS NS NS NS
N x Fe * * *NS NS NS NS NS NS NS NS NS NS NS NS NS
K x Fe *NS NS NS NS NS NS NS NS NS NS NS NS NS NS NS
N x K x Fe NS NS NS NS NS NS NS NS NS NS NS NS NS NS NS NS
Cultivation (C) NS NS NS NS NS NS NS NS NS NS NS NS NS NS NS NS
C x N *NS NS NS NS NS NS NS NS NS NS NS NS NS NS NS
C x K *NS NS NS NS NS NS NS NS NS NS NS NS NS NS NS
C x N x K * ** * *NS NS NS NS NS NS NS NS NS NS NS NS
C x Fe NS NS NS NS NS NS NS NS NS NS NS NS NS NS NS NS
C x N x Fe *NS NS NS NS NS NS NS NS NS NS NS NS NS NS NS
C x K x Fe *NS NS NS NS NS NS NS NS NS NS NS NS NS NS NS
C x N x K x Fe * NSNS NS NS NS NS NS NS NS NS NS NS NS NS NS
Cultivation with Toro HydroJect 3000, #53 nozzles (11 operating), run in the raised (transport) position and set to second greatest hole density. In 1998, applied once every 4 weeks from June through October; in 1999, applied oncez
every 3 weeks from May through October; and in 2000, applied once every 3 weeks from April through September.Mean separation with Fisher’s Protected LSD test.y
N-P O -K O fertility treatments applied foliarly to each main plot every 3 weeks, utilizing a CO sprayer mounted on a cart, and watered in [finish spray volume 855.3 L·ha (2.1 gal/1000 ft )]. N and K O applied at specified annualx -1 22 5 2 2 2
rates. P O applied at 146.4 kg·ha (3.0 lb P O /1000 ft ) per year. See Table 2 for more details.2 5 2 5-1 2
Fe applied foliarly to each main plot every 3 weeks, at 6.1 kg·ha FeSO (2.0 oz/1000 ft FeSO ) per application, utilizing a CO sprayer mounted on a cart, immediately after N- P O -K O fertility treatments, and not wateredw -1 24 4 2 2 5 2
in [finish spray volume 855.3 L·ha (2.1 gal/1000 ft )].-1 2
Strip-plot design: N, K, Fe treatments were the main plot factor (2x2x2 factorial) and cultivation treatments were the subplot factor.v
Nonsignificant or significant at P ≤ 0.05, 0.01, 0.001, respectively.NS, *, **, ***

Note: Mean comparisons conducted by a Fishers protected LSD test.
27
Note: K, Fe, and culitvation treatments basically did not affect percent coverage of mottling/patchiness.
Figure 6. The effect of N treatments on percent coverage of mottling/patchiness of an annual bluegrassputting green from 6 July 1999 to 19 Sept. 2000.
0
10
20
30
40
50
60
70
80
90
100
29-J
un-9
9
27-J
ul-9
9
24-A
ug-9
9
21-S
ep-9
9
19-O
ct-9
9
16-N
ov-9
9
14-D
ec-9
9
11-J
an-0
0
08-F
eb-0
0
07-M
ar-0
0
04-A
pr-0
0
02-M
ay-0
0
30-M
ay-0
0
27-J
un-0
0
25-J
ul-0
0
22-A
ug-0
0
19-S
ep-0
0
Date
Mo
ttlin
g/p
atch
ines
s co
vera
ge
(%)
487.9 kg/ha (10.0 lb/1000 ft²) N/yr 244.0 kg/ha (5.0 lb/1000 ft²) N/yr
(8) (NS)(12) (9)(LSD, P =0.05)
(18) (5) (11) (13) (13)(NS)
(14)

28
Table 11. The effect of water injection cultivation, N, K O, and FeSO treatments on percent coverage of mottling/patchiness of an annual bluegrass putting green from 6 July 19992 4
to 19 Sept. 2000.
Mottling/patchiness (% coverage)
Treatments 1999 1999 1999 1999 2000 2000 2000 2000 2000 2000 2000
Date
6 July 30 July 17 Aug. 12 Oct. 18 Jan. 23 May 5 July 19 July 9 Aug. 18 Aug. 19 Sept.
Cultivation level treatmentsz
No cultivation 17 16 12 54 12 40 21 33 35 40 39y
With cultivation 14 10 9 54 11 45 18 26 33 45 38LSD, P=0.05 NS NS NS NS NS NS NS NS NS NS NS
N-fertility rate treatmentsx
487.9 kg·ha (10.0 lb/1000 ft ) N/yr 24 21 15 80 19 72 33 52 57 46 59-1 2
244.0 kg·ha (5.0 lb/1000 ft ) N/yr 7 5 7 28 4 13 6 7 11 40 18-1 2
LSD, P=0.05 8 12 18 5 11 9 13 13 14NS NS
K O-fertility rate treatments2x
585.5 kg·ha (12.0 lb/1000 ft ) K O/yr 17 14 11 51 14 43 20 29 30 41 34-1 22
195.2 kg·ha (4.0 lb/1000 ft ) K O/yr 14 12 10 57 9 42 20 30 38 44 43-1 22
LSD, P=0.05 NS NS NS NS NS NS NS NS NS NS NS
FeSO level treatments4w
With FeSO 13 11 9 56 6 38 21 26 32 42 414
No FeSO 18 15 12 52 18 47 18 33 36 44 364
LSD, P=0.05 5NS NS NS NS NS NS NS NS NS NS
Summary of ANOVA effectsv
Nitrogen (N) *** ** *** *** *** *** *** *** ***NS NS
Potassium (K) NS NS NS NS NS NS NS NS NS NS NS
N x K **NS NS NS NS NS NS NS NS NS NS
Iron (Fe) ***NS NS NS NS NS NS NS NS NS NS
N x Fe *** *NS NS NS NS NS NS NS NS NS
K x Fe **NS NS NS NS NS NS NS NS NS NS
N x K x Fe ** *NS NS NS NS NS NS NS NS NS
Cultivation (C) NS NS NS NS NS NS NS NS NS NS NS
C x N NS NS NS NS NS NS NS NS NS NS NS
C x K NS NS NS NS NS NS NS NS NS NS NS
C x N x K * * *NS NS NS NS NS NS NS NS
C x Fe NS NS NS NS NS NS NS NS NS NS NS
C x N x Fe NS NS NS NS NS NS NS NS NS NS NS
C x K x Fe *NS NS NS NS NS NS NS NS NS NS
C x N x K x Fe * *NS NS NS NS NS NS NS NS NS
Cultivation with Toro HydroJect 3000, #53 nozzles (11 operating), run in the raised (transport) position and set to second greatest hole density. In 1998, applied once every 4 weeks from June through October; in 1999, applied oncez
every 3 weeks from May through October; and in 2000, applied once every 3 weeks from April through September.Mean separation with Fisher’s Protected LSD test.y
N-P O -K O fertility treatments applied foliarly to each main plot every 3 weeks, utilizing a CO sprayer mounted on a cart, and watered in [finish spray volume 855.3 L·ha (2.1 gal/1000 ft )]. N and K O applied at specified annualx -1 22 5 2 2 2
rates. P O applied at 146.4 kg·ha (3.0 lb P O /1000 ft ) per year. See Table 2 for more details.2 5 2 5-1 2
Fe applied foliarly to each main plot every 3 weeks, at 6.1 kg·ha FeSO (2.0 oz/1000 ft FeSO ) per application, utilizing a CO sprayer mounted on a cart, immediately after N- P O -K O fertility treatments, and not wateredw -1 24 4 2 2 5 2
in [finish spray volume 855.3 L·ha (2.1 gal/1000 ft )].-1 2
Strip-plot design: N, K, Fe treatments were the main plot factor (2x2x2 factorial) and cultivation treatments were the subplot factor.x
Nonsignificant or significant at P ≤ 0.05, 0.01, 0.001, respectively.NS, *, **, ***

Note: Mean comparisons conducted by a Fishers protected LSD test.
29
Note: K and Fe treatments did not affect percent coverage of leaf wilting and rolling.
Figure 7. The effect of N and water injection cultivation treatments on percent coverage of leaf wiltingand rolling of an annual bluegrass putting green in 1999 and 2000.
0
10
20
30
40
50
60
70
80
90
100
12-Oct-99 19-Jul-00 9-Aug-00 19-Sep-00Date
Lea
f w
iltin
g a
nd
ro
llin
g (
% c
ove
rag
e)
487.9 kg/ha (10.0 lb/1000 ft²) N/yr
244.0 kg/ha (5.0 lb/1000 ft²) N/yr
(LSD, P =0.05)
(15)
(16)
0
10
20
30
40
50
60
70
80
90
100
12-Oct-99 19-Jul-00 9-Aug-00 19-Sep-00Date
Lea
f w
iltin
g a
nd
ro
llin
g (
% c
ove
rag
e)
No WIC With WIC
(LSD, P =0.05)
(NS)
(14)
(2)
(8)
(10)
(NS)

30
Table 12. The effect of water injection cultivation, N, K O, and FeSO treatments on coverage of cool-season brown patch, leaf wilting and rolling, and scalping of an annual bluegrass2 4
putting green from 28 May 1999 to 26 Sept. 2000.
Cool-season brown patch Leaf wilting and rolling Scalping
Treatments 28 May 1999 30 July 1999 12 Oct. 1999 19 July 2000 9 Aug. 2000 19 Sept. 2000 5 July 2000 18 Aug. 2000 26 Sept. 2000
Date Date Date
--------------------------------------------------------------------------------------------------------------- % coverage ---------------------------------------------------------------------------------------------------------------
Cultivation level treatmentsz
No cultivation 2.2 0.8 19 49 23 23 3 6 7y
With cultivation 2.2 2.9 14 33 20 20 1 11 11LSD, P=0.05 14 2NS NS NS NS NS NS NS
N-fertility rate treatmentsx
487.9 kg·ha (10.0 lb/1000 ft ) N/yr 1.4 0.8 27 56 36 34 3 12 15-1 2
244.0 kg·ha (5.0 lb/1000 ft ) N/yr 2.9 2.9 6 26 8 9 0 6 3-1 2
LSD, P=0.05 1.0 15 16 8 10 2 8NS NS
K O-fertility rate treatments2x
585.5 kg·ha (12.0 lb/1000 ft ) K O/yr 2.0 2.6 14 43 19 17 2 7 9-1 22
195.2 kg·ha (4.0 lb/1000 ft ) K O/yr 2.4 1.1 19 39 25 26 1 11 9-1 22
LSD, P=0.05 NS NS NS NS NS NS NS NS NS
FeSO level treatments4w
With FeSO 2.2 1.2 19 45 21 24 3 11 114
No FeSO 2.1 2.5 14 37 22 18 1 7 74
LSD, P=0.05 NS NS NS NS NS NS NS NS NS
Summary of ANOVA effectsv
Nitrogen (N) ** ** *** *** *** ** **NS NS
Potassium (K) NS NS NS NS NS NS NS NS NS
N x K NS NS NS NS NS NS NS NS NS
Iron (Fe) NS NS NS NS NS NS NS NS NS
N x Fe NS NS NS NS NS NS NS NS NS
K x Fe * *NS NS NS NS NS NS NS
N x K x Fe *NS NS NS NS NS NS NS NS
Cultivation (C) * *NS NS NS NS NS NS NS
C x N NS NS NS NS NS NS NS NS NS
C x K NS NS NS NS NS NS NS NS NS
C x N x K NS NS NS NS NS NS NS NS NS
C x Fe NS NS NS NS NS NS NS NS NS
C x N x Fe NS NS NS NS NS NS NS NS NS
C x K x Fe NS NS NS NS NS NS NS NS NS
C x N x K x Fe NSNS NS NS NS NS NS NS NS
Cultivation with Toro HydroJect 3000, #53 nozzles (11 operating), run in the raised (transport) position and set to second greatest hole density. In 1998, applied once every 4 weeks from June through October; in 1999, applied once everyz
3 weeks from May through October; and in 2000, applied once every 3 weeks from April through September.Mean separation with Fisher’s Protected LSD test.y
N-P O -K O fertility treatments applied foliarly to each main plot every 3 weeks, utilizing a CO sprayer mounted on a cart, and watered in [finish spray volume 855.3 L·ha (2.1 gal/1000 ft )]. N and K O applied at specified annual rates. P Ox -1 22 5 2 2 2 2 5
applied at 146.4 kg·ha (3.0 lb P O /1000 ft ) per year. See Table 2 for more details.-1 22 5
Fe applied foliarly to each main plot every 3 weeks, at 6.1 kg·ha FeSO (2.0 oz/1000 ft FeSO ) per application, utilizing a CO sprayer mounted on a cart, immediately after N- P O -K O fertility treatments, and not wateredw -1 24 4 2 2 5 2
in [finish spray volume 855.3 L·ha (2.1 gal/1000 ft )].-1 2
Strip-plot design: N, K, Fe treatments were the main plot factor (2x2x2 factorial) and cultivation treatments were the subplot factor.x
Nonsignificant or significant at P ≤ 0.05, 0.01, 0.001, respectively.NS, *, **, ***

Note: Mean comparisons conducted by a Fishers protected LSD test.
31
Note: K and Fe treatments did not affect clipping yield. Since data were collected from main plots, thecultivation effect could not be tested.
Figure 8. The effect of N treatments on clipping yields [g dry clippings/2.0 m² (22.0 ft²) per 1 d] of an annual bluegrass putting green from 21 Dec. 1998 to 26 July 2000.
0
5
10
15
20
25
8-D
ec-9
8
5-Ja
n-99
2-F
eb-9
9
2-M
ar-9
9
30-M
ar-9
9
27-A
pr-9
9
25-M
ay-9
9
22-J
un-9
9
20-J
ul-9
9
17-A
ug-9
9
14-S
ep-9
9
12-O
ct-9
9
9-N
ov-9
9
7-D
ec-9
9
4-Ja
n-00
1-F
eb-0
0
29-F
eb-0
0
28-M
ar-0
0
25-A
pr-0
0
23-M
ay-0
0
20-J
un-0
0
18-J
ul-0
0
Date
Clip
pin
g y
ield
487.9 kg/ha (10.0 lb/1000 ft²) N/yr
244.0 kg/ha (5.0 lb/1000 ft²) N/yr
(0.16) (0.57) (0.52)
(LSD, P =0.05)
(0.84)
(NS)
(NS)

32
Table 13. The effect of N, K O, and FeSO treatments on clipping yield [g dry clippings/2.0 m (22.0 ft ) per 1 d] of an annual bluegrass putting green from 21 Dec. 1998 to 26 July 2000. 2 42 2
Clipping yieldz
Treatments 21 Dec. 1998 23 Mar. 1999 30 July 1999 21 Dec. 1999 22 Mar. 2000 26 July 2000
Date
N-fertility rate treatmentsy
487.9 kg·ha (10.0 lb/1000 ft ) N/yr 1.53 7.01 12.74 2.92 5.77 19.61-1 2 x
244.0 kg·ha (5.0 lb/1000 ft ) N/yr 0.83 3.49 12.04 1.63 3.93 17.34-1 2
LSD, P=0.05 0.16 0.57 0.52 0.84NS NS
K O-fertility rate treatments2y
585.5 kg·ha (12.0 lb/1000 ft ) K O/yr 1.19 5.16 12.31 2.27 4.99 18.55-1 22
195.2 kg·ha (4.0 lb/1000 ft ) K O/yr 1.13 5.33 12.45 2.28 4.71 18.39-1 22
LSD, P=0.05 NS NS NS NS NS NS
FeSO level treatments4w
With FeSO 1.13 5.35 13.14 2.46 4.94 18.344
No FeSO 1.18 5.14 11.66 2.09 4.76 18.604
LSD, P=0.05 NS NS NS NS NS NS
Summary of ANOVA effectsv
Nitrogen (N) *** *** *** ***NS NS
Potassium (K) NS NS NS NS NS NS
N x K NS NS NS NS NS NS
Iron (Fe) NS NS NS NS NS NS
N x Fe *NS NS NS NS NS
K x Fe * *NS NS NS NS
N x K x Fe NS NS NS NS NS NS
Clipping yield samples represent 66% of the total surface area of the main plot. Mowing height for 21 Dec. 1998, 23 Mar. 1999, and 30 July 1999 = 3.96 mm (0.156 inch ); 21 Dec. 1999 = 3.30 mm (0.130 inch); and 22 Mar. 2000 and 26z
July 2000 = 3.81 mm (0.150 inch).
N-P O -K O fertility treatments applied foliarly to each main plot every 3 weeks, utilizing a CO sprayer mounted on a cart, and watered in [finish spray volume 855.3 L·ha (2.1 gal/1000 ft )]. N and K O applied at specified annual rates. P Oy -1 22 5 2 2 2 2 5
applied at 146.4 kg·ha (3.0 lb P O /1000 ft ) per year. See Table 2 for more details.-1 22 5
Mean separation with Fisher’s Protected LSD test.x
Fe applied foliarly to each main plot every 3 weeks, at 6.1 kg·ha FeSO (2.0 oz/1000 ft FeSO ) per application, utilizing a CO sprayer mounted on a cart, immediately after N-P O -K O fertility treatments, and not watered w -1 24 4 2 2 5 2
in [finish spray volume 855.3 L·ha (2.1 gal/1000 ft )].-1 2
Randomized complete block design (RCB) with fertilizer treatments arranged in a 2x2x2 factorial arrangement.v
Nonsignificant or significant at P ≤ 0.05, 0.01, 0.001, respectively.NS, *, **, ***

33
Note: Mean comparisons conducted by a Fishers protected LSD test.
Note: N, K, Fe, and cultivation treatments basically did not affect shoot number; K, Fe, and cultivationtreatments basically did not affect root mass density.
Figure 9. The effect of N treatments on shoot number (shoots per 14.2 cm²) and root mass density
(mg�cm-3) in the 1.3- to 8.9-cm (0.5- to 3.5-inch) deep root zone of an annual bluegrass putting greenin 1999 and 2000.
0
100
200
300
400
500
600
700
7-May-99 10-Sep-99 5-May-00 8-Sep-00Date
Sh
oo
t n
um
ber
(sh
oo
ts p
er 1
4.2
cm²)
487.9 kg/ha (10.0 lb/1000 ft²) N/yr
244.0 kg/ha (5.0 lb/1000 ft²) N/yr
(LSD, P =0.05)
(NS)
(NS)
0.000
0.050
0.100
0.150
0.200
0.250
0.300
0.350
7-May-99 10-Sep-99 5-May-00 8-Sep-00
Date
Ro
ot
mas
s d
ensi
ty (
mg
�cm
-3)
487.9 kg/ha (10.0 lb/1000 ft²) N/yr
244.0 kg/ha (5.0 lb/1000 ft²) N/yr
(LSD, P =0.05)
(0.061)
(0.016)(0.044)
(NS)
(NS)(27)

34
Table 14. The effect of water injection cultivation, N, K O, and FeSO treatments on shoot number and root mass density of an annual bluegrass putting green as determined by samples2 4
taken in 1999 and 2000.
Shoot number (shoots per 14.2 cm ) Root mass density (mg·cm )2 -3
Treatments 1999 1999 2000 2000 1999 1999 2000 2000
Date Date
7 May 10 Sept. 5 May 8 Sept. 7 May 10 Sept. 5 May 8 Sept.
Cultivation level treatmentsz
No cultivation 456 542 551 492 0.234 0.070 0.044 0.046y y
With cultivation 459 522 532 489 0.225 0.073 0.086 0.046LSD, P=0.05 0.003NS NS NS NS NS NS NS
N-fertility rate treatmentsx
487.9 kg·ha (10.0 lb/1000 ft ) N/yr 463 517 548 459 0.130 0.063 0.039 0.044-1 2
244.0 kg·ha (5.0 lb/1000 ft ) N/yr 452 546 535 521 0.329 0.080 0.092 0.048-1 2
LSD, P=0.05 27 0.061 0.016 0.044NS NS NS NS
K O-fertility rate treatments2x
585.5 kg·ha (12.0 lb/1000 ft ) K O/yr 462 525 530 509 0.225 0.074 0.061 0.046-1 22
195.2 kg·ha (4.0 lb/1000 ft ) K O/yr 453 538 553 472 0.234 0.069 0.069 0.046-1 22
LSD, P=0.05 27NS NS NS NS NS NS NS
FeSO level treatments4w
With FeSO 450 545 538 469 0.226 0.065 0.064 0.0414
No FeSO 465 519 545 511 0.233 0.078 0.066 0.0514
LSD, P=0.05 27NS NS NS NS NS NS NS
Summary of ANOVA effectsv
Nitrogen (N) *** *** * *NS NS NS NS
Potassium (K) **NS NS NS NS NS NS NS
N x K * NS NS NS NS NS NS NS
Iron (Fe) **NS NS NS NS NS NS NS
N x Fe NS NS NS NS NS NS NS NS
K x Fe NS NS NS NS NS NS NS NS
N x K x Fe NS NS NS NS NS NS NS NS
Cultivation (C) *NS NS NS NS NS NS NS
C x N NS NS NS NS NS NS NS NS
C x K NS NS NS NS NS NS NS NS
C x N x K NS NS NS NS NS NS NS NS
C x Fe NS NS NS NS NS NS NS NS
C x N x Fe *NS NS NS NS NS NS NS
C x K x Fe NS NS NS NS NS NS NS NS
C x N x K x Fe * NSNS NS NS NS NS NS
Cultivation with Toro HydroJect 3000, #53 nozzles (11 operating), run in the raised (transport) position and set to second greatest hole density. In 1998, applied once every 4 weeks from June through October; in 1999, applied once everyz
3 weeks from May through October; and in 2000, applied once every 3 weeks from April through September.Mean separation with Fisher’s Protected LSD test.y
N-P O -K O fertility treatments applied foliarly to each main plot every 3 weeks, utilizing a CO sprayer mounted on a cart, and watered in [finish spray volume 855.3 L·ha (2.1 gal/1000 ft )]. N and K O applied at specified annual rates. P Ox -1 22 5 2 2 2 2 5
applied at 146.4 kg·ha (3.0 lb P O /1000 ft ) per year. See Table 2 for more details.-1 22 5
Fe applied foliarly to each main plot every 3 weeks, at 6.1 kg·ha FeSO (2.0 oz/1000 ft FeSO ) per application, utilizing a CO sprayer mounted on a cart, immediately after N- P O -K O fertility treatments, and not wateredw -1 24 4 2 2 5 2
in [finish spray volume 855.3 L·ha (2.1 gal/1000 ft )].-1 2
Strip-plot design: N, K, Fe treatments were the main plot factor (2x2x2 factorial) and cultivation treatments were the subplot factor.v
Nonsignificant or significant at P ≤ 0.05, 0.01, 0.001, respectively.NS, *, **, ***

35
Table 15. The effect of water injection cultivation, N, K O, and FeSO treatments on root mass, crown mass, and total plant mass of an annual bluegrass putting green as determined by2 4
samples taken in 1999 and 2000.
Treatments 10 Sept. 1999 5 May 2000 8 Sept. 2000 10 Sept. 1999 5 May 2000 8 Sept. 2000 10 Sept. 1999 5 May 2000 8 Sept. 2000
Root mass (g per 108.0 cm ) Crown mass (g per 14.2 cm ) Total plant mass (g) (root + crown mass)3 2
Date Date Date
Cultivation level treatmentsz
No cultivation 0.0075 0.0047 0.0049 0.5693 0.7800 0.6510 0.5769 0.7847 0.6559With cultivation 0.0079 0.0093 0.0050 0.5592 0.7365 0.6466 0.5672 0.7459 0.6516LSD, P=0.05 0.0003 NS NS NS NS NS NS NS NS
N-fertility rate treatmentsx
487.9 kg·ha (10.0 lb/1000 ft ) N/yr 0.0068 0.0042 0.0047 0.5122 0.6843 0.5716 0.5190 0.6885 0.5763-1 2
244.0 kg·ha (5.0 lb/1000 ft ) N/yr 0.0086 0.0099 0.0052 0.6164 0.8323 0.7260 0.6250 0.8422 0.7312-1 2
LSD, P=0.05 0.0017 0.0048 0.0351 0.0277 0.0482 0.0357 0.0276 0.0487NS
K O-fertility rate treatments2x
585.5 kg·ha (12.0 lb/1000 ft ) K O/yr 0.0080 0.0066 0.0049 0.5372 0.7672 0.6510 0.5452 0.7738 0.6560-1 22
195.2 kg·ha (4.0 lb/1000 ft ) K O/yr 0.0075 0.0075 0.0050 0.5913 0.7493 0.6465 0.5988 0.7568 0.6516-1 22
LSD, P=0.05 0.0351 0.0357NS NS NS NS NS NS NS
FeSO level treatments4w
With FeSO 0.0071 0.0069 0.0044 0.5407 0.7528 0.6705 0.5478 0.7597 0.67494
No FeSO 0.0084 0.0072 0.0055 0.5879 0.7638 0.6271 0.5963 0.7710 0.63264
LSD, P=0.05 0.0351 0.0357NS NS NS NS NS NS NS
Summary of ANOVA effectsv
Nitrogen (N) * * *** *** *** *** *** ***NS
Potassium (K) ** **NS NS NS NS NS NS NS
N x K * *NS NS NS NS NS NS NS
Iron (Fe) ** **NS NS NS NS NS NS NS
N x Fe NS NS NS NS NS NS NS NS NS
K x Fe NS NS NS NS NS NS NS NS NS
N x K x Fe NS NS NS NS NS NS NS NS NS
Cultivation (C) * NS NS NS NS NS NS NS NS
C x N NS NS NS NS NS NS NS NS NS
C x K NS NS NS NS NS NS NS NS NS
C x N x K NS NS NS NS NS NS NS NS NS
C x Fe ** **NS NS NS NS NS NS NS
C x N x Fe NS NS NS NS NS NS NS NS NS
C x K x Fe NS NS NS NS NS NS NS NS NS
C x N x K x Fe NSNS NS NS NS NS NS NS NS
Cultivation with Toro HydroJect 3000, #53 nozzles (11 operating), run in the raised (transport) position and set to second greatest hole density. In 1998, applied once every 4 weeks from June through October; in 1999, applied once everyz
3 weeks from May through October; and in 2000, applied once every 3 weeks from April through September.Mean separation with Fisher’s Protected LSD test.y
N-P O -K O fertility treatments applied foliarly to each main plot every 3 weeks, utilizing a CO sprayer mounted on a cart, and watered in [finish spray volume 855.3 L·ha (2.1 gal/1000 ft )]. N and K O applied at specified annual rates. P Ox -1 22 5 2 2 2 2 5
applied at 146.4 kg·ha (3.0 lb P O /1000 ft ) per year. See Table 2 for more details.-1 22 5
Fe applied foliarly to each main plot every 3 weeks, at 6.1 kg·ha FeSO (2.0 oz/1000 ft FeSO ) per application, utilizing a CO sprayer mounted on a cart, immediately after N- P O -K O fertility treatments, and not wateredw -1 24 4 2 2 5 2
in [finish spray volume 855.3 L·ha (2.1 gal/1000 ft )].-1 2
Strip-plot design: N, K, Fe treatments were the main plot factor (2x2x2 factorial) and cultivation treatments were the subplot factor.v
Nonsignificant or significant at P ≤ 0.05, 0.01, 0.001, respectively.NS, *, **, ***

Note: Mean comparisons conducted by a Fishers protected LSD test.
36
Note: K and Fe treatments basically did not affect total N content of clippings. Since clippings werecollected from main plots, the cultivation effect could not be tested.
Figure 10. The effect of N treatments on total nitrogen content of clippings of an annual bluegrassputting green from 12 Aug. 1998 to 26 Sept. 2000.
Note: A published target range for total nitrogen content of clippings of an annual bluegrass puttinggreen could not be located. A target range of 4.5% to 6.0% total N was cited for creeping bentgrass[Nuss, J. 1994. Golf course management 62(2):120–128].
0
1
2
3
4
5
6
7
8
4-A
ug-9
8
15-S
ep-9
8
27-O
ct-9
8
8-D
ec-9
8
19-J
an-9
9
2-M
ar-9
9
13-A
pr-9
9
25-M
ay-9
9
6-Ju
l-99
17-A
ug-9
9
28-S
ep-9
9
9-N
ov-9
9
21-D
ec-9
9
1-F
eb-0
0
14-M
ar-0
0
25-A
pr-0
0
6-Ju
n-00
18-J
ul-0
0
29-A
ug-0
0
Date
To
tal N
(%
)
487.9 kg/ha (10.0 lb/1000 ft²) N/yr
244.0 kg/ha (5.0 lb/1000 ft²) N/yr
(0.15)(0.23) (0.25) (0.21) (0.13) (0.16) (0.14) (0.22) (0.16)(LSD, P =0.05)
(0.11) (0.09) (0.11) (0.13) (0.27) (0.13) (0.45) (NS)

37
Table 16. The effect of N, K O, and FeSO treatments on clipping nitrogen content of an annual bluegrass putting green from 12 Aug. 1998 to 26 Sept. 2000.2 4
Total N (%)z
Treatments 1999 1999 2000
Date
12 30 18 19 13 28 17 28 9 18 11 23 18 26Aug. Sept. Nov. Jan. Apr. May Aug. Sept. Nov. Jan. Apr. May Aug. Sept.
1998 1998 1998 1999 1999 1999 1999 1999 1999 2000 2000 2000 2000 2000
2 6 7
Mar. July July
N-fertility rate treatmentsy
487.9 kg·ha (10.0 lb/1000 ft ) N/yr 5.05 4.50 5.37 6.32 6.52 6.09 5.22 5.17 5.44 5.80 5.95 6.96 5.74 5.52 5.43 5.71 6.10-1 2 x
244.0 kg·ha (5.0 lb/1000 ft ) N/yr 4.70 4.24 4.81 5.18 4.98 4.80 4.35 4.43 4.85 5.49 5.51 5.81 4.63 4.92 5.09 5.25 5.89-1 2
LSD, P=0.05 0.23 0.15 0.11 0.25 0.21 0.13 0.09 0.16 0.14 0.22 0.11 0.16 0.13 0.27 0.13 0.45 NS
K O-fertility rate treatments2y
585.5 kg·ha (12.0 lb/1000 ft ) K O/yr 4.93 4.39 5.05 5.74 5.86 5.48 4.77 4.84 5.20 5.74 5.71 6.30 5.13 5.21 5.22 5.36 6.00-1 22
195.2 kg·ha (4.0 lb/1000 ft ) K O/yr 4.82 4.35 5.12 5.80 5.80 5.40 4.79 4.76 5.09 5.55 5.75 6.47 5.25 5.19 5.29 5.59 5.97-1 22
LSD, P=0.05 0.16NS NS NS NS NS NS NS NS NS NS NS NS NS NS NS NS
FeSO level treatments4w
With FeSO 4.88 4.34 5.15 5.85 5.86 5.48 4.79 4.85 5.17 5.64 5.70 6.48 5.18 5.21 5.21 5.50 5.804
No FeSO 4.87 4.40 5.02 5.69 5.80 5.41 4.78 4.74 5.12 5.66 5.76 6.28 5.19 5.19 5.30 5.43 6.164
LSD, P=0.05 0.11 0.16 0.28NS NS NS NS NS NS NS NS NS NS NS NS NS NS
Summary of ANOVA effectsv
Nitrogen (N) ** *** *** *** *** *** *** *** *** ** *** *** *** *** *** * NS
Potassium (K) *NS NS NS NS NS NS NS NS NS NS NS NS NS NS NS NS
N x K *NS NS NS NS NS NS NS NS NS NS NS NS NS NS NS NS
Iron (Fe) * * **NS NS NS NS NS NS NS NS NS NS NS NS NS NS
N x Fe *NS NS NS NS NS NS NS NS NS NS NS NS NS NS NS NS
K x Fe NS NS NS NS NS NS NS NS NS NS NS NS NS NS NS NS NS
N x K x Fe *NS NS NS NS NS NS NS NS NS NS NS NS NS NS NS NS
Calculated on a dry weight basis and determined by combustion gas analyzer method (see Table A-8 for details).z
N-P O -K O fertility treatments applied foliarly to each main plot every 3 weeks, utilizing a CO sprayer mounted on a cart, and watered in [finish spray volume 855.3 L·ha (2.1 gal/1000 ft )]. N and K O applied at specified annual rates. P Oy -1 22 5 2 2 2 2 5
applied at 146.4 kg·ha (3.0 lb P O /1000 ft ) per year. See Table 2 for more details.-1 22 5
Mean separation with Fisher’s Protected LSD test.x
Fe applied foliarly to each main plot every 3 weeks, at 6.1 kg·ha FeSO (2.0 oz/1000 ft FeSO ) per application, utilizing a CO sprayer mounted on a cart, immediately after N-P O -K O fertility treatments, and not watered inw -1 24 4 2 2 5 2
[finish spray volume 855.3 L·ha (2.1 gal/1000 ft )].-1 2
Randomized complete block design (RCB) with fertilizer treatments arranged in a 2x2x2 factorial arrangement.v
Nonsignificant or significant at P ≤ 0.05, 0.01, 0.001, respectively.NS, *, **, ***

Note: Mean comparisons conducted by a Fishers protected LSD test.
38
Note: A published target range for total potassium content of clippings of an annual bluegrass putting puttinggreen could not be located. A target range of 2.2% to 2.6% total K was cited for creeping bentgrass [Nuss, J.1994. Golf course management 62(2):120–128].
Note: Fe treatments basically did not affect total K content of clippings. Since clippings were collected frommain plots, the cultivation effect could not be tested.
Figure 11. The effect of N and K treatments on total potassium content of clippings of an annualbluegrass putting green from 12 Aug. 1998 to 26 Sept. 2000.
0.0
0.5
1.0
1.5
2.0
2.5
3.0
3.5
4.0
4.5
4-A
ug-9
8
15-S
ep-9
8
27-O
ct-9
8
8-D
ec-9
8
19-J
an-9
9
2-M
ar-9
9
13-A
pr-9
9
25-M
ay-9
9
6-Ju
l-99
17-A
ug-9
9
28-S
ep-9
9
9-N
ov-9
9
21-D
ec-9
9
1-Fe
b-00
14-M
ar-0
0
25-A
pr-0
0
6-Ju
n-00
18-J
ul-0
0
29-A
ug-0
0
Date
Tota
l K (%
)
487.9 kg/ha (10.0 lb/1000 ft²) N/yr
244.0 kg/ha (5.0 lb/1000 ft²) N/yr
0.0
0.5
1.0
1.5
2.0
2.5
3.0
3.5
4.0
4.5
4-A
ug-9
8
15-S
ep-9
8
27-O
ct-9
8
8-D
ec-9
8
19-J
an-9
9
2-M
ar-9
9
13-A
pr-9
9
25-M
ay-9
9
6-Ju
l-99
17-A
ug-9
9
28-S
ep-9
9
9-N
ov-9
9
21-D
ec-9
9
1-Fe
b-00
14-M
ar-0
0
25-A
pr-0
0
6-Ju
n-00
18-J
ul-0
0
29-A
ug-0
0
Date
Tota
l K (%
)
585.5 kg/ha (12.0 lb/1000 ft²) K2O/yr
195.2 kg/ha (4.0 lb/1000 ft²) K2O/yr
(NS)(NS) (0.12) (0.21) (0.08) (0.07) (NS) (NS) (0.18)(LSD, P =0.05)
(0.09) (0.05) (NS)
(NS)(NS) (0.12) (NS) (NS) (0.07) (NS) (NS) (0.18)(LSD, P =0.05)
(0.09) (NS) (0.15) (NS) (0.06)
(NS) (0.06) (NS)
(0.05) (NS)
(NS)
(NS)
(NS)

39
Table 17. The effect of N, K O, and FeSO treatments on clipping potassium content of an annual bluegrass putting green from 12 Aug. 1998 to 26 Sept. 2000.2 4
Total K (%)z
Treatments 1999 1999 2000
Date
12 30 18 19 13 28 17 28 9 18 11 23 18 26Aug. Sept. Nov. Jan. Apr. May Aug. Sept. Nov. Jan. Apr. May Aug. Sept.
1998 1998 1998 1999 1999 1999 1999 1999 1999 2000 2000 2000 2000 2000
2 6 7
Mar. July July
N-fertility rate treatmentsy
487.9 kg·ha (10.0 lb/1000 ft ) N/yr 2.20 2.40 2.74 2.46 2.66 2.28 2.48 2.57 2.42 2.36 2.97 3.15 2.29 2.25 2.26 2.60 3.91-1 2 x
244.0 kg·ha (5.0 lb/1000 ft ) N/yr 2.39 2.35 2.63 2.27 2.73 2.36 2.50 2.42 2.37 2.36 2.80 2.91 2.39 2.18 2.21 2.53 3.84-1 2
LSD, P=0.05 0.09 0.12 0.07 0.15 0.18 0.06 0.05NS NS NS NS NS NS NS NS NS NS
K O-fertility rate treatments2y
585.5 kg·ha (12.0 lb/1000 ft ) K O/yr 2.28 2.40 2.75 2.52 2.99 2.48 2.56 2.53 2.41 2.36 2.92 3.19 2.37 2.27 2.22 2.56 3.89-1 22
195.2 kg·ha (4.0 lb/1000 ft ) K O/yr 2.31 2.35 2.62 2.22 2.41 2.16 2.42 2.45 2.37 2.36 2.85 2.87 2.31 2.16 2.25 2.56 3.86-1 22
LSD, P=0.05 0.09 0.12 0.21 0.08 0.05 0.07 0.18 0.06NS NS NS NS NS NS NS NS NS
FeSO level treatments4w
With FeSO 2.43 2.38 2.69 2.41 2.78 2.32 2.48 2.48 2.39 2.36 2.88 3.06 2.38 2.23 2.23 2.54 3.874
No FeSO 2.16 2.37 2.68 2.32 2.61 2.33 2.50 2.51 2.39 2.36 2.89 3.00 2.30 2.20 2.24 2.58 3.884
LSD, P=0.05 0.23 NS NS NS NS NS NS NS NS NS NS NS NS NS NS NS NS
Summary of ANOVA effectsv
Nitrogen (N) * ** *** * ** * *NS NS NS NS NS NS NS NS NS NS
Potassium (K) ** *** *** *** *** * ** **NS NS NS NS NS NS NS NS NS
N x K * *NS NS NS NS NS NS NS NS NS NS NS NS NS NS NS
Iron (Fe) * NS NS NS NS NS NS NS NS NS NS NS NS NS NS NS NS
N x Fe NS NS NS NS NS NS NS NS NS NS NS NS NS NS NS NS NS
K x Fe NS NS NS NS NS NS NS NS NS NS NS NS NS NS NS NS NS
N x K x Fe NS NS NS NS NS NS NS NS NS NS NS NS NS NS NS NS NS
Calculated on a dry weight basis and determined by dry ashing, leachate, and inductively coupled Ar plasma (ICAP) emission spectrometry (see Table A-8 for details).z
N-P O -K O fertility treatments applied foliarly to each main plot every 3 weeks, utilizing a CO sprayer mounted on a cart, and watered in [finish spray volume 855.3 L·ha (2.1 gal/1000 ft )]. N and K O applied at specified annual rates. P Oy -1 22 5 2 2 2 2 5
applied at 146.4 kg·ha (3.0 lb P O /1000 ft ) per year. See Table 2 for more details.-1 22 5
Mean separation with Fisher’s Protected LSD test.x
Fe applied foliarly to each main plot every 3 weeks, at 6.1 kg·ha FeSO (2.0 oz/1000 ft FeSO ) per application, utilizing a CO sprayer mounted on a cart, immediately after N-P O -K O fertility treatments, and not watered in [finish sprayw -1 24 4 2 2 5 2
volume 855.3 L·ha (2.1 gal/1000 ft )].-1 2
Randomized complete block design (RCB) with fertilizer treatments arranged in a 2x2x2 factorial arrangement.v
Nonsignificant or significant at P ≤ 0.05, 0.01, 0.001, respectively.NS, *, **, ***

Note: Mean comparisons conducted by a Fishers protected LSD test.
40
Note: K and Fe treatments basically did not affect total P content of clippings. Since clippings werecollected from main plots, the cultivation effect could not be tested.
Figure 12. The effect of N treatments on total phosphorus content of clippings of an annual bluegrass puttinggreen from 12 Aug. 1998 to 26 Sept. 2000.
Note: A published target range for total phosphorus content of clippings of an annual bluegrassputting putting green could not be located. A target range of 0.3% to 0.6% total P was cited forcreeping bentgrass [Nuss, J. 1994. Golf course management 62(2):120–128].
0.0
0.1
0.2
0.3
0.4
0.5
0.6
0.7
4-A
ug-9
8
15-S
ep-9
8
27-O
ct-9
8
8-D
ec-9
8
19-J
an-9
9
2-M
ar-9
9
13-A
pr-9
9
25-M
ay-9
9
6-Ju
l-99
17-A
ug-9
9
28-S
ep-9
9
9-N
ov-9
9
21-D
ec-9
9
1-F
eb-0
0
14-M
ar-0
0
25-A
pr-0
0
6-Ju
n-00
18-J
ul-0
0
29-A
ug-0
0
Date
To
tal P
(%
)
487.9 kg/ha (10.0 lb/1000 ft²) N/yr
244.0 kg/ha (5.0 lb/1000 ft²) N/yr
(NS)(NS) (0.02) (0.02) (0.01) (NS) (0.03) (NS) (0.03)(LSD, P =0.05)
(NS) (0.02) (NS) (NS) (NS) (0.01) (0.01) (0.01)

41
Table 18. The effect of N, K O, and FeSO treatments on clipping phosphorus content of an annual bluegrass putting green from 12 Aug. 1998 to 26 Sept. 2000.2 4
Total P (%)z
Treatments 1999 1999 2000
Date
12 30 18 19 13 28 17 28 9 18 11 23 18 26Aug. Sept. Nov. Jan. Apr. May Aug. Sept. Nov. Jan. Apr. May Aug. Sept.
1998 1998 1998 1999 1999 1999 1999 1999 1999 2000 2000 2000 2000 2000
2 6 7
Mar. July July
N-fertility rate treatmentsy
487.9 kg·ha (10.0 lb/1000 ft ) N/yr 0.49 0.48 0.60 0.57 0.53 0.50 0.51 0.47 0.47 0.51 0.63 0.66 0.53 0.54 0.45 0.49 0.39-1 2 x
244.0 kg·ha (5.0 lb/1000 ft ) N/yr 0.50 0.48 0.60 0.53 0.55 0.49 0.53 0.48 0.50 0.52 0.62 0.62 0.52 0.53 0.47 0.53 0.43-1 2
LSD, P=0.05 0.02 0.02 0.01 0.02 0.03 0.03 0.01 0.01 0.01NS NS NS NS NS NS NS NS
K O-fertility rate treatments2y
585.5 kg·ha (12.0 lb/1000 ft ) K O/yr 0.50 0.48 0.60 0.55 0.54 0.49 052 0.48 0.48 0.52 0.62 0.64 0.52 0.54 0.46 0.51 0.41-1 22
195.2 kg·ha (4.0 lb/1000 ft ) K O/yr 0.49 0.48 0.60 0.55 0.54 0.49 0.52 0.47 0.48 0.52 0.63 0.64 0.53 0.53 0.46 0.51 0.41-1 22
LSD, P=0.05 NS NS NS NS NS NS NS NS NS NS NS NS NS NS NS NS NS
FeSO level treatments4w
With FeSO 0.51 0.48 0.60 0.56 0.54 0.50 0.51 0.47 0.48 0.52 0.62 0.65 0.53 0.53 0.45 0.51 0.404
No FeSO 0.48 0.48 0.60 0.54 0.54 0.49 0.52 0.49 0.49 0.52 0.63 0.63 0.52 0.53 0.46 0.52 0.424
LSD, P=0.05 0.03 0.01 0.01NS NS NS NS NS NS NS NS NS NS NS NS NS NS
Summary of ANOVA effectsv
Nitrogen (N) *** * ** * * * *** *** ***NS NS NS NS NS NS NS NS
Potassium (K) NS NS NS NS NS NS NS NS NS NS NS NS NS NS NS NS NS
N x K **NS NS NS NS NS NS NS NS NS NS NS NS NS NS NS NS
Iron (Fe) * * **NS NS NS NS NS NS NS NS NS NS NS NS NS NS
N x Fe *NS NS NS NS NS NS NS NS NS NS NS NS NS NS NS NS
K x Fe NS NS NS NS NS NS NS NS NS NS NS NS NS NS NS NS NS
N x K x Fe *NS NS NS NS NS NS NS NS NS NS NS NS NS NS NS NS
Calculated on a dry weight basis and determined by dry ashing, leachate, and inductively coupled Ar plasma (ICAP) emission spectrometry (see Table A-8 for details).z
N-P O -K O fertility treatments applied foliarly to each main plot every 3 weeks, utilizing a CO sprayer mounted on a cart, and watered in [finish spray volume 855.3 L·ha (2.1 gal/1000 ft )]. N and K O applied at specified annual rates. P Oy -1 22 5 2 2 2 2 5
applied at 146.4 kg·ha (3.0 lb P O /1000 ft ) per year. See Table 2 for more details.-1 22 5
Mean separation with Fisher’s Protected LSD test.x
Fe applied foliarly to each main plot every 3 weeks, at 6.1 kg·ha FeSO (2.0 oz/1000 ft FeSO ) per application, utilizing a CO sprayer mounted on a cart, immediately after N-P O -K O fertility treatments, and not watered in [finish sprayw -1 24 4 2 2 5 2
volume 855.3 L·ha (2.1 gal/1000 ft )].-1 2
Randomized complete block design (RCB) with fertilizer treatments arranged in a 2x2x2 factorial arrangement.v
Nonsignificant or significant at P ≤ 0.05, 0.01, 0.001, respectively.NS, *, **, ***

Note: Mean comparisons conducted by a Fishers protected LSD test.
42
Note: A published target range for total iron content of clippings of an annual bluegrass putting green couldnot be located. A target range of 100 to 300 ppm total Fe was cited for creeping bentgrass [Nuss, J. 1994.Golf course management 62(2):120–128].
Figure 13. The effect of N and Fe treatments on total iron content of clippings of an annual bluegrassputting green from 12 Aug. 1998 to 26 Sept. 2000.
Note: K treatments basically did not affect total Fe content of clippings. Since clippings were collected frommain plots, the cultivation effect could not be tested.
0
50
100
150
200
250
4-A
ug-9
8
15-S
ep-9
8
27-O
ct-9
8
8-D
ec-9
8
19-J
an-9
9
2-M
ar-9
9
13-A
pr-9
9
25-M
ay-9
9
6-Ju
l-99
17-A
ug-9
9
28-S
ep-9
9
9-N
ov-9
9
21-D
ec-9
9
1-Fe
b-00
14-M
ar-0
0
25-A
pr-0
0
6-Ju
n-00
18-J
ul-0
0
29-A
ug-0
0
Date
Tota
l Fe
(ppm
)
487.9 kg/ha (10.0 lb/1000 ft²) N/yr244.0 kg/ha (5.0 lb/1000 ft²) N/yr
0
50
100
150
200
250
300
4-A
ug-9
8
15-S
ep-9
8
27-O
ct-9
8
8-D
ec-9
8
19-J
an-9
9
2-M
ar-9
9
13-A
pr-9
9
25-M
ay-9
9
6-Ju
l-99
17-A
ug-9
9
28-S
ep-9
9
9-N
ov-9
9
21-D
ec-9
9
1-Fe
b-00
14-M
ar-0
0
25-A
pr-0
0
6-Ju
n-00
18-J
ul-0
0
29-A
ug-0
0
Date
Tota
l Fe
(ppm
)
6.4 L/ha (2.0 oz/1000 ft²) FeSO4/3 weeks
No FeSO4
(NS)(7) (NS) (14) (NS) (8) (8) (NS) (NS)(LSD, P =0.05)
(NS) (13) (NS)
(NS)(7) (22) (14) (7) (NS) (8) (12) (23)(LSD, P =0.05)
(NS) (13) (NS)
(NS) (17)
(13) (NS) (NS)
(29) (NS)
(NS)
(5)
(5)

43
Table 19. The effect of N, K O, and FeSO treatments on clipping iron content of an annual bluegrass putting green from 12 Aug. 1998 to 26 Sept. 2000.2 4
Total Fe (ppm)z
Treatments 1999 1999 1999 1999 1999 1999 2000 2000 2000 2000
Date
12 30 18 17 28 18 26Aug. Sept. Nov. Aug. Sept. Aug. Sept.
1998 1998 1998 1999 1999 2000 2000
19 2 13 28 6 9 18 11 23 7
Jan. Mar. Apr. May July Nov. Jan. Apr. May July
N-fertility rate treatmentsy
487.9 kg·ha (10.0 lb/1000 ft ) N/yr 137 197 169 222 176 186 149 124 112 130 178 219 156 137 234 217 97-1 2 x
244.0 kg·ha (5.0 lb/1000 ft ) N/yr 127 189 160 237 159 188 132 108 103 127 190 221 150 115 202 214 91-1 2
LSD, P=0.05 7 14 13 8 8 17 29 5NS NS NS NS NS NS NS NS NS
K O-fertility rate treatments2y
585.5 kg·ha (12.0 lb/1000 ft ) K O/yr 131 190 157 233 177 184 140 115 108 130 184 218 151 124 222 203 93-1 22
195.2 kg·ha (4.0 lb/1000 ft ) K O/yr 132 196 172 225 161 190 141 117 107 128 184 221 155 127 213 229 94-1 22
LSD, P=0.05 NS NS NS NS NS NS NS NS NS NS NS NS NS NS NS NS NS
FeSO level treatments4w
With FeSO 142 191 173 253 187 201 147 117 113 139 197 237 162 133 215 233 974
No FeSO 121 195 156 204 152 173 134 115 102 118 172 202 144 117 221 197 904
LSD, P=0.05 7 22 14 7 13 8 12 23 13 5NS NS NS NS NS NS NS
Summary of ANOVA effectsv
Nitrogen (N) ** * ** *** * * * *NS NS NS NS NS NS NS NS NS
Potassium (K) NS NS NS NS NS NS NS NS NS NS NS NS NS NS NS NS NS
N x K * *NS NS NS NS NS NS NS NS NS NS NS NS NS NS NS
Iron (Fe) *** *** *** *** * ** ** ** ** **NS NS NS NS NS NS NS
N x Fe *NS NS NS NS NS NS NS NS NS NS NS NS NS NS NS NS
K x Fe * NS NS NS NS NS NS NS NS NS NS NS NS NS NS NS NS
N x K x Fe * NS NS NS NS NS NS NS NS NS NS NS NS NS NS NS NS
Determined by dry ashing, leachate, and inductively coupled Ar plasma (ICAP) emission spectrometry (see Table A-8 for details).z
N-P O -K O fertility treatments applied foliarly to each main plot every 3 weeks, utilizing a CO sprayer mounted on a cart, and watered in [finish spray volume 855.3 L·ha (2.1 gal/1000 ft )]. N and K O applied at specified annual rates. P Oy -1 22 5 2 2 2 2 5
applied at 146.4 kg·ha (3.0 lb P O /1000 ft ) per year. See Table 2 for more details.-1 22 5
Mean separation with Fisher’s Protected LSD test.x
Fe applied foliarly to each main plot every 3 weeks, at 6.1 kg·ha FeSO (2.0 oz/1000 ft FeSO ) per application, utilizing a CO sprayer mounted on a cart, immediately after N-P O -K O fertility treatments, and not watered in [finish sprayw -1 24 4 2 2 5 2
volume 855.3 L·ha (2.1 gal/1000 ft )].-1 2
Randomized complete block design (RCB) with fertilizer treatments arranged in a 2x2x2 factorial arrangement.v
Nonsignificant or significant at P ≤ 0.05, 0.01, 0.001, respectively.NS, *, **, ***

44
Table 20. The effect of N, K O, and FeSO treatments on soil salinity and fertility as determined by samples taken 7 May 1999. 2 4
Treatments (dS·m ) (ppm) (ppm) (ppm) (%) (ppm) (ppm) (ppm) (ppm) (ppm)
Soluble Exchangeablez z
EC Ca Mg Na TKN P-Olsen X-K X-Ca X-Mg X-Nae-1 SAR
N-fertility rate treatmentsy
487.9 kg·ha (10.0 lb/1000 ft ) N/yr 1.73 191.4 47.4 178.1 3.0 0.172 59.5 65.2 1479.6 189.5 149.5-1 2 x
244.0 kg·ha (5.0 lb/1000 ft ) N/yr 1.68 172.3 42.9 171.3 3.0 0.165 39.5 104.3 1499.6 167.2 149.5-1 2
LSD, P=0.05 18.5 4.7 15.2NS NS NS NS NS NS NS NS
K O-fertility rate treatments2y
585.5 kg·ha (12.0 lb/1000 ft ) K O/yr 1.78 186.4 46.2 173.8 2.9 0.169 52.0 120.6 1452.9 171.2 145.7-1 22
195.2 kg·ha (4.0 lb/1000 ft ) K O/yr 1.63 177.3 44.1 175.6 3.1 0.168 47.0 48.9 1526.4 185.4 153.3-1 22
LSD, P=0.05 0.13 52.8NS NS NS NS NS NS NS NS NS
FeSO level treatments4w
With FeSO 1.68 179.3 44.7 169.2 3.0 0.173 45.2 81.5 1519.7 179.4 153.34
No FeSO 1.73 184.4 45.6 180.2 3.0 0.164 53.8 88.0 1459.6 177.3 145.74
LSD, P=0.05 NS NS NS NS NS NS NS NS NS NS NS
Summary of ANOVA effectsv
Nitrogen (N) * * **NS NS NS NS NS NS NS NS
Potassium (K) * **NS NS NS NS NS NS NS NS NS
N x K NS NS NS NS NS NS NS NS NS NS NS
Iron (Fe) NS NS NS NS NS NS NS NS NS NS NS
N x Fe NS NS NS NS NS NS NS NS NS NS NS
K x Fe NS NS NS NS NS NS NS NS NS NS NS
N x K x Fe NS NS NS NS NS NS NS NS NS NS NS
See Table A-9 for methodology details. Samples were from main (fertility) plots and included 14, 2-cm cores, from the 1.3- to 8.9-cm (0.5- to 3.5-inch) root zone. z
N-P O -K O fertility treatments applied foliarly to each main plot every 3 weeks, utilizing a CO sprayer mounted on a cart, and watered in [finish spray volume 855.3 L·ha (2.1 gal/1000 ft )]. N and K O applied at specified annual rates. P Oy -1 22 5 2 2 2 2 5
applied at 146.4 kg·ha (3.0 lb P O /1000 ft ) per year. See Table 2 for more details.-1 22 5
Mean separation with Fisher’s Protected LSD test.x
Fe applied foliarly to each main plot every 3 weeks, at 6.1 kg·ha FeSO (2.0 oz/1000 ft FeSO ) per application, utilizing a CO sprayer mounted on a cart, immediately after N-P O -K O fertility treatments, and not watered in [finish sprayw -1 24 4 2 2 5 2
volume 855.3 L·ha (2.1 gal/1000 ft )].-1 2
Randomized complete block design (RCB) with fertilizer treatments arranged in a 2x2x2 factorial arrangement.v
Nonsignificant or significant at P ≤ 0.05, 0.01, 0.001, respectively.NS, *, **, ***

45
Table 21. The effect of N, K O, and FeSO treatments on soil salinity and fertility as determined by samples taken 10 Sept. 1999. 2 4
Treatments (dS·m ) (ppm) (ppm) (ppm) (%) (ppm) (ppm) (ppm) (ppm) (ppm)
Soluble Exchangeablez z
EC Ca Mg Na TKN P-Olsen X-K X-Ca X-Mg X-Nae-1 SAR
N-fertility rate treatmentsy
487.9 kg·ha (10.0 lb/1000 ft ) N/yr 1.39 137.6 36.6 173.6 3.3 0.125 37.0 74.9 1427.8 151.0 143.7-1 2 x
244.0 kg·ha (5.0 lb/1000 ft ) N/yr 1.44 141.1 38.0 175.8 3.2 0.137 39.6 84.7 1513.0 172.3 155.2-1 2
LSD, P=0.05 18.3NS NS NS NS NS NS NS NS NS NS
K O-fertility rate treatments2y
585.5 kg·ha (12.0 lb/1000 ft ) K O/yr 1.39 137.8 37.2 172.5 3.2 0.132 37.1 81.5 1421.2 159.1 143.7-1 22
195.2 kg·ha (4.0 lb/1000 ft ) K O/yr 1.43 141.0 37.4 176.9 3.3 0.130 39.5 78.2 1519.7 164.2 155.2-1 22
LSD, P=0.05 NS NS NS NS NS NS NS NS NS NS NS
FeSO level treatments4w
With FeSO 1.42 140.1 37.4 174.0 3.2 0.131 39.0 81.5 1519.7 170.2 153.34
No FeSO 1.41 138.6 37.2 175.4 3.3 0.130 37.6 78.2 1421.1 153.0 145.74
LSD, P=0.05 NS NS NS NS NS NS NS NS NS NS NS
Summary of ANOVA effectsv
Nitrogen (N) *NS NS NS NS NS NS NS NS NS NS
Potassium (K) NS NS NS NS NS NS NS NS NS NS NS
N x K *NS NS NS NS NS NS NS NS NS NS
Iron (Fe) NS NS NS NS NS NS NS NS NS NS NS
N x Fe *NS NS NS NS NS NS NS NS NS NS
K x Fe NS NS NS NS NS NS NS NS NS NS NS
N x K x Fe NS NS NS NS NS NS NS NS NS NS NS
See Table A-9 for methodology details. Samples were from main (fertility) plots and included 14, 2-cm cores, from the 1.3- to 8.9-cm (0.5- to 3.5-inch) root zone. z
N-P O -K O fertility treatments applied foliarly to each main plot every 3 weeks, utilizing a CO sprayer mounted on a cart, and watered in [finish spray volume 855.3 L·ha (2.1 gal/1000 ft )]. N and K O applied at specified annual rates. P Oy -1 22 5 2 2 2 2 5
applied at 146.4 kg·ha (3.0 lb P O /1000 ft ) per year. See Table 2 for more details.-1 22 5
Mean separation with Fisher’s Protected LSD test.x
Fe applied foliarly to each main plot every 3 weeks, at 6.1 kg·ha FeSO (2.0 oz/1000 ft FeSO ) per application, utilizing a CO sprayer mounted on a cart, immediately after N-P O -K O fertility treatments, and not watered inw -1 24 4 2 2 5 2
[finish spray volume 855.3 L·ha (2.1 gal/1000 ft )].-1 2
Randomized complete block design (RCB) with fertilizer treatments arranged in a 2x2x2 factorial arrangement.v
Nonsignificant or significant at P ≤ 0.05, 0.01, 0.001, respectively.NS, *, **, ***

46
Table 22. The effect of N, K O, and FeSO treatments on soil salinity and fertility as determined by samples taken 5 May 2000. 2 4
Treatments (dS·m ) (ppm) (ppm) (ppm) (%) (ppm) (ppm) (ppm) (ppm) (ppm) (meq/100 g)
Soluble Exchangeablez z
EC Ca Mg Na TKN P-Olsen X-K X-Ca X-Mg X-Na CECe-1 SAR pH
N-fertility rate treatmentsy
487.9 kg·ha (10.0 lb/1000 ft ) N/yr 1.58 178.3 36.7 160.0 3.0 0.179 81.9 74.9 1766.9 199.6 153.3 6.5 21.3-1 2 x
244.0 kg·ha (5.0 lb/1000 ft ) N/yr 1.53 163.7 34.2 164.3 3.0 0.178 83.8 88.0 1733.5 202.7 161.0 6.5 20.7-1 2
LSD, P=0.05 13.3 . 12.7NS NS NS NS NS NS NS NS NS NS
K O-fertility rate treatments2y
585.5 kg·ha (12.0 lb/1000 ft ) K O/yr 1.56 166.8 34.4 162.5 3.0 0.181 79.2 114.0 1728.4 199.6 159.1 6.5 21.3-1 22
195.2 kg·ha (4.0 lb/1000 ft ) K O/yr 1.54 175.2 36.5 161.8 3.0 0.176 86.5 48.9 1771.9 202.7 155.2 6.5 20.7-1 22
LSD, P=0.05 . 12.7NS NS NS NS NS NS NS NS NS NS NS
FeSO level treatments4w
With FeSO 1.56 173.2 36.0 163.3 3.0 0.173 80.0 81.5 1736.8 201.7 153.3 6.5 22.04
No FeSO 1.55 168.8 35.0 161.0 3.0 0.184 85.8 81.5 1763.5 200.6 161.0 6.5 20.04
LSD, P=0.05 . 1.5NS NS NS NS NS NS NS NS NS NS NS
Summary of ANOVA effectsv
Nitrogen (N) * . *NS NS NS NS NS NS NS NS NS NS
Potassium (K) . ***NS NS NS NS NS NS NS NS NS NS NS
N x K * * . * *NS NS NS NS NS NS NS NS
Iron (Fe) . **NS NS NS NS NS NS NS NS NS NS NS
N x Fe .NS NS NS NS NS NS NS NS NS NS NS NS
K x Fe .NS NS NS NS NS NS NS NS NS NS NS NS
N x K x Fe .NS NS NS NS NS NS NS NS NS NS NS NS
See Table A-9 for methodology details. Samples were from main (fertility) plots and included 14, 2-cm cores, from the 1.3- to 8.9-cm (0.5- to 3.5-inch) root zone. z
N-P O -K O fertility treatments applied foliarly to each main plot every 3 weeks, utilizing a CO sprayer mounted on a cart, and watered in [finish spray volume 855.3 L·ha (2.1 gal/1000 ft )]. N and K O applied at specified annual rates. P Oy -1 22 5 2 2 2 2 5
applied at 146.4 kg·ha (3.0 lb P O /1000 ft ) per year. See Table 2 for more details.-1 22 5
Mean separation with Fisher’s Protected LSD test.x
Fe applied foliarly to each main plot every 3 weeks, at 6.1 kg·ha FeSO (2.0 oz/1000 ft FeSO ) per application, utilizing a CO sprayer mounted on a cart, immediately after N-P O -K O fertility treatments, and not watered inw -1 24 4 2 2 5 2
[finish spray volume 855.3 L·ha (2.1 gal/1000 ft )].-1 2
Randomized complete block design (RCB) with fertilizer treatments arranged in a 2x2x2 factorial arrangement.v

47
Table 23. The effect of N, K O, and FeSO treatments on soil salinity and fertility as determined by samples taken 8 Sept. 2000. 2 4
Treatments (dS·m ) (ppm) (ppm) (ppm) (%) (ppm) (ppm) (ppm) (ppm) (ppm) (meq/100 g)
Soluble Exchangeablez z
EC Ca Mg Na TKN P-Olsen X-K X-Ca X-Mg X-Na CECe-1 SAR pH
N-fertility rate treatmentsy
487.9 kg·ha (10.0 lb/1000 ft ) N/yr 1.65 140.1 47.1 237.5 4.3 0.118 59.6 92.7 1574.8 243.2 230.2 6.9 23.3-1 2 x
244.0 kg·ha (5.0 lb/1000 ft ) N/yr 1.73 142.5 49.1 251.1 4.5 0.120 66.8 105.8 1581.5 251.3 244.7 6.9 23.0-1 2
LSD, P=0.05 5.1NS NS NS NS NS NS NS NS NS NS NS NS
K O-fertility rate treatments2y
585.5 kg·ha (12.0 lb/1000 ft ) K O/yr 1.68 140.0 47.8 239.8 4.3 0.120 61.1 109.7 1558.1 247.3 236.5 6.9 23.6-1 22
195.2 kg·ha (4.0 lb/1000 ft ) K O/yr 1.70 142.6 48.4 248.8 4.5 0.119 65.3 88.8 1598.2 247.2 238.5 6.9 22.8-1 22
LSD, P=0.05 13.7NS NS NS NS NS NS NS NS NS NS NS NS
FeSO level treatments4w
With FeSO 1.75 144.0 49.0 253.6 4.6 0.115 61.8 101.5 1566.5 246.2 247.6 6.9 22.14
No FeSO 1.62 138.6 47.2 235.0 4.2 0.124 64.6 97.0 1589.8 248.3 227.4 6.9 24.34
LSD, P=0.05 NS NS NS NS NS NS NS NS NS NS NS NS NS
Summary of ANOVA effectsv
Nitrogen (N) **NS NS NS NS NS NS NS NS NS NS NS NS
Potassium (K) **NS NS NS NS NS NS NS NS NS NS NS NS
N x K *NS NS NS NS NS NS NS NS NS NS NS NS
Iron (Fe) NS NS NS NS NS NS NS NS NS NS NS NS NS
N x Fe *NS NS NS NS NS NS NS NS NS NS NS NS
K x Fe NS NS NS NS NS NS NS NS NS NS NS NS NS
N x K x Fe NS NS NS NS NS NS NS NS NS NS NS NS NS
See Table A-9 for methodology details. Samples were from main (fertility) plots and included 20, 2-cm cores, from the 1.3- to 8.9-cm (0.5- to 3.5-inch) root zone. z
N-P O -K O fertility treatments applied foliarly to each main plot every 3 weeks, utilizing a CO sprayer mounted on a cart, and watered in [finish spray volume 855.3 L·ha (2.1 gal/1000 ft )]. N and K O applied at specified annual rates. P Oy -1 22 5 2 2 2 2 5
applied at 146.4 kg·ha (3.0 lb P O /1000 ft ) per year. See Table 2 for more details.-1 22 5
Mean separation with Fisher’s Protected LSD test.x
Fe applied foliarly to each main plot every 3 weeks, at 6.1 kg·ha FeSO (2.0 oz/1000 ft FeSO ) per application, utilizing a CO sprayer mounted on a cart, immediately after N-P O -K O fertility treatments, and not watered inw -1 24 4 2 2 5 2
[finish spray volume 855.3 L·ha (2.1 gal/1000 ft )].-1 2
Randomized complete block design (RCB) with fertilizer treatments arranged in a 2x2x2 factorial arrangement.v

A1
APPENDIX

A2
Table A-1. Analyses of irrigation water samples taken in 1999 and 2000 (see Table A-9 for analyses methodology details).
Analysis 1999 1999 1999 2000 2000 X23 Mar. 30 July 21 Dec. 22 Mar. 25 July _
SE
B (ppm) 0.4 0.4 0.4 0.4 0.3 0.4 0.02
Ca (ppm) 54.1 58.1 48.1 54.1 64.1 55.7 2.6
Cl (ppm) 106.4 127.7 113.5 113.5 127.7 117.8 4.3
CO (ppm) <3 <3 <3 <3 <3 <3 03
Cu (ppm) <0.02 <0.02 0.02 <0.02 <0.02 <0.02 0
EC (dS·m ) 1.01 1.01 0.94 0.98 1.09 1.01 0.02-1
ESP (%) 4 3 3 3 3 3 0.2
Fe (ppm) 0.04 0.04 <0.02 <0.02 <0.02 <0.03 0.005
HCO (ppm) 213.5 256.2 207.4 225.7 237.9 228.1 8.83
K-Sol (ppm) 16.3 15.8 14.8 15.0 16.3 15.6 0.3
Mg (ppm) 17.0 18.2 20.7 19.5 18.2 18.7 0.6
Mn (ppm) 0.03 <0.02 <0.02 <0.02 <0.02 <0.02 0.002
Na (ppm) 119.6 112.7 115.0 110.4 119.6 115.5 1.8
NH -N (ppm) 1.95 7.37 1.22 2.17 <0.05 <2.55 1.264
NO -N (ppm) 1.36 1.21 4.04 0.47 5.67 2.55 0.993
P (ppm) 0.53 1.17 0.62 0.80 0.65 0.75 0.11
pH 7.4 7.0 7.4 7.3 7.0 7.2 0.1
SAR 4 3 3 3 3 3 0.2
Se (ppb) 0.4 0.6 13.8 11.5 0.1 5.3 3.0
SO -S (ppm) 38.8 41.2 35.4 33.0 46.4 39.0 2.34
Zn (ppm) 0.03 0.06 0.05 0.03 0.03 0.04 0.01

A3
Table A-2. Estimation of nitrogen applied to the research plot through the irrigation water over a 12-month period.
Month irrigation waterIrrigation water applied (inches) Concentration of total N (mg/L) lb N/1000 ft applied throughz y 2
May 2000 5.10 7.18 0.19
June 2000 5.74 7.39 0.22
July 2000 5.90 6.80 0.21
Aug. 2000 6.23 4.03 0.13
Sept. 2000 3.79 3.38 0.07
Oct. 2000 2.04 3.19 0.03x
Nov. 2000 0.77 3.19 0.01x
Dec. 2000 0.88 3.19 0.01x
Jan. 2001 0.96 3.00 0.01
Feb. 2001 0.41 4.66 0.01
Mar. 2001 1.78 4.06 0.04
Apr. 2001 1.05 4.88 0.03
12-month total 34.65 – 0.96
Based on cumulative monthly irrigation run-times and precipitation rate of the research site irrigation system as determined by catch-can tests.z
Water samples collected from the irrigation head at the research site in the last week of each month. Samples were transported to the County Sanitation Districts of y
Los Angeles County Water Reclamation Department shortly after collection where they were subsequently analyzed for ammonia nitrogen, organic nitrogen, nitrate nitrogen, and nitrite nitrogen content.
Estimated values based on average concentration of Sept. 2000 and Jan. 2001 samples.x

A4
Table A-3. Monthly average concentrations of N at Industry Hills Golf Courses from May 2000 to Aug. 2001.
23 May 21 June 25 July 25 Aug. 26 Sept. 29 Jan. 26 Feb. 26 Mar. 30 Apr. 29 May 25 June 1 Aug. 30 Aug.
2000 2000 2000 2000 2000 2001 2001 2001 2001 2001 2001 2001 2001
Ammonia N 3.2 3.4 3.5 1.6 2.0 1.6 <3.0 0.4 1.8 0.6 0.3 0.7 3.7
Organic N 3.1 1.9 1.6 1.2 1.0 1.2 1.6 2.0 1.5 2.2 2.4 0.3 1.5
Nitrate N 0.55 1.34 1.40 1.07 <0.30 0.19 <0.05 1.52 1.37 3.52 3.07 1.50 0.60
Nitrite N 0.33 0.75 0.30 0.16 0.08 <0.01 <0.01 0.14 0.21 0.88 0.34 0.27 0.44
Total N 7.18 7.39 6.80 4.03 <3.38 <3.00 <4.66 4.06 4.88 7.20 6.11 2.77 6.24
Table A-4. Monthly average concentrations of N at the San Jose Creek Water Reclamation Plant, East (SJC-WRP) from May 2000 to Aug. 2001.
May 21 June 10 July 17 Aug. 11 Sept. 2 Oct. 19 Dec. 10 Jan. 8 Feb. 6 Mar. 17 Apr. 14 May 11 June 24 July 6 Aug.
2000 2000 2000 2000 2000 2000 2000 2001 2001 2001 2001 2001 2001 2001 2001
Ammonia N 9.7 9.2 9.0 6.4 6.8 8.5 6.3 6.2 7.3 7.8 7.3 7.3 5.0 5.4 7.0
Organic N 2.6 1.7 1.9 1.5 1.2 1.6 1.4 1.3 1.5 1.1 1.7 1.8 1.6 1.7 1.5
Nitrate N 2.02 1.79 3.33 3.28 3.24 2.81 3.66 3.78 3.48 3.36 4.20 4.83 4.96 4.12 3.16
Nitrite N 0.84 1.02 0.96 0.53 0.30 0.50 0.71 0.51 0.60 0.72 0.60 0.57 0.49 0.39 0.46
Total N 15.16 13.71 15.19 11.71 11.54 13.41 12.07 11.79 12.88 12.98 13.80 14.50 12.05 11.61 12.12

A5
Figure A-1. Concentrations of total N from Industry Hills Golf Courses from May 2000 to Aug. 2001and San Jose Creek Water Reclamation Plant, East from Oct. 1997 to Aug. 2001.
0
2
4
6
8
10
12
14
16
18
20
Oct
-97
Jan-
98
Apr
-98
Jul-9
8
Oct
-98
Jan-
99
Apr
-99
Jul-9
9
Oct
-99
Jan-
00
Apr
-00
Jul-0
0
Oct
-00
Jan-
01
Apr
-01
Jul-0
1
Date
To
tal N
(m
g/L
N)
Industry Hills GC San Jose Creek Plant

A6
Table A-5. Annual average (January to December) concentrations of N at the San Jose Creek Water Reclamation Plant, East.
Year Ammonia N Organic N Nitrate N Nitrite N Total N
---------------------------------------------------------------- mg·L ---------------------------------------------------------------1
1975 7.0 1.6 4.4 0.25 13.25
1976 7.3 1.6 4.5 0.29 13.69
1977 11.9 2.1 2.1 0.67 16.77
1978 19.7 3.3 0.8 0.56 24.36
1979 16.6 2.0 1.0 0.59 20.19
1980 12.9 2.3 0.7 0.63 16.50
1981 14.4 1.8 0.4 0.45 17.06
1982 16.2 1.8 0.5 0.38 18.84
1983 14.1 2.0 1.4 0.93 18.47
1984 13.7 1.8 1.0 0.89 17.36
1985 11.4 1.7 2.5 1.03 16.63
1986 11.7 1.7 1.4 0.57 15.40
1987 12.3 1.6 0.7 0.60 15.12
1988 11.1 1.7 1.6 0.63 14.95
1989 11.6 2.0 0.7 0.66 14.95
1990 16.0 1.6 0.4 0.76 18.80
1991 12.7 1.7 2.9 0.96 18.25
1992 10.8 1.7 3.6 0.84 16.90
1993 9.0 1.2 2.3 1.76 14.32
1994 6.4 1.4 4.4 1.35 13.58
1995 7.6 1.7 3.4 1.48 14.21
1996 8.4 1.4 3.6 1.41 14.85
1997 9.8 1.4 1.92 1.24 14.36
1998 8.7 1.8 2.68 1.30 14.44
1999 9.9 1.8 2.38 1.11 15.18
2000 8.9 1.6 2.52 0.83 13.84

A7
Table A-6. Overview of major activities for the annual bluegrass management study.
Date Activity
1 June 1998 to Application of HydroJect treatments for 1998 (applied every 4 weeks).
12 Oct. 1998
3 June 1998 to Application of fertilizer treatments (applied every 3 weeks).
11 Sept. 2000
12 Aug. 1998 to Clipping samples taken for NIRS and wet chemistry analyses (taken every 6 weeks) and Minolta spectrophotometer
26 Sept. 2000 measurements (taken every 6 weeks through Jan. 2000 and every 3 weeks from Feb. to Sept. 2000).
12 Aug. 1998 to Visual turfgrass quality ratings (taken every 6 weeks for a total of 15 rating dates), visual turfgrass color ratings
26 Sept. 2000 (taken every 6 weeks through Jan. 2000 and every 3 weeks from Feb. to Sept. 2000 for a total of 23 rating dates).Note: ratings for seedhead coverage (16 rating dates), percent mottling/patchiness (11 rating dates), percent wiltingand rolling (four rating dates), percent cool-season brown patch coverage (two rating dates), percent scalping(three rating dates), and percent phytotoxicity (one rating date) were taken on an as-needed basis during thisperiod.
22 Oct. 1998 Core cultivation and topdressing.
21 Dec. 1998 Clipping yield [mowing height at 3.96 mm (0.156 inch)].
23 Mar. 1999 Clipping yield [mowing height at 3.96 mm (0.156 inch)].
31 Mar. 1999 Irrigation water sample taken (analysis by DANR).
7 May 1999 Soil core samples taken for elemental and morphological analyses.
28 May 1999 to Application of HydroJect treatments for 1999 (applied every 3 weeks).
5 Oct. 1999
30 July 1999 Clipping yield [mowing height at 3.96 mm (0.156 inch)]; irrigation water sample taken (analysis by DANR).
10 Sept. 1999 Soil cores taken for elemental and morphological analyses.
22 Oct. 1999 Core cultivation [with 1.59 cm (0.625 inch) tines] and topdressing.
21 Dec. 1999 Clipping yield [mowing height at 3.30 mm (0.130 inch)]; irrigation water sample taken (analysis by DANR).
22 Mar. 2000 Clipping yield [mowing height at 3.81 mm (0.150 inch)]; irrigation water sample taken (analysis by DANR).
5 Apr. 2000 to Application of HydroJect treatments for 2000 (applied every 3 weeks).
18 Sept. 2000
5 May 2000 Soil core samples taken for elemental and morphological analyses.
23 May 2000 Irrigation water samples collected (analysis by L.A. County).
21 June 2000 Irrigation water samples collected (analysis by L.A. County).
25 July 2000 Clipping yield [mowing height at 3.81 mm (0.150 inch)]; irrigation water samples collected (analyses by DANR andL.A. County).
25 Aug. 2000 Irrigation water samples collected (analysis by L.A. County).
8 Sept. 2000 Soil core samples taken for elemental and morphological analyses.
26 Sept. 2000 Irrigation water samples collected (analysis by L.A. County).

A8
Table A-7. Calendar of activities for the annual bluegrass management study.
Date Activity
1 June 1998 Mowing height at 3.96 mm (0.156 inch).Initial application of HydroJect treatments.
3 June 1998 Pre-trial soil fertilizer test.Initial application of fertilizer treatments.
16 June 1998 Plots verticut.Pesticide application (Chipco) to control dollar spot.
19 June 1998 Fertilizer treatments applied.Mowing height at 4.75 mm (0.187 inch).
23 June 1998 HydroJect treatments applied.
28 June 1998 Leaching event.
29 June 1998 Plots verticut.
14 July 1998 Fertilizer treatments applied.
21 July 1998 HydroJect treatments applied.
23 July 1998 Pesticide application (Dursban) to control cutworms.
27 July 1998 Plots verticut.Leaching event.
5 Aug. 1998 Fertilizer treatments applied.
10 Aug. 1998 Pesticide application (Daconil) to control dollar spot.
12 Aug. 1998 Initial clipping samples taken for NIRS and wet chemistry analyses.Initial Minolta spectrophotometer measurements.Initial visual turfgrass ratings (quality and color).
20 Aug. 1998 HydroJect treatments applied.
26 Aug. 1998 Fertilizer treatments applied.
3 Sept. 1998 Pesticides applied (Heritage and Daconil) to control summer patch and prevent anthracnose
8 Sept. 1998 Plots verticut.
16 Sept. 1998 Fertilizer treatments applied.
28 Sept. 1998 Leaching event.Mowing height at 3.58 mm (0.141 inch).
29 Sept. 1998 HydroJect treatments applied.
30 Sept. 1998 Clipping samples taken for NIRS and wet chemistry analyses.Minolta spectrophotometer measurements.
6 Oct. 1998 Fertilizer treatments applied.
12 Oct. 1998 HydroJect treatments applied.
19 Oct. 1998 Mowing height at 3.96 mm (0.156 inch).
20 Oct. 1998 Plots lightly topdressed.
22 Oct. 1998 Core cultivation [with 1.59 cm (0.625 inch) tines] and topdressing.
28 Oct. 1998 Fertilizer treatments application.
29 Oct. 1998 Pesticide application (Eagle) to control dollar spot.
9 Nov. 1998 Pesticide application (Eagle) to control dollar spot.
10 Nov. 1998 Clipping samples taken for NIRS and wet chemistry analyses.Minolta spectrophotometer measurements.Visual turfgrass ratings (color).
18 Nov. 1998 Fertilizer treatments applied.Pesticide application (Terraclor) to prevent snow mold.
19 Nov. 1998 Plots verticut and lightly topdressed
8 Dec. 1998 Fertilizer treatments applied.
11 Dec. 1998 Plots verticut (with groomers) and lightly topdressed.
21 Dec. 1998 Initial clipping yield [mowing height at 3.96 mm (0.156 inch)].
22 Dec. 1998 Visual turfgrass ratings (quality and color).
6 Jan. 1999 Fertilizer treatments applied.
8 Jan. 1999 Plots lightly topdressed.
19 Jan. 1999 Clipping samples taken for NIRS and wet chemistry analyses.Minolta spectrophotometer measurements.Visual turfgrass ratings (quality and color).
29 Jan. 1999 Fertilizer treatments applied.
2 Feb. 1999 Plots verticut and lightly topdressed.
12 Feb. 1999 Pesticide application (Terraclor) to control snow mold.
17 Feb. 1999 Fertilizer treatments applied.
25 Feb. 1999 Leaching event.

A9
Table A-7 (continued). Calendar of activities for the annual bluegrass management study.
Date Activity
2 Mar. 1999 Clipping samples taken for NIRS and wet chemistry analyses.Minolta spectrophotometer measurements.Visual turfgrass ratings (quality, color, and seedhead coverage).Plots verticut.
10 Mar. 1999 Fertilizer treatments applied.
23 Mar. 1999 Clipping yield [mowing height at 3.96 mm (0.156 inch)].
25 Mar. 1999 Pesticide application (Terraclor) to control snow mold.
29 Mar. 1999 Plots verticut (two passes).
30 Mar. 1999 Plots lightly topdressed.
31 Mar. 1999 Fertilizer treatments applied.Irrigation water sample taken for analysis by DANR.Visual turfgrass ratings (seedhead coverage).
Apr. to June 1999 Grooming once per week.
1 Apr. 1999 Pesticide application (Betasan) for crabgrass pre-emergence.
8 Apr. 1999 Pesticide application (Terraclor) to control snow mold.
9 Apr. 1999 Plots verticut.
13 Apr. 1999 Clipping samples taken for NIRS and wet chemistry analyses.Minolta spectrophotometer measurements.Visual turfgrass ratings (color and seedhead coverage).
21 Apr. 1999 Fertilizer treatments applied.
4 May 1999 Plots verticut.
6 May 1999 Mowing height at 3.76 mm (0.148 inch).
7 May 1999 Soil core samples taken for elemental and morphological analyses.
10 May 1999 Plots verticut.
11 May 1999 Plots lightly topdressed.
14 May 1999 Fertilizer treatments applied.
21 May 1999 Pesticide applications (Prostar and Banner) to control cool-season brown patch.
28 May 1999 Clipping samples taken for NIRS and wet chemistry analyses.Minolta spectrophotometer measurements.Visual turfgrass ratings (quality, color, seedhead coverage, and percent cool-season brown patch coverage).HydroJect treatments applied.
1 June 1999 Plots verticut.
2 June 1999 Fertilizer treatments applied.
3 June 1999 Mowing height at 3.56 mm (0.140 inch).
9 June 1999 HydroJect treatments applied.
11 June 1999 Pesticide application (Banner) to prevent summer patch.
22 June 1999 Plots verticut.
23 June 1999 Fertilizer treatments applied.
26 June 1999 Leaching event.
29 June 1999 Mowing height at 3.30 mm (0.130 inch).
1 July 1999 HydroJect treatments applied.
2 July 1999 Pesticide application (Daconil) to control dollar spot.
6 July 1999 Clipping samples taken for NIRS and wet chemistry analyses.Minolta spectrophotometer measurements.Visual turfgrass ratings (quality, color, seedhead coverage, and percent mottling/patchiness).
13 July 1999 Plots lightly topdressed.
14 July 1999 Fertilizer treatments applied.
19 July 1999 HydroJect treatments applied.
20 July 1999 Mowing height at 3.96 mm (0.156 inch).
21 July 1999 Pesticide application (Dursban) to control cutworms.
28 July 1999 Pesticide application (Dursban) to control cutworms.
30 July 1999 Clipping yield [mowing height at 3.96 mm (0.156 inch)].Irrigation water sample taken for analysis by DANR.Visual turfgrass ratings (percent mottling/patchiness and percent cool-season brown patch coverage).
4 Aug. 1999 Fertilizer treatments applied.
9 Aug. 1999 HydroJect treatments applied.Visual turfgrass ratings (percent mottling/patchiness and percent wilting and rolling).
17 Aug. 1999 Clipping samples taken for NIRS and wet chemistry analyses.Minolta spectrophotometer measurements.Visual turfgrass ratings (quality, color, seedhead coverage, and percent mottling/patchiness).

A10
Table A-7 (continued). Calendar of activities for the annual bluegrass management study.
Date Activity
18 Aug. 1999 Pesticide application (Heritage and Daconil) to prevent summer patch.
25 Aug. 1999 Fertilizer treatments applied.
31 Aug. 1999 HydroJect treatments applied.Plots verticut (two passes) and lightly topdressed.
1 Sept. 1999 Mowing height at 3.81 mm (0.150 inch).
10 Sept. 1999 Soil cores taken for elemental and morphological analyses.
17 Sept. 1999 Fertilizer treatments applied.
20 Sept. 1999 HydroJect treatments applied.
27 Sept. 1999 Leaching event.
28 Sept. 1999 Clipping samples taken for NIRS and wet chemistry analyses.Minolta spectrophotometer measurements.Visual turfgrass ratings (quality, color, and seedhead coverage).
30 Sept. 1999 Pesticide application (Dursban) to control cutworms.
2 Oct. 1999 Mowing height at 3.30 mm (0.130 inch).
5 Oct. 1999 HydroJect treatments applied.Plots lightly topdressed.
6 Oct. 1999 Fertilizer treatments applied.
12 Oct. 1999 Visual turfgrass ratings (percent mottling/patchiness and percent wilting and rolling).
18 Oct. 1999 Mowing height at 3.96 mm (0.156 inch).
22 Oct. 1999 Core cultivation [with 1.59 cm (0.625 inch) tines] and topdressing.
27 Oct. 1999 Fertilizer treatments applied.
9 Nov. 1999 Clipping samples taken for NIRS and wet chemistry analyses.Minolta spectrophotometer measurements.Visual turfgrass ratings (color and seedhead coverage).
10 Nov. 1999 Plots verticut (two passes) and lightly topdressed.
19 Nov. 1999 Fertilizer treatments applied.
22 Nov. 1999 Mowing height at 3.81 mm (0.150 inch).Leaching event.
30 Nov. 1999 Plots hand mowed and groomed in one direction.
1 Dec. 1999 Plots groomed in one direction.
6 Dec. 1999 Plots verticut and lightly topdressed.
8 Dec. 1999 Fertilizer treatments applied.
20 Dec. 1999 Mowing height at 3.30 mm (0.130 inch).
21 Dec. 1999 Clipping yield [mowing height at 3.30 mm (0.130 inch)].Irrigation water sample taken for analysis by DANR.Fertilizer treatments applied.
27 Dec. 1999 Mowing height at 3.81 mm (0.150 inch).
4 Jan. 2000 Plots verticut and lightly topdressed.
5 Jan. 2000 Fertilizer treatments applied.
18 Jan. 2000 Clipping samples taken for NIRS and wet chemistry analyses.Minolta spectrophotometer measurements.Visual turfgrass ratings (quality, color, and percent mottling/patchiness).
24 Jan. 2000 Mowing height at 3.30 mm (0.130 inch).
26 Jan. 2000 Fertilizer treatments applied.
3 Feb. 2000 Plots verticut (two passes) and lightly topdressed.
9 Feb. 2000 Minolta spectrophotometer measurements.Visual turfgrass ratings (color).
14 Feb. 2000 Pesticide application (PCNB 75% WP) to control pink snow mold.
29 Feb. 2000 Clipping samples taken for NIRS and wet chemistry analyses.Minolta spectrophotometer measurements.Visual turfgrass ratings (quality, color, and seedhead coverage).
7 Mar. 2000 Plots verticut and lightly topdressed.
8 Mar. 2000 Fertilizer treatments applied.
20 Mar. 2000 Mowing height at 3.81 mm (0.150 inch).
22 Mar. 2000 Clipping yield [mowing height at 3.81 mm (0.150 inch)].Minolta spectrophotometer measurements.Irrigation water sample taken for analysis by DANR.Visual turfgrass ratings (color and seedhead coverage).
29 Mar. 2000 Fertilizer treatments applied.
5 Apr. 2000 HydroJect treatments applied.

A11
Table A-7 (continued). Calendar of activities for the annual bluegrass management study.
Date Activity
10 Apr. 2000 Plots verticut (two passes) and lightly topdressed.
11 Apr. 2000 Clipping samples taken for NIRS and wet chemistry analyses.Minolta spectrophotometer measurements.Visual turfgrass ratings (quality, color, and seedhead coverage).
17 Apr. 2000 Mowing height at 3.30 mm (0.130 inch).
17–18 Apr. 2000 Leaching event via rainfall [71 mm (2.8 inches)].
19 Apr. 2000 Fertilizer treatments applied.
24 Apr. 2000 HydroJect treatments applied.
26 Apr. 2000 Plots verticut and lightly topdressed.
2 May 2000 Pesticide application (Heritage and Curalan) to prevent dollar spot and summer patch.
3 May 2000 Minolta spectrophotometer measurements.Visual turfgrass ratings (color, seedhead coverage, and percent cool-season brown patch coverage).
5 May 2000 Soil core samples taken for elemental and morphological analyses.
8 May 2000 Plots verticut (two passes) and lightly topdressed.
10 May 2000 Fertilizer treatments applied.
15 May 2000 HydroJect treatments applied.
23 May 2000 Clipping samples taken for NIRS and wet chemistry analyses.Minolta spectrophotometer measurements.Visual turfgrass ratings (quality, color, seedhead coverage, and percent mottling/patchiness).Irrigation water samples collected for analysis by L.A. County.
31 May 2000 Fertilizer treatments applied.Leaching event.
5 June 2000 HydoJect treatments applied.
6 June 2000 Plots verticut (two passes) and lightly topdressed.
19 June 2000 Mowing height at 3.81 mm (0.150 inch).
21 June 2000 Fertilizer treatments applied.Irrigation water samples collected for analysis by L.A. County.
22 June 2000 Plots verticut and lightly topdressed.Pesticide application (Heritage and Fore) to prevent dollar spot and summer patch.
25 June 2000 Leaching event cancelled due to high temperatures.
26 June 2000 HydroJect treatments applied.
5 July 2000 Minolta spectrophotometer measurements.Visual turfgrass ratings (quality, color, seedhead coverage, percent mottling/patchiness, and percent scalping).
6 July 2000 Plots verticut and lightly topdressed.
7 July 2000 Clipping samples taken for NIRS and wet chemistry analyses.
12 July 2000 Fertilizer treatments applied.Pesticide application (Heritage and Fore) to prevent dollar spot and summer patch.
17 July 2000 HydroJect treatments applied.
19 July 2000 Visual turfgrass ratings (percent mottling/patchiness and percent wilting and rolling).
25 July 2000 Clipping yield [mowing height at 3.81 mm (0.150 inch)].Minolta spectrophotometer measurements.Irrigation water samples collected for analysis by DANR and L.A. County.Visual turfgrass ratings (color).
30 July 2000 Leaching event cancelled due to high temperatures.
2 Aug. 2000 Fertilizer treatments applied.
7 Aug. 2000 HydroJect treatments applied.
18 Aug. 2000 Clipping samples taken for NIRS and wet chemistry analyses.Minolta spectrophotometer measurements.Visual turfgrass ratings (quality, color, seedhead coverage, percent mottling/patchiness, and percent scalping).Mowing height at 4.762 mm (0.1875" inch).
22 Aug. 2000 Pesticide application (Heritage) to prevent dollar spot and summer patch.Pesticide application (Scimitar) to control cutworms.
23 Aug. 2000 Fertilizer treatments applied.
25 Aug. 2000 Irrigation water samples collected for analysis by L.A. County.
28 Aug. 2000 HydroJect treatments applied.
5 Sept. 2000 Minolta spectrophotometer measurements.Visual turfgrass ratings (color).Plots verticut (two passes) and lightly topdressed.
8 Sept. 2000 Soil core samples taken for elemental and morphological analyses.

A12
Table A-7 (continued). Calendar of activities for the annual bluegrass management study.
Date Activity
11 Sept. 2000 Mowing height at 3.96 mm (0.156 inch).Fertilizer treatments applied.
18 Sept. 2000 HydroJect treatments applied.
19 Sept. 2000 Visual turfgrass ratings (seedhead coverage, mottling/patchiness, and percent wilting and rolling).
26 Sept. 2000 Clipping samples taken for NIRS and wet chemistry analyses.Minolta spectrophotometer measurements.Visual turfgrass ratings (quality, color, percent scalping, and percent phytotoxicity).Irrigation water samples collected for analysis by L.A. County.

A13
Table A-8. Toro Research and Development Laboratory methods.
ANALYSES OF TOTAL N, C, and S
Quantitative determination of total nitrogen and total carbon in botanical materials using a resistance furnace and a thermal conductivity detector (combustion gas analyzer method).
Quantitative determination of total sulfur in botanical materials using an induction furnace and a thermal conductivity detector (combustion gas analyzer method).
Methodologies from Western States Program, Ver. 4.10 (2/10/98).
Literature:Beaton, J.D., G.K. Burns and J. Platou. 1968. Determination of sulfur in soils and plant material. Technical Bulletin No. 14, The Sulfur Institute, Washington, D.C. 1968.
McGeehan, S.L. and D.V. Naylor. 1988. Automated instrumental analysis of carbon and nitrogen in plant and soil samples. Comm. in Soil Sci. Plant Anal. 19:493-505.
Sheldrick, B.H. 1986. Test of the LECO CHN-600 Determinator for soil carbon and nitrogen analysis. Can. J. Soil Sci. 66:543-545.
Shepers, J.S., D.D. Francis, and M.T. Thompson. 1989. Automated total nitrogen of soil and plant samples. Comm. in Soil Sci. Plant Anal. 20:949-959.
Sweeney, R.A. 1989. Generic combustion method for determination of crude protein in feeds: collaborative study. J. Assoc. Off. Anal. Chem. 72:770-774.
Yeomans, J.C. and J.M. Bremmer. 1991. Carbon and nitrogen analysis of soils by automated combustion techniques. Comm. in Soil Sci. Plant Anal. 22:843-850.
ANALYSES OF TOTAL P, K, Ca, Mg, Na, Fe, Zn, Mn, Cu, B, Mo, Al, and Ti
Quantitative determination of the concentration of P, K, Ca, Mg, Na, Fe, Zn, Mn, Cu, B, Mo, Al, and Ti in botanical materials using a high temperature dry oxidation of the organicmatter and dissolution of the ash with hydrochloric acid. Digest analyte concentrations determined by inductively coupled Ar plasma atomic emission spectrometry (ICAP-AES).
Methodology from AOAC Official Method 985.01 (Metals and Other Elements in Plant and Pet Foods), AOAC Official Methods of Analysis (1995), Supplement Mar. 1996, 3.2.06.Also from Western States Program, Ver. 4.10 (2/10/98).
Literature:Baker, D.E., G.W. Gorsline, C.G. Smith, W.L. Thomas, W.E. Grubs, and J.L. Ragland. 1964. Techniques for rapid analysis of corn leaves for eleven elements. Agron. J. 56:133-136.
Chapman, H.D. and P.F. Pratt. 1961. Methods of analysis for soils, plants, and waters. University of California, Berkeley, Division of Agricultural Sciences. Priced Publication 4034.
Isaac, R.A. and J.B. Jones Jr. 1972. Effects of various dry ashing temperatures on the determination of 13 elements in five plant tissues. Comm. Soil Sci. Plant Anal. 3:261-269.
Loshe, G. 1982. Microanalytical azomethine-H method for boron determination in plant tissue. Comm. Soil Sci. Plant Anal. 13:127-134.
Munter, R.C., T.L. Halverson and R.D. Anderson. 1984. Quality assurance of plant tissue analysis by ICP-AES. Comm. Soil Sci. Plant Anal. 15:1285-1322.
Soltanpour, P.N., G.W. Johnson, S.M. Workman, J.B. Jones and R.O. Miller. 1996. Inductively coupled plasma emission spectrometry and inductively coupled plasma-massspectrometry, p. 91-139. In: J.M. Bartels et al. (ed.) Methods of soil analysis: Part 3 Chemical methods. 3rd. ed. ASA and SSSA, Madison, WI. Book series no. 5.
Wear, J.I. 1985. Boron. p. 1059-1063. In: C.A. Black, et al (eds.) Methods of soil analysis, Part 2. Agron. Monogr. 9, ASA, Madison, WI.

A14
Table A-9. DANR Analytical Laboratory soil, plant and water analyses methods.
Note: The soil and plant analyses information excerpted from the DANR Analytical Laboratory methodology and citation handoutdated 3/5/97. The water analyses information was provided by DANR in May 1998 upon request.
SOIL SALINITY / ALKALINITY / TOXICITY ANALYSES
pH Semi-quantifies soil pH using the saturated paste and pH meter. Determination: U.S. Salinity Laboratory Staff, 1954.
EC Semi-quantifies the amount of soluble salts in the saturation paste extract using conductivity meter. Determination:e
Rhoades, 1982.
HCO , Quantification of the bicarbonate (HCO ) and carbonate (CO ) in the saturated paste extract by titration with 0.053 3 3
CO Normal H SO acid. Determination: Nelson, 1982.3 2 4
Cl Amount of chloride based on electrometric titration of the saturated paste extract by chloridometer. Determination:Rhoades, 1982.
B ICP-AES determination of amount of boron in saturated paste extract. Extraction: Rhoades, 1982; determination:Soltanpour, et al, 1982.
Ca, Mg Amounts of soluble calcium and magnesium in the saturated paste extract by inductively coupled plasmic atomicemission spectrometry. Extraction: Lanyon and Heald, 1982; determination, Soltanpour, et al, 1982.
Na, Amounts of soluble potassium and sodium in the saturated paste extract by emission spectrometry. Determination:K(sol) Knudsen, Peterson and Pratt, 1982.
SAR Sodium Absorption Ratio estimated calculation from calcium, magnesium and sodium on saturated paste extract.Calculation: U.S. Salinity Laboratory, 1954.
ESP Estimated value for exchangeable sodium percentage. Calculated from SAR values. Calculation: U.S. SalinityLaboratory, 1954.
SOIL FERTILITY ANALYSES
X-K, Equilibrium extraction of soil for plant available exchangeable potassium, sodium, calcium and magnesium usingX-Na, 1 Normal ammonium acetate (pH 7.0) and subsequent determination by atomic absorption/emission spectrometry.X-Ca, Extraction: Knudsen, Peterson and Pratt, 1982 and Lanyon and Heald, 1982. Measurement of exchangeable mineralsX-Mg residing on the soil colloid exchange sites is by displacement with buffered ammonium acetate solution. Determination:
Franson, 1985.
Cu, Zn Equilibrium extraction of soil using DTPA and subsequent determination by atomic absorption spectrometry. Extraction: Mn, Fe Lindsay and Norvell, 1978; determination: Franson, 1985.
Olsen-P Extractable phosphate based on alkaline extraction by 0.5 Normal NaHCO . Plant available phosphate for soil with pH3
greater than 6.5 by ascorbic acid reduction of phosphomolybdate complex and measurement by spectrophotometry. Extraction and determination: Olsen, et al, 1954.
TKN Total Kjeldahl Nitrogen in soil. Total reduced nitrogen by the wet oxidation of soil organic matter using standard Kjeldahlprocedure with sulfuric acid and digestion catalyst. Extraction: Isaac and Johnson, 1976. Determination: Carlson, 1978.
SOIL PHYSIO-CHEMICAL ANALYSES
OM Organic Matter by potassium dichromate reduction of organic carbon and subsequent spectrophotometric measurement(modified Walkley-Black). Determination: Nelson and Sommers, 1982.
CEC Cation Exchange Capacity by barium acetate saturation and calcium replacement. Determination: Rible and Quick, 1960and Janitzky, 1986.
PSA Particle Size Analysis of sand, silt and clay in soil suspension by hydrometer. Determination: Gee and Bauder, 1979.

A15
Table A-9 (continued). DANR Analytical Laboratory soil, plant and water analyses methods.
PLANT TISSUE ANALYSES
N Total Nitrogen by Nitrogen Gas Analyzer utilizing induction furnace and thermal conductivity (LECO FP-428). Samplesize 100 mg, results corrected to 100% dry matter basis. Determination: Sweeney, 1989.
K Total K, extraction by 2% acetic acid extraction. Quantitative determination by atomic emission spectrometry (AES). Extraction: Johnson and Ulrich, 1959; determination: Franson, 1985.
B, Ca, Totals, microwave acid digestion/dissolution of sample. Quantitative determination by atomic emission spectroscopyMg, Mo, (ICP-AES). Digestion: Sah and Miller, 1992.P, S
Na Totals, microwave acid digestion/dissolution of sample. Quantitative determination by atomic emission spectrometry(AES). Digestion: Sah and Miller, 1992; determination, Franson, 1985.
Cu, Fe, Totals, microwave acid digestion/dissolution of sample. Quantitative determination by atomic emission spectrometryMn, Zn (AAS). Digestion: Sah and Miller, 1992; determination, Franson, 1985.
WATER SALINITY / ALKALINITY / TOXICITY ANALYSES
pH Semi-quantifies H O pH using the pH meter. U.S. Salinity Laboratory, 1954. 2
EC Semi-quantifies the amount of soluble salts in H O using the conductivity meter. Rhoades, 1982.2
HCO , Quantification of the bicarbonate (HCO ) and carbonate (CO ) in H O by titration with 0.05 Normal H SO acid.3 3 3 2 2 4
CO Rhoades, 1982.3
Cl Amount of chloride based on electrometric titration of H O by chloridometer. Rhoades, 1982.2
P Quantitative determination by ascorbic acid reduction of phosphomolybdate complex and quantitative measurement by flow injection analysis. Franson, 1985.
SO -S Amount of sulfate sulfur present in H O, by inductively coupled plasmic emission spectrometry. Soltanpour, et al, 1982.4 2
B ICP-AES determination of amount of boron in H O. Soltanpour, et al, 1982.2
Ca, Mg Amounts of soluble calcium and magnesium in H O by inductively coupled plasmic atomic emission spectrometry.2
Soltanpour, et al, 1982.
Na, Amounts of soluble potassium and sodium in H O by emission spectrometry. Knudsen, 1982.2
K (sol)
SAR Sodium Absorption Ratio estimated calculation from calcium, magnesium and sodium in H O. Calculation: U.S. 2
Salinity Laboratory Staff, 1954.
ESP Estimated value for exchangeable sodium percentage. Calculated from SAR values. Calculation: U.S. Salinity Laboratory Staff, 1954.
NO -N, Determination by diffusion-conductivity analyzer. Carlson, 1978.3
NH -N4
TKN Total Kjeldahl Nitrogen in H O. Total reduced nitrogen by the wet oxidation of H O using standard Kjeldahl procedure with2 2
sulfuric acid and digestion catalyst. Carlson, 1978.
Zn, Cu, Determination by atomic absorption spectrometry. DeBoer and Reisenauer, 1973.Mn, Fe
Se Total selenium using nitric/perchloric acid digestion/dissolution of sample. Quantitative determination by vapor generation by inductively coupled plasma atomic emission spectroscopy (ICP-AES). Determination: Tracy and Moeller,1990.

A16
Table A-9 (continued). DANR Analytical Laboratory soil, plant and water analyses methods.
References:
Carlson, R. M. 1978. Automated separation and conductimetric determination of ammonia and dissolved carbon dioxide. Anal. Chem.50:1528-1531.
DeBoer, G. J. and H. M. Reisenauer, 1973. DTPA as an Extractant of Available Soil Iron. 121-128. Comm. In Soil Sci. Plant Anal. 4 (2).
Franson, M.A.H. (ed.) 1985. Method 303A. 157-160. In: Standard Methods for the Examination of Water and Wastewater. 16th Edition.APHA, AWWA, WPCF; Washington, D.C.
Gee, G.W. and J.W. Bauder. 1979. Particle size analysis by hydrometer: a simplified method for routine textural analysis and asensitivity test of measurement parameters. Soil Sci. Soc. Am. J., Madison, WI 43:1004-1007.
Isaac, R.A. and W.C. Johnson. 1976. Determination of total nitrogen in plant tissue, using a block digestor. J. Assoc. Off. Anal. Chem.59:98-100.
Janitzky, P. 1986. Cation exchange capacity. 21-23. In: Singer, M.J. and P. Janitzky (ed.) Field and Laboratory Procedures Used in a SoilChromosequence Study. U.S. Geological Survey Bulletin 1648.
Johnson, C.M. and A. Ulrich. 1959. Analytical methods for use in plant analysis. Bulletin 766. Berkeley: University of California,Agricultural Experiment Station. 26-78.
Knudsen, D., G.A. Peterson and P.F. Pratt. 1982. Lithium, sodium, and potassium. 225-246. In: A. L. Page (ed.) Methods of SoilAnalysis: Part 2: Chemical and Microbiological Properties. Monograph Number 9 (Second Edition). ASA, Madison, WI.
Lanyon, L.E. and W.R. Heald. 1982. Magnesium, calcium, strontium, and barium. 247-262. In: A. L. Page (ed.) Methods of Soil Analysis:Part 2: Chemical and Microbiological Properties. Monograph Number 9 (Second Edition). ASA, Madison, WI.
Lindsay, W.L. and W.A. Norvell. 1978. Development of a DTPA soil test for zinc, iron, manganese, and copper. Soil Sci. Soc. Am. J.Madison, WI. 42:421-428.
Nelson, D.W. and L.E. Sommers. 1982. Total carbon, organic carbon, and organic matter. 539-579. In: A. L. Page (ed.) Methods of SoilAnalysis: Part 2: Chemical and Microbiological Properties. Monograph Number 9 (Second Edition). ASA, Madison, WI.
Nelson, R.E. 1982. Carbonate and gypsum. 181-197. In: A. L. Page (ed.) Methods of Soil Analysis: Part 2: Chemical and MicrobiologicalProperties. Monograph Number 9 (Second Edition). ASA, Madison, WI.
Olsen, S.R., C.V. Cole, F.S. Watanabe, and L.A. Dean. 1954. Estimation of available phosphorus in soils by extraction with sodiumbicarbonate. U.S. Dept. Agr. Cir. 939: 1-19.
Rhoades, J.D. 1982. Soluble salts. 167-179. In: A. L. Page (ed.) Methods of Soil Analysis: Part 2: Chemical and MicrobiologicalProperties. Monograph Number 9 (Second Edition). ASA, Madison, WI.
Rible, J.M. and J. Quick. Apr., 1960. Water Soil Plant Tissue Tentative methods of analysis for diagnostic purposes. Method S-19:0.University of California Agricultural Experiment Service.
Sah, R.N. and R.O. Miller. 1992. Spontaneous reaction for acid dissolution of biological tissues in closed vessels. Anal. Chem. 64:230-233.
Soltanpour, P.N., J. Benton Jones, Jr., and S. M. Workman. 1982. Optical emission spectrometry. 29-65. In: A. L. Page (ed.) Methods ofSoil Analysis: Part 2: Chemical and Microbiological Properties. Monograph Number 9 (Second Edition). ASA, Madison, WI.
Sweeney, R.A. 1989. Generic combustion method for determination of crude protein in feeds: collaborative study. J. Assoc. Off. Anal.Chem. 72:770-774.
Tracy, M. L. and G. Moeller. 1990. Continuous flow vapor generation for inductively coupled argon plasma spectrometric analysis. PartI. Selenium. J. Assoc. Off. Anal. Chem. 73:404-410.
U.S. Salinity Laboratory Staff. 1954. L.A. Richards (ed.) Diagnosis and Improvement of Saline and Alkali Soils. U.S. Department ofAgriculture Handbook no. 60.

A17
Table A-10. The effect of N, K O, and FeSO treatments on clipping carbon content of an annual bluegrass putting green from 12 Aug. 1998 to 26 Sept. 2000.2 4
Total C (%)z
Treatments 1998 1998 1998 1999 1999 1999 1999 1999 1999 1999 2000 2000 2000 2000 2000 2000
Date
12 30 18 19 13 28 6 17 28 9 18 11 23 7 18 26Aug. Sept. Nov. Jan. Apr. May July Aug. Sept. Nov. Jan. Apr. May July Aug. Sept.
2 Mar.1999
N-fertility rate treatmentsy
487.9 kg·ha (10.0 lb/1000 ft ) N/yr 44.87 43.63 44.41 47.47 48.66 48.31 47.61 48.18 48.84 48.97 48.46 47.61 47.07 49.46 47.92 47.50 48.83-1 2 x
244.0 kg·ha (5.0 lb/1000 ft ) N/yr 44.84 43.16 43.97 46.12 46.84 47.48 47.10 47.08 48.34 49.35 48.21 46.58 45.68 48.51 47.46 45.67 49.11-1 2
LSD, P=0.05 0.65 1.20 0.60 0.46 0.68 0.54NS NS NS NS NS NS NS NS NS NS NS
K O-fertility rate treatments2y
585.5 kg·ha (12.0 lb/1000 ft ) K O/yr 45.20 43.37 44.25 46.84 47.99 48.11 47.41 47.46 48.74 49.34 48.30 46.75 46.23 49.07 47.51 45.91 49.05-1 22
195.2 kg·ha (4.0 lb/1000 ft ) K O/yr 44.51 43.43 44.13 46.79 47.71 47.68 47.30 47.80 48.44 48.98 48.37 47.44 46.52 48.83 47.84 47.23 48.91-1 22
LSD, P=0.05 NS NS NS NS NS NS NS NS NS NS NS NS NS NS NS NS NS
FeSO level treatments4w
With FeSO 44.76 43.52 44.26 46.77 47.61 47.97 47.15 47.74 48.72 48.99 48.10 47.60 46.41 48.98 47.54 47.24 48.194
No FeSO 44.95 43.28 44.12 46.87 48.07 47.83 47.57 47.52 48.46 49.33 48.57 46.59 46.34 48.92 47.83 45.81 49.784
LSD, P=0.05 NS NS NS NS NS NS NS NS NS NS NS NS NS NS NS NS NS
Summary of ANOVA effectsv
Nitrogen (N) *** ** ** * ** ***NS NS NS NS NS NS NS NS NS NS NS
Potassium (K) NS NS NS NS NS NS NS NS NS NS NS NS NS NS NS NS NS
N x K **NS NS NS NS NS NS NS NS NS NS NS NS NS NS NS NS
Iron (Fe) NS NS NS NS NS NS NS NS NS NS NS NS NS NS NS NS NS
N x Fe NS NS NS NS NS NS NS NS NS NS NS NS NS NS NS NS NS
K x Fe NS NS NS NS NS NS NS NS NS NS NS NS NS NS NS NS NS
N x K x Fe *NS NS NS NS NS NS NS NS NS NS NS NS NS NS NS NS
Calculated on a dry weight basis and determined by combustion gas analyzer method (see Table A-8 for details).z
N-P O -K O fertility treatments applied foliarly to each main plot every 3 weeks, utilizing a CO sprayer mounted on a cart, and watered in [finish spray volume 855.3 L·ha (2.1 gal/1000 ft )]. N and K O applied at specified annual rates.y -1 22 5 2 2 2
P O applied at 146.4 kg·ha (3.0 lb P O /1000 ft ) per year. See Table 2 for more details.2 5 2 5-1 2
Mean separation with Fisher’s Protected LSD test.x
Fe applied foliarly to each main plot every 3 weeks, at 6.1 kg·ha FeSO (2.0 oz/1000 ft FeSO ) per application, utilizing a CO sprayer mounted on a cart, immediately after N-P O -K O fertility treatments, and not watered in [finish sprayw -1 24 4 2 2 5 2
volume 855.3 L·ha (2.1 gal/1000 ft )].-1 2
Randomized complete block design (RCB) with fertilizer treatments arranged in a 2x2x2 factorial arrangement.v
Nonsignificant or significant at P ≤ 0.05, 0.01, 0.001, respectively.NS, *, **, ***

A18
Table A-11. The effect of N, K O, and FeSO treatments on clipping sulfur content of an annual bluegrass putting green from 12 Aug. 1998 to 26 Sept. 2000.2 4
Total S (%)z
Treatments 1998 1998 1998 1999 1999 1999 1999 1999 1999 1999 2000 2000 2000 2000 2000 2000
Date
12 30 18 19 13 28 6 17 28 9 18 11 23 7 18 26Aug. Sept. Nov. Jan. Apr. May July Aug. Sept. Nov. Jan. Apr. May July Aug. Sept.
2 Mar.1999
N-fertility rate treatmentsy
487.9 kg·ha (10.0 lb/1000 ft ) N/yr 0.46 0.45 0.48 0.68 0.71 0.59 0.52 0.55 0.53 0.57 0.59 0.72 0.58 0.52 0.55 0.57 0.55-1 2 x
244.0 kg·ha (5.0 lb/1000 ft ) N/yr 0.44 0.42 0.47 0.66 0.63 0.49 0.47 0.51 0.49 0.56 0.56 0.66 0.51 0.50 0.52 0.51 0.53-1 2
LSD, P=0.05 0.02 0.02 0.03 0.02 0.02 0.02 0.02 0.01 0.03 0.02 0.02 0.01 0.05NS NS NS NS
K O-fertility rate treatments2y
585.5 kg·ha (12.0 lb/1000 ft ) K O/yr 0.45 0.43 0.48 0.68 0.71 0.55 0.49 0.53 0.51 0.57 0.58 0.69 0.54 0.50 0.53 0.52 0.54-1 22
195.2 kg·ha (4.0 lb/1000 ft ) K O/yr 0.45 0.44 0.47 0.66 0.65 0.53 0.50 0.53 0.51 0.55 0.57 0.69 0.55 0.51 0.54 0.55 0.54-1 22
LSD, P=0.05 0.03 0.01NS NS NS NS NS NS NS NS NS NS NS NS NS NS NS
FeSO level treatments4w
With FeSO 0.45 0.43 0.48 0.67 0.68 0.54 0.49 0.53 0.51 0.55 0.57 0.69 0.55 0.51 0.53 0.54 0.524
No FeSO 0.45 0.44 0.47 0.67 0.68 0.54 0.50 0.53 0.51 0.57 0.59 0.69 0.54 0.51 0.54 0.53 0.564
LSD, P=0.05 0.01 0.02NS NS NS NS NS NS NS NS NS NS NS NS NS NS NS
Summary of ANOVA effectsv
Nitrogen (N) * * *** *** *** *** *** ** *** *** * *** *NS NS NS NS
Potassium (K) *** *NS NS NS NS NS NS NS NS NS NS NS NS NS NS NS
N x K *NS NS NS NS NS NS NS NS NS NS NS NS NS NS NS NS
Iron (Fe) ** **NS NS NS NS NS NS NS NS NS NS NS NS NS NS NS
N x Fe *NS NS NS NS NS NS NS NS NS NS NS NS NS NS NS NS
K x Fe NS NS NS NS NS NS NS NS NS NS NS NS NS NS NS NS NS
N x K x Fe NS NS NS NS NS NS NS NS NS NS NS NS NS NS NS NS NS
Calculated on a dry weight basis and determined by combustion gas analyzer method (see Table A-8 for details).z
N-P O -K O fertility treatments applied foliarly to each main plot every 3 weeks, utilizing a CO sprayer mounted on a cart, and watered in [finish spray volume 855.3 L·ha (2.1 gal/1000 ft )]. N and K O applied at specified annual rates.y -1 22 5 2 2 2
P O applied at 146.4 kg·ha (3.0 lb P O /1000 ft ) per year. See Table 2 for more details.2 5 2 5-1 2
Mean separation with Fisher’s Protected LSD test.x
Fe applied foliarly to each main plot every 3 weeks, at 6.1 kg·ha FeSO (2.0 oz/1000 ft FeSO ) per application, utilizing a CO sprayer mounted on a cart, immediately after N-P O -K O fertility treatments, and not watered in [finish sprayw -1 24 4 2 2 5 2
volume 855.3 L·ha (2.1 gal/1000 ft )].-1 2
Randomized complete block design (RCB) with fertilizer treatments arranged in a 2x2x2 factorial arrangement.v
Nonsignificant or significant at P ≤ 0.05, 0.01, 0.001, respectively.NS, *, **, ***

A19
Table A-12. The effect of N, K O, and FeSO treatments on clipping calcium content of an annual bluegrass putting green from 12 Aug. 1998 to 26 Sept. 2000.2 4
Total Ca (%)z
Treatments 1998 1998 1998 1999 1999 1999 1999 1999 1999 1999 2000 2000 2000 2000 2000 2000
Date
12 30 18 19 13 28 6 17 28 9 18 11 23 7 18 26Aug. Sept. Nov. Jan. Apr. May July Aug. Sept. Nov. Jan. Apr. May July Aug. Sept.
2 Mar.1999
N-fertility rate treatmentsy
487.9 kg·ha (10.0 lb/1000 ft ) N/yr 0.39 0.39 0.38 0.40 0.42 0.39 0.40 0.40 0.35 0.34 0.43 0.38 0.38 0.36 0.40 0.39 0.26-1 2 x
244.0 kg·ha (5.0 lb/1000 ft ) N/yr 0.38 0.39 0.38 0.40 0.39 0.33 0.36 0.36 0.35 0.34 0.43 0.37 0.35 0.34 0.39 0.39 0.26-1 2
LSD, P=0.05 0.02 0.02 0.02 0.01 0.02 0.01 0.01NS NS NS NS NS NS NS NS NS NS
K O-fertility rate treatments2y
585.5 kg·ha (12.0 lb/1000 ft ) K O/yr 0.39 0.39 0.37 0.38 0.38 0.32 0.35 0.38 0.35 0.33 0.41 0.35 0.35 0.34 0.39 0.38 0.26-1 22
195.2 kg·ha (4.0 lb/1000 ft ) K O/yr 0.38 0.39 0.39 0.42 0.44 0.40 0.41 0.39 0.35 0.35 0.45 0.39 0.37 0.36 0.40 0.40 0.27-1 22
LSD, P=0.05 0.01 0.03 0.02 0.02 0.02 0.02 0.03 0.01NS NS NS NS NS NS NS NS NS
FeSO level treatments4w
With FeSO 0.37 0.39 0.38 0.40 0.40 0.36 0.38 0.37 0.35 0.34 0.43 0.37 0.37 0.35 0.39 0.39 0.264
No FeSO 0.40 0.39 0.38 0.41 0.41 0.36 0.38 0.39 0.35 0.34 0.43 0.38 0.36 0.36 0.40 0.39 0.274
LSD, P=0.05 0.02 0.01 0.01 0.01NS NS NS NS NS NS NS NS NS NS NS NS NS
Summary of ANOVA effectsv
Nitrogen (N) ** *** *** *** * *** **NS NS NS NS NS NS NS NS NS NS
Potassium (K) ** ** *** *** *** ** ** ***NS NS NS NS NS NS NS NS NS
N x K *NS NS NS NS NS NS NS NS NS NS NS NS NS NS NS NS
Iron (Fe) * * ** *NS NS NS NS NS NS NS NS NS NS NS NS NS
N x Fe *NS NS NS NS NS NS NS NS NS NS NS NS NS NS NS NS
K x Fe **NS NS NS NS NS NS NS NS NS NS NS NS NS NS NS NS
N x K x Fe NS NS NS NS NS NS NS NS NS NS NS NS NS NS NS NS NS
Calculated on a dry weight basis and determined by dry ashing, leachate, and inductively coupled Ar plasma (ICAP) emission spectrometry (see Table A-8 for details).z
N-P O -K O fertility treatments applied foliarly to each main plot every 3 weeks, utilizing a CO sprayer mounted on a cart, and watered in [finish spray volume 855.3 L·ha (2.1 gal/1000 ft )]. N and K O applied at specified annual rates.y -1 22 5 2 2 2
P O applied at 146.4 kg·ha (3.0 lb P O /1000 ft ) per year. See Table 2 for more details.2 5 2 5-1 2
Mean separation with Fisher’s Protected LSD test.x
Fe applied foliarly to each main plot every 3 weeks, at 6.1 kg·ha FeSO (2.0 oz/1000 ft FeSO ) per application, utilizing a CO sprayer mounted on a cart, immediately after N-P O -K O fertility treatments, and not watered in [finish sprayw -1 24 4 2 2 5 2
volume 855.3 L·ha (2.1 gal/1000 ft )].-1 2
Randomized complete block design (RCB) with fertilizer treatments arranged in a 2x2x2 factorial arrangement.v
Nonsignificant or significant at P ≤ 0.05, 0.01, 0.001, respectively.NS, *, **, ***

A20
Table A-13. The effect of N, K O, and FeSO treatments on clipping magnesium content of an annual bluegrass putting green from 12 Aug. 1998 to 26 Sept. 2000.2 4
Total Mg (%)z
Treatments 1998 1998 1998 1999 1999 1999 1999 1999 1999 1999 2000 2000 2000 2000 2000 2000
Date
12 30 18 19 13 28 6 17 28 9 18 11 23 7 18 26Aug. Sept. Nov. Jan. Apr. May July Aug. Sept. Nov. Jan. Apr. May July Aug. Sept.
2 Mar.1999
N-fertility rate treatmentsy
487.9 kg·ha (10.0 lb/1000 ft ) N/yr 0.18 0.17 0.19 0.20 0.22 0.18 0.18 0.20 0.27 0.17 0.22 0.23 0.17 0.19 0.191 0.22 0.22-1 2 x
244.0 kg·ha (5.0 lb/1000 ft ) N/yr 0.18 0.17 0.17 0.17 0.19 0.16 0.17 0.18 0.18 0.17 0.21 0.19 0.16 0.18 0.186 0.22 0.21-1 2
LSD, P=0.05 0.01 0.01 0.02 0.01 0.01 0.01 0.01 0.01 0.003 0.003NS NS NS NS NS NS NS
K O-fertility rate treatments2y
585.5 kg·ha (12.0 lb/1000 ft ) K O/yr 0.18 0.17 0.18 0.18 0.20 0.16 0.17 0.19 0.27 0.17 0.21 0.20 0.16 0.18 0.19 0.22 0.21-1 22
195.2 kg·ha (4.0 lb/1000 ft ) K O/yr 0.18 0.17 0.18 0.20 0.22 0.18 0.19 0.19 0.17 0.18 0.22 0.22 0.17 0.19 0.19 0.22 0.22-1 22
LSD, P=0.05 0.01 0.01 0.01 0.01 0.01 0.01 0.003NS NS NS NS NS NS NS NS NS NS
FeSO level treatments4w
With FeSO 0.18 0.17 0.18 0.19 0.21 0.17 0.18 0.18 0.27 0.17 0.21 0.20 0.17 0.18 0.18 0.21 0.214
No FeSO 0.18 0.17 0.18 0.19 0.21 0.17 0.18 0.20 0.18 0.17 0.22 0.21 0.17 0.19 0.19 0.22 0.224
LSD, P=0.05 0.01 0.003 0.003 0.01 0.01NS NS NS NS NS NS NS NS NS NS NS NS
Summary of ANOVA effectsv
Nitrogen (N) *** *** *** *** *** *** *** ** *** **NS NS NS NS NS NS NS
Potassium (K) ** *** *** *** *** * *NS NS NS NS NS NS NS NS NS NS
N x K * ** *NS NS NS NS NS NS NS NS NS NS NS NS NS NS
Iron (Fe) *** *** *** *** ***NS NS NS NS NS NS NS NS NS NS NS NS
N x Fe *NS NS NS NS NS NS NS NS NS NS NS NS NS NS NS NS
K x Fe * *NS NS NS NS NS NS NS NS NS NS NS NS NS NS NS
N x K x Fe *NS NS NS NS NS NS NS NS NS NS NS NS NS NS NS NS
Calculated on a dry weight basis and determined by dry ashing, leachate, and inductively coupled Ar plasma (ICAP) emission spectrometry (see Table A-8 for details).z
N-P O -K O fertility treatments applied foliarly to each main plot every 3 weeks, utilizing a CO sprayer mounted on a cart, and watered in [finish spray volume 855.3 L·ha (2.1 gal/1000 ft )]. N and K O applied at specified annual rates.y -1 22 5 2 2 2
P O applied at 146.4 kg·ha (3.0 lb P O /1000 ft ) per year. See Table 2 for more details.2 5 2 5-1 2
Mean separation with Fisher’s Protected LSD test.x
Fe applied foliarly to each main plot every 3 weeks, at 6.1 kg·ha FeSO (2.0 oz/1000 ft FeSO ) per application, utilizing a CO sprayer mounted on a cart, immediately after N-P O -K O fertility treatments, and not watered in [finish sprayw -1 24 4 2 2 5 2
volume 855.3 L·ha (2.1 gal/1000 ft )].-1 2
Randomized complete block design (RCB) with fertilizer treatments arranged in a 2x2x2 factorial arrangement.v
Nonsignificant or significant at P ≤ 0.05, 0.01, 0.001, respectively.NS, *, **, ***

A21
Table A-14. The effect of N, K O, and FeSO treatments on clipping manganese content of an annual bluegrass putting green from 12 Aug. 1998 to 26 Sept. 2000.2 4
Total Mn (ppm)z
Treatments 1998 1998 1998 1999 1999 1999 1999 1999 1999 1999 2000 2000 2000 2000 2000 2000
Date
12 30 18 19 13 28 6 17 28 9 18 11 23 7 18 26Aug. Sept. Nov. Jan. Apr. May July Aug. Sept. Nov. Jan. Apr. May July Aug. Sept.
2 Mar.1999
N-fertility rate treatmentsy
487.9 kg·ha (10.0 lb/1000 ft ) N/yr 39.73 35.15 31.30 36.27 41.41 42.11 36.96 32.92 29.78 32.62 38.82 38.89 38.69 33.68 43.18 48.58 28.47-1 2 x
244.0 kg·ha (5.0 lb/1000 ft ) N/yr 38.57 36.21 31.43 33.88 29.91 42.56 32.14 33.02 30.89 31.04 44.57 35.56 33.89 31.69 39.75 48.52 29.46-1 2
LSD, P=0.05 3.24 1.63 1.27 4.49 2.53 1.68 1.67NS NS NS NS NS NS NS NS NS NS
K O-fertility rate treatments2y
585.5 kg·ha (12.0 lb/1000 ft ) K O/yr 39.50 35.84 30.27 34.84 37.06 42.62 33.74 33.02 30.95 31.84 41.47 36.75 35.82 33.01 41.34 47.48 29.33-1 22
195.2 kg·ha (4.0 lb/1000 ft ) K O/yr 38.80 35.53 32.46 35.37 35.51 42.06 35.36 32.92 29.72 31.82 41.91 37.69 36.76 32.22 41.59 49.76 28.61-1 22
LSD, P=0.05 1.95 1.63 1.78NS NS NS NS NS NS NS NS NS NS NS NS NS NS
FeSO level treatments4w
With FeSO 37.48 34.54 30.67 34.22 35.62 41.17 33.67 30.85 28.97 30.51 39.47 33.92 35.64 31.92 39.59 45.27 25.874
No FeSO 40.82 36.83 32.06 36.06 36.85 43.51 35.44 35.09 31.69 33.16 43.91 40.53 36.95 33.40 43.33 51.82 32.124
LSD, P=0.05 1.90 1.50 1.63 1.69 1.76 1.27 4.49 3.44 1.68 1.67 1.78 2.93NS NS NS NS NS
Summary of ANOVA effectsv
Nitrogen (N) *** *** * ** *** ** ***NS NS NS NS NS NS NS NS NS NS
Potassium (K) * * *NS NS NS NS NS NS NS NS NS NS NS NS NS NS
N x K **NS NS NS NS NS NS NS NS NS NS NS NS NS NS NS NS
Iron (Fe) *** ** * *** ** *** * *** * *** *** ***NS NS NS NS NS
N x Fe **NS NS NS NS NS NS NS NS NS NS NS NS NS NS NS NS
K x Fe NS NS NS NS NS NS NS NS NS NS NS NS NS NS NS NS NS
N x K x Fe * * *NS NS NS NS NS NS NS NS NS NS NS NS NS NS
Determined by dry ashing, leachate, and inductively coupled Ar plasma (ICAP) emission spectrometry (see Table A-8 for details).z
N-P O -K O fertility treatments applied foliarly to each main plot every 3 weeks, utilizing a CO sprayer mounted on a cart, and watered in [finish spray volume 855.3 L·ha (2.1 gal/1000 ft )]. N and K O applied at specified annual rates.y -1 22 5 2 2 2
P O applied at 146.4 kg·ha (3.0 lb P O /1000 ft ) per year. See Table 2 for more details.2 5 2 5-1 2
Mean separation with Fisher’s Protected LSD test.x
Fe applied foliarly to each main plot every 3 weeks, at 6.1 kg·ha FeSO (2.0 oz/1000 ft FeSO ) per application, utilizing a CO sprayer mounted on a cart, immediately after N-P O -K O fertility treatments, and not watered in [finish sprayw -1 24 4 2 2 5 2
volume 855.3 L·ha (2.1 gal/1000 ft )].-1 2
Randomized complete block design (RCB) with fertilizer treatments arranged in a 2x2x2 factorial arrangement.v
Nonsignificant or significant at P ≤ 0.05, 0.01, 0.001, respectively.NS, *, **, ***

A22
Table A-15. The effect of N, K O, and FeSO treatments on clipping boron content of an annual bluegrass putting green from 12 Aug. 1998 to 26 Sept. 2000.2 4
Total B (ppm)z
Treatments 1998 1998 1998 1999 1999 1999 1999 1999 1999 1999 2000 2000 2000 2000 2000 2000
Date
12 30 18 19 13 28 6 17 28 9 18 11 23 7 18 26Aug. Sept. Nov. Jan. Apr. May July Aug. Sept. Nov. Jan. Apr. May July Aug. Sept.
2 Mar.1999
N-fertility rate treatmentsy
487.9 kg·ha (10.0 lb/1000 ft ) N/yr 20.91 16.20 14.72 12.06 34.01 11.27 23.46 32.11 17.67 16.61 9.49 26.47 26.72 12.44 17.81 23.24 21.64-1 2 x
244.0 kg·ha (5.0 lb/1000 ft ) N/yr 19.96 14.39 10.95 11.06 31.56 12.62 17.54 27.07 14.66 15.25 9.05 25.17 21.94 10.12 16.32 24.26 15.80-1 2
LSD, P=0.05 2.42 0.73 2.51 4.12 1.91 4.67 0.86 4.13NS NS NS NS NS NS NS NS NS
K O-fertility rate treatments2y
585.5 kg·ha (12.0 lb/1000 ft ) K O/yr 19.02 14.45 11.91 11.67 33.98 12.01 19.47 29.42 15.80 15.55 9.09 27.62 23.53 11.13 16.58 22.87 17.56-1 22
195.2 kg·ha (4.0 lb/1000 ft ) K O/yr 21.84 16.15 13.75 11.49 31.91 11.88 21.54 29.76 16.52 16.31 9.45 24.02 25.13 11.27 17.55 24.83 19.63-1 22
LSD, P=0.05 NS NS NS NS NS NS NS NS NS NS NS NS NS NS NS NS NS
FeSO level treatments4w
With FeSO 20.49 15.86 12.68 11.73 36.03 12.16 22.07 31.23 17.14 16.74 9.80 26.95 26.60 11.67 17.62 25.76 19.324
No FeSO 20.38 14.73 12.98 11.41 30.00 11.73 18.93 27.95 15.18 15.12 8.74 24.69 22.06 10.66 16.51 21.80 17.734
LSD, P=0.05 3.49 2.51 1.91 3.19NS NS NS NS NS NS NS NS NS NS NS NS NS
Summary of ANOVA effectsv
Nitrogen (N) ** *** *** * ** * *** **NS NS NS NS NS NS NS NS NS
Potassium (K) NS NS NS NS NS NS NS NS NS NS NS NS NS NS NS NS NS
N x K * * ** * * **NS NS NS NS NS NS NS NS NS NS NS
Iron (Fe) ** * * *NS NS NS NS NS NS NS NS NS NS NS NS NS
N x Fe NS NS NS NS NS NS NS NS NS NS NS NS NS NS NS NS NS
K x Fe NS NS NS NS NS NS NS NS NS NS NS NS NS NS NS NS NS
N x K x Fe *NS NS NS NS NS NS NS NS NS NS NS NS NS NS NS NS
Determined by dry ashing, leachate, and inductively coupled Ar plasma (ICAP) emission spectrometry (see Table A-8 for details).z
N-P O -K O fertility treatments applied foliarly to each main plot every 3 weeks, utilizing a CO sprayer mounted on a cart, and watered in [finish spray volume 855.3 L·ha (2.1 gal/1000 ft )]. N and K O applied at specified annual rates.y -1 22 5 2 2 2
P O applied at 146.4 kg·ha (3.0 lb P O /1000 ft ) per year. See Table 2 for more details.2 5 2 5-1 2
Mean separation with Fisher’s Protected LSD test.x
Fe applied foliarly to each main plot every 3 weeks, at 6.1 kg·ha FeSO (2.0 oz/1000 ft FeSO ) per application, utilizing a CO sprayer mounted on a cart, immediately after N-P O -K O fertility treatments, and not watered in [finish sprayw -1 24 4 2 2 5 2
volume 855.3 L·ha (2.1 gal/1000 ft )].-1 2
Randomized complete block design (RCB) with fertilizer treatments arranged in a 2x2x2 factorial arrangement.v
Nonsignificant or significant at P ≤ 0.05, 0.01, 0.001, respectively.NS, *, **, ***

A23
Table A-16. The effect of N, K O, and FeSO treatments on clipping copper content of an annual bluegrass putting green from 12 Aug. 1998 to 26 Sept. 2000.2 4
Total Cu (ppm)z
Treatments 1998 1998 1998 1999 1999 1999 1999 1999 1999 1999 2000 2000 2000 2000 2000 2000
Date
12 30 18 19 13 28 6 17 28 9 18 11 23 7 18 26Aug. Sept. Nov. Jan. Apr. May July Aug. Sept. Nov. Jan. Apr. May July Aug. Sept.
2 Mar.1999
N-fertility rate treatmentsy
487.9 kg·ha (10.0 lb/1000 ft ) N/yr 9.45 10.42 12.37 12.73 13.34 12.64 9.87 9.75 7.65 10.40 12.21 15.43 8.94 9.39 7.61 8.69 7.86-1 2 x
244.0 kg·ha (5.0 lb/1000 ft ) N/yr 9.58 10.82 12.53 11.30 13.94 12.52 10.29 11.41 8.76 11.32 13.16 15.16 9.40 10.83 8.63 10.67 10.26-1 2
LSD, P=0.05 1.05 0.95 0.54 0.91 0.90 0.94NS NS NS NS NS NS NS NS NS NS NS
K O-fertility rate treatments2y
585.5 kg·ha (12.0 lb/1000 ft ) K O/yr 9.58 10.99 12.21 12.15 14.26 12.82 10.09 10.81 8.27 10.43 12.60 15.26 9.18 10.49 8.29 9.85 9.75-1 22
195.2 kg·ha (4.0 lb/1000 ft ) K O/yr 9.45 10.26 12.69 11.94 13.01 12.34 10.07 10.35 8.14 11.29 12.77 15.33 9.16 9.82 7.95 9.62 8.44-1 22
LSD, P=0.05 0.89 0.94NS NS NS NS NS NS NS NS NS NS NS NS NS NS NS
FeSO level treatments4w
With FeSO 10.02 10.45 12.62 12.26 13.58 12.51 10.00 10.28 8.11 10.58 11.98 14.52 9.38 9.53 8.24 9.25 8.374
No FeSO 9.01 10.80 12.28 11.80 13.64 12.65 10.16 10.87 8.29 11.14 13.39 16.07 8.96 10.87 8.00 10.24 9.914
LSD, P=0.05 0.96 1.03 0.91 0.90 0.94NS NS NS NS NS NS NS NS NS NS NS NS
Summary of ANOVA effectsv
Nitrogen (N) ** ** *** ** *** ***NS NS NS NS NS NS NS NS NS NS NS
Potassium (K) ** **NS NS NS NS NS NS NS NS NS NS NS NS NS NS NS
N x K *** **NS NS NS NS NS NS NS NS NS NS NS NS NS NS NS
Iron (Fe) * ** ** * **NS NS NS NS NS NS NS NS NS NS NS NS
N x Fe * *NS NS NS NS NS NS NS NS NS NS NS NS NS NS NS
K x Fe ** **NS NS NS NS NS NS NS NS NS NS NS NS NS NS NS
N x K x Fe NS NS NS NS NS NS NS NS NS NS NS NS NS NS NS NS NS
Determined by dry ashing, leachate, and inductively coupled Ar plasma (ICAP) emission spectrometry (see Table A-8 for details).z
N-P O -K O fertility treatments applied foliarly to each main plot every 3 weeks, utilizing a CO sprayer mounted on a cart, and watered in [finish spray volume 855.3 L·ha (2.1 gal/1000 ft )]. N and K O applied at specified annual rates.y -1 22 5 2 2 2
P O applied at 146.4 kg·ha (3.0 lb P O /1000 ft ) per year. See Table 2 for more details.2 5 2 5-1 2
Mean separation with Fisher’s Protected LSD test.x
Fe applied foliarly to each main plot every 3 weeks, at 6.1 kg·ha FeSO (2.0 oz/1000 ft FeSO ) per application, utilizing a CO sprayer mounted on a cart, immediately after N-P O -K O fertility treatments, and not watered in [finish sprayw -1 24 4 2 2 5 2
volume 855.3 L·ha (2.1 gal/1000 ft )].-1 2
Randomized complete block design (RCB) with fertilizer treatments arranged in a 2x2x2 factorial arrangement.v
Nonsignificant or significant at P ≤ 0.05, 0.01, 0.001, respectively.NS, *, **, ***

A24
Table A-17. The effect of N, K O, and FeSO treatments on clipping zinc content of an annual bluegrass putting green from 12 Aug. 1998 to 26 Sept. 2000.2 4
Total Zn (ppm)z
Treatments 1998 1998 1998 1999 1999 1999 1999 1999 1999 1999 2000 2000 2000 2000 2000 2000
Date
12 30 18 19 13 28 6 17 28 9 18 11 23 7 18 26Aug. Sept. Nov. Jan. Apr. May July Aug. Sept. Nov. Jan. Apr. May July Aug. Sept.
2 Mar.1999
N-fertility rate treatmentsy
487.9 kg·ha (10.0 lb/1000 ft ) N/yr 71.21 60.33 59.49 87.45 79.20 71.44 63.26 79.60 66.88 69.39 75.66 82.35 72.24 78.30 82.66 87.52 53.91-1 2 x
244.0 kg·ha (5.0 lb/1000 ft ) N/yr 71.85 55.81 51.41 74.29 61.55 56.41 56.83 70.09 63.23 63.01 66.53 67.14 61.66 71.03 75.02 83.60 50.31-1 2
LSD, P=0.05 3.40 4.20 6.27 3.35 3.10 2.54 2.74 3.84 3.85 4.06 2.82 1.96 3.16NS NS NS NS
K O-fertility rate treatments2y
585.5 kg·ha (12.0 lb/1000 ft ) K O/yr 71.92 58.38 54.88 81.05 72.09 63.72 58.79 75.27 65.83 66.42 72.26 75.74 66.74 74.50 78.31 85.66 51.68-1 22
195.2 kg·ha (4.0 lb/1000 ft ) K O/yr 71.14 57.76 56.02 81.12 70.55 64.12 61.30 74.42 64.28 65.98 69.93 73.74 67.16 74.34 79.37 85.18 52.33-1 22
LSD, P=0.05 2.54NS NS NS NS NS NS NS NS NS NS NS NS NS NS NS NS
FeSO level treatments4w
With FeSO 73.91 57.60 55.39 79.61 70.86 63.38 58.92 72.62 64.99 65.19 66.97 69.15 64.73 72.26 74.65 79.67 49.424
No FeSO 69.15 58.54 55.52 82.65 71.69 64.47 61.17 77.07 65.12 67.21 75.22 80.33 69.17 76.89 83.03 91.20 54.554
LSD, P=0.05 3.02 2.74 3.85 4.06 2.82 1.96 3.16 4.23NS NS NS NS NS NS NS NS NS
Summary of ANOVA effectsv
Nitrogen (N) * *** *** *** *** *** *** ** *** *** *** *** ***NS NS NS NS
Potassium (K) *NS NS NS NS NS NS NS NS NS NS NS NS NS NS NS NS
N x K ** ** * *NS NS NS NS NS NS NS NS NS NS NS NS NS
Iron (Fe) ** ** *** *** ** *** *** ***NS NS NS NS NS NS NS NS NS
N x Fe *** ** ** **NS NS NS NS NS NS NS NS NS NS NS NS NS
K x Fe * NS NS NS NS NS NS NS NS NS NS NS NS NS NS NS NS
N x K x Fe * NSNS NS NS NS NS NS NS NS NS NS NS NS NS NS NS
Determined by dry ashing, leachate, and inductively coupled Ar plasma (ICAP) emission spectrometry (see Table A-8 for details).z
N-P O -K O fertility treatments applied foliarly to each main plot every 3 weeks, utilizing a CO sprayer mounted on a cart, and watered in [finish spray volume 855.3 L·ha (2.1 gal/1000 ft )]. N and K O applied at specified annual rates.y -1 22 5 2 2 2
P O applied at 146.4 kg·ha (3.0 lb P O /1000 ft ) per year. See Table 2 for more details.2 5 2 5-1 2
Mean separation with Fisher’s Protected LSD test.x
Fe applied foliarly to each main plot every 3 weeks, at 6.1 kg·ha FeSO (2.0 oz/1000 ft FeSO ) per application, utilizing a CO sprayer mounted on a cart, immediately after N-P O -K O fertility treatments, and not watered in [finish sprayw -1 24 4 2 2 5 2
volume 855.3 L·ha (2.1 gal/1000 ft )].-1 2
Randomized complete block design (RCB) with fertilizer treatments arranged in a 2x2x2 factorial arrangement.v
Nonsignificant or significant at P ≤ 0.05, 0.01, 0.001, respectively.NS, *, **, ***

A25
Table A-18. The effect of N, K O, and FeSO treatments on clipping molybdenum content of an annual bluegrass putting green from 12 Aug. 1998 to 26 Sept. 2000.2 4
Total Mo (ppm)z
Treatments 1998 1998 1998 1999 1999 1999 1999 1999 1999 1999 2000 2000 2000 2000 2000 2000
Date
12 30 18 19 13 28 6 17 28 9 18 11 23 7 18 26Aug. Sept. Nov. Jan. Apr. May July Aug. Sept. Nov. Jan. Apr. May July Aug. Sept.
2 Mar.1999
N-fertility rate treatmentsy
487.9 kg·ha (10.0 lb/1000 ft ) N/yr 7.49 5.49 3.54 2.33 3.45 2.57 5.34 8.30 5.37 5.66 3.98 2.25 4.99 6.55 9.15 8.28 4.97-1 2 x
244.0 kg·ha (5.0 lb/1000 ft ) N/yr 7.35 5.33 3.61 2.46 3.00 2.80 5.84 8.79 5.98 5.88 3.81 1.91 4.41 6.69 9.23 8.17 4.91-1 2
LSD, P=0.05 0.42 0.33 0.32 0.40NS NS NS NS NS NS NS NS NS NS NS NS NS
K O-fertility rate treatments2y
585.5 kg·ha (12.0 lb/1000 ft ) K O/yr 7.47 5.40 3.53 2.20 3.14 2.62 5.53 8.45 5.62 5.52 3.78 1.99 4.59 6.48 9.09 8.22 4.90-1 22
195.2 kg·ha (4.0 lb/1000 ft ) K O/yr 7.37 5.42 3.62 2.57 3.35 2.75 5.66 8.64 5.73 6.02 4.01 2.18 4.80 6.78 9.28 8.22 4.99-1 22
LSD, P=0.05 0.31 0.42NS NS NS NS NS NS NS NS NS NS NS NS NS NS NS
FeSO level treatments4w
With FeSO 7.03 5.27 3.49 2.21 3.07 2.73 5.36 8.48 5.51 5.54 3.59 1.75 4.58 6.23 8.49 7.70 4.594
No FeSO 7.81 5.54 3.66 2.59 3.41 2.64 5.82 8.61 5.85 6.00 4.20 2.41 4.82 7.08 9.88 8.74 5.294
LSD, P=0.05 0.46 0.25 0.31 0.42 0.33 0.42 0.42 0.32 0.34 0.94 0.57 0.26NS NS NS NS NS
Summary of ANOVA effectsv
Nitrogen (N) * *** * **NS NS NS NS NS NS NS NS NS NS NS NS NS
Potassium (K) * *NS NS NS NS NS NS NS NS NS NS NS NS NS NS NS
N x K * *NS NS NS NS NS NS NS NS NS NS NS NS NS NS NS
Iron (Fe) ** * ** * * * ** *** *** ** *** ***NS NS NS NS NS
N x Fe NS NS NS NS NS NS NS NS NS NS NS NS NS NS NS NS NS
K x Fe NS NS NS NS NS NS NS NS NS NS NS NS NS NS NS NS NS
N x K x Fe NS NS NS NS NS NS NS NS NS NS NS NS NS NS NS NS NS
Determined by dry ashing, leachate, and inductively coupled Ar plasma (ICAP) emission spectrometry (see Table A-8 for details).z
N-P O -K O fertility treatments applied foliarly to each main plot every 3 weeks, utilizing a CO sprayer mounted on a cart, and watered in [finish spray volume 855.3 L·ha (2.1 gal/1000 ft )]. N and K O applied at specified annual rates.y -1 22 5 2 2 2
P O applied at 146.4 kg·ha (3.0 lb P O /1000 ft ) per year. See Table 2 for more details.2 5 2 5-1 2
Mean separation with Fisher’s Protected LSD test.x
Fe applied foliarly to each main plot every 3 weeks, at 6.1 kg·ha FeSO (2.0 oz/1000 ft FeSO ) per application, utilizing a CO sprayer mounted on a cart, immediately after N-P O -K O fertility treatments, and not watered in [finish sprayw -1 24 4 2 2 5 2
volume 855.3 L·ha (2.1 gal/1000 ft )].-1 2
Randomized complete block design (RCB) with fertilizer treatments arranged in a 2x2x2 factorial arrangement.v
Nonsignificant or significant at P ≤ 0.05, 0.01, 0.001, respectively.NS, *, **, ***

A26
Table A-19. The effect of N, K O, and FeSO treatments on clipping sodium content of an annual bluegrass putting green from 12 Aug. 1998 to 26 Sept. 2000.2 4
Total Na (ppm)z
Treatments 1998 1998 1998 1999 1999 1999 1999 1999 1999 1999 2000 2000 2000 2000 2000 2000
Date
12 30 18 19 13 28 6 17 28 9 18 11 23 7 18 26Aug. Sept. Nov. Jan. Apr. May July Aug. Sept. Nov. Jan. Apr. May July Aug. Sept.
2 Mar.1999
N-fertility rate treatmentsy
487.9 kg·ha (10.0 lb/1000 ft ) N/yr 1515 1942 1733 1231 1178 553 1006 1342 1300 1377 1764 1467 718 995 1023 1148 1575-1 2 x
244.0 kg·ha (5.0 lb/1000 ft ) N/yr 1617 2054 1860 1598 1361 674 1074 1292 1361 1398 1921 1768 868 1006 968 1144 1771-1 2
LSD, P=0.05 115 122 131 120 185 125 46 127NS NS NS NS NS NS NS NS NS
K O-fertility rate treatments2y
585.5 kg·ha (12.0 lb/1000 ft ) K O/yr 1485 1960 1733 1357 1206 541 1000 1300 1316 1353 1794 1627 778 1008 990 1116 1625-1 22
195.2 kg·ha (4.0 lb/1000 ft ) K O/yr 1647 2035 1860 1458 1310 686 1080 1334 1345 1423 1899 1609 807 994 1001 1180 1741-1 22
LSD, P=0.05 115 120NS NS NS NS NS NS NS NS NS NS NS NS NS NS NS
FeSO level treatments4w
With FeSO 1581 2018 1807 1417 1234 605 1026 1332 1318 1388 1834 1589 819 978 994 1170 17134
No FeSO 1551 1978 1785 1400 1285 622 1054 1302 1343 1387 1856 1646 766 1027 997 1122 16454
LSD, P=0.05 35NS NS NS NS NS NS NS NS NS NS NS NS NS NS NS NS
Summary of ANOVA effectsv
Nitrogen (N) * *** ** * ** * * **NS NS NS NS NS NS NS NS NS
Potassium (K) * *NS NS NS NS NS NS NS NS NS NS NS NS NS NS NS
N x K ** ** *NS NS NS NS NS NS NS NS NS NS NS NS NS NS
Iron (Fe) **NS NS NS NS NS NS NS NS NS NS NS NS NS NS NS NS
N x Fe * *NS NS NS NS NS NS NS NS NS NS NS NS NS NS NS
K x Fe NS NS NS NS NS NS NS NS NS NS NS NS NS NS NS NS NS
N x K x Fe NS NS NS NS NS NS NS NS NS NS NS NS NS NS NS NS NS
Determined by dry ashing, leachate, and inductively coupled Ar plasma (ICAP) emission spectrometry (see Table A-8 for details).z
N-P O -K O fertility treatments applied foliarly to each main plot every 3 weeks, utilizing a CO sprayer mounted on a cart, and watered in [finish spray volume 855.3 L·ha (2.1 gal/1000 ft )]. N and K O applied at specified annual rates.y -1 22 5 2 2 2
P O applied at 146.4 kg·ha (3.0 lb P O /1000 ft ) per year. See Table 2 for more details.2 5 2 5-1 2
Mean separation with Fisher’s Protected LSD test.x
Fe applied foliarly to each main plot every 3 weeks, at 6.1 kg·ha FeSO (2.0 oz/1000 ft FeSO ) per application, utilizing a CO sprayer mounted on a cart, immediately after N-P O -K O fertility treatments, and not watered in [finish sprayw -1 24 4 2 2 5 2
volume 855.3 L·ha (2.1 gal/1000 ft )].-1 2
Randomized complete block design (RCB) with fertilizer treatments arranged in a 2x2x2 factorial arrangement.v
Nonsignificant or significant at P ≤ 0.05, 0.01, 0.001, respectively.NS, *, **, ***

A27
Table A-20. The effect of N, K O, and FeSO treatments on clipping aluminum content of an annual bluegrass putting green from 12 Aug. 1998 to 26 Sept. 2000.2 4
Total Al (ppm)z
Treatments 1998 1998 1998 1999 1999 1999 1999 1999 1999 1999 2000 2000 2000 2000 2000 2000
Date
12 30 18 19 13 28 6 17 28 9 18 11 23 7 18 26Aug. Sept. Nov. Jan. Apr. May July Aug. Sept. Nov. Jan. Apr. May July Aug. Sept.
2 Mar.1999
N-fertility rate treatmentsy
487.9 kg·ha (10.0 lb/1000 ft ) N/yr 30.98 102.20 204.26 82.61 50.95 59.89 62.52 33.86 31.38 40.59 58.61 76.13 43.11 25.16 106.69 108.41 29.99-1 2 x
244.0 kg·ha (5.0 lb/1000 ft ) N/yr 25.82 90.66 201.71 89.08 56.38 67.77 51.06 29.76 31.91 40.89 77.60 84.00 41.95 25.28 93.13 126.19 29.09-1 2
LSD, P=0.05 6.35NS NS NS NS NS NS NS NS NS NS NS NS NS NS NS NS
K O-fertility rate treatments2y
585.5 kg·ha (12.0 lb/1000 ft ) K O/yr 26.28 92.33 191.96 87.17 57.51 60.99 57.85 30.40 30.96 43.77 70.50 77.20 42.23 24.82 103.27 105.24 30.25-1 22
195.2 kg·ha (4.0 lb/1000 ft ) K O/yr 30.53 100.52 214.01 84.41 49.53 66.68 55.74 33.22 32.33 37.71 65.71 82.94 42.83 25.63 96.55 132.35 28.67-1 22
LSD, P=0.05 21.68NS NS NS NS NS NS NS NS NS NS NS NS NS NS NS NS
FeSO level treatments4w
With FeSO 26.93 91.97 210.55 84.16 57.49 64.16 56.26 29.77 32.49 41.21 69.99 75.51 43.91 24.59 98.81 140.15 30.494
No FeSO 29.88 100.88 195.43 87.43 49.56 63.51 57.33 33.85 30.80 40.27 66.22 84.63 41.14 25.95 101.02 95.64 28.534
LSD, P=0.05 NS NS NS NS NS NS NS NS NS NS NS NS NS NS NS NS NS
Summary of ANOVA effectsv
Nitrogen (N) *NS NS NS NS NS NS NS NS NS NS NS NS NS NS NS NS
Potassium (K) *NS NS NS NS NS NS NS NS NS NS NS NS NS NS NS NS
N x K ** *NS NS NS NS NS NS NS NS NS NS NS NS NS NS NS
Iron (Fe) NS NS NS NS NS NS NS NS NS NS NS NS NS NS NS NS NS
N x Fe NS NS NS NS NS NS NS NS NS NS NS NS NS NS NS NS NS
K x Fe * **NS NS NS NS NS NS NS NS NS NS NS NS NS NS NS
N x K x Fe * *NS NS NS NS NS NS NS NS NS NS NS NS NS NS NS
Determined by dry ashing, leachate, and inductively coupled Ar plasma (ICAP) emission spectrometry (see Table A-8 for details).z
N-P O -K O fertility treatments applied foliarly to each main plot every 3 weeks, utilizing a CO sprayer mounted on a cart, and watered in [finish spray volume 855.3 L·ha (2.1 gal/1000 ft )]. N and K O applied at specified annual rates.y -1 22 5 2 2 2
P O applied at 146.4 kg·ha (3.0 lb P O /1000 ft ) per year. See Table 2 for more details.2 5 2 5-1 2
Mean separation with Fisher’s Protected LSD test.x
Fe applied foliarly to each main plot every 3 weeks, at 6.1 kg·ha FeSO (2.0 oz/1000 ft FeSO ) per application, utilizing a CO sprayer mounted on a cart, immediately after N-P O -K O fertility treatments, and not watered in [finish sprayw -1 24 4 2 2 5 2
volume 855.3 L·ha (2.1 gal/1000 ft )].-1 2
Randomized complete block design (RCB) with fertilizer treatments arranged in a 2x2x2 factorial arrangement.v
Nonsignificant or significant at P ≤ 0.05, 0.01, 0.001, respectively.NS, *, **, ***

A28
Table A-21. The effect of N, K O, and FeSO treatments on clipping titanium content of an annual bluegrass putting green from 12 Aug. 1998 to 26 Sept. 2000.2 4
Total Ti (ppm)z
Treatments 1998 1998 1998 1999 1999 1999 1999 1999 1999 1999 2000 2000 2000 2000 2000 2000
Date
12 30 18 19 13 28 6 17 28 9 18 11 23 7 18 26Aug. Sept. Nov. Jan. Apr. May July Aug. Sept. Nov. Jan. Apr. May July Aug. Sept.
2 Mar.1999
N-fertility rate treatmentsy
487.9 kg·ha (10.0 lb/1000 ft ) N/yr 1.39 2.03 3.68 3.53 1.72 1.97 1.86 1.57 0.94 1.34 1.98 2.78 0.70 0.53 0.67 3.01 0.44-1 2 x
244.0 kg·ha (5.0 lb/1000 ft ) N/yr 1.47 2.00 3.53 3.14 1.78 2.35 1.71 1.40 0.97 1.54 2.61 2.83 0.69 0.55 0.60 3.05 0.43-1 2
LSD, P=0.05 0.27 0.61NS NS NS NS NS NS NS NS NS NS NS NS NS NS NS
K O-fertility rate treatments2y
585.5 kg·ha (12.0 lb/1000 ft ) K O/yr 1.25 1.91 3.46 3.60 2.01 2.18 1.77 1.55 0.91 1.54 2.42 2.77 0.71 0.53 0.63 2.67 0.46-1 22
195.2 kg·ha (4.0 lb/1000 ft ) K O/yr 1.61 2.12 3.75 3.11 1.50 2.15 1.80 1.43 0.99 1.34 2.16 2.84 0.68 0.55 0.63 3.44 0.41-1 22
LSD, P=0.05 0.21 0.35NS NS NS NS NS NS NS NS NS NS NS NS NS NS NS
FeSO level treatments4w
With FeSO 1.45 1.99 3.77 3.28 1.90 2.22 2.02 1.34 0.98 1.49 2.38 2.63 0.72 0.55 0.64 3.67 0.474
No FeSO 1.41 2.04 3.44 3.41 1.60 2.10 1.55 1.64 0.93 1.39 2.20 2.98 0.67 0.53 0.62 2.40 0.404
LSD, P=0.05 0.36 0.96NS NS NS NS NS NS NS NS NS NS NS NS NS NS NS
Summary of ANOVA effectsv
Nitrogen (N) ** *NS NS NS NS NS NS NS NS NS NS NS NS NS NS NS
Potassium (K) * **NS NS NS NS NS NS NS NS NS NS NS NS NS NS NS
N x K * **NS NS NS NS NS NS NS NS NS NS NS NS NS NS NS
Iron (Fe) ** *NS NS NS NS NS NS NS NS NS NS NS NS NS NS NS
N x Fe *NS NS NS NS NS NS NS NS NS NS NS NS NS NS NS NS
K x Fe NS NS NS NS NS NS NS NS NS NS NS NS NS NS NS NS NS
N x K x Fe *NS NS NS NS NS NS NS NS NS NS NS NS NS NS NS NS
Determined by dry ashing, leachate, and inductively coupled Ar plasma (ICAP) emission spectrometry (see Table A-8 for details).z
N-P O -K O fertility treatments applied foliarly to each main plot every 3 weeks, utilizing a CO sprayer mounted on a cart, and watered in [finish spray volume 855.3 L·ha (2.1 gal/1000 ft )]. N and K O applied at specified annual rates.y -1 22 5 2 2 2
P O applied at 146.4 kg·ha (3.0 lb P O /1000 ft ) per year. See Table 2 for more details.2 5 2 5-1 2
Mean separation with Fisher’s Protected LSD test.x
Fe applied foliarly to each main plot every 3 weeks, at 6.1 kg·ha FeSO (2.0 oz/1000 ft FeSO ) per application, utilizing a CO sprayer mounted on a cart, immediately after N-P O -K O fertility treatments, and not watered in [finish sprayw -1 24 4 2 2 5 2
volume 855.3 L·ha (2.1 gal/1000 ft )].-1 2
Randomized complete block design (RCB) with fertilizer treatments arranged in a 2x2x2 factorial arrangement.v
Nonsignificant or significant at P ≤ 0.05, 0.01, 0.001, respectively.NS, *, **, ***