management and planning of revenue of dabur nepal …
TRANSCRIPT
1
MANAGEMENT AND PLANNING OF REVENUE OF
DABUR NEPAL PVT. LTD
By:
BASU BABU PANDAY
Shanker Dev Campus
T.U. Registration No: 7-1-240-137-98
Roll No. 1587/060
A Thesis Submitted to
Office of the Dean
Faculty of Management
Tribhuvan University
In Partial Fulfilment of the Requirement for the Degree
of Master in Business Studies (M.B.S.)
Kathmandu, Nepal
November, 2009
2
RECOMMENDATION
This is to certify that the thesis
Submitted By:
BASU BABU PANDAY
Entitled:
“MANAGEMENT AND PLANNING OF REVENUE OF DABUR NEPAL PVT. LTD”
Has been prepared as approved by this campus in the prescribed format of the Faculty of
Management. This thesis is forwarded for examination.
……………................. .................................. .........……………………
Prakash Singh Pradhan Prof. B.M Shrestha Prof.Dr. Kamal Deep Dhakal
Associate Professor (Head of Research Department) (Campus Chief)
(Supervisor)

3
VIVA-VOCE SHEET
We have conducted the Viva-Voce of the Thesis
Submitted By:
BASU BABU PANDAY
Entitled:
“MANAGEMENT AND PLANNING OF REVENUE OF DABUR NEPAL PVT. LTD”
And found the thesis to be the original work of the student and written according to the prescribed
format. We recommend the thesis to be accepted as partial fulfilment of the requirement for the
Degree of Master in Business Studies (M.B.S.)
Viva-Voce Committee
Head, Research Department :- ...............................................................
Member (Thesis Supervisor) :- ...............................................................
Member (External Expert) :- ...............................................................
Date: ......................................
4
DECLARATION
I hereby declare that the work reported in this thesis entitled " Management and
Planning of Revenue of Dabur Nepal Private Limited" submitted to Shankar Dev Campus,
Tribhuvan University, is my original work done in the form of partial fulfilment of the
requirement for the Master's Degree in Business Studies (M.B.S.) under the supervision of Mr.
Prakash Singh Pradhan Associate Professor of Shanker Dev Campus, Tribhuvan University.
…………………………..
Basu Babu Panday
Researcher
5
ACKNOWLEDGEMENT
I express my sincere gratitude to all the authors and learned personalities, whose writings have
been cited in this study. I also express my sincere gratitude to those authors whose writings
though are not cited but helped and inspired me in making my vision clear and reaching on
conclusion.
I extend my deep sense of indebtedness to my respected supervisors Mr. Prakash Singh Pradhan,
Shanker Dev Campus, Tribhuvan University for his generous encouragement and precious
guidelines, inspiration and suggestion thoroughly during the period of this study. I acknowledge
my profound gratitude to the personnel of Dabur Nepal Private Limited for the cooperation shown
and providing me necessary data.
Finally, I would like to express my sincere gratitude to my family members, all my friends for
their assistance, timely encouragement in every step.
BASU BABU PANDAY
Researcher
6
TABLE OF CONTENTS
Recommendation
Viva-voce sheet
Declaration
Acknowledgement
Table of Contents
List of Table
List of Figures
Abbreviation
PAGE
NO:
CHAPTER – I INTRODUCTION 1-14
1.1 Background of the study 1
1.2 Evolution of Industries in Nepal 2
1.3 Overview of Dabur Nepal Pvt. Ltd 4
1.3.1 The major products of Dabur Nepal Pvt. Ltd. are as follows 7
1.3.2 Management & Directors of Dabur Nepal Pvt. Ltd. 7
1.3.3 The Bankers of DNPL 10
1.3.4 The corporate purpose of the company 10
1.4 Introduction of Management and Planning of Revenue:- 10
1.5 Statement of the Problem:- 11
1.6 Objectives of the study:- 13
1.7 Significance of the study 13
1.8 Limitation of study 13
1.9 Organization of the study:- 14
CHAPTER – II REVIEW OF LITERATURE 15-59
2.1 Planning 15

7
2.1.1 Components of Planning 17
2.1.2 Characteristics of Planning 18
2.1.3 Corporate Planning 192.2 Forecasting 202.3 Forecasting Vs Planning 20
2.4 Role of Forecasting in Planning 21
2.5 Overview of Profit Planning 222.5.1 Profit Planning & Control 24
2.5.2 Fundamental Concept of Profit Planning and Control 252.6 Revenue Planning 26
2.6.1 Revenue Planning Process 282.7 The systematic process of profit planning. 30
2.8 Role of Budgeting in Business Management 312.8.1 Characteristics of Good Budgeting. 32
2.8.2 The objective and purpose of budget 32
2.8.3 Classification of Budget 33
2.9 Methods of Sales Projection 41
2.10 Concept of Cost-Volume Profit Analysis 43
2.10.1 Uses of CVP Analysis in Business 44
2.10.2 Break-Even Point 45
2.11 Credit Policy 46
2.12 Collection Policies 472.13 Review of Previous Research 48
2.14 Research Gap 59
CHAPTER-3 RESEARCH METHODOLOGY 60-65
3.1 Introduction 60
3.2 Research Design 60
3.3 Source of Data 61
3.4 Data Collection Techniques 61
3.5 Data Analysis Tools ` 61
3.5.1 Financial Tools: - 62
3.5.2 Statistical Tools 63

8
CHAPTER – 4 DATA PRESENTATION AND ANALYSIS 66-101
4.1 Sales Plan/Budget in DNPL 66
4.2 Sales Budget & Achievement 67
4.3 Calculation of Mean, Standard Deviation & Coefficient of Variation. 69
4.4 Contribution of each Product on Revenue of DNPL 70
4.5 Revenue of Each Territory 76
4.6 Budgeted Domestic Sales & Actual Domestic Sales 784.7 Budgeted Foreign Sales & Actual Foreign Sales 81
4.8 Calculation of Trend by Fitting Straight Line Trend, Least Squarefor Actual Sales Trend & Possible Sales of DNPL. 84
4.9 Analysis of Actual Total Income Operating Expenses & Operating Profit. 864.10 Analysis of Ratio between Actual Sales & Net Profit 88
4.11 Analysis of Account Receivable 91
4.12 Analysis of Cash Flow 93
4.13 Correlation Analysis 94
4.13.1 Correlation coefficient between the Sales and Net Profit of DNPL 94
4.13.2 Correlation between the Operating profit and Net profit of DPNL 95
4.14 Analysis of Sales per Employee 95
4.15 Cost Classification 97
4.16 Cost Volume Profit Analysis 99
4.17 Major Findings 100
CHAPTER -5 SUMMARY, CONCLUSION & RECOMMENDATION 102-106
5.1 Summary 102
5.2 Conclusion 103
5.3 Recommendations 104
BIBLOGRAPHY
APPENDIX

9
LIST OF TABLE
PAGE NO:
Table No.1.3 Management & Directors of Dabur Nepal Pvt. Ltd. 8
Table No.4.1 Sales Budget & Achievement 67
Table No.4.2 Mean, Standard Deviation & Coefficient of Variation 69
Table No. 4.3 Contribution of each product in Revenue Trend of DNPL 70
Table No. 4.4 Contribution of Each Production in Revenue Trend of
DNPL in Percentage 73
Table No. 4.5 Revenue of Each Territory 76
Table No. 4.6 Budget Domestic Sales & Actual Domestic Sales 78
Table No. 4.7 Summary of A.M., S.D., CV, & PE of Budgeted & Actual
Domestic Sales 80
Table No. 4.8 Budgeted Foreign Sales & Actual Foreign Sales 81
Table No. 4.9 Summary A.M., SD, CV, P.E of Budgeted & Actual Foreign Sales 83
Table No.4.10 Calculation of Trend by Fitting Straight Line Trend, Least Square
For Actual Sales Trend & Possible Sales of DNPL. 84
Table No. 4.11 Analysis of Actual Total Income Operating Expenses &
Operating Profit. 86
Table No. 4.12 Analysis of Ratio between Actual Sales & Net Profit 88
Table No. 4.13Fitting of trend line by using least square method 89
Table No - 4.14Account Receivable, Debtors turnover ratio & Average collection
Period of DNPL 92
Table No. 4.15Cash Flow of DNPL 93
Table No. 4.16Correlation Coefficient, Coefficient of Determination and
Probable Error (P.E.) 95
Table No. 4.17Correlation between the Operating profit and Net profit of DPNL 95
Table No. 4.18 Sales per Employee of DNPL 96
Table No. 4.19Variable Cost 97
Table No. 4.20Fixed Cost 98
Table No. 4.21Cost volume profit analysis 99

10
LIST OF FIGURES
PAGE NO.
Diagram No. - 4.1 Budget Sales & Actual Sales 68
Diagram No. - 4.2 Actual Sales, by Territories 78
Diagram No.-4.3 Budgeted & Actual Domestic Sales 79
Diagram - No. 4.4 Budgeted & Actual Foreign Sales 82

11
LIST OF ABBREVIATION
A.D. - Anno Domini
A.M - Arithmetic Mean
A/C - Account
Asst. - Assistant
B.S - Bikram Sambat
BE - Break Even
BEP - Break Even Point
BMDP - Biratnagar Milk Distribution Project
BMSS - Biratnagar Milk Supply Scheme
CC - Chilling Centers
CM - Contribution margin
Co. - Company
CV - Coefficient of Variation
CVP - Cost Volume Profit
DCC - Dairy Development Corporation
Dept. - Department
Dev. - Development
Dist. - Distribution
Div. - Davison
Exe. - Executive
DPNL - Dabur Nepal Private Limited
FC - Fixed Cost
FY - Fiscal Year
GDP - Gross Domestic Product
Gen - General
GON - Government of Nepal

12
HMSS - Hetauda Milk Supply Scheme
HPPCL - Herbs processing and production company Limited
I.E. - That is
No. - Number
NEBICO - National Biscuits and Confectionary Private Limited
NEA - Nepal Electricity Authority
P.E. - Probable error
P/L - Profit / (Loss)
P/V Ratio - Profit Volume ratio
PE’s - Public Enterprises
Prof - Professor
Rs. - Rupee
RDL - Royal Drugs Limited
S&D - Selling and Distribution
S.D - Standard Distribution
SDVKVS - Singh Durbar Vaidya Khana Vikas Samiti
T.U - Tribhuvan University
V/V Ratio - Variable Volume ratio
13
CHAPTER – I
Introduction
1.1 Background of the study
Economic growth of the country has not improved substantially over time. Agriculture
has still remained the significant in Nepalese economy since more than 80% of the people
are dependent on agriculture. It can be said that the growth of Nepalese economy is based
on agricultures which is also the main resource of livelihood of people. If the population
is engaged in the agriculture it can help to achieve self sufficiency self sufficient in food.
There is no doubt that this sector can contribute substantially in production activities,
export sector & supply of raw materials for an agro-industries as well as Industry,
business, trade & commerce. Nepalese economic condition does not improve without the
development & improvement of agriculture sector.
The industrialization process has started very late is our country. It started only after the
Second World War. Due to lack of investment & knowledge, private sector could not get
substantial success in industrialization. Therefore the government was forced to undertake
these responsibilities by establishing various manufacturing companies in the country.
Among them, some companies were established mainly to produce new whereas products
other was established to facilitate the industrial activities within the country. There is a
great challenge for the nation to eliminate massive poverty existing in the country through
gradual development of the industrial sector.
1.2 Evolution of Industries in Nepal
In ancient time, Handicraft & Cottage Industries played significant role. During Lichhibi
period industries like weaving, mining, handicraft, metal idols, food products were
encouraged. Prithvi Narayan Shah has made policy to protect cottage industries by
discouraging imports. At that time, Nepal becomes self dependent in textiles. The
development of modern industries was started after 1935 A.D. In 1935 an industrial board
named "Udhyog Parishad" was formed with a view to produce goods under medium &
large industry. The first company Act. was promulgated in 1936 A.D. & in the same year
Biratnagar Jute mill, the first joint stock company was established in Biratnagar. To
14
provide financial assistance to industries& trade, Nepal Bank Ltd. was established in 1994
B.S.
During ten year (1936-1946 A.D.) altogether 63 industries like established Morang Sugar
Mills, Raghupati Jute Mills, Judha Match Factory, Nepal Plywood & Babbin Company
were established beside Paper, Soap, Furniture, Oil, Rice Industries were also established
with a total investment of Rs. 7.20 crores. However, most of them went into liquidation
due to lack of proper management.
After the fall of Rana regime in 2007 B.S. Company Act was enacted. After democracy,
the process of planned industrialization started with the launching of the first five year
plan. In the first planning period, industrial policy 2014, Private firm Registration Act
2014 B.S. & Factory & Factory workers Act 2016 B.S. were published. During this
period, Balaju Industrial Estate was established. Some public enterprises were also
established during that period. They are Royal Nepal Airlines Corporation which is
converted into Nepal Airlines Corporation recently the days, Nepal Industrial
Development Corporation & Timber Corporation.
From the third plan onward, outlays for the private & public sectors were provided. The
plan was geared to promote industrial development through the private sector. In this plan
more than two dozen industries were established from private sector such as, Furniture,
Paper, Sugar, Cement, Lime Industries. However government had given priority for the
development of basic industries in public sector & establish. Bansbari Leather & Shoes
Factory, Brick & Tile Factory, Agricultural Tools Factory, Dairy Development
Corporation, Cottage Industries and Handicraft Emporium, Nepal Tea Corporation,
Agriculture Development Bank, National Insurance Corporation & Telecommunication
Board were set up during the plan period. In this plan period Dharan and Nepalgunj
Industrial estates were purposed. During the fifth plan, Butwal & Bhaktapur Industrial
estate were established. In this plan period, only three industries were established in
public sector; Hetauda Kapada Udhyog, Agriculture Lime Industry & Bhaktapur Brick &
Tile Industries. A few industries such as Flour Mill, Sugar, Cotton, Textile, Soap,
Polythene Pipe etc. were established in the private sector. During the sixth plan, Surkhet
Industrial Estate & Dhankuta Industrial Estate were established. In this plan period,
Biscuits, Sweets, Shoes & Sandle, Rice, Brick Factories were established in private
15
sector. In public sector, Lumbini Sugar Factory, Bhrikuti Pulp and Paper Industry, Nepal
Paper Industry, Herbs Production & Processing Company Limited, Butwal Spring Mills
Limited Nepal Magnetic, Nepal Metal Industries were established under construction
phase. Industrial Enterprises Act. 2039 B.S. & Foreign Investment & Technology Act
2039 B.S. were formulated during the plan period.
During the seventh plan, Rajbiraj Industrial Estate was established. In this plan period
Woolen Carpet, Ready Made Garments, Beer, Distillery, Cement, Cigarette Industries
were established in private sector where as Lumbini Sugar Factory, Udayapur Cement
Factory, Industrial District Management Ltd. & Economic Service Center Ltd. were set
up in public sector. During the eighth plan period, the government adopted open & liberal
economic policies. As a result Industrial Policy 2049, B.S. Industrial Act. 2049 B.S.,
Foreign Investment & technology Transfer Act 2050 B.S., Revitalization Policy act 2051
B.S, Company Act 2053 B.S. were reviewed. During this period a total of sixteen
important industries such as Bansbari Leathes & Shoes Factory, Harisiddhi Brick Factory
Balaju, Textile Industries, Nepal Film Development Corporation, Nepal Metal Industries,
Seti Cigarette Factory, Raghupati Jute Mills, Agricultural Tools Factory etc were
Privatized. During this plan, Drug, Soap Detergent Powder Factory, Bank & Finance
Companies were established under foreign investment.
During the ninth plan it had been accomplished which contained the liberal economic
policy. The plan had target to privatize thirty more public enterprises. So for only sixteen
enterprises have been privatized.
The objectives of ninth plan were
Increase contribution of industrial sector in domestic production
Increase the earning & reserves of foreign
Increase the production of processed goods through the arrangement of
necessary infrastructure &
Increase the income & purchasing power of people.
The main objective of tenth plan is to make economics sector of country effective healthy,
dynamic & competitive by maximum utilization of available resources. The plan
16
conceives to expand the role of private sector for higher economic growth & effective
operation of poverty alleviation programmed sector was as follows.
1. Emphasis on investor friendly environment for forward economic
improvement by policy wise guarantee.
2. Provision of entry & drawback of private investment in the every sector of
economic by defining the role of private sector.
3. Increase in competitive capacity by providing facilities & benefits to the
investment sector.
4. Acceleration of privatization programmed effectively.
With the end of the long conflict, Nepal has now started to move slowly towards of
sustainable peace. The three-year interim plan (2007-10) is now in the process of
finalization on the basis of the recommendations of the recently concluded meeting of the
National Development Council. The plan will be brought to implementation from the
fiscal year 2007-08.
It has been widely realized that the issues relating to economic development have so far
been side-stepped by the political issues. Incidents causing industrial unrest are wide-
spread. Industrial climate has not improved. Exports have declined because of the loss of
competitiveness due to higher cost of production. Problem of unemployment was not
been rightly addressed. An inclusive and judiciously balanced economic growth through
increased involvement in rural and backward areas has been long overdue. In view of
these development-related issues, the need has strongly been left to expedite the
implementation of various political commitments, policies, and program and development
projects.
1.3 Overview of Dabur Nepal Pvt. Ltd
In the early 90’s the liberalization policy adopted both Nepal & India. Nepal has become
a place for immediate investment to Indian & other foreign investor. Dabur Nepal Pvt.
Ltd. is an example of joint venture business with Dabur India Ltd. A company with 100
years of expertise in Ayurvedic based personal care, health care & food product has been
a catalyst for the country’s infrastructural growth, economic independency & global
recognition. Dabur Nepal was established in 1992 A.D. with an initial investment of Rs

17
80 million. The Joint Venture Company agreement was done in 1989 A.D. The company
was established with a majority share of 80% by Dabur India Ltd. The commercial
production started on November 5, 1992 A.D. The factory is situated at Parwanipur,
Birgunj & its corporate office is located at TNT building, Koteshwor Teenkune Nepal.
DNPL has succeeded in fulfilling the needs in health care, personal care & food product.
The company is the first of its kind in the country to harness ecological resources &
manufacture commercially variable & value added top of the line products locally to be
sold at prevalent rates for domestic use & export to India, Bangladesh & other
Neighboring countries.
Dabur Nepal Pvt. Ltd. has been combining modern technology with the wisdom of
ancient texts to develop innovative products. Dabur manufactures varieties of innovative
products. Dabur manufactures varieties of products. It is into the business of
manufacturing & selling of Ayurvedic medicine, Ayurvedivc Natural, Herbal Personal.
Health products & processed food either directly or indirectly through the subsidiaries.
Subsequently to the review of India & Nepal treaty in 1992 A.D. the government of India
eased out the procedural delay for allowing import of products manufactured in Nepal
having more than 50% component of India & Nepali origin along with labour cost. This
gave further impetus to Dabur Nepal Pvt. Ltd. to increase its production target within a
span of more than 15 years of its operation. The company has achieved a turnover of Rs
32270.23 lakhs in the fiscal year 2005/06 out of which Rs 25,905.65 lakhs equivalent
products was export.
Family needed products are into business of manufacturing & selling of Dabur Nepal Pvt.
Ltd. Hair Care Products, Oral Care Product, Skin Care Products & Honey. Hair Care
Products include Dabur Amala Hair Oil, improved Dabur Special Hair Oil, Vatika Hair
Oil, Vatika Shampoo Oral Care includes Dabur Lal Danta Manjan, Dabur Lal Toothpaste
beside that the company has also Binaka range of Toothpaste & Tooth Brushes.
Health care products are into business of Ayurvedic based Health Tonics, Health Tablets,
Health Oils. The division’s product portfolio consists of health tonics products consisting
of Chyawanpransh, digestive product which of Pudinahara, Hajmola Tablet & Hingoli
Child Care Products consist of Dabur Lal Tail.

18
The Dabur Nepal Pvt. Ltd. started manufacturing of Dabur products in Nepal like Lal
Danta Manjan, Amala Hair Oil & Hajmola in 1992 A.D. The company has been
increasing & modernizing the product line. The company has also set up herbal nursery
project "Plant for Life" a 90 million green house project at Banepa in 1996 A.D. with a
vision to rejuvenate the fast receding herbal flora of Nepal. Spread over five acres of land,
the lush green environment comprising twenty green house DNPL has been engaging to
produce the needed herbal ingredient for its product & has helped to generate
employment in the locality. Dabur Nepal Pvt. Ltd. has employed more than 600 local
Nepalese for employment in the factory. Apart from that more than 2500 families at
various remote places are benefited from collection Taxes Baccata Levales, Pipli, Tamar
Seeds, Sunthi etc.
"The main aim of starting the nursery project has been to develop a sustainable resource
of medicinal herbal & protect the ecological balance of the Himalayas.
The application of this project has spurred a study supply of rare, endangered medicinal
herb, saplings in a state of the art green house equipped with modern climatic controls.
The saplings are also sold at a cost to formers in remote areas to grow and harvest with
buy back guarantee." Steps have been taken to subsidize the cost of saplings in order to
enable broader participation of the local people. In addition to these commercial activities
the company has been an active member of the socio-economic development of Nepal.
The company has not only established some benchmark facilities in production &
scientific research but also set in place social programmes that help local communities.
Set up social welfare schemes to develop infrastructure facilities in health &
education sectors.
Promotion cultural events to give a boost to Nepalese art.
Sponsor & supporting events to help build up Nepal presence in the world of
sport.
Beside it has got several accolades including the higher export award from the ministry of
commerce, NICCI award for excellent & CIP award for outstanding contribution to the
country. In the fiscal year 2000A.D. DNPL got certificate at Hazard analysis & critical
point (HACCP) plan verification for manufacturing of Fruit Juice & tomato Puree. The

19
company produced Real Brand Juice in various flavor in Mango, Orange, Pineapple,
Litchi, Grape & Mixed Fruit flavors.
The company endeavor has shown some remarkable result in just over a decade
Dabur Nepal Pvt. Ltd. established a strong national wide brand, selling
through over 20000 retail out lates throughout Nepal.
Dynamic brand & corporate image building exercises through sponsorship of
major national sport & cultural event.
Capital asset made a jump to 11.72 times in 14 years
Net profit of company crossed corers of rupees the company has redesign
extent & launch the product according to necessary & consumer demand.
The Company has redesign, extent & Launch the product according to
necessity & consumer demand.
The main objectives behind the establishment of Dabur Nepal Pvt. Ltd. are to establish a
modern factory, process & blend local & imported herbs & thus produce different
varieties of healthful products. According to license issued by the department of Nepal
Dabur Nepal Pvt. Ltd. is permitted to Industry, make arrangement in a planned manner
for their sales & distribution & also export them to foreign countries.
1.3.1 The major products of Dabur Nepal Pvt. Ltd. are as follows
1. Lal Danta Manjan 2. Dabur Lal Tooth Paste
3. Vatika Hair Oil 4. Vatika Shampoo
5. Vatika Face Pack 6. Amala Hair Oil
7. Special Hair Oil 8. Baby Olive Oil
9. Hajmola Tablet 10. Chywanprasch
11. Real Fruit Juice 12. Glucose ‘D’
13. Pachan Churna 14. DCP Mishan
15 Danta Mukta 16 Honey
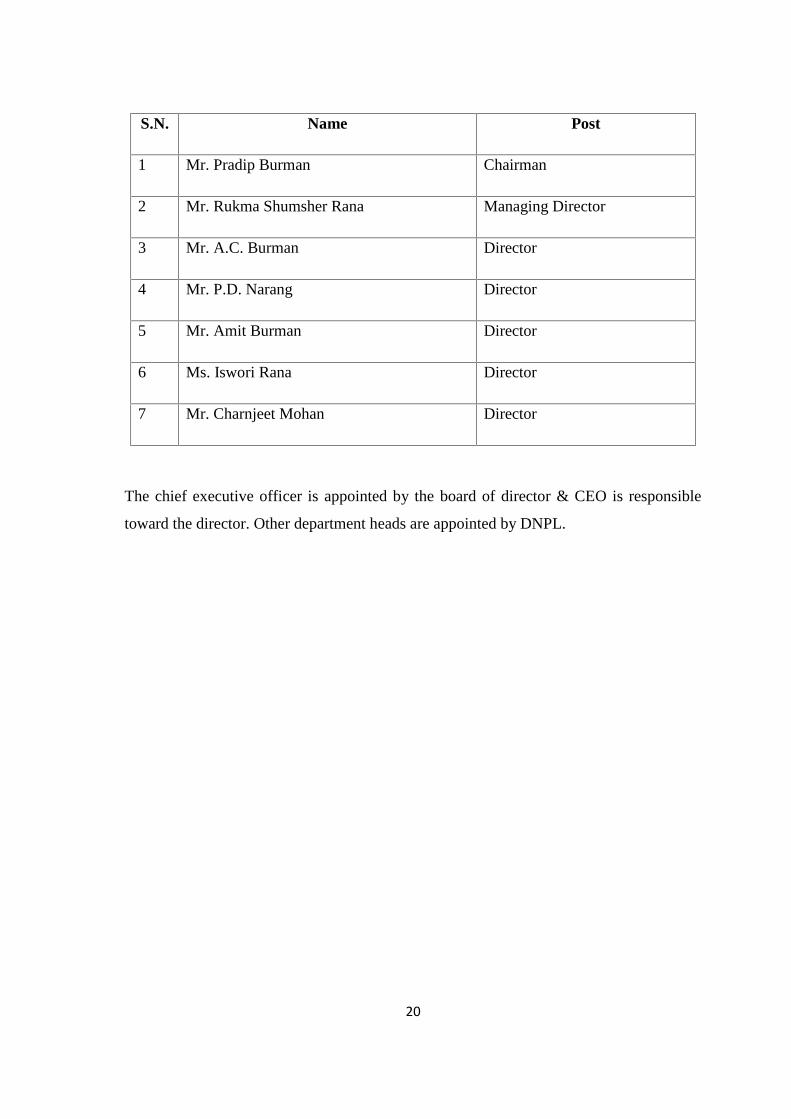
1.3.2 Management & Directors of Dabur Nepal Pvt. Ltd.
Management of Dabur Nepal Pvt. Ltd. at present is entrusted to board of director
consisting of seven members. The members of board of directors are as follows.
20
S.N. Name Post
1 Mr. Pradip Burman Chairman
2 Mr. Rukma Shumsher Rana Managing Director
3 Mr. A.C. Burman Director
4 Mr. P.D. Narang Director
5 Mr. Amit Burman Director
6 Ms. Iswori Rana Director
7 Mr. Charnjeet Mohan Director
The chief executive officer is appointed by the board of director & CEO is responsible
toward the director. Other department heads are appointed by DNPL.

21
Board of Directors
C. E. O.
(CEO)
H.S. Bedi
Sales &Marketing
Head
S. BadrinarayanNursery
operation Head
BibekAgrawalaFinancial
Controller
Atula Nagar
DGIM CPPD &CSCC
K. AbhimanyuManager - HR
Sanj
uli P
radh
an
Offi
ce C
oord
inat
or

22
1.3.3 The Bankers of DNPL
Dabur Nepal Pvt. Ltd. obtains loan from reputed banks they are
1. Nabil Bank Ltd.
2. Standard Chartered Bank Ltd.
3. Nepal SBI Bank Ltd.
1.3.4 The corporate purpose of the company
The main purpose of Dabur Nepal Pvt. Ltd. is to meet the everyday need of people
everywhere to anticipate the aspirate consumer and to respond creatively and
competitively with the branded production and services which rise up quality of life. The
company brings their wealth of knowledge and industrial expertise to the service of local
customers. Dabur Nepal Pvt. Ltd. roots in local culture and market are up parallel in
heritance and foundation for the company for future growth for its long term meeting
required total commitments with exceptional standard of performance and productivity to
work together affectivity and willingness to support new ideas and learn continuously.
The company believed that the success requires the highest of corporate behavior to meet
the aspirations employees, consumers, society. Thus Dabur Nepal Pvt. Ltd. needs the
sustainable profitable growth & long term values creation for their stakeholder. The
vision of Dabur Nepal Pvt. Ltd. was “Dedication to the health and will being of every
household.”
1.4 Introduction of Management and Planning of Revenue:-
Revenue planning and management are crucial for the overall profit planning of business
enterprises. Profit realization is the result to the effective emplacement of series of plan
including revenue planning & management. In current system of revenue planning mostly
advertising affects profit. Thus periodical analysis of revenue planning is necessary in
order to ensure smooth functioning of enterprises for realization of profit.
Revenue is the results of the sales of goods and rendering services are measured by the
charge made to consumers. Revenue planning is a starting point of overall planning
process.

23
The basic issue of revenue planning & management has been sought to be answered by
this study. It has been tried to assets the efforts of the company by way of increasing the
sales in Rs or volume. It has been also attempted to see whether the company has added to
its original line of product or take more consumers of its product in different segments
such as institutional buyers, individual buyers etc. The industrialization in the country
slowly in spite of various attractive polices of government in respect of industrialization.
The financial performance, investment on industry and utilization of data are not
encouraging.
The primary purpose of planning of business is to increase the chance of making profit.
The budget is the primary operating planning document and committed performance
budget are call profit plan. Mangers and sub-ordinates are responsible for the operation
within the profit plan. Since manager and sub-ordinate have the authority in varying
degrees to make decision the result of which will most nearly accomplish thought better
budgetary target.
Management is the philosophy which governs the group of people & materials, so that
maximum profit can be achieved. A management is a distinct process consisting of
planning organizing & controlling performed to determine and accomplish the objective
of people and sources. Enterprises cannot be successful without of accomplishment of
money, economic social & political effectiveness of human efforts. It helps to achieve
better equipment plans, office production, service & human. It keeps of aware of
changing conditions and provides foresight & imagination.
1.5 Statement of the Problem:-
Economic prosperity of every country depends upon a sustainable economic
development. The industrialization in the process of value added that contributes to the
creation of new employment opportunities & economic integration.
Public enterprises are established in order to prepare social overhead capital to produce
the required goods and services in the company & to increase exportable goods, help in
controlling price situation to create opportunity for employment to increase government
revenues & contribute significantly in the national economic transformation of company.

24
The private sector investor did not take a leading role in the rapid socio-industrial
development of the country as desired. Therefore the role of government owned
enterprises become very important especially in terms of developing the infrastructure,
extending social over head capital which increase the excess capacity of economy that
leads to intensify industrial production giving this fact more prominence & greater
reorganization was given in the various plan of Nepal government to the role of
government corporation.
After the restoration of democracy in 1990 A.D. Nepal has adopted open & liberal
economics to attract the “foreign direct investment (FDI) and Technology Transfer Act
1992 A.D.” was enacted for the purpose which defends technology transfer as any
transfer of technology to be made under the agreement between industry & foreign
investor. There are various manufacturing industries established in Nepal under the
foreign investment. A good example, Dabur Nepal Pvt. Ltd. Colgate, Palmolive, Coca
Cola, Pepsi, Unilever Nepal Ltd. etc. Most of them have proved to be the important
enterprises for the development of the country. Attainment of huge amount of investment,
advanced technology and concept, employment generation are the main important of
those enterprises to Nepal.
The successful operation of an enterprises largely depends up on planning & control
system of an enterprises Profit Planning and Control is the most important management
device that plays key role for effective formulation and implementation of strategic as
well as tactical plans of an organization. PPC system requires the effective co-ordination
between various financial budgets of an organization. In this contest the study tried to
answers the following research questions.
1. How effective was the sales budget of Dabur Nepal Pvt. Ltd.?
2. What were the main problems in implementing sales budgeting practice in
Dabur Nepal Pvt. Ltd.?
3. What was the ratio between sales & Profit?
4. What steps should be taken in the revenue planning and management to in the
sales revenue of the company?

25
1.6 Objectives of the study:-
The basis of this research is to analyze management and planning of revenue practice of
Dabur Nepal Pvt. Ltd. In order to identify problems and recommend possible remedial
measures this study was conducted with the following the major objectives.
1. To make analysis of sales revenue of Dabur Nepal Pvt. Ltd.
2. To make a comparative study of revenue generated by Dabur Nepal Pvt. Ltd.
3. To evaluate the deviation between budgeted and actual sales.
4. To make comparison of sales with profit of Dabur Nepal Pvt. Ltd.
1.7 Significance of the study
Revenue planning is one of the most important plans for both non manufacturing &
manufacturing enterprises to achieve their goals. In the context of Nepal, most of the
manufacturing enterprises are suffering from poor performance due to lack of proper
management of revenue planning No-organization can achieve its goals without
systematic revenue planning and management. Proper revenue planning is the most
important for every enterprise to earn profit.
Dabur Nepal Pvt. Ltd. produced different type of products to meet everyday need of
people everywhere. Dabur Nepal Pvt. Ltd. being a manufacturing company it spends a lot
of time and efforts to earn profit. Therefore the researcher is very much interested to
examine its revenue planning. This study would be very useful for entrepreneur, decision
makers & researchers because it dealt with all the aspect of budgeting & profit planning.
The study was initiated to examine whether the Dabur Nepal Pvt. Ltd. applied revenue
planning system properly or not.
1.8 Limitation of study
The study focused on the revenue planning management of Dabur Nepal Pvt. Ltd. This
study is not free from the following limitation.
1. This study is based on secondary data obtain from Dabur Nepal Pvt. Ltd.
2. The study covers the analysis of only six years data.

26
3. Use of personal interview as primary source would not be free biases.
4. Limited time dimension made difficult to make thoroughly analysis.
1.9 Organization of the study:-
The chapters of the study were designed the following patterns.
Chapter 1:- Introduction
This chapter dealt on general historical background of development of industries in
Nepal, Overview of Dabur Nepal. P. Ltd. introduction to revenue planning statement of
the problem, objective of the study, significance of study & limitation of study.
Chapter 2:- Revenue of Limitation
This chapter dealt with literature review covering of profit planning, revenue planning
and also includes brief review preview research works so far
Chapter 3: Research Methodology
This chapter consisted of the research designed source of data collection & Procedure
period covered, tools used and researches variables.
Chapter 4:- Data Presentation, Analysis & Finding
This chapter made presentation & analysis of data collected from various sources by
using various financial & statistical tools. This chapter also include & major findings of
the analysis.
Chapter 5:- Summary, conclusions and recommendation & suggestions
This chapter consisted with summary, conclusions and recommendations

27
CHAPTER - II
Review of Literature
2.1 Planning
Planning is the first phase of the five functions of management and followed by
organizing, directing, coordinating and controlling. Planning means choosing among
alternative objectives, policies and programs as well as the methods, procedures and
techniques for making the plan effective. Planning is the foundation of business. It is the
safeness means by which business enterprise assures tomorrow’s solvency. To plan is to
determine a forward program for the future affairs of an enterprise. The purpose of the
plan is to adjust necessary conditions to the predicted environment in order to obtain the
greatest advantage for the company. The plan should be sufficiently flexible to meet
unforeseen conditions. A coordinated plan could incorporate both immediate programs
and long-range objectives.
In industry and commerce, the different between success and failure, profit and loss
depends upon the outcome of well-laid plans. Planning is an integral part of our everyday
lives, without it, actions become purposeless and effort gets wasted.
Many firms & companies use planning, which determines long range & short range
decision for running the overall business. The terms & conditions are evaluated in terms
of their financial impact on the business organization and plans are expressed in financial
terms. It is the statement of organization and overall activities for coming period. It is
developed by top executives considering general economic conditions, anticipated
conditions of industries competitive consideration etc. Plan is projection of activities of
functional department. It is developed in detail by specifying timing of activities for
execution.
"Planning means setting goals for the firm considering various way of meeting those
goals & picking out what appears to be the best way to meet the goal" (Lynch &
Williamson, 1493:18)
"To plan is to look ahead and chalks out future course of operations. It is the
determination of course of action to achieve a desired result."(Kulkarni, 1985:187)
28
The planning processes both short and long term, are most crucial component of whole
system. It is both the foundation and the bond for the other elements because it is through
the planning process that an enterprise determines what it is going to do, how it can be
done it, and who is going to do it. It operates as the brain centre of an organization and
like the brain it both reasons and communicates.
Planning is concerned with taking action in the immediately to prevent becoming obsolete
in the future. It is concerned with how an organization can change internally to adopt to
variations in external conditions. There are many external factors, which make the
planning process essential for organizational survival. In short, planning refers, to the
process to answering the questions related with what, who, how, where of any
organization.
“Planning is directed toward the establishment of desirable future objectives and the
formation of an organizational structure to be followed in achieving them. Control results
from the evaluation of individual and group effort in terms of the predetermined goals.
The effective discharge of these functions is essential to sound business management and
successful operations.” [Niswonger & Fess, 1965:515]
“Planning is first function of management. It is performed continuously because the
passage of time demands both re-planning and making new plans. Moreover, current
feedback often necessitates newly planned actions to (a) correct performance deficiencies,
(b) cope with unanticipated events that are unfavorable and (c) take advantage of new
developments. Management planning is a process that includes (1) establishing
enterprises objectives and goals (2) developing premises about the environment of the
entity (3) making decision to activate the plans and (4) evaluating performance feedback
for re-planning. Management planning provides the basis for performing the four other
functions- organizing, staffing, leading and controlling.” [Welsch, Hilton & Gordon,
1998:4-5]
“It is some times said that planning is the primary managerial functions which logically
precedes all other functions, since without planning, a manager would not have activities
to organize, would not require a staff, would have no one to direct and would have no
need to control. However, the managerial job is actually one, which takes place

29
simultaneously rather than serially. Planning is one of functions of the manager and, as
such involves the selection, from among alternative, of enterprises objectives, policies,
procedures, and program. It is thus decision-making affecting the future course of
enterprises.” [Koontz & Donnel, 1990: 21]
“Fundamentally, then, managerial decision-making entails the task of manipulating the
relevant controllable variables and taking advantage of relevant non-controllable variable
that may influence long-run operational success. The controllable are those that can be
actively planned and controlled by management. In direct contrast, management cannot
influence the non-controllable variables. Yet this does not mean that effective planning
with respect to them is not possible. Significantly, the non-controllable variable must be
projected and “planned for” to take full advantage of their anticipated favorable
consequences.” [Welcch, Hilton & Gordon, 1998:9-10]
Thus it can be concluded that planning is deciding in advance, what is to be done in
future? It is a method of thinking out acts and purpose before and planning starts with
forecast and complete with determination of future events. It is the first essence of
management and all other function performed within the framework of planning.
2.1.1 Components of Planning
Planning programme encompasses much more than the traditional idea of a periodic
budget. Rather, it encompasses application of a number of management concepts through
a variety of approaches techniques and sequential steps. The essential steps implicit in
profit planning programmed may be as follows:
1. Evaluation of relevant variables affecting the enterprise.
2. Specification by executive management of the broad objectives of the
enterprise.
3. Establish specific goals for the enterprise.
4. Development and evaluation of enterprise strategies.
5. Preparation of planning premises.
6. Preparation and evaluation of project plans.
7. Development and approval of strategic and tactical profit plans.
8. Development of supplementary analysis.
30
9. Implementation of profit plan.
10. Development, dissemination and utilization of performance reports.
11. Implementation of follow up actions.
2.1.2 Characteristics of Planning
There are certain characteristics in planning. This characteristic should be helpful in
understanding the fundamental nature of planning process. [Thacker & Ellis, 1981:164)]
They are
A. Uncertainly and risk
Planning involves predicting the future. Thus the manager is faced with the situation of
acting rationally with the uncertainty about the future. It is therefore useful to classify
decision-making according to its degree of certainty or uncertainty. The three situations of
decisions can be categorized into
a. Decision-making under certainty
b. Decision-making under risk
c. Decision-making under uncertainty
B .Use of information
Planning requires forecasting. Instead of using historical events as the choice, the data
must be converted to make prediction. For example, where an operating plan in the form
of a budget is being developed, the past sales would be the starting point for setting the
future sales goal. Other considerations would include the volume and sales price expected
in the future, the economic environment, population trends, credit availability, and so
forth. The successful manager, in planning, is concerned with information that will help to
determine the real difference among the options.
C. Simplifying
Planning provides the possibility of identifying and extremely large number of options for
dealing with any one issue. In addition, there can be a very large number of goals toward
which to aspire. Plans cannot be made once and for all. Instead, they must be made with
the understanding that they may not succeed. Furthermore, new insights and information

31
may require a change in the goals. To deal with this problem in planning at a series of
decisions must be made.
On the other hand, the commitment of resources over some reasonable time span serves to
simplify the planning job. Another simplifying factor is the trade customs that develop
within industries. These serve as guides to planning as do laws, ethics and other codes of
conduct.
A final simplifying process in the planning job has been designated as the principle of
bounded rationality.
2.1.3 Corporate Planning
Corporate planning is reasoning out how a business will get, where it wants to go. It is
largely a mental process of thinking before doing (look before you leap). The essence of
corporate planning is to see opportunities and threats or risk in the future, and exploit the
opportunities, combat threats or face the risk as the case may be. [Sherlekar, 1983: 3]
Corporate planning determines long-range goals of a company as whole and in order to
achieve them functional plans are made. Corporate planning is action oriented. Since,
corporate planning is also concerned with long-term goals; it cannot be obtained without a
forecast. Through forecast, the objectives and determines the means which must be
orchestrated in order to achieve the objectives. Corporate planning therefore is the
technique for action now for ensuring the goal. [Hampton: 22]
In most business in earlier times (and in smaller firms today), the focus of the manager’s
job was on today’s decisions for today’s world in today’s business. However changes
taking place all around led to a different approach to management. Managers began to see
the value of trying to anticipate the future and to prepare for it. They did this in several
ways. They prepared systems and procedure manuals for decision. They prepared
budgets. They tried to anticipate future sales and flows of Funds. In sum, they create a
planning and control system. Then long-range planning appears. This movement focuses
on forecasting the future by using economic and technical tools.
“First-generation planning” means that the firm chooses the most probable appraisal and
diagnosis of the future environment and of its own strengths and weaknesses. Form this; it
involves the best strategy for a match of the environment and the firm- a single plan for

32
the most likely future. Today’s approach is called “strategic planning” or more frequently
“strategic management”. Strategic management focuses on “second generation planning”
this is, analysis of the business and the preparation of several scenarios for the future.
Contingency strategies are then prepared for each of these likely future scenarios [Jauch
& Glueck, 1988:4-5]
2.2 Forecasting
Forecasting is predicting the future business conditions and the state of the economy on
the basis of various statistics describing past and current conditions particularly those
selected as indicators.
Forecast indicates what is to be expected in the future and thus provide a framework on
which plans are built. Forecasts are indispensable in planning. Forecasts are statements of
expected future conditions. Define statements of what will actually happen are patently
impossible. Expectations depend upon the assumption made. If the assumptions are
plausible the forecast has a better chance of being useful. Forecasting assumptions and
techniques vary with the kind of planning needed. Short term forecasting is needed in
budget making. A budget set for the following year will be much more useful. It greases
sales levels, which will eventually rather than merely to current sales levels. In general,
forecasting may be long term, short term and intermediate term.
2.3 Forecasting Vs Planning
Foresting is our thinking about what will happen to us in the future whereas, planning
includes programme of intended future action and desired results. Many companies use
and prepare forecasts but don’t have a disciplined planning procedure. Other companies
have procedure without using forecasts as a part of their plan. The base arrangement is to
use both techniques. It may be used to prepare a short-term forecast of sales and profit
and projects them into future long range periods. A good long range plan may utilize may
be more useful then short term forecasts without the future projection is starting point.
“A forecast is not a plan; rather it is statement and/or a qualified as assumption of future
about a particular subject (e.g. sales revenue) more explicit assumptions. A forecast
should always set the assumptions upon which it is based. A forecast should be viewed as

33
only one input into the development of a sales plan. The management of a company may
accept, modify or reject the forecast. When comparing forecasting with sales planning, a
sales plan incorporates management decisions that are based on the forecasts, other inputs
and management judgments about such related item as sales volume, prices, sales efforts
production and financing” (Welsch, et. al., 2000: 172).
“The destination between forecasting & planning is not an easy one. Webster gives; “To
plan a head” is the leading definition for forecast. Forecasting is our best thinking about
what will happen in the future. In forecasting situation is assumed and recognize problems
and opportunities. In planning objectives are developed in practical details, and
correspondingly develop schemes of action to achieve these objectives.” (American
Accounting Association: 502)
Forecasting is a technical activity, usually assigned to technically trained staff specialists.
Its purpose is to predict a probable outcome from a given set of circumstances for a
specified period in the future. A forecast rests upon specified assumptions made by the
forecaster. Forecasting often provides some of the basic data that are useful in the
planning process
2.4 Role of Forecasting in Planning
Forecasts are indispensable in planning. Forecasts are statement of expected future
conditions, definite statement of what will actually happen are patently impossible
expectations depend upon the assumption made if the assumptions are to be plausible (to
be believable) the forecast has a better chance of being useful. Forecasting assumptions
and techniques vary with the kind of planning needs.
Most managers are not familiar with the theoretical aspects of forecasting and its
limitations because they do not have the depth. Yet, many manufacturing companies have
a forecasting function because it can help them to cope with an increasingly uncertain
environment. Management planning involves uncertain and reliable forecast can help
reduce the uncertainty in planning. A forecasting system must establish a mutual
relationship among forecast made by different management: There is a high degree of
interdependence among the forecasts of various divisions or departments which cannot be
ignored if forecasting is to be successful. For example, error in sales projections can

34
trigger a series of reactions affecting budget forecast operating expenses, cash follows,
inventory levels, pricing etc. Similarly budgeting errors in projecting the amount of
money available to each division will effect product development, modernization of
equipment hiring of personnel and advertising expenditure. This turn will influence, if not
determine the level of sales, operating costs and cash flows.
2.5 Overview of Profit Planning
“Profit planning has to resolve a number of conflicting issues before expressing the
established directions & decisions made by top management. Conflicting aims should be
brought to produce more sales & profit out many investors also increase the investment in
working capital & the risk of bad debt”(Holmes & et; at. 1970: 682).
A profit planning is an advances decision of expected achievement based on the most
efficient operation. It is established against which actual accomplishment is regularly
compared. Profit is an outcome of effective & efficient management which is effected by
various factors. Profit planning is that tools which manage all the factors efficiently &
effectively.
Profit planning is therefore fundamental part of the overall management function & is
vital part of total budgeting process. The management determines the profit goals &
prepared goals. Profit planning can be done only when the management has the
information about the cost of the products both fixed a variables & the selling price at
which it will be in a position to sell the products of company. (Maheshwari, 2001:171)
Profit Planning is a means by which management plans are expressed in to amounts. By
means of departmental breakdown the budgetary scheduling is communicated to each
operating supervisor who is affected. When correctly applied, the budgetary system can
be a means of motivating employees to more efficient operations or to improved
individual performance. [Seller, 1964:655]
Thus a budget is a plan for the future expressed in financial terms. In business units,
budgets represent an operating plan with two primary objectives: (1) to provide a
financial forecast of future operation and (2) to provide standards for the measurement of
performance. A company budget is, therefore, both a plan for the future and a means of
comparing actual results with the standards established in the budgets.

35
“Profit planning or budgeting is a forward planning & involves the preparation in advance
of the quantitative as well as financial statements to indicate the intention of management
in respect of the various aspects of business. Profit planning, in fact, is a managerial
technique and it is written plan in which all aspects of business operation with respect of
definite future period are included. It is a formed statement of policy plan objective &
goal established by the top management in respect of some future period. Profit planning
is a predetermined detailed plan of action developed and distributed as a guide to current
operations and as a partial basis for the subsequent evaluation of performance. Thus, it
can be said that profit planning is a tool which may be used by the management in
planning the future course of action and controlling actual performance. (Gupta,
1992:521)
Profit planning is a systematic & management accounting formal means of decision
making and attaining organizational objectives & goals at a specific future period of time
by the application of diversified managerial tools for utilization of available resources at a
reasonable manner.
To plan profit intelligently, as Lynch suggests that a management needs to know.
a) The economic characteristic of the firms operation,
b) The nature of the market for its product;
c) The nature & severity of its competition;
d) The cost of its factors of production the material, the labor, productive
capacity, the capital)
e) The sound & intelligent planning of profit, cost & sales are important in the
age of rapid technological change.(Lynch, 1999:100)
Profit planning is the work involved in attaining the objectives where a firm hopes to
realize through the use of a complete budgetary system. Such planning includes budget
conference with executives and department heads, analysis of past performance, analysis
of expected future conditions, study of pricing policies determination of break-even
points, coordination of departmental activities, control of cost by measurement of result,
and of course, the actual forecasting in financial terms. [Easton, Newton, 1958:374]

36
2.5.1 Profit Planning & Control
Profit planning and control is a process of carefully & systematically planning future
activities "In some companies plans for the future exist only in the minds of one or two
top executives, out in more progressively managed companies formal budget are prepared
& approved by executive management in advance of actual operation. (Robort E
Seller, 1964:655). The comprehensive profit planning & control is defined as a systematic
& formalize approach for performing significance phase of the management planning and
control functions. Specially, it involves.
1. The development and application of broad and long range objectives for the
enterprises.
2. The specification of enterprise's goal.
3. A long range profit plan developed in broad terms;
4. A short –range profit plan detailed by assigned responsibilities (division, products
projects.)
5. A system of the periodic performance report detailed by assigned responsibilities; and
6. Follow –up procedures
The concept of comprehensive budgeting course it's use in planning organizing &
controlling all the financial and operative activities of the forth coming period (Richard &
Williamson, 1995 :142).
Profit in the accounting sense is the excess of revenue receipts over the cost incurred in
producing this revenue. This concept of profit is known as residual concept. But in
economics both implicit & explicit cost are deducted from total sales in determining profit
(CAUVERY, 1997:122-123).
Basically comprehensive profit planning offers a systematic, practical & approach to the
management. Profit panning & control is a comprehensive system to coordinate. All
aspect of the management process carefully together the close ends of management &
operation.
37
2.5.2 Fundamental Concept of Profit Planning and Control
The fundamental concepts of PPC include the underlying activities of tasks that must
generally be carried out to attain maximum usefulness from PPC. These fundamentals
have never been fully codified. Outlines of the fundamental aspects of PPC are given
below. [Welch, Hilton & Gordon, 1998:31-32]
1. A management process that includes planning, organizing, staffing, leading and
controlling.
2. A management commitment to effective management participation by all levels in the
entity.
3. An organization structure that clearly specifies assignments of management authority
and responsibility at the organization levels.
4. A management planning process.
5. A management control Process.
6. A continuous and consistent coordination of all the management function.
7. Continuous feed forward feedback, follow-up, and re-planning through defined
communication channels (both downward and upward)
8. A strategic (long-range) profit plan.
9. A tactical (short-range) profit plan.
10. A responsibility accounting system.
11. A continuous use of the exception principles.
12. A behavioral management program.
The basic objective of profit planning & control are: [Vinayakam & Sinha, 1992:17]
1. It's a plan of action and serves on a declaration of policies.
2. To coordinate the various division of a business, namely production, marketing,
financial and administrative divisions, by consultation among the divisional heads and
mutual agreement on company policies.
3. To decentralize responsibility on to each manager involved.

38
4. to plan and control income and expenditure so that maximize profitability is achieved.
5. To operate most efficiency the divisions, departments and cost centers of a plant.
6. To smooth out seasonal variations in production by developing new ‘fill-in’ products
and there by accomplishing once phase of economic planning.
7. to aid in controlling cash.
8. To obtain a more economic use of capital.
9. Only the exceptions are reported to the management so that corrective action can be
taken in order to achieve the objectives laid down by the management.
2.6 Revenue Planning
Revenue results from the sale of goods and rendering of services. Revenues are measured
in terms of the charge made to customers, clients or tenants for goods and services
provided them. It also includes interest and dividends earned on investments and other
increases in the owner’s equity except those arising from capital contributions and capital
adjustments. Revenue from ordinary sales and from other transaction in the ordinary
course of business is sometimes described as operating revenue. [Bhattacharaya &
Dearden, 1980:137]
The revenue planning estimates are only a guide to the level of future revenues, not a
guarantee. If the economy remains strong, the planning estimates are likely to
underestimate future revenues. But, if the economy fails to perform at the high level
anticipated in the control, the planning estimates will overstate future revenues.
Responsibility centers for sales district are often designated as revenue centre. The
revenue centre for the sales budget is normally a sales zone or sales district i.e. the unit
under the control of an area sales manager.
A reasonable degree of accuracy is hard to achieve in sales budget but it is imperative
owing to dependency of other budgets on sales. No methods will ensure absolute accuracy
but reasonably correct forecast are much more likely to result from thorough market
research and analysis and application of this knowledge to the individual circumstances of
particular business. [Varma & Agrawal, 1996:3.33]

39
The factors influencing the level of revenues may be classified as external and internal
[Barma & Agrawal, 1996:3.19-3.30]
1. Internal Factors
These include promotional aids such as advertising, incentives to salesman, ability of the
organization to satisfy demand, quality of the finished product, changes in price etc.
2. External Factors.
These include the fluctuations in the size of population, the general level of prosperity, the
extent and severity of completion in the market, government policy and regulation.
Changes in fashion and tastes, degree of competition expected from new product etc.
elasticity of demand for the product is of obvious importance if prices are expected to
undergo a change.
The revenue plan should be designed to coordinate the efforts of the sales department,
production department and all other departments. Many factors must be considered when
sales budget is established, including sales trends, limitations on the supply of
merchandise or the company’s market, competing products, the expected amount of
advertising, and general level of the economy. Since most of these unknown companies
frequently maintain a specially trained staff to increase them. [Seiler, 1964:659-660]
The revenue planning process is a necessary part of PPC. It provides for the basic
management decision about marketing and based on those decisions, it is an organized
approach for developing in a comprehensive sales plan. If the revenue plan is not realistic,
all of the other parts of the overall profit plan also are not realistic. Therefore, if the
management believes that a realistic revenue plan cannot be developed; there is little
justification for PPC. Simply, if it were really impossible to assess the future revenue
potential of a business, there would be little incentive for investment in the business
initially or for continuation of it except for purely speculation ventures that most
managers and investors preferred to avoid it. (Welsch, Hilton & Gordon; 1999:171-172)
The logical starting point in developing the revenue planning is to estimate sales. It does
not follow, however, that the revenue estimation can be considered in isolation or that
once the revenue estimates has been computed, the other element of revenue and expenses

40
will fall in to place. These are circular relationship between sales and some expenses. In
fact, the level or amount of certain expense may have a considerable influence on the
revenue. For example: the relationship between advertising and sales. [Finney & Miller,
1963:389]
The company erases profit only when it is able to sell its product and not when it
produces them. It is no use producing goods that are not likely to be sold and for which
there is a limited demand. In some business, it is necessary to establish that the product
will sell even before it is produced. In normal times of keen competition, the sales,
forecast must be realistic. It is undoubtedly true that past can provide experience and
information, which will be of assistance in estimating present and future revenue, but care
must be taken in presenting past facts to management so that incorrect conclusions may
not be drawn there from (Singh and Goyal, 1992: 37-40).
2.6.1 Revenue Planning Process
A planner should complete the following process for planning the revenue. They are as
follows (Welsch, et. al., 1999: 176-182).
Step 1 : Development Management Guidelines for Revenue Planning
All management participants in the sales planning process should be provided with
specific management guideline to be followed in sales planning. Fundamentally, those
guidelines should specify sales planning responsibilities. The purpose of these guidelines
is to attain coordination and uniformity in the sales planning process. The guidelines
should emphasis enterprise objectives, goals and sales strategies. The guideline also
should direct attention to such areas as product emphasis, general pricing policies, major
marketing strategies and competitive position.
Step 2 : Prepare Sales Forecast
One or more sales forecasts should be prepared. Such separate forecast should use
different assumptions, which should be clearly explained in the forecast. The management
guidelines should provide the broad assumptions. Forecasting methods are broadly
classified as (i) quantitative, (ii) technological, and (iii) judgmental. These forecasting
methods include time series smoothing, decomposition for time series, advanced time

41
series, simple and multiple regressions, and modeling. The forecasts should include
strategic and tactical forecasts that are consistent with the time dimensions.
Step 3: Assemble Other Relevant Data
In addition to steps (1) and (2), all other information relevant to developing realistic sales
plan should be collected and evaluated. This information should relate to both constraints
and opportunities. The primary constraints that should be evaluated are:
i. Manufacturing capacity.
ii. Source of raw materials and supplies, or goods for resale.
iii. Availability of key people and labour force.
iv. Capacity availability.
v. Availability of alternative distribution channels.
These five factors require evaluation and coordination among the heads of the various
functional areas in developing a realistic revenue plan.
Stet 4: Develop the Strategic and Tactical Sales Plan
Using the information provided in step (1), (2) and (3), the management develops a
comprehensive revenue plan. To do this the planning process must be structured to
maximize motivation of the sales force and realism in the revenue plan. These processes
should recognize the importance of management goals both strategic and tactical. The
process of developing a realistic revenue plan should be unique to each company because
of the company's characteristics its products, its distribution channels, and the competence
of its marketing group. Four different participative approaches widely used are
characterized as follows; (i) sales force composite, (ii) sales division manager's
composite, (iii) executive decision, and (iv) statistical approaches.
Step 5: Securing Managerial Commitment to Attain the Goals in the Comprehensive
Revenue
Top management must be fully committed to attaining the sales goals that are specified in
the approve revenue plan. This commitment requires full communication to the sales
manager of the goals: approve marketing plan and strategies by sales responsibilities. The
commitment must be strong and ever present day-to-day operations.

42
2.7 The systematic process of profit planning.
A budgeting is a quantitative expression of a plan of action & an aid to coordination &
implementation. Budget may be formulated for the organization as a whole or may be for
a sub unit. Budgeting includes sales production, distribution & financial aspects of an
organization. Budget programs are designed to carry out a variety of function comprising
planning evaluating, performance, coordinating activities by implementing plans,
communicating, motivate and authority.
A budget is a written plan for the future. The managers of forms, which use budgets, are
formed to plan ahead. A firm with specific goals in the form of a budget helps a firm to
control its cost by setting guideline for spending money for undead items because they
know at all cost will be compared to the budget .
The complete budget for a firm is often called the master budget. The master budget
consists of many functional budgets. These budgets include a sales budget, production
budget, a purchase budgets, an expenses budget, an equipment purchase budget and a
cash budget. Once all of these budgets are completed, the master budget for the entire
firm is prepared. (Flesher & Tonyak, 1960:406)
The master budget consists of many functional budgets including a sales budget, a
production budget, a purchase budget, an expense budget, an equipment purchase budget
and a cash budget. Once all of these budgets are completed, the master budget for the
entire firm is prepared. When all budgets have been prepared, the budgeted profit and loss
account and balances sheet provide the overall picture of the planner performance for the
budget period (Bajracharya, et. al., 2004: 356).
"Budget as a tool of planning & control in clearly related to the broader system of
planning & control in an organization. Planning involves the specification of basic
objectives that will guide it, in operation terms. It involves the step of setting objectives;
specifying goals, formulating strategic & expressing budgets. A budget is a
comprehensive & coordinated plan. (Khan & Jain, 1993: 296)
Budget impasses operational standards with accountability for performance & it must be
set with these objectives in view. Therefore the aim of every company should be to
prepare its budgets meticulously, systematically & factually and as a instrument of
management control.

43
The concept of comprehensive budget course its use in planning, organizing & controlling
all the financial & operating activities of the firm in the forth coming period. Budgeting
summarize the estimated results of the future transaction for the entire company in much
the same manner as the accounting process records & summarize the results of completed
transactions. (Lynch, et. at., 142)
Budget encourages cogent thinking and help in the avoidance of vague generalization as
all executives have to quantity plans to examine their feasibility in terms of profit
potential. They place the problems of profit in proper prospective by emphasizing that the
only means of safeguarding the desire margin of profits lies in adopting costs to precedes
which are beyond the control of enterprise. Then by maintaining the various activities of a
concern in proper relation to one another, business budgets bring a sense of balance and
direction in the affairs of an undertaking. Budget is also a psychological device that
obtains results. It makes these responsible for the implementation of the budgets
proposals conscious for
2.8 Role of Budgeting in Business Management
Budgeting forces early consideration of basic policies and compels all members of
management from top to bottom, to participate in the establishment of goals and plans. It
compels departmental managers to make plans to harmony with the other departments and
of the entire enterprise. So that it contributes to maintain coordination in the organization.
It compels management to plan for the most economical use of labour, material and
capital. Budgets also needs at all levels of management the habit of timely, careful and
adequate consideration of the relevant factors before reaching important decisions. It frees
executives from many day-to-day internal problems through predetermined polices and
clear-cut authority relationship. It thereby provides more executive time for planning and
creative thinking. It checks progress or lack of progress towards the objectives of the
enterprise. To sum up, budget application helps to predict future uncertainties and manage
the risks. The following main arguments are usually given for budgeting.
i. Focuses on strategic plans.
ii. Reduces uncertainties.
iii. Creates harmony.
iv. Provides basis for control.
44
v. Provides objective facts.
vi. Forces optimal allocation of resources.
vii. Facilitates credit (Bajracharya, et. al., 2004: 396).
2.8.1 Characteristics of Good Budgeting.
The characteristics of good budgeting are as follows.
a) Budgets may be formulated for the organization as a whole or for any sub unit.
b) A good system of accounting is also essential to make the budgeting useful.
c) A budget is a quantitative expression of a plan of action and aid to coordination
and implementation.
d) A good budgeting system should involve persons at different levels while
preparing the budgets. The sub ordinates should not free only imposition on term.
e) Budgets are designed to carry out a variety of functions, planning, evaluating,
activities, implementation plans, communicating, motivating and authorizing
actions. (Pandey, 1994: 21 -22)
2.8.2 The objective and purpose of budget
The main and most important purpose of the budget is to achieve the planned profit of the
business enterprise thus, it is considered as a main tool for planning and controlling the
profit One of the primary subjects of an annual budget is to measure the profit expectation
for the next financial years with check on all the circumstances favorite that can influence
the trading prospects.
According to Rattan, the following are the objectives of setting budgets.
1) It is a plan of action and serves as a declaration of policies.
2) It defines the objectives for all the executives
3) It provides a means of coordination and communication
4) Budget facilitates centralization control with delegated authority and responsibility
5) It provides comparison of actual performances with budgets
6) Only the expectations are reported to the management so that corrective action can be
taken in order to achieve the objective laid down by the management.
45
2.8.3 Classification of Budget
Broadly speaking, budgets can be classified as follows. [Vinayakam & Sinha, 1992:25-
26]
A. Classification according to time.
B. Functional classification.
C. Classification according to flexibility
A. Classification according to time.
1. Long-term budget:
The long term sales plan uses broad groupings of products with separate consideration of
major and new products and services. Long term sales plan usually involve in depth
analysis of future market potential, which may be build up from a basis foundation. Such
as production changes, state of the economy, industry projection, and finally company
objectives, long term managerial strategies would affect such areas as long term pricing
policy, development of new products and innovations of present products, new direction
in marketing efforts, expansion or changes in distribution channels and cost patterns
(Welsch, et. al, 2000: 173).
2. Short-term budget.
The short term sales plan is known as tactical sales plan. Short-term sales plan covers 12
months of period of future are which plan is made by quarterly and monthly. The tactical
sales plan is usually subject to review and version on a quarterly basis. The short range
sales plan includes a detailed plan for each major product and for grouping of minor
products. Short term sales plan must also be structured by marketing responsibility for
planning and control proposes. Short term sales plan may involve the application of
technical analysis; however managerial judgment plays a large for its determination.
A short range sales plan should include considerable detail, whereas a long range plan
should be in broad terms. Besides these, both the strategic and tactical sales plans have
three distinct features. They are: (i) the planned volume of sales at the planned sales price
per unit for each product. (ii) The sales promotion plan. (iii) The sales expenses plan.
46
3. Current budgets:
These budgets cover a period of one month or more and the short-term budgets are
modified according to current conditions or prevailing situations.
B. Functional classification.
Budgets correspond and are co-terminus with a particular function. These are called
“functional budget” whose number depends on the size and nature of the business. The
usual functional budgets of a business are:
1. Sales Budget
Sales are the primary source of revenue. The sales plan is the foundation for periodic
planning in the firms because practically all other enterprise planning built on it. All other
plans and budgets are depending upon the sales budget. The budget is usually presented
both in unit and rupees of the sales revenue or sales volume. The preparation of sales plan
is based upon the sales forecast. It is also known as corner stone for all the other budgets.
It is only the budget that deals both revenue and cost. It deals with the policy of business
expansion or intensification as well.
Generally the sales budget is accompanied by a computation of expected cash receipts for
the forth coming budget period. This computation is needed to assists in preparing the
cash budget for the year. Expected cash receipts are composed on collections on sales
made to customers in prior periods, plus collections on sales made in the current budget
period (Garrison, 1976: 253).
Sales plan is the first plan or budget to be prepared. It is an estimate of the goods that are
expected to sale. All plans are depended upon sales plan. A sales plan should be realistic.
Unless there is a realistic sales plan, practically all other elements of profit plan will be
out of kitten with reality, sales plan is the foundation for periodic planning in the firm
because practically all other enterprise planning is built on it. So management should
develop a realistic sales plan. If the management cannot develop realistic sales plan, it
will be little justified.
Sales forecasting and sales budget
Forecasting is the perquisite for planning. Sales forecasting is the statement of expected
future conditions of sales. These expectations depend upon the assumption made. If

47
assumptions as plausible the forecast has better chance of being useful. Sales, forecasting
assumptions and techniques vary with the kind of planning needed.
The sales budget is the foundation for preparation of the comprehensive master budget. A
sales forecast is broader than a sales budget, generally, encompassing potential sales for
the entire industry, as well as potential sales for the firm preparing the forecast. However,
the sales budget is the most important functional budget. It is not a sales forecast. It is a
planning and control document, which shows what management, intends to accomplish.
The document is active rather than passive. The sales forecast on the contrary, is a
projection of the available customer demand. A forecast reflects the environmental and
competitive situation facing a company, while the sales budget shows how a management
intends to react to this situation.
Thus it can be concluded that:
i. Sales budget is the quantitative expression of business plans and policies to be
pursed in future whereas sales forecasts are just well educated inferences about
probable future events.
ii. Sales budget is control device of management as it provides standard for
comparison with results actually while no control can be exercised by forecasting,
as it is just a probable inferences.
2. Production Budget.
Production plan is prepared after the sales budget. It is mainly related with the
manufacturing organization. Production budget shows the number of units of services or
goods that are to be produced during a budget period. In developing production budget,
the first step is to formulate policies relative to inventory levels. The next step is to
determine the total quantity of each product that is to be manufactured during the budget
period. The third step is to schedule this production to interim periods.
The marketing plan specifies the planned volume of each product (or groups of similar
products) for each time period through the planning period. The next step in a
manufacturing enterprise is to develop a production plan. This entails the development of
policies about efficient production levels (finished-goods and work in process inventory).
The quantities specified in the marketing plan, adjusted to conform to production and

48
inventory policies, give the volume of goods that must be manufactured by product and
by interim time period. Thus, the production budget can be represented in this way: sales
volume ± finished goods inventory change = production requirements (Welsch, et. al.,
2000: 210).
3. Materials and Purchase Budget
Material budget specifies the planned quantities of raw material required for production
process. Sufficient raw materials are needed to meet production needs, plus it should
provide for the desired ending raw material inventory for the budget period. However,
some quantity of material requirement will already exist in the form of beginning raw
materials inventory. The reminder will have to be purchased from suppliers. Therefore,
the budget should show the planned quantities of each raw material, by time, by product
and by using responsibility.
Planned material consumption = Planned production units × Standard raw material
usage per unit of output.
The material budget specifies the quantities and timing of each raw material needed.
Therefore a plan for materials purchase must be developed. The purchase budget shows
the estimated cost for each raw material and the required delivery dates.
Planned material purchase unit = Planned material consumption + Desired ending
inventory of raw material – Beginning inventory of raw material
The preparation of purchase budget is the responsibilities of the purchase manager.
Therefore, it is his/her responsibility to provide projected unit and materials cost for use
in the purchase budget.
Planned purchase price per unit =Total cost of purchaseUnits to be purchase
4. Direct Labour Budget or Plan
The direct labour budget is also developed on the basis of production budget. Direct
labour requirements must be computed so that the company will know whether sufficient
labour time is available to meet production needs. Although some companies prepare a
labour budget that includes both direct and indirect labour, it is usually preferable to
49
prepare a separate direct labour budget and to include indirect labour in the factory
overhead budgets.
The production plan provides the underlying data for planning the direct labour
requirements. The labour budget requires two additional decision inputs (i) the standard
direct labour hour per unit of each unit of finished goods and (ii) the average hourly wage
rates planned.
5. Selling and Distribution, Expenses Budget or Plan
Selling and distribution expenses include all costs related to selling, distribution and
delivery of products to consumers. These expenses are not product cost and are not
allocated to specific product. So, careful planning of such expenses affects the profit
potential of the firm.
The two primary aspects of planning selling and distribution expenses are as follows:
i. Planning and Coordination
In the development of the short term profit plan, it is essential that a favorable economic
balance be achieved between sales effort (expense) and sales results (revenue)
.
ii. Control of Distribution Expenses
Besides from planning considerations, it is important that serious effort be given in
controlling distribution expenses. Control is especially important, since distribution
expenses are frequently a significant portion of total expenses, and both sales
management and sales personnel tend to view such expenses lightly, in some cases
extravagantly, such as entertainment expenditures. It involves the same principles of
control as manufacturing overhead.
6. Administrative Expenses Budget or Plan
Administrative expenses include those expenses other than manufacturing and
distribution. They are incurred in the responsibility centers that provide supervision of a
service to all functions of the enterprise, rather than in the performance of any one
function. Because large portions of administrative are fixed rather than variable, the
notion persist that they cannot be controlled. Aside from certain top managers' salaries,

50
most administrative expenses are determined by management decisions (Bajracharya, et.
al., 2004: 376-377).
The administrative expenses budget covers the expenses incurred in farming policies,
direction the organization and controlling the business operations. In other words the
budget provides on estimate of the expenses of central office and of management salaries.
The budget can be prepared with the help of past experience and anticipated changes.
Budget may be prepared for each administration department, so that responsibility for
increasing such expenses may be fixed and related to the different executives.
7. Capital Expenditure Budget or Plan
Capital expenditure budget involves the planning and control of long term capital
investment. It is the process of deciding whether or not to commit resources to a particular
long term project whose benefit are to be realized over a period of time, more than a year.
A capital expenditure is the use of funds to obtain operational assets that will help earn
future revenue or reduce future costs. It includes such fixed assets as property plant,
machinery and equipment major renovations etc.
The capital expenditure budget gives an estimate of the amount of capital that may be
needed for acquiring the fixed assets required for fulfilling production requirements as
specified in the production budget. The budget is prepared after taking into consideration
the available productive capacity, probable reallocation of the existing assets and possible
improvement in production techniques. Separate budgeting may be prepared for different
item of fixed assets such as plant and equipment budget, building budget etc. The capital
expenditure budget is an important budget providing for the acquisition of assets
necessitated by the following factors.
Replacement of existing assets.
Purchase of additional machine to meet a proposed increase in production due to
increase in demand.
Purchase of new assets because of starting up of new lines of production.
Installation of an improved type of machinery so as to reduce cost of production.

51
The very nature of capital investments make them important. Capital investments involve
relatively large amounts. They represent commitments that extend over long periods of
time, and once a capital investment has been made, it is largely irreversible at least it is
hard to undo without making a major sacrifice (Handerson, 1984: 118-119).
Thus, the capital expenditure budget enables one to know what new fixed assets are
needed and what will be their costs and rates of returns.
8. Cash Budget or Plan
Cash is the most liquid asset, without cash no company cannot survive. It is one major
responsibility of management to plan, control and safeguard the cash of enterprise. On
these grounds the cash budget is one of the most important schedules prepared during the
budgeting process.
The planning and controlling of the cash inflows, the cash outflows and the related
financing is important in all enterprise. Cash budgeting in an effective way to plan and
control the cash follows, assess cash needs, and effectively use excess cash. A primary
objective is to plan the liquidity position of the company as a basis for determining future
borrowing and future investments. For example, excess cash if not invested incurs an
opportunity cost that is loss of high interest that could be earned on the excess cash. The
timing of cash follows can be controlled in many ways by the management such as
increasing the effectiveness of credit and collection activities, making payment on the last
day of discount periods matching payments and giving discounts on cash sales (Welsch,
et. al., 2000: 433).
A cash budget is a detailed estimate for some future period of time of cash inflows from
all sources, cash disbursement for all purpose and the resultant cash balance. It is the
process of forecasting the expected receipts and expected payments of cash to meet the
future obligations. It is an effective way to plan and control the cash flow, assess cash
needs an effectively uses excess cash. The preparation of cash budget is relatively simple
matter in an undertaking with a complete system of budgetary control because most of the
information needed for the preparation of cash budget is contained in budgets.
The primary purposes of cash budget are:
i. Give the probable cash position at the end of each period as a result of planned
operations.

52
ii. Identify cash excess or shortage by time period.
iii. Establish the needs for financing and/or the availability of idle cash for
investment.
iv. Coordinate cash with total working capital, sales revenue, expenses investment,
and liabilities.
v. Indicate the availability of cash discounts.
vi. Establish a sound basis for continuous monitoring of the cash position. (Koirda,
Ojha, Singh, Subedi & Acharya, 2007:610)
vii. Preserve liquidity.
Cash budget shows the details of cash receipts, cash disbursement and the balance cash.
The cash budget is composed of four major sections. (1) The receipts section, (2) The
disbursements section, (3) The cash excess or deficiency section, and (4) The financing
section (Garrison, 1976: 260).
C. Classification according to flexibility
1. Fixed Budget:
It is a budget in which targets are rigidly fixed. Such budgets are usually prepared from
one up to three months in advance of the fiscal year to which they are applicable from one
to three months in advance of the fiscal year.
A budget which is designed to remain Unchanged irrespective of the level of activity
attained (IMA, London)
2. Flexible Budget:
This budget provides flexible targets and resorted by all business concerns where sales
forecasts for the future could not be affected with certainty.
A budget is designed to change in relation to the level of activity attained. (IMA,
London).

53
2.9 Methods of Sales Projection
Methods of sales projection may vary with nature of organization, organizational structure
of the business, nature of consumers etc. In general these methods can be used for
forecasting of sales in an organization:
1. Judgment Method
Judgment method is also known as personal judgment method, or rule of thumb method
or non-mathematical method or directorship method. In this method sales projection is
made on the basis of personal observation without using mathematical formulas. Under
this method following techniques are used:
i. Sales Force Composite
In this technique sales forecast is made by personal judgment of sales person involved in
the field of marketing.
Steps:
a. Receive historical sales data of the area through sales department.
b. Collect socio-economic data of the area through inspection or informal talk or
interview.
c. Based upon the above two, project sales for the area and submit it to the sales
department.
d. After receiving the sales projection, sales department makes necessary adjustment
and prepare sales projection for the company. Then the projection is submitted to
chief for approval.
e. Chief executive tentatively approves the budget.
ii. Sales Department Managers Composite
Under this technique sales forecast is made by sales department executives on the basis of
collecting relevant information regarding product market.
54
Steps:
a. Receives information from sales territories on socio economic changes.
b. Based upon information received and historical sales data repair sales projection
for company and submit to the chief for approval.
c. Chief tentatively approves the budget.
iii. Chief Executive Decision
In this technique chief executive decides the sales on the basis of historical sales data and
socio economic information submitted by sales department.
2. Statistical or Mathematical Method
Under this method statistical or mathematical tools are used for projection of sales. These
are usually followed statistical and mathematical methods for project of sales.
i. Economic Rhythm Method
Under this method of sales projection, sales are projected on the basis of rhythm of
economic movement such as inflation, recession, cyclical movement etc.
Steps:
a. Projection of sales based on historical sales.
b. Selection of various economic indicators. Such as; cyclical factors, seasonal
variance price variance etc.
c. Project adjustment sales.
ii. Cyclical Sequential Method
This is a type of sales projection, which is based upon the change in economic factor that
has close relation with sales. These are change in interest rate, change in price, change in
deposits, future demand, product life cycle etc.
Steps:
a. Sales projection on the basis of historical sales.
b. Select economic parameters.
55
c. Compute correlation between sales and parameter.
d. Projecting the sales.
iii. Historical Analogical Method
This method of sales projection is based on historical physical, natural, social, political or
cultural events these are expected to repeat in budget years e.g. trend analysis.
3. Specific Purpose Method
Under this method different combinations of mathematical techniques are used to
compute future sales. These three methods are taken under this approach.
i. Industrial Analysis Method
Under this method no single company do as the projection separately for their company.
They form a pool and have separate research company to do the sales projection for the
industry as a whole. On the basis of the result, each individual company tries to find out
their share in the market. Generally multinational companies use this method of
forecasting future sales which operates in high competition and highly affected by
international economy and technology change for e.g. automobile, aircrafts, electronic
equipments company etc.
ii. Product Line Analysis
Under this method of sales projection, the projector projects sales for each individual
product separately, total them and present them as sales projection for the company. This
method is useful for industries producing more than one product from single raw material
and each product has separate identity in the market. For e.g. petroleum producing
industry, dairy, chemical industry etc.
iii. End use Analysis
Under this method, a company projects the sales of another company's product where it's
end of product to be used as a part or raw material. This method may be used like tyre,
tube, battery and spare parts industry etc.
2.10 Concept of Cost-Volume Profit Analysis
The word 'cost' means price paid to acquire, produce, accomplish and maintain anything,
'volume' means a mass or quantity of something or amount, and 'profit' means the ratio of
such pecuniary gain to the amount of capital invested. In total CVP analysis is the effect

56
on profit of changes in selling prices, service fees, cost, income tax rates and the
organization's mix of product and services. It provides the manager with a powerful tool
for identifying that course of action that will or will not improvement profitability. The
entire amount of revenue planning is associated with CV inter relationship. An
understanding of CVP relationship is necessary for the successful management of any
enterprise.
The managers of profit-seeking organizations usually study the effects of output volume
on revenue (sales), expenses (costs), and net income (net profit). This study is commonly
called cost-volume profit (CVP) analysis. The managers of nonprofit organizations also
benefit from the study of CVP relationships. Why? No organization has unlimited
resources, and knowledge of how costs fluctuate as volume changes helps mangers to
understand how to control costs (Horngren, 1998: 42).
Thus, the study of the effects of output volume on revenue, expenses and net income is
called CVP analysis. It is of immense utility of management as it provides an insight into
the effect and inter-relationship of factors, which influence profit of the firm. With the
help of C.V.P analysis, the finance executive is enabled to present facts and figures in
accurate reports and easily.
2.10.1 Uses of CVP Analysis in Business
CVP analysis is used in profit-seeking companies as well as nonprofit organizations. The
uses of CVP are as follows:
i. To determine the break-even point in terms of unit or revenue.
ii. To determine the target net income.
iii. To examine the effects on income of changes in factors such as fixed cost,
variable cost, or volume.
iv. To ascertain the margin of safety.
v. To estimate optimum selling price.
vi. To find out most profitable and least profitable product of the company.
vii. To maintain operating leverage.
viii. To determine the maximum sales volume to avoid losses.

57
ix. To assess the likely effect of management decision such as an increases of new
method of production and also to reduce direct labour or increase it.
2.10.2 Break-Even Point
The break-even point is the level of sales at which revenue equals expenses and net
income is zero. It is widely used technique for the study of cost-volume-profit
relationship. Some people state that the study of cost-volume-profit relationship is often
called break-even analysis. But this term is misleading, because finding the break-even
point is often just the first step is a planning decision. BEP is concerned with the study of
revenue and cost is relation to sales volume and determines that volume of sales at which
the firm's revenue and total costs will be exactly equal.
Two methods are used to determine the break-even points, but only issued contribution
margin approach is used in this study.
Contribution margin is the difference between the sales revenue and variable cost of
production. Contribution margin is consisting of fixed cost and profit. Each unit sold
provides a certain amount of contribution on margin that goes towards covering the fixed
cost using sales price minus unit of variable expenses. It is defined as sales price minus
per unit variable production, sales and administration costs. Under this method, BEP is
computed by using the following formulas:
i. BEP (in units) =Fixed Cost
CMPU
or, =Fixed Cost
SPPPU - VCPU
ii. BEP (in Rs.) =Fixed Cost
CM Ratio or P/V Ratio
Where,
CM or P/V Ratio = 1-Variable CostSales Value

58
2.11 Credit Policy
The term receivable is debt owed to the firm by customers arising from sales or goods of
services, on credit in the ordinary course of business. When a firm makes an ordinary sale
of goods or services without receiving payment mean the firm has sold on credit and
creates accounts receivable, which would be collected in the future. Thus, accounts
receivable represent an extension of credit to customers, allowing them a reasonable
period of time in which to pay for the goods on credit is an essential part of the modern
competitive economic system. In fact, credit sales and, therefore, receivable, are treated as
a marketing tool to aid the sales of goods. The credit policy of a firm provides the
framework to determine (a) whether or not to extend credit to customer and (b) how much
credit to extend [ Khan & Jain, 1994:705-706]
Credit and collection polices are interrelated with the pricing of a product or service and
must be viewed as part of the overall competitive process. Economic conditions and the
firm’s credit policies are the chief influence on the level of a firm’s accounts receivable.
Economic conditions, of course are largely beyond the control of the financial manager.
As with other current assets, however, the manager can vary the level of receivables in
keeping with the trade-off between profitability and risk. [Van Horne, 1996:402]
The volume of credit sales and the average period between sales and collections
determine the level of accounts receivable. The average collection period is dependent
partly on economic condition (during recession, for example, customer may be compelled
to delay payment) and partly on a set of controllable factors-credit policy variables. The
major policy variables includes (1) credit period- The length of time for which credit is
generated; (2) credit standard- The maximum risk ness of acceptable credit amount; (3)
discount given for early payment; and (4) the firm’s collection policy. [Weston &
Brigham, 1981:314]
Credit policy can have a significant influence on sales. In theory, the firm should lower its
quality standard for account accepts as long as the profitability of sales generated exceeds
the added costs of the receivable. What are the costs of reflexing credit standards? Some
arise from an enlarged credit department, the clerical work of checking additional
accounts and servicing the added volume receivable. [Van Horne, 1996:403]

59
Another factor, which is expected to be affected by change in credit standard, is bad debt
expenses (default expenses). They can be expected to increase with relaxation in credit
standards and decreases as credit standard become more restrictive. [Khan & Jain,
1994:709]
There is opportunity cost of the additional receivable, resulting from increases sales and a
slower average collection period. If new customers are attracted by the reflaxed credit
standards, collecting from these customers is likely to be slower than collecting from
exciting customers. In addition, a more liberal extension of credit may cause certain
existing customers to be less conscientious in paying their bills in tie. To assess the
profitability of a more liberal extension of credit, we must know the profitability of a
more liberal extension of credit; we must know the profitability of additional sales, the
added demand for products arising from relaxed credit standards, the increased slowness
of average collection period, and the required return on investment. [Van Horne, 1996:
403]
The second decision area in accounts receivable management is the credit terms. After the
credit standards have been established and credit worthiness of the customers has been
assessed, the management of a firm must determine the terms and conditions on which
trade credit will be made available. The stipulations under which goods are sold on credit
are referred to as credit terms. These relate to the repayment of the amount under credit
sale. Thus credit terms specify the repayment terms of receivables. Credit terms have
three components: (a) Credit period, in terms of the duration of time for which trade credit
is extended during this period the overdue amount must be paid by the customer, (b) Cash
discount, if any, which the customer can take advantage of, i.e. the overdue amount will
reduced by this amount; and (c) cash discount period, which refers to the duration during
which the discount can be availed of. [Khan & Jain, 1994:714]
2.12 Collection Policies
Collection policy refers to the procedures, a firm follows to obtain payment of past due
accounts. For example it may send a letter such of accounts when they are ten days past
due date; it may use a more threatening letter, followed by a telephone call; and it may
turn the amount over to a collection agency. The collection process can be expensive in
terms of both out of pocket expenditure and lost goodwill, but at least some firmness is

60
needed to prevent an undue lengthening in the collection period and to minimize outright
losses. Again, a balance must be struck between the costs and benefits of different
collection policies. [Weston & Brigham, 1981:318]
2.13 Review of Previous Research
Jogindar Goet's (1999) made research on "Revenue planning and management in Nepal:
A Case Study of Nepal Electricity Authority" had the following major findings and
recommendations:
1. NEA has not considered major demand determinations of electricity such as
family income, price of electricity. Connection charges, cost of alternative, cost of
auto generation and reliability of NEA services.
2. No plan and program has been made about possible consumption of electricity in
agriculture sector.
3. NEA has failed to convert sales unit into sales revenue.
4. NEA has not adopted practice of preparing monthly budget.
5. The revenue plans have been prepared by the branches and sub-branches have not
been used to prepare central revenue plan.
6. There is consistency between planned sales and actual sales, their correlation is
positive and high.
7. The analysis of category-wise revenue plan shows the fluctuating figure.
8. NEA has not been able to bring transmission loss down in respect with target.
9. Meter reading system is not properly managed.
10. There is no reconciliation between units read and units billed.
11. Revenue is not recognized on accrual basis.
12. Collection period and debtors turnover shows improving trend.
13. Operating cost of NEA consist huge amount of fixed costs.
Recommendations of Mr. Goet's study are:
1. NEA planners should be properly trained about budgeting and revenue planning.
2. NEA should prepare plans and programmers for agriculture sector which is
capable of massive consumption of electricity.
3. To achieve target growth rate in sales revenue, NEA should make realistic
forecasts.

61
4. NEA should start the practice of preparing monthly budget for sales revenue and
also it should take into account all the suggestions made by branches and sub-
branches.
5. NEA should introduce programmers and action plans for the reduction of
transmission loss.
6. NEA should put more effort to manage the supply to the profitable sectors such as
domestic, industrial, non-commercial, commercial and temporary supply.
7. Tariff rate for water supply and irrigation, temple, transport services, street light,
bulk supply to India should be revised in such a way that they could cover
operating cost at least.
8. There should be greater consideration to cost while making power purchase
agreement between Nepal and India.
9. Revenues should be recognized on accrual basis to comply with present
accounting manual.
10. NEA should try to reduce overdue amount of receivables.
11. An effective cost control program is necessary in NEA.
12. NEA should have proper coordination regarding budget formulation,
implementation and evaluation of achievement.
Bishwas Acharya's (2004) made research on "Revenue planning and management of
manufacturing companies in Nepal: A Case Study of National Biscuits and Confectionary
Pvt. Ltd. (NEBICO)" had the following major findings and recommendations:
1. NEBICO has not achieved its target sales, but its achievement is not less than 80%
in entire fiscal years mentioned above.
2. NEBICO has not considered major demand of rural areas people, it is shown from
the investigation that its major market is in urban areas, which is not fare.
3. NEBICO has not adopted practice of preparing monthly budget.
4. Major contribution on NEBICO, profit was made by Biscuits sales, it has more
than 98% in entire five fiscal year (i.e. from 2055/56 to 2059/60), and only 1 to
2% sales contribution was made by confectionary.
5. The pricing policy needs revision and pricing adjustment policy of the company is
also not fare.
6. The pricing adjustment percentage policy is also not mentioned.
62
7. NEBICO has capacity to fulfill the demand of its customer, but company is
neglecting its broad market, so we can say that in most of the shop of the cities
sufficient supplying of their product for their customer are not made.
8. NEBICO's most favorable side is its credit policy and having no bad debts and
minimum loss on production process.
9. NEBICO's fixed cost is high. The excess amount of fixed cost has lowered its
profit potential.
10. NEBICO has no clear cut boundaries to separate cost into fixed and variable. The
classification of cost is not scientific and systematic. Therefore, NEBICO has not
been able to make realistic budget.
11. NEBICO has not adequately considered controllable and non-controllable
variables affecting the organization.
Major recommendations of Mr. Acharya's research are:
1. NEBICO planners should be properly trained for budgeting and revenue planning.
2. NEBICO should considered demand determinations, at the time of preparing
budget it should survey markets all over the country.
3. To achieve targeted sales revenue, NEBICO should make realistic forecasts.
4. NEBICO should start the practice of preparing monthly budget for sales revenue.
5. While setting the target for the next year, NIBICO should consider other factors
such as increasing or decreasing of consumer of every product.
6. Company should try to achieve its targeted sales in those products which cover
large percentage on the whole, such as Glucose 75 gms, Thin Arrowroot 75 gms,
coconut crutches 100 gram. Malt Glucose 65 gms etc.
7. NIBICO has capacity to fulfill the demand of its customer, so company should not
neglect its broad market, and it should supply to all the shops and cities of their
products.
8. Company should manage their changing policy of selling price of each product.
9. Company should manage or decrease its fixed cost, which hampers in profit
directly or it should use properly by increasing production quantity.
10. NEBICO should separate fixed and variable cost, so that NIBICO can make
realistic budget.
63
11. NIBICO should have proper co-ordination of budget formulation, implementation
and evaluation of achievement.
Ajana Amatya's (2004) made research on "Budgeting in manufacturing concerned. A
case study of Dabur Nepal Private Limited." had the following major finding &
recommendation.
1. DNPL has been suffering from under utilization of its capacity.
2. Management has not adequate knowledge about the nature & content of profit
plan. They have not followed a system of periodical performance report.
3. DNPL does not prepare production budgeted as separate. They assume budgeted
sales itself is the budgeted production.
4. DNPL has adopted cost plus pricing strategy. The price is found to be cheaper
than Nepal Lever's product.
5. Sales revenue is found to be very high than BEP which is good for the company.
6. There is lack of coordination system and realization of objective between different
level managers.
7. Budgeted cost is higher than the average actual cost. Fluctuation of the cost in
budgetary & actual is almost same since C.V of actual is marginally higher than
budgeted cost.
8. Operating expenses are in increasing trend which has affected the profit margin.
The operating expense occupies more than 50% of gross profit.
Amatya's research recommendations are:
1. DNPL should utilize its idle capacity by expanding its current products.
2. DNPL should define the clear long range & short range profit plan detailed by
relevant responsibilities as a systematic and formalized approach for
accomplishing the planning coordination & control responsibilities of
management.
3. A systematic approach should be made on implementation of profit plan.
4. The company should develop the systematic periodic performance reports detailed
by assigned responsibilities for accomplishing the planning objectives.
5. Variance analysis should be effectively done.
6. The company should prepare separate production budget & direct labor plan.

64
7. A separate costing section should be established and separate costing system
should be developed.
8. Pricing policy should be revised.
9. Planning experts should be developed.
10. The company should adopt the effective cost control technique.
11. There should be continuous flow of information among various level of
management and various groups of employees. The goals objectives & strategies
should be communicated from top to lower level. All person should be
participated on decision making and planning process.
Narayani Poudel (2003) made research on "Relationship between Sales, Budget & Profit
Planning & Profit Planning & Control". Dabur Nepal Private Limited." had the following
major finding & recommendation.
1. Although the company has set the sales target, it has no practice of preparing
production budget. Sales budget is treated as production budget. The company is
following just-in-time production policy.
2. The company doesn’t have practice of preparing direct labour cost budget though most
of labours are engaged in producing and progressing.
3. Expenses trend of DNPL is increasing year by year. The cost of materials is higher than
other expenses in a year. The cost of material is more than 70% of total cost.
4. The cost of DNPL is classified into fixed and variable. There is no practice of
identifying semi-variable cost.
5. The capacity utilization of DNPL is not satisfactory because it is operating below
capacity. Average capacity utilization is 40.15% only.
6. Total assets turnover ratio of the firm is satisfactory and it is in increasing order. This
ratio concludes overall performances of the firm. Optimal utilization of the assets (fixed
assets, current assets, total assets) automatically increasing the profitability of the firm.
Poudel's research recommendations are:
1. The company management should look carefully into the basis of setting target for
sales and achieving those targets meaningfully. Thus, the realistic long range,
medium range and short range forecast should be made.

65
2. The company should prepare production budget. The production plan depends on
availability of raw material so DNPL should consider about the raw material also.
3. DNPL should prepare material purchase budget considering the final inventory of
raw material and parts and initial inventory of raw materials and parts. Alternative
supply sources of raw material must be developed.
4. DNPL should focus on the relationship between expenditure and benefit.
Expenses planning and controlling is necessary to obtain company’s goals.
5. Production is based on sales (demand) forecasting in the market, so the firm shuld
not need to keep excess idle inventory.
6. DNPL should make proper manpower planning.
7. Capital expenditure should be planned in detail for evaluation purpose.
8. Classification of an expenses item as controllable and non-controllable must be
made with and specific framework of responsibility and time.
9. Cost-volume profit analysis should be considered while formulating profit plan.
10. To get the idea of further cash requirement and application of the firm, it should
make cash budget (projected cash flow statement), the statement could be made
only after the preparation of the sales budget, production budget, labour budget,
raw material purchase budget, manufacturing overhead budget etc. DNPL
prepares sales budget only. Therefore to know the actual cash application, the
other remaining budgets should also be prepared.
11. A systematic approach should be made towards comprehensive profit planning.
This can contribute to increase the profitability of the company.
12. Profit planning manuals should be communicated from top level to lower levels.
13. Firm’s present output is not the optimal level, it could increase this level but main
problem of the marginal product is availability of marketed.
Lekh Prasad Panta's (2006) made research on "A study on revenue planning in
manufacturing enterprise: A case study of Royal Drugs Limited" had the following major
findings and recommendations.
1. Organizational goals and policies are set up by the top executive level
management board in accordance with plan and policies of the RDL.
66
2. RDL has not practice of preparing long range sales budget. RDL yearly sales
target and achievement is very poor. It has not achieved its target sales more than
73.41% and it has minimum achievement of 42.51%. Its yearly sales trend is in
decreasing trend and it has high degree of deviation in terms of budget and
achievement. Its means that it is failing to focus on its factor affecting sales.
3. Production budget of RDL is satisfactory in terms of budget and achievement but
it production plan is not satisfactory because it has planned its production below
break-even point level. It achievement rate ranges from 39 to 43% and in second
quarter achievement is approximately 60%.
4. Short range production achievement is poor and it ranges from 21.49% to 80.62%
which has high difference or gap. In average it has achievement of 42.2% which is
not satisfactory for RDL the tactical production has unfavorable variance in the
fiscal year 2059/60.
5. RDL has planned its production below break-even point. Its capacity utilization is
very poor. In each period RDL is planning production below its capacity. It has
not used its capacity above 47.75% and its capacity utilization is in decreasing
trend which falls to 16.87% in the fiscal year 2059/60. It also indicates that the
RDL is not managing its all fixed manufacturing costs properly which has been
under absorbed due to production falling below capacity which caused negative
impact on profitability.
6. RDL has fluctuating inventory in respect to sales. Its inventory turnover ratio is
also in decreasing trend. It shows no specific inventory planning.
7. RDL has large amount of investment in current assets than fixed assets. Fixed
assets have small fluctuation compared to other assets. Any depreciation thereof
has been supplemented by small capital addition. It seems RDL is unable to meet
its all short term obligations because its current liabilities are increasing gradually
over past years. In current fiscal year 2059/60 in which it has very high amount of
loss and very high amount of current liability compared to last years.
8. RDL has started to plan for capital expenditure. It is good sign for managing fixed
assets and controlling investment in fixed assets. It has no fund for investment in
fixed assets due to heavy losses since last several years.
67
9. RDL is being unable to utilize all its assets optimally because although sales and
production decreased over the years, its current assets have not decreased.
10. It has not classified all its costs into variable and fixed portion. Due to this it is
impossible to monitor the costs incurred in RDL. All the cost has been classified
on the basis of personal decision as manufacturing costs are variable costs and
administrating costs are fixed costs.
11. Cost volume profit analysis showed that at 30.57% of its capacity company will be
at break even point at current fixed costs and average 90% of variable expense.
12. Manpower planning of Royal Drugs Limited is week because its ratio of actual
sales per employee is decreasing over last five year.
13. It is not using all of its assets optimally. It has investment in non-productive assets
because capacity utilization is very low.
14. It is not monitoring all of is costs. Sales and production is decreasing whereas
expenses are increasing compared to change in sales and production.
15. Poor achievement of sales budget over past years has indicated that its planned
sales budget is lacking continuous evaluation and monitoring.
Mr. Pant's research recommendations are:
1. Royal Drugs Limited should clearly define its objectives, policies and
strategies for achievement of its long term plan and policies.
2. Royal Drugs Limited should follow a comprehensive budgeting taking all the
functional budgets in accordance with plan and policies.
3. Since the sales budget is the corner stone of the functional budgets is should be
prepared in realistic way and it should include both strategic and long term
sales budgeting. All the other factors affecting sales budget should be traced
out so that a realistic sales budget can be prepared.
4. Production planning should be made on the basis of appropriate sales planning
and reasonable amount of inventory of finished goods so that loss due to
expiry of goods can reduced.
5. An effective cost control system should be developed by preparing all the cost
related budgets like manufacturing overhead budgets, selling and distribution
expense budget, administrative expense budget etc. separately with clear
definition of cost variability and controllability costs. Also a cost monitoring
68
mechanism should be developed so that all the controllable costs are
controlled and uncontrollable costs can be optimally utilized. It will also help
in planning future cost i.e. revise budget and use it for managerial decision
making.
6. A cost volume relationship should be established because it is most effective
tool for profit planning or budgeting and controlling operation e.g. sales
revenue, variable expenses and fixed costs. Based on cost volume relationship
sales and production should be planned.
7. Variance analysis should be conducted for betterment of its planning practice
which helps in control over implantation and modification to the future
planning. Variance analysis should be classified as controllable and
uncontrollable variance. It should also be backed by the practice of
determining tolerance limit and also analysis of cause and effect. For the
objectively use of variance analysis it should be communicated with the help
of feedback and feed-forward procedure for gradual improvement.
8. RDL has a planning division but it is not functioning well. Employees of
planning division are lacking of knowledge of budgeting and profit planning.
They are being unable to coordinate its all the departments in proper way.
RDL should follow a comprehensive profit planning system taking
participation of all the responsible which will look for overall activities and its
budgeting.
9. Cash flow analysis should be made so that contribution of different operating,
financing and investing activity can be analyzed and evaluated.
10. Current assets and current liability should be managed well to improve in poor
liquidity condition.
11. It should arrange for training and development of its staff to increase their
quality and efficiency. It should analyze the overstaffing condition and certain
programmer and policies should be taken to attract voluntary retirement of
employee.
12. Research and development program me should be adopted to analyze the
market condition, product innovation and invention.

69
13. Governmental intervention should be controlled for the smooth and continuous
operation of Royal Drugs Limited.
14. It should look for another option for utilizing available large idle space as
alternative source of revenue.
15. It should modernize its existing production facility by necessary repair or
maintenance and additions.
Krishna Prasad Sharma (2006) made research on “Revenue Planning & Management of
Manufacturing Public Enterprises” (A case study of Singh Durbar Vaidya Khana Vikas
Samiti) had the following major findings and recommendations.
1. SDVKVS has not achieved its target sales, but its achievement is not less than 79.4%
in maintaining fiscal years.
2. SDVKVS has adopted only product/categorized budget. But it has not adopted
practice of preparing monthly budget.
3. There is no surprise sale.
4. There are no actual bad debts shown in an account.
5. In the calculation of profit volume ratio, it has shown that its fixed cost is high.
6. The pricing policy needs revision and adjustment of pricing policy organization is not
fare.
7. Coefficient of variation of budgeted sales is greater than the actual sales i.e. 15.88
>12.97 it means budgeted sales are more variable than of Actual sales.
8. The organization is suffered from unproductive fixed cost.
9. The production plan of SDVKVS is highly dependent upon the weather and forest
policy of the government. So the standard formula is not used for production volume.
10. The organization has no proper marketing strategy.
Mr. Sharma's research recommendations are:
1. SDVKVS should formulate systematic and scientific sales plan by considering
different factor affecting sales. Sales forecasting should be done on realistic
ground.
2. SDVKVS should develop its overhead budget in scientific and systematic
classified. All expenses related with purchase and production should be included

70
in manufacturing overhead and similarly administrative overhead and selling and
distribution overhead should be categorized systematically.
3. For the effective implementation of budgeting system worksheet or manual should
be communicated higher level to lower level of management.
4. Cost-volume-profit relationship should be considered while formulating profit
plan especially in determining sales volume. Selling price and profit.
5. SDVKVS should develop the effective pricing policies according to the
competitive market situation to gain high market share.
6. SDVKVS was interested by government directly. SDVKVS management cannot
take its own decision in major issue without prior acceptance of the government.
7. SDVKVS should operate on commercial basis.
8. SDVKVS should try to expand its distribution, dealers all over the country as well
as export its products to the foreign countries.
9. SDVKVS should adopt long range and short range plan. The plan should be
formulate them and committed to accomplished them.
10. SDVKVS should evaluate the profitability of the product line. There should be
market studies focusing on demand, supply and pricing of Ayurvedic product
should be carried out and loss oriented product identify and drop them.
11. SDVKVS should prepare it periodic performance report for evaluating of
performance of the poor achievement.
12. SDVKVS should be use feedback mechanism to control overall activities.
13. The organization has been suffering from high amount of expenses without
eliminating over expenses there is no possibility of operating in good profitability
condition.
Prabes Nepal (2007) studied on the topic of " Inventory Management of Herbs processing
and production co. Ltd". He found the following problems in the area of inventory
management in the HPPCL like-
What types of inventory problems do they face?
Do they have any plan for inventory?
What are the bases for such plan?

71
Are there any plans and policies to increase profit, reduce expenditures through
improving size of inventory in future, If yes, what, if not, why?
He set some objectives, which are given below:
Identify present position of inventory in HPPCL.
What types of problems faced by HPPCL in the management cost and profit that
should be identified.
Provide the appropriate recommendation and suggestion improvement of
inventory management in HPPCL on the basis of above study and findings.
He concluded after study, if the company want to be success, it was necessary to apply the
theoretical and practical methods in collection, production, distribution management,
marketing, proper remuneration and rewards and punishment etc. The company had given
extra facilities and inspiration to the farmer to produce the raw materials to reduce the
loss of inventory expenses. Transportation high charge and loss of company would reduce
if the company were able to fulfill desired raw materials from private resources.
2.14 Research Gap
Most of the researchers had conducted their research work on comprehensive profit
planning & control of various Public & Private Organizations. But this study is totally
based on revenue planning system of DNPL, which was born as a multi-national joint
venture private organization. Some study related to DNPL was concerned with
relationship between sales, budget & profit planning & profit planning & control.
However no research paper was made on i.e. revenue planning & management of DNPL.
Therefore it is new area of research in the context of Nepalese manufacturing company.
72
CHAPTER-3
Research Methodology
3.1 Introduction
Research is an ongoing and ever growing activity. It is done not only to solve a problem
existing in the work setting, but also to add or contribute to the general body of
knowledge in a particular area of interest. Research may be defined as the objective and
systematic method of finding solution to a problem i.e. systematic collection, recording,
analyzing, interpreting and reporting of information about various facts of phenomenon
under study"(Kothari,2000:18)
Research methodology refers to the various sequential steps to be adopted by the
researcher in studying a problem with certain objects in view. This research is conducted
with a view to examine, analyze and interpret the budgeting techniques. It is used in
process of revenue planning and its effectiveness in the firm with the help of various
financial statements, Statistical tools and non financial subject matters. Keeping in
harmony with the basic objectives, other sub-objectives are also formulated and the
research methodology is followed to obtain the basic objectives and goal of research
work.
3.2 Research Design
Research design is the plan structure and strategy of invention conceived so as to obtain
answer to research objectives. The plan is the overall scheme on program of research. It
includes on the outline of what the investigators will do from writing the hypothesis and
their operational implication to the final analysis of data. The structure of the research is
more specific. It is the outline, the scheme and the paradigm of the operation of the
variables .When we draw diagram that the variables and their relation and just a position
we build structural schemes for accomplishing the operational research purpose strategy,
as used here is also more specific than plan.
This research design of present work is analytical as well as descriptive approaches. This
study is an examination and evaluation of budgeting procedure in the process of revenue
planning. Planning of Dabur Nepal Private limited. Therefore the study is closely related
73
with the sales budget and other accounting statement. Analytical method is used to
present information and data. Apart from those quantitative data presentation, the research
also possesses qualitative aspects and these aspects are described in word detail where it
is necessary. Quality aspects of this study
Include view of the top level management as well as employees of DNPL in formulation
and implementation of revenue plan and the reasons behind lower achievement are also
the course of this research work.
3.3 Source of Data
The six years data is taken for the study form the year 2002/03 to 2007/08.
Information/data is the lifeblood of the study. For this work the study data are taken from
its origin and previous study. This study is mainly based on secondary and interactions
with responsible persons. The data were collected from the budget of Dabur Nepal Pvt.
Ltd. Some descriptive data were collected from the office staffs and some data were also
drawn from the previous dissertations etc.
3.4 Data Collection Techniques
For this study some techniques and procedure were adopted to collect necessary and
authentic data and information. Since, this study is related with revenue budgeting
practice so, the relevant data were collected from secondary source covering functional
budget of DNPL, booklets, magazines journal and similar previous study. The primary
data are collected form account department and functional department of DNPL and other
related out sources. Direct meeting, telephone and mail system were used for necessary
information.
3.5 Data Analysis Tools
Data collected from various sources were managed, presented in proper table’s format
and analyzed. For research work all the data were input for research process and
systematic processing were done by using appropriate analytical tools. For analytical
study these data are using different analytical tool. Financial and statistical tools are used
to analyze the collected data.

74
3.5.1 Financial Tools: -
(a) Net Profit Ratio: This ratio is also called net profit margin this ratio measures the
overall profitability of a business by establishing the relationship between net profit & net
sales. This ratio is calculated by dividing net profit after that by net sales. It is expressed
in terms of %
(b) Cash Flow Statement
The statement that shows cash inflows & out flows of a firm for a specified period is
called the statement of cash flows it demonstrates where the cash has come from during
the year and what the firm has done with the available cash. Therefore cash flow
statement shows a picture of cash movement occurred in and out from a firm during a
year in a summarized farm it gives a picture of sources & application of cash of a firm far
a year. Charles T. Hornbeam "The statement of cash flow is the statement that reports the
cash receipts & cash payments of an organization during a particular period."
(c) Ratio Analysis: - Ratio analysis is the process of determining & interpreting
numerical relationship between figures of financial statements. Since an absolute
accounting figure often does not provide much meaning by itself it has to be analyzed in
relation to other figure so that significant information about the company's financial
performance can be derived.
(d) Debtors Turnover Ratio:- Debtors turnover ratio is also termed as receivable
turnover ratio. This ratio establishes the relationship between net credit sales and average
debtors for the year its shows how quickly the credit sales of the company have been
converted into cash. This ratio is calculated by using the formula

75
(e) Average Collection Period: - Average collection period is also called debt collection
period or average as of debtors and receivable. It includes how long it takes to realize the
credit sales and receivable. The average collection period also measures the average credit
period enjoyed by the customers. It indicates the time lag between the credit sales and
their conversion into cash it can be calculated by using the following formula
3.5.2 Statistical Tools: -
(a) Arithmetic Mean: Arithmetic mean or simply a 'mean' of a set of observation is the
sum of all the observations divided by the number of observation. Arithmetic mean is also
known as the arithmetic average.
(b) Standard Deviation: The standard deviation is the absolute measure of disperser in
which draw back present in other measures of disperses are removed. It is said to be the
best measure of disperses as it satieties most of the requisites of a good measure of
disperses. Sd. is defined as the positive require root of the mean of the square of the
deviations taken from the arithmetic mean. It is denoted by
(c) Variance: The square root of the standard deviation is known as the variance. IT is
denoted by 2
(d) Coefficient Of Variation:- Standard deviation is the absolute measure of disperses
the relevant measure of dispersion based on the standard deviation is known as the
coefficient of standard deviation.
The coefficient of dispassion based on standard deviation multiplied by 100 is known as
the coefficient of variation (C.V.) If be the arithmetic mean & 6, the standard deviation of
the distribution, then the C.V. is defined by
Coefficient of Variation =Mean
DS ..

76
It is independent of unit so two distribution can bitterly be compared with the help of C.V.
for their variability less the C.V. more will be the uniformity, consistency etc. & more the
C.V. less will be the uniformity, consistency etc.
(e) Correlation: two variables are said to have "correlation" when they are so related that
the change in the value of one variable is accompanied by the change in value of other.
The measure of correlation called the correlation coefficient summarizes in one figure the
degree & direction of movement. But the important thing that is to be noted here is that
correlation analysis only helps in determine the extent to which the two variables are
correlated but it does not tell about cause & effect relationship. Thus the degree of
correlation between two variables cannot say which one is the cause & which one the
effect.
Properties of Correlation Coefficient
1. Correlation of correlation coefficient
2. The correlation coefficient is independent of change of origin & scale
3. Correlation coefficient is the geometric mean between two regression
coefficients.
(f) Probable Error
Probable error of the correlation coefficient by P.E. is the measure of testing the reliability
of the calculated value of r. If r be the calculated value of r from a sample of n pair of
observation, then P.E. is denoted by PE = 0.6745 xn
r21
It is used in interpretation whether calculated value of r is significant or n of
(1) If r< P.E., it is insignificant so perhaps there is no evidence of correlation.
(2) If r> 6 P.E., it is significant in other cases nothing can be concluded.
77
(g) Regression Analysis
It is the one of the most powerful tools of statistics, which being uses in the estimation of
the strength of the relationship between two variables.
Regression Analysis is used as a tool of determining the strength of relationship between
tool variable. Thus it is a statistical device, with the help of regression analysis we can
estimate or predict the value of one variable when the value of other variable when the
value of other variable is known. The unknown variable which we have to predict is
called independent variable & variable whose vahee is known is called independent
variable. The analysis used to describe the average relationship between two variables is
regression analysis.
78
CHAPTER - 4
Data Presentation and Analysis
4.1 Sales Plan/Budget in DNPL
A company should prepare various sub-plans for the completion of the profit plan. A
revenue plan is one of them. It is the key plan in profit planning & control. Unless there is
a realistic & practical revenue plan, no company can make other plan accurate.
Sales budget is the first budget in the process of developing the overall budgeting process
of enterprises. Sales budget is an estimation of sales for if future. It is concerned with cash
generation & basis for development of other functional budgets. Sales budget is prepared
on the basis of forecast. There are two types of sales budget. One is long term sales
budget which is prepared for more than One year & second is short term sales budget
which is prepared for one accounting year.
DNPL is multinational manufacturing company established in Nepal. DNPL Lunches its
promotional campaign through the media by news paper, magazine, pamphlet, audio &
visual media etc. Analysis of past sales has been made to know about the previous sales
trend & to forecast the future sales trend of DNPL.
The following tables represent the budgeted sales & actual sales achievement of DNPL

79
4.2 Sales Budget & Achievement
Table No. 4.1
Sales Budget & Achievement
(Rs in Lakhs)
F/Y Budgeted Sales Actual Sales Achievement Variance
In RS Unfavorite %
2002/03
2003/04
2004/05
2005/06
2006/07
2007/08
26511.21
31013.36
33286.01
34795.50
36517.32
36732.51
22249.16
27649.62
26995.05
30177.02
27287.90
32270.30
83.92%
89.15%
81.10%
86.28%
75.73%
87.85%
4262.05
3363.74
6290.96
4798.48
9229.42
4462.21
16.08
10.85
18.90
13.72
25.15
12.15
Average 33142.67 27771.61 84.01% 5401.22 16.26
Source: - Annual Report 2007/08 of DNPL
Thus above table showed that the budgeted sales were in increasing trend where as the
actual sales were in fluctuation. The actual sales were below the budgeted sales of the
company. The highest target sales achievement was in 2003/04 which was 89.15% where
as lowest achievement was in F/Y 2006/07 the average actual sales achievement was only
83.01% It indicates that the company could not a here its targets sales.
The above table showed the highest unfavorable variance was in the F/Y 2006/07 by
25.27% & less variance was the F/Y 2003/04 by 10.85% variance percentage. The
average budgeted sales were Rs. 33127.67 & actual average sales were Rs. 27771.61. The
average achievement of DNPL was Rs. 84.01 there was unfavorable variance in
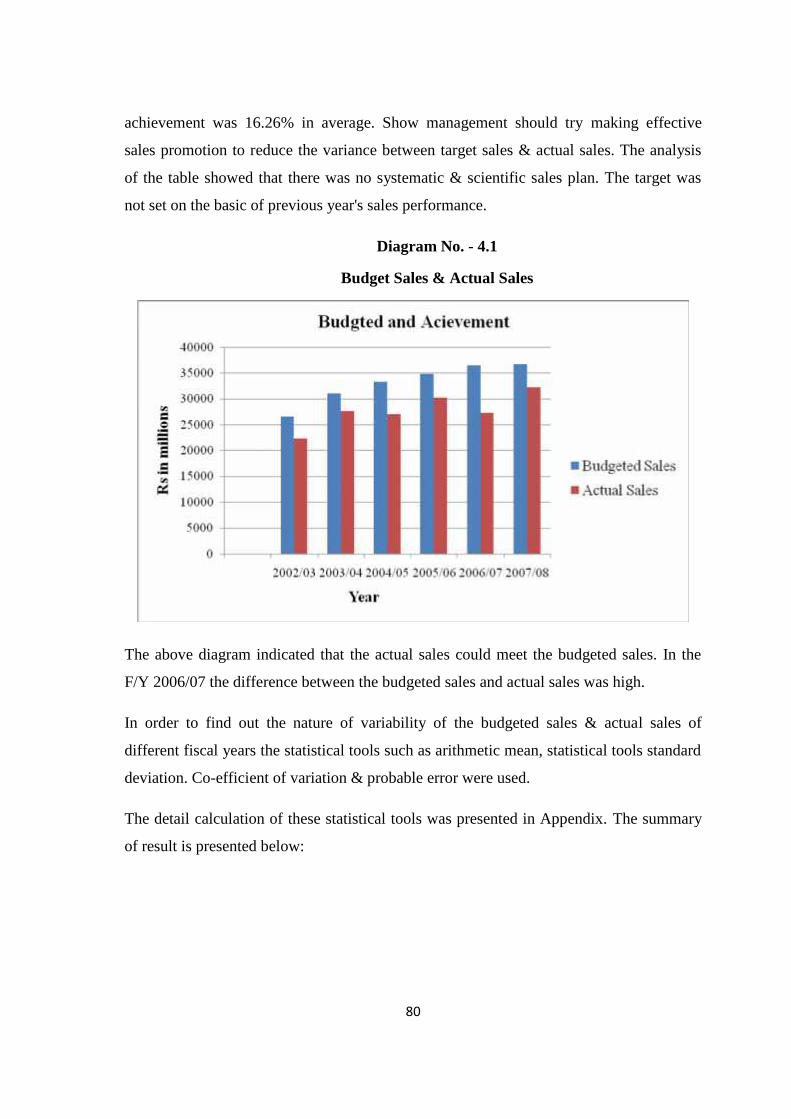
80
achievement was 16.26% in average. Show management should try making effective
sales promotion to reduce the variance between target sales & actual sales. The analysis
of the table showed that there was no systematic & scientific sales plan. The target was
not set on the basic of previous year's sales performance.
Diagram No. - 4.1
Budget Sales & Actual Sales
The above diagram indicated that the actual sales could meet the budgeted sales. In the
F/Y 2006/07 the difference between the budgeted sales and actual sales was high.
In order to find out the nature of variability of the budgeted sales & actual sales of
different fiscal years the statistical tools such as arithmetic mean, statistical tools standard
deviation. Co-efficient of variation & probable error were used.
The detail calculation of these statistical tools was presented in Appendix. The summary
of result is presented below:

81
4.3 Calculation of Mean, Standard Deviation & Coefficient of Variation.
Table No. 4.2
Mean, Standard Deviation & Coefficient of Variation
(Rs in Lakhs)
Statical Tools
Particular
Budgeted Sales Actual Sales Achievement %
A.M.
Standard Deviation (S.D)
Coefficient of Variation (CV)
Probable error (P.E)
Correlation (r)
33127.65
3562.77
10.75
0.08
0.84
27771.51
3093.29
11.13%
83.38%
Source: Appendix – 1
The table 4.2 showed that DNPL was unsuccessful to achieve its targeted sales during the
study period. The average budgeted sales are greater than average actual sales. The
standard deviation of the budgeted sales is 3562.77 which greater than actual sales of
3092.29. It indicated that the range size of deviation of the budgeted sales was more than
the actual sales. The CV of the budgeted sales is less than the actual sales less CV means
less variability, more stable & more homogeneous but largest CV means just opposite.
Thus the budgeted sales are more uniform than the actual sales.
Two variables are said to be correlated in the value of one variable appears to be related
or linked with the change in other variable the correlation analysis determines the degree
of relationship between two variables. The degree of correlation can be measured by the
correlation coefficient the various methods can be used to determine correlation
coefficient. Here Karl Pearson's coefficient of correlation a most popular method to
determine the coefficient of correlation between the budgeted sales & actual sales. The
calculated value of r is 0.84 so that, there is a high degree of positive correlation between
actual sales.

82
The probable error can be used to measure the reliability of the calculated value of
correlation coefficient. If r< PE it is insignificant so perhaps there is no evidence of
correlation r If r > 6 P.E. it is significant. The calculated value of probable error is 0.08. It
is found that the value of correlation (Rs is more than PE (r) ie (0.84>0.08) so it can be
concluded that calculated value of r is significant r which indicates that the actual sales
will go in the same direction of budgeted sales.
4.4 Contribution of each Product on Revenue of DNPL
If revenue planning is the key factor of profit planning and control. Unless there is a
realistic and practical revenue plan, one cannot be sure of accuracy of other plan based on
it.
Contribution of each product in Revenue Trend of DNPL
Table No 4.3
(Rs in Lakhs)
S.N. Products 2003/04 2004/05 2005/06 2006/07 2007/08
1
2
3
4
5
6
7
8
9
Lal Dant Manjan
Dabuour Lal Tooth Paste
Babool Tooth Paste
Meswak Tooth Paste
Binaca Tooth Powder
Vatika Hair Oil
Vatika Shampoo
Sles (30%)
Vatika Face Pack
3940.46
-
16.95
204.09
2352.06
-
-
3578.95
-
1395.50
2795.99
-
-
3553.99
-
24.89
3680.42
1916.31
-
-
4074.16
149.92
-
1934.82
685.03
28.19
7.45
5604.32
457.97
50.24
29.32
-
950.46
490.09
8.44
2.45
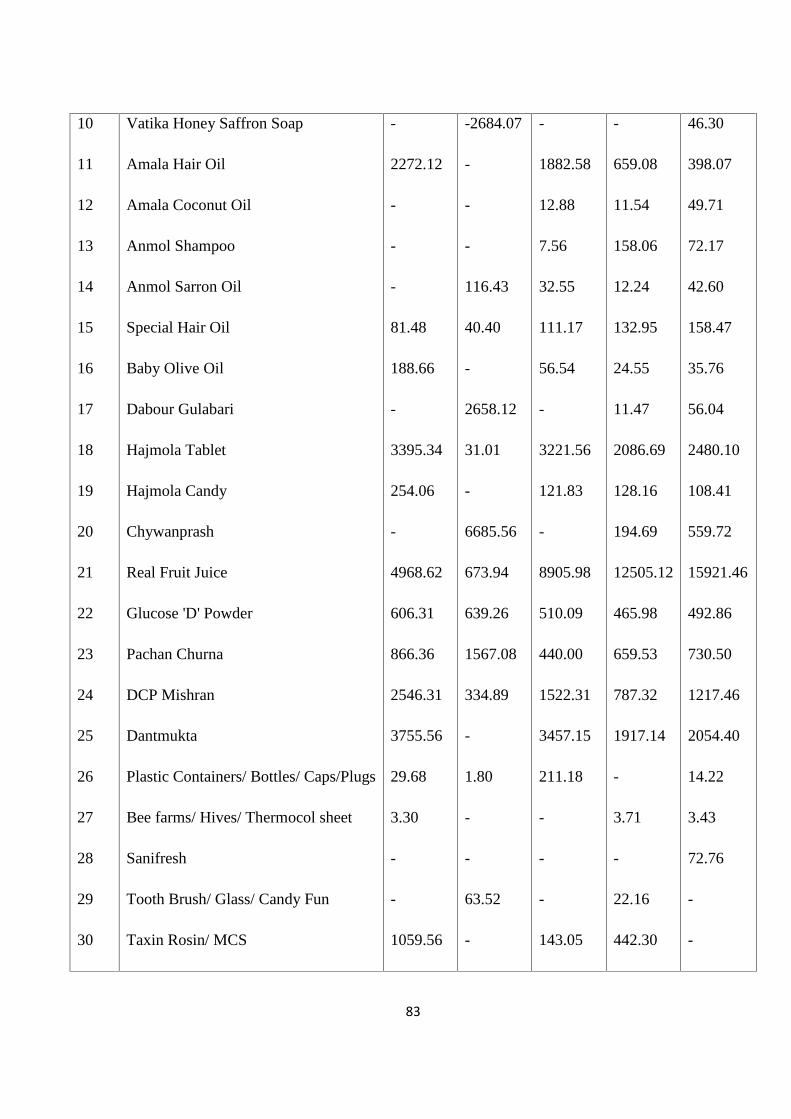
83
10
11
12
13
14
15
16
17
18
19
20
21
22
23
24
25
26
27
28
29
30
Vatika Honey Saffron Soap
Amala Hair Oil
Amala Coconut Oil
Anmol Shampoo
Anmol Sarron Oil
Special Hair Oil
Baby Olive Oil
Dabour Gulabari
Hajmola Tablet
Hajmola Candy
Chywanprash
Real Fruit Juice
Glucose 'D' Powder
Pachan Churna
DCP Mishran
Dantmukta
Plastic Containers/ Bottles/ Caps/Plugs
Bee farms/ Hives/ Thermocol sheet
Sanifresh
Tooth Brush/ Glass/ Candy Fun
Taxin Rosin/ MCS
-
2272.12
-
-
-
81.48
188.66
-
3395.34
254.06
-
4968.62
606.31
866.36
2546.31
3755.56
29.68
3.30
-
-
1059.56
-2684.07
-
-
-
116.43
40.40
-
2658.12
31.01
-
6685.56
673.94
639.26
1567.08
334.89
-
1.80
-
-
63.52
-
-
1882.58
12.88
7.56
32.55
111.17
56.54
-
3221.56
121.83
-
8905.98
510.09
440.00
1522.31
3457.15
211.18
-
-
-
143.05
-
659.08
11.54
158.06
12.24
132.95
24.55
11.47
2086.69
128.16
194.69
12505.12
465.98
659.53
787.32
1917.14
-
3.71
-
22.16
442.30
46.30
398.07
49.71
72.17
42.60
158.47
35.76
56.04
2480.10
108.41
559.72
15921.46
492.86
730.50
1217.46
2054.40
14.22
3.43
72.76
-
-

84
31
32
33
34
35
36
37
Chirayita Plant/ Medical Plant
Pappermint Oil
Stevid Powder (Sappling)
Honey
Apliculture
Canvas Bag/Dangless/ssplant
Hypericum levels/ Silybun sed
-
-
3.92
1104.78
-
-
-
-
13.59
660.67
-
4.08
36.16
10.35
-
-
285.14
6.49
-
-
-
-
39.37
145.70
0.50
-
-
3.33
0.99
12.68
145.49
-
-
-
Total 27649.62 26995.05 30177.02 27287.90 32270.23
Source: Annual Report 2007/08
It is clear from the table no.3 that DNPL Products sales were in increasing trend, but sales
of main product other than Real Fruit Juice were in fluctuating trend. The sales of
represented high share sales revenue on major products like Real Fruit Juice, Lal Dant
Manjan, DPC Mishran , Dant Makta, Glucose 'D' Powder Pachan Churna , Hajmola & oil.
The contributions of each product are presented in percent the percentage contribution of
each products sale in total sales revenue.

85
Table-4.4
Contribution of Each Production in Revenue Trend of DNPL in Percentage
( in %)
S.N. Name of Products 2003/04 2004/05 2005/06 2006/07 2007/08
1
2
3
4
5
6
7
8
9
10
11
12
13
14
15
16
17
18
Lal Danta Manjan
Binaka Tooth Powder
Dabour Lal Tooth Paste
Babool Tooth Paste
Meswak Tooth Paste
Vatika Hair Oil
Vatika Shampoo
Sles (30)
Vatika Face Pack
Vatika Honey Saffron Soap
Amala Hair Oil
Anmol Coconut Oil
Anamol Shapoo
Anmol sarsonoil
Special Hair Oil
Baby Olive Oil
Dabour Gulabari
Hajmola Tablet
14.25
0.06
-
-
-
0.74
-
8.51
-
-
8.22
-
-
-
0.29
0.68
-
12.28
13.26
-
-
-
-
5.17
-
10.36
-
-
9.94
-
-
-
0.43
0.15
-
9.85
11.78
0.08
-
-
-
12.20
-
6.35
-
-
6.24
0.04
0.23
0.11
0.37
0.19
-
10.68
14.93
-
0.55
-
-
7.09
2.51
0.10
0.03
-
2.42
0.04
0.58
0.04
0.49
0.09
0.04
7.65
17.37
-
1.42
0.16
0.09
2.81
1.52
0.03
0.01
0.14
0.30
0.15
0.22
0.13
0.49
0.11
0.17
7.69

86
19
20
21
22
23
24
25
26
27
28
29
30
31
32
33
34
35
36
37
Hajmola Candy
Chywanprash
Real Fruit Juice
Glucose ‘D’
Pachan churna
DCP Mishan
Dantamukta
Plastic Containers/ Bottles Cap/ Plugs
Beefarns/ Hives Thirmocol Sheet
Sanfresh
Tooth Brush/ Glass Candy Fun
Taxin Rosin / Mis
CHIRAYITA Plan/ Medical Plant
Pappermint Oil
Stevid Powder Sapling
Honey
Aplictture
Canvas Bag/ Dangless/ SS- plate
Hyperican Canvas/ Sily.........
0.92
-
17.97
2.19
3.13
9.21
13.58
0.11
0.01
-
-
3.83
-
-
0.01
4.00
-
-
-
0.11
-
24.77
2.5
2.37
5.81
12.41
-
0.01
-
-
0.24
-
-
0.05
2.45
-
0.02
0.13
0.40
-
29.51
1.69
1.46
5.04
11.46
0.70
-
-
-
0.47
0.03
-
-
0.94
0.02
-
-
0.47
0.71
45.83
1.73
2.42
2.89
7.03
-
0.01
-
0.08
0.62
-
-
0.14
0.53
-
-
-
0.34
1.73
49.34
1.53
2.26
3.77
6.37
0.04
0.01
-
0.23
-
-
-
0.04
0.45
-
-
-
Total 100 100 100 100 100
Source: Annual Report 2007/08
87
The table no.4.4 showed clearly that Real Fruit Juice contributed major part sales revenue.
Real Fruit Juice contributed 17.92% in the F/Y 2003/04, 24.27% in the F/Y 2004/05,
29.51 % in the F/Y 2005/06, 45.83% in the F/Y 2006/07 & 49.34% in the F/Y 2007/08.
The sales of Real Fruit Juices were in increasing trend. Similarly Lal Danta Manjan sales
were also sigma cant but its sales were in fluctuation trend. Lal Danta Manjan
contribution in sales was in decreasing trend.
The Real Fruit Juice, Lal Danta Manjan, Amala Hair Oil, Hojmala Tablets, Pachan
Churna, DPC Mishran, Golcuse 'D' Power, Dant Makuta & Vatika shampoo were the
main products of the company. These products contributed more than 1% & in over all
they contributed 90.08% in the F/Y 2003/04, 96.44% in the F/Y 2004/05, 96.42% in the
F/Y 2005/06, 94.42% in the F/Y 2006/07 & 92.96% in the F/Y 2007/08.
The contributions of others products than Real Fruit Juice & Lal Danta Manjan were in
decreasing trend. The sales revenue of other products contributed less than 1%.
From this table it can be said that Real Fruit Juice was the only product that made remark
contribution in the company’s sales revenue generation.

88
4.5 Revenue of Each Territory
Table - 4.5Revenue of Each Territory
(Rs in Lakhs)
Source: Annual Report 2007/08
From table no.4.5 it shows that the contribution of foreign sales is more than domestic
sales. Domestic sales revenue is in increasing trend. During the starting period of study
the contribution of domestic sales was only 6.42% but it increased to 19.72%, in fiscal
year 2007/08. But contribution of foreign sales was in decreasing trend. In the F/Y
Fiscal Year Total
Sales
Growt
h
Domestic Foreign % Contribution in
total
Sales Growth
In %
Sales Growth
In %
Domestic Foreign Total
2002/03
2003/04
2004/05
2005/06
2006/07
2007/08
22249.16
27649.62
26995.05
30177.02
27287.90
32270.30
24.27
-2.37
11.79
-9.57
18.28
1427.5
6
1880.8
9
2165.9
8
2542.4
1
4146.8
7
6364.5
8
31.74
15.15
17.37
63.11
53.48
20821.
60
25768.
73
24829.
07
27634.
60
23141.
03
25905.
65
-
-23.67
-3.64
11.29
-16.26
11.95
6.24
6.80
8.02
8.42
15.20
19.72
93.58
93.20
91.98
91.58
84.80
80.18
100
100
100
100
100
100

89
2003/04 the contribution is 93.58% where as at the end of the study period, it contributes
only 80.28%.
In the F/Y 2003/04 total sales has been increased by 24.27% in comparison to 2002/03.
Domestic sales have been increased substantially by 31.73% in that year & 23.76%
increased in foreign sales which are the greatest increment in the total revenue.
In the F/Y 2004/05 the total sales was decreased by 2.37% which was the result of
decrease in foreign sales of family product division & health care product division. The
increment in domestic sales of 15.15% cannot control the decrease total contribution. The
small decrease in foreign sales of 3.64% decreases 2.37% in total sales in the F/Y
2005/06, total sales, domestic sales & foreign sales was increased by 11.79% 17.38% &
11.29% respectively in the F/Y 2005/06 the sales of main product such as real fruit Juices,
Vatika shampoo & Amala hair oil were increased.
In the F/Y 2006/07, total sales revenue & export revenue decreased by 6.57% & 16.26%
respectively. The domestic sales revenue was increased at that year by 63% mainly
decrease in export or gerbil powders & Hajmola tablet decreased the sales revenue Real
Fruit Juices Chawan Pransh & Taxin Roshin & oil Sales was increase in domestic market.
In 2007/08, total sales revenue export sales & domestic sales were increased by 18.26%,
11.95% & 53.48% respectively. During this year company ran smoothly with conflict
resolution the sales of main products Real Fruit Juices, Hajmola tablet, Lal Danta
Manjan, Chawanpransh, DCP Mishran was increased.
The actual sales by territories are shown on the following graphical presentation.

90
Graph No. - 4.2
Actual Sales, by Territories
4.6 Budgeted Domestic Sales & Actual Domestic SalesTable- 4.6
Budget Domestic Sales & Actual Domestic Sales
(Rs in Lakhs)
Fiscal Year Budgeted Sales Domestic Actual Domestic Sales % of Achievement
2002/03
2003/04
2004/05
2005/06
2006/07
2007/08
1764.44
2059.91
2727.70
2815.60
4960.75
7613.73
1427.56
1880.89
2165.98
2542.41
4146.87
6364.58
80.90
91.31
79.40
90.30
83.59
84.71
Source: Annual Report 2007/08

91
The percentage of achievement ranges from 79.40 to 91.3. In the F/Y 2003/04 the
percentage of achievement revealed highest among others over budget which is 91.31%
likewise the percentage of achievement for the F/Y 2004/05, 2005/06, 2006/07 &
2007/08% are 79.40%, 90.3%, 83.59% and 84.71 respectively. The sales achievement of
domestic sales was in fluctuation trend. Form this calculation, it can be concluded that the
in the F/Y 2004/05 the company budgeted target was not meet due to the company’s sales
department performance and political crisis.
The budgeted & actual domestic sales can be shown below by graphically presentation.
Diagram No.-4.3
Budgeted & Actual Domestic Sales
The following tables show arithmetic mean, standard dedication & co-efficient of
variation of budgeted domestic sales. The detail calculation of statically tools presented in
Appendix now summarizes the result which gives the idea about budgeted and actual
figure of domestic sales.
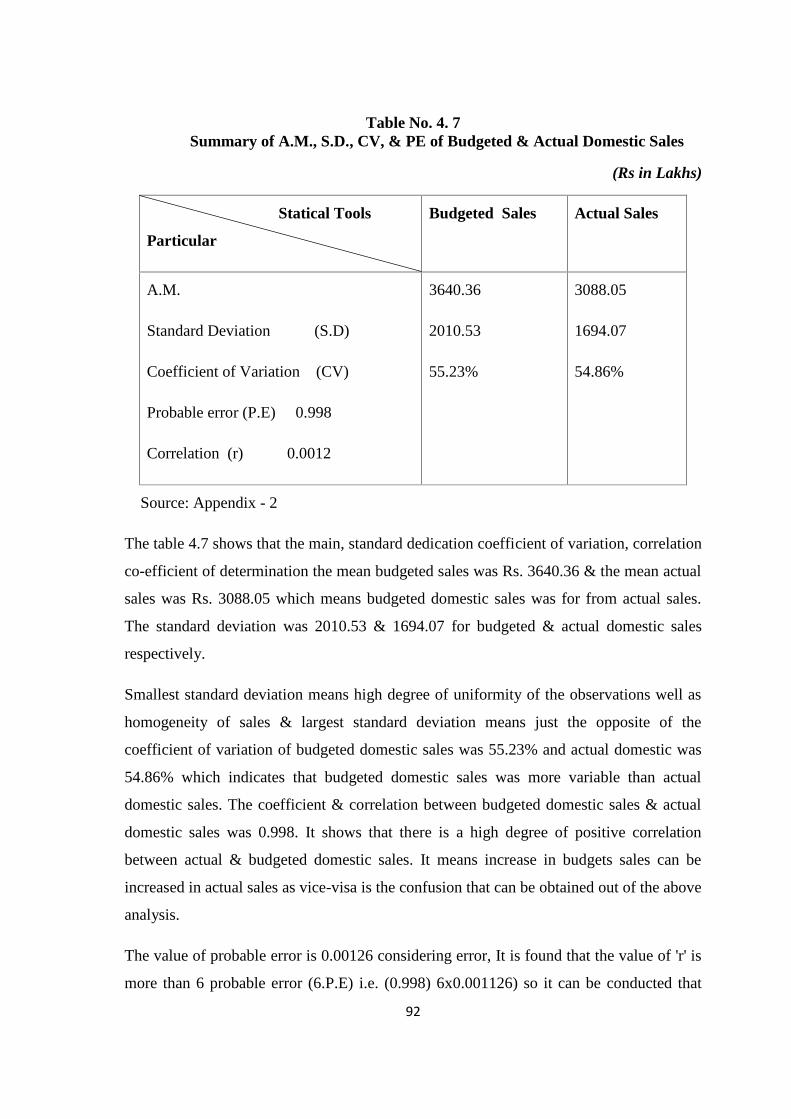
92
Table No. 4. 7Summary of A.M., S.D., CV, & PE of Budgeted & Actual Domestic Sales
(Rs in Lakhs)
Statical Tools
Particular
Budgeted Sales Actual Sales
A.M.
Standard Deviation (S.D)
Coefficient of Variation (CV)
Probable error (P.E) 0.998
Correlation (r) 0.0012
3640.36
2010.53
55.23%
3088.05
1694.07
54.86%
Source: Appendix - 2
The table 4.7 shows that the main, standard dedication coefficient of variation, correlation
co-efficient of determination the mean budgeted sales was Rs. 3640.36 & the mean actual
sales was Rs. 3088.05 which means budgeted domestic sales was for from actual sales.
The standard deviation was 2010.53 & 1694.07 for budgeted & actual domestic sales
respectively.
Smallest standard deviation means high degree of uniformity of the observations well as
homogeneity of sales & largest standard deviation means just the opposite of the
coefficient of variation of budgeted domestic sales was 55.23% and actual domestic was
54.86% which indicates that budgeted domestic sales was more variable than actual
domestic sales. The coefficient & correlation between budgeted domestic sales & actual
domestic sales was 0.998. It shows that there is a high degree of positive correlation
between actual & budgeted domestic sales. It means increase in budgets sales can be
increased in actual sales as vice-visa is the confusion that can be obtained out of the above
analysis.
The value of probable error is 0.00126 considering error, It is found that the value of 'r' is
more than 6 probable error (6.P.E) i.e. (0.998) 6x0.001126) so it can be conducted that

93
(0.998) (0006.76) calculated value of 'r' is significant & actual sales will go in the same
direction of Budgeted sales.
4.7 Budgeted Foreign Sales & Actual Foreign Sales
Table No. 4.8
Budgeted Foreign Sales & Actual Foreign Sales
(Rs in Lakhs)
F/Y Budgeted Foreign Sales Actual Foreign Sales % Achievement
2002/03
2003/04
2004/05
2005/06
2006/07
2007/08
24764.77
28953.45
30558.31
32159.90
31556.57
29218.78
20821.60
25768.73
24829.07
27634.60
23141.03
25905.65
84.14
89.00
81.251
85.951
73.331
88.661
Source: Annual Report 2007/08
The % of achievement ranges from 73.33% to 89.00% in the year 2003/04 the percentage
of achievement was highest among others the percentage of achievement, in the F/Y
2002/03, 2004/05, 2005/06, 2006/07 & the F/Y 2007/08 are 84.14%, 81.25, 85.95,
73.33% & the F/Y 88.66% respectively. From this it can be said that company budgeted
exported sales was greater than actual exported sales.

94
The budgeted foreign & actual foreign sales can be show by the bar diagram.
Diagram - No. 4.4
Budgeted & Actual Foreign Sales
The arithmetic mean standard deviation coefficient of variation coefficient of correlation
& coefficient portable error of budgeted foreign sales & actual foreign sales detailed
calculation of statistic tools are presented in appendix. Now summarize the results which
give ideas about budgeted foreign & actual figure of foreign sales.
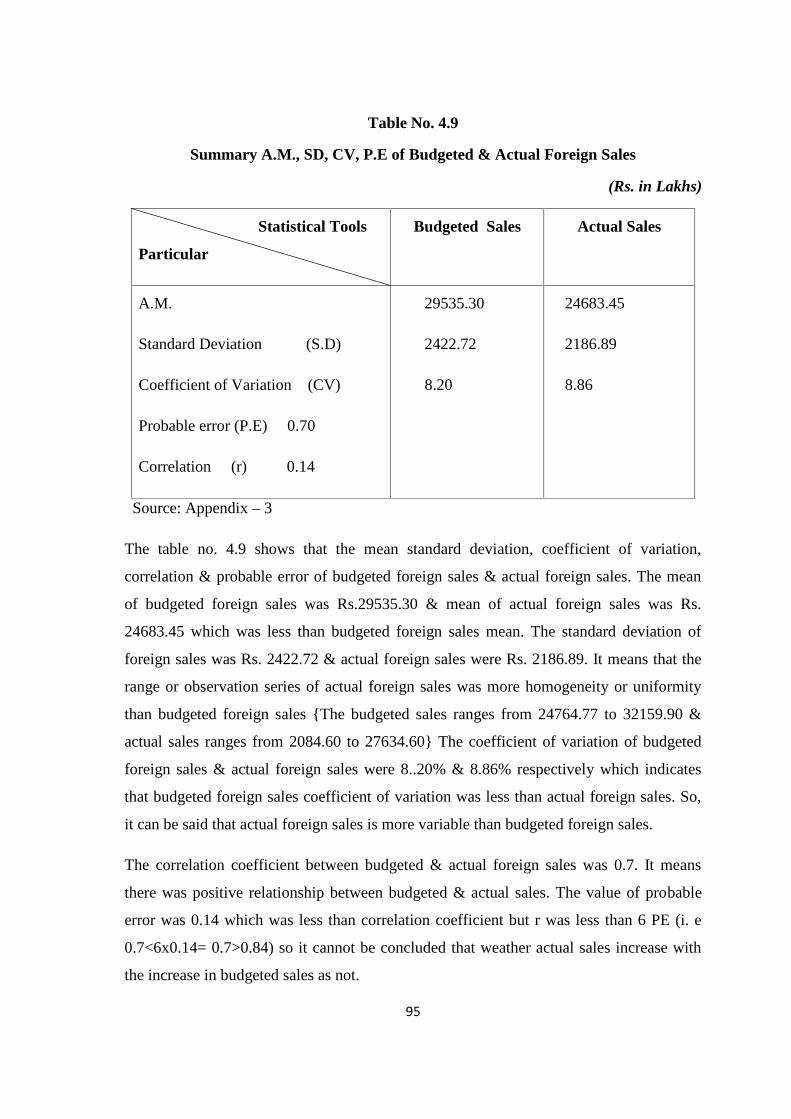
95
Table No. 4.9
Summary A.M., SD, CV, P.E of Budgeted & Actual Foreign Sales
(Rs. in Lakhs)
Statistical Tools
Particular
Budgeted Sales Actual Sales
A.M.
Standard Deviation (S.D)
Coefficient of Variation (CV)
Probable error (P.E) 0.70
Correlation (r) 0.14
29535.30
2422.72
8.20
24683.45
2186.89
8.86
Source: Appendix – 3
The table no. 4.9 shows that the mean standard deviation, coefficient of variation,
correlation & probable error of budgeted foreign sales & actual foreign sales. The mean
of budgeted foreign sales was Rs.29535.30 & mean of actual foreign sales was Rs.
24683.45 which was less than budgeted foreign sales mean. The standard deviation of
foreign sales was Rs. 2422.72 & actual foreign sales were Rs. 2186.89. It means that the
range or observation series of actual foreign sales was more homogeneity or uniformity
than budgeted foreign sales {The budgeted sales ranges from 24764.77 to 32159.90 &
actual sales ranges from 2084.60 to 27634.60} The coefficient of variation of budgeted
foreign sales & actual foreign sales were 8..20% & 8.86% respectively which indicates
that budgeted foreign sales coefficient of variation was less than actual foreign sales. So,
it can be said that actual foreign sales is more variable than budgeted foreign sales.
The correlation coefficient between budgeted & actual foreign sales was 0.7. It means
there was positive relationship between budgeted & actual sales. The value of probable
error was 0.14 which was less than correlation coefficient but r was less than 6 PE (i. e
0.7<6x0.14= 0.7>0.84) so it cannot be concluded that weather actual sales increase with
the increase in budgeted sales as not.
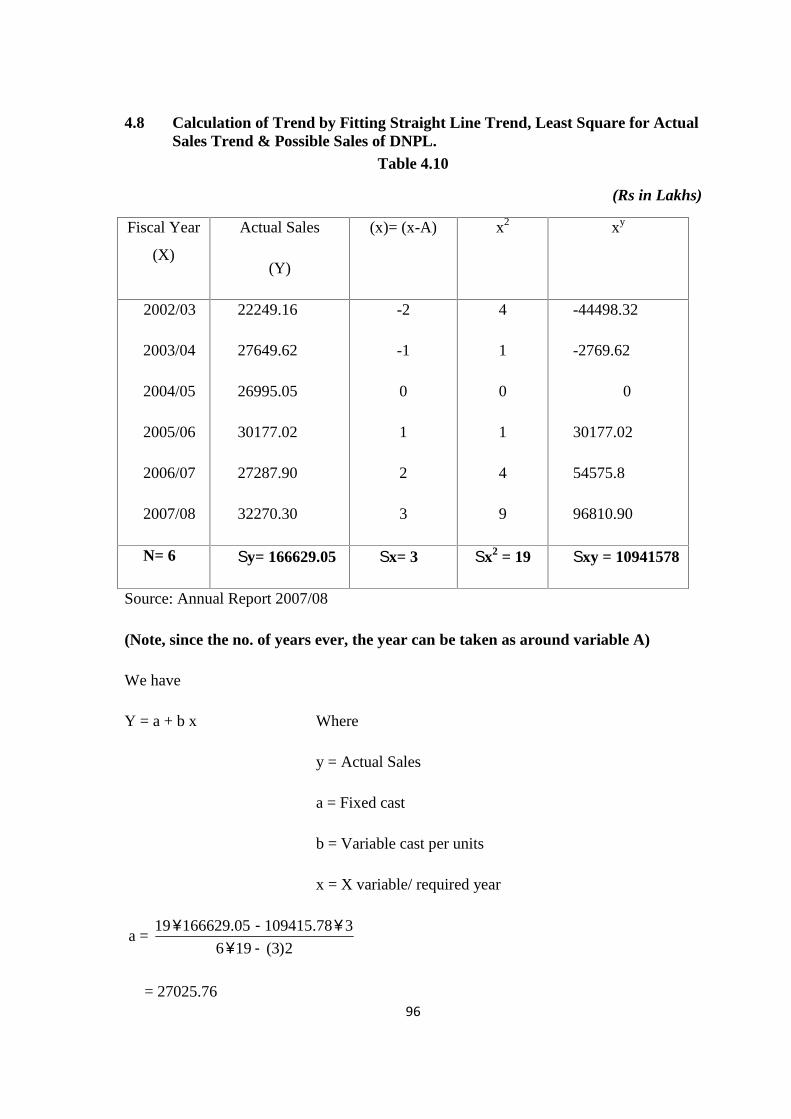
96
4.8 Calculation of Trend by Fitting Straight Line Trend, Least Square for ActualSales Trend & Possible Sales of DNPL.
Table 4.10
(Rs in Lakhs)
Fiscal Year
(X)
Actual Sales
(Y)
(x)= (x-A) x2 xy
2002/03
2003/04
2004/05
2005/06
2006/07
2007/08
22249.16
27649.62
26995.05
30177.02
27287.90
32270.30
-2
-1
0
1
2
3
4
1
0
1
4
9
-44498.32
-2769.62
0
30177.02
54575.8
96810.90
N= 6 y= 166629.05 x= 3 x2 = 19 xy = 10941578
Source: Annual Report 2007/08
(Note, since the no. of years ever, the year can be taken as around variable A)
We have
Y = a + b x Where
y = Actual Sales
a = Fixed cast
b = Variable cast per units
x = X variable/ required year
a =2)3(196
378.10941505.66629119
= 27025.76

97
=2)3(196
305.1666978.9415016
=1491.50
The fiscal year 2008/09 the value of x will be 4 is to be assumed based years now
substituting the value of a & b in the required straight line trend equation.
y = a+bx
= 27025.76 + 1491.50x4
= 37991.76
If there trend does not change the possible sales for next year will be Rs. 32991.76 Lakhs
Similarly If we take
X = 2011/ 12 than
x = 2009/10 – 2002/03 = 7
y = a+bx
= 27025.76 + 1491.50 x 7 = 37466.26 Lakhs
If the trend does not change the possible sales far next year will be Rs 32991.76. Lakhs

98
4.9 Analysis of Actual Total Income Operating Expenses & Operating Profit.
Table = 4.11
Actual Total Income, Operating Expenses & Operating Profit
(Rs in Lakhs)
Fiscal
Year
Actual Income Operating Expenses Operating Profit
Amount %
Increase
Amount %
Increase
Amount % Increase
2002/03
2003/04
2004/05
2005/06
2006/07
2007/08
22315.57
27751.36
27086.42
30312.37
27543.41
32412.12
24.36
2.40
11.91
- 9.13
17.68
18395.21
23052.63
23602.93
26251.92
25109.29
30130.43
25.32
12.39
11.32
- 4.35
19.89
3920.36
4698.73
4148.43
4060.45
2434.12
2308.69
19.85
- 11.71
- 2.12
- 40.05
-5.15
Source: Annual report 2007/08
Sales & other income was taken as Actual increase & cost of material, manufacturing
overhead personal over head, Administrative & selling overhead & regality are includes
in operating expenses.
Table No. 4.11 shows the trend of actual income, operating expenses & operating profit
from F/Y 2002/03 to 2007/08. In F/Y 2003/04 actual income increased by 23.36% due to
increase in the third country export sales of Hajmola, Herbal powders, Shampoos &
regular increase in sales of real fruit Juices. Operating expenses is also increase with
increase in sales revenue operating expenses increased by 25.32% which is higher than
Actual increase in actual income percentage increase operating profit is 19.85% which is
less than percentage increased in Actual income.

99
In 2004/05 Actual income increased by 2.4% and in 2005/06 due to decrease in export
sales of Herbal products & Hajmola operating income i.e. 11.71% loss due to high
operating expenses operating expenses increased by 2.39% over the previous where as
sales decreased by 2.4% operating cost increase with increase in cost of material &
person.
In 2005/06 Actual income increased by 11.91% over previous year is mainly due to
increase in hair oil, Hajmola tablet & real fruit juices sales. The ratio of increasing in
operating profit of powder than income but percentage of operating income decreased by
2.12% over previous year. It shows that the margin of sales was decreased.
In 2006/07 Actual income decreased by 9.13% over previous year this is mainly due to
shifting of manufacturing hair oil, shampoo & Hajmola to India post announcement of
excise free & tax free zones there. The operating expenses also decreased with decrease in
sales but operating income was decreased by 40.05 over previous year mainly decrease in
sales higher input case & extra import duty burden on packing materials.
In 2007/08 the company income was increased by 17.68% over the previous year this is
mainly due to increase in Juices sales the operating expenses increased by 19.89% due to
high input cast & extra import duty burden on packing materials & operating profit
decrease by 5.15% due to high operating cast & low margin.
This analysis shows in that income of company was fluctuating trend where as operating
expenses increase as a result of increased in operating expenses & decrease in margin the
operating profit was in decreasing trend during the study period.

100
4.10 Analysis of Ratio between Actual Sales & Net Profit
Table No. 4.12
Ratio between Actual Sales & Net Profit
(Rs in Lakhs)
Fiscal Year Actual Sales Net Profit % Net Profit
2002/03
2003/04
2004/05
2005/06
2006/07
2007/08
22249.16
27649.62
26995.05
30177.02
27287.90
32270.30
1395.09
1642.99
1150.84
1212.73
453.43
121.28
6.27
5.49
4.26
4.02
1.66
0.38
Source: Annual report 2007/08
Table 4.12 shows the clear pictures of sales & Net Profit relationship of DNPL. The table
shows that sales were in fluctuating nature. Net Profit in 2003/04 was highest amount of
Rs. 1642.99 from 2004/05 Net Profit was in decreasing trend. The net margin of the
company was very low. At the starting period the net profit decreased to only 0.38 of
sales the end of study period. The net profit margin was in decreasing trend. The net profit
of company was decreased due to high cost of raw material, administrative & selling
expenses & increase in fixed cost. The company loses its net profit margin every year.

101
Table No. 4.13
Fitting of trend line by using least square method
(Rs in Lakhs)
Fiscal Year (X) Net Income (Y) x = X-A x2 xy
2002/03
2003/04
2004/05
2005/06
2006/07
2007/08
1395.09
1642.99
1150.84
1212.73
453.73
121.28
-2
-1
0
1
2
3
4
1
0
1
4
9
-2790.18
1642.99
0
1212.73
453.43
121.28
N= 6 Y=5976.36 x=3 x2=19 xy=194.74
Since No. of year is even the third year (i.e. 2004/05) can be taken as the assumed
variable A.
Let the trend line between dependent variable net profit 'y' & independent variable year 'x'
(ie time) be represented by
y = a + b x.......... (i)
Where a = y intercept
b = slope of the trend line or amount of change that comes in y for a unit change in x
To find the variable of a & b it can be solve the following two equation
y = Na + b x .............. (ii)
xy = a x + b x2 ............. (iii)
Now, solve the equation

102
y = Na + bx
5976.36 = 6a + bx3
6a+3b = 5976.36 ........................ (iv)
again
x 4 = a x + b x2
- 1949.74 = a 3 + 6 19
3a + 196 = - 1949.74 ............. (v)
Now multiplying Equation (v) by 2 & subtract (iv) from (v)
6a + 38b = - 3899.48
6a + 3b = 5976.36
35b = - 9875.84
b =35
84.9875
= - 282.17
Therefore b = - 282.17
Now put b = -282.17 in equation (iv) then
6a + 3b = 5976.36
6a + 3x (-282.17) = 5976.36
6a = 5976.36 + 846.50
a = 6822.86 = 1137.14
6

103
Now put value of a & b in equation (i) then
y = a+bx
y= 1137.14 -282.17x
when x = 5 in 2007/08
then y = 1137.14 -282.175
= -273.71
If the trend does not change the company will surface Rs 273.71 Lakhs loss in fiscal year
2007/08
4.11 Analysis of Account Receivable
DNPL sales its products in both cash & credit but it has no fixed policy to show how
much percentage to be sold on credit of total sales. It provides trade & cash discount on
sales. Its discount policy various from product wise & place wise, DNPL focuses on cash
sales to company used one bill system with its customers so it's collection period is
decreased. Company has average collection period of 30 days. DNPL has not made any
policy to motivate staff for effective collection of revenue & there is no record of penalty
for their customers when their credit remains over dues DNPL sales & accounts
receivable relation can be presented in table.
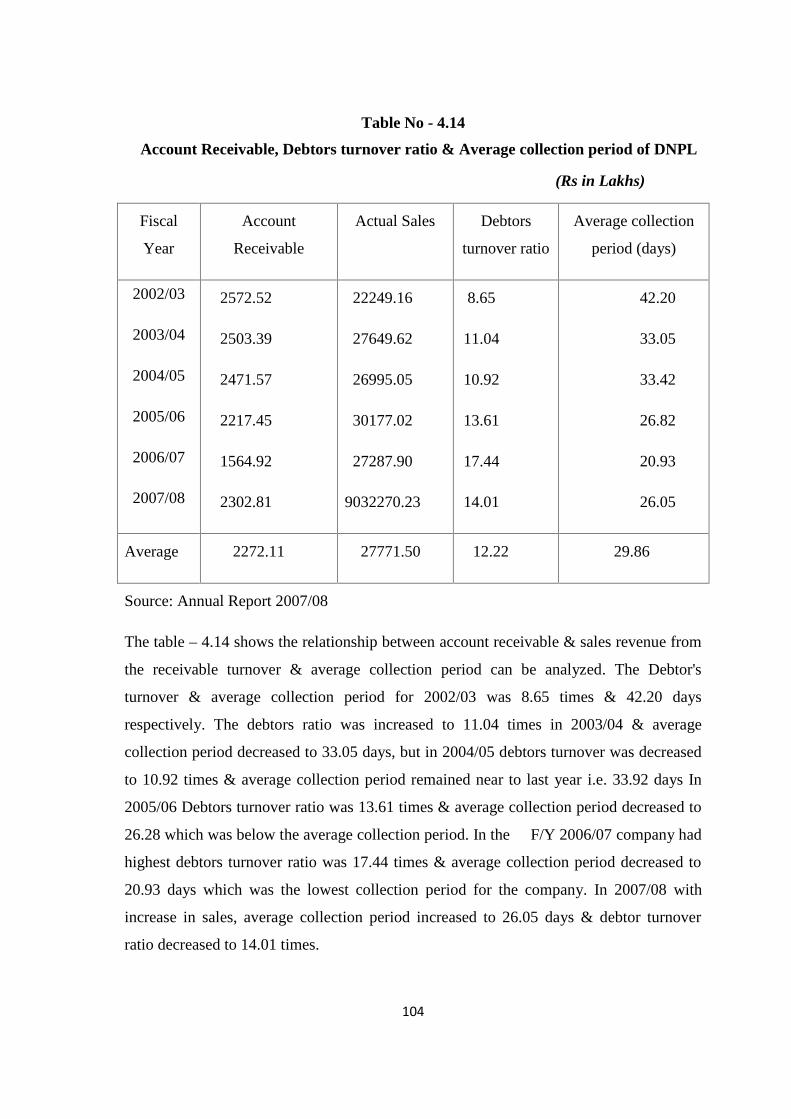
104
Table No - 4.14
Account Receivable, Debtors turnover ratio & Average collection period of DNPL
(Rs in Lakhs)
Fiscal
Year
Account
Receivable
Actual Sales Debtors
turnover ratio
Average collection
period (days)
2002/03
2003/04
2004/05
2005/06
2006/07
2007/08
2572.52
2503.39
2471.57
2217.45
1564.92
2302.81
22249.16
27649.62
26995.05
30177.02
27287.90
9032270.23
8.65
11.04
10.92
13.61
17.44
14.01
42.20
33.05
33.42
26.82
20.93
26.05
Average 2272.11 27771.50 12.22 29.86
Source: Annual Report 2007/08
The table – 4.14 shows the relationship between account receivable & sales revenue from
the receivable turnover & average collection period can be analyzed. The Debtor's
turnover & average collection period for 2002/03 was 8.65 times & 42.20 days
respectively. The debtors ratio was increased to 11.04 times in 2003/04 & average
collection period decreased to 33.05 days, but in 2004/05 debtors turnover was decreased
to 10.92 times & average collection period remained near to last year i.e. 33.92 days In
2005/06 Debtors turnover ratio was 13.61 times & average collection period decreased to
26.28 which was below the average collection period. In the F/Y 2006/07 company had
highest debtors turnover ratio was 17.44 times & average collection period decreased to
20.93 days which was the lowest collection period for the company. In 2007/08 with
increase in sales, average collection period increased to 26.05 days & debtor turnover
ratio decreased to 14.01 times.

105
The company lowered the collection period means cash quickly & higher collection
period means poor level & there is also more chance of being bad debtors lower
collection period of higher debtors turnover ratio created more working capital therefore
DNPL should pay more attention to collect debtors.
4.12 Analysis of Cash Flow
Table No. 4.15
Cash Flow of DNPL
(Rs in Lakhs)
Fiscal
Year
Cash Flow From
Operating Activities
Cash From
Investing
Cash Flow Financing
Activities
Net Cash
Flow
2002/03
2003/04
2004/05
2005/06
2006/07
2007/08
1731.37
2152.62
1173.49
1003.27
2659.61
2185.28
(1194.08)
(809.75)
(1273.59)
(506.87)
(2365.19)
(2417.15)
(517.70)
(1316.74)
85.97
(431.88)
(326.44)
176.08
19.59
26.13
(14.13)
64.52
(32.02)
(55.79)
Average 1817.61 (1427.77) 387.95 1.38
Source: Annual Report 2007/08
The tale no. 4.15 shows that the cash flow of DNPL was in fluctuating trend. The cash
flow from operating activities was in flow highly fluctuating. The average cash in flow
from operating activities was Rs. 1817.61 Lakhs. The cash in flowed from operating
activities in year 2006/07 was higher than other year. The cash inflow from operating
activities increase with increase in sales 2003/04 & 2006/07, but cash flow in 2005/06 &
2007/08 was decrease due to high operating cost & cost of packing material increase
during that year.

106
The cash flow from investing activities was cash out flow. The average cash outflow from
investing activities was Rs. 1427.77 Lakhs. The cash outflow from investing activities in
2007/08 was higher than other year. DNPL invested large amount to installing new
sterilizes in Juice plant in that year. DNPL invested larger amount to import new machine
& technology replaced old machine to increase it's capacity.
The cash from financing activities also in fluctuating trend DNPL had high cash inflow in
2007/08 from financing activities of Rs. 176.08. The cash out flow from financing
activities in 2005/06 was higher than other year due to high repayment of loan &
distribution of dividend. The company had average cash out flow from financing
activities was Rs 387.95 Lakhs. DNPL has decreased its debts from Rs. 6204.62 Lakhs to
Rs. 496.20 Lakhs during study period. DNPL did not issue its share capital during this
period.
The net cash flow of DNPL has fluctuating trend. The net cash flow in 2002/03, 2003/04
& 2005/06 was cash inflow of Rs 19.59, 26.13 & 64.52 lakhs respectively & in 2004/05,
2006/07 & 2007/08 there was cash outflow of Rs. 14.13, Rs. 32.02 & Rs. 55.79 Lakhs
respectively. The average cash inflow for the study period was Rs 1.38 Lakhs.
4.13 Correlation Analysis
Correlation coefficient is used to define the relationship between two or more variable. In
this study it is used to see the close consistency of data.
4.13.1 Correlation coefficient between the Sales and Net Profit of DNPL
It shows the relationship between two variables profit and sales. The table below shows
the correlation coefficient, coefficient of determination and probable error between the
sales and net profit.

107
Table 4.16
Correlation Coefficient, Coefficient of Determination and Probable Error (P.E.)
Correlation
Coefficient
Coefficient of
Determination
P.E 6 P.E.
-0.5611142 0.3148492 0.2033 1.2201
Source : Apendix-8
Above table 4.16 shows the correlation coefficient between the sales. The correlation
between the sales and net profit of DNPL is highly negative i.e. -0.5611. It shows the
negative relationship between the sales and profit. Here correlation coefficient is lesser
than 6 times value, it is not statistically significant. Coefficient of determination is
0.3148492 which mean 31.48% total Profit is explained by sales. This indicates that Profit
of DPNL has lower volume and decreasing in trend.
Table 4.17
4.13.2 Correlation between the Operating profit and Net profit of DPNL
Correlation
Coefficient
Coefficient of
Determination
P.E 6 P.E.
0.9677722 0.9365831 0.01746 0.104776
Source : Apendix-8
The above table shows the correlation coefficient between the operating and net profit i.e.
0.9678. This indicates there is high positive correlation between the net profit and
operating profit. Here correlation coefficient is higher than 6 times P.E. which means that
the correlation coefficient is statistically significant. This shows the profit is highly
depend on operating profit.
4.14 Analysis of Sales per Employee
Employees plays major role in a company. A happy worker can give more services to
organization. Organizational success or failure is largely depends up on the role of human

108
resources so management needs to manage human recourses so that they can participate
in decision making, formulating strategic planning & implementation. Human resources
management assures employees as assets.
Sometimes other external factors also plays significant role in a company. The sales
turnover per of DNPL can be presented as
Table No. 4.18
Sales per Employee of DNPL
(Rs in Lakhs)
Fiscal Year Actual Sales No. of Employees Sales per employee
2002/03 22249.16 1000 22.224916
2003/04 27649.62 1000 27.64962
2004/05 26995.05 1000 26.99505
2005/06 30177.02 1000 30.17702
2006/07 27287.90 1000 27.28790
2007/08 32270.30 1000 32.27030
Source: Annual Report 2007/08
The ratio of sales per employee was position the sales per employee was in fluctuating
trend but number of employees of DNPL was constant since the F/Y 2002/03 to F/Y
2007/08. There were 1000 employees directly employed by DNPL. The sales of per
employee of fiscal year 2002/03 were Rs. 22249.16 lakhs which was lowest during the
study period. In the F/Y 2003/04 the sales per employee decrease to Rs. 26995.05 lakhs.
But in the F/Y 2005/06 per employee sales increased to Rs. 30177.02 lakhs. It was Rs.
27287.90 lakhs in the F/Y 2006/07 & Rs. 32270.30 lakhs in F/Y 2007/08 which was the
highest sales per employee during the study period.
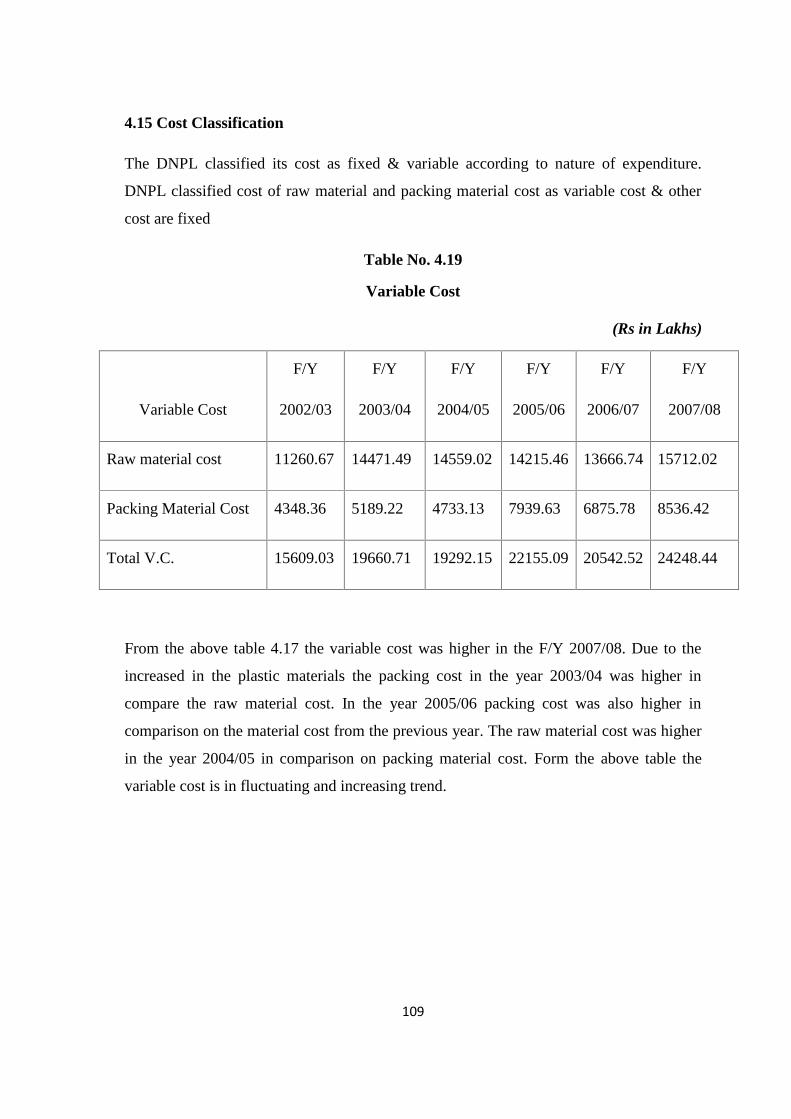
109
4.15 Cost Classification
The DNPL classified its cost as fixed & variable according to nature of expenditure.
DNPL classified cost of raw material and packing material cost as variable cost & other
cost are fixed
Table No. 4.19
Variable Cost
(Rs in Lakhs)
Variable Cost
F/Y
2002/03
F/Y
2003/04
F/Y
2004/05
F/Y
2005/06
F/Y
2006/07
F/Y
2007/08
Raw material cost 11260.67 14471.49 14559.02 14215.46 13666.74 15712.02
Packing Material Cost 4348.36 5189.22 4733.13 7939.63 6875.78 8536.42
Total V.C. 15609.03 19660.71 19292.15 22155.09 20542.52 24248.44
From the above table 4.17 the variable cost was higher in the F/Y 2007/08. Due to the
increased in the plastic materials the packing cost in the year 2003/04 was higher in
compare the raw material cost. In the year 2005/06 packing cost was also higher in
comparison on the material cost from the previous year. The raw material cost was higher
in the year 2004/05 in comparison on packing material cost. Form the above table the
variable cost is in fluctuating and increasing trend.
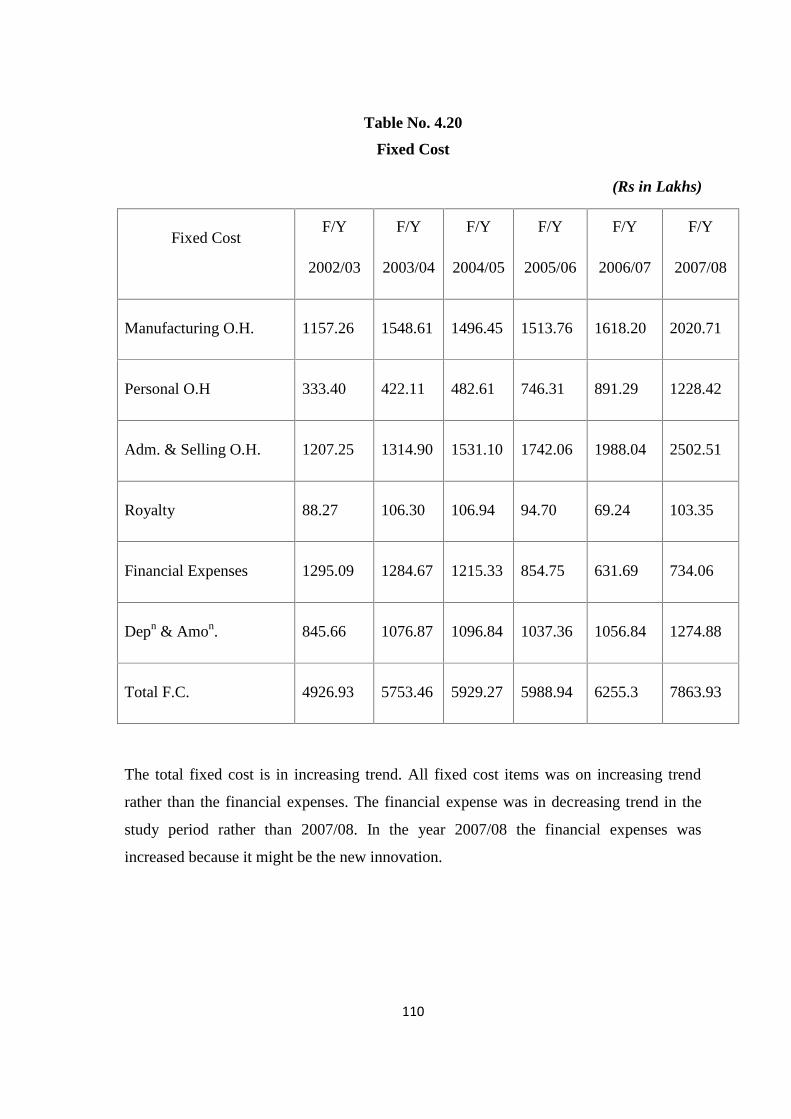
110
Table No. 4.20
Fixed Cost
(Rs in Lakhs)
Fixed CostF/Y
2002/03
F/Y
2003/04
F/Y
2004/05
F/Y
2005/06
F/Y
2006/07
F/Y
2007/08
Manufacturing O.H. 1157.26 1548.61 1496.45 1513.76 1618.20 2020.71
Personal O.H 333.40 422.11 482.61 746.31 891.29 1228.42
Adm. & Selling O.H. 1207.25 1314.90 1531.10 1742.06 1988.04 2502.51
Royalty 88.27 106.30 106.94 94.70 69.24 103.35
Financial Expenses 1295.09 1284.67 1215.33 854.75 631.69 734.06
Depn & Amon. 845.66 1076.87 1096.84 1037.36 1056.84 1274.88
Total F.C. 4926.93 5753.46 5929.27 5988.94 6255.3 7863.93
The total fixed cost is in increasing trend. All fixed cost items was on increasing trend
rather than the financial expenses. The financial expense was in decreasing trend in the
study period rather than 2007/08. In the year 2007/08 the financial expenses was
increased because it might be the new innovation.
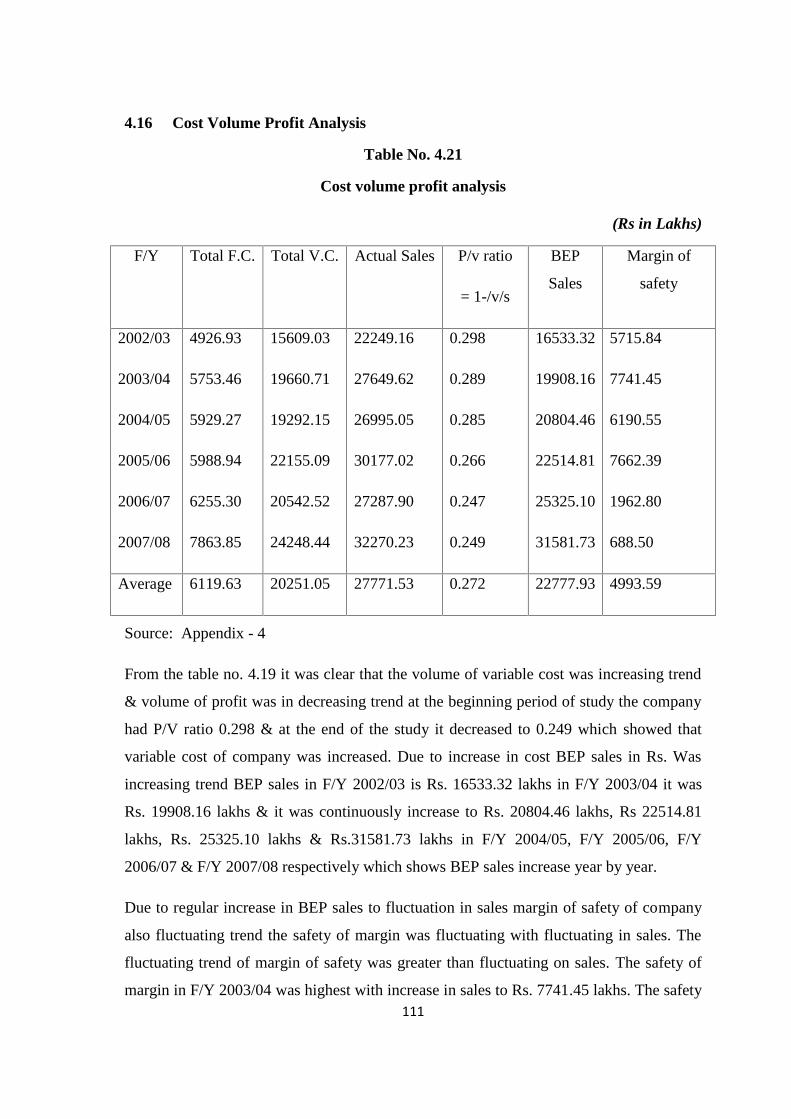
111
4.16 Cost Volume Profit Analysis
Table No. 4.21
Cost volume profit analysis
(Rs in Lakhs)
F/Y Total F.C. Total V.C. Actual Sales P/v ratio
= 1-/v/s
BEP
Sales
Margin of
safety
2002/03
2003/04
2004/05
2005/06
2006/07
2007/08
4926.93
5753.46
5929.27
5988.94
6255.30
7863.85
15609.03
19660.71
19292.15
22155.09
20542.52
24248.44
22249.16
27649.62
26995.05
30177.02
27287.90
32270.23
0.298
0.289
0.285
0.266
0.247
0.249
16533.32
19908.16
20804.46
22514.81
25325.10
31581.73
5715.84
7741.45
6190.55
7662.39
1962.80
688.50
Average 6119.63 20251.05 27771.53 0.272 22777.93 4993.59
Source: Appendix - 4
From the table no. 4.19 it was clear that the volume of variable cost was increasing trend
& volume of profit was in decreasing trend at the beginning period of study the company
had P/V ratio 0.298 & at the end of the study it decreased to 0.249 which showed that
variable cost of company was increased. Due to increase in cost BEP sales in Rs. Was
increasing trend BEP sales in F/Y 2002/03 is Rs. 16533.32 lakhs in F/Y 2003/04 it was
Rs. 19908.16 lakhs & it was continuously increase to Rs. 20804.46 lakhs, Rs 22514.81
lakhs, Rs. 25325.10 lakhs & Rs.31581.73 lakhs in F/Y 2004/05, F/Y 2005/06, F/Y
2006/07 & F/Y 2007/08 respectively which shows BEP sales increase year by year.
Due to regular increase in BEP sales to fluctuation in sales margin of safety of company
also fluctuating trend the safety of margin was fluctuating with fluctuating in sales. The
fluctuating trend of margin of safety was greater than fluctuating on sales. The safety of
margin in F/Y 2003/04 was highest with increase in sales to Rs. 7741.45 lakhs. The safety
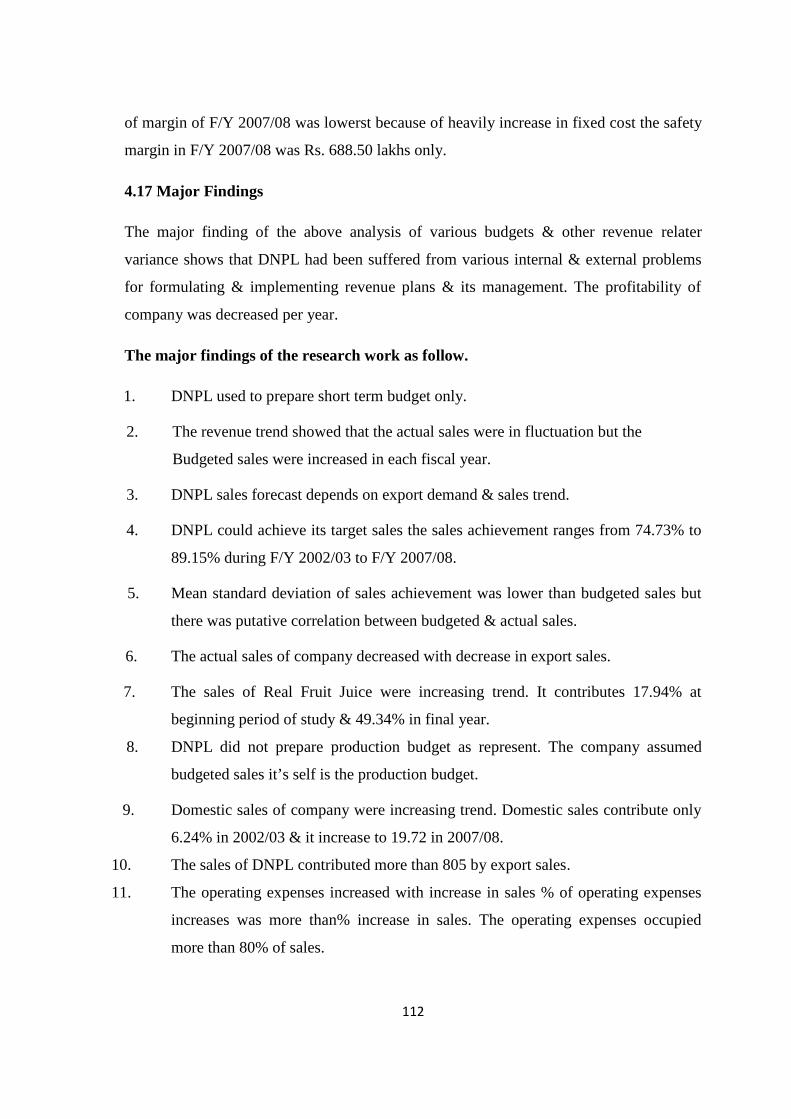
112
of margin of F/Y 2007/08 was lowerst because of heavily increase in fixed cost the safety
margin in F/Y 2007/08 was Rs. 688.50 lakhs only.
4.17 Major Findings
The major finding of the above analysis of various budgets & other revenue relater
variance shows that DNPL had been suffered from various internal & external problems
for formulating & implementing revenue plans & its management. The profitability of
company was decreased per year.
The major findings of the research work as follow.
1. DNPL used to prepare short term budget only.
2. The revenue trend showed that the actual sales were in fluctuation but the
Budgeted sales were increased in each fiscal year.
3. DNPL sales forecast depends on export demand & sales trend.
4. DNPL could achieve its target sales the sales achievement ranges from 74.73% to
89.15% during F/Y 2002/03 to F/Y 2007/08.
5. Mean standard deviation of sales achievement was lower than budgeted sales but
there was putative correlation between budgeted & actual sales.
6. The actual sales of company decreased with decrease in export sales.
7. The sales of Real Fruit Juice were increasing trend. It contributes 17.94% at
beginning period of study & 49.34% in final year.
8. DNPL did not prepare production budget as represent. The company assumed
budgeted sales it’s self is the production budget.
9. Domestic sales of company were increasing trend. Domestic sales contribute only
6.24% in 2002/03 & it increase to 19.72 in 2007/08.
10. The sales of DNPL contributed more than 805 by export sales.
11. The operating expenses increased with increase in sales % of operating expenses
increases was more than% increase in sales. The operating expenses occupied
more than 80% of sales.

113
12. DNPL adopted cost plus pricing strategy the price of DNPL production was
cheaper than Nepal lever’s production.
13. DNPL lost its net profit year by year it was 6.27% in F/Y 2002/03 but it was only
0.38% in F/Y 2007/08 which indicated that the company would suffer loss very
soon.
14. The correlation analysis shows the there is highly negative correlation between
sales and net profit that mean the profit is not highly caused from the sales
volumes.
15. DNPL had good collection policy the average collection period was nearly one
month which gave less chance of being bad debt.
16. The main source of cash generation was from operating activities. Company
invested to per chase new automatic plant.
17. DNPL did not issue its share to raise capital. It took bank loan to fulfill its cash
requirement.
18. DNPL sales revenue did not depend upon the number of employee. It depended on
market strategy & export sales.
19. Manpower planning of DNPL was not good; the company did not create new
opportunity for new & freesed manpower. The structure of manpower remained
constrain during the study period.
20. The fixed cost of DNPL was increasing trend which was the main cause of
decreasing in net profit.
21. The portion of variable cost is very high in DNPL. Variable cost per rupees of
sales was less than 67.88% in F/Y 2002/03 & it increases to 73.10%
22. DNPL BEP sales were very high it was increasing tool however BEP sales was
low than actual sales so company could make profit.

114
CHAPTER -5
Summary, Conclusion & Recommendation
5.1 Summary
Planning means arrangement for doing or using something or considering in advance. It is
the first phase of live function of management & followed by organization, directing,
coordinating & controlling. It is concerned with how an organization can change
internally to adapt to variations in external condition. It industry & commerce the
difference between success & failure, profit & loss depends upon the outcome of well laid
plans.
Revenue is the outcome of sales of goods & rendering the resources are measured in
terms of change made to customer's clients or tenants for goods & resources provided
them. Estimation the future revenue is called revenue planning. It is a necessary part of
PPC. The revenue plan should be designed to co-ordinate the efforts of the sales
department. It provides for the basic management decision about marketing.
Revenue planning is the essence of management & without it's effective PPC cannot be
developed however, only preparation of plan is not sufficient for the successful operation
of the business in addition this effective implementation & follow up system is very
important.
Dabur Nepal Private Limited is manufacturing private company is selected to examined
the revenue planning & its management of manufacturing enterprises. Dabur Nepal was
established in 1992 with an initial investment of Rs. 80 million. The factory was situated
at Parwanipur, Bara. DNPL has succeeded in fulfilling the need in health care, period care
herbal & food product.
This study tries to seek the DNPL. The main objective of the present study is to high light
the current practice of preparation sales budget & its effectiveness in DNPL for that
purpose of analyzing six year data (F/Y 2002/03 to 2007/08) are taken. Both primaries,
secondary are used in this study. This study mainly depend secondary sources. The data
have been analyzed using statistical & financial tools. Descriptive as well as analytical
approached have been used to analysis the quantitative data. In statistical tool, mean & D

115
correlation CV, PE, coefficient of variance has been used & in financial tools, Net profit,
ratio & CVP analysis have been used.
The analysis of sales budget & actual sales reports of DNPL, it is found that the actual
sales could not meet budgeted sales however company able to make profit till date.
This study has been organized in five chapters consisting of Introduction, Review of
Literature, Research Methodology, Data Presentation Analysis & Summary, and
Conclusion & Recommendation
5.2 Conclusion
Dabur Nepal Private Limited has significantly outperformed most benchmark, only few
product can improve their market share the company has not practice at systematic &
scientific sales plan. DNPL has not been able to acquaint the comprehensive budget target
growth rate has not been achieved however company has expanded program, target are
setting as high expectation mean standard deviation of sales but there is a lower than
budgeted sales which are lower than budgeted sales but there is a positive correlation
between sales target & sales achievements. DNPL has not practice of using statistical tool
in sales for costing sales plan were not made by considering all the component affecting
sales the percentage of achievement of export sales for 2004/05 was higher in compassion
with the other year & amount of export sales was greater in 200/08. The total sales of
company were in fluctuating the sales of company fluctuated with the export sales. The
main sources of revenue collection were export sales. It is contribution is sales revenue is
more than 80% the domestic sales of DNPL was increase year by year only some
benchmark product contribute is sales revenue of DNPL. The main product of Dabur as
Real Fruit Juice it contribute 49.37% in sales revenue. The net profit of company was
decrease year by year if this trend does not change company will suffer in near future.
DNPL does not prepare production budget as represent company assumed budget sales
itself as budgeted production quantity are almost same. DNPL has suffer under utilization
of it available company DNPL has fixed structure of manpower, which directly
influencing in generating revenue cost of material occupied more than 70% of its sales the
ratio of variable cost of DNPL was very high. The pricing policy adopt by DNPL was
cost plus pricing strategy the price of DNPL was found cheaper than its main competitors

116
Nepal lever's production. DNPL most favorable side is its debtor’s turnover ratio &
average collection period is nearly one month the ratio of increasing in cost was higher
than increase in actual sales ratio sales revenue of company was higher than BEP sales
which is the portative side for company. The management of DNPL do not have any
systematic cost control production program which decrease the net profit of the company
the management of DNPL do not adopt the nature & content of profit planning. The
company does not have followed a systematic periodical performance. DNPL
management teams have not implemented suggestions given by previous researcher so it
can be concluded that company are not seriously conscious to their poor performance.
5.3 Recommendations
Based on above study of DNPL previous background for some suggestion to improve the
revenue planning system in DNPL for its better improvement DNPL has suffering from
the various problems to formulating revenue plans. Therefore following suggestions can
be implementation of revenue plans to lead the factory in the strong position if future.
1. DNPL sales forecast should be made on realistic ground. Forecast should include
strategic & tactical forecast that are consistent with the time clemencies. The
process of developing a realistic sales plan should unique according to
requirement of the company.
2. DNPL should develop specific goals for the coming budget. Such goals may be
return on capital employed, net profit on sales increase in cost effeteness etc.
without such goals the DNPL not be effective.
3. DNPL should develop the effective pricing policies according to the competitive
market situation profit cost volume relationship should be taken into consideration
while developing sales plan & pricing policy.
4. DNPL should focus promotional tools. Such as, advertisement & publishing
should be improved.
5. DNPL should be consider certain management technical & financial issues
organization, participation of employees, coordination with in organization,
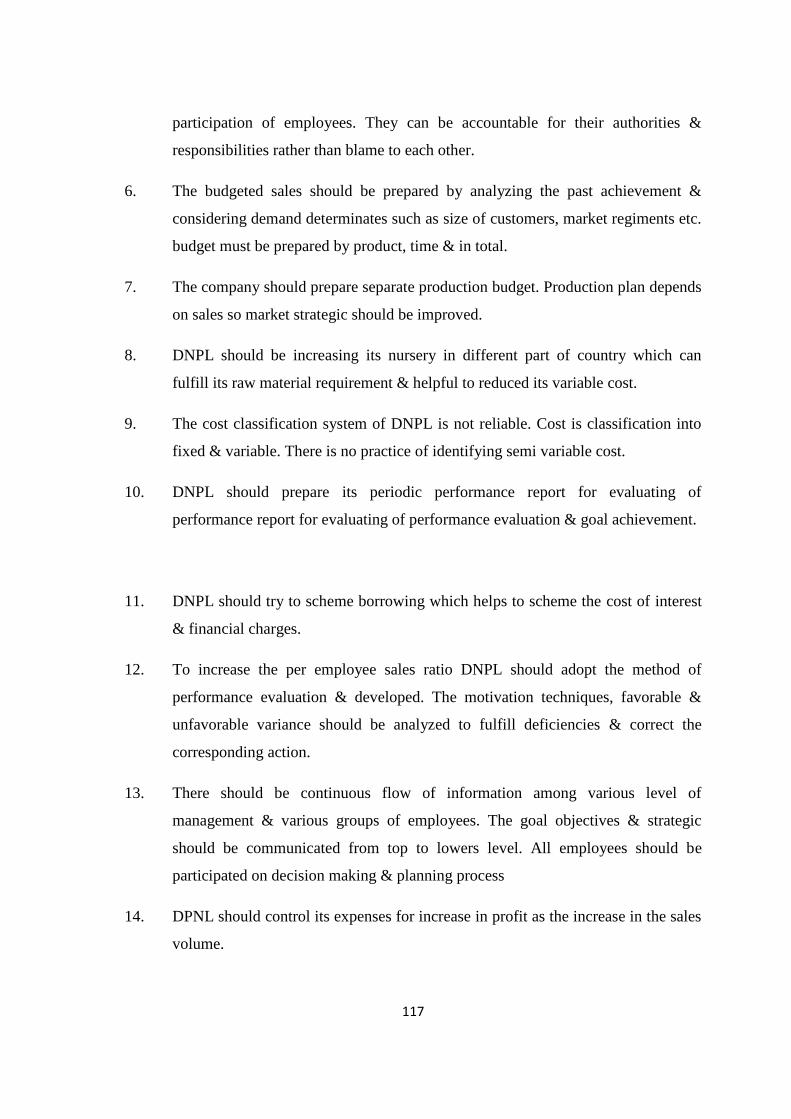
117
participation of employees. They can be accountable for their authorities &
responsibilities rather than blame to each other.
6. The budgeted sales should be prepared by analyzing the past achievement &
considering demand determinates such as size of customers, market regiments etc.
budget must be prepared by product, time & in total.
7. The company should prepare separate production budget. Production plan depends
on sales so market strategic should be improved.
8. DNPL should be increasing its nursery in different part of country which can
fulfill its raw material requirement & helpful to reduced its variable cost.
9. The cost classification system of DNPL is not reliable. Cost is classification into
fixed & variable. There is no practice of identifying semi variable cost.
10. DNPL should prepare its periodic performance report for evaluating of
performance report for evaluating of performance evaluation & goal achievement.
11. DNPL should try to scheme borrowing which helps to scheme the cost of interest
& financial charges.
12. To increase the per employee sales ratio DNPL should adopt the method of
performance evaluation & developed. The motivation techniques, favorable &
unfavorable variance should be analyzed to fulfill deficiencies & correct the
corresponding action.
13. There should be continuous flow of information among various level of
management & various groups of employees. The goal objectives & strategic
should be communicated from top to lowers level. All employees should be
participated on decision making & planning process
14. DPNL should control its expenses for increase in profit as the increase in the sales
volume.

118
15. Finally a systematic approach should be made towards effective implementation
of planning can be considerably contribute to increase profit.
16. Cost Volume Profit analysis, cost segregation analysis, cash management and the
inventory management should be the future study material.

119
BIBLIOGRAPHY
Acharya, Bishwas (2004), "Revenue Planning and Management of Manufacturing Companies in
Nepal: A Case Study of National Biscuits and Confectionary Pvt. Ltd. (NEBICO)",
Unpublished thesis Shanker Dev Campus, T.U., Kathamndu.
Amatya, Anjana (2004), "Budgeting in Manufacturing Concerned: A case study of Dabur Nepal
Pvt. Ltd.", Unpublished thesis Saraswoti Campus, T.U., Kathamndu.
Agrawal G.R. (2003), "Entrepreneurship Development in Nepal", Kathmandu: M.K. Publisher &
Distributors.
Bajrachrya, P.; Ojha, K.P.; Goet, J. and Sharma, S. (2004), "Managerial Accounting: Nepalese
Perspective", Kathmandu: Asmita Books Publishers and Distributors.
Bhattacharya, S.K. and Deardon, John (1980), "Accounting for Management: Text and Cases",
New Delhi: Vikas Publishing House Pvt. Ltd.
Bhattachrya, S. (1981), "Corporate Planning", New Delhi: Mohan Primani Oxford and IBH
Publish Co.
Bhusal, Lok Nath (30/11/2006), "Need for Development Planning Despite Failures",
Kathmandu", The Kathmandu Post, Vol. XIV, No. 330.
Central Bureau of Statistics, "Statistical Pocket Book In Nepal, 2006," GON-NPCS, CBS,
Kathmandu.
Central Bureau of Statistics "Nepal in Figure 2006", HMG/N-NPCS, CBS, Kathmandu
Dangol, R.M. & Prajapati, Keshav P. (2001) "Accounting for Financial Analysis and Planning",
Kathmandu: Taleju Prakashan.
Finney, H.A. and Miller, H.E. (1963), "Principles of Accounting" Englewood Eliffs", Printice Hall
Inc.

120
Garrison, Ray H. (1976), "Management Accounting: Concern for Planning, Control and Decision
Making", Business Publication Inc.
Ghos, P.K. and Gupta, G.S. (1979), "Fundamentals of Management Accounting", New Delhi:
National Publication House.
Ghosh, Asit Kumar and Kumar Prem (1991), "Corporate Planning and Management Control",
India: Anmol Publication.
Goet, J.; Bhattari, I. and Gautam, A. (2005), "Budgeting: Profit Planning and Control",
Kathmandu: Asmita Book Publishers and Distributors.
Dangol, Bishnu D. (20/7/2007), "Implementation Aspect of Budget", Kathmandu: The Kathmandu
Post, Vol. XV, No. 152.
Goet, Jogindar (1999), "Revenue Planning and Management in Nepal: A Case Study of Nepal
Electricity Authority", Unpublished thesis Shanker Dev Campus, T.U., Kathamndu.
Handerson, Glenn V.; Trenne Pohl; Gray, L. and Wert, James E. (1984), "An Introduction to
Financial Management, USA: Addisen Weley Publishing Co.
Horngren, Chrles T.; Garry L. Sundem an William O. Stratton (1998), "Introduction to
Management Accounting", New Delhi: Prentice Hall of India Private Limited.
Joshi, P.R. (2005), "Research Methodology", Kathmandu: Buddha Academic Enterprises Pvt .
Ltd.
Koontz, Horold and Dennel, Cyric, O. (1990), "Essential of Management", New York: Mc Graw
Hill Publishing Co.
Lekh Prasad (2006), "A Study on Revenue Planning in Manufacturing Enterprise: A Case study of
Royal Drugs Limited", Unpublished thesis Shanker Dev Campus, T.U., Kathamndu.
Lynch, Ricahrd M. and Robert W. Williamson (1983), "Accounting for Management: Planning
and Control", New York: Mc Graw Hill.
121
Manmohan and Goyal, S.N. (1992), "Principles of Management Accounting", Agra: Sahitya
Bhawan.
Niswonger, C. Rolloin and Fers, Philip E. (1983), "Accounting Principles, Cincinnati Chicago",
South Publishing House Pvt. Ltd.
National Planning Commission Scretariat, "Tenth Plan", GON-NPCS Kathmandu
Nepal Government (2000), "A Report on Performance of Privatized Enterprises", Kathmandu:
Ministry of Finance.
Nepal Government (2000), "Privatization in Nepal, Ministry of Finance", Privatization Cell.
Nepal Government (2006), "Economic Survey", Kathmandu: Central Bureau of Statistics,
National Planning Commission Secretariat.
Nepal, Prabes (2007) " Inventory Management of Herbs processing and production co. Ltd". Un
Published thesis Shanker Dev Campus, T.U., Kathamndu.
Pandey Ramesh, Shrestha Bijay, Singh Yamesh Man, et. al., (2005), "Accounting for Financial
Analysis & Planning", Buddha Academy Enterprises Pvt. Ltd.
Pant, P.R. (2000), "Fieldwork Assignment and Report Writing", Kathmandu: Buddha Academic
Enterprise Pvt. Ltd.
Panta, Lekh Prasad (2006), "A Study on Revenue Planning in Manufacturing Enterprise: A Case
study of Royal Drugs Limited", Unpublished thesis Shanker Dev Campus, T.U.,
Kathamndu.
Pathak, J.K. (1982), "Profitability in Nepalese Manufacturing Public Enterprises Management
Dynamics", Vol. 2, No. 1, Kathmandu: Shankar Dev Campus, T.U.
Regmi, Govinda Prasad (1994), "Industry Growth in Nepal", New Delhi: Oxford and IBN
Publishing Co. Pvt. Ltd.
122
Sharma Krishana Prasad (2006), "Revenue Planning & Management of Manufacturing Public
Enterprises: A case study of Singh Durbar Baidha Khana Bikash Samiti." Unpublished
thesis Shanker Dev Campus, T.U., Kathamndu.
Shrestha, Tulasi Prasad (2002), "Profit Planning in Sri Bhrikuti Pulp and Paper Nepal Limited",
Unpublished thesis Shanker Dev Campus, T.U., Kathamndu.
Sherilevar, S.A. (1983), "Business Planning and Policy", Bombay: Himalayan Publishing House.
Thapa, B.B. "Industrial Department in Nepal : Major Thrusts", The Weekly Mirror, Volume 423,
September, 1947, Kathmandu.
Van Horne, James C. (1996), "Financial Management and Policy", New Delhi: Prentice Hall of
India Pvt. Ltd.
Varma Dr. and Agrawal (1996), "Management Accounting", New Delhi, King Book Educational
Publishers.
Verin, Richard I. and Davi S. Rubin (1998), "Statistics for Management", Singapore: Pearson
Education Inc.
Welsch, Glen A. (1984), "Budgeting, Profit Planning and Control", New Delhi: Prentice Hall of
India Private Limited.
Welsch, Glen A.; Hilton, Ronald W.; Gorden, Paul N. (2000), "Budgeting Profit Planning and
Control", New Delhi, Prentice Hall of India Private Limited.
Weston, J.F. and Copeland, J.E. (1992), "Managerial Finance", Chicago: The Dryden Pres.

123
Wolf, Howard K. and Pant, Prem Raj (2002), "Social Science Research and Thesis Writing",
Kathmandu: Buddha Academic Enterprise Pvt. Ltd.
www.emeraldindight.com
www.daburnepal.com