malnutrition in zambia - save the children uk 7 nutrition pathway 3: health services and environment...
TRANSCRIPT

malnutrition in zambiaHarnessing social protection for the most vulnerable

Save the Children works in more than 120 countries. We save children’s lives. We fight for their rights. We help them fulfil their potential.
Published bySave the Children 1 St John’s LaneLondon EC1M 4ARUK+44 (0)20 7012 6400savethechildren.org.uk
First published 2016
© The Save the Children Fund 2016
The Save the Children Fund is a charity registered in England and Wales (213890) and Scotland (SC039570). Registered Company No. 178159
This publication is copyright, but may be reproduced by any method without fee or prior permission for teaching purposes, but not for resale. For copying in any other circumstances, prior written permission must be obtained from the publisher, and a fee may be payable.
Typeset by Grasshopper Design CompanyPrinted by Page Bros Ltd
AcknowledgementsThis report was written by Katherine Richards and Stephanie Bellack. Particular recognition should be given to Grace Kite for her work on the data analysis; to James Manley and Vanya Slavchevska for their work on the literature review; and to Emma Smail and Eleanor Percey for their work on governance.
Many individuals from a wide range of organisations in Zambia and internationally gave valuable time to tell us about their plans and experiences with nutrition-sensitive social protection. Many people contributed to this report by reviewing the research, sharing insights on the contextual analysis, and providing practical advice on tangible solutions to shape our recommendations. We are extremely grateful for all of these contributions.
Particular thanks go to the Zambian Civil Society Organisation for Scaling Up Nutrition Secretariat and the team at Save the Children Zambia for their significant contributions throughout, and to the participants of the research validation workshop (Lusaka, October 2015) for their critical guidance and recommendations.
Sincere thanks, for their inputs and efforts in reviewing this report, also go to Andrea Spray at World Bank’s Secure Nutrition initiative; Charlotte Harland-Scott in Zambia; Richard Morgan at the Save the Children Child Poverty Global Initiative; and Jody Harris at the International Food Policy Research Institute. This report has been greatly enriched by all of these contributions.
Cover photo: A child at Shimukunami rural health centre, Copperbelt province. Photo: Cleis Nordfjell/Save the Children
CONTENTS
Executive summary v
Abbreviations and acronyms x
Key terms xi
Introduction xii
Overview of the report xii
PART 1: SOCIAL PROTECTION FOR NUTRITION IN ZAMBIA 1
1 Why social protection and nutrition? 3
Why we must tackle child malnutrition 3 The potential of social protection 3 How social protection helps tackle hunger and malnutrition 4 International evidence on the impact of social protection 4 Social protection in Zambia 6
2 Malnutrition in Zambia 7
Overview of Zambia’s progress and outcomes on nutrition 7 Nutrition, poverty and inequality in Zambia 9 Benchmarking Zambia and other countries by stunting and disparities in stunting 12 Implications for nutrition-sensitive social protection in Zambia 14
PART 2: NUTRITIONAL PATHWAYS ANALYSIS: THE POTENTIAL OF SOCIAL PROTECTION FOR NUTRITION IN ZAMBIA 15
Methodology 16
3 Understanding the pathways approach 17
The nutrition pathways framework 17
4 Evidence of the impact of social protection on nutrition outcomes 20
Implications for nutrition-sensitive social protection in Zambia 21
5 Nutrition pathway 1: Household food security 23
Drivers of food insecurity in Zambia 23 Evidence of the impact of social protection on household food security 26 Implications for nutrition-sensitive social protection in Zambia 27
6 Nutrition pathway 2: Caring practices for women and children 29
Drivers of inadequate care for mothers and young children in Zambia 29 Women’s empowerment 31 Evidence of the impact of social protection on caring practices for women and children 32 Implications for nutrition-sensitive social protection in Zambia 33

iv
7 Nutrition pathway 3: Health services and environment 35
Environmental and healthcare-related drivers of malnutrition in Zambia 35 Evidence of the impact of social protection on health services and environment 40 Implications for nutrition-sensitive social protection in Zambia 42
PART 3: HOW TO DO NUTRITION-SENSITIVE SOCIAL PROTECTION 43
8 Social protection and nutrition policy development 45
Social protection policy in Zambia 45 Zambia’s Social Cash Transfer 46 Nutrition policy in Zambia 48 Implications for nutrition-sensitive social protection in Zambia 49
9 Building a social protection system 50
What does it take? 50
10 Design implications of nutrition-sensitive social protection 51
Linkages 51 International design principles for nutrition-sensitive social protection 52 Zambia’s Social Cash Transfer 54 How to make Zambia’s Social Cash Transfer nutrition-sensitive 54
11 Key aspects of governance for nutrition-sensitive social protection 59
Responsiveness 60 Multi-sector engagement 63 Robust institutional framework 66
12 Global priorities related to nutrition-sensitive social protection 70 Nutrition 70 Social protection 70 Across nutrition and social protection 72
13 Conclusions and recommendations for the development of nutrition-sensitive social protection in Zambia 73
Recommendations for the Social Cash Transfer 73 Recommendations for the wider development of nutrition-sensitive social protection in Zambia 76
Appendices 78
Appendix 1: Methodology 78 Appendix 2: Nutrition-sensitive social protection checklist 79 Appendix 3: Programmes included in literature review 83 Appendix 4: Data gaps 87
Literature review references 88
Endnotes 91
MA
LNU
TR
ITIO
N IN
ZA
MB
IA

v
Malnutrition prevents millions of Zambia’s children from reaching their potential. The rates of malnutrition – among the highest in the world – are reducing the country’s chances of achieving its aspiration to be a prosperous upper-middle-income country by 2030.1 Today, in 2016, more than 40% of Zambian children under five are stunted (low height-for-age) and 15% are underweight (low weight-for-age).
A number of non-contributory social protection programmes exist in Zambia, including the government’s Social Cash Transfer (SCT). Coverage of the SCT is increasing, with a growing number of beneficiaries (145,000 in 2014) and a rising budget. In 2015 it covered nearly half of Zambia’s districts and expansion plans continue, with the aim of achieving full national coverage by 2017.
International evidence shows that a nutrition-sensitive social protection programme can successfully contribute to the reduction of malnutrition. The scale-up of the SCT presents a unique opportunity to use social protection as a platform to improve chronic malnutrition (stunting) in Zambia. In this report we present recommendations for how it can be done, drawing on pathways analysis of the drivers of malnutrition in Zambia and experience of existing social protection programmes, alongside a review of the policy environment.
MALNUTRITION IN ZAMBIA
Stunting has been persistently high at over 40% in Zambia since 1992.2 The absolute number of children who are stunted has increased, from 685,000 in 1992 to 1.14 million in 2013.3 More than a quarter of Zambia’s children under five – 28% – are stunted.
POVERTY, INEQUALITY AND MALNUTRITION
Zambia has experienced strong progress on economic growth, at around 5% or 6% over the ten years up to 2015. This has been driven by increased copper production, high commodity prices and significant foreign direct investment.4 Yet, this growth has not resulted in commensurate change in incomes, poverty levels or employment, other than in particular urban settings.5 In 2016, Zambia’s economic environment is under pressure. Limited in power supply and a steep drop in copper prices have led to Zambia’s kwacha being labelled the world’s worst performing currency.6
Zambia’s vice-president Guy Scott stated in 2014 that economic growth is a key ingredient for reducing undernutrition in Zambia. However, in order to benefit human and social development, the proceeds from this growth must be effectively invested: “Investing in the most vulnerable members of our society – children under the age of two and their mothers – is a sure-fire way of turning fast economic growth into more meaningful growth, both economic and human.”7
Zambia’s economic growth is noted in the National Social Protection Policy to have been largely unequal, as reflected in one of the highest income Gini coefficients in the world of 57.5.8 In 2010, the bottom 50% of the population according to wealth accounted for 9.1% of the total income, while the top 10% by wealth accounted for 52.6%.9 Geographical inequalities are also stark: urban poverty has dropped from 40% to 26% since 1996, yet rural poverty, at around 78% in 2010, has changed very little from its level in 2006 (80%).10
These inequalities are reflected in the figures on – and children’s experiences of – malnutrition. Stunting levels are especially bad for the three poorest quintiles with more than 40% stunting prevalence, rising to
EXECUTIVE SUMMARY

vi
47% for the poorest quintile.11 Children in the poorest households are more than twice as likely to be underweight as children in the wealthiest households.12
Combatting undernutrition could bring great gains for Zambia and the investment case is strong. Research implies that money invested in nutrition interventions has a 17:1 ratio on average for return on investment in Zambia.13, 14 Also, research shows gross domestic product (GDP) totals in Africa are less than 90% of what they would be without undernutrition.15
THREE NUTRITION PATHWAYS
At the household and community levels, nutritional status is influenced by three pathways:
Household food security
A large number of Zambian households are classed as “extremely poor” – 42% in 2010 – in that they are unable to afford a “minimum food basket”.16 Around 53% of households cannot afford three meals a day.17 Households, particularly those in rural areas, are also very vulnerable to shocks that affect their supply of food18 and have very little ability to absorb the impact of negative shocks.19
Dietary diversity in Zambia is a major challenge. Children do not consume food from enough food groups, with only 22% of children age 6–23 months found to have sufficient dietary diversity according to infant and young child feeding guidelines.20 Generally, there is a nationwide focus on maize production, which some argue has “crowded out” diversification into more nutrient-dense food.21
Caring practices for women and children
The vast majority of babies in Zambia are not born stunted (chronically malnourished). Instead, most children under age five who become stunted do so between the ages of two months and two years.22
Breastfeeding rates are high, but so are incidences of related diseases such as diarrhoea which can be linked to early diversion from exclusive breastfeeding. Diarrhoea affected almost one-third of children aged 6–23 months in 2010. Of breastfed children aged 2–3 months, 7% in 2013 received some kind of solid or semi-solid food, and this proportion increased to 40% by age 4–5 months,23 showing the need to promote good habits, including exclusive breastfeeding up to six months.24
The proportion of children aged 6–23 months receiving minimum adequate feeding is alarmingly low, at 11% across all Zambia and 7% in the lowest wealth quintile. Only 42% of children in this age group ate often enough.25
Health services and environment
Poor water and sanitation are particular concerns. In rural areas, 19% of the population uses surface water for drinking. Similarly, 22% of the rural population practices open defecation, leaving them vulnerable to infections transmitted by faeces.26 Lack of access to clean water is a key factor in the persistence of chronic malnutrition in Zambia. While the Zambia Child Grant Programme – a cash transfer programme – was found to reduce stunting rates by 9 percentage points in households that had access to clean water, it did not reduce stunting at all in those households without access to clean water.27
A well-designed social protection system has the potential to affect positively all issues outlined above. It provides a channel through which the government of Zambia can redistribute income and resources and share the benefits of growth28 to improve nutrition for the poorest children, as well as providing a safety net for those who need it most. For Zambia, the SCT has strong potential to be used as a nutrition-sensitive tool addressing chronic malnutrition (stunting).
HOW SOCIAL PROTECTION CAN HELP TACKLE CHILD MALNUTRITION
Positive results for nutrition are most likely when social protection systems consider children’s needs from the outset, and when the 1,000 days between a woman conceiving and her child’s second birthday are targeted (see section ‘The importance of the first 1,000 days’ on page 3).
Within social protection policies and systems, nutrition-focused interventions or programmes tackle the underlying causes of malnutrition through three pathways: • household food security • caring practices for women and children • health services and environment.29
MA
LNU
TR
ITIO
N IN
ZA
MB
IA
EXEC
UT
IVE SU
MM
ARY
vii
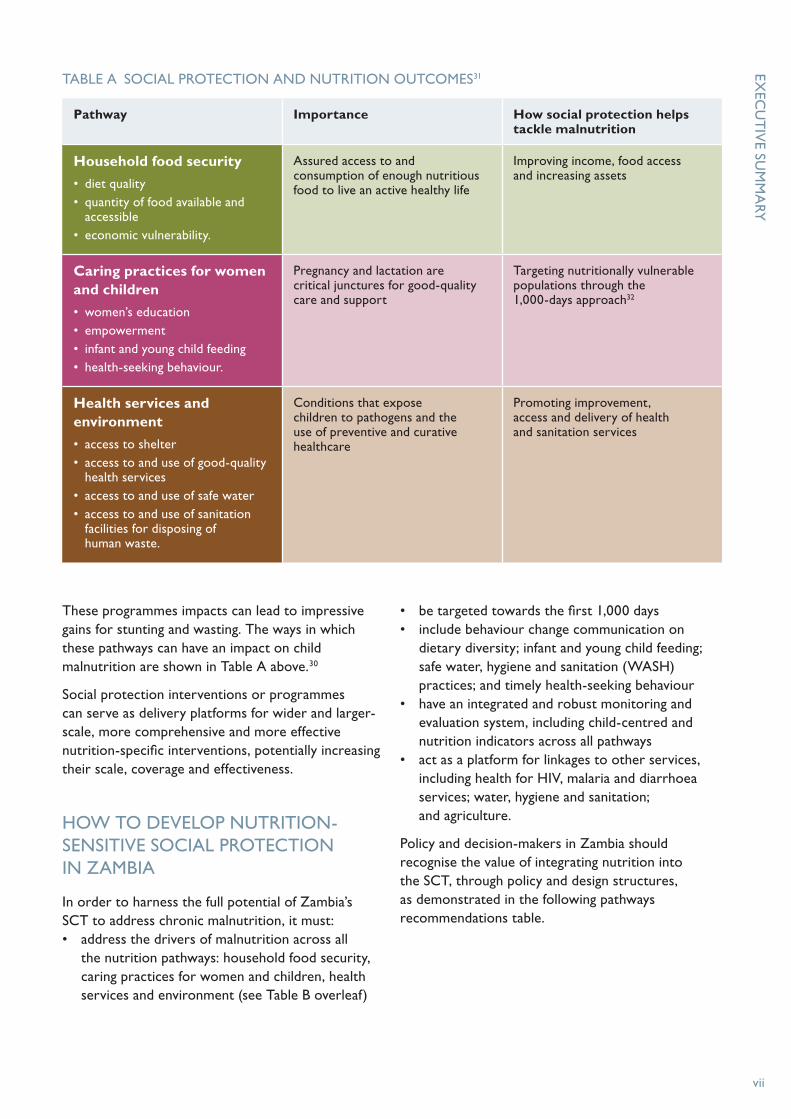
These programmes impacts can lead to impressive gains for stunting and wasting. The ways in which these pathways can have an impact on child malnutrition are shown in Table A above.30
Social protection interventions or programmes can serve as delivery platforms for wider and larger-scale, more comprehensive and more effective nutrition-specific interventions, potentially increasing their scale, coverage and effectiveness.
HOW TO DEVELOP NUTRITION-SENSITIVE SOCIAL PROTECTION IN ZAMBIA
In order to harness the full potential of Zambia’s SCT to address chronic malnutrition, it must: • address the drivers of malnutrition across all
the nutrition pathways: household food security, caring practices for women and children, health services and environment (see Table B overleaf)
• be targeted towards the first 1,000 days• include behaviour change communication on
dietary diversity; infant and young child feeding; safe water, hygiene and sanitation (WASH) practices; and timely health-seeking behaviour
• have an integrated and robust monitoring and evaluation system, including child-centred and nutrition indicators across all pathways
• act as a platform for linkages to other services, including health for HIV, malaria and diarrhoea services; water, hygiene and sanitation; and agriculture.
Policy and decision-makers in Zambia should recognise the value of integrating nutrition into the SCT, through policy and design structures, as demonstrated in the following pathways recommendations table.
TABLE A SOCIAL PROTECTION AND NUTRITION OUTCOMES31
Pathway Importance How social protection helps tackle malnutrition
Household food security
• diet quality• quantity of food available and
accessible• economic vulnerability.
Assured access to and consumption of enough nutritious food to live an active healthy life
Improving income, food access and increasing assets
Caring practices for women and children
• women’s education• empowerment• infant and young child feeding• health-seeking behaviour.
Pregnancy and lactation are critical junctures for good-quality care and support
Targeting nutritionally vulnerable populations through the 1,000-days approach32
Health services and environment
• access to shelter• access to and use of good-quality
health services • access to and use of safe water• access to and use of sanitation
facilities for disposing of human waste.
Conditions that expose children to pathogens and the use of preventive and curative healthcare
Promoting improvement, access and delivery of health and sanitation services
viii
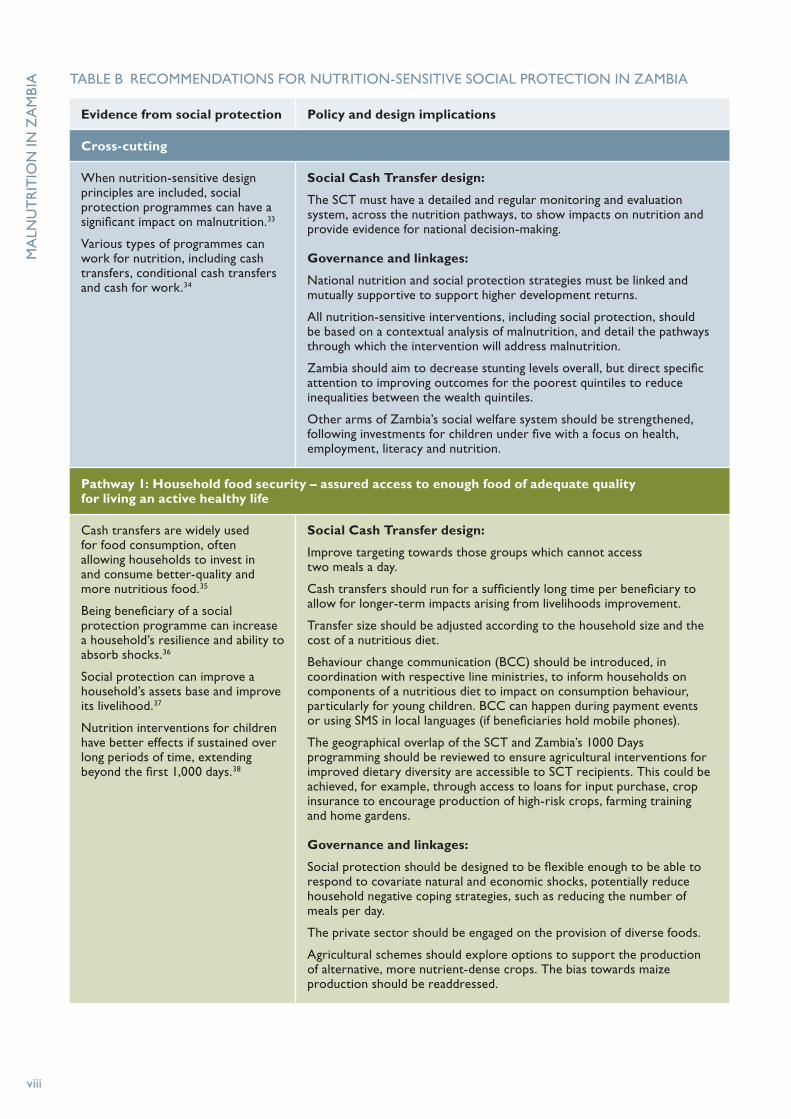
TABLE B RECOMMENDATIONS FOR NUTRITION-SENSITIVE SOCIAL PROTECTION IN ZAMBIA
Evidence from social protection Policy and design implications
Cross-cutting
When nutrition-sensitive design principles are included, social protection programmes can have a significant impact on malnutrition.33
Various types of programmes can work for nutrition, including cash transfers, conditional cash transfers and cash for work.34
Social Cash Transfer design:
The SCT must have a detailed and regular monitoring and evaluation system, across the nutrition pathways, to show impacts on nutrition and provide evidence for national decision-making.
Governance and linkages:
National nutrition and social protection strategies must be linked and mutually supportive to support higher development returns.
All nutrition-sensitive interventions, including social protection, should be based on a contextual analysis of malnutrition, and detail the pathways through which the intervention will address malnutrition.
Zambia should aim to decrease stunting levels overall, but direct specific attention to improving outcomes for the poorest quintiles to reduce inequalities between the wealth quintiles.
Other arms of Zambia’s social welfare system should be strengthened, following investments for children under five with a focus on health, employment, literacy and nutrition.
Pathway 1: Household food security – assured access to enough food of adequate quality for living an active healthy life
Cash transfers are widely used for food consumption, often allowing households to invest in and consume better-quality and more nutritious food.35
Being beneficiary of a social protection programme can increase a household’s resilience and ability to absorb shocks.36
Social protection can improve a household’s assets base and improve its livelihood.37
Nutrition interventions for children have better effects if sustained over long periods of time, extending beyond the first 1,000 days.38
Social Cash Transfer design:
Improve targeting towards those groups which cannot access two meals a day.
Cash transfers should run for a sufficiently long time per beneficiary to allow for longer-term impacts arising from livelihoods improvement.
Transfer size should be adjusted according to the household size and the cost of a nutritious diet.
Behaviour change communication (BCC) should be introduced, in coordination with respective line ministries, to inform households on components of a nutritious diet to impact on consumption behaviour, particularly for young children. BCC can happen during payment events or using SMS in local languages (if beneficiaries hold mobile phones).
The geographical overlap of the SCT and Zambia’s 1000 Days programming should be reviewed to ensure agricultural interventions for improved dietary diversity are accessible to SCT recipients. This could be achieved, for example, through access to loans for input purchase, crop insurance to encourage production of high-risk crops, farming training and home gardens.
Governance and linkages:
Social protection should be designed to be flexible enough to be able to respond to covariate natural and economic shocks, potentially reduce household negative coping strategies, such as reducing the number of meals per day.
The private sector should be engaged on the provision of diverse foods.
Agricultural schemes should explore options to support the production of alternative, more nutrient-dense crops. The bias towards maize production should be readdressed.
MA
LNU
TR
ITIO
N IN
ZA
MB
IA

EXEC
UT
IVE SU
MM
ARY
ix
Evidence from social protection Policy and design implications
Pathway 2: Caring practices for women and children – pregnancy and lactation are critical junctures for good-quality care and support
The 1,000 days between a woman’s pregnancy and her child’s second birthday is a critical period for nutrition interventions to target.39
The education level and age of the mother influence the nutrition status of the child: the better educated and older the mother, the better the nutrition status of the child.40
Social Cash Transfer design:
Target the critical window of the first 1,000 days: pregnant/lactating women and children under two years old.
Include BCC as a soft condition of the SCT, with a focus on infant and young child feeding practices, in particular on exclusive breastfeeding for the first six months and dietary diversity for children aged six to 24 months.
Include monitoring of infant and young child feeding practices within the SCT framework to show the impact of BCC.
Promote gender inclusivity across all behaviour change communication activities by including men and boys alongside women and girls.
Encourage completion of secondary education for adolescents, particularly girls, as a minimum.
Pathway 3: Health services and environment – conditions children’s exposure to pathogens and the use of preventive and curative healthcare
If combined with access to safe water, social protection programmes can have a huge impact on nutrition.41
Social protection programmes can encourage timely health-seeking behaviour.42
Social Cash Transfer design:
Include BCC on safe water, hygiene and sanitation (WASH) practices, and timely health-seeking behaviour.
Include monitoring of WASH and health-seeking behaviour indicators within the SCT framework to show the impact of behaviour change communication.
Governance and linkages:
The geographical overlap of the SCT and Zambia’s 1000 Days programming should be reviewed to promote linkages between the SCT and WASH programmes that provide access to safe drinking water specifically in rural areas, and health programmes focusing on malaria, diarrhoea and HIV and AIDS.
Access to health services at local levels should be reviewed at district level, with particular attention given to communities with the largest distance to basic health centres.
TABLE B RECOMMENDATIONS FOR NUTRITION-SENSITIVE SOCIAL PROTECTION IN ZAMBIA continued

x
AIDS Acquired immunodeficiency syndrome
ART Antiretroviral therapy
BCC Behaviour change communication
CSO Civil society organisation
DHS Demographic and Health Survey
FAO Food and Agriculture Organization
GDP Gross domestic product
GRID Groups and Inequality Database
GRZ Government of the Republic of Zambia
HANCI Hunger and Nutrition Commitment Index
HIV Human immunodeficiency virus
ILO International Labour Organization
IYCF Infant and young child feeding
JMP Joint Monitoring Programme
LCMS Living Conditions Monitoring Survey
MCDMCH Ministry of Community Development, Mother and Child Health
MDG Millennium Development Goal
MOH Ministry of Health
NFNC National Food and Nutrition Commission
NFNSP National Food and Nutrition Strategic Plan
NGO Non-governmental organisation
NSSP National Social Protection Policy
PWAS Public Welfare Assistance Scheme
SCT Social Cash Transfer
SDG Sustainable Development Goal
SP-SAG Sector Advisory Group on Social Protection
SUN Scaling Up Nutrition
UNICEF United Nations Children’s Fund
UNSCN United Nations Standing Committee on Nutrition
WASH Water, sanitation and hygiene
WFP World Food Programme
WHO World Health Organization
ABBREVIATIONS AND ACRONYMS

xi
1,000-day window
The 1,000-day period between a woman’s pregnancy and her child’s second birthday. The right nutrition during this critical period can have a profound impact on a child’s ability to grow, learn and rise out of poverty. It can also shape a society’s long-term health, stability and prosperity.43
Hunger
Hunger is the body’s way of signalling that it is running short of food and needs to eat something. It can lead to undernutrition, although it is only one of many causes, which include diarrhoea, malaria and HIV and AIDS.44
Malnutrition
Malnutrition is a broad term commonly used as an alternative to undernutrition but technically it also refers to overnutrition. People are malnourished if their diet does not provide adequate calories and protein for growth and maintenance or they are unable to fully utilise the food they eat due to illness (undernutrition). They are also malnourished if they consume too many calories (overnutrition).45
Nutrition-sensitive interventions
Nutrition-sensitive interventions target the underlying determinants of nutrition, affecting the broader context of life and health, and enhancing the coverage and effectiveness of nutrition-specific interventions.46 Nutrition-sensitive interventions that have significant potential include social protection, agriculture and women’s empowerment (including girls’ education).
Undernutrition
Undernutrition is defined as the outcome of insufficient food intake and repeated infectious diseases. It includes being underweight for one’s age, too short for one’s age (stunted), dangerously thin for one’s height (wasted), and deficient in vitamins and minerals (micronutrient malnutrition).47
KEY TERMS

xii
Malnutrition prevents millions of Zambia’s children from reaching their potential. The rates of malnutrition – among the highest in the world – are reducing the country’s chances of achieving its aspiration to be a prosperous upper-middle-income country by 2030.48 An estimated 40% of children under five in Zambia are stunted (low height-for-age) and 15% are underweight (low weight-for-age).49 Children in the poorest households are more than twice as likely to be underweight as children in the wealthiest households.50
Social protection is a crucial tool in combatting poverty, in tackling inequalities and breaking inter-generational poverty traps.51 It is a mechanism through which human rights can be realised and a means for states to protect their most vulnerable citizens. This is recognised in the Universal Declaration of Human Rights, the United Nations Convention on the Rights of the Child, the International Labour Organization’s (ILO) constitution, and legal instruments on social security.
Universal social protection, as the integrated set of policies designed to ensure income security and support to all people across the life cycle, is a global aim promoted by the ILO and World Bank. Anyone who needs social protection should be able to access it.52 However, social protection is far from the norm for most of the world’s population: 73% of the world’s population are covered partially or not at all.53 In Zambia, social protection provision, through targeted programming, covered 1.6% of the total population and 14.8% of the poorest quintile in 2010.54
A number of non-contributory social protection programmes exist in Zambia, including the government’s Social Cash Transfer (SCT). The effective scope of
social protection coverage is low. Due to limited resources and low capacity, it only reaches a small portion of the poor and vulnerable groups it intends to cover. Coverage, however, is increasing, with a growing number of beneficiaries (145,000 in 2014) and a rising budget. In 2015 the SCT covered nearly half of Zambia’s districts and expansion plans continue, with the aim of achieving full national coverage by 2017.
The scale-up of the SCT presents a unique opportunity to improve nutrition in Zambia. In this report we explore how it can be done.
OVERVIEW OF THE REPORT
Part 1 of this report examines the potential of social protection for nutrition in Zambia. Part 2 sets out the issues we need to consider. It examines the results of our literature review on the impact of Zambian and worldwide social protection programmes on nutrition outcomes and pathways. It summarises the context in Zambia for each pathway, considers the known impacts of social protection, and draws conclusions. Part 3 makes recommendations for the development of social protection programmes, with focus on the SCT for Zambia, and systems to improve nutrition.
The major pathways to nutrition outcomes are demonstrated by evidence for nutrition-sensitive social protection. This allows us to make knowledgeable recommendations for policy and programme development in Zambia and to inform global learning.
This reports builds upon the approaches set out in Malnutrition in Bangladesh: Harnessing social protection for the most vulnerable, which was published by Save the Children in February 2015.
INTRODUCTION

PART 1
A mother and child at Chisannina primary healthcare unit, which is part of the Lufwanyama Integrated and Child Health Project
PHO
TO
: CLEIS N
OR
DFJELL/SA
VE T
HE C
HILD
REN
SOCIAL PROTECTION FOR NUTRITION IN ZAMBIA

In this section we:
• explain why we are focusing on social protection and nutrition
• consider the definitions
• summarise the current situation for nutrition-sensitive social protection in Zambia, including progress to date on malnutrition.
Mirium, with her children who are beneficiaries of the Lufwanyama Integrated and Child Health Project
PHO
TO
: CLEIS N
OR
DFJELL/SA
VE T
HE C
HILD
REN

3
WHY WE MUST TACKLE CHILD MALNUTRITION
THE IMPORTANCE OF THE FIRST 1,000 DAYS
Maternal and child malnutrition is the underlying cause of 45% of preventable child deaths55 and, for those children who survive, malnutrition is likely to have irreversible, lifelong consequences for a child’s physical and cognitive development. Evidence shows that up to 70% of stunting takes place before a child’s second birthday.56 Maximising the unique window of opportunity between conception and a child’s second birthday – the first 1,000 days – helps shape healthier and more prosperous futures. The right nutrition during this period can have a profound impact on a child’s ability to grow, learn and rise out of poverty.
During this period of the first 1,000 days, malnutrition affects the structural and functional development of the brain, directly affecting cognitive development.57 Malnutrition58 also has an indirect impact, affecting the ways children learn and their ability to interact and engage with the world. Good maternal nutrition is essential: pregnant or breastfeeding mothers who cannot access the right nutrients are more likely to have children with compromised brain development and poor cognitive performance. Once the child is born, nutrition continues to play a key role in ensuring that the brain develops properly.
A high return on investment
Ensuring the right nutrition during those first 1,000 days can also help shape a society’s long-term health, stability and prosperity.59 Children who are malnourished earn 20% less as adults than children who are well nourished.60 The effects of malnutrition on physical stature, cognitive development and the ability to do physical work can lock children into poverty and entrench inequality. Malnutrition can therefore act as a significant barrier to economic growth. According to the World Bank, improving nutrition enough to eliminate anaemia in
working adults results in a 5–17% increase in adult productivity, increasing the national income growth by up to 2%.61
The resulting human and economic cost of malnutrition is huge. With a long-term impact on productivity, hunger and undernutrition reduce global gross domestic product (GDP) by 2–3% and cost the world up to US$2.1 trillion in lost global GDP.62 The Copenhagen Consensus,63 which involves hundreds of economists evaluating the returns to investing in a variety of social goods, calls fighting malnutrition a ‘phenomenal’ investment, putting it in the top category of investments.
THE POTENTIAL OF SOCIAL PROTECTION
Investing in social protection brings multiple gains – including long-term gains – for individuals and societies as a whole. When designed well, social protection can:• address poverty and provide protection against
vulnerability and exclusion• empower the most vulnerable people• offer a means to cope with major risks
throughout the lifecycle• reduce people’s vulnerability to global challenges
such as aggregate economic shocks, instability in the price of food or other essential commodities, and climate change
• contribute to inclusive growth, social cohesion and broader national social-economic development and security.64
Social protection can also increase the effectiveness of investments in nutrition, health, education, and water and sanitation and enhance outcomes for children. Cash transfer programmes, like Zambia’s Social Cash Transfer (SCT), are an increasingly popular social protection tool due to their ability to deliver direct cash to households, usually targeted to poor and vulnerable groups.65
1 WHY SOCIAL PROTECTION AND NUTRITION?

4
HOW SOCIAL PROTECTION HELPS TACKLE HUNGER AND MALNUTRITION
Positive results for nutrition are most likely when social protection systems consider children’s needs from the outset and when the 1,000-day period between conception and a child’s second birthday is targeted (see page 3).
Within social protection policies and systems, nutrition-focused interventions or programmes tackle the underlying causes of malnutrition (see ‘Understanding the pathways approach’ on page 17) through three pathways: • household food security• caring practices for women and children• health services and environment.66
These programmes can lead to impressive gains for stunting and wasting. The ways in which these pathways can have an impact on child malnutrition are shown in Table 1 below.67
Social protection interventions or programmes can serve as delivery platforms for larger-scale, more
comprehensive and more effective nutrition-specific interventions.
Nutrition-sensitive social protection programmes also help tackle both the immediate and the underlying causes of malnutrition by reducing vulnerability, challenging discrimination and exclusion, protecting productive assets, and ensuring that basic needs can be met. Nutrition-sensitive social protection has an important role to play in addressing children’s needs – and in addressing children’s needs throughout the lifecycle.
Nutrition-sensitive social protection and the three pathways are explored in detail in Part 2 of this report.
INTERNATIONAL EVIDENCE ON THE IMPACT OF SOCIAL PROTECTION
Social protection initiatives across a number of countries show strong evidence of positive impacts on both hunger and malnutrition. In Africa, Asia and Latin America, cash transfers have been shown to improve both the quantity and the diversity
TABLE 1 SOCIAL PROTECTION AND NUTRITION OUTCOMES68
Pathway Importance How social protection helps tackle malnutrition
Household food security
• diet quality• quantity of food available and
accessible• economic vulnerability.
Assured access to and consumption of enough nutritious food to live an active healthy life
Improving income, food access and increasing assets
Caring practices for women and children
• women’s education• empowerment• infant and young child feeding• health-seeking behaviour.
Pregnancy and lactation are critical junctures for good-quality care and support
Targeting nutritionally vulnerable populations through the 1,000-days approach69
Health services and environment
• access to shelter• access to and use of good-quality
health services • access to and use of safe water• access to and use of sanitation
facilities for disposing of human waste.
Conditions that expose children to pathogens and the use of preventive and curative healthcare
Promoting improvement, access and delivery of health and sanitation services
MA
LNU
TR
ITIO
N IN
ZA
MB
IA

1 WH
Y SO
CIA
L PROT
ECT
ION
AN
D N
UT
RIT
ION
?
5
of food consumption, as well as to protect food consumption during shocks or lean periods.70 For example, Ghana’s Livelihood Empowerment Against Poverty cash transfer programme saw reductions of 25 percentage points in perceived food insecurity for families, and of 32 percentage points for families headed by women.71
Improved nutrition from social protection programmes also contributes to better physical
development for children, demonstrated by programmes in Mexico, Malawi and Colombia that show reductions in the number of children with stunted growth.72, 73 For example, with Malawi’s Mchinji Social Cash Transfer scheme stunting among child participants decreased from 55% to 46%.74 Children in South African households receiving a pension grow, on average, five centimetres taller than those in households without a pension.75
DEFINITIONS
NUTRITION-SENSITIVE SOCIAL PROTECTION
Nutrition-sensitive social protection refers to the interventions or programmes within social protection policies and systems that integrate a nutrition objective and address the underlying determinants of foetal, young child and adolescent growth and development.
NUTRITION-SPECIFIC INTERVENTIONS
Nutrition-specific interventions target the immediate causes of undernutrition, for example, inadequate dietary intake and ill-health.76
SOCIAL PROTECTION
Social protection is a set of public policies, programmes and systems that help poor and vulnerable individuals and households to: • reduce their economic and social
vulnerabilities
• improve their ability to cope with risks and shocks
• enhance their social rights and status.
Social protection initiatives provide: • social assistance to poor, vulnerable and
excluded individuals and households, which may include non-contributory cash transfers, in-kind transfers or a combination
• social insurance, such as unemployment benefits and health insurance, to protect people against the risks and consequences of livelihood shocks, including unemployment, climate disasters, conflict, economic crises, and large-scale health risks.
In addition, relevant national legislation, policies and regulations – such as maternity policy – are essential measures to address legal, social, cultural and economic barriers to social protection programmes and basic services.77
TABLE 2 SOCIAL PROTECTION THROUGH THE LIFECYCLE
Lifecycle stage Example of social protection
Pregnancy and early childhood Maternity grants, child grants
School-age children Child grants, education stipends, family allowances/conditional cash transfers, school feeding
Youth Education/training stipends, employment guarantee schemes
Working age Employment guarantee schemes/public works, family allowances
Old age Pensions

6
SOCIAL PROTECTION IN ZAMBIA
The Government of the Republic of Zambia, in the National Social Protection Policy (2014),78 defines social protection as: “Policies and practices that protect and promote the livelihoods and welfare of people suffering from critical levels of poverty and deprivation and/or [who] are vulnerable to risks and shocks.”
The Zambian government has, over a decade or more, introduced a range of social protection interventions, including social cash transfers, school bursaries, disability and old-age grants, maternity grants, and fertiliser subsidies.79
SOCIAL PROTECTION SYSTEMS
Social protection should be designed and implemented through a systems approach, where all actors coordinate in support of strategies, policies and programmes underpinned by the national vision. The role of government in developing, implementing and financing social protection is critical in order to ensure long-term sustainability of policies, guided by national vision. National systems can comprise non-governmental social protection schemes alongside those that are government-led.
To be effective, social protection should be complemented by wider policy reforms to address the causes of poverty, improve the quality and scale of healthcare, education and other basic services, and promote social equity and inclusion.
Peter (second right) at home with his mother and younger siblings in Lufwanyama district, Copperbelt province
PHO
TO
: CLEIS N
OR
DFJELL/SA
VE T
HE C
HILD
REN
MA
LNU
TR
ITIO
N IN
ZA
MB
IA

7
Before we delve into our pathways analysis, we need to understand the wider nutrition context that social protection needs to address in Zambia. In this section, we explore nutrition progress through an equalities lens, compared with other African countries, and highlight the places where the problems underlying poor nutrition outcomes are worst.
OVERVIEW OF ZAMBIA’S PROGRESS AND OUTCOMES ON NUTRITION
Stunting has been persistently high in Zambia for more than two decades, as shown by data since 1992 (see Figure 1). Rates only dropped by 6 percentage points from 46% to 40% between 1992 and 2013. Given population growth, the absolute number
of children who are stunted has increased, from 685,000 in 1992 to 1.14 million in 2013. Stunting rates climbed to 48% in 1996 and then to a peak of 53% in 2002, coinciding with the peak of HIV infection in the pre-treatment era.
The percentage of children under five who are underweight followed a broadly similar pattern of increasing during the 1990s, and then beginning to fall (see Figure 2). Wasting has remained constant at between 5% and 6%.80
However, acute malnutrition (very low weight for height) may pose a greater threat than these figures suggest. Globally, acute malnutrition is recognised to increase mortality.81 Recent research by Every Child Fed82 found that severe acute malnutrition in Zambia comes with a 40% mortality rate. An even higher mortality rate, 46%, was found among children under five with severe acute malnutrition who were admitted to hospital, with diarrhoea and pneumonia,
2 MALNUTRITION IN ZAMBIA
Source: Zambia DHS 1992, 1996, 2002, 2007, 2013–14
Notes: To be stunted a child must have height less than two standard deviations below the median for their age from the reference population. All stunting rates quoted in this report use the 2006 World Health Organization reference populations.
FIGURE 1 PROGRESS ON STUNTING IN ZAMBIA
Stu
nti
ng
rate
, % o
f all
child
ren
un
der
5
60
50
40
30
20
10
0 1992 1995 1998 2001 2004 2007 2010 2013
46%48%
53%
45%
40%

8
the most common co-morbidities.83 Treatment in Zambia is hampered as the availability and use of therapeutic foods is patchy and inconsistent.84
When we examine stunting and wasting prevalence across provinces (regions), we see that provinces with the highest stunting (Northern, Muchinga, Eastern)
are not the same as the provinces with the highest wasting (Luapula, North-Western) (see Figure 3). Regional variations in wasting are likely to be due to recent weather and its impact on crops and harvests, whereas variations in stunting are driven more by the underlying causes (see page 19). This distinction means interventions, such as nutrition-sensitive
Source: Zambia DHS 2013–14: 161
FIGURE 2 TRENDS IN WASTING, UNDERNUTRITION AND OVERWEIGHT%
of c
hild
ren
un
der
5
25
20
15
10
5
0 Wasting Underweight Overweight
21%
1992
1996
2002
2007
2013
19%
23%
15% 15%
6%5%
6%5%
6%
1% 1% 1% 1% 1%
Source: Zambia DHS 2013–14: 161
FIGURE 3 STUNTING AND WASTING BY PROVINCE
% o
f all
child
ren
un
der
5
60
50
40
30
20
10
0
Copperbel
t
36%
Stunting
Wasting
Lusaka
Nort
h-Wes
tern
Wes
tern
Centr
al
Souther
n
Easte
rn
Luapula
Nort
hern
Much
inga
36% 36% 37% 37%
7% 6% 7%8%
4% 5%
13%
5% 4% 4%
43% 43% 43% 44%
49%
MA
LNU
TR
ITIO
N IN
ZA
MB
IA

2 MA
LNU
TR
ITIO
N IN
ZA
MB
IA
9
social protection, must be clear on which measure of undernutrition is being targeted, as these two measures identify different problems and priorities.
Micronutrient malnutrition is also high in Zambia: 15% of children under five are zinc deficient, 20% are vitamin A deficient, 21% are iron deficient and 87% are deficient in vitamin B12.85
NUTRITION, POVERTY AND INEQUALITY IN ZAMBIA
ECONOMIC GROWTH IS NOT A MAGIC BULLET FOR NUTRITION
Zambia’s progress on economic growth, at around 5–6% over a ten-year period, has been driven by increased copper production, high commodity prices and significant foreign direct investment.86 Yet this growth has not resulted in commensurate change in incomes, poverty levels or unemployment rates, other than in a few selected urban settings.87 In 2016, Zambia’s economic environment is under pressure. Limited power supply and a steep drop in copper prices have led to Zambia’s kwacha being labelled the world’s worst performing currency.88
As the vice-president of Zambia, Guy Scott, stated in 2014, economic growth is a key ingredient for reducing undernutrition in Zambia. However, to benefit human and social development, the proceeds from this growth must be effectively invested: “Investing in the most vulnerable members of our society – children under the age of two and their mothers – is a sure-fire way of turning fast economic growth into more meaningful growth, both economic and human.”89
Zambia’s economic growth is noted in the National Social Protection Policy to have been largely unequal, as reflected in one of the highest income Gini coefficients in the world of 57.5.90 In 2010, the bottom 50% of the population according to wealth accounted for 9.1% of the total income, while the top 10% by wealth accounted for 52.6%.91 Geographical inequalities are also stark: urban poverty has dropped from 40% to 26% since 1996, yet rural poverty, at around 78% in 2010, has changed very little from its level in 2006 (80%).92
Looking at the links between economic measures and stunting across countries, we find countries with high stunting are often the same ones with low GDP per capita (see Figure 4). Stunting is higher in Zambia
Source: Save the Children’s own calculations based on DHS and World Development Indicators
Notes: The chart is a scatter plot including 203 country/year combinations, comparing stunting in that country year to GDP per capita. GDP per capita is measured at purchasing power parity, in current international $.
FIGURE 4 STUNTING RATE vs. GDP PER CAPITA ACROSS ALL COUNTRIES AND YEARS IN GRID93
Ove
rall
stu
nti
ng
rate
, nat
ion
al (
%)
70
60
50
40
30
20
10
0 0 2,000 4,000 6,000 8,000 10,000 12,000 14,000 16,000 18,000 20,000
GDP per capita (PPP, $2005)
Malawi, 2010Mozambique, 2011Tanzania, 2010
Zambia, 2013DRC, 2013Zimbabwe, 2010
Namibia, 2013

10
than we would expect, given its level of GDP per capita – as demonstrated in Figure 4 with Zambia positioned well above the ‘line of best fit’.
Evidence from other countries – and Zambia’s own history – shows that economic growth alone is not enough to tackle hunger and malnutrition. At a global level, the last 23 years have seen a huge increase in real GDP per head and the number of people living on less than $1.25 per head has dramatically reduced. However, the number of people eating too few calories to sustain an active life has fallen relatively slowly – only half as fast as poverty.96
Without active government leadership and proactive intervention, the benefits of growth cannot be expected to translate into increased food budgets in the most disadvantaged households, let alone dramatic improvements in malnutrition.97
WHICH GROUPS ARE FURTHEST BEHIND?
In order to understand Zambia’s malnutrition burden and how to reach the children who are ‘hardest to reach’ or have been ‘left behind’, we examine stunting rates by group drawing upon the Groups and Inequality Database.
In Zambia, the groups with the highest stunting rate are: • Northern Province, with a 49% stunting rate• the bottom quintile by wealth, with a 47%
stunting rate.
The poorest 40% by wealth is only marginally better at 45%, and Eastern Province is the fourth worst group, with 43% (see Figure 5 opposite).
Wealthier Zambians are less likely to be stunted, but stunting rates do not reduce quickly with wealth. All but the top wealth quintile in Zambia have stunting rates of 38% or over (see Figure 6 opposite).
ZAMBIA’S NUTRITION INVESTMENT CASE
Combatting undernutrition could bring great gains for Zambia.
Research shows gross domestic product (GDP) totals in Africa are less than 90% of what they would be without undernutrition.94
Scaling up nutrition-specific interventions to 90% coverage to tackle stunting would have a benefit–cost ratio in Zambia of 17 to 1. In other words, for every kwacha invested, at the median, 17 will be returned.95
GRID
The Groups and Inequality Database (GRID) was developed by Save the Children and is designed to monitor group-based inequality across developing countries in key dimensions of children’s rights and well-being, including child mortality, malnutrition, and water, sanitation and hygiene (WASH). GRID is based on direct processing of raw data from Demographic and Health Surveys (DHS), and it contains results from 257 nationally representative household surveys. GRID currently includes more than 90 developing countries (for up to seven points in time).
Through GRID, data can be disaggregated to measure and monitor disparities across the following groups: • boys/girls• urban/rural• subnational regions• ethno-linguistic groups • socioeconomic groups (measured with
the wealth index).
MA
LNU
TR
ITIO
N IN
ZA
MB
IA

2 MA
LNU
TR
ITIO
N IN
ZA
MB
IA
11
Source: Save the Children’s own calculations, based on DHS
FIGURE 5 STUNTING RATE BY GROUP
0 10 20 30 40 50 60
Group level stunting rate, 2013
Northern Province
Quintile 1 (poorest)
Poorest 40% by wealth
Eastern Province
Muchinga Province
Bemba ethnic group
Central Province
Luapula Province
Rural
Quintile 2
Quintile 3
All Zambia
Tonga ethnic group
Quintile 4
North-Western Province
Southern Province
Western Province
Lusaka Province
Urban
Copperbelt Province
Top 10% by wealth
Quintile 5 (richest)
49%
47%
45%
43%
43%
43%
43%
43%
42%
42%
40%
40%
39%
38%
37%
36%
36%
36%
36%
35%
28%
28%
Source: Save the Children’s own calculations, based on DHS
FIGURE 6 STUNTING RATE BY WEALTH QUINTILE
Gro
up
stu
nti
ng
rate
, 201
3 (%
)
50
45
40
35
30
25
20
15
10
5
0 Q1 (Poorest) Q2 Q3 Q4 Q5 (Richest)
47%
42%40%
38%
28%

12
ARE INEQUALITIES WIDENING OR NARROWING?
Inequalities in stunting are narrowing across all group dimensions considered (see Table 3 above). In other words, in each case the disadvantaged group has seen faster progress on stunting than the more advantaged group. This shows that Zambia, since 2002, has experienced the right type of progress, albeit modest. Progress has been faster where it is needed most. This needs to be sustained.
However, despite progress since 2002, children from the poorest quintile are 1.7 times as likely to be stunted as children from the wealthiest quintile (see Table 3). As noted, Zambian society is very unequal in income, and the pattern of growth is reinforcing this situation as time goes on. This, combined with the fact that money is a large differentiator of stunting likelihood, demonstrates the importance of addressing the distribution of wealth – not just for poverty, but also for nutrition.
BENCHMARKING ZAMBIA AND OTHER COUNTRIES BY STUNTING AND DISPARITIES IN STUNTING
Figure 8 opposite shows Zambia’s position alongside all the other countries in the GRID database, highlighting the southern African nations. It shows how the overall stunting rate and inequality in stunting compare with other countries, and whether Zambia’s stunting rate and inequality in stunting are high or low. In the charts below, all the years
available for Zambia are plotted and labelled. This also allows us to benchmark Zambia’s progress.
The direction of progress which is most desirable depends on the country’s starting position.99
Relative to other countries, Zambia has a high stunting rate, but relatively low inequality in stunting across wealth groups. Along with many of its neighbours, it is in the “bad for everyone” quadrant of the chart, reflecting high levels of stunting across all wealth groups.
On average, in the 65 other countries included, the stunting rate was 31% in the most recent year for which we have data. Zambia’s rate in 2013 of 40% is considerably higher. Namibia, Tanzania, Malawi and Zambia have all reduced national-level stunting, but Zambia is the only one that has reduced inequality over the time period that DHS studies cover.100 Deeper analysis, which falls outside the scope of this report, is required to understand this success in order for it to be maintained.
Figure 9 on page 14 shows improvements in Zambia (dark blue) compared with neighbouring countries that have also achieved significant falls in stunting. Each country has a line that starts at the earliest year available for that country, and ends at the most recent year available (start and end years are labelled). Namibia, Tanzania, Malawi and Zambia have all reduced national-level stunting, but Zambia is the only one that has reduced inequality over the time period that DHS studies cover.
TABLE 3 INEQUALITY IN STUNTING RATES BETWEEN GROUPS
1992 1996 2002 2007 2013 Increase
Bottom 40% vs. Top 10% Ratio 2.0 1.7 1.6 1.6 -0.4
Poorest vs. Richest Quintile Ratio 1.8 1.8 1.4 1.7 -0.1
Rural vs. Urban Ratio 1.3 1.4 1.4 1.2 1.2 -0.2
Luapula vs. Lusaka Ratio 1.6 1.7 1.5 1.5 1.2 -0.4
Northern vs. Lusaka Ratio 1.6 1.6 1.4 1.3 1.4 -0.2
Source: Save the Children’s own calculations, based on DHS
Notes: This summarises inequality between groups. For each comparison (wealthy vs least wealthy, urban vs. rural, etc) the table reports the ratio of stunting rates. This measures how much higher stunting is in the first group than the second.98
MA
LNU
TR
ITIO
N IN
ZA
MB
IA

BENCHMARKING COUNTRIES BY STUNTING AND DISPARITIES IN STUNTING
Figure 7 shows how stunting and measures of disparities might combine. Countries with high stunting rates across the whole population combined with little inequality appear in the bottom right corner of the chart. Here, the situation is bad for everyone. The bottom left corner of the chart is the opposite situation. Countries here have low overall stunting rates and low inequality. The situation is good for everyone. The two uppermost quadrants of the chart are where there is high inequality. The top right hand corner with high inequality and high overall stunting rates is the worst case scenario, but this is rarely seen in practice. This leaves the top left, which is where advantaged groups have lower stunting than disadvantaged groups, presumably because the privileged have experienced progress not available to the less fortunate.
2 MA
LNU
TR
ITIO
N IN
ZA
MB
IA
13
Source: Save the Children’s own calculations, based on DHS
Notes: 66 countries included in total. All years are shown for Zambia. For other countries, only the most recent year in the database is included. It was not possible to calculate stunting by wealth quintile using the DHS survey for Zambia in 1992. Neighbouring countries included are Namibia, 2013, Zimbabwe, 2010, DRC, 2013, Mozambique, 2011, Tanzania, 2010, and Malawi, 2010. There is no DHS data available for Angola.
FIGURE 8 PROGRESS ON NUTRITION BY WEALTH GROUP IN ZAMBIA COMPARED TO OTHER SOUTH AFRICAN NATIONS
Rat
io o
f stu
nti
ng
rate
bo
tto
m 2
0% v
s. t
op
20%
by
wea
lth
12
10
8
6
4
2
0 0 10 20 30 40 50 60 70
National stunting rate (%)
Zambia
Neighbours
Other countries, most recent year
Mozambique, 2011
Malawi, 2010
Zambia, 1996Zambia, 2002
Zambia, 2007Zambia, 2013
Namibia, 2013
Zimbabwe, 2010
Tanzania, 2010
DRC, 2013
Average stunting 31%
Average inequality 2.9
BAD FOR EVERYONE
GOOD FOR EVERYONE
UNEQUAL
Ineq
ual
ity
in s
tun
tin
g
Source: Save the Children
‘Bad for everyone’
‘Bad for disadvantaged
group, OK for others’
‘Good for everyone’
Overall stunting rate
3. Inequitable progress
2. R
ecti
fyin
g in
equ
alit
y
1. Equitable progress
FIGURE 7

14
IMPLICATIONS FOR NUTRITION-SENSITIVE SOCIAL PROTECTION IN ZAMBIA
• A narrowly targeted programme is not likely to address chronic malnutrition in Zambia sufficiently, as rates are bad for all. Arguments for universal coverage – as a viable cost-effective approach – come to the fore.
• More analysis is required as to why stunting disparities across groups are decreasing in order to design programmes that preserve and accelerate this trend. The gap between children from the least wealthy and wealthiest households requires specific attention.
• Poverty is not the only driver of malnutrition – well-designed social protection needs to be based on a nutrition pathways analysis.
Over the long term, Zambia should seriously consider reinvestment of gains from economic growth into poverty alleviation, wealth distribution and nutrition interventions for improved social and economic outcomes.
We present specific design recommendations for Zambia, based on all of the evidence presented in this report, in Part 3, section 13.
Source: Save the Children’s own calculations, based on DHS
Note: This chart does not show all of Zambia’s neighbours, but focuses on the three neighbours that have also achieved respectable reductions in stunting. Missing are Angola – no DHS data, and DRC, Mozambique and Zimbabwe, which have not significantly reduced their overall stunting rate.
FIGURE 9 ZAMBIA’S PROGRESS vs. NEIGHBOURING COUNTRIESR
atio
of s
tun
tin
g ra
te b
ott
om
20%
vs.
to
p 20
% b
y w
ealt
h
3.5
3
2.5
2
1.5
1
0.5
0 0 10 20 30 40 50 60
National stunting rate (%)
2013 Average stunting 31%
Average inequality 2.9
BAD FOR EVERYONE
GOOD FOR EVERYONE
UNEQUAL
Zambia
Malawi
Namibia
Tanzania
1992
2010 1996
19921996
2010
2013
MA
LNU
TR
ITIO
N IN
ZA
MB
IA
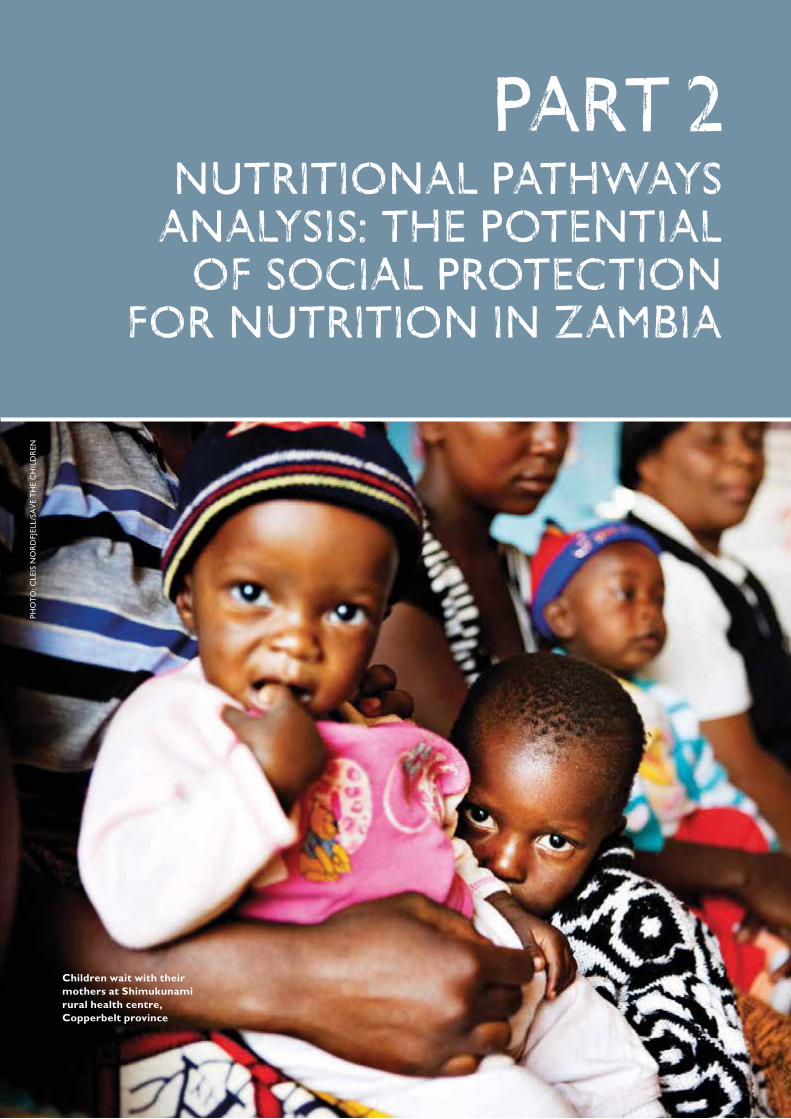
PART 2
Children wait with their mothers at Shimukunami rural health centre, Copperbelt province
PHO
TO
: CLE
IS N
OR
DFJ
ELL/
SAV
E T
HE
CH
ILD
REN
NUTRITIONAL PATHWAYS ANALYSIS: THE POTENTIAL
OF SOCIAL PROTECTION FOR NUTRITION IN ZAMBIA

In order to make recommendations for nutrition-sensitive social protection in Zambia, it is important to know which programmes have been effective and which features of those programmes might explain their success.
In the following section we explore the results of a comprehensive literature review, which shows the impact of Zambian and worldwide social protection programmes on each nutrition pathway.
In the three sections that follow, we then summarise the malnutrition context in Zambia for each pathway,101 consider the known impacts of social protection, and conclude with learning for Zambia.
METHODOLOGY
Parts 2 and 3 of this report are informed by three research components: • a literature review• contextual analysis • policy analysis.
For more information on the methods please see Appendix 1.
A research validation workshop took place in Lusaka in October 2015 with participants from a variety of civil society organisations, the University of Zambia and the Zambian Ministry of Health. Its focus was on the drivers of malnutrition that need to be addressed in order to reduce chronic malnutrition (stunting) in Zambia.102 Recommendations were developed and are presented in this report along with the authors’ conclusions.

17
THE NUTRITION PATHWAYS FRAMEWORK
At the most basic level, nutritional status depends on nutrition being available and on a child’s ability to absorb it. Nutrition depends partly on household access to food, and on caregivers’ awareness of nutrition and their ability to provide it to children. At the same time, children’s ability to absorb nutrients is linked to their health status, which is, in part, a function of environmental determinants of health such as access to clean water and developed means of sanitation.
UNICEF’s conceptual framework, which has been used by the nutrition community for the past 25 years, identifies three levels of causes of undernutrition:• Immediate causes: manifest at individual
level, primarily addressed by nutrition-specific interventions
• Underlying causes: manifest at household and community levels, primarily addressed by nutrition-sensitive interventions
• Basic causes: around the structure and processes of society, primarily addressed through the enabling environment.103
Nutrition-sensitive interventions have an impact on the underlying causes of nutrition. There are three pathways:104, 105
1. Household food security refers to the accessibility of household resources to consume sufficient food for all members in the household, either by food production, cash income or food received as a gift.
2. Caring practices for women and children recognise pregnancy and lactation as critical junctures for good-quality care and support. The quality of care for women and children is determined by the caregiver’s: • level of control over resources and autonomy• mental and physical health (ie, level of stress,
maternal nutritional status) • knowledge (including literacy and educational
attainment), preferences and beliefs.
3. Health services and environment considers access to safe water and sanitation facilities, healthcare and shelter.
The success of nutrition-sensitive programmes is often measured by their ability to alleviate the incidence of chronic malnutrition (low height-for- age or stunting) and acute malnutrition (low weight-for-height or wasting). It is also important to acknowledge that it is difficult to attribute this to nutrition-sensitive interventions, given the complexity of most social protection interventions and multi-causality of nutrition outcomes. Also, social protection may address the underlying determinants of undernutrition without necessarily hitting anthropometric outcomes, because of other limiting factors. For example, diets might improve, but if there is no availability of clean water nutrition outcomes may not improve, yet that is still a good thing to do for nutrition. This complexity of causality leads to a lack of strong evidence. Nevertheless, an evidence base does exist and is reviewed below.
3 UNDERSTANDING THE PATHWAYS APPROACH

18
NUTRITION FRAMEWORK FOR ACTION
The Lancet Maternal and Child Nutrition series sets out a Framework for Action with three core components:• nutrition-specific interventions that
directly address the immediate causes of child undernutrition, that is, inadequate dietary intake and poor health status
• nutrition-sensitive interventions that incorporate nutrition goals and actions to
address the underlying causes of malnutrition, (namely, household food insecurity, poor quality of caring practices for mothers and children, and unhealthy living environments)
• building an enabling environment that addresses the basic causes of malnutrition – more remote factors related to the broad economic, political, environmental, social and cultural context shaping children’s nutrition.
Children at a community school in Kazungula district, Southern province
PHO
TO
: CLE
IS N
OR
DFJ
ELL/
SAV
E T
HE
CH
ILD
REN
MA
LNU
TR
ITIO
N IN
ZA
MB
IA

3 UN
DER
STAN
DIN
G T
HE PA
TH
WA
YS A
PPROA
CH
19
FIGURE 10 MODIFIED VERSION OF UNICEF CONCEPTUAL FRAMEWORK
Source: Modified by author with information from L. Smith and L. Haddad, 2014, Reducing Child Undernutrition: Past drivers and priorities for the post-MDG era, IDS working paper: 10, based on Black et al, The Lancet, 2008; UNICEF, 2013, Improving Child Nutrition: 6 http://www.unicef.org/publications/files/Nutrition_Report_final_lo_res_8_April.pdf [Accessed 12/11/15]
Nutritional status
Dietary intake Health status
Immediate causes operating at the individual level
Underlying causes influencing households and communities
Resources for health • Safe water supply
• Adequate sanitation and hygiene
• Healthcare availability
• Environmental safety/shelter
• Knowledge and beliefs for healthy lifestyle choices
Health services and environment
Resources for care • Caregiver control
of resources and autonomy
• Caregiver physical and mental status
• Caregiver social status
• Caregiver knowledge and beliefs for nutritious feeding practices
Care for women and children
Resources for food security • Food access and
production
• Cash income
• Transfers of food in-kind
• Household assets
• Household knowledge to make nutritious choices
Household food security
Economics and income
Individual and national
Political context and governance
• Bureaucratic effectiveness
• Law and order
• Political stability
• Restraint of corruption
• Democratic accountability
Basic causes around the structure and processes of societies
Poverty and inequality
Social protection can help

20
In this section we explore the known impact of social protection on anthropometric outcomes, and its implications for the development of nutrition-sensitive social protection.
When we examined the impact of existing social protection programmes on nutrition outcomes,106 we found that nine programmes – almost half of those included – reported a reduction in either stunting or wasting (see Figure 11 below). Peru’s Juntos and Malawi’s Social Cash Transfer were the only programmes that saw a reduction in both stunting and wasting.
We also looked for improvements in three other indicators: low-birthweight babies, the incidence of childhood overweight, and anaemia in women of reproductive age. This provided us with a total of five anthropometric and bio-marker measures that could potentially have registered improvement.
However, as most of the programme evaluations did not look for improvements in all five of the indicators, these results should be treated carefully. The median number of indicators assessed was two. For this reason, we consider the percentage of indicators included in a particular programme’s assessment that saw an improvement (see Figure 12 opposite).
4 EVIDENCE OF THE IMPACT OF SOCIAL PROTECTION ON NUTRITION OUTCOMES
Source: Save the Children’s own calculations, based on literature review. See page 88 for literature review references.
Notes: Different programme evaluations used different measures for stunting and wasting. In our review these measures were interpreted liberally – for example, any measured and significant increase in height for age was counted as a reduction in stunting. Programmes where there was a measured effect or lack of effect for one nutrition outcome but where the other outcome was not evaluated have been categorised according to the measured outcome.
FIGURE 11 NUTRITION OUTCOMES IN SOCIAL PROTECTION PROGRAMMES
Nu
mb
er o
f pro
gram
mes
9
8
7
6
5
4
3
2
1
0
2
Both Stunting not wasting Neither No measurement
7
3
8

4 EVID
ENC
E OF T
HE IM
PAC
T O
F SOC
IAL PRO
TEC
TIO
N O
N N
UT
RIT
ION
OU
TCO
MES
21
There are some programmes where, despite looking for an effect on nutrition, no positive effect has been found. The Kenyan Hunger Safety Net Programme evaluation assessed both stunting and wasting and found no effect on either. It did not assess the other three metrics. The Bolsa Familia and Desarrollo Humano programmes also found no impact on either stunting or wasting but both programmes did have some success with one or more of the other three anthropometric measures.
A major issue affecting the results of our review is that nutrition was not evaluated using anthropometric indicators in eight of the 20 programmes included.107
IMPLICATIONS FOR NUTRITION-SENSITIVE SOCIAL PROTECTION IN ZAMBIA
• Inconsistent measuring of nutrition outcomes in social protection programmes makes it difficult to be conclusive about certain design features and their respective impact. Zambia should develop a core set of indicators to be monitored frequently across all of its nutrition-sensitive programmes.
To enable us to understand more about differences in impact and their implications for design of nutrition-sensitive social protection, the next three sections explore nutrition pathways relating to the underlying causes of malnutrition, which manifest at household and community levels.
Source: Save the Children’s own calculation based on literature review. See page 88 for literature review references.
Notes: Different programme evaluations used different measures. These have been interpreted liberally; eg, any measured and significant increase in height for age counted as a reduction in stunting. 100% could mean one anthropometric indicator was assessed and improved or three indicators were assessed and improved.
FIGURE 12 ANTHROPOMETRIC IMPACTS OF SOCIAL PROTECTION PROGRAMMESN
um
ber
of p
rogr
amm
es
9
8
7
6
5
4
3
2
1
0
1
0% Not measured100%75%50%33%
5
1
8
2
3

Mary Tembo, a traditional birth attendant in Bulaya, Copperbelt province
PHO
TO
: CLE
IS N
OR
DFJ
ELL/
SAV
E T
HE
CH
ILD
REN
23
In this section we explore the context of household food security in Zambia, the known impact of social protection on this pathway and the implications for the development of nutrition-sensitive social protection.
DRIVERS OF FOOD INSECURITY IN ZAMBIA
THE IMPORTANCE OF AGRICULTURE
Zambia has a population of 15.5 million. The majority of people live in rural areas (65% in 2010, and 66% in 2013–14) and 67% of people work in farming, forestry, or fisheries (2010 figure). Around 1.6 million households rely on agriculture to produce food to eat or to sell.108 58% of the total land area of 39 million hectares is classified as having medium to high potential for agricultural production. Central areas of the country are more fertile and accessible, and contain most commercial farms. In the north, the soil has high acidity and in the south the climate is drier. Agriculture plays an important role in the lives of many Zambians: 59% of the total population is engaged in small-scale farming, which is mainly subsistent and rainfall-dependent.109 The vast majority (83%) of Zambia’s agricultural households produce maize. Just over half of them (54%) have poultry and around a third (36%) own livestock.110 A major challenge for maize-producing households is low productivity: maize yields are just over 2 metric tonnes per hectare. However, the potential yield for most hybrid maize varieties grown in Zambia is about 6 metric tonnes per hectare.111
FOOD INSECURITY AND VULNERABILITY TO SHOCKS
Despite the dominance of agricultural practices across Zambia, only around half of potential arable land is cultivated and water resources remain largely unused for the purposes of irrigation.112 Nevertheless, Zambia is capable of producing enough food not only to
feed itself, but to export to neighbouring countries. In 2011 and 2012, consecutive bumper harvests produced an after-consumption surplus of more than a million metric tonnes of maize. Yet Zambia has been described as having “food self-sufficiency but not food security” due to issues with the supply of food reaching the Zambian population.113
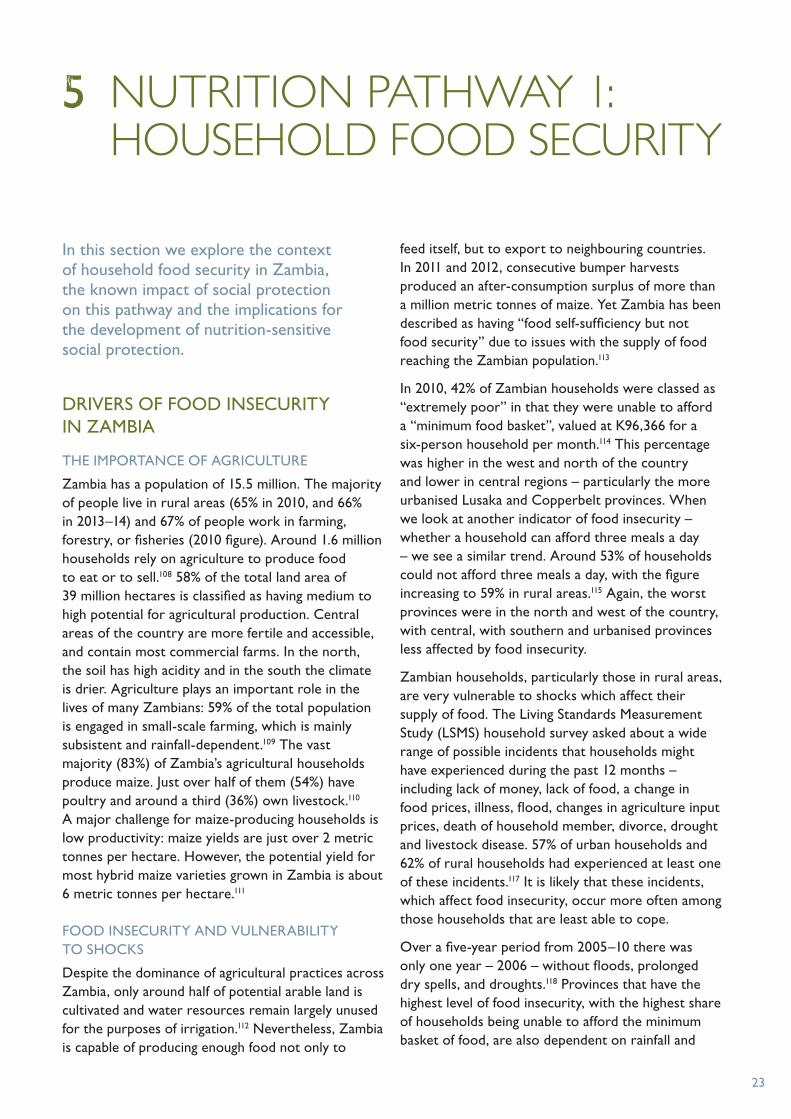
In 2010, 42% of Zambian households were classed as “extremely poor” in that they were unable to afford a “minimum food basket”, valued at K96,366 for a six-person household per month.114 This percentage was higher in the west and north of the country and lower in central regions – particularly the more urbanised Lusaka and Copperbelt provinces. When we look at another indicator of food insecurity – whether a household can afford three meals a day – we see a similar trend. Around 53% of households could not afford three meals a day, with the figure increasing to 59% in rural areas.115 Again, the worst provinces were in the north and west of the country, with central, with southern and urbanised provinces less affected by food insecurity.
Zambian households, particularly those in rural areas, are very vulnerable to shocks which affect their supply of food. The Living Standards Measurement Study (LSMS) household survey asked about a wide range of possible incidents that households might have experienced during the past 12 months – including lack of money, lack of food, a change in food prices, illness, flood, changes in agriculture input prices, death of household member, divorce, drought and livestock disease. 57% of urban households and 62% of rural households had experienced at least one of these incidents.117 It is likely that these incidents, which affect food insecurity, occur more often among those households that are least able to cope.
Over a five-year period from 2005–10 there was only one year – 2006 – without floods, prolonged dry spells, and droughts.118 Provinces that have the highest level of food insecurity, with the highest share of households being unable to afford the minimum basket of food, are also dependent on rainfall and
5 NUTRITION PATHWAY 1: HOUSEHOLD FOOD SECURITY

therefore most vulnerable to drought. A large proportion (71%) of extremely poor households who cannot afford a minimum food basket experienced an adverse incident in the 12 months prior to being surveyed (as listed above).119
There is very little scope for households to absorb the impact of negative shocks. On average, Zambians spend around 50% of their total household budget on food, 26% on housing, 7% on education and 3% on clothes. The proportion of the household budget spent on food rises to 65% in rural areas and to 72% in North-Western Province.120 There is very little support for many of these households. Most agricultural workers (77%), typically casual workers on small-scale farms, do not have formal employment agreements, and so do not have access to safety nets such as paid leave, pensions or social security.121 In the face of adverse shocks, 43% of urban households and 47% of rural households reduced the amount of food they ate.122
The impact of households’ responses to shocks on nutrition and, in particular, the effect of food price rises on stunting, show up clearly in a micro-econometric study that compared Living Conditions Monitoring Survey (LCMS) data from
before and after the 2007–08 food crisis. The findings show that child height-for-age z scores are negatively affected by an increase in the price of cereals and other commodities, such as chicken and eggs, which are rich in proteins and energy. A 10% rise in the price of the more refined maize flour (breakfast mealie meal) reduces children’s height-for-age z scores by 0.36 units in rural areas and 0.23 in urban areas. For an average-sized 28-month-old child this translates into 1.29cm and 0.85cm respectively.123
Monetary poverty and inclusive growth are key drivers of food insecurity. See section ‘Nutrition, poverty and inequality in Zambia’ on page 9 for more details on this and on the relationship between Zambia’s economic growth and malnutrition.
LACK OF DIETARY DIVERSITY
Maize (corn) is the staple food for many Zambians, commonly eaten as nshima – a stiff porridge made from ground maize. Maize, other cereals and starchy roots account for 80% of the total energy intake.124 This is problematic: although maize-based staples provide energy, they do not provide a sufficient range of nutrients (see Figure 14 opposite).
24
Source: CSO, 2012: 180, DHS 2013–14116
Notes: Stunting rate for 2013–14 in Northern and Eastern regions does not include the districts that are now included in Muchinga. 2010 data on food insecurity in those regions does include the districts that are now in Muchinga.
FIGURE 13 STUNTING AND FOOD INSECURITYP
erce
nt
of h
ou
seh
old
s o
r ch
ildre
n u
nd
er 5
stu
nte
d
80
70
60
50
40
30
20
10
0
Copperbel
t
Lusaka
Nort
h-Wes
tern
Wes
tern
Centr
al
Souther
n
Easte
rn
Luapula
Nort
hern
36%
12% 32%
36%
18% 49%
49%
56% 65%
43%
65% 74%
43%
59% 53%
37%
47% 28%
43%
37% 46%
36%
64% 67%
37%
46% 63%
Can’t afford minimum basket, 2010
Can’t afford 3 meals, 2010
Stunting, 2013
MA
LNU
TR
ITIO
N IN
ZA
MB
IA

5 NU
TR
ITIO
N PA
TH
WA
Y 1: H
OU
SEHO
LD FO
OD
SECU
RIT
Y
25
The lack of diet diversity is of particular concern for children, as complementary foods – mainly starchy staples – are introduced early in children’s lives.125 The latest DHS survey (2013–14) found 75% of all 6–23-month-old children had eaten food from grains the day or night preceding the interview – the largest percentage across all the food types included in the survey (see Figure 14 below).126
It was also found that only 22% of children aged 6–23 months had sufficient dietary diversity according to the Infant and Young Child Feeding guidelines127 (four or more food groups) in the day or night preceding the survey (see Figure 15 overleaf). Rural areas, again, present a worse situation: 18% of young children in these areas did not eat from enough food groups. Diet diversity is also worse among poor families. Of children in the least wealthy quintile, only 15% ate from enough food groups. This overlap is not surprising given 77.9% of the rural population is poor.128
Recent research suggests several routes by which inadequate dietary diversity might be tackled. Reductions in the prices of foods have been shown to lead to increasing consumption, indicating potential benefits from a policy that reduces the price of nutritious foods.129 Some also argue that increasing the supply of fish, and undertaking marketing to change attitudes towards eating fish, would be beneficial.130
However, perhaps the greatest opportunity for Zambia to improve dietary diversity is through improved agricultural productivity. People who are most food insecure often rely on small-scale, local food production for their livelihoods. Dietary diversity can also deliver better nutrition and health, with benefits for livelihoods, human development and productivity over the life course.131 Balanced nutrition requires diversity of crops, including diversity among similar types of crops, since some lesser-known crops are superior to staple crops in terms of their micronutrient content.132
Source: DHS 2013–14: 168
FIGURE 14 FOOD CONSUMED BY YOUNG CHILDREN
0 10 20 30 40 50 60 70 80
Percentage of children aged 6–23 months
Non-breastfeeding
Breastfeeding
Food made from grains
Fruits and vegetables rich in vitamin A
Other liquid
Meat, fish, poultry
Fortified baby foods
Legumes and nuts
Eggs
Other fruits and vegetables
Roots and tubers
Cheese, yoghurt, other milk products
Other milk
Caterpillars, other insects
Infant formula
75%
67%

26
Part of the reason for the lack of dietary diversity in Zambia relates to long-standing policies that were intended to improve food security and to support the production of maize. In particular, policies introduced in the 1970s were intended to ensure that urban residents have cheap maize. Some argue that these policies have “crowded out” diversification into more nutrient-dense food.133
EVIDENCE OF THE IMPACT OF SOCIAL PROTECTION ON HOUSEHOLD FOOD SECURITY
As the data above shows, most Zambians are in great need of social protection and ways to absorb shocks and to improve food security. There is a great deal of evidence supporting the link between social protection and food security, which we explore here:• Poor households globally use most of the cash
transfers from social protection programmes to purchase food.134
• By increasing food security, social transfers improve households’ ability to absorb shocks.135
• Social transfers, whether in cash or in kind, can encourage food production.136 This is thought to be the result of increased stability in market demand for food in areas where social protection programmes have been implemented.137
• Food security is an important prerequisite to long-term productivity.138 Gains in nutrition due to increased food security make both direct and indirect contributions to labour productivity. Directly, proper caloric intake enables workers to endure demanding physical labour. Indirectly, nutritional gains resulting from food security and adequate child feeding and nutrition practices support children’s cognitive development and school attendance, increasing educational attainment.139
Food security is more regularly assessed than more expensive anthropometric measures in social protection programming, particularly in sub-Saharan Africa. Though food consumption is not a full measure of nutrition, it does provide an important indication of the potential impact of social protection for nutrition.
When we examined the impact of existing social protection programmes on the consumption of food through our review, we found 11 programmes recorded an improvement; five did not; while four did not measure food consumption.140
Significantly, our review found that the more food security measures achieved (we looked for seven), the more likely it was that a programme saw an improvement in food consumption and in stunting and/or wasting (see Figure 16 opposite).
Source: DHS 2013–14: 170
FIGURE 15 YOUNG CHILDREN EATING FOUR OR MORE FOOD GROUPS
0 5 10 15 20 25 30 35 40 45
Percentage of children aged 6–23 months
Zambia
Quintile 5: Most wealthy
Quintile 4
Quintile 3
Quintile 2
Quintile 1: Poorest
Urban
Rural
22%
41%
26%
18%
18%
15%
31%
18%
MA
LNU
TR
ITIO
N IN
ZA
MB
IA
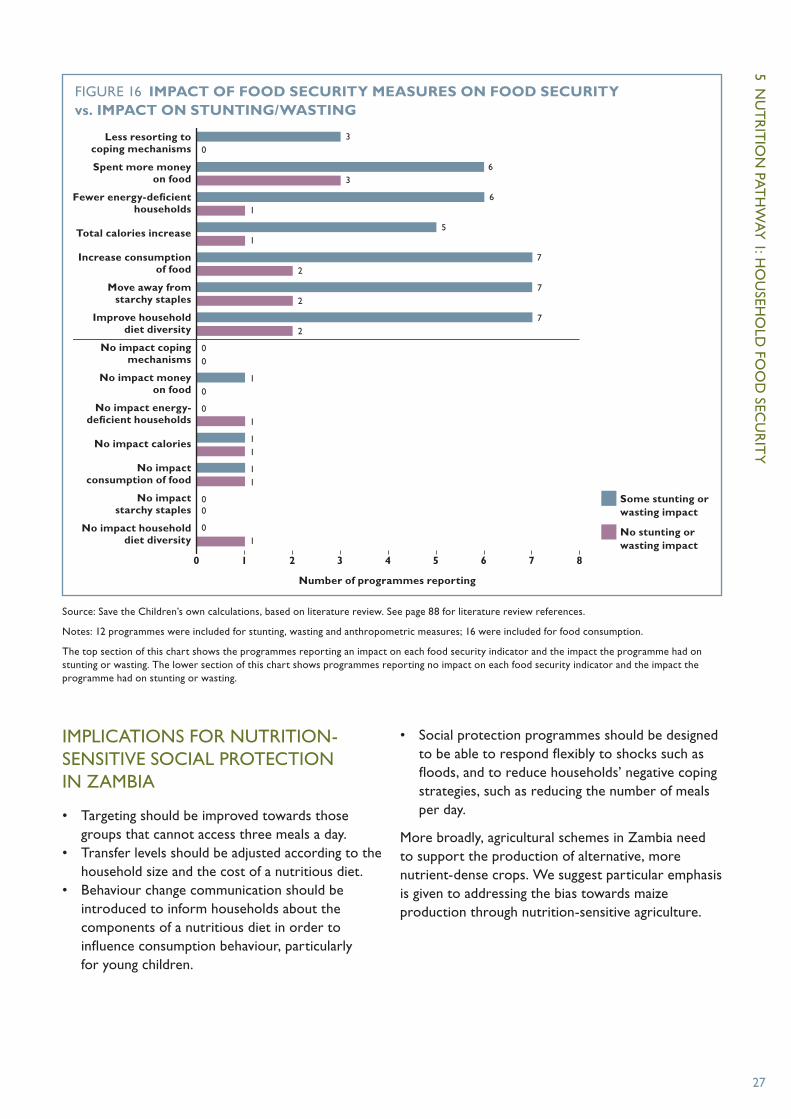
5 NU
TR
ITIO
N PA
TH
WA
Y 1: H
OU
SEHO
LD FO
OD
SECU
RIT
Y
27
IMPLICATIONS FOR NUTRITION-SENSITIVE SOCIAL PROTECTION IN ZAMBIA
• Targeting should be improved towards those groups that cannot access three meals a day.
• Transfer levels should be adjusted according to the household size and the cost of a nutritious diet.
• Behaviour change communication should be introduced to inform households about the components of a nutritious diet in order to influence consumption behaviour, particularly for young children.
• Social protection programmes should be designed to be able to respond flexibly to shocks such as floods, and to reduce households’ negative coping strategies, such as reducing the number of meals per day.
More broadly, agricultural schemes in Zambia need to support the production of alternative, more nutrient-dense crops. We suggest particular emphasis is given to addressing the bias towards maize production through nutrition-sensitive agriculture.
Source: Save the Children’s own calculations, based on literature review. See page 88 for literature review references.
Notes: 12 programmes were included for stunting, wasting and anthropometric measures; 16 were included for food consumption.
The top section of this chart shows the programmes reporting an impact on each food security indicator and the impact the programme had on stunting or wasting. The lower section of this chart shows programmes reporting no impact on each food security indicator and the impact the programme had on stunting or wasting.
FIGURE 16 IMPACT OF FOOD SECURITY MEASURES ON FOOD SECURITY vs. IMPACT ON STUNTING/WASTING
0 1 2 3 4 5 6 7 8
Number of programmes reporting
Some stunting or wasting impact
No stunting or wasting impact
Less resorting to coping mechanisms
Spent more money on food
Fewer energy-deficient households
Total calories increase
Increase consumption of food
Move away from starchy staples
Improve household diet diversity
No impact coping mechanisms
No impact money on food
No impact energy-deficient households
No impact calories
No impact consumption of food
No impact starchy staples
No impact household diet diversity
36
03
61
51
72
72
27
00
10
01
11
11
00
01

Children at Shimukunami rural health centre, Copperbelt province
PHO
TO
: CLE
IS N
OR
DFJ
ELL/
SAV
E T
HE
CH
ILD
REN

29
In this section we explore: • the context of caring practices for women
and children in Zambia• the known impact of social protection on
this pathway• implications for the development of
nutrition-sensitive social protection.
DRIVERS OF INADEQUATE CARE FOR MOTHERS AND YOUNG CHILDREN IN ZAMBIA
MALNUTRITION AT BIRTH
While stunting prevalence among children under five in Zambia is 40%,141 the vast majority of babies are not born stunted. Our calculations, based on DHS data, show between 2% and 11% of Zambian children are born stunted.142 Most of the children aged under five who become stunted do so between the ages of two months and two years.143
The situation is similar for children who are underweight. Very few babies are born underweight, but the proportion rises rapidly to reach a peak at age two and a half.
Wasting is the highest out of the three nutrition indicators at birth. Around 10% of newborn babies suffer from wasting. This figure slowly and steadily decreases from then until age five.144
These trends underline the importance of ensuring sustained nutrition interventions throughout the full period of the first 1,000 days. While good nutrition in pregnancy must not be neglected, nutrition interventions to reach babies in the early months after birth and beyond are also critical.
Poor nutrition in newborn babies is often linked to undernutrition among pregnant women and undernutrition in women of child-bearing age.
Addressing undernutrition quickly when a woman becomes pregnant is difficult. Data on this for Zambia is relatively encouraging: only 1.9% of women have a height of less than 145cm, and the proportion of women with a body mass index classified as ‘moderately or severely thin’ is also relatively low at 2.5%.145
Over 60% of women take vitamin A, iron supplements, iodised salt and deworming medication, which can partly be attributed to the well-established food fortification and supplementation programmes based on vitamin A in sugar and iodised salt.146 Rates for fortified food intake remain relatively high for women in the lowest wealth quintile, at around 50% for most of the supplements and as high as 95% for iodised salt.147
However, there is still work to be done on iron supplementation and zinc. Either not enough people are taking supplements, or the supplements themselves are insufficient. When the National Food and Nutrition Commission148 tested levels of these nutrients in 2012, they found iron deficiency in 19% of pregnant women and anaemia in 42%. Zinc deficiencies were also high – varying between 28% and 70% in different provinces; 95% of women were also deficient in vitamin B12.
EARLY PREGNANCY AND MOTHERS’ EDUCATION
Another driver of poor nutritional outcomes in newborn babies is early pregnancy. In Zambia, the legal minimum age for marriage is 18. The 2013–14 DHS survey showed 16.9% of women aged 15–19 were married or living with a partner.149 The same data shows that women begin having sex on average around one year before they are married. Compared with a national median age of first sexual intercourse of 17.4 years old, in rural areas it is 16.9 years; in North-Western and Western Provinces the age is 16.6 years and 16.2 years respectively.150
6 NUTRITION PATHWAY 2: CARING PRACTICES FOR WOMEN AND CHILDREN

30
Source: DHS 2013–14: 139
Notes: This Figure shows nutrition outcomes at birth by the mother’s age. It show a measure of size – the percentage of babies that were “very small” or “smaller than average” – which is correlated with stunting.152 It also shows the percentage of babies with low birth weight – less than 2.5kg
FIGURE 17 SIZE AND WEIGHT AT BIRTH BY MOTHER’S AGE
Per
cen
t o
f liv
e b
irth
s
14
12
10
8
6
4
2
0
13.3%
Percentage either “very small” or “smaller than average”
Percentage weighing less than 2.5kg
<20 35–4520–34
12.9%
11.5%
8.3%
10.3%
8.6%
When we consider nutrition outcomes at birth by the mother’s age and by the mother’s level of education, we see that the proportion of babies born small decreases both as the mother’s age (see Figure 17) and education increases. Though these changes in babies’ size and weight are usually relatively small, they still may be very important for nutrition. Effects may be greater when these drivers of the mother’s age and education are very low or very high. For example, there is a significant drop in babies born small when women have “more than secondary” education.151
It could also be the case that a large proportion of babies born to very young mothers – to those aged 16 or younger – are small. Information on mothers below the age of 20 in Zambia is not included in the chart below as the data is not available. As we see later in this section, a mother’s education and empowerment are important to her children’s outcomes after birth.
FEEDING AND HEALTH-SEEKING BEHAVIOUR
Exclusive breastmilk is the optimal diet for babies under the age of six months. Very positively, more than 94% of babies in Zambia are breastfed within one day of birth. However, progress is still required in relation to exclusive breastfeeding for the first six months. 73% of babies aged less than six months were exclusively breastfed, with the very high levels of breastfeeding from birth falling to 45% at age 4–5 months, with the others being introduced to other types of milk and/or complementary
foods.153 Introducing other types of milk, particularly formula, puts babies into contact with more germs, in particular diarrhoea. In Zambia in 2010, almost one-third of children aged 6–23 months had an episode of this disease.154 Contrary to World Health Organization recommendations, babies in Zambia are also being introduced to solid or semi-solid food too early, ie, before reaching six months. In 2013, 7% of breastfed children aged 2–3 months received some kind of solid or semi-solid food, and this proportion increased to 39% by age 4–5 months.155 Interestingly, as shown on Figure 18, the wealthiest quintile scores relatively poorly on this measure, reflecting characteristics of women in this wealth group returning to work. Southern Province is the only group getting close to the recommended six months.
After the age of six months, and particularly in the period between six and 23 months, children need to continue with milk, eat a range of complementary foods, and eat meals frequently. In Zambia, the proportion of children deemed to be receiving minimum adequate feeding was worryingly low, at 11% across all of Zambia, 7% in the lowest wealth quintile and still only 17% in the wealthiest families. Most children were fed milk. However, the share of children being fed four or more food groups was low in all groups except the wealthiest quintile, and was particularly marked in rural areas and the poorest quintile. Minimum meal frequencies were also not met for the majority of children: only 42% of all Zambian children in this age group fed frequently, or in other words, ate often enough.156
MA
LNU
TR
ITIO
N IN
ZA
MB
IA

6 NU
TR
ITIO
N PA
TH
WA
Y 2: C
AR
ING
PRA
CT
ICES FO
R W
OM
EN A
ND
CH
ILDR
EN
31
When we look at health-seeking behaviour by women, the picture is much more encouraging. More than 96% of women received antenatal care from a skilled health provider and 95% had more than three antenatal visits; 82% of mothers were protected against neonatal tetanus.157
WOMEN’S EMPOWERMENT
Econometric studies have confirmed that better status for women is correlated with better nutrition outcomes in a wide range of developing countries.158 In Zambia, a study which looked at the women’s education, related to the effect of food price rises on stunting, found that the better educated the mother is in urban areas, the taller the children are.159
An assessment of the effect of the Zambia Child Grant Programme on stunting found the programme had high impact in households where the mother was educated and no impact where she was not. The programme was found to reduce stunting by 1.2 percentage points for each additional year of education that the mother has.160 This is a powerful finding, showing that even in households where there are enough resources for nutrition (in this case because they receive a grant), less-educated mothers see little, if any, improvement in their children’s nutrition status. It is worth noting
that 45% of women in Zambia have secondary education or higher – demonstrating significant progress since 1992 when only 24% of women had secondary education or higher.161
Source: DHS 2013–14: 173
FIGURE 18 EXCLUSIVE BREASTFEEDING
0 1 2 3 4 5 6
Months
Southern ProvinceWestern Province
Quintile 4Secondary education
No educationLusaka Province
Central ProvinceQuintile 3
Quintile 1: Least wealthyNorthern Province
RuralAll ZambiaQuintile 2
Primary educationUrban
Eastern ProvinceQuintile 5: Most wealthy
Muchinga ProvinceLuapula Province
Copperbelt ProvinceNorth-Western Province
5.6
4.8
4.3
4.3
4.3
4.3
4.3
4.2
4.2
4.2
4.2
4.1
4.1
4
4
3.9
3.5
3.4
3.4
3.3
3
INFANT AND YOUNG CHILD FEEDING (IYCF)
IYCF practices play an important role in determining the health and development of children. The IYCF practices most commonly measured include the breastfeeding status of infants, with special attention to exclusive breastfeeding, which is recommended for the first six months of life, along with the complementary feeding of children aged 6–23 months, with three key IYCF practices (as referred to in Figure 19 overleaf) according to WHO guidelines:• continued breastfeeding, or feeding of milk
or milk products to non-breastfed children • feeding children solid foods the minimum
number of times • feeding children solid foods from the
minimum number of food groups.162

32
As we can see from Figure 19, educated women in Zambia are more likely to make positive decisions and take the positive actions for their children’s nutrition. Children born to educated women are more likely to start life with a doctor, nurse, midwife or traditional health worker in attendance, and their mothers are more likely to have seen an antenatal health professional. Between the ages of 6–23 months, these children are more likely to be fed often enough and with enough dietary diversity. This demonstrates the importance of raising the status of women and empowering them to make decisions as an important step in improving nutrition.
While girls’ enrolment has increased in recent years, corresponding with a rise in gender parity, the basic education level, literacy, is not universal among women aged 15 to 49 (68% for the whole of Zambia, and only 54% in rural areas). Keeping girls in school at higher grades remains a challenge. Dropout rates are consistently higher among girls (2.1% in 2013) than boys (1.1%). This is partly because the cost of secondary education for one year is estimated at about 30% of the total annual expenditure of an extremely poor household.
Zambia ranks low at 101 of 148 countries on the Gender Development Index and 134 of 152 on
the Gender Inequality Index.163 Improving gender equality and women’s empowerment is also likely to lead to further improvements in women’s abilities to make decisions in the household. In 2013–14, 59% of married women said they made decisions about how to spend their husband’s cash earnings jointly, and 35% of women who earned their own cash were able to decide how to spend it on their own. 74% of women participate in decisions about their own health and 53% participated in all of the four specified decisions around their own health, major purchases, daily purchases and visits to family.164
EVIDENCE OF THE IMPACT OF SOCIAL PROTECTION ON CARING PRACTICES FOR WOMEN AND CHILDREN
When we looked at the impacts of social protection through our review, we found better outcomes for stunting and wasting when programmes bring improvements in education for women and in women’s participation in household decision-making (see Figure 20 opposite).
Results of the combined impact of indicators for this pathway were inconclusive, due to the inclusion of
Source: Save the Children’s own calculations, based on DHS 2013–14
Notes: See box on page 31 for detail on IYCF practices. The top three bars (IYCF practices, meal frequency and 4+ food groups) show percentages of children aged 6–23 months. The next two (problems accessing healthcare and antenatal care from a nurse or midwife) are percentages of women, and the bottom bar shows percentages of live births where the birth was assisted by a skilled attendant.
FIGURE 19 NUTRITION PATHWAYS AND MOTHER’S EDUCATION
0 10 20 30 40 50 60 70 80 90 100
Percent of births, women, children 6–23 months
3 IYCF practices
Minimum meal frequency
4+ food groups
Any problems accessing
healthcare
Antenatal from nurse/midwife
Skilled birth attendant
Secondary or higher
Primary
No education
22%
8%
59%
39%
53%
18%
64%
59%
100%
93%
91%
68%
14%
49%
28%
38%
92%
80%
MA
LNU
TR
ITIO
N IN
ZA
MB
IA
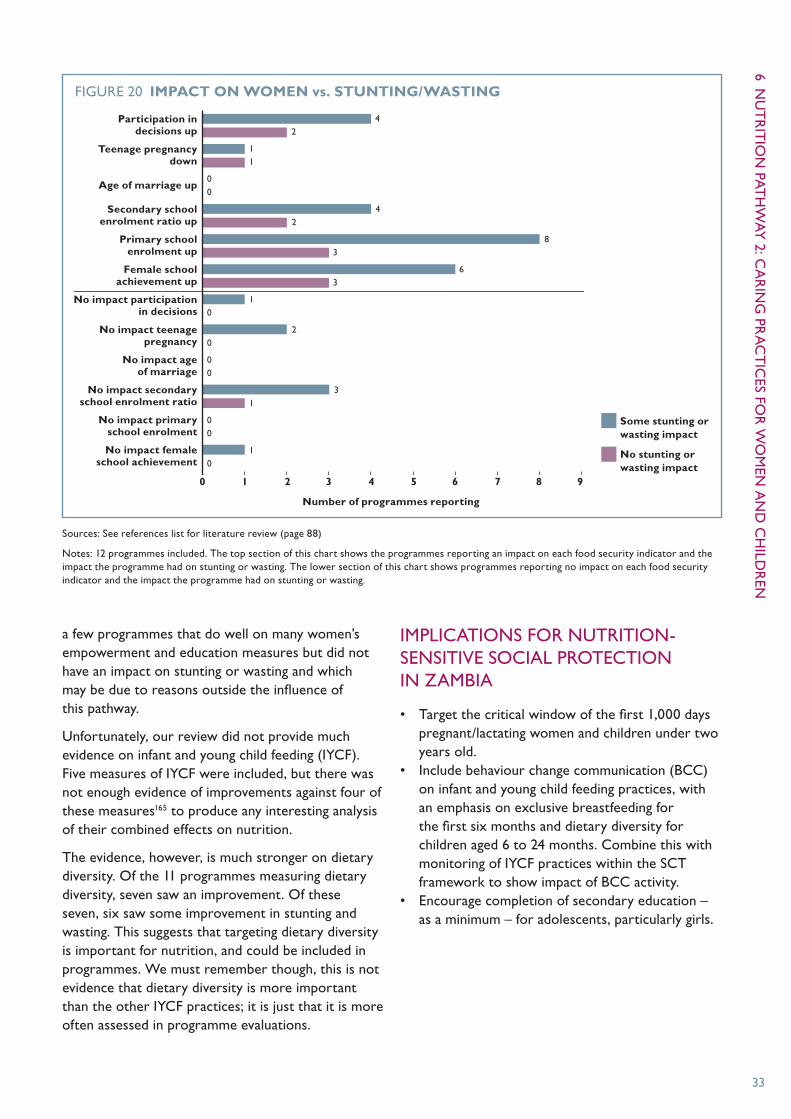
6 NU
TR
ITIO
N PA
TH
WA
Y 2: C
AR
ING
PRA
CT
ICES FO
R W
OM
EN A
ND
CH
ILDR
EN
33
a few programmes that do well on many women’s empowerment and education measures but did not have an impact on stunting or wasting and which may be due to reasons outside the influence of this pathway.
Unfortunately, our review did not provide much evidence on infant and young child feeding (IYCF). Five measures of IYCF were included, but there was not enough evidence of improvements against four of these measures165 to produce any interesting analysis of their combined effects on nutrition.
The evidence, however, is much stronger on dietary diversity. Of the 11 programmes measuring dietary diversity, seven saw an improvement. Of these seven, six saw some improvement in stunting and wasting. This suggests that targeting dietary diversity is important for nutrition, and could be included in programmes. We must remember though, this is not evidence that dietary diversity is more important than the other IYCF practices; it is just that it is more often assessed in programme evaluations.
IMPLICATIONS FOR NUTRITION-SENSITIVE SOCIAL PROTECTION IN ZAMBIA
• Target the critical window of the first 1,000 days pregnant/lactating women and children under two years old.
• Include behaviour change communication (BCC) on infant and young child feeding practices, with an emphasis on exclusive breastfeeding for the first six months and dietary diversity for children aged 6 to 24 months. Combine this with monitoring of IYCF practices within the SCT framework to show impact of BCC activity.
• Encourage completion of secondary education – as a minimum – for adolescents, particularly girls.
Sources: See references list for literature review (page 88)
Notes: 12 programmes included. The top section of this chart shows the programmes reporting an impact on each food security indicator and the impact the programme had on stunting or wasting. The lower section of this chart shows programmes reporting no impact on each food security indicator and the impact the programme had on stunting or wasting.
FIGURE 20 IMPACT ON WOMEN vs. STUNTING/WASTING
0 1 2 3 4 5 6 7 8 9
Number of programmes reporting
Some stunting or wasting impact
No stunting or wasting impact
Participation in decisions up
Teenage pregnancy down
Age of marriage up
Secondary school enrolment ratio up
Primary school enrolment up
Female school achievement up
No impact participation in decisions
No impact teenage pregnancy
No impact age of marriage
No impact secondary school enrolment ratio
No impact primary school enrolment
No impact female school achievement
42
83
63
20
00
31
00
10
10
00
11
42

Besta Chooka, a night nurse at Ngwerere rural health centre, Lusaka province
PHO
TO
: TER
I PEN
GIL
LEY
/SA
VE
TH
E C
HIL
DR
EN

35
This section focuses on health services, and water, sanitation and hygiene. It explores: • the context of the health services and
environment in Zambia• the known impact of social protection
on this pathway• the implications for the development of
nutrition-sensitive social protection.
ENVIRONMENTAL AND HEALTHCARE-RELATED DRIVERS OF MALNUTRITION IN ZAMBIA
WATER AND SANITATION
Poor water and sanitation, particularly open defecation combined with drinking surface water, breeds conditions which impede the ability of children’s bodies to absorb and retain nutrients. These conditions include diarrhoea, tropical enteropathy and parasitic infections (worms).166
Lack of access to safe water, despite significant progress since 1990, remains a serious problem in Zambia. In 2015, 35% of people do not have “improved” water and 12% drink surface water. On sanitation, 41% of people do not have an “improved” facility and 14% practise open defecation (see Figure 21).167
The share of the population relying on surface water as the main source of drinking water is much higher in rural areas, at 23.3 %, than urban areas, at 1.9%. Similarly, 26.8% of the rural population has no toilet facility, compared with 1.5% of the urban population. One fifth of the rural population is using the most unsafe type of water, or the most unsafe type of sanitation, or both.168 Looking at correlations with poverty and nutrition, we see only 10% of extremely poor households had improved sanitation, and only 49% improved water. This means that 90% of the extremely poor households in Zambia have children who are not only suffering from lack of food, but also poor sanitation.169 This overlap is unsurprising
7 NUTRITION PATHWAY 3: HEALTH SERVICES AND ENVIRONMENT
Source: DHS 1992, 1997, 2001–02, 2007, 2013–14
Note: Uses DHS measure of “surface water”, which is slightly different to the Joint Monitoring Programme (JMP) measure. The following figures use the DHS measure of “surface water”, and to proxy for the JMP measure “open defecation”, the charts below use the DHS measure “no facility”.
FIGURE 21 OPEN DEFECATION AND SURFACE WATER
Per
cen
t o
f po
pu
lati
on
35
30
25
20
15
10
5
0 1992 1997 2002 2007 2012
31.7%
28.8%29.6%
25.2%
16.2%
27.5%
16.6%
19.6%20.7%
14.4%
Sanitation: no facility
Water: surface water
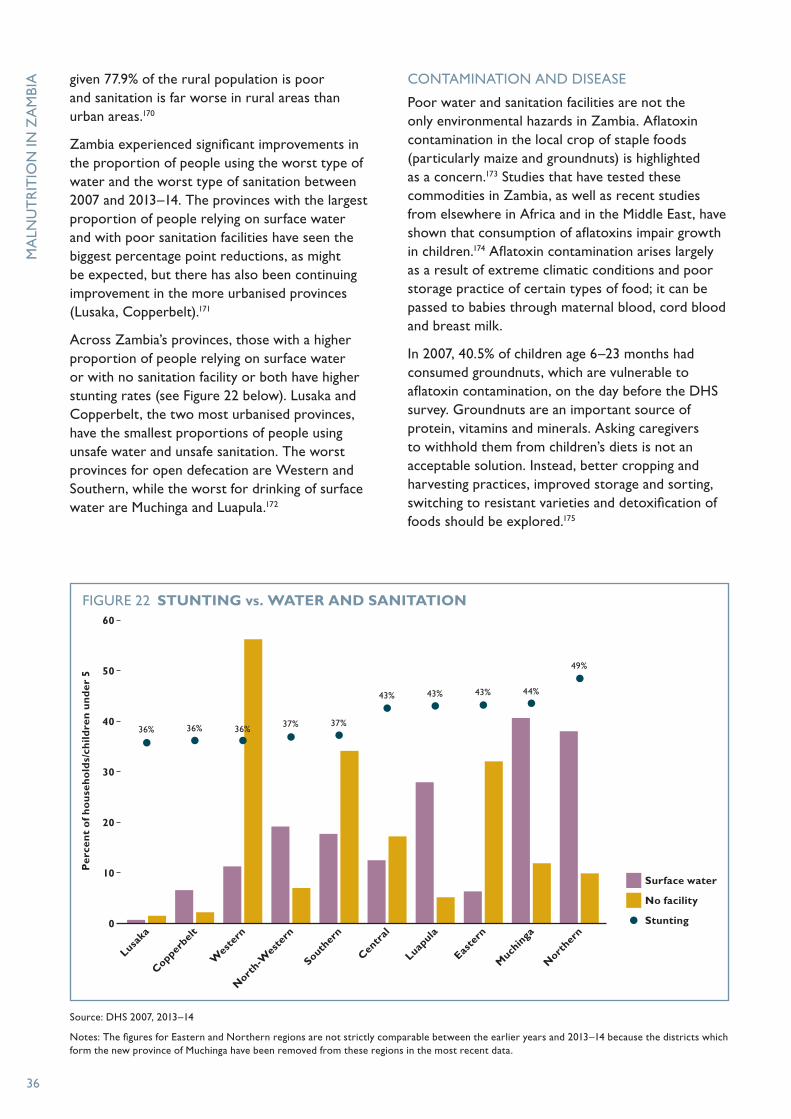
36
Source: DHS 2007, 2013–14
Notes: The figures for Eastern and Northern regions are not strictly comparable between the earlier years and 2013–14 because the districts which form the new province of Muchinga have been removed from these regions in the most recent data.
FIGURE 22 STUNTING vs. WATER AND SANITATION
Per
cen
t o
f ho
use
ho
lds/
child
ren
un
der
5
60
50
40
30
20
10
0
Copperbel
t
Lusaka
Nort
h-Wes
tern
Wes
tern
Centr
al
Souther
n
Easte
rn
Much
inga
Luapula
Nort
hern
36%
Surface water
No facility
Stunting
36% 36% 37% 37%
43% 43% 43% 44%
49%
given 77.9% of the rural population is poor and sanitation is far worse in rural areas than urban areas.170
Zambia experienced significant improvements in the proportion of people using the worst type of water and the worst type of sanitation between 2007 and 2013–14. The provinces with the largest proportion of people relying on surface water and with poor sanitation facilities have seen the biggest percentage point reductions, as might be expected, but there has also been continuing improvement in the more urbanised provinces (Lusaka, Copperbelt).171
Across Zambia’s provinces, those with a higher proportion of people relying on surface water or with no sanitation facility or both have higher stunting rates (see Figure 22 below). Lusaka and Copperbelt, the two most urbanised provinces, have the smallest proportions of people using unsafe water and unsafe sanitation. The worst provinces for open defecation are Western and Southern, while the worst for drinking of surface water are Muchinga and Luapula.172
CONTAMINATION AND DISEASE
Poor water and sanitation facilities are not the only environmental hazards in Zambia. Aflatoxin contamination in the local crop of staple foods (particularly maize and groundnuts) is highlighted as a concern.173 Studies that have tested these commodities in Zambia, as well as recent studies from elsewhere in Africa and in the Middle East, have shown that consumption of aflatoxins impair growth in children.174 Aflatoxin contamination arises largely as a result of extreme climatic conditions and poor storage practice of certain types of food; it can be passed to babies through maternal blood, cord blood and breast milk.
In 2007, 40.5% of children age 6–23 months had consumed groundnuts, which are vulnerable to aflatoxin contamination, on the day before the DHS survey. Groundnuts are an important source of protein, vitamins and minerals. Asking caregivers to withhold them from children’s diets is not an acceptable solution. Instead, better cropping and harvesting practices, improved storage and sorting, switching to resistant varieties and detoxification of foods should be explored.175
MA
LNU
TR
ITIO
N IN
ZA
MB
IA

7 NU
TR
ITIO
N PA
TH
WA
Y 3: H
EALT
H SERV
ICES A
ND
ENV
IRON
MEN
T
37
Source: CSO 2012: 84, 85180
FIGURE 23 TYPE OF ILLNESS/INJURY REPORTED
0 10 20 30 40 50 60 70 80 90 100
Children 0–4
All Zambia
Non-poor
Moderately poor
Extremely poor
Pneumonia, 0%
% of all those reporting an illness or injury
Fever/Malaria Cough/cold/chest infection Diarrhoea
Abdominal, head, back and tooth ache Eye, skin, stomach infection Asthma
Pneumonia Tuberculosis Others
Pneumonia, 1%
Pneumonia, 1%
Pneumonia, 1%
Pneumonia, 1%
Diarrhoea, 9%
Diarrhoea, 5%
Diarrhoea, 4%
Diarrhoea, 5%
Diarrhoea, 5%
Fever/Malaria, 52%
Fever/Malaria, 48%
Fever/Malaria, 48%
Fever/Malaria, 47%
Fever/Malaria, 48%
Zambia also suffers from a high prevalence of diseases that people who are undernourished find harder to overcome. Overall, 15% of respondents to the 2010 LCMS reported suffering from an illness or injury in the past two weeks. The burden was higher in rural areas (16%) than in urban areas
(12%) and the two most urbanised provinces (Lusaka and Copperbelt).176
Among those who reported an illness or injury, malaria or fever was by far the most often reported, at 47–48% across all poverty categories, and at 52% for children under age five (see Figure 23 below).
A child washes cooking pots in Kapilamikwa village, Lufwanyama district, Copperbelt province
PHO
TO
: CLEIS N
OR
DFJELL/SA
VE T
HE C
HILD
REN
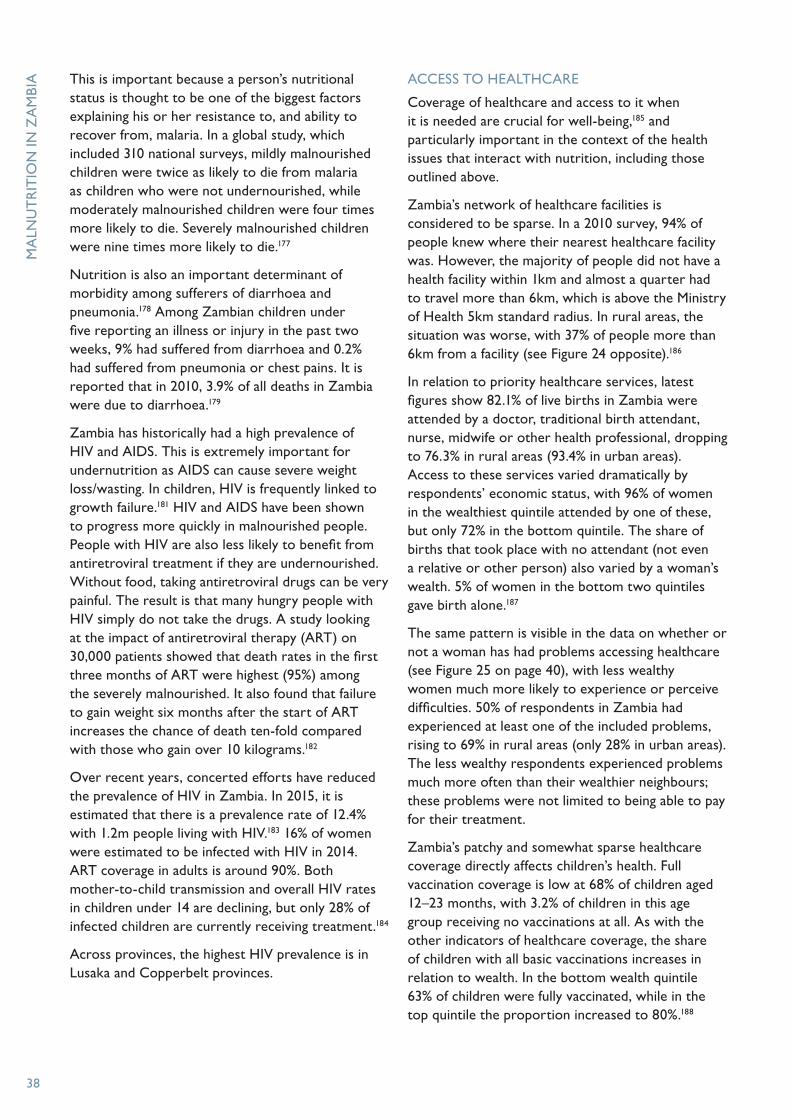
38
This is important because a person’s nutritional status is thought to be one of the biggest factors explaining his or her resistance to, and ability to recover from, malaria. In a global study, which included 310 national surveys, mildly malnourished children were twice as likely to die from malaria as children who were not undernourished, while moderately malnourished children were four times more likely to die. Severely malnourished children were nine times more likely to die.177
Nutrition is also an important determinant of morbidity among sufferers of diarrhoea and pneumonia.178 Among Zambian children under five reporting an illness or injury in the past two weeks, 9% had suffered from diarrhoea and 0.2% had suffered from pneumonia or chest pains. It is reported that in 2010, 3.9% of all deaths in Zambia were due to diarrhoea.179
Zambia has historically had a high prevalence of HIV and AIDS. This is extremely important for undernutrition as AIDS can cause severe weight loss/wasting. In children, HIV is frequently linked to growth failure.181 HIV and AIDS have been shown to progress more quickly in malnourished people. People with HIV are also less likely to benefit from antiretroviral treatment if they are undernourished. Without food, taking antiretroviral drugs can be very painful. The result is that many hungry people with HIV simply do not take the drugs. A study looking at the impact of antiretroviral therapy (ART) on 30,000 patients showed that death rates in the first three months of ART were highest (95%) among the severely malnourished. It also found that failure to gain weight six months after the start of ART increases the chance of death ten-fold compared with those who gain over 10 kilograms.182
Over recent years, concerted efforts have reduced the prevalence of HIV in Zambia. In 2015, it is estimated that there is a prevalence rate of 12.4% with 1.2m people living with HIV.183 16% of women were estimated to be infected with HIV in 2014. ART coverage in adults is around 90%. Both mother-to-child transmission and overall HIV rates in children under 14 are declining, but only 28% of infected children are currently receiving treatment.184
Across provinces, the highest HIV prevalence is in Lusaka and Copperbelt provinces.
ACCESS TO HEALTHCARE
Coverage of healthcare and access to it when it is needed are crucial for well-being,185 and particularly important in the context of the health issues that interact with nutrition, including those outlined above.
Zambia’s network of healthcare facilities is considered to be sparse. In a 2010 survey, 94% of people knew where their nearest healthcare facility was. However, the majority of people did not have a health facility within 1km and almost a quarter had to travel more than 6km, which is above the Ministry of Health 5km standard radius. In rural areas, the situation was worse, with 37% of people more than 6km from a facility (see Figure 24 opposite).186
In relation to priority healthcare services, latest figures show 82.1% of live births in Zambia were attended by a doctor, traditional birth attendant, nurse, midwife or other health professional, dropping to 76.3% in rural areas (93.4% in urban areas). Access to these services varied dramatically by respondents’ economic status, with 96% of women in the wealthiest quintile attended by one of these, but only 72% in the bottom quintile. The share of births that took place with no attendant (not even a relative or other person) also varied by a woman’s wealth. 5% of women in the bottom two quintiles gave birth alone.187
The same pattern is visible in the data on whether or not a woman has had problems accessing healthcare (see Figure 25 on page 40), with less wealthy women much more likely to experience or perceive difficulties. 50% of respondents in Zambia had experienced at least one of the included problems, rising to 69% in rural areas (only 28% in urban areas). The less wealthy respondents experienced problems much more often than their wealthier neighbours; these problems were not limited to being able to pay for their treatment.
Zambia’s patchy and somewhat sparse healthcare coverage directly affects children’s health. Full vaccination coverage is low at 68% of children aged 12–23 months, with 3.2% of children in this age group receiving no vaccinations at all. As with the other indicators of healthcare coverage, the share of children with all basic vaccinations increases in relation to wealth. In the bottom wealth quintile 63% of children were fully vaccinated, while in the top quintile the proportion increased to 80%.188
MA
LNU
TR
ITIO
N IN
ZA
MB
IA

7 NU
TR
ITIO
N PA
TH
WA
Y 3: H
EALT
H SERV
ICES A
ND
ENV
IRON
MEN
T
39
FIGURE 24 HOUSEHOLDS’ DISTANCE TO A HEALTHCARE FACILITY IN 2010
Source: CSO 2012: 246
16+km, 6.5%
16+km, 9.5%
2–5km, 30.5%
2–5km, 34.7%
6–15km, 18.2%
6–15km, 27.9%
Less than 1km, 44.9% Less than
1km, 27.9%
All Zambia Rural Zambia
A neighbourhood health committee at a health centre in Lufwanyama province, Copperbelt province
PHO
TO
: CLE
IS N
OR
DFJ
ELL/
SAV
E T
HE
CH
ILD
REN

40
EVIDENCE OF THE IMPACT OF SOCIAL PROTECTION ON HEALTH SERVICES AND ENVIRONMENT
Unfortunately, when we look at the impact of social protection on the health services and environment linked to nutrition, the evidence is patchy. Water and sanitation and healthcare system coverage are very important for nutrition, but often these are not the main priority for social protection programmes with nutrition and food security objectives. In fact, our review found many cases where, in the same place, one programme was targeting one pathway, and another programme was targeting a different pathway. This means there is not a lot of clear evidence arising from social protection programme evaluations for us to assess how the inclusion of this pathway might impact on the nutrition effect of programmes. Figure 26 opposite suggests the importance of sanitation and shelter but is inconclusive on water and skilled birth attendant (SBA) coverage.
The top section of Figure 26 shows the programmes reporting an impact on each food security indicator and the impact the programme had on stunting or wasting. The lower section of this chart shows programmes reporting no impact on each food security indicator and the impact the programme had on stunting or wasting.
However, there is strong information from Zambia on the importance of clean water. The Zambia Child Grant cash transfer programme was found to reduce stunting rates by 9 percentage points in households that had access to clean water (see Figure 27 opposite). It did not reduce stunting at all in those households without access to clean water.189 This is a powerful finding and shows that even in households that have relatively fewer food security issues (because they are receiving a grant), clean water is necessary, but not sufficient, to improve nutrition outcomes.
FIGURE 25 PROBLEMS ACCESSING HEALTHCARE FOR WOMEN BY WEALTH GROUP
Getting permission
to go for treatment
Getting money for treatment
Distance to health
facility
Having to take transport
Not wanting to go alone
Concern there may not be a
female provider
Any of the specified problems
Source: DHS 2013–14
Per
cen
t
80
70
60
50
40
30
20
10
0
4%
Quintile 1: Least wealthy Quintile 2 Quintile 3 Quintile 4 Quintile 5: Wealthy
2%
42%
8%
62%
11%
60%
9%
31%
8%
13%
9%
75%
25%
MA
LNU
TR
ITIO
N IN
ZA
MB
IA

7 NU
TR
ITIO
N PA
TH
WA
Y 3: H
EALT
H SERV
ICES A
ND
ENV
IRON
MEN
T
41
Sources: Save the Children’s own calculations, based on literature review. See page 88 for literature review references.
Notes: 12 programmes included.
FIGURE 26 IMPACT ON HEALTH ENVIRONMENT vs. IMPACT ON STUNTING/WASTING
0 1 2 3 4 5 6
Number of programmes reporting
Some stunting or wasting impact
No stunting or wasting impact
Access to sanitation improved
Access to “improved” water improved
Use of safe drinking water improved
Access to safe drinking water improved
SBA coverage improved
Protective shelter improved
Access to sanitation not improved
Access to “improved” water not improved
Use of safe drinking water not improved
Access to safe drinking water not improved
SBA coverage not improved
Protective shelter not improved
0
2
1
0
4
1
5
0
4
0
1
0
3
0
0
0
0
0
0
1
0
1
3
2
Source: Seidenfeld et al, 2014: 41
FIGURE 27 ZAMBIA’S CHILD GRANT, ACCESS TO WATER AND EDUCATION
Per
cen
tage
po
int
chan
ge in
stu
nti
ng
0
-1
-2
-3
-4
-5
-6
-7
-8
-9
-10
0
-9
-1.2
Other households
Per additional year of mother’s
schooling
Access to safe water
When we examined the impact of social protection on health-seeking behaviour related to nutrition we found a positive pattern. Improvements in health-seeking behaviours are associated with greater impact on nutrition across all stunting and wasting (including programmes that have an impact on both) and across all of the individual health-seeking behaviours included in the review and shown in Figure 28 overleaf. This strong result underlines the importance of health for nutrition. It is important to note, however, that utilisation of the traditional healthcare system was not evaluated among the programmes included in this review.
The top section of this chart shows the programmes reporting an impact on each food security indicator and the impact the programme had on stunting or wasting. The lower section of this chart shows programmes reporting no impact on each food security indicator and the impact the programme had on stunting or wasting.

42
IMPLICATIONS FOR NUTRITION-SENSITIVE SOCIAL PROTECTION IN ZAMBIA
• Include behaviour change communication (BCC) on safe water, hygiene and sanitation (WASH) practices, food storage and preparation, and timely health-seeking behaviour.
• Include monitoring of WASH and health-seeking behaviour indicators within SCT framework to show impact of BCC activity.
• Review the geographical overlap of SCT and Zambia’s 1000 Days programming to promote linkages between the SCT and WASH programmes and health programmes that focus on malaria, diarrhoea and HIV and AIDS.
More broadly, we suggest access to health services at local levels should be reviewed at district level, with particular attention given to communities with the largest distance to basic health centres.
Sources: Save the Children’s own calculations, based on literature review. See page 88 for literature review references.
Notes: 12 programmes included. Use of traditional healthcare was never assessed in the programmes under review.
FIGURE 28 IMPACT ON HEALTH-SEEKING BEHAVIOUR vs. IMPACT ON STUNTING/WASTING
0 1 2 3 4 5 6 7
Number of programmes reporting
Some stunting or wasting impact
No stunting or wasting impact
Improve seeking health information
Improve timely access
Improve use of modern healthcare system
Improve access to healthcare
No impact seeking health information
No impact timely access
No impact use of modern healthcare system
No impact access to healthcare
6
2
22
21
20
20
6
3
6
2
60
MA
LNU
TR
ITIO
N IN
ZA
MB
IA
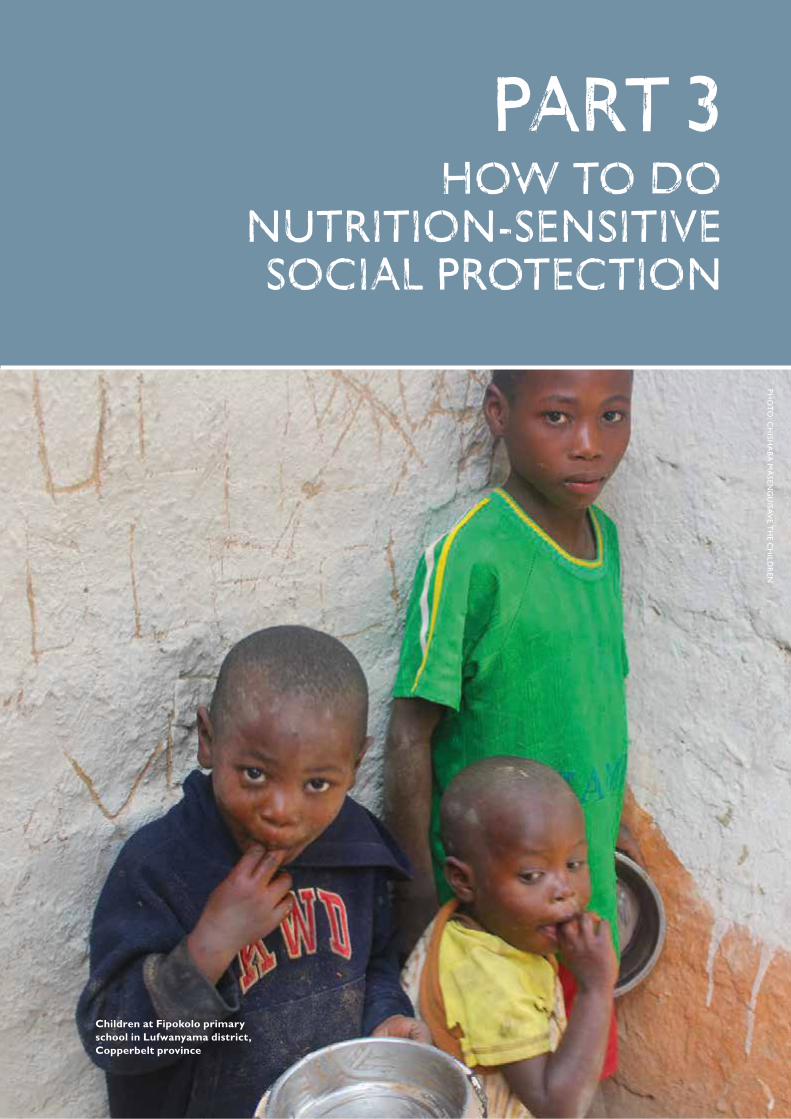
PART 3
Children at Fipokolo primary school in Lufwanyama district, Copperbelt province
PHO
TO
: CH
ISHA
BA
MA
SENG
U/SA
VE T
HE C
HILD
REN
HOW TO DO NUTRITION-SENSITIVE SOCIAL PROTECTION

We have learned a huge amount about the potential of social protection for nutrition in Zambia through our analysis so far. We have identified priority issues and groups. It is now time to think about how to put this learning into action. The remainder of this report will focus on ways to develop the key social protection programme in Zambia, the Social Cash Transfer (SCT), within the national protection system to effectively improve nutrition.
We start by looking closely at the development of social protection and nutrition policies and programming in Zambia to understand opportunities for harmonisation through nutrition-sensitive social protection (sections 8 and 9). We then look at issues related to programme design and present international design principles (10). We then look at the key aspects of governance for nutrition-sensitive social protection development, drawing on global learning, looking at Zambia’s context and identifying areas for improvement (sections 11 and 12). Finally, we pause to reflect on everything we have learned before making specific design recommendations for the development of nutrition-sensitive social protection, through the SCT, in Zambia (section 13).

45
SOCIAL PROTECTION POLICY IN ZAMBIA
Zambia has a long-standing social welfare190 structure beginning with the Public Welfare Assistance Scheme (PWAS) in the 1950s. Several approaches to social protection have been tried. Agricultural subsidies, as a form of social welfare, have always been prominent in Zambia though evaluations have shown limited impact. The Farmer Input Support Programme, which provides subsidised seeds and fertilisers to farmers, and the Food Reserve Agency, responsible for securing national food reserves and stabilising market prices,191 account for nearly 50% of the total agricultural budget.192 Both are categorised within that as poverty reduction programmes,193 yet so far limited evidence has been found to suggest that there has been any impact of statistical significance on the effects of poverty incidence.194
Over the past 15 years, the introduction of a number of pilots and new targeting models, gradual scale-up, increased government financing, and the increased use of impact evaluations have resulted in the consolidation of cash transfers in Zambia’s social protection portfolio. In 2008 the PWAS budget was dramatically reduced with greater emphasis being placed on the Social Cash Transfer (SCT).
Zambia’s national social protection system is coordinated by the Sector Advisory Group on Social Protection (SP-SAG), set up in 2003 and comprising stakeholders from key ministries, civil society, NGOs and cooperating partners. The SP-SAG is chaired by the lead ministry for social protection, the Ministry of Community Development, Mother and Child Health,195 and is responsible for working on policy and implementation issues, including mainstreaming
social protection into the work of other actors, monitoring and evaluation of social protection initiatives, and the preparation of the sector budget.196 The government of Zambia’s articulated major priority for social protection interventions is to protect the poor, especially the vulnerable and the incapacitated.197
The Social Protection Strategy, drafted in 2005 under the leadership of SP-SAG, informs the Social Protection Chapter in the Revised Sixth National Development Plan for 2011–15. The strategy was an attempt to harmonise, prioritise and improve existing social protection approaches in Zambia as well as integrate new ones in response to specific crises, such as the HIV and AIDS pandemic.198 The main vulnerable groups targeted by the strategy are characterised as: low-capacity households (eg, widows, disabled people, other marginalised, low-income households and informal sector operators); households with no one fit to work; child-headed households; and street children.
The 2014 National Social Protection Policy (NSSP) is the most significant recent policy development for social protection in Zambia since it featured in the Fifth National Development Plan in 2005. The policy is based on four pillars and contains important objectives related to nutrition-sensitive social protection, as set out in Table 5 on page 47.
The SCT is positioned as the primary intervention within the NSSP. The SCT, the largest social protection programme in the country, was originally fully financed by donors. In 2010 the government took full ownership and started financing part of its cost. This was the result of increased exposure of ministry officials to programme impact and lessons.
8 SOCIAL PROTECTION AND NUTRITION POLICY DEVELOPMENT
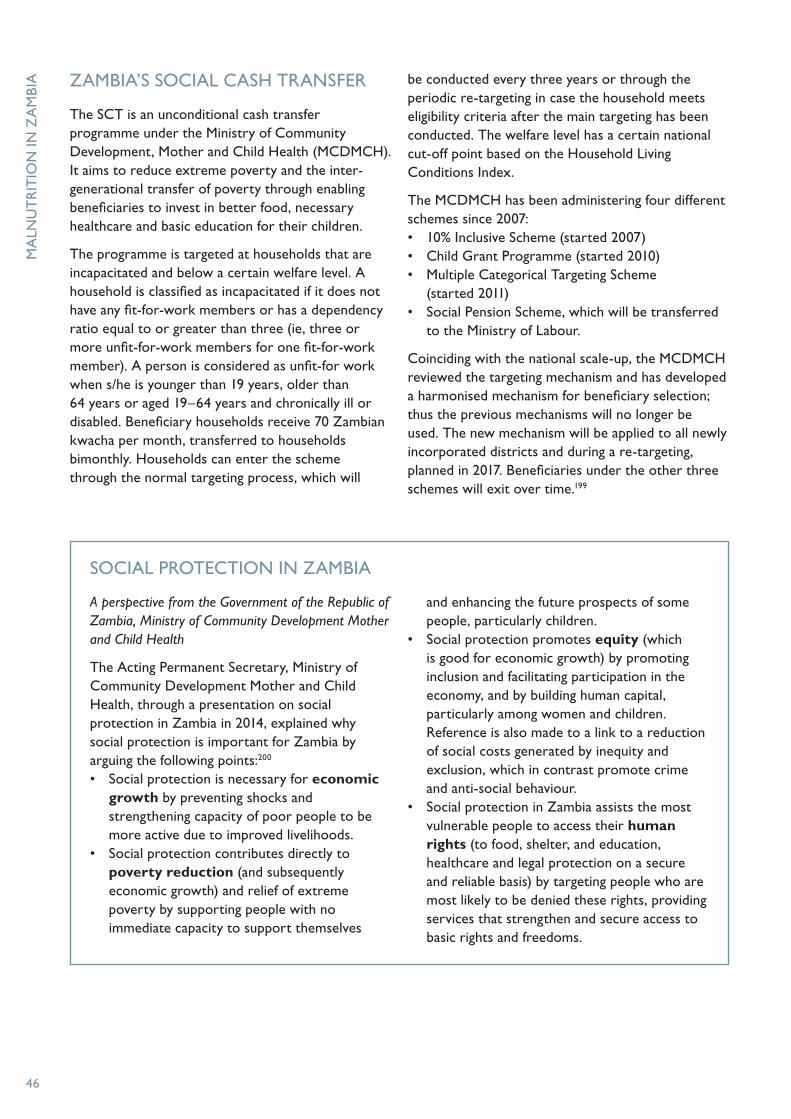
46
ZAMBIA’S SOCIAL CASH TRANSFER
The SCT is an unconditional cash transfer programme under the Ministry of Community Development, Mother and Child Health (MCDMCH). It aims to reduce extreme poverty and the inter-generational transfer of poverty through enabling beneficiaries to invest in better food, necessary healthcare and basic education for their children.
The programme is targeted at households that are incapacitated and below a certain welfare level. A household is classified as incapacitated if it does not have any fit-for-work members or has a dependency ratio equal to or greater than three (ie, three or more unfit-for-work members for one fit-for-work member). A person is considered as unfit-for work when s/he is younger than 19 years, older than 64 years or aged 19–64 years and chronically ill or disabled. Beneficiary households receive 70 Zambian kwacha per month, transferred to households bimonthly. Households can enter the scheme through the normal targeting process, which will
be conducted every three years or through the periodic re-targeting in case the household meets eligibility criteria after the main targeting has been conducted. The welfare level has a certain national cut-off point based on the Household Living Conditions Index.
The MCDMCH has been administering four different schemes since 2007: • 10% Inclusive Scheme (started 2007)• Child Grant Programme (started 2010)• Multiple Categorical Targeting Scheme
(started 2011) • Social Pension Scheme, which will be transferred
to the Ministry of Labour.
Coinciding with the national scale-up, the MCDMCH reviewed the targeting mechanism and has developed a harmonised mechanism for beneficiary selection; thus the previous mechanisms will no longer be used. The new mechanism will be applied to all newly incorporated districts and during a re-targeting, planned in 2017. Beneficiaries under the other three schemes will exit over time.199
SOCIAL PROTECTION IN ZAMBIA
A perspective from the Government of the Republic of Zambia, Ministry of Community Development Mother and Child Health
The Acting Permanent Secretary, Ministry of Community Development Mother and Child Health, through a presentation on social protection in Zambia in 2014, explained why social protection is important for Zambia by arguing the following points:200 • Social protection is necessary for economic
growth by preventing shocks and strengthening capacity of poor people to be more active due to improved livelihoods.
• Social protection contributes directly to poverty reduction (and subsequently economic growth) and relief of extreme poverty by supporting people with no immediate capacity to support themselves
and enhancing the future prospects of some people, particularly children.
• Social protection promotes equity (which is good for economic growth) by promoting inclusion and facilitating participation in the economy, and by building human capital, particularly among women and children. Reference is also made to a link to a reduction of social costs generated by inequity and exclusion, which in contrast promote crime and anti-social behaviour.
• Social protection in Zambia assists the most vulnerable people to access their human rights (to food, shelter, and education, healthcare and legal protection on a secure and reliable basis) by targeting people who are most likely to be denied these rights, providing services that strengthen and secure access to basic rights and freedoms.
MA
LNU
TR
ITIO
N IN
ZA
MB
IA
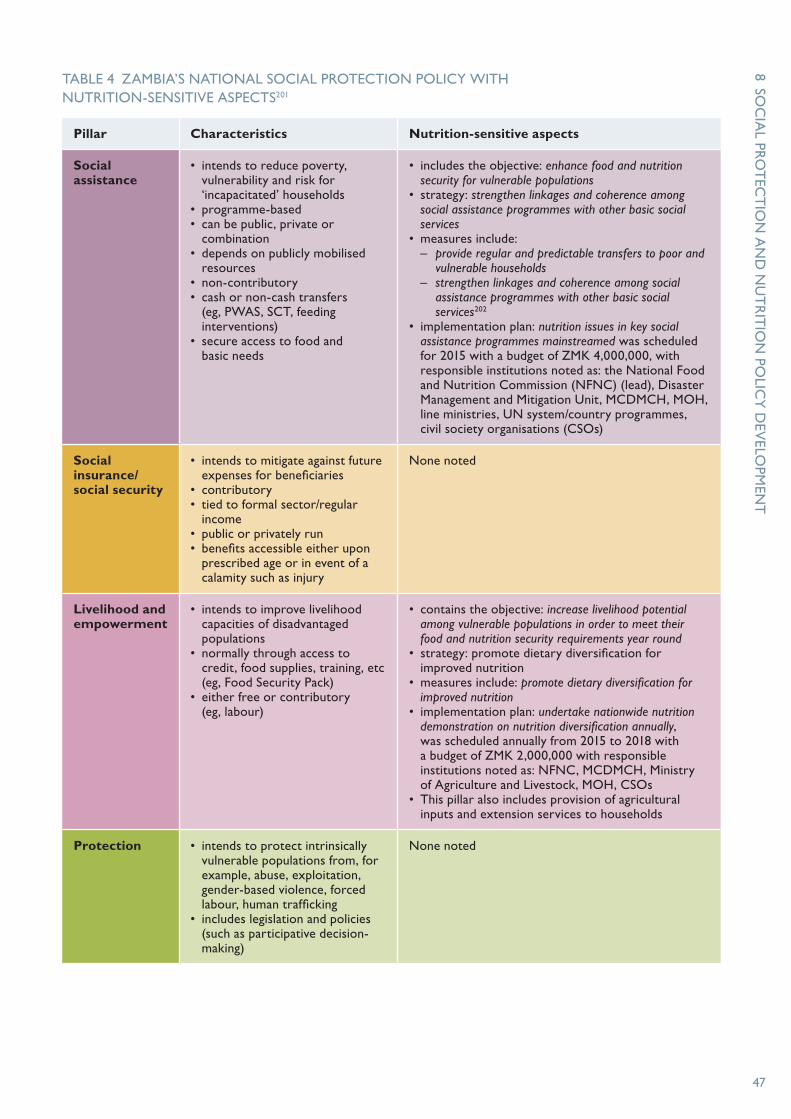
8 SOC
IAL PRO
TEC
TIO
N A
ND
NU
TR
ITIO
N PO
LICY
DEV
ELOPM
ENT
47
TABLE 4 ZAMBIA’S NATIONAL SOCIAL PROTECTION POLICY WITH NUTRITION-SENSITIVE ASPECTS201
Pillar Characteristics Nutrition-sensitive aspects
Social assistance
• intends to reduce poverty, vulnerability and risk for ‘incapacitated’ households
• programme-based • can be public, private or
combination• depends on publicly mobilised
resources• non-contributory• cash or non-cash transfers
(eg, PWAS, SCT, feeding interventions)
• secure access to food and basic needs
• includes the objective: enhance food and nutrition security for vulnerable populations
• strategy: strengthen linkages and coherence among social assistance programmes with other basic social services
• measures include: – provide regular and predictable transfers to poor and
vulnerable households– strengthen linkages and coherence among social
assistance programmes with other basic social services202
• implementation plan: nutrition issues in key social assistance programmes mainstreamed was scheduled for 2015 with a budget of ZMK 4,000,000, with responsible institutions noted as: the National Food and Nutrition Commission (NFNC) (lead), Disaster Management and Mitigation Unit, MCDMCH, MOH, line ministries, UN system/country programmes, civil society organisations (CSOs)
Social insurance/ social security
• intends to mitigate against future expenses for beneficiaries
• contributory • tied to formal sector/regular
income• public or privately run• benefits accessible either upon
prescribed age or in event of a calamity such as injury
None noted
Livelihood and empowerment
• intends to improve livelihood capacities of disadvantaged populations
• normally through access to credit, food supplies, training, etc (eg, Food Security Pack)
• either free or contributory (eg, labour)
• contains the objective: increase livelihood potential among vulnerable populations in order to meet their food and nutrition security requirements year round
• strategy: promote dietary diversification for improved nutrition
• measures include: promote dietary diversification for improved nutrition
• implementation plan: undertake nationwide nutrition demonstration on nutrition diversification annually, was scheduled annually from 2015 to 2018 with a budget of ZMK 2,000,000 with responsible institutions noted as: NFNC, MCDMCH, Ministry of Agriculture and Livestock, MOH, CSOs
• This pillar also includes provision of agricultural inputs and extension services to households
Protection • intends to protect intrinsically vulnerable populations from, for example, abuse, exploitation, gender-based violence, forced labour, human trafficking
• includes legislation and policies (such as participative decision-making)
None noted

48
NUTRITION POLICY IN ZAMBIA
Zambia recognised the importance of nutrition more than 40 years ago. The National Food and Nutrition Commission (NFNC) was established in 1967 under the jurisdiction of the Ministry of Health. The NFNC was designated, as it still is today, as the convening body to coordinate action on nutrition, and to provide technical advice and food and nutrition training to various sectors.203 The objectives of the commission, as articulated in the 1967 Act,204 include:• to reduce mortality due directly or indirectly to
malnutrition in children and focus public attention on the nutritional needs of children and youth
• to improve the nutritional status of vulnerable groups (mothers, infants, school and pre-school children)
• to create community interest in better nutrition, to arouse public awareness of the serious impact of malnutrition and to instil public confidence in the solutions to the problems.
However, it was not until the Fifth (2005–10) and Sixth (2011–15) National Development Plans that the high levels of malnutrition in the country began to draw high-level attention and prompt concerted action.
Many acknowledge Zambia joining the Global Scaling Up Nutrition (SUN) movement in 2010 as a pivotal moment for nutrition in the country, establishing nutrition as a development priority and increasing high-level political commitment.205 One of the most significant examples is the Zambian vice-president’s commitment to reducing chronic undernutrition by
50% in the next ten years (from 2013), at the June 2013 Nutrition for Growth Summit in London.206 Subsequently, 2014 saw a flurry of activity including the launch of the Zambia National 1000 Most Critical Days Programme, the development of the first Nutrition Workforce Plan and the establishment of a Cabinet Steering Committee on Nutrition and increased, though arguably still insufficient, nutrition budgets.207
Zambia joining SUN is also recognised as an important moment for multi-sector coordination for nutrition in Zambia. Previously there were no alliances, partnerships or unified efforts across sectors dealing with nutrition matters, leading to irregular consultation, poor coordination and “duplication and conflict of efforts”.208 In 2014 the NFNC voted to expand its mandate across sectors to improve coordination, confirming its current position as an independent multi-sector platform for nutrition.209
Other coordination structures include:210
• Nutrition Coordination Committees established in some districts and provinces by key ministries and civil society organisations with responsibility for nutrition are involved in multi-sector district planning, facilitated by NFNC through the District Commissioners’ Offices.
• Nutrition Cooperating Partners’ Group brings together donors engaged in scaling up nutrition in the country, including UN agencies. This group is represented in several multi-sectorial platforms.
• CSO-SUN Alliance facilitates diverse civil society actors to raise demand and understanding of nutrition interventions.
THE FIRST 1000 MOST CRITICAL DAYS PROGRAMME (2013–15)211
A three-year framework and implementation plan, The First 1000 Most Critical Days Programme, guides stakeholders to undertake related work, set out under the five strategic areas:1. policy and coordination for robust
stewardship, harmonisation and coordination of the programme
2. priority interventions across sectors to reduce stunting
3. institutional, organisational and human resource, capacity-building
4. communications and advocacy5. monitoring, evaluation and research.
Social protection is recognised as a supporting strategy under strategic area 2, through the objective: ‘Social protection initiatives for prevention of stunting and treatment of moderate acute malnutrition.’ The following ambition is stated: Social protection interventions such as cash and food voucher transfers, alternative livelihood support activities and income generating activities will aim at building resilience to food and nutrition insecurity, targeting women, children and adolescent girls from nutritionally vulnerable households.
MA
LNU
TR
ITIO
N IN
ZA
MB
IA

8 SOC
IAL PRO
TEC
TIO
N A
ND
NU
TR
ITIO
N PO
LICY
DEV
ELOPM
ENT
49
• MPs on SUN, a network comprising Members of Parliament (MPs) acting as champions of nutrition, which contributes to improved accountability of national nutrition efforts.
Despite the attention nutrition has received in recent years, Zambia ranks 30th (out of 45 countries) on the Hunger and Nutrition Commitment Index (HANCI),212 which compares developing countries’ performance on 22 indicators of political commitment to reduce hunger and undernutrition. Strengths and areas for improvement identified by HANCI are integrated into the governance analysis in section 11, ‘Key aspects of governance for nutrition-sensitive social protection’, page 59.
IMPLICATIONS FOR NUTRITION-SENSITIVE SOCIAL PROTECTION IN ZAMBIA
Nutrition and social protection strategies are currently not closely aligned. Ensuring these strategies are linked and mutually supportive is a key area to be addressed to support higher development returns through nutrition-sensitive social protection in Zambia.213 Please see section 11, page 59, ‘Key aspects of governance for nutrition-sensitive social protection’, for more details and recommendations on how this can be achieved.
Children fetch water at the clinic in Kapilamikwa village, Lufwanyama district, Copperbelt province
PHO
TO
: CH
ISHA
BA
MA
SENG
U/SA
VE T
HE C
HILD
REN
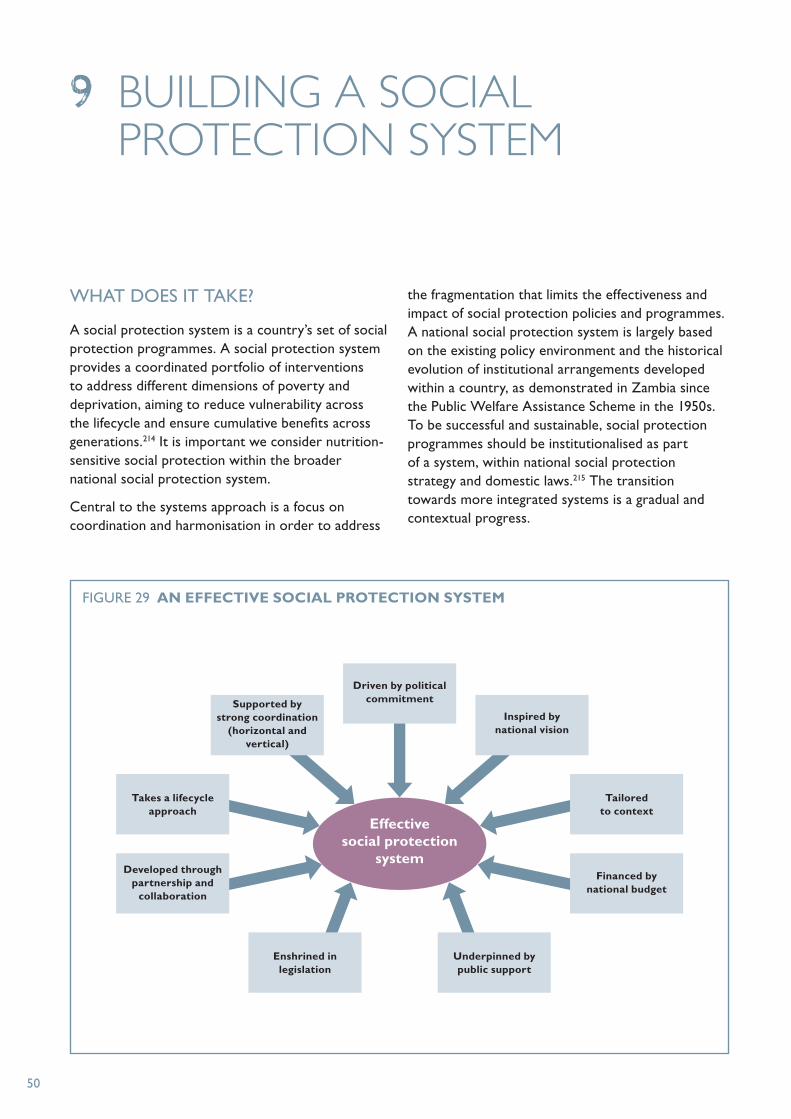
50
WHAT DOES IT TAKE?
A social protection system is a country’s set of social protection programmes. A social protection system provides a coordinated portfolio of interventions to address different dimensions of poverty and deprivation, aiming to reduce vulnerability across the lifecycle and ensure cumulative benefits across generations.214 It is important we consider nutrition-sensitive social protection within the broader national social protection system.
Central to the systems approach is a focus on coordination and harmonisation in order to address
the fragmentation that limits the effectiveness and impact of social protection policies and programmes. A national social protection system is largely based on the existing policy environment and the historical evolution of institutional arrangements developed within a country, as demonstrated in Zambia since the Public Welfare Assistance Scheme in the 1950s. To be successful and sustainable, social protection programmes should be institutionalised as part of a system, within national social protection strategy and domestic laws.215 The transition towards more integrated systems is a gradual and contextual progress.
9 BUILDING A SOCIAL PROTECTION SYSTEM
FIGURE 29 AN EFFECTIVE SOCIAL PROTECTION SYSTEM
Effective social protection
system
Driven by political commitment
Underpinned by public support
Financed by national budget
Tailored to context
Inspired by national vision
Supported by strong coordination
(horizontal and vertical)
Takes a lifecycle approach
Developed through partnership and
collaboration
Enshrined in legislation

51
Social protection can have a tremendous effect on nutrition if certain principles are followed. Based on our findings of the previous chapters, including the literature review on international country examples and analysis of the specific Zambian context, we are now able to consider the design implications for harnessing social protection in Zambia for nutrition. In particular, we look at how to improve the design of Zambia’s Social Cash Transfer (SCT) programme – making it nutrition-sensitive. We look at linkages, objectives, target group, transfer size and programme duration. We explore key debates around social protection programmes. Finally we conclude with specific recommendations across the pathways and present international design principles.
LINKAGES
Social protection should not be seen as a stand-alone pillar for improving the lives of the poorest and most vulnerable people. Rather, it should be complemented by investments in other sectors such as health, water, sanitation, education and shelter,216 not only because it can increase effectiveness and positive outcomes within these sectors but also because of their importance for the nutrition pathways and to harness the greatest positive effects on nutrition. Social protection can be used as a platform for nutrition-sensitive and nutrition-specific interventions, with potential for increasing the scale, coverage and effectiveness of these interventions. A key requisite here is that basic social services are in place and functioning to provide the necessary framework.
10 DESIGN IMPLICATIONS OF NUTRITION-SENSITIVE SOCIAL PROTECTION
Children at a community school in Kazungulu district, Southern province
PHO
TO
: CLEIS N
OR
DFJELL/SA
VE T
HE C
HILD
REN
52
International experience shows how a multi-sectoral response, linking initiatives from various sectors, can lead to lasting positive results. A prominent example is Brazil’s Zero Hunger Strategy, which made nutrition a national priority.217 The strategy was carried by various ministries including the Ministries of Social Development, Education, Health, and Agriculture and Livestock. Since its launch in 2003, nutrition outcomes have been progressively but significantly improving in Brazil;218 between 1996 and 2006–10 the prevalence of stunting fell from 13.5% to 7.1%.219
In order for the SCT to impact nutrition outcomes it should be linked to complementary programmes in the following three sectors: • Health: As shown in our pathways analysis,
prevalence of HIV, diarrhoea and malaria in Zambia is high.220 Evidence shows that nutritional status influences the ability of the body to successfully fight these diseases.221 Therefore, for the SCT, the emphasis should be on linking to health initiatives addressing diarrhoea, malaria and HIV and AIDS.
• Agriculture: As dietary diversity is a major concern (see page 24), social protection initiatives should be linked with agricultural initiatives to help leverage production and consumption constraints. Beneficiaries of the SCT could receive complementary services through input subsidies specifically designed to reach vulnerable small-scale farmers,222 access to loans directed to small-scale farmers223 to allow for asset building, or crop insurance224 to encourage production of higher-risk crops.
• Water, sanitation and hygiene (WASH): As shown by the results of the Zambia Child Grant Programme, access to clean water is crucial for improved nutrition outcomes.225 The SCT should be linked to initiatives of the relevant institutions (Ministry of Local Government and Housing, National Water Supply and Sanitation Council, local government, commercial utilities, private schemes), providing access to safe water to beneficiary households, as well as safe sanitation.
These linkages could be made through a variety of steps. To start, the relevant complementary services, provided by the public and private sector, and NGOs, should be mapped. If possible, this mapping should be done at district level to allow local as well as national linkages. Larger programmes, which are administered nationwide and/or cover multiple districts where the SCT is operating, should be linked
at national level to ensure all beneficiaries have access to the same complementary services and create a coherent base of evidence. In addition, at the policy level, there should be emphasis on coordination between the initiatives of different ministries, through the development of joint desired outcomes and action plans. A good example for this would be the 1000 Days programme. However, based on the initiatives found through the mapping exercise, beneficiaries can also be linked to programmes with smaller coverage. Sufficient administrative capacity at all levels would be required to manage these processes (see section 11, page 59 for information on linkages in relation to the policy framework and coordination).
Also, access to these complementary services should be tailored to the specific needs of the household and well-sequenced,226 which would require data collection on household composition to assess the needs of the households. Within the linkages it is important that programmes and initiatives follow the same messaging and avoid giving contrary messages to the beneficiaries. Messaging can be delivered in a number of ways: for example, information on other programmes could be delivered at cash points to ensure that all beneficiaries are reached.
INTERNATIONAL DESIGN PRINCIPLES FOR NUTRITION-SENSITIVE SOCIAL PROTECTION
In the short term, food security and wasting can be addressed quite effectively through food transfers. However, to address chronic malnutrition and reduce stunting rates, long-term integrated programmes that consider a number of the nutrition pathways are required.
The development of nutrition-sensitive social protection internationally should include the following key steps and be informed by our international design principles (see Table 5 opposite): • Assess the context and evidence across nutrition
pathways to identify priorities and analyse policy options (as we have done through this report for Zambia).
• Identify key ministries and other bodies at national and local level for coordination and cooperation.
• Include and evaluate a range of pathway indicators to assess success against malnutrition and to inform multi-sector development plans.
MA
LNU
TR
ITIO
N IN
ZA
MB
IA

10 DESIG
N IM
PLICA
TIO
NS O
F NU
TR
ITIO
N-SEN
SITIV
E SOC
IAL PRO
TEC
TIO
N
53
TABLE 5 INTERNATIONAL DESIGN PRINCIPLES TO MAKE SOCIAL PROTECTION PROGRAMMES AND POLICIES NUTRITION-SENSITIVE
Cross-cutting aspects
• Understand the local causes of malnutrition (supply, access, care, environment).
• Clarify the pathways through which the programme is intended to have an impact on nutrition.
• Reach adolescent girls as a key vulnerable group.
• Prevent general negative side effects, particularly on the causes of both undernutrition and obesity.
• Be gender-sensitive.
• Integrate behaviour change communication (BCC) and nutrition education.
• Ensure programme lifespan is long enough for change to occur.
• Consider integration of soft conditionalities (which are not enforced) to generate demand for specific services such as health and nutrition.
• Have a functioning referral system, potentially based on a single household registry.
Household food security
• Include choice of impact indicators (as a minimum, dietary diversity for women).
• Provide transfers in an appropriate form (examples of consideration of nutrition in development of form) and frequency.
• Adjust cash/voucher benefit level to the cost of a nutritious diet.
Examples of social protection instruments
• food transfers
• cash transfers
• public works programmes
• input subsidies (reduced cost of food)
• social insurance
Caring practices for women and children
• Ensure women’s economic empowerment and improved decision-making within households.
• Integrate nutrition-focused complementary action, eg, food supplements, nutritional BCC on infant and young child feeding.
• Minimise time spent (and cost) for beneficiaries to receive the transfer, eg, using mobile phones.
• Exempt pregnant women from work requirement or provide a work option that is oriented towards women.
• Reach the 1,000 days: pregnant/lactating women and children under two years old.
Examples of social protection instruments
• food transfers
• cash transfers
• nutrition education and behaviour change
• labour regulations
Health services and environment
• Integrate social protection programmes with health services by putting in place coordinating mechanisms and synergetic linkages and ensure the delivery of good-quality health services to increase the impact on nutritional outcomes.
• Extend access to health, clean drinking water and sanitary services to poor and vulnerable households.
• Integrate nutrition-focused complementary health actions, such as distribution of food supplements, growth monitoring, nutritional training and deworming.
Examples of social protection instruments
• food transfers
• cash transfers
• links to health and sanitation services
• water, sanitation and hygiene (WASH) education

54
• Ensure the type of programme fits the local context and take into consideration what types of complementary services are available, making linkages to existing services across the nutrition pathways.
• Consider the integration of empowerment, behaviour change communication and income-generating activities to encourage sustainable outcomes.
• Consider the integration of soft conditionalities (which are not enforced) to generate demand for complementary services with health, WASH, education, etc.
ZAMBIA’S SOCIAL CASH TRANSFER
WHY WORK WITH THE SOCIAL CASH TRANSFER?
In November 2015 the SCT was operating in 50 districts, covering 145,000 households227 (see Figure 30 opposite). The government of Zambia plans to expand it to 27 additional districts in 2016 and to roll-out the programme nationwide in 2017/18. The SCT provides an opportunity to address nutrition for the poorest and most vulnerable populations nationwide.
HOW TO MAKE ZAMBIA’S SOCIAL CASH TRANSFER NUTRITION-SENSITIVE
In order for the SCT to be nutrition-sensitive and to have an impact on chronic malnutrition (stunting) in Zambia, the following design principles, which cover cross-cutting aspects and specific nutrition pathways, should be applied.
• MAKE NUTRITION A SPECIFIC OBJECTIVE, WITH SUPPORTING INDICATORS
Laying out a specific nutrition objective will influence the design of a programme, leading to the inclusion of nutrition-sensitive design parameters as well as clearly measuring nutrition outcomes. Most importantly, through a nutrition objective a clear pathway on how the programme is meant to address nutrition is included, giving the programme a clear target instead of just the possibility of improving nutrition as one of many unintended consequences of the programme. Also, potential negative impacts on nutrition might be avoided. Our review shows that including nutrition-sensitive design features
is associated with better nutrition outcomes, see Figure 31 on page 56.
The objective of the SCT is to “Reduce extreme poverty and the inter-generational transfer of poverty by enabling poor families to invest in better food, necessary healthcare and basic education so that their children will be more likely to be non-poor in the future.”229
Although it is positive that the objective refers to “better food”, which implies a focus on quality of food instead of quantity of food, this objective centres on food instead of nutrition. As demonstrated through this report, the focus of the SCT has to be extended from food security to include a focus on nutrition, for lasting positive impacts.
As well as the three pathways, supporting indicators should encompass cross-cutting issues, for example: nutrition outcomes for the target group, and children specifically; the quantity and quality of food available; women’s education and empowerment; infant and young child feeding; health-seeking behaviour; access to shelter; health services; and water and sanitation.
• SPECIFICALLY TARGET CHILDREN AND PREGNANT WOMEN, AND ADDRESS THE FIRST 1,000 DAYS
With the Child Grants Programme (one of the SCT pilots), Zambia had a programme specifically targeted at children (ie, households with children under five years). However, with the development of the new targeting criteria the Child Grants Programme will gradually cease to exist. Under the new targeting criteria, households with young children will no longer be specifically targeted, but rather included indirectly through the incapacity criteria and through those falling under the welfare threshold (the poorest 10%). Given that the SCT specifically aims to reduce the inter-generational transmission of poverty, a focus on vulnerable children is imperative. Specifically, the Child Grants Programme under the previous scheme showed positive (albeit not significant) impact on stunting (reduction from 34.8% to 32.9%)230 and improvements in households’ food consumption, dietary diversity and food security. It remains to be seen how many children will be reached under the new targeting criteria. Also, as our research has shown, stunting levels do not differ a great deal between the poorest and second poorest quintile and in general are high among the poorest three quintiles. Therefore, the new targeting
MA
LNU
TR
ITIO
N IN
ZA
MB
IA

10 DESIG
N IM
PLICA
TIO
NS O
F NU
TR
ITIO
N-SEN
SITIV
E SOC
IAL PRO
TEC
TIO
N
55
criteria may risk leaving behind children in poor but comparatively better-off households in the second poorest quintile. Analysis of coverage and outcomes, of the old targeting protocol versus the new protocol, should be completed.
• BASE THE TRANSFER SIZE ON HOUSEHOLD SIZE AND COST OF A NUTRITIOUS DIET
International evidence shows that the size of the transfer has a major impact on nutrition outcomes. In general, it can be said that the higher the transfer level is, the better the outcomes for nutrition.231 To have a positive impact on nutrition the transfer size should take into account the cost of a nutritious (not caloric) diet, while not being so high as to provide disincentives to work. Of equal importance, the transfer size should be adjusted to the household size, enabling households to cater for all their members. Programmes that have transfer sizes
based on the number of household members fare better in terms of nutrition outcomes, as seen in Figure 32 overleaf.
The transfer size for the SCT is 70 kwacha per household per month and is not adjusted to the size of the household. Therefore, it is reasonable to assume the impact for bigger households might be lower.
In relation to nutrition it is important to consider how the transfer relates to the minimum food basket. In 2010 the food basket for Zambia cost 96,366 kwacha for a family of six to meet minimum nutritional requirements.232 Applying the 2010 values, the current transfer covers 72% of the food basket. It can be estimated though that the cost of the minimum food basket has increased since then.233 A separate assessment of the cost of the nutritious diet would be beneficial to provide more insight into the expenditure levels necessary for a nutritious diet.
FIGURE 30 SOCIAL CASH TRANSFER COVERAGE IN ZAMBIA Chiengi
Kaputa
Nsama
Mpulungu
MbalaNchelenge
Nakonde
Mungwi
MporokosoKawambwa
Mwansabombwe Isoka
Ma�nga
Chama
Chinsali
Shiwamg’andu
Kasama
Mpika
Lundazi
Chilubi
LungaSamfya
Mansa
MilengiChembe
Vubwi
Mambwi
Chipata
ChadizaKatete
Sinda
Petauke
Nyimba
Serenje
Chitambo
Mkushi
Luano
Rufunsa
Luangwa
Masaiti
Kapiri Mposhi
Mpongwe
Kabwe
Chisamba
Ngabwe
Chibombo
ChongweLusaka
Kafue
ChilangaShibuyunji
Mazabuka
Chikankanta Chirundu
Siavonga
Monze
GwembePemba
ChomaKalomo
Zimba
Sinazongwe
Namwala
Itezhi-tezhi
Kazungula
Livingstone
Mulobezi
Mwandi
Kasempa
MumbwaNkeyema
Mufumbwe
Lukulu
Kaoma
Luampa
Kabompo
Manyinga
Zambezi
Chavuma
Mitete
Mongu
Senanga
Nalolo
Sesheke
Sioma
Shangombo
Sikongo
Kalabo
Limulunga
Ikelenge
Mwinilunga
Solwezi
LuwinguChipili
Mwense
Lufwanyama
Chililabombwe
Mufulira
Kitwe Ndola
Luanshya
Kalulushi
Chingola
Source: MCDMCH Social Cash Transfer Programme Fact Sheet (2014)228
SCT operating in district

56
Source: Save the Children’s own calculations, based on literature review. See page 88 for literature review references.
Notes: 12 programmes with anthropometric measurement are included. Each row only includes programmes that have this design feature. Some design features included in the review are not included in this chart. This is because they are either universally adopted or very rarely adopted so that the comparison on nutrition outcomes is not possible.
FIGURE 31 IMPACT OF NUTRITION-SENSITIVE DESIGN FEATURES ON STUNTING/WASTING
0 1 2 3 4 5 6 7 8 9 10
Number of programmes reporting
Some stunting or wasting impact
No stunting or wasting impact
Health conditionalities or complementary programmes
Include deworming
Include infant feeding or food supplements
Include nutrition awareness or training
Childrens’ first 1,000 days?
Nutrition-sensitive amount for transfers
Nutrition-sensitive form and frequency
Use nutrition in impact indicators?
Prevention of any negative side effects
Clarified the pathways
Undertaken a contextual analysis
Integrated within broader nutrition strategies
51
93
42
61
21
73
52
12
10
20
20
52
Sources: See references list for literature review on page 88.
Notes: 12 programmes included for stunting and wasting and anthropometric measures, 16 included for food consumption.
FIGURE 32 TRANSFER SIZE ADJUSTED TO HOUSEHOLD SIZE AND NUTRITION OUTCOMES
0 1 2 3 4 5 6 7
Number of programmes reporting
Adjusted transfer
Transfer not adjusted
Increased food consumption
Some stunting or wasting impact
>50% assessed measures improved
No increase in food consumption
No stunting or wasting impact
<50% assessed measures improved
32
12
12
63
63
56
MA
LNU
TR
ITIO
N IN
ZA
MB
IA

10 DESIG
N IM
PLICA
TIO
NS O
F NU
TR
ITIO
N-SEN
SITIV
E SOC
IAL PRO
TEC
TIO
N
57
In addition, throughout programme implementation it is advisable to monitor fluctuations in food prices, which could trigger an increase of the transfer size, therefore requiring regular budget adjustments.
• INCLUDE BEHAVIOUR CHANGE COMMUNICATION
Discussions of cash transfer programmes are commonly accompanied by debates on whether the receipt of cash should be linked to any conditions on the part of the beneficiary, such as regular medical check-ups of children or school enrolment and attendance. This debate is often driven at a political level, particularly in relation to domestically financed programmes, with a presumption that linking cash to conditions instead of ‘hand-outs’ will promote buy-in from the middle class.234 Empirical evidence in general shows that beneficiaries of cash transfers, with or without conditions, invest in health and education for their children.235 The benefits of conditions, particularly when administration costs are considered, are therefore questionable. For nutrition specifically, international evidence suggests that conditional cash transfers might have a better impact on nutrition. However, the difference in numbers in any given nutrition outcome is small (see Figure 33). Evidence suggests that while conditions do sometimes help in terms of nutrition, in many cases unconditional cash transfers can provide equally good results, with the advantage of being easier and cheaper to implement and administer.
Behaviour change communication (BCC) can be included as a soft condition, ie, not enforced, and is a strong tool for improving outcomes on nutrition. Knowledge on what should or should not be done is often not enough to create a change in behaviour, therefore targeted BCCs are needed. The content of the BCCs should be informed by a knowledge, attitudes, practice and barriers analysis and be developed conjointly with the respective ministry leading in a sector. An analysis of the human resource capacity of the different sectors should be conducted to be clear about the roles and responsibilities that staff, for example health workers, can take in the process. BCCs should cover all the three pathways:• Household food security: Evidence shows
that including nutrition awareness sessions can have a positive impact on stunting or wasting (see Figure 33). BCC should focus on the importance of dietary diversity, addressing the lack of dietary diversity as shown in our pathway analysis.
• Caring practices: Given the importance of exclusive breastfeeding rates during the first six months and our findings that show many children are introduced too early to certain food categories, BCCs have to focus on infant and young child feeding practices, including exclusive breastfeeding for the first six months and dietary diversity for children aged six to 24 months.
• Health services and environment: Given the links between nutrition and diseases such as malaria and diarrhoea, BCC should focus on WASH and timely health-seeking behaviour so as to ensure appropriate care.
Sources: See references list for literature review on page 88.
Notes: 12 programmes included for stunting and wasting and anthropometric measures, 16 included for food consumption.
FIGURE 33 CASH TRANSFERS, CONDITIONS AND NUTRITION IMPACT
0 10 20 30 40 50 60 70 80 90 100
Percentage of programmes
>50% assessed measures improved
Some stunting or wasting impact
Increased food consumption
<50% assessed measures improved
No stunting or wasting impact
No increase in food consumption
0 conditions
2 conditions
3 or more conditions

58
For the best results, BCCs should follow an approach of gender inclusivity by including men and boys alongside women and girls. This can lead to greater acceptance of the messages that are transmitted within households and families, and make it easier for all household and family members, especially women and girls, to adopt new behaviours.
BCC can be combined with the payment events, thus happening every other month. In addition, the use of technology, such as mobile phones, for BCC can be a very effective tool. This would be a feasible option, if the government of Zambia was to consider a move to electronic payments using mobile phones.
• MAINTAIN A PROGRAMME DURATION THAT ENSURES IMPACT
The longer a household is a beneficiary of a cash transfer programme, the better the nutrition results for a child.236 The SCT aims to re-target households every three years so a household, if enrolled during the initial targeting, will benefit for three years from the programme. This minimum duration should be maintained.
DO CASH TRANSFERS CREATE DEPENDENCY?
Linked to the debate of conditional versus unconditional transfers is the debate on dependency. The argument often heard is that the programmes will make beneficiary households dependent on the cash and disincentivise them from attempting to improve their economic situation themselves. However, evidence does not largely show those effects. Design features that minimise risks that programmes will create dependency are, for example, rigorous targeting to the most vulnerable groups
It should also be noted that for certain programmes the aim is to support the most vulnerable and labour-constrained who need external assistance. The cash is actually meant to support the households in their current situation as they themselves do not have the capability.
As a general rule, programmes should generate evidence on wide-ranging impacts to provide further evidence on the dependency debate.
MA
LNU
TR
ITIO
N IN
ZA
MB
IA

59
A strong governance system lays the foundation for an enabling environment to maximise the impact of nutrition-specific and nutrition-sensitive policies and programmes,237 through a social protection system. Furthermore, as is evident in many countries where undernutrition continues to pose a threat to the population, including Zambia, the influence of politics and governance is critical in the creation of a sustained political force to maintain productivity on the ground.238
Brazil and Peru have made substantial progress in tackling nutrition through social protection systems.241 Key to their success has been the acceleration of progress in nutrition and health outcomes over recent decades through strong political commitment, a supportive institutional framework and multi-sector engagement. Both countries have utilised governance as a mechanism to connect national, municipal and regional governments to the food-insecure population.
Learning from the experiences of these two countries, the following three factors should be considered when developing governance structures to support nutrition-sensitive social protection systems:
RESPONSIVENESS
• high level of government commitment • sustainable funding and investment • clearly defined, context- and target-specific
national priorities.
MULTI-SECTOR ENGAGEMENT
• community and beneficiary engagement • a vibrant civil society • an active private sector.
INSTITUTIONAL FRAMEWORK
• effective monitoring and evaluation • strong coordination and legislation• international support.
The following tables contain detail on each of the three priority areas in developing a nutrition-sensitive social protection system. They present global learning, the situation in Zambia, and a summary of what it means for nutrition-sensitive social protection in Zambia, which informs this report’s recommendations.
11 KEY ASPECTS OF GOVERNANCE FOR NUTRITION-SENSITIVE SOCIAL PROTECTION
UNDERSTANDING GOVERNANCE
Governance refers to the exercise of political and administrative authority at all levels to manage a country’s affairs. Governance comprises the mechanisms, processes and institutions through which citizens and groups articulate their interests, exercise their legal rights, meet their obligations and mediate their differences.239
Good governance has eight major characteristics. It is:240
• participatory• consensus oriented• accountable• transparent• responsive• effective and efficient• equitable and inclusive• conducted following the rule of law.
Good governance ensures that corruption is minimised, the views of communities are taken into account, and the voices of the most vulnerable people in society are heard in decision-making processes.

High level of government commitment
Global learning
Strong executive leadership and agenda-setting in Brazil and Peru have been central to respective successes in reducing undernutrition. In Brazil, the presidential commitment to combat hunger and reduce poverty was put into action through the national Zero Hunger strategy, with social protection as a key pillar, with dedicated resources.242, 243 Juntos, Peru’s flagship social protection programme, was a ‘depoliticised’ programme. Peru’s national nutrition strategy points to government successfully integrating diverse actors in the design, implementation and monitoring of nutrition-sensitive social protection programmes.244 Attention, even from high-level politicians, is insufficient on its own to drive action; real political and system commitment is necessary to translate interest into impact.245
The situation in Zambia
Zambia has long recognised the challenges of nutrition and in 2011 was hailed an ‘early riser’ country within the global SUN (Scaling Up Nutrition) movement. Yet, before 2011 Zambia did not score well on indices that measure nutrition commitment and governance, ranking mid-to-bottom of various lists assessing national policy commitments, programming, governance, legal frameworks, inter-sectoral coordination or resourcing for nutrition.246 The 2013 commitment to halve malnutrition by 2023, made by Zambia’s vice-president at the global Nutrition for Growth event, is an example of a rise in ambition for and commitment to nutrition. A number of high-level plans followed in 2014. For Zambia, the attention nutrition has attracted internationally appears to have been translated into attention from the national government. However, as prevailing high levels of malnutrition in Zambia show, building and sustaining commitment is not a quick win. Improving and implementing policies and laws is an ongoing process.247
Social protection achieved high-level government commitment when what started as a donor-driven district pilot became a largely domestically financed national programme as part of a dramatic scale-up plan for the SCT. MCDMCH planned to reach full country coverage by 2016 in a phased manner by rolling out to those districts with high levels of poverty and inequality in 2015.248 A sharp increase in government budget allocations in 2014 is the strongest sign of commitment to date, but increased financing to match the government’s ambitions to scale up the SCT was not sustained in 2015. Social protection provision in Zambia appears to be a growing priority, particularly due to the emphasis placed on its role in supporting the attainment of the ambitions for the vision 2030 of transforming Zambia into a prosperous middle-income country.249
Despite both social protection and nutrition attracting ‘priority’ status, high-level commitment for nutrition-sensitive social protection has not yet been achieved. It features in the National Food and Nutrition Commission list of priority objectives as ‘nutritional sensitive messages to be in cash transfers and other programmes’, and in the 1000 Days strategy priority interventions as ‘nutritional sensitive messages in GRZ programmes’,250 including the SCT. However, little progress has been made as yet. The draft 1000 Days Monitoring and Evaluation Plan does continue to put emphasis on the area, with the ‘promotion of social protection initiatives for prevention of stunting, treatment of moderate acute malnutrition and alternative livelihoods interventions’ noted under Intervention area ‘Promotion of food based interventions’.251 Encouragingly nutrition objectives are included in two of the four pillars of the 2014 National Social Protection Policy with a focus on linkages and messaging.
What does it mean for nutrition-sensitive social protection in Zambia?
• The Government of the Republic of Zambia should make a specific policy commitment for nutrition-sensitive social protection, with the necessary human and financial resources to support it. The second Nutrition for Growth Summit at the Brazilian Olympics in 2016 will provide the ideal opportunity for such a commitment to be made.
• Nutrition-sensitive social protection, as a cross-cutting priority, should be clearly articulated in both nutrition and social protection national strategies. Action plans for the incorporation of nutrition-sensitive social protection should be developed and implemented.
60
RESPONSIVENESS
A responsive governance system is required to adapt and meet the progressing needs and demands of a country.
MA
LNU
TR
ITIO
N IN
ZA
MB
IA

11 KEY
ASPEC
TS O
F GO
VER
NA
NC
E FOR
NU
TR
ITIO
N-SEN
SITIV
E SOC
IAL PRO
TEC
TIO
N
61
Sustainable funding
Global learning
Effective and sustainable funding mechanisms need to encourage policy coordination and implementation.252 In the short term, external bodies such as international financial institutions can strengthen funding. However, to remain effective in the long term, sustained commitment must be managed internally by the national government. Finding domestic fiscal space for critical economic and social investments, such as social protection, is essential if sustained and equitable development is to be achieved.253 Options for financing social protection include: reallocating public expenditures; increasing tax revenues; extending social security contributions; borrowing or restructuring existing debt; curtailing illicit financial flows; drawing on increased aid and transfers; tapping into fiscal and foreign exchange reserves; adopting a more accommodating macroeconomic framework.254
The situation in Zambia
Zambia is one of the few countries in sub-Saharan Africa that meets its promises made under the Maputo and Abuja Declarations to spend over 10% of public expenditures on agriculture (spending 10.2%).255 Yet health is lagging behind, with 11.2% in 2013 and a projected 9.6% in 2015 against the commitment to spend over 15%.256 As part of the Nutrition for Growth commitment, vice-president Guy Scott pledged to “increase government nutrition expenditure to US$30 per child under five per year, including a minimum 20% annual budget increase until 2023.”257 The World Bank estimates that Zambian tax revenues are 17% of GDP or US$3.5bn per year, yet only a few million dollars per year have actually been spent on nutrition-specific interventions.258 Zambian CSO-SUN Alliance’s analysis of the 2015 national budget found around 0.1% constitutes spending on nutrition. This does represent an increase from the 0.03% allocation for nutrition in 2014. However, even with this increase, the budget allocation is considered extremely low to make an impact on the nutrition crisis in Zambia.259 Zambia’s Nutrition for Growth commitment also included a pledge to resolve the human resource and financial gaps in the five key line ministries260 responsible for nutrition actions, at provincial and district levels, including increasing direct support to communities.261
An overall financial system to reconcile estimates of costs with national investments, across sectors and external contributions, towards the implementation of the National Food and Nutrition strategic plan is not yet fully in place. Information on financial tracking is only available on domestic and external contributions for specific programmes. However, the government is currently working on the development of a mechanism to track nutrition funds either from pooled funds or direct support as well as government funding. The recently established SUN Fund, a pooled fund which supports innovative approaches to scaling up nutrition, will track allocations for nutrition-specific and nutrition-sensitive interventions from all pooling donors.262
Zambia’s largest social protection programme, the Social Cash Transfer, was donor led and financed. GIZ (German overseas development agency) financed the first cash transfer pilot from 2003 up until 2010 when the government of Zambia took full ownership of the SCT and started financing part of its cost. At the end of 2013, the government decided to increase the funding to the programme by more than 700%, from K17.5 million to K150 million for 2014. With this increase in funding, the ministry and its cooperating partners embarked on a rapid scale-up. In 2014, 31 new districts were added, bringing the total number of districts implementing the SCT programme to 50 (nearly half of all districts). The programme is funded by both the government and its cooperating partners.263 However, despite the activity in 2014, the budget allocation for SCT remained the same in 2015, throwing some doubt over the sustainability of the scale-up. The budget allocation to the Farmer Input Support Programme increased more than two-fold in 2015 despite evaluations showing limited impact, suggesting fiscal space for transfers. Therefore, greater understanding of the reasons behind the freeze in SCT budgeting is required.
What does it mean for nutrition-sensitive social protection in Zambia?
• Zambia’s Nutrition for Growth financial commitments need to be not only met, but exceeded to address the inadequacy of current levels of money spent on nutrition. A more ambitious financial commitment, which builds upon that made in 2013, with a specific emphasis on spending towards nutrition-sensitive social protection, could be made at the second Nutrition for Growth Summit in 2016.
• Funding committed to the SCT must be consistently delivered. Funding should support realistic plans for effective scale-up, development and maintenance. The emphasis should be on delivery of good-quality programming, without sacrifices for fast scale-up.
continued overleaf

62
What does it mean for nutrition-sensitive social protection in Zambia? continued
• Funding must be used to support regular and robust monitoring and evaluation of social protection programming, with emphasis on the impact on nutrition. The information generated should be articulated to decision-makers to inform their decision-making and prioritisation of funds, and to civil society for advocacy and accountability.
• Gains from tax revenues due to GDP growth could be efficiently invested in nutrition-sensitive social protection for improved nutrition, and to address high levels of inequality and encourage more inclusive growth.
Clearly defined, context- and target-specific national priorities
Global learning
Government strategies should focus on the progressive nature of social protection initiatives, recognising how these programmes are situated within broader policy frameworks, and what that means for their country.264 The uniqueness of each country requires that a range of options is carefully examined at national level and that selection is based on effective social dialogue and a sound approach to political economy.265
The situation in Zambia
The government of Zambia has established national strategies for both nutrition and social protection. Coordinating bodies exist for each area, bringing together stakeholders from across sectors.266 Vision 2030 is Zambia’s first-ever written, long-term plan and expresses the aspirations of the Zambian people to be a prosperous middle-income nation by the year 2030. It articulates national and sector goals. It also presents challenges and obstacles that must be overcome.
Vision 2030 contains clear sector visions for both nutrition and social protection, though none that relate to nutrition-sensitive social protection specifically.
For social protection, the 2030 sector vision is: A nation that promotes and provides sustainable security against deprivation and extreme vulnerability by 2030. This vision is supported by goals and targets including: livelihood security to meet basic needs and protection from the worst impacts of risks and shocks for all vulnerable Zambians; and attaining a labour market free of child labour by 2030. For food and nutrition, the 2030 sector vision is: A well-nourished and healthy population by 2030. This vision is supported by goals and targets, including: ensure food and nutrition security, and food quality and safety across all levels; prevent and control specific macro and micronutrient deficiencies, and promote appropriate diets and lifestyles; strengthen nutrition care practices for vulnerable groups; develop and sustain human resource capacity; and establish and maintain an efficient institutional arrangement and strong nutritional networks.267
What does it mean for nutrition-sensitive social protection in Zambia?
• A clear priority for nutrition-sensitive social protection, with recognition of the cross-cutting impacts/aspects (eg, social protection, nutrition and agriculture), should be recognised in Zambia’s national plans (such as Vision 2030), and followed through in the relevant sector strategies. This priority should be SMART: specific, measurable, achievable, relevant and time-bound.
• Zambia’s nutrition strategy and the social protection strategies need to align and to reflect the pathways approach268 for nutrition-sensitive social protection.
MA
LNU
TR
ITIO
N IN
ZA
MB
IA

11 KEY
ASPEC
TS O
F GO
VER
NA
NC
E FOR
NU
TR
ITIO
N-SEN
SITIV
E SOC
IAL PRO
TEC
TIO
N
63
MULTI-SECTOR ENGAGEMENT
Given the multi-faceted and multi-dimensional causes of undernutrition, strong multi-sector coordination across a number of ministries and stakeholders is critical to ensuring effective nutrition governance.269
Community and beneficiary engagement
Global learning
Inclusive and effective nutrition-sensitive social protection programmes require meaningful participation of relevant stakeholders, including civil society organisations (CSOs), beneficiaries and children. CSOs and community groups are uniquely placed to present the voice of the people and to drive government to include appropriate nutrition goals into national plans. In Peru, the community initiative secured nutritional goals within the national poverty reduction strategy. In Brazil, communities engaged with numerous political parties, government ministers and local governments to transform nutrition campaigns into national government policies. The experiences of Brazil and Peru highlight the real impact individuals at community level can have on lobbying government to consider nutrition as a national priority.
The situation in Zambia
Observers recognise a lack of awareness and access to information on nutrition as a key contributing factor for the low profile of nutrition across all levels in Zambia. Particularly at the grassroots level, there is a need to create demand for information and services on nutrition. According to reports, citizens often appear unconcerned about nutritional issues and there is little demand for knowledge on the health-related aspects of food. Reports also suggest citizens are unable to access information on nutrition interventions and subsequently unable to hold decision-makers accountable for their decisions, contributing to a weak political will to tackle the adverse effects of inadequate nutrition.270 Therefore, citizens do not appear to have an active role and opportunity to engage in accountability processes and to hold governments to account for progress on commitments, plans and targets.
Citizens and beneficiaries’ ability to respond to information on nutrition is limited due to the poor variety of nutritious foods available to consumers across Zambia. As we saw in our contextual pathways analysis, this is particularly challenging for rural areas where farming is dominated by maize production (see ‘The importance of agriculture’ on page 23).
What does it mean for nutrition-sensitive social protection in Zambia?
• Mechanisms to ensure initiatives against malnutrition in all its forms are locally owned must be developed and sustained, particularly at subnational levels, with a focus on community and beneficiary engagement. Such mechanisms should improve the flow of information between policy-makers and beneficiaries/communities. Information on beneficiaries’ experiences and needs must be integrated into monitoring and evaluation mechanisms to enable responsive policy and programme development. This aspect of monitoring and evaluation could be well delivered by civil society.
• Access to clear information on nutrition-sensitive programming, including social protection, with details on access, entitlements, etc, should be regularly disseminated to communities through civil society/NGO and community structures.
• Many civil society groups champion the role of agriculture for nutrition and food security, but specific accountability activity should take place to ensure articulated plans for dietary diversity in agricultural are followed through.
continued overleaf

64
A vibrant civil society
Global learning
It is widely recognised that the active involvement of civil society organisations in the formulation, implementation and monitoring of public programmes results in more sustainable and effective programmes, responsive to local contexts and needs. International and national civil society organisations also have experience to share in the development, delivery and evaluation of social protection systems. International civil society should work alongside national civil society organisations to build capacity in both civil society and government. Similarly, opportunities to connect civil society-led social protection and nutrition initiatives with national nutrition-sensitive social protection systems should be encouraged.
The situation in Zambia
A catalyst and/or champion is often needed to spark action, garner political or financial support, and transform a situation.271 The Zambia CSO-SUN Alliance has been widely recognised as key force in securing nutrition’s current profile in Zambia’s national development agenda. The alliance mobilises, coordinates and builds the capacity of civil society actors to influence national efforts through constructive dialogue and advocacy with stakeholders, including the government, donors and private sector, thereby contributing to improved leadership and accountability towards the national SUN/1000 days movement.272
The Platform for Social Protection (PSP) was established as an NGO umbrella organisation to coordinate civil society on social protection. It was originally set up to address challenges around a fragmented civil society with significant capacity limitations, a dominance of international NGOs and a lack of information being shared with civil society. The overall aim of PSP is to build well-coordinated platforms for CSOs to engage in, promote and support social protection discourses and programmes in Zambia,273 with core activities on capacity building, information building, networking and advocacy. PSP also supports the delivery of a village savings and loans scheme, targeting the social cash transfer beneficiaries, with Care International.
Both CSO-SUN Alliance and PSP contributed to the drafting of the 2014 National Social Protection Policy (NSSP). Operationalisation of the NSSP further recognises their role by calling for a multi-sectoral approach to address challenges within Zambian social protection provision such as inadequate financing, poor coordination, weak institutional capacity, and the lack of an integrated targeting mechanism and single registry to record beneficiaries and evaluate programme performance.274
What does it mean for nutrition-sensitive social protection in Zambia?
• Civil society in Zambia needs to mobilise behind calls to maximise social protection for nutrition by, for example, advocating to government, contributing to programme design and delivery, drawing upon international networks for support, engaging communities and beneficiaries, and contributing to evidence generation and dissemination.
• Civil society should develop accountability mechanisms, with community participation, to hold government to account for the development and delivery of nutrition-sensitive protection within the SCT.
• Capacity strengthening in nutrition-sensitive social protection should be sought for civil society, alongside other partners, to enable all to play an active role in developing this agenda for Zambia.
An active private sector
Global learning
Engaging the private sector is necessary to develop new patterns of sustainable and inclusive production. The private sector has a powerful role in the production, distribution and marketing of food, as well as a strong influence on the production costs and price of food products. Coupled with its influence over workforces, the private sector carries strong potential to accelerate the progress of nutrition-sensitive social protection and shape nutrition outcomes. Private sector organisations contribute to the value chain and have a great impact on commodity markets and pricing.
MA
LNU
TR
ITIO
N IN
ZA
MB
IA
continued opposite

11 KEY
ASPEC
TS O
F GO
VER
NA
NC
E FOR
NU
TR
ITIO
N-SEN
SITIV
E SOC
IAL PRO
TEC
TIO
N
65
Global learning continued
The private sector contribution to social protection exists in many contexts, albeit mainly logistical. This is most prominent through the development of technology to facilitate transfers at community level, for example, through mobile technology and other innovative banking methods. It is also important to consider how the private sector can contribute through promoting inclusivity, eg, paying a living wage or supporting poorer communities to qualify to be part of their value chains.
The role of the private sector in nutrition is developing, with initiatives such as the Scaling Up Nutrition (SUN) Business Network working globally to harness expertise and apply its strengths and comparative advantages to improve nutrition. The network advances opportunities for the business community to support efforts around agriculture, product development, infrastructure systems, distribution channels, or research and innovation.275
The situation in Zambia
The private sector is not coordinated in relation to social protection in Zambia. However, the MCDMCH is said to be in the process of procuring a payment service-provider in order to reduce fiduciary risk associated with bulk low-value cash payments for the SCT. The ministry is holding meetings with the banking and financial sector on how they can provide this service to beneficiaries.276
A Business Network for SUN was launched in Zambia in November 2014; 30 companies registered their interest in developing commitments to scaling-up nutrition in Zambia. Areas explored include: expanding the nutrition market (food producers and processors); improving nutrition in the agricultural value chain; business in the community (What more can business do to improve nutrition?); partnerships in nutrition; and policies, regulations and standards to support nutrition. WFP (World Food Programme) Zambia has led a strategy to further business engagement in Zambia’s national nutrition priorities, which was planned to be available in 2015.277 Despite this activity, civil society observers note a low profile for business in nutrition so far. Contributions businesses could make for nutrition in Zambia include: improve the nutritional quality of food by creating food products high in nutrients and decreasing the production of foods that lead to obesity; companies in the business of production should ensure the food is safe and fresh.278
What does it mean for nutrition-sensitive social protection in Zambia?
• Information should be shared across sectors on the potential role of the private sector, particularly in relation to dietary diversity. The benefits of a private sector markets/growth strategy, to complement poverty reduction and social protection strategies, should be considered.
• For Zambia’s nutrition strategies, the private sector contribution to encouraging dietary diversity through crop production/horticultural markets, with emphasis on the rural areas with particularly weak infrastructure, should be developed.
• More research is required to outline the impact different forms of public policy, regulation and financial incentives can have on raising awareness among the private sector and to spur engagement to create change in the levels of undernutrition.279
SOCIAL ACCOUNTABILITY MECHANISMS
Social accountability mechanisms are an important part of the governance process. Child-focused social accountability is a set of participatory activities designed and implemented by children and other citizens to hold public officials and service providers accountable, through dialogue, for their commitments to children.
Accountability is a two-way process:
Downwards: requiring state bodies and individual representatives of the state to act in a manner appropriate to their function
Upwards: requiring citizens to act in a responsible manner, and to demand that the state fulfils its duties properly.280

66
ROBUST INSTITUTIONAL FRAMEWORK
The institutional layout that makes countries achieve more through collaboration is vital for the development of effective nutrition-sensitive social protection programmes.
Effective monitoring and evaluation
Global learning
Effective monitoring and data collection is important to understand what works and what does not work in social protection programming and to improve understanding of impact on nutrition outcomes. It is important to integrate nutrition indicators and monitor nutritional outcomes, including the nutrition pathways of household food security, caring practices for women and children, and health services and environment.
Up-to-date data should be reviewed regularly to enable identification of coverage gaps and help prevent and respond to environmental shocks and stresses. This is particularly important in areas prone to flooding, which increases the vulnerability of undernourished sectors of the population. Evidence of programme impact also plays an important role in reinforcing the political commitment needed for nutrition initiatives281 and increases accountability.
The situation in Zambia
The importance of monitoring and evaluation information for nutrition-sensitive social protection is clear. For the SCT, impact evaluations of the pilots were key to achieving government support. In the discussions during the period leading up to the 2010 launch of the SCT programme, findings from evaluations had not played a significant role and the programme has remained donor-led. The recent impact evaluations are considered to be government-commissioned evaluations. Nutrition outcomes are included in the monitoring of the Child Grant Programme model of the SCT, but are not included in other programmes (Multiple Category Targeting Grant or Monze Social Cash Transfer). The nutrition outcomes that the Child Grant Programme monitors include: stunting, wasting, meals per day, household diet diversity, and food energy and food expenditures.282
A number of data, monitoring and evaluation initiatives exist for nutrition in Zambia. Efforts are underway, such as through the draft 1000 Days Monitoring and Evaluation Plan, to improve quality, consistency, coordination and timeliness. Regular (once every three years) nutrition surveys have not been done and as a result the policy-makers do not have access to up-to-date information. 283
A number of vital data gaps also exist:• In the development of this report we were unable to find data on nutritional status of pregnant women, or on
their share of food within the household. • It is currently not possible to see nutrition prevalence by district (DHS will only disaggregate by province).• It is currently not possible to explore the implications of child/teenage pregnancy. DHS only presents data on size
of babies with mother’s age categorised as <20. We should extend this to be able to see <16.• We currently also do not know enough about the extent of disabilities and where they are located, particularly
those that work as pathways to poor nutrition.
It is unclear if nutrition data is systematically shared across relevant ministries for social protection, such as MCDMCH, or vice versa.
What does it mean for nutrition-sensitive social protection in Zambia?
• The National Social Protection Policy, and within it the SCT, must have a detailed and regular monitoring and evaluation system, across the nutrition pathways, to show the impact on nutrition and provide evidence for national decision-making.
• The quality and coverage of Zambia’s nutrition and poverty data should be improved, disaggregated by group where possible (age, wealth, gender, ethnicity, rural/urban, regions) to help accelerate progress towards reducing malnutrition and to reach the most vulnerable through the SCT. Analysis of data at district level would be particularly beneficial for comparison with impact of the SCT.
MA
LNU
TR
ITIO
N IN
ZA
MB
IA
continued opposite
11 KEY
ASPEC
TS O
F GO
VER
NA
NC
E FOR
NU
TR
ITIO
N-SEN
SITIV
E SOC
IAL PRO
TEC
TIO
N
67
What does it mean for nutrition-sensitive social protection in Zambia? continued
• All data should be collected at regular intervals and made accessible so that it can be useful for both policy-makers and citizens.
• The Zambian 1000 days monitoring and evaluation plan (which was scheduled to be drafted in 2015) should set out how key data gaps for nutrition will be addressed. Please see Appendix 4 for specific recommendations in relation to these gaps.
Strong coordination and legislation
Global learning
Sustainable change requires coordinated action and effort on the part of different line ministries and agencies at national and regional levels. Vertical coordination across different levels of decision-making and service delivery is important. Cross-sector coordination is also required, particularly across areas of education, health, agriculture and nutrition. It is important to ensure that there are proper structures in place, and national and regional governments generate the proper technical capacities and incentives to transfer resources and remain accountable to each other.284, 285
There are many pathways to improved nutrition. Having policies and laws on the books does not mean they will be implemented. It does, however, indicate a government’s public commitment and hence offers an entry point for civil society engagement in issues surrounding nutrition.286 Provisions enshrined in law also ensure long-term action across political terms/changes in government.
The situation in Zambia
The National Social Protection Policy (NSPP) intends to deliver a more comprehensive and integrated approach to social protection overall as a tool for sustainable poverty reduction, based on the clustering initiatives under protection, prevention, promotion and transformation.287 Coordination in relation to the field of nutrition and food security is noted as a challenge to be addressed within the NSSP. The policy recognises that it is critical to link social cash transfers with the promotion of appropriate feeding and care practices, provision of micronutrients, water and sanitation, and the diagnosis and management of diseases. This requires establishing coordinated multi-sectoral responses towards social protection programming. The recent realignment of the primary healthcare services with social protection presents an important opportunity for enhanced coordination, in particular at district level and below.288
The Social Protection Sector Advisory Group, informed by technical working groups, advises the development of ongoing social protection policy in the country.289 The NSSP proposed a high-level coordinating unit at Cabinet Office to oversee the development, implementation and integration of social protection strategies, programmes and financing. Reports indicate the Ministry (MCDMCH) is awaiting guidance on how the structure will be operationalised and how it will interface with implementing institutions.290
The National Food and Nutrition Commission, as the convening body to coordinate action on nutrition, developed the National Food and Nutrition Strategic Plan (2011–15), launched alongside the 1000 Most Critical Days Programme, to inform the work of all the relevant sectors.291 It was developed with participation from multiple sectors and with support from development partners through the Nutrition Cooperating Partners’ Group. The plan combines action across five key line ministries: Ministry of Health, Ministry of Agriculture and Livestock, Ministry of Community Development, Mother and Child Health, Ministry of Education and Ministry of Local Government.292 The plan serves as the common results framework for nutrition. Within the plan it is articulated that success depends on the joint functioning of healthcare, agriculture and social protection services at the community level. The plan also promotes linkages between nutrition and social protection for vulnerable HIV-affected households.293
Cross-sector coordination is attempted for both nutrition and social protection: the NFNC through the multi-sector platform and other arms of the SUN movement provides coordination for nutrition; the Social Protection Sector Advisory Group, informed by technical working groups, advises the development of ongoing social protection policy in the country.294 Despite existing plans, it is likely that sub-regional coordination will continue to present a particular challenge, given that the lead ministry for both social protection and nutrition, MCDMCH, is represented at national and provincial levels, but not at district level.
A thorough assessment of Zambia’s legal framework/legal provisions regarding social protection is beyond the scope of this research but is needed in order to inform future decisions.

68
What does it mean for nutrition-sensitive social protection in Zambia?
• Attention must be given to address the institutional challenges, including coordination across shared goals, that negatively affect the implementation of national policies, including those related to nutrition and social protection. Priorities and ambitions for cross-cutting areas should be consistent across all documents.
• Sector-specific plans need to be allocated sufficient time and investment for them to develop and deliver through coordinated structures.
• The National Food and Nutrition Strategic Plan (NFNSP) 2011–15 process should be reviewed to obtain learning on coordination across the five key ministries, as per its ambition. Implementation of the new NFNSP should proactively improve coordination across relevant ministries, such as MCDMCH, Health, and Agriculture.
• A thorough assessment of Zambia’s legislative framework/legal provisions regarding social protection and nutrition, with the identification of key areas to improve, should be undertaken. This review should include consideration of the adoption of a ‘rights-based’ approach to food security and nutrition.
International support
Global learning
International commitments and initiatives provide powerful support for the development of national nutrition-sensitive social protection systems.
The ILO- and World Bank-led Social Protection Floor initiative encourages national governments to develop support systems to provide protection to all citizens.
The SUN movement, which aims to eliminate all forms of malnutrition, is representative of a global push for action to improve conditions related to maternal and child nutrition. Utilising support from movements such as these can increase ‘buy-in’ and accelerate progress nationally.
Nutrition-sensitive social protection is attracting increased international recognition for its potential to address malnutrition globally.
The Millennium Development Goals (MDGs) and the recently endorsed Sustainable Development Goals (SDGs), also known as the Global Goals, have a huge influence on international development policy. The SDGs include a target to “implement nationally appropriate social protection systems and measures” by 2030, and a target to “end all forms of malnutrition” by 2030.295 Many nutrition experts have linked the two targets as supportive of nutrition outcomes.
The World Bank’s Secure Nutrition Forum recently held a Global Forum, hosted by the Russian Federation, to facilitate evidence generation, learning and sharing of best practice on nutrition-sensitive social protection. High-level delegations from more than 20 countries attended. Influential international agencies, including the Food and Agriculture Organization (FAO) and WFP, recently released guidance on the development of nutrition-sensitive social protection.
The situation in Zambia
International agencies such as GIZ (the German government’s aid department), UNICEF and the UK Department for International Development have supported the Zambian government’s social policy development for many years, with a lot of emphasis placed on the SCT. The Global SUN movement has effectively encouraged Zambia to become a rising star for nutrition. However, plans that are seen to be relatively good on paper now need to be put into action if improved outcomes are to be achieved.
Increased emphasis from international agencies, such as WFP and FAO, on the potential of social protection for rural communities is likely to gain some headway in Zambia, particularly given the prominence of agricultural systems and importance of food security in the country.296 Observers note the MDG process revealed that Zambia continues to face bottlenecks that preclude major policy and institutional reforms, and as a result affect the overall degree of implementation of the MDGs.297 Similar observations can be made for social protection and nutrition policies.
MA
LNU
TR
ITIO
N IN
ZA
MB
IA
continued opposite

11 KEY
ASPEC
TS O
F GO
VER
NA
NC
E FOR
NU
TR
ITIO
N-SEN
SITIV
E SOC
IAL PRO
TEC
TIO
N
69
What does it mean for nutrition-sensitive social protection in Zambia?
• The international momentum behind nutrition-sensitive social protection should be used by all parties to galvanise support for the agenda within Zambia. An increasing volume of resources are being made available demonstrating the impact and the ‘how to’.
• Nutrition-sensitive social protection cuts across a number of the SDG targets under the poverty (Goal 1) and health and nutrition (Goal 2) goals. These gains should be clearly communicated to, and then monitored by, all those responsible for the implementation and accountability of the goals in Zambia.
ZAMBIA’S NUTRITION FOR GROWTH COMMITMENTS298
In June 2013 the Zambian government pledged to cut high levels of chronic malnutrition in the country by 50% over a period of ten years to 2023. The statement was made by Vice-President Guy Scott in front of a global audience at the Nutrition for Growth conference in the UK.
Specifically, the government pledged to:• fill human resource and financial gaps for
nutrition in key line ministries• increase government nutrition expenditure
to US$30 per child under five, including a minimum 20% annual budget increase
• encourage private sector involvement in production of nutritious foods
• strengthen government governance and coordination mechanisms, including direct oversight by the Vice-President and strengthening of the National Food and Nutrition Commission.
This is an ambitious agenda, but one that addresses many key challenges identified in and by the country.299
RECOMMENDATIONS FOR NUTRITION DATA
District-level data. It is currently not possible to explore the prevalence of malnutrition at district level in Zambia. DHS only allows disaggregation by province. This is extremely important for service planning, delivery, monitoring and evaluation. We strongly suggest this is addressed as a priority.
Teenage pregnancy. It is currently not possible to explore the implications of child/teenage pregnancy for nutrition in Zambia. DHS only presents data on size of babies with mother’s age categorised as <20. This should be extended to be able to see <16.
Disabilities. We currently don’t know enough about the extent of disabilities and where they are located, especially the extent of disabilities that work as pathways to poor nutrition. The only information we could find is in the 2000 census that 2.7% of people were disabled, and in the 2010 census that 3% were disabled. DHS should cover disabilities.
Pregnant and lactating women. We were unable to find data on nutritional status of pregnant women, or on their share of food within the household. This is extremely important for nutrition and should be addressed.

Social protection and nutrition currently sit high on the international development agenda, supported by a series of high-level recommendations and commitments. These have created a strong momentum for the development of nutrition-sensitive social protection programmes within national systems. In this section we provide an overview of the current global priorities within this sector before moving on to our recommendations.
NUTRITION
NUTRITION FOR GROWTH SUMMIT
The first Nutrition for Growth Summit was held in June 2013 in London, UK, with a focus on the importance of business and science for combatting malnutrition. The meeting brought together civil society organisations, governments, business leaders and scientists and resulted in a Global Nutrition for Growth Compact, which included stakeholders from all these groups. Several governments committed increased resources for nutrition work and/or announced targets for the reduction of stunting, including Zambia, which committed to halve child malnutrition by 2023. Since then, annual global nutrition meetings and an annual global report on nutrition have been published with the aim of holding parties accountable for their commitments, by monitoring progress and demonstrating results of their actions.300
The next summit will be held in 2016 in Rio de Janeiro, Brazil. It will provide an opportunity to review progress over the last years, remind parties of their commitment, and agree on next steps for nutrition.
WORLD HEALTH ASSEMBLY GLOBAL TARGETS ON NUTRITION
In 2012, the World Health Assembly set six global targets designed to reduce the unacceptably high burdens of disease and death caused by poor nutrition by 2025.
The World Health Assembly Global Targets301 to improve maternal, infant and young child nutrition by 2025 include: • a 40% reduction in the number of children under
five who are stunted• a 30% reduction in low birthweight• a reduction and maintenance of childhood wasting
to less than 5%.
SOCIAL PROTECTION
INTERNATIONAL LABOUR ORGANIZATION AND WORLD BANK GLOBAL INITIATIVE ON UNIVERSAL SOCIAL PROTECTION
For both the International Labour Organization (ILO) and the World Bank, social protection is central to their agenda. Social protection can help end poverty and increase shared property, which are the twin goals of the World Bank Group to reach by 2030.For the ILO, social protection is at the core of its mandate, as also expressed in the Social Protection Floors Recommendation, No. 202.
In June 2016 the World Bank and the ILO launched the Global Initiative on Universal Social Protection to call on world leaders to focus on universal social protection policies and financing. The Global Initiative aims to increase the number of countries adopting universal social protection. For this, in the next 15 years the two organisations will use their resources to support countries to adopt universal social protection through joint support. Particular
12 GLOBAL PRIORITIES RELATED TO NUTRITION-SENSITIVE SOCIAL PROTECTION
70

71
12 GLO
BAL PR
IOR
ITIES R
ELAT
ED TO
NU
TR
ITIO
N-SEN
SITIV
E SOC
IAL PRO
TEC
TIO
N
attention will be given to the harmonisation of social protection policies, programmes and administration systems; the integration of universal social protection into national development strategies; and the expansion of fiscal space.302
ILO RECOMMENDATION 202: NATIONAL SOCIAL PROTECTION FLOORS
Recommendation 202, an international legal instrument, was adopted in 2012 by the governments of all 185 member countries of the ILO, and by workers’ and employers’ organisations. It is a reflection of the joint commitment of these organisations and governments to build tax-financed national social protection floors. These are a set of nationally defined basic social security guarantees that have the objective of alleviating or preventing poverty, vulnerability and social exclusion. Social security is seen as a human right and an
economic and social necessity, and a key element to promote human development, political stability and inclusive growth.
The basic level of security that is to be provided should encompass access to healthcare and income security throughout the lifecycle while ensuring people’s dignity and rights and should thus at least include basic income security for children, people of working age who are unable to earn a sufficient income and older people and should also include basic maternity care. The recommendation complemented already existing conventions and recommendations of the ILO on the topic of social security. It sets out details on how to establish national social protection floors and comprehensive social protection systems. The social protection floor only provides a minimum security; countries are encouraged to provide a much higher level of support to their citizens.303
Dorothy, a pupil at Riverside school, Kazungula district, Southern province
PHO
TO
: CLEIS N
OR
DFJELL/SA
VE T
HE C
HILD
REN

72
ACROSS NUTRITION AND SOCIAL PROTECTION
SUSTAINABLE DEVELOPMENT GOALS
Three years in the making, the 16 Sustainable Development Goals (SDGs) were agreed by 193 UN member states in August 2015. The SDGs include both nutrition and social protection in their targets. Social protection is included under Goal 1 “to end poverty in all its forms everywhere”, in target 1.3: “Implement nationally appropriate social protection systems and measures for all, including floors, and by 2030 achieve substantial coverage of the poor and the vulnerable.” It is also mentioned under Goal 5 on gender equality in the context of recognising unpaid care and domestic work through providing social protection among other measures, and under Goal 10 on inequality to contribute to achieving equality through the adoption of social protection.
Nutrition is included under Goal 2 “End hunger, achieve food security and improved nutrition and promote sustainable agriculture.” Malnutrition is separately addressed under target 2.2: “by 2030 end
all forms of malnutrition, including achieving by 2025 the internationally agreed targets on stunting and wasting in children under five years of age, and address the nutritional needs of adolescent girls, pregnant and lactating women, and older persons”.304
UNSCN SOCIAL PROTECTION AND FOOD SECURITY RECOMMENDATIONS
The United Nations Standing Committee on Nutrition (UNSCN) developed recommendations concerning the use of social protection for food security and nutrition in 2012. The recommendation calls on member states to design and build or strengthen comprehensive, nationally owned and contextually appropriate social protection systems for food security and nutrition. Member states as well as international organisations and other stakeholders are encouraged to improve the design and use of social protection systems, therefore enabling them to address vulnerability to chronic and acute food insecurity by embracing a twin-track strategy to have maximum impact on resilience, food security and nutrition.305
MA
LNU
TR
ITIO
N IN
ZA
MB
IA

73
In this final section we present recommendations for nutrition-sensitive social protection in Zambia. We make specific design recommendations to harness the Social Cash Transfer to address chronic malnutrition (stunting). We then make recommendations for the broader development of nutrition-sensitive social protection in Zambia.
RECOMMENDATIONS FOR THE SOCIAL CASH TRANSFER
In order to harness the full potential of Zambia’s Social Cash Transfer (SCT) to address chronic malnutrition, it must: • address the drivers of malnutrition across all
the nutrition pathways: household food security,
caring practices for women and children, health services and environment (as presented in the table below)
• be targeted towards the first 1,000 days• include behaviour change communication on
dietary diversity; infant and young child feeding; safe water, sanitation and hygiene (WASH) practices; and timely health-seeking behaviour
• have an integrated and robust monitoring and evaluation system, including child-centred and nutrition indicators across all pathways
• act as a platform for linkages to other services, including health for HIV, malaria and diarrhoea services; WASH; and agriculture.
Policy- and decision-makers in Zambia should recognise the value of integrating nutrition into the SCT through policy and design structures, as demonstrated in the following pathways recommendations table.
13 CONCLUSIONS AND RECOMMENDATIONS FOR THE DEVELOPMENT OF NUTRITION-SENSITIVE SOCIAL PROTECTION IN ZAMBIA

74
TABLE 6 RECOMMENDATIONS FOR NUTRITION-SENSITIVE SOCIAL PROTECTION IN ZAMBIA
Evidence from social protection Policy and design recommendations
Cross-cutting
When nutrition-sensitive design principles are included, social protection programmes can have a significant impact on malnutrition.306
Various types of programmes can work for nutrition, including cash transfers, conditional cash transfers and cash for work.307
Social Cash Transfer design:
The SCT must have a detailed and regular monitoring and evaluation system, across the nutrition pathways, to show impacts on nutrition and provide evidence for national decision-making.
Governance and linkages:
National nutrition and social protection strategies must be linked and mutually supportive to support higher development returns.
All nutrition-sensitive interventions, including social protection, should be based on a contextual analysis of malnutrition, and detail the pathways through which the intervention will address malnutrition.
Zambia should aim to decrease stunting levels overall, but direct specific attention to improving outcomes for the poorest quintiles to reduce inequalities between the wealth quintiles.
Other arms of Zambia’s social welfare system should be strengthened, following investments for children under five years old with a focus on health, employment, literacy and nutrition.
Pathway 1: Household food security – assured access to enough food of adequate quality for living an active healthy life
Cash transfers are widely used for food consumption, often allowing households to invest in and consume better-quality and more nutritious food.308
Being a beneficiary of a social protection programme can increase a household’s resilience and ability to absorb shocks.309
Social protection can improve a household’s assets base and improve its livelihood.310
Nutrition interventions for children have better effects if sustained over long periods of time, extending beyond the first 1,000 days.311
Social Cash Transfer design:
Improve targeting towards those groups which cannot access two meals a day.
Cash transfers should run for a sufficiently long time per beneficiary to allow for longer-term impacts arising from livelihoods improvement.
Transfer size should be adjusted according to household size and the cost of a nutritious diet.
Behaviour change communication (BCC) should be introduced, in coordination with respective line ministries, to inform households on components of a nutritious diet to impact on consumption behaviour, particularly for young children. BCC can happen during payment events or using SMS in local languages (if beneficiaries hold mobile phones).
The geographical overlap of SCT and Zambia’s 1000 Days programming should be reviewed to ensure agricultural interventions for improved dietary diversity are accessible to SCT recipients. This could be achieved, for example, through access to loans for input purchase, crop insurance to encourage production of high-risk crops, farming training and home gardens.
Governance and linkages:
Social protection should be designed to be flexible enough to be able to respond to covariate natural and economic shocks, in order potentially to reduce household negative coping strategies, such as decreasing the number of meals per day.
The private sector should be engaged on the provision of diverse foods.
Agricultural schemes should explore options to support the production of alternative, more nutrient-dense crops. The bias towards maize production should be readdressed.
MA
LNU
TR
ITIO
N IN
ZA
MB
IA

13 CO
NC
LUSIO
NS A
ND
REC
OM
MEN
DA
TIO
NS FO
R T
HE D
EVELO
PMEN
T O
F NU
TR
ITIO
N-SEN
SITIV
E SOC
IAL PRO
TEC
TIO
N IN
ZA
MB
IA
75
Evidence from social protection Policy and design recommendations
Pathway 2: Caring practices for women and children – pregnancy and lactation are critical junctures for good-quality care and support
The 1,000 days between a woman conceiving and her child’s second birthday is a critical period for nutrition interventions to target.312
The education level and age of the mother influences the nutrition status of the child: the better educated and older the mother, the better the nutrition status of the child.313
Social Cash Transfer design:
Target the critical window of the first 1,000 days: pregnant/lactating women and children under two years old.
Include BCC as a soft condition of the SCT, with a focus on infant and young child feeding (IYCF) practices – in particular, on exclusive breastfeeding for the first six months and on dietary diversity for children aged 6–24 months.
Include monitoring of IYCF practices within the SCT framework to show impact of BCC activity.
Promote gender inclusivity across all BCC activities by including men and boys alongside women and girls.
Encourage completion of secondary education – as a minimum – for adolescents, particularly girls.
Pathway 3: Health services and environment – conditions children’s exposure to pathogens and the use of preventive and curative healthcare
If combined with access to safe water, social protection programmes can have a huge impact on nutrition.314
Social protection programmes can encourage timely health-seeking behaviour.315
Social Cash Transfer design:
Include BCC on safe water, sanitation and hygiene (WASH) practices, and timely health-seeking behaviour.
Include monitoring of WASH and health-seeking behaviour indicators within SCT framework to show impact of BCC activity.
Governance and linkages:
The geographical overlap of SCT and Zambia’s 1,000 Days programming should be reviewed to promote linkages between the SCT and WASH programmes that provide access to safe drinking water specifically in rural areas, and between the SCT and health programmes focusing on malaria, diarrhoea and HIV and AIDS.
Access to health services at local levels should be reviewed at district level, with particular attention given to communities with the largest distance to basic health centres.
76
RECOMMENDATIONS FOR THE WIDER DEVELOPMENT OF NUTRITION-SENSITIVE SOCIAL PROTECTION IN ZAMBIA
RECOMMENDATIONS TO GOVERNMENT OF THE REPUBLIC OF ZAMBIA
Commitment to nutrition-sensitive social protection:
• The Government of the Republic of Zambia should make a specific and realistic policy commitment to nutrition-sensitive social protection, with the necessary human and financial resources to support it. The second Nutrition for Growth Summit at the Brazilian Olympics in 2016 provides the ideal opportunity for such a commitment to be made, with implementation followed through in the 2017 re-targeting exercise for the SCT.
• Nutrition-sensitive social protection, as a cross-cutting priority, should be clearly articulated in both nutrition and social protection national strategies.
Community and beneficiary engagement:
• Mechanisms to ensure initiatives against malnutrition in all its forms are locally owned must be developed and sustained, particularly at subnational levels, with a focus on community and beneficiary engagement. Such mechanisms should improve the flow of information between policy-makers and beneficiaries/communities. Information on beneficiaries’ experiences and needs must be integrated into monitoring and evaluation mechanisms to enable responsive policy and programme development. This aspect of monitoring and evaluation could be well delivered by civil society.
Monitoring and evaluation:
• The National Social Protection Policy, and within it the SCT, must have a detailed and regular monitoring and evaluation system, across the nutrition pathways, to show their impact on nutrition and to provide evidence for national decision-making.
• The Zambian 1000 Days monitoring and evaluation plan (scheduled to be drafted in 2015) should set out how key data gaps for nutrition will be addressed. (See Appendix 4 for specific recommendations in relation to these gaps.)
Coordination:
• Attention must be given to addressing the institutional challenges, including coordination across shared goals, that negatively affect the implementation of important national policies, including those related to nutrition and social protection.
• Implementation of the new National Food and Nutrition Strategic Plan should proactively improve coordination across relevant ministries, such as MCDMCH, Health, and Agriculture, to facilitate linkages for dietary diversity, IYCF and WASH programmes that provide access to safe drinking water, and health programmes focusing on malaria, diarrhoea and HIV and AIDS.
Legislation:
• A thorough assessment of Zambia’s legislative framework/legal provisions regarding social protection and nutrition, with identification of key areas to improve, should be undertaken. This review should include consideration of the adoption of a ‘rights-based’ approach to food security and nutrition.
RECOMMENDATIONS TO ZAMBIAN CIVIL SOCIETY
• Civil society in Zambia needs to mobilise behind calls to maximise social protection for nutrition by, for example, advocating to government; contributing to programme design and delivery; engaging communities and beneficiaries; and holding the government to account.
• Access to clear information on nutrition-sensitive programming including social protection – with details on access, entitlements, etc – should be regularly disseminated to communities through civil society/NGO and community structures.
RECOMMENDATION TO THE ZAMBIAN PRIVATE SECTOR
• The private sector should consider its contribution to the availability of a diverse and nutritious diet to households through crop production/horticultural markets, with emphasis on the rural areas with particularly weak infrastructure.
MA
LNU
TR
ITIO
N IN
ZA
MB
IA

Children at Riverside school, Kazungula district, Southern province
PHO
TO
: CLEIS N
OR
DFJELL/SA
VE T
HE C
HILD
REN

78
APPENDIX 1: METHODOLOGY
LITERATURE REVIEW
We undertook a literature review looking for the impact of social protection on direct nutrition outcomes and the three nutrition pathways – household food security, care for women and children, and health services and environment. Programme evaluations were reviewed against a checklist, with both design and outcome indicators (see Appendix 2) related to UNICEF’s conceptual framework on the causes of malnutrition (see page 19).
All types of social protection programmes were considered for inclusion in the review. See Appendix 3 for details of programmes included and instruments covered.
The following criteria were applied to select programmes for the review:• The programme has been active for at least one
year and has evaluation information available, and• has been implemented within the last ten yearsand• has been designed to have an impact on nutrition
and/or food securityand/or• the evaluation of the programme documents a
nutrition and/or food security outcome.
The final two criteria are important to note as they show the programmes included set out to improve nutrition or food security (an underlying determinant of nutrition).
Twenty major social protection programme evaluations (see Appendix 3) were included: four from Zambia, a further eight from sub-Saharan Africa and eight from the rest of the world.316
CONTEXTUAL ANALYSIS
We undertook a contextual analysis drawing upon on existing data (various sources) to ascertain the issues driving malnutrition across the nutrition pathways (see checklist in Appendix 2).
POLICY ANALYSIS
We reviewed the policy and governance landscape to ascertain the opportunities, gaps and entry points at national level for the scale-up of successful nutrition-sensitive social protection policies and programmes.
APPENDICES

APPEN
DIC
ES
79
APPENDIX 2: NUTRITION-SENSITIVE SOCIAL PROTECTION CHECKLIST317
This checklist informs the literature review and contextual pathways analysis within this report.
Pathway Impact of programme (any change)
Design principle incorporated (incorporated, partially incorporated, not incorporated)
Cross-cutting What is the programme impact on...?
World Health Assembly 2025 global nutrition targets:318
• the number of children under five who are stunted
• childhood wasting• childhood overweight• low birthweight• anaemia in women of reproductive
age• the rate of exclusive breastfeeding
in the first six months.
Intrauterine growth retardation (poor growth of a baby while in the mother’s womb during pregnancy)
The amount of food available at the national level• measured using countries’ daily
per-capita dietary energy supplies, an indicator of the average amount of food available per person in a country.
Are these aspects incorporated into programme design?
Integrated within broader food and nutrition security strategies
Undertook a contextual analysis to understand the local causes of malnutrition (supply, access, care, environment)
Clarified the pathways through which the programme is intended to impact nutrition
Prevention of any negative side effects on the causes of both undernutrition and overweight
Measures the impact of nutrition outcomes (various)
Poverty and inequality What is the programme impact on?
Household expenditure
Use of cash
Changes for different groups: • male/female• urban/rural• subnational regions• wealth groups • age groups• ethno-linguistic groups.
Are these aspects incorporated into programme design?
Consideration of impact on different groups (eg, through contextual analysis, targeting or evaluation):• male/female• urban/rural• subnational regions• wealth groups• age groups• ethno-linguistic groups.
continued overleaf

80
Pathway Impact of programme (any change)
Design principle incorporated (incorporated, partially incorporated, not incorporated)
Household food security
Assured access to enough food of adequate quality for living an active healthy life
What is the programme impact on...?
Diet quality319
• household dietary diversity: the number of foods or nutritionally significant food groups acquired by a household over the reference period
• percentage of food energy available from staple foods: the percentage of the energy acquired by a household over the reference period that is derived from staple foods (cereals, roots and tubers)
• quantities of foods acquired daily per capita: the quantity of specific foods acquired over the reference period divided by the number of household members and the number of days in the period.
Quantity of food available• household daily food energy
availability per capita• the energy in the food acquired
by a household over the survey reference period divided by the number of household members and the number of days in the period.
• whether a household is food energy-deficient: whether a household acquires insufficient food over the reference period to meet the energy requirements of all of its members for basal metabolic function and light activity (an individual’s energy-deficiency situation is defined as that of her or his household).
Economic vulnerability• percentage of expenditures on food:
the percentage of total household expenditures devoted to food over the reference period
• coping mechanisms.
Are these aspects incorporated into programme design?
Choice of nutrition impact indicators (as a minimum, dietary diversity) integrated
Reaches the 1,000 days: pregnant/lactating women and children under two years of age
Provides transfers in an appropriate form and frequency (examples of consideration of nutrition in development of form)
Adjusts cash/voucher benefit level to the cost of a healthy diet
MA
LNU
TR
ITIO
N IN
ZA
MB
IA

APPEN
DIC
ES
81
Pathway Impact of programme (any change)
Design principle incorporated (incorporated, partially incorporated, not incorporated)
Caring practices for women and children
Pregnancy and lactation are critical junctures for good-quality care and support
What is the programme impact on...?
Women’s education• female school achievement• female gross secondary school
enrolment ratio.320
Empowerment (marker of women’s power relative to men)• age of marriage (female) • teenage pregnancy• women’s participation in household
decision-making (eg, making household purchases, determining own healthcare).
Infant and young child feeding321
• early initiation of breastfeeding• exclusive breastfeeding up to six
months• continued breastfeeding at one year• introduction of solid, semi-solid or
soft food• minimum dietary diversity/
minimum acceptable diet.
Health-seeking behaviour• utilisation of the modern healthcare
system• utilisation of traditional healthcare• timely access to healthcare• seeking health information.
Are these aspects incorporated into programme design?
Reaches the 1,000 days: adolescent girls, pregnant/lactating women, and children under two years of age
Has nutrition-focused complementary actions • nutrition behaviour change,
education, awareness-raising or training
• infant feeding or food supplements• women’s decision-making
considered • deworming
Adapts design and implementation arrangements• minimising time spent (and cost) for
beneficiaries to receive the transfer, eg, using mobile phones
• exempting pregnant women from work requirement
Health services and environment
Conditions children’s exposure to pathogens and the use of preventive and curative healthcare
What is the programme impact on...?
Access to shelter• a place giving protection from bad
weather or danger.
Access to and use of good-quality health services • skilled birth attendant coverage.
Access to and use of safe water• access to safe drinking water • use of safe drinking water• improved drinking water.
Access to and use of sanitation facilities for disposing of human waste• provision of facilities and services
for the safe disposal of human urine and faeces.
Are these aspects incorporated into programme design?
Nutrition-focused complementary actions are included• food supplements, nutritional
training, deworming

82
SUPPORTING DEFINITIONS
Access to drinking water
Water used for domestic purposes, drinking, cooking and personal hygiene. Access to drinking water means that the source is less than 1km away from its place of use and that it is possible to reliably obtain at least 20 litres per household member per day.*
Safe water Water with microbial, chemical and physical characteristics that meet WHO guidelines or national standards on drinking water quality.*
Use of safe drinking water
The proportion of people using improved drinking water sources, eg, household connection, public standpipe, borehole, protected dug well, protected spring, rainwater.*
Improved drinking water
Defined as one that, by nature of its construction or through active intervention, is protected from outside contamination, in particular from contamination with faecal matter. It comprises piped water on premises such as a piped household water connection located inside the user’s dwelling, plot or yard. Other improved drinking water sources include public taps or standpipes, tubewells or boreholes, protected dug wells, protected springs, and rainwater.*
Open defecation Defecation in fields, forests, bushes, bodies of water or other open spaces, or disposal of human faeces with solid waste.**
Basic sanitation The lowest-cost technology ensuring hygienic excreta and sullage disposal, and a clean and healthy living environment, both at home and in the neighbourhood of users. Access to basic sanitation includes safety and privacy in the use of these services. Coverage is the proportion of people using improved sanitation facilities, eg, public sewer connection, septic system connection, pour-flush latrine, simple pit latrine, ventilated improved pit latrine.*
Improved sanitation Defined as one that hygienically separates human excreta from human contact.***
Unimproved sanitation
Facilities that do not ensure hygienic separation of human excreta from human contact. Unimproved facilities include pit latrines without a slab or platform, hanging latrines and bucket latrines.**
Shared sanitation Sanitation facilities of an otherwise acceptable type shared between two or more households. Shared facilities include public toilets.**
* WHO & UNICEF provide the UN system’s joint monitoring programme definition: http://www.who.int/water_sanitation_health/mdg1/en/ [Accessed online 4 December 2014]
** UNICEF, http://www.unicef.org/wcaro/overview_2570.html [Accessed online 4 December 2014]
*** http://www.wssinfo.org/definitions-methods/ [Accessed online 4 December 2014]
MA
LNU
TR
ITIO
N IN
ZA
MB
IA

APPEN
DIC
ES
83
Programme Country Detail Brief overview of findings322
Bolsa Familia Brazil • conditional cash transfer
• started 2003.
• positive impact on household food security: 9% increase of dietary diversity, increase of food expenditure by 9%
• caring practices: 8% increase of exclusive breastfeeding during first six months (compared with non-beneficiaries)
• no impact on wasting or stunting.
Familias en Acción/CCT
Colombia • conditional cash transfer
• started 2000.
• 10% drop in stunting in rural areas• positive impact on household food security:
protein consumption increased and all children ate more of each food group.
Child Support Grant
South Africa • unconditional cash transfer
• started in 1998• reaches 8 million
children.
Impact on caring practices: • ¼ grade increase in attainment for girls and
earlier enrolment• reduction of number of sexual partners and
pregnancy rate.
Social Cash Transfer
Malawi • unconditional cash transfer
• started in 2006• reaching almost
300,000 households.
• 4% drop in stunting and 2% drop in wasting• significant increase of household expenditure
on food and of food consumption • positive impact on health services and
environment: more likely to access health services when sick
• positive impact on caring practices: higher enrolment for girls and boys
• positive impact on health services and environment: increased housing quality.
Hunger Safety Net Programme
Kenya • unconditional cash transfer
• started in 2006.
• no impact on stunting and wasting• positive impact on household food security:
food consumption increased• positive impact on health services and
environment: improved access to safe water in some areas.
Progressa / Oportunidades
Mexico • conditional cash transfer
• started in 1997• reaches 5 million+
families.
• results on impact of stunting mixed• positive impact on household food security:
improved dietary quality• impact on caring practices: infant mortality
declines.
APPENDIX 3: PROGRAMMES INCLUDED IN LITERATURE REVIEW
continued overleaf

84
Programme Country Detail Brief overview of findings322
Juntos Peru • conditional cash transfer
• started in 2006• reaches 650,000+
families.
• decrease of stunting by 8%• positive impact on household food security:
beneficiaries consume more foods of all food groups; 15% increase in expenditure on food
• positive impact on caring practices: higher enrolment rates in primary and secondary school, particularly for girls.
• positive impact on health services and environment: healthcare access for children under five doubled; increase in skilled birth attendance coverage.
Pantawid Pamilyang Pilipino Program
Philippines • conditional cash transfer
• started in 2008• reaches 3 million
households.
• 10% decrease in severe stunting• impact on household food security: no impact
on food expenditure or consumption• positive impact on caring practices: 9% increase
of primary school enrolment• positive impact on health services and
environment: increase in use of prenatal care.
Child Grant Nepal • unconditional cash transfer
• started in 2009 • reaches 500,000+
children.
• impact on household food security: enabled beneficiaries to buy more food but did not change overall levels of food security; also no effect on household food consumption
• impact on caring practices: no impact on primary and secondary school enrolment
• impact on health services and environment: no significant impact on access to healthcare and utilisation of modern healthcare
Bono de Desarrollo Humano
Ecuador • unconditional cash transfer, then became conditional
• started in 1998• reaches 1.3 million
households.
• no effect on stunting or wasting• impact on household food security: half of
households report spending 10–12% more on food but no changes in dietary diversity were found
• positive impact on caring practices: 10% increase in primary school enrolment
• impact on health services and environment: 12% increase in take-up of parasite treatment; no effect on seeking health information or timely access to healthcare.
Red de Protección Social and Atencion a Crisis
Nicaragua • conditional cash transfer
• started 2000
• reduction of stunting by 5%; no effect on wasting
• positive impact on household food security: both programmes increased household food expenditure and improved dietary diversity
• positive impact on caring practices: Red de Protección saw a 20% improvement in primary school enrolment
• positive impact on health services and environment: preventive healthcare improved; increase in take-up of deworming drugs.
MA
LNU
TR
ITIO
N IN
ZA
MB
IA
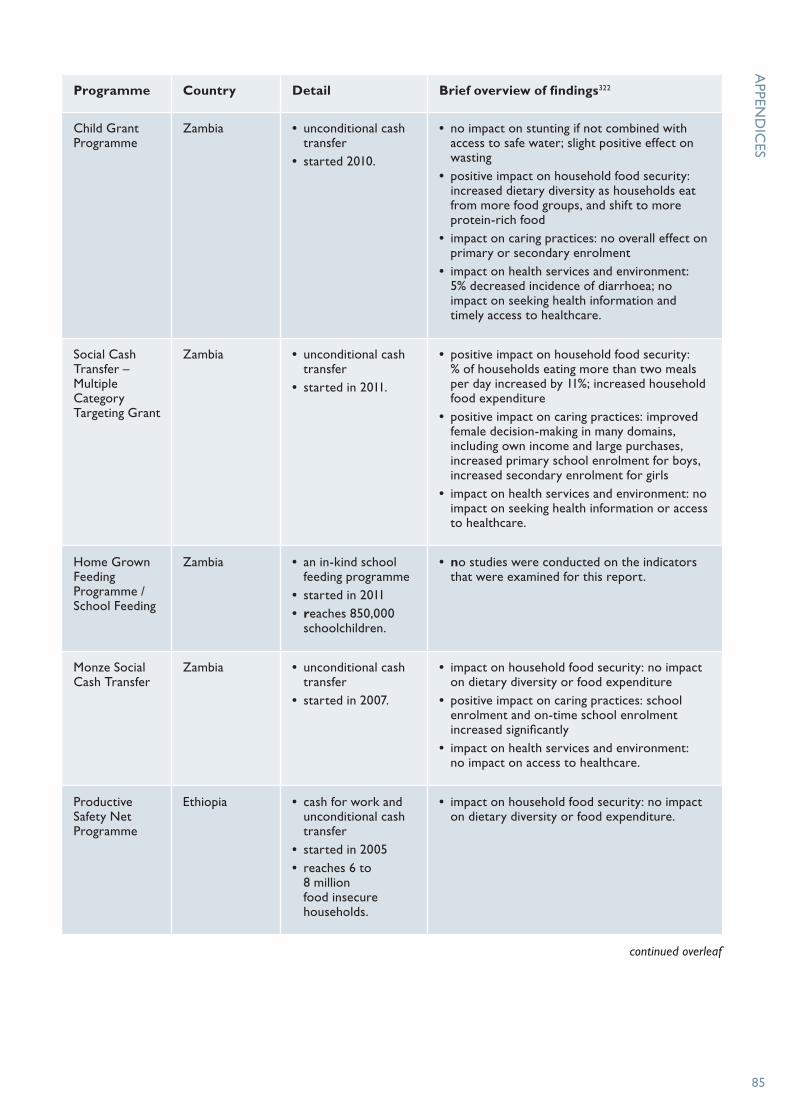
APPEN
DIC
ES
85
Programme Country Detail Brief overview of findings322
Child Grant Programme
Zambia • unconditional cash transfer
• started 2010.
• no impact on stunting if not combined with access to safe water; slight positive effect on wasting
• positive impact on household food security: increased dietary diversity as households eat from more food groups, and shift to more protein-rich food
• impact on caring practices: no overall effect on primary or secondary enrolment
• impact on health services and environment: 5% decreased incidence of diarrhoea; no impact on seeking health information and timely access to healthcare.
Social Cash Transfer – Multiple Category Targeting Grant
Zambia • unconditional cash transfer
• started in 2011.
• positive impact on household food security: % of households eating more than two meals per day increased by 11%; increased household food expenditure
• positive impact on caring practices: improved female decision-making in many domains, including own income and large purchases, increased primary school enrolment for boys, increased secondary enrolment for girls
• impact on health services and environment: no impact on seeking health information or access to healthcare.
Home Grown Feeding Programme / School Feeding
Zambia • an in-kind school feeding programme
• started in 2011 • reaches 850,000
schoolchildren.
• no studies were conducted on the indicators that were examined for this report.
Monze Social Cash Transfer
Zambia • unconditional cash transfer
• started in 2007.
• impact on household food security: no impact on dietary diversity or food expenditure
• positive impact on caring practices: school enrolment and on-time school enrolment increased significantly
• impact on health services and environment: no impact on access to healthcare.
Productive Safety Net Programme
Ethiopia • cash for work and unconditional cash transfer
• started in 2005 • reaches 6 to
8 million food insecure households.
• impact on household food security: no impact on dietary diversity or food expenditure.
continued overleaf

86
Programme Country Detail Brief overview of findings322
Lesotho Child Grants Programme
Lesotho • unconditional cash transfer
• started in 2011 • reaches 50,000
children
• impact on household food security: no impact on dietary diversity but improved food security, especially among children
• positive impact on caring practices: increased primary school enrolment, though higher for boys than for girls
• impact on health services and environment: no impact on access to healthcare or seeking health information.
National Harmonized Social Cash Transfer program
Zimbabwe • unconditional cash transfer
• started in 2011 • reaches 33,000
households.
• positive impact on household food security: beneficiaries were better able to meet their food requirements; less use of adverse coping strategies
• impact on caring practices: enabled households to meet education needs
Programa Subsídio de Alimentos Program
Mozambique • unconditional cash transfer
• reaches 144,000 households.
• no impact on stunting; 30% reduction of wasting
• positive impact on household food security: increased household food expenditure; increased probability that women and boys eat more meals a day than previously.
Livelihood Empowerment against Poverty
Ghana • unconditional cash transfer
• started in 2008• reaches 70,000+
households.
• impact on household food security: improved food security; weak and inconclusive evidence on dietary diversity.
• impact on caring practices: no impact on primary enrolment; increased secondary school enrolment for boys and increased secondary school attendance for girls
• impact on health services and environment: improved access to healthcare; increased morbidity for children aged 0–5; decreased morbidity for children aged 6–17.
MA
LNU
TR
ITIO
N IN
ZA
MB
IA
APPEN
DIC
ES
87
APPENDIX 4: DATA GAPS
A number of vital data gaps exist for nutrition in Zambia. The 1000 Days Monitoring and Evaluation plan should set out how these will be addressed. Save the Children, as part of a recent review, has identified gaps to be addressed, as follows: • District-level data. It is currently not possible
to explore the prevalence of malnutrition at district level in Zambia. The current presentation of DHS only allows disaggregation by province. This is extremely important for service planning, delivery, monitoring and evaluation. We strongly suggest this is addressed as a priority.
• Teenage pregnancy. It is currently not possible to explore the implications of child/teenage pregnancy for nutrition in Zambia. DHS only presents data on size of babies with mother’s age categorised as <20. We should extend to be able to see <16.
• Disabilities. We currently do not know enough about the extent of disabilities and where they are located, especially the extent of disabilities that work as pathways to poor nutrition. The only information we could find is in the 2000 census that 2.7% of people were disabled, and in the 2010 census that 3% were disabled. DHS should cover disabilities.
• Pregnant and lactating women. We were unable to find data on nutritional status of pregnant women, or on their share of food within the household. This is extremely important for nutrition and should be addressed.
• Need for consistency across surveys on definitions of water and sanitation. Water and sanitation are key drivers of malnutrition. DHS currently doesn’t allow data on improved water and sanitation cut by different subsets of the sample to be downloaded. There are also different definitions for surface water in the Joint Monitoring Programme (JMP) and DHS statcompiler. The categories for water and sanitation sources are different again in the Zambia LCMS. This is not just a problem for Zambia, but it is important here because water and sanitation are clearly an issue for nutrition in the country. There is a need for harmonisation of measures in this area, so that we can look at the JMP measure at a disaggregated level and see where to target interventions to improve it and so hit MDGs and SDGs.
• No food insecurity index. We have been unable to find a good insecurity index. We have used the share of people who cannot afford a minimum basket, or three meals a day, as a substitute. We suggest this information could be improved. We also could not find information on the intra-household impact of food insecurity (eg, who goes without). Bangladesh, for example, has a system, Household Food Insecurity Access Sale (HFIAS), which measures food insecurity more directly by asking about whether people are going without and what coping strategies they are having to resort to.
• Lack of strategic, forward-looking analysis on where crises likely to happen. WFP for example relies heavily on in-depth vulnerability assessment surveys, which are reactive and only take place after a drought or flood has caused large-scale problems.323
• Need for cost-benefit analysis. As cited by Drimie et al 2014,324 there is a need for Zambia-specific estimates of the economic benefit of investing in nutrition. This is important because growth is the central metric for government attention. Hoddinott et al (2013) estimate the return on investment into nutrition via its impact on economic growth for eight sub-Saharan African countries and conclude the benefit–cost ratios of such investments are approximately 1:15. But this study doesn’t include Zambia, and Drimie et al found no studies that do.
• Information on nutrition capacity gaps. As cited by Drimie et al 2014325 Where are the nutrition capacity gaps most constraining? Is it the lack of frontline workers, or that they are not trained and equipped to do the right thing? Or is it that different sectors and ministries do not work well together? Or is it all of the above?
• Acute malnourishment in children. How to expand the management of acute malnourishment in children?326 This category was not in any of the publications reviewed.
• Measuring the impact of nutrition-sensitive interventions. How to make nutrition-sensitive interventions have a bigger impact? For example, through managing aflatoxin in the production of food; school-based nutrition education; integrating nutrition into agricultural interventions; and strengthening the power of women to make relevant decisions.327

Adhikari, T. P., Thapa, F. B., Tamrakar, S., Magar, P. B., Hagen-Zanker, J., & Babajanian, B. (2014). How does social protection contribute to social inclusion in Nepal?. ODI report, February. 76 pp. Downloaded in August 2015 from http://www.researchgate.net/profile/Jessica_Hagen-Zanker/publication/268809079_How_does_social_protection_contribute_to_social_inclusion_in_Nepal_Evidence_from_the_Child_Grant_in_the_Karnali_Region/links/547734520cf293e2da25e356.pdf
American Institutes for Research (AIR). (2013). Zambia’s Child Grant Program: 24-month impact report. Washington, DC: Author. Downloaded in August 2015 from http://www.air.org/sites/default/files/Zambia_Child_Grant_Program_Report_20131.pdf
American Institutes for Research. (2014). Zambia’s Multiple Category Targeting Grant: 24-Month Impact Report. Washington, DC: Author. Downloaded in August 2015 from http://www.air.org/sites/default/files/downloads/report/RCT%20of%20SCTs_MCTG_24_month_report_Official.pdf
Angelucci, M. (2008). Love on the rocks: Domestic violence and alcohol abuse in rural Mexico. The BE Journal of Economic Analysis & Policy, 8(1).
Attah, R., Farhat, M., & Kardan, A. (2013). Kenya Hunger Safety Net Programme Monitoring and Evaluation Component; Qualitative Impact Evaluation Report: 2011–2012. 47 pp. Downloaded in August 2015 from http://www.opml.co.uk/sites/default/files/HSNP%20impact%20evaluation%20qualitaive%20report_0.pdf
Attanasio, O., Gomez, L. C., Heredia, P., & Vera-Hernandez, M. (2005). The short-term impact of a conditional cash subsidy on child health and nutrition in Colombia. 15 pp.
Baird, S., McIntosh, C., & Özler, B. (2011). Cash or condition? Evidence from a cash transfer experiment. The Quarterly Journal of Economics, qjr032.
Barber, S. L., & Gertler, P. J. (2010). Empowering women: how Mexico’s conditional cash transfer
programme raised prenatal care quality and birth weight. Journal of Development Effectiveness, 2(1), 51–73.
Barrientos, A., & Nino-Zarazua, M. (2010). Effects of non-contributory social transfers in developing countries: A compendium. Geneva: International Labor Office. p. 40.
Behrman, J. R., Fernald, L., Gertler, P., Neufeld, L. M., & Parker, S. (2008). Evaluación de los efectos a diez años de Oportunidades en el desarrollo, educación y nutrición en niños entre 7 y 10 años de familias incorporadas desde el inicio del Programa. Evaluación externa del Programa Oportunidades 2008, 15.
Black, R. E., Victora, C. G., Walker, S. P., Bhutta, Z. A., Christian, P., de Onis, M., Ezzati, M., Grantham-McGregor, S., Katz, J., Martorell, R., et al. Maternal and child undernutrition and overweight in low-income and middle income countries. Lancet 2013;382:427–51.
Blattman, C. “Let Them Eat Cash.” New York Times June 29, 2014. Accessed in August of 2015 at http://www.nytimes.com/2014/06/30/opinion/ let-them-eat-cash.html.
Bobonis, G. J., González-Brenes, M., & Castro, R. (2013). Public transfers and domestic violence: The roles of private information and spousal control. American Economic Journal: Economic Policy, 5(1), 179–205.
Chaudhury, N., Friedman, J., & Onishi, J. (2013). Philippines conditional cash transfer program impact evaluation 2012. Manila: World Bank. 80 pp. Downloaded in August 2015 from http://www.dswd.gov.ph/download/Research/Philippines%20Conditional%20Cash%20Transfer%20Program,%20Impact%20Evaluation%202012.pdf.
Cluver, L. D., Orkin, F. M., Boyes, M. E., & Sherr, L. (2014). Cash plus care: social protection cumulatively mitigates HIV-risk behaviour among adolescents in South Africa. AIDS, 28, S389–S397.
LITERATURE REVIEW REFERENCES
88

89
LITER
AT
UR
E REV
IEW R
EFEREN
CES
Covarrubias, K., Davis, B., & Winters, P. (2012). From protection to production: productive impacts of the Malawi social cash transfer scheme. Journal of Development Effectiveness, 4(1), 50–77.
de Brauw, A., Gilligan, D., Hoddinott, J., Moreira, V., & Roy, S. (2012). The impact of Bolsa Familia on child, maternal, and household welfare. Working Paper. Washington DC: International Food Policy Research Institute. 83 pp.
de Neve, J. W., Fink, G., Subramanian, S. V., Moyo, S., & Bor, J. (2015). Length of secondary schooling and risk of HIV infection in Botswana: evidence from a natural experiment. The Lancet Global Health, 3(8), e470–e477.
DSD, SASSA and UNICEF. (2012). The South African Child Support Grant Impact Assessment: Evidence from a survey of children, adolescents and their households. Pretoria: UNICEF South Africa.
Duflo, E., Dupas P., and Kremer, M. (2015). Education, HIV, and Early Fertility: Experimental Evidence from Kenya. American Economic Review, 105(9): 2757–97.
Fernald, L. C., Gertler, P. J., & Neufeld, L. M. (2009). 10-year effect of Oportunidades, Mexico’s conditional cash transfer programme, on child growth, cognition, language, and behaviour: a longitudinal follow-up study. The Lancet, 374(9706), 1997–2005.
Fernald, L. C., & Hidrobo, M. (2011). Effect of Ecuador’s cash transfer program (Bono de Desarrollo Humano) on child development in infants and toddlers: a randomized effectiveness trial. Social science & medicine, 72(9), 1437–1446.
Gilligan, D. O., Hoddinott, J., & Taffesse, A. S. (2009). The Impact of Ethiopia’s Productive Safety Net Programme and its Linkages. Journal of Development Studies, 45(10), 1684–1706. doi: 10.1080/00220380902935907
Handa, S., Angeles, G., Abdoulayi, S., Mvula, P., & Tsoka, M. (2014). Malawi Social Cash Transfer Program Baseline Evaluation Report, 125 pp. Available as of August 2015 from http://www.cpc.unc.edu/projects/transfer/countries/malawi/copy_of_MalawiSCTPBaselineReportrev2014July8.pdf.
Handa, S., Park, M., Darko, R. O., Osei-Akoto, I., Davis, B., & Daidone, S. (2014). Livelihood Empowerment Against Poverty Program Impact Evaluation. Chapel Hill, North Carolina: Carolina Population Center, University of North Carolina at Chapel Hill.
Handa, S., Peterman, A., Seidenfeld, D., & Tembo, G. (2015). Income Transfers and Maternal Health: Evidence from a National Randomized Social Cash Transfer Programme in Zambia. Health Economics. Published online before print. DOI: 10.1002/hec.3136
Handa, S., Seidenfeld, D., Tembo, G., Prencipe, L., & Peterman, A. (2013). Zambia’s Child Grant Program: 24-Month Impact Report. Washington DC, USA: American Institutes for Research (AIR).
Handa, S., Seidenfeld, D., Davis, B., Tembo G., and the Zambia Cash Transfer Evaluation Team (2014). Are Cash Transfers a Silver Bullet? Evidence from the Zambian Child Grant, Innocenti Working Paper No.2014-08, UNICEF Office of Research, Florence.
Hanlon, J., Barrientos, A., et al. (2010). Just give money to the poor: The development revolution from the global south. Sterling, VA: Kumarian Press.
Hoddinott, J., Alderman, H., Behrman, J. R., Haddad, L., Horton, S., 2013. The Economic Rationale for Investing in Stunting Reduction. Available online: http://repository.upenn.edu/cgi/viewcontent.cgi?article=1007&context=gcc_economic_returns
Hoddinott, J., Berhane, G., Gilligan, D. O., Kumar, N., & Taffesse, A. S. (2012). The Impact of Ethiopia’s Productive Safety Net Programme and Related Transfers on Agricultural Productivity. Journal of African Economies, 21(5), 761–786.
Hoddinott, J., Skoufias, E., & Washburn, R. (2000). The impact of PROGRESA on consumption: A final report. International Food Policy Research Institute, Washington, DC.
Kardan, A., Sindou, E., & Pellerano, L. (2014). Lesotho Child Grants Programme: The historic and future costs of the CGP and its affordability Executive Summary: Oxford Policy Management.
Lindert, K., Linder, A., Hobbs, J., & De la Brière, B. (2007). The nuts and bolts of Brazil’s Bolsa Família Program: implementing conditional cash transfers in a decentralized context.
Maluccio, J., & Flores, R. (2005). Impact evaluation of a conditional cash transfer program: The Nicaraguan Red de Protección Social. Intl Food Policy Res Inst.
Manley, J., Gitter, S., & Slavchevska, V. (2013). How Effective are Cash Transfers at Improving Nutritional Status?. World development, 48, 133-155.
Merttens, F., Hurrell, A., Marzi, M., Attah, R., Farhat, M., Kardan, A., & MacAuslan, I. (2013). Kenya Hunger Safety Net Programme Monitoring
90
and Evaluation Component. Impact Evaluation Final Report: 2009 to 2012. 154 pp. As of August 2015, available from http://www.opml.co.uk/sites/default/files/HSNP%20Impact%20evaluation%20final%20report_0.pdf
Miller, C., Tsoka, M., & Reichert, K. (2008). Impact Evaluation Report External Evaluation of the Mchinji Social Cash Transfer Pilot. Available as of August 2015 from http://www.unicef.org/malawi/MLW_resources_impactsocialcashtrf.pdf
Miller, C. M., Tsoka, M., & Reichert, K. (2011). The impact of the Social Cash Transfer Scheme on food security in Malawi. Food policy, 36(2), 230–238.
Molyneux, M. (2006). Mothers at the service of the new poverty agenda: progresa/oportunidades, Mexico’s conditional transfer programme. Social Policy & Administration, 40(4), 425–449.
Olinto, P., Flores, R., Morris, S., & Viega, A. (2003, August). The impact of the Bolsa Alimentação Program on food consumption. In annual meetings of the International Association of Agricultural Economists.
Oxford Policy Management. (2013). Qualitative research and analyses of the economic impacts of cash transfer programmes in sub-Saharan Africa Zimbabwe Country Case Study Report. Rome: Food and Agriculture Organization of the United Nations.
Oxford Policy Management. (2014). Child Grants Programme Impact Evaluation. Follow-up Report. Oxford.
Paxson, C., & Schady, N. (2010). Does money matter? The effects of cash transfers on child development in rural Ecuador. Economic development and cultural change, 59(1), 187–229.
Perova, E., & Vakis, R. (2009). Welfare impacts of the “Juntos” Program in Peru: Evidence from a non-experimental evaluation. The World Bank, 1–59.
Rivera, J. A., Sotres-Alvarez, D., Habicht, J. P., Shamah, T., & Villalpando, S. (2004). Impact of the Mexican program for education, health, and nutrition (Progresa) on rates of growth and anemia in infants and young children: a randomized effectiveness study. Jama, 291(21), 2563–2570.
Ruel, Marie T. 2010. “The Oriente Study: Program and Policy Impacts.” Journal of Nutrition 140: 415–418.
Sánchez, A., & Jaramillo, M. (2012). Impacto del programa Juntos sobre la nutrición temprana. Revista Estudios Económicos, 23(1), 53–66.
Sayre, R. K., Devercelli, A. E., Neuman, M. J., & Wodon, Q. (2015). Investing in Early Childhood Development: Review of the World Bank’s Recent Experience. World Bank Publications.
Schubert, B., & Chirchir, R. (2012). Zimbabwe Harmonized Social Cash Transfer Programme (HSCT): Analysis of the process and results of targeting labour constrained food poor households in the first 10 districts. Harare, Zimbabwe.
Seidenfeld, D., & Handa, S. (2011). Results of the Three Year Impact Evaluation of Zambia’s Cash Transfer Program in Monze District Final Report. Washington, DC: American Institutes for Research.
Smith, L., & Haddad, L. (2014). Reducing Child Undernutrition: Past Drivers and Priorities for the Post-MDG Era. 47 pp. Available as of August 2015 from http://opendocs.ids.ac.uk/opendocs/bitstream/handle/123456789/3816/Wp441R.pdf?sequence=4
Soares, F. V., & Silva, E. (2010). Conditional cash transfer programmes and gender vulnerabilities: case studies of Brazil, Chile and Colombia (No. 69). Working Paper, International Policy Centre for Inclusive Growth.
Soares, F. V., & Teixeira, C. (2010). Impact Evaluation of the Expansion of the Food Subsidy Programme in Mozambique. Center for Inclusive Growth. International Policy Research Brief 17.
Streuli, N. (2012). Children’s experiences of Juntos, a conditional cash transfer scheme in Peru. Young Lives Working Paper No, 78.
Tembo, G., Freeland, N., Chimai, B., & Schüring, E. (2014). Social Cash Transfers and Household Welfare: Evidence from Zambia’s Oldest Scheme. Applied Economics and Finance, 1(1), 13–26.
Werth, C. “A New Fix for the Needy.” Newsweek October 25, 2010.
WHO (World Health Organization) (2006). Infant and young child nutrition: The WHO multicentre growth reference study. Quote is online at: http://www.who.int/childgrowth/faqs/applicable/en/, accessed August 2015.
World Bank. (2015). World Development Indicators. Downloaded in August 2015 from http://data.worldbank.org/indicator/NY.GDP.PCAP.CD
MA
LNU
TR
ITIO
N IN
ZA
MB
IA

91
EXECUTIVE SUMMARY1 Government of the Republic of Zambia, 2006, Vision 2030. http://unpan1.un.org/intradoc/groups/public/documents/cpsi/unpan040333.pdf: 32/332 DHS, 2015. Zambia Demographic and Health Survey. Available online: http://dhsprogram.com/Where-We-Work/Country-Main.cfm?ctry_id=47&c=Zambia&Country=Zambia&cn=&r=1
Note: Data on stunting in Zambia only available through DHS since 1992.3 Zambia DHS 1992, 1996, 2002, 2007, 2013–144 Government of the Republic of Zambia, 2015. National Social Protection Policy, Ministry of Community Development, Mother and Child Health, Government of the Republic of Zambia: 35 World Bank 2013. Zambia’s Jobs Challenge: Realities on the ground. Washington DC: The World Bank. 6 Bloomberg, 2015. Zambia Seen Moving to Prop Worst Currency Performer in 2015. Bloomberg Business. Available online: http://www.bloomberg.com/news/articles/2015-09-25/barclays- sees-zambia-acting-to-stem-world-s-worst-currency-fall [Last accessed 011215]7 Scott, G., 2014. Forward, Turning Rapid Growth into Meaningful Growth: Sustaining the Commitment to Nutrition in Zambia, IDS Special Collection, September8 UNDP, 2015. Income GINI Coefficients. Available online: http://hdr.undp.org/en/content/income-gini-coefficient [Last accessed 021215]9 CSO, 2012. Living Condition and Monitoring Report 2006 and 2010, Lusaka: Government of Zambia: 14810 World Bank, 2015. Mapping Subnational Poverty in Zambia, Lusaka: World Bank: 111 Save the Children’s own calculations, based on Zambia Demographic and Health Survey. Available online: http://dhsprogram.com/Where-We-Work/Country-Main.cfm?ctry_id=47&c=Zambia&Country=Zambia&cn=&r=112 Save the Children’s own calculations, based on Zambia Demographic and Health Survey. Available online: http://dhsprogram.com/Where-We-Work/Country-Main.cfm?ctry_id=47&c=Zambia&Country=Zambia&cn=&r=113 The benefit-cost ratio of scaling up nutrition-specific interventions to 90% coverage in terms of its impact on stunting in Zambia is 17 to 1. The analysis is based on an assumption, in line with the level of stunting reduction modelled by Bhutta et al. (2013a), that scaling up a core package of interventions will lead to a 20% decrease in the rate of stunting.14 The analysis is based on an assumption, in line with the level of stunting reduction modelled by Bhutta et al. (2013a), that scaling up a core package of interventions will lead to a 20% decrease in the rate of stunting.15 International Food Policy Research Institute. 2014. Global Nutrition Report 2014: Actions and Accountability to Accelerate the World’s Progress on Nutrition. Washington, DC: 7, 916 Note: 2010 food baskets valued at K96,366 respectively a for six-person household, GRZ, 2012. Living Conditions Monitoring Survey Report 2006 and 2010. Central Statistics Office, Government of the Republic of Zambia: 178
17 CSO, 2012. Living Condition and Monitoring Report 2006 and 2010, Lusaka: Government of Zambia: 21218 CSO, 2012. Living Condition and Monitoring Report 2006 and 2010, Lusaka: Government of Zambia: 21319 CSO, 2012. Living Condition and Monitoring Report 2006 and 2010, Lusaka: Government of Zambia: 119–120, 16620 Infant and Young Child Feeding, based on four or more food groups in the day or night preceding the survey. For more information see World Health Organization guidelines: http://www.who.int/mediacentre/factsheets/fs342/en/ 21 Harris, J and Drimie, S, 2012. Towards an Integrated Approach for Addressing Malnutrition in Zambia: A literature review and institutional analysis, Washington DC: International Food Policy Research Institute (IFPRI)22 DHS, Zambia Demographic and Health Survey: 2013–14: 161 Available online: http://www.dhsprogram.com/pubs/pdf/FR304/FR304.pdf23 DHS, 2015. Zambia Demographic and Health Survey: 2013–14: 167. Available online: http://www.dhsprogram.com/pubs/pdf/FR304/FR304.pdf24 Drimie, S., Chakrabarty, S., Dube, C., Smit-Mwanamwenge, M. , Rawat, R and Harris, J., 2014. Intersectoral Coordination for Nutrition in Zambia, Turning Rapid Growth into Meaningful Growth: Sustaining the Commitment to Nutrition in Zambia, IDS Special Collection, September25 DHS, 2015. Zambia Demographic and Health Survey: 2013–14: 169. Available online: http://www.dhsprogram.com/pubs/pdf/FR304/ FR304.pdf26 JMP, 2015. Zambia: estimates on the use of water sources and sanitation facilities (1980–2015). Available online: http://www.wssinfo.org/documents/?tx_displaycontroller%5Btype%5D=country_files&tx_displaycontroller%5Bsearch_word%5D=Zambia [Last accessed 27/7/15]27 Handa, S., Seidenfeld, D., Davis, B., Tembo G., and the Zambia Cash Transfer Evaluation Team, 2014. Are Cash Transfers a Silver Bullet? Evidence from the Zambian Child Grant, Innocenti Working Paper No.2014-08, UNICEF Office of Research, Florence28 ILO, 2014. World Social Protection Report 2014/15, International Labour Organization: 15429 Smith, L., & Haddad, L., 2014. Reducing Child Undernutrition: Past Drivers and Priorities for the Post-MDG Era, IDS Working Paper Volume 2014 No 44, Transform Nutrition, Institute of Development Studies: 930 The World Bank, 2013. Improving Nutrition Through Multisector Approach: Social Protection briefing, The World Bank, Rapid Social Response, DFID, Government of Japan. This brief is part of the World Bank’s report on multisectoral approach for improving nutrition.31 Developed from Smith and Haddad, 2014, Reducing Child Undernutrition: Past Drivers and Priorities for the Post-MDG Era. IDS working paper. Volume 2014, Issue 441, pages 1–47, April 201432 The 1,000-day period between a woman’s pregnancy (conception) and her child’s second birthday. The right nutrition during this critical period can have a profound impact on a child’s ability to grow, learn and rise out of poverty. It can also shape a society’s long-term health, stability and prosperity33 Save the Children own analysis based on results of the literature review. For full literature review references see page 88.
ENDNOTES
34 As our analysis showed, for example, the Ethiopia Productive Safety Net Programme (public works), Malawi Mchinji Social Cash Transfer Scheme (UCT), Mexico’s Progreas/Oportunidades (CCT). Save the Children own analysis based on results of the literature review. For full literature review references see page 88.35 See, for example: Ethiopia’s Productive Safety Net Programme – Devereux, S. and S. Coll-Black, 2007 Review of evidence and evidence gaps on the effectiveness and impacts of DFID-supported pilot social transfer schemes. DFID Evaluation Working Paper.
Malawi’s Social Cash Transfer Programme – Vincent, K. and Cull, T., 2009. Impacts of social cash transfers: case study evidence from across Southern Africa. Instituto de Estudos Sociais e Económicos. 36 See, for example, Ethiopia’s Productive Safety Net Programme on a reduction of negative coping strategies: Devereux, S. and S. Coll-Black, 2007 Review of evidence and evidence gaps on the effectiveness and impacts of DFID-supported pilot social transfer schemes. DFID Evaluation Working Paper.37 See examples:
– from Ethiopia: Devereux, 2007 and Slater, R. et al, 2006, PSNP policy, programme and institutional linkages. Final Report, ODI, the IDL group and Indak International.
– from Mexico: Gertler, P., Martinez, S. and Rubio-Codina, M., 2006, Investing cash transfers to raise long-term living standards, Report WPS 3994-IE, Washington DC, World Bank. 38 Tanner, J., Candland, T. L., Odden, W. S, 2015. Impacts of interventions during early childhood on later outcomes: a systematic review. Washington, DC: World Bank Group.39 1000 Days Partnership, 2014, About 1000 days. http://www.thousanddays.org/about/ [Last accessed 16/11/15]40 See, for example, Smith, L., & Haddad, L. (2014). Reducing Child Undernutrition: Past drivers and priorities for the post-MDG era. 47 pp. Available as of August 2015 from http://opendocs.ids.ac.uk/opendocs/bitstream/handle/123456789/3816/Wp441R.pdf?sequence=4. 41 See, for example, outcomes of the Zambia Child Grants Programme in Seidenfeld, D., Handa, S., Tembo, G., Michelo, S., Harland Scott, C., and Prencipe, L., (2014). The impact of an unconditional cash transfer on food security and nutrition: The Zambia Child Grant Programme, In: Harris, Jody; Haddad, Lawrence and Grütz, Silke Seco (2014) Turning Rapid Growth into Meaningful Growth: Sustaining the Commitment to Nutrition in Zambia, Brighton: IDS.42 DFID, 2011. DFID Cash Transfers Literature Review. Policy Division, Department for International Department, UK: 28; Hörmansdörfer, C., 2009. Health and Social Protection. In: OECD, 2009. Promoting Pro-poor Growth, Social Protection: 145–153.
KEY TERMS43 1000 Days Partnership, 2014. 1000 days. http://www.thousanddays.org/about/ [Accessed online 4 December 2014]44 UNICEF, 2006. Progress for Children – Hunger definition. http://www.unicef.org/progressforchildren/2006n4/hungerdefinition.html [Accessed online 4 December 2014]45 UNICEF, 2006. Progress for Children – Malnutrition definition. http://www.unicef.org/progressforchildren/2006n4/malnutrition definition.html [Accessed online 4 December 2014]46 Ruel et al., 2013, Nutrition-sensitive interventions and programmes: how can they help to accelerate progress in improving maternal and child nutrition? The Lancet, Volume 382, Issue 9891: 536–55147 UNICEF, 2006. Progress for Children – Undernutrition definition. http://www.unicef.org/progressforchildren/2006n4/undernutrition definition.html [Accessed online 4 December 2014]
INTRODUCTION48 Government of the Republic of Zambia, 2006, Vision 2030. http://unpan1.un.org/intradoc/groups/public/documents/cpsi/unpan040333.pdf: 32/3349 DHS, 2015. Zambia Demographic and Health Survey: 2013–14. Available online: http://www.dhsprogram.com/pubs/pdf/FR304/FR304.pdf50 Central Statistical Office (CSO) [Zambia], Ministry of Health (MOH) [Zambia], and ICF International. 2014. Zambia Demographic and Health Survey 2013–14. Rockville, Maryland, USA: Central Statistical Office, Ministry of Health, and ICF International: 157/15851 Save the Children International, 2015, CSSP Position Paper (working copy)52 ILO and World Bank, 2015. Joint Statement by World Bank Group President Jim Yong Kim and ILO Director General Guy Ryder, June 30, 2015. Available online: http://www.worldbank.org/en/news/press-release/ 2015/06/30/joint-statement-world-bank-group-president-ilo-director-general-guy-ryder53 ILO, 2014. World Social Protection Report 2014/15: 154 Numbers include all social protection and labour programmes. Extracted from ASPIRE, World Bank. http://datatopics.worldbank.org/aspire/country/zambia. [Last accessed: 12.11.15]
1 WHY SOCIAL PROTECTION AND NUTRITION? 55 Note: Figure is for 2011. Source: Black et al, 2013. Maternal and child undernutrition and overweight in low-income and middle-income countries, Series Paper Maternal and Child Nutrition, The Lancet. Volume 382, No. 9890: 427–451, August 201356 Leroy, J. L., M. Ruel, J. P. Habicht and E. A. Frongillo, 2014. Linear growth deficit continues to accumulate beyond the first 1000 days in low- and middle-income countries: Global evidence from 51 national surveys. Journal of Nutrition, 144: 1460–146657 Save the Children, 2013. Food for Thought: Tackling child malnutrition to unlock potential and boost prosperity: iv–v58 Leroy, J. L., M. Ruel, J. P. Habicht and E. A. Frongillo, 2014. Linear growth deficit continues to accumulate beyond the first 1000 days in low- and middle-income countries: Global evidence from 51 national surveys. Journal of Nutrition, 144: 1460–146659 1000 Days Partnership, 2014, About 1000 days. http://www.thousanddays.org/about/ [Last assessed 16/11/15]60 Note: It has been estimated that stunted children earn 22% less than their non-stunted counterparts, based on available longitudinal studies of the impact of malnutrition on education, and evidence from 51 countries on the impact of education on earnings. Grantham McGregor S, 2007. Development potential in the first 5 years for children in developing countries, The Lancet, 369(9555): 60–7061 World Bank, Repositioning Nutrition as Central to Development: 2462 FAO, 2013. The State of Food and Agriculture 2013, Food and Agriculture Organisation of the United Nations. 63 Copenhagen Consensus, 2014, Preliminary Benefit-Cost Assessment for 12th Session OWG Goals, Copenhagen Centre64 DFID, Help Age International, et al, 2009. Advancing child-sensitive social protection, http://www.unicef.org/aids/files/CSSP_joint_statement_10.16.09.pdf [Last accessed 23.10.15]65 de Groot, R., Palermo, T., Handa, S., Ragno, L.P. and Peterman, A., 2015. Cash Transfers and Child Nutrition: What we know and what we need to know, Innocenti Working Paper No.2015-07, UNICEF Office of Research, Florence: 566 Smith, L., & Haddad, L., 2014. Reducing Child Undernutrition: Past drivers and priorities for the post-MDG era, IDS Working Paper Volume 2014 No 44, Transform Nutrition, Institute of Development Studies: 967 The World Bank, 2013. Improving Nutrition Through Multisector Approach: Social Protection briefing, The World Bank, Rapid Social Response, DFID, Government of Japan. This brief is part of the World Bank’s report on multisectoral approach for improving nutrition.
92
MA
LNU
TR
ITIO
N IN
ZA
MB
IA

END
NO
TES
93
68 Developed from Smith and Haddad, 2014, Reducing Child Undernutrition: Past drivers and priorities for the post-MDG era. IDS working paper. Volume 2014, Issue 441, pages 1–47, April 201469 The 1,000-day period between a woman conceiving and her child’s second birthday70 ILO, 2014. World Social Protection Report 2014/15: Building economic recovery, Inclusive Development and Social Justice, International Labour Organization71 Handa, S., Park, M. J., Darko, R. O., Osei-Akoto, I. Davis, B. and Diadone, S. 2013. Livelihood Empowerment against Poverty Impact Evaluation. Carolina Population Center, University of North Carolina: 1472 Yablonski, J., O’Donnell, M., 2009. Lasting Benefits: The role of cash transfers in tackling child mortality, London, Save the Children73 Tirivayi, N., Knowles, M., Davis, B., 2013. The interaction between social protection and agriculture: A review of evidence, Food and Agriculture Organisation74 ODI, 2013. Social protection and resilient food system, Overseas Development Agency, http://www.odi.org/sites/odi.org.uk/files/odi-assets/publications-opinion-files/8601.pdf [Last accessed 01.12.15]75 Case, A., 2001. Does Money Protect Health Status? Evidence from South African pensions, NBER – Working Paper No. 8495, Cambridge, MA, National Bureau of Economic Research76 Transform Nutrition, 2014. Nutrition-specific interventions, Transform Nutrition. http://www.transformnutrition.org/research/direct-interventions/ [Accessed online 4 December 2014]77 Save the Children International, 2015. Child-sensitive social protection position paper – draft. Save the Children International 78 Government of the Republic of Zambia, 2014, National Social Protection Policy, Ministry of Community Development Mother and Child Health79 Save the Children, 2016, Child Poverty: What drives it and what it means to children across the world, London, Save the Children
2 MALNUTRITION IN ZAMBIA80 Save the Children’s own calculations based on Zambia DHS 1992, 1996, 2002, 2007, 2013–1481 WHO, 2015. Severe malnutrition. World Health Organization. Available online: http://www.who.int/nutrition/topics/severe_malnutrition/en/ [Last accessed 2.12.15]82 Every Child Fed, 2015. Severe Acute Malnutrition in Zambia: 83,000 Zambian children are projected to die preventable deaths from severe acute malnutrition in 2015.83 Munthali, T, Jacobs, C, Sitali, L, Dambe, R, and Michelo, C, 2015. Mortality and morbidity patterns in under-five children with severe acute malnutrition (SAM) in Zambia: a five-year retrospective review of hospital-based records (2009–2013), Archives of Public Health 2015, 73:2384 Every Child Fed, 2015. Severe Acute Malnutrition in Zambia: 83,000 Zambian children are projected to die preventable deaths from severe acute malnutrition in 2015.85 Drimie, S, Chakrabarty, S, Dube, C, Smit-Mwanamwenge, M, Rawat, R and Harris, J., 2014. Intersectoral Coordination for Nutrition in Zambia, Turning Rapid Growth into Meaningful Growth: Sustaining the Commitment to Nutrition in Zambia, IDS Special Collection, September86 Government of the Republic of Zambia, 2015. National Social Protection Policy, Ministry of Community Development, Mother and Child Health, Government of the Republic of Zambia: 387 World Bank 2013. Zambia’s Jobs Challenge: Realities on the ground. Washington DC: The World Bank. 88 Bloomberg, 2015. Zambia Seen Moving to Prop Worst Currency Performer in 2015. Bloomberg Business. Available online: http://www.bloomberg.com/news/articles/2015-09-25/barclays-sees-zambia-acting-to-stem-world-s-worst-currency-fall [Last accessed 01.12.15]
89 Scott, G., 2014. Turning Rapid Growth into Meaningful Growth: Sustaining the Commitment to Nutrition in Zambia, IDS Special Collection, September90 UNDP, 2015. Income GINI Coeffiencts. Available online: http://hdr.undp.org/en/content/income-gini-coefficient [Last accessed 02.12.15]91 CSO, 2012. Living Condition and Monitoring Report 2006 and 2010, Lusaka: Government of Zambia: 14892 World Bank, 2015. Mapping Subnational Poverty in Zambia, Lusaka: World Bank: 193 See page 10 for more detail on the Groups and Inequalities Database (GRID). 94 International Food Policy Research Institute. 2014. Global Nutrition Report 2014: Actions and accountability to accelerate the world’s progress on nutrition. Washington, DC: 7, 995 The analysis is based on an assumption, in line with the level of stunting reduction modeled, that scaling up a core package of interventions will lead to a 20% decrease in the rate of stunting. International Food Policy Research Institute. 2014. Global Nutrition Report 2014: Actions and accountability to accelerate the world’s progress on nutrition. Washington, DC: 7, 996 The Economist (2014) Feast and famine, available: http://www.economist. com/news/international/21635046-world-has-terrible-record -improving-peoples-diets-may-be-changing-feast-and?frsc=dg%7Cc &fsrc=scn/tw_app_ipad [Last accessed 31.7.15]97 Headey, D, Hoddinott, J, Ali, D, Tesfaye, R and Dereje, M, 2014. The Other Asian Enigma: Explaining the Rapid Reduction of Undernutrition in Bangladesh, IFPRI Discussion Paper, Washington DC: International Food Policy Research Institute (IFPRI)98 Further note: Lusaka is the best province on stunting for four out of the five years in the survey. Luapula is worst in all but 2013. The boundaries of Northern region changed between 2007 and 2013, as some districts in that province became part of the new Muchinga province. With the new boundaries in 2013, this region had the worst stunting rate.99 Further notes: For a country in the bottom right, the ideal is to proceed leftward, along the arrow labelled 1 in the chart below. These countries already have low inequality (because things are bad for everyone). While we would always prefer the fastest progress to take place in groups that need it most, what these countries need most of all is fast progress on stunting in every group, so that the overall mortality rate comes down without introducing significant inequality.
The most desirable direction for a country in the top left though, which already has low overall stunting, is to proceed downwards and rectify the inequality (along the arrow labelled 2).
The arrow labelled 3 shows the direction of progress we do not want for less developed countries, but which we suspect might occur quite often; that is, stunting only improving for advantaged groups, and inequality increasing as the national stunting rate comes down. 100 Source: Save the Children’s own calculations, based on Zambia’s Demographic and Health Survey. Available online: http://www.dhsprogram.com/
3 UNDERSTANDING THE PATHWAYS APPROACH101 L. Smith and L. Haddad (2014), Reducing Child Undernutrition: Past drivers and priorities for the post-MDG era, IDS working paper: 10, based on Black et al, The Lancet, 2008; UNICEF, 2013, Improving Child Nutrition: 6102 Note: Stunting is a long-term indicator of malnutrition (chronic), while wasting (acute) is more of a short-term indicator.103 L. Smith and L. Haddad (2014), Reducing Child Undernutrition: Past drivers and priorities for the post-MDG era, IDS working paper: 10, based on Black et al (The Lancet), 2008; UNICEF, 2013. Improving Child Nutrition, United Nationals Children’s Fund: 6 http://www.unicef.org/publications/files/Nutrition_Report_final_lo_res_8_April.pdf [Accessed 12.11.15]

94
104 de Groot, R., Palermo, T., Handa, S., Ragno, L.P. and Peterman, A., 2015. Cash Transfers and Child Nutrition: What we know and what we need to know, Innocenti Working Paper No.2015-07, UNICEF Office of Research, Florence: 6105 Smith, L. C. and L. Haddad, 2002. How potent is economic growth in reducing undernutrition? What are the pathways of impact? New cross‐country evidence. Economic Development and Cultural Change, Vol. 51, No. 1: 55–76
4 EVIDENCE OF THE IMPACT OF SOCIAL PROTECTION ON NUTRITION OUTCOMES106 See page 88 for all literature review references. 107 Note: Seven of the 12 included programmes for sub-Saharan Africa do not have any anthropometric measurement of nutrition, even though they contained objectives to improve food security and/or nutrition.
5 NUTRITION PATHWAY 1: HOUSEHOLD FOOD SECURITY108 CSO, 2012. Living Condition and Monitoring Report 2006 and 2010, Lusaka: Government of Zambia:119-120; DHS, 2015. Zambia Demographic and Health Survey: 2013–14. Available online: http://www.dhsprogram.com/pubs/pdf/FR304/FR304.pdf 109 CSO, 2012. Living Condition and Monitoring Report 2006 and 2010, Lusaka: Government of Zambia: 119, 18110 CSO, 2012. Living Condition and Monitoring Report 2006 and 2010, Lusaka: Government of Zambia: 119–120; DHS, 2015. Zambia Demographic and Health Survey: 2013–14. Available online: http://www.dhsprogram.com/pubs/pdf/FR304/FR304.pdf 111 Bhalla, J, 2013. Maize dependency and agricultural subsidies in Zambia: In conversation with Rhoda Moyfa-Mukuka, available: http://www.africa researchinstitute.org/blog/agricultural-subsidies-in-zambia/?_sm_au_=iFVjSRSZTk8WqTq9 [Last accessed 29.7.15]112 CSO, 2012. Living Condition and Monitoring Report 2006 and 2010, Lusaka: Government of Zambia: 119113 Bhalla, J, 2013. Maize dependency and agricultural subsidies in Zambia: In conversation with Rhoda Moyfa-Mukuka, available: http://www.africa researchinstitute.org/blog/agricultural-subsidies-in-zambia/?_sm_au_=iFVjSRSZTk8WqTq9 [Last accessed 29.7.15]114 Note: 2010 food baskets valued at K96,366 respectively a for six-person household, GRZ, 2012. Living Conditions Monitoring Survey Report 2006 and 2010. Central Statistic Office, Government of the Republic of Zambia: 178 115 CSO, 2012. Living Condition and Monitoring Report 2006 and 2010, Lusaka: Government of Zambia: 212116 CSO, 2012. Living Condition and Monitoring Report 2006 and 2010, Lusaka: Government of Zambia; DHS, 2015. Zambia Demographic and Health Survey: 2013–14. Available online: http://www.dhsprogram.com/pubs/pdf/FR304/FR304.pdf117 CSO, 2012. Living Condition and Monitoring Report 2006 and 2010, Lusaka: Government of Zambia: 213118 This is according to WFP and UNICEF collation of WFP disaster response119 CSO, 2012. Living Condition and Monitoring Report 2006 and 2010, Lusaka: Government of Zambia: 213120 CSO, 2012. Living Condition and Monitoring Report 2006 and 2010, Lusaka: Government of Zambia: 164121 CSO, 2012. Living Condition and Monitoring Report 2006 and 2010, Lusaka: Government of Zambia: 119–120, 166122 CSO, 2012. Living Condition and Monitoring Report 2006 and 2010, Lusaka: Government of Zambia: 215123 Chibuye, M, 2014. The impact of rising food prices on child nutrition in Zambia, Turning Rapid Growth into Meaningful Growth: Sustaining the Commitment to Nutrition in Zambia, IDS Special Collection, September
124 FAO, 2009. Nutrition Country Profile: The Republic of Zambia, Rome: Nutrition and Consumer Protection Division, Food and Agriculture Organization125 CSO, 2009. Zambia Demographic and Health Survey, Lusaka: Central Statistical Office126 DHS, 2015. Zambia Demographic and Health Survey: 2013–14. Available online: http://www.dhsprogram.com/pubs/pdf/FR304/FR304.pdf127 Infant and Young Child Feeding, based on four or more food groups in the day or night preceding the survey. For more information see World Health Organization guidelines: http://www.who.int/mediacentre/factsheets/fs342/en/128 LCMS, 2010, Living Conditions and Monitoring Standards survey report, The Government of the Republic of Zambia. Available online; http://www.zamstats.gov.zm/report/Lcms/2006-2010%20LCMS%20Report%20Final%20Output.pdf 129 Chibuye, M, 2014. The impact of rising food prices on child nutrition in Zambia, Turning Rapid Growth into Meaningful Growth: Sustaining the Commitment to Nutrition in Zambia, IDS Special Collection, September130 Longley, C, Thilsted, S, Beveridge, M, Cole, S, Nyirenda, D, Heck, S and Hother, A., 2014. The role of fish in the first 1,000 days in Zambia, Turning Rapid Growth into Meaningful Growth: Sustaining the Commitment to Nutrition in Zambia, IDS Special Collection, September131 EA Frison, J Cherfas, T Hodgkin, 2011. ‘Agricultural biodiversity is essential for a sustainable improvement in food and nutrition security’, Sustainability, 3, 1: 238–53132 J Fanzo, D Hunter, T Borelli, F Mattei (2013) Diversifying Food and Diets: Using agricultural biodiversity to improve nutrition and health, Routledge/Biodiversity International: 43133 Harris, J and Drimie, S, 2012. Towards an Integrated Approach for Addressing Malnutrition in Zambia: A literature review and institutional analysis, Washington DC: International Food Policy Research Institute (IFPRI)134 Samson, M. et al., 2007. The Social and Economic Impact of Cash Transfers. Economic Policy Research Institute. 135 DFID 2011. DFID Cash Transfers Literature Review: 16.136 Samson, M. et al. (2007). The Social and Economic Impact of Cash Transfers. Economic Policy Research Institute.137 Slater, R. 2009 Cash transfers: graduation and growth, ODI Project Briefing 29.138 World Bank, 2006. Repositioning Nutrition as Central to Development. http://siteresources.worldbank.org/NUTRITION/Resources/281846-1131636806329/NutritionStrategy.pdf [Accessed 3 December 2014]139 Samson, M., Yang, M., & Murphy, A., 2014. Strengthening the economic imperative of social protection – preliminary draft working paper, Economic Policy Research Institute, Sept 2013.140 Save the Children’s own calculations, based on literature review. See page 88 for literature review references.
6 NUTRITION PATHWAY 2: CARING PRACTICES FOR WOMEN AND CHILDREN141 DHS, 2015. Zambia Demographic and Health Survey: 2013–14. Available online: http://www.dhsprogram.com/pubs/pdf/FR304/FR304.pdf142 Note: This means that of 618,000 babies born in Zambia in 2013/14, between 12,400 (2%) and 66,100 (11%) were born stunted. Source: UN Population Project, 2012. World Population Prospects: The 2012 Revision, available: http://esa.un.org/wpp/unpp/panel_indicators.htm; Save the Children’s own calculation 143 DHS, Zambia Demographic and Health Survey: 2013–14: 161 Available online: http://www.dhsprogram.com/pubs/pdf/FR304/FR304.pdf144 DHS, 2015. Zambia Demographic and Health Survey: 2013–14: 176. Available online: http://www.dhsprogram.com/pubs/pdf/FR304/FR304.pdf145 DHS, 2015. Zambia Demographic and Health Survey: 2013–14: 176. Available online: http://www.dhsprogram.com/pubs/pdf/FR304/FR304.pdf
MA
LNU
TR
ITIO
N IN
ZA
MB
IA
END
NO
TES
95
146 Drimie, S, Chakrabarty, S, Dube, C, Smit-Mwanamwenge, M, Rawat, R and Harris, J. 2014, Intersectoral coordination for nutrition in Zambia, Turning Rapid Growth into Meaningful Growth: Sustaining the Commitment to Nutrition in Zambia, IDS Special Collection, September147 DHS, 2015. Zambia Demographic and Health Survey: 2013–14: 178. Available online: http://www.dhsprogram.com/pubs/pdf/FR304/FR304.pdf148 NFNC (National Food and Nutrition Commission), 2013. Micronutrient and Food Consumption Survey, Lusaka: UNICEF149 DHS, 2015. Zambia Demographic and Health Survey: 2013–14: 56–60 Available online: http://www.dhsprogram.com/pubs/pdf/FR304/FR304.pdf150 DHS, 2015. Zambia Demographic and Health Survey: 2013–14: 55, 62 Available online: http://www.dhsprogram.com/pubs/pdf/FR304/FR304.pdf151 DHS, 2015. Zambia Demographic and Health Survey: 2013–14. Available online: http://www.dhsprogram.com/pubs/pdf/FR304/FR304.pdf152 DHS, 2015. Zambia Demographic and Health Survey: 2013–14: 159. Available online: http://www.dhsprogram.com/pubs/pdf/FR304/FR304.pdf153 DHS, 2015. Zambia Demographic and Health Survey: 2013–14: 159. Available online: http://www.dhsprogram.com/pubs/pdf/FR304/FR304.pdf154 Drimie, S., Chakrabarty, S., Dube, C., Smit-Mwanamwenge, M., Rawat, R and Harris, J., 2014. Intersectoral coordination for nutrition in Zambia, Turning Rapid Growth into Meaningful Growth: Sustaining the Commitment to Nutrition in Zambia, IDS Special Collection, September155 DHS, 2015. Zambia Demographic and Health Survey: 2013–14: 167. Available online: http://www.dhsprogram.com/pubs/pdf/FR304/FR304.pdf156 DHS, 2015. Zambia Demographic and Health Survey: 2013–14: 169. Available online: http://www.dhsprogram.com/pubs/pdf/FR304/FR304.pdf157 DHS, 2015. Zambia Demographic and Health Survey: 2013–14: 119. Available online: http://www.dhsprogram.com/pubs/pdf/FR304/FR304.pdf158 Imai, K, Annim, S, Kulkarni, and V, Gaiha, R (2014) Women’s Empowerment and Prevalence of Stunted and Underweight Children in Rural India, Economics Discussion Paper Series, EDP-1409, University of Manchester; Giroux, S (2008) Child Stunting Across Schooling and Fertility Transitions: Evidence from sub-Saharan Africa, DHS working papers, No. 57, August 2008159 Note: the effect in rural areas is not significant from zero. Source: Chibuye, M, 2014. The impact of rising food prices on child nutrition in Zambia, Turning Rapid Growth into Meaningful Growth: Sustaining the Commitment to Nutrition in Zambia, IDS Special Collection, September: 17160 Handa, S., Seidenfeld, D., Davis, B., Tembo G. and the Zambia Cash Transfer Evaluation Team, 2014. Are Cash Transfers a Silver Bullet? Evidence from the Zambian Child Grant, Innocenti Working Paper No.2014–08, UNICEF Office of Research, Florence161 DHS, 2015. Zambia Demographic and Health Survey: 2013–14. Available online: http://www.dhsprogram.com/pubs/pdf/FR304/FR304.pdf162 DHS, 2015. Nutrition. The DHS Programme, Demographic and Health Surveys. USAID. Available online: http://dhsprogram.com/topics/nutrition.cfm [Last accessed 22.10.15]163 UNDP, 2014. Human Development Report: Sustaining Human Progress: Reducing vulnerabilities and building resilience, New York, UNDP164 DHS, 2015. Zambia Demographic and Health Survey: 2013–14: 253. Available online: http://www.dhsprogram.com/pubs/pdf/FR304/FR304.pdf165 Only two programmes or fewer in our review provided evidence on 4 of 5 the IYCF measures included.
7 NUTRITION PATHWAY 3: HEALTH SERVICES AND ENVIRONMENT166 Humphrey, J, 2009. Child undernutrition, tropical enteropathy, toilets, and handwashing. The Lancet: 1032–35; World Health Organization (2014) Health Equity Monitor, available http://apps.who.int/gho/data/node.main.HE-1540?lang=en167 JMP, 2015. Zambia: estimates on the use of water sources and sanitation facilities (1980–2015). Available online http://www.wssinfo.org/documents/?tx_displaycontroller%5Btype%5D=country_files&tx_displaycontroller%5Bsearch_word%5D=Zambia [Last accessed 27.7.15]
168 JMP, 2015. Zambia: estimates on the use of water sources and sanitation facilities (1980–2015). Available online http://www.wssinfo.org/documents/?tx_displaycontroller%5Btype%5D=country_files&tx_displaycontroller%5Bsearch_word%5D=Zambia [Last accessed 27.7.15]169 CSO, 2012. Living Condition and Monitoring Report 2006 and 2010, Lusaka: Government of Zambia: 227, 236170 LCMS, 2010. Living Conditions Monitoring Survey, Zambia. Available online: www.zamstats.gov.zm171 DHS 2007, 2013–14, DHS, 2015. Zambia Demographic and Health Survey: 2013–14: 253. Available online: http://www.dhsprogram.com/pubs/pdf/FR304/FR304.pdf172 Save the Children’s own calculations, based on DHS 1992, 1997, 2001–02, 2007, 2013–14, DHS, 2015. Zambia Demographic and Health Survey: 2013–14: 253. Available online: http://www.dhsprogram.com/pubs/pdf/FR304/FR304.pdf173 Ismail, S, Shindano, J, Nyirenda, D, Bandyopadhyay, R and Akello, J, 2014. Does exposure to aflatoxin constrain efforts to reduce stunting in Zambia?, Turning Rapid Growth into Meaningful Growth: Sustaining the Commitment to Nutrition in Zambia, IDS Special Collection, September174 Ismail, S, Shindano, J, Nyirenda, D, Bandyopadhyay, R and Akello, J (2014) Does exposure to aflatoxin constrain efforts to reduce stunting in Zambia?, Turning Rapid Growth into Meaningful Growth: Sustaining the Commitment to Nutrition in Zambia, IDS Special Collection, September175 Ismail, S, Shindano, J, Nyirenda, D, Bandyopadhyay, R and Akello, J (2014) Does exposure to aflatoxin constrain efforts to reduce stunting in Zambia?, Turning Rapid Growth into Meaningful Growth: Sustaining the Commitment to Nutrition in Zambia, IDS Special Collection, September: 23176 Interestingly though, disease and injuries are not disproportionately suffered by the poor – all three poverty categories included in the LCMS had rates of illness and injury very similar to that of Zambia as a whole.177 Caulfield, L, de Onic, M, Blossner, M and Black, R, 2004. Undernutrition as an underlying cause of child deaths associated with diarrhoea pneumonia, malaria and measles, American Journal of Clinical Nutrition, July: 193–198178 Caulfield, L, de Onic, M, Blossner, M and Black, R, 2004. Undernutrition as an underlying cause of child deaths associated with diarrhoea pneumonia, malaria and measles, American Journal of Clinical Nutrition, July: 193–198179 CSO, 2012. Living Condition and Monitoring Report 2006 and 2010, Lusaka: Government of Zambia: 38180 CSO, 2012. Living Condition and Monitoring Report 2006 and 2010, Lusaka: Government of Zambia181 Avert, 2015, HIV and Nutrition. Available online: www.avert.org ; ECS (European Collaborative Study), 2003. Height, weight, and growth in children born to mothers with HIV-1 infection in Europe, Pediatrics 111(1). Available online: www.avert.org/hiv-and-nutrition.htm#footnote2_y8ipezh 182 Koethe, John R MD. et al (2010) Association between weight gain and clinical outcomes among malnourished adults initiating antiretroviral therapy in Lusaka, Zambia, JAIDS 53(4) 507–513183 UNAIDS (2015) Zambia country profile, Available http://www.unaids.org/en/regionscountries/countries/zambia [Accessed 30.7.15]184 Drimie, S, Chakrabarty, S, Dube, C, Smit-Mwanamwenge, M, Rawat, R and Harris, J (2014) Intersectoral coordination for nutrition in Zambia, Turning Rapid Growth into Meaningful Growth: Sustaining the Commitment to Nutrition in Zambia, IDS Special Collection, September185 ILO, 2014. World Social Protection Report 2014/15, International Labour Organization: 100 186 CSO, 2012. Living Condition and Monitoring Report 2006 and 2010, Lusaka: Government of Zambia: 242187 DHS, 2015. District Health Survey 2013–14. 188 DHS, 2015. Zambia Demographic and Health Survey: 2013–14: 140 Available online: http://www.dhsprogram.com/pubs/pdf/FR304/FR304.pdf

96
189 Handa, S., Seidenfeld, D., Davis, B., Tembo G., and the Zambia Cash Transfer Evaluation Team, 2014. Are Cash Transfers a Silver Bullet? Evidence from the Zambian Child Grant, Innocenti Working Paper No.2014-08, UNICEF Office of Research, Florence
8 SOCIAL PROTECTION AND NUTRITION POLICY DEVELOPMENT190 Note: Social welfare is commonly delivered by the state. Social protection is delivered by a combination of government, independent, voluntary, and autonomous public services – Spicker, P. 2014, Social Policy – Theory and Practice, Bristol Policy Press. 191 FAO, 2009, Zambia Nutrition Profile – Nutrition and Consumer Protection Division. Available online: ftp://ftp.fao.org/ag/agn/nutrition/ncp/zmb.pdf [last accessed 05.10.15]192 N. Mason & T. Tembo, 2015, Do Input Subsidy Programmes Raise Incomes and Reduce Poverty Among Smallholder Farm Households? Evidence from Zambia. Working Paper 92, Indaba Agricultural Policy Research Institute (IAPRI) Lusaka, Zambia: 45 Available online: http://www.iapri.org.zm/images/WorkingPapers/wp92.pdf [last accessed 01.10.15]193 N. Mason & T. Tembo, 2015, Do Input Subsidy Programmes Raise Incomes and Reduce Poverty Among Smallholder Farm Households? Evidence from Zambia. Working Paper 92, Indaba Agricultural Policy Research Institute (IAPRI) Lusaka, Zambia: 45 Available online: http://www.iapri.org.zm/images/WorkingPapers/wp92.pdf [last accessed 01.10.15]194 N. Mason & T. Tembo, 2015, Do Input Subsidy Programmes Raise Incomes and Reduce Poverty Among Smallholder Farm Households? Evidence from Zambia. Working Paper 92, Indaba Agricultural Policy Research Institute (IAPRI) Lusaka, Zambia: 45 Available online: http://www.iapri.org.zm/images/WorkingPapers/wp92.pdf [last accessed 01.10.15]195 MCDMCH, 2014. Presentation on Social Protection in Zambia, by Simmy Chapula – Acting Permanent Secretary, Ministry of Community Development Mother and Child Health. Available online: http://www.saspen.org/conferences/Lusaka_SP_Colloquium/2014_Aug_21_Launch/MCDMCH-PRESENTATION_Lusaka-Social-Protection-Colloquium_SASPEN-PSP-FES_Launch_21082014.pdf [Last accessed 23/09/15]196 World Bank, 2005. Presentation on Social protection Strategy for Zambia, Draft. Available online: http://info.worldbank.org/etools/docs/library/152923/zambiaspstrategy.pdf [Last accessed 01.12.15]197 MCDMCH, 2014. Presentation on Social Protection in Zambia, by Simmy Chapula – Acting Permanent Secretary, Ministry of Community Development Mother and Child Health. Available online: http://www.saspen.org/conferences/Lusaka_SP_Colloquium/2014_Aug_21_Launch/MCDMCH-PRESENTATION_Lusaka-Social-Protection-Colloquium_SASPEN-PSP-FES_Launch_21082014.pdf [Last accessed 23/09/15]198 IDS, 2005, Report of Study on Drivers of Change for a National Social Protection Scheme in Zambia, A study undertaken for DFID Zambia. Institute of Development Studies, UK: 28 Available online: http://www.ids.ac.uk/files/dmfile/DfIDZambianov2005.pdf [Last accessed 01.10.15]199 MOCDMCH. 2014. Social Cash Transfer Programme Fact Sheet, Ministry of Community Development, Mother and Children Health, The Government of the Republic of Zambia. 200 MCDMCH, 2014. Presentation on Social Protection in Zambia, by Simmy Chapula – Acting Permanent Secretary, Ministry of Community Development Mother and Child Health. Available online: http://www.saspen.org/conferences/Lusaka_SP_Colloquium/2014_Aug_21_Launch/MCDMCH-PRESENTATION_Lusaka-Social-Protection-Colloquium_SASPEN-PSP-FES_Launch_21082014.pdf [Last accessed 23/09/15]201 MCDMCH, 2014. Presentation on Social Protection in Zambia, by Simmy Chapula – Acting Permanent Secretary, Ministry of Community Development Mother and Child Health. Available online: http://www.saspen.org/conferences/Lusaka_SP_Colloquium/2014_Aug_21_Launch/MCDMCH-PRESENTATION_Lusaka-Social-Protection-Colloquium_SASPEN-PSP-FES_Launch_21082014.pdf [Last accessed 23/09/15]
202 Government of the Republic of Zambia, 2014. National Social Protection Policy. Ministry of Community Development Mother and Child Health. Government of the Republic of Zambia: 11, 24, 36203 Taylor L. 2012. A Second Chance: Focusing Zambia’s nutrition sector in the context of political change. Analysing Nutrition Governance: Zambia Country Report, Institute of Development Studies http://www.ids.ac.uk/idsproject/analysing-nutritiongovernance 204 Government of the Republic of Zambia, 1967, The National Food and Nutrition Commission Act, Chapter 308: 7. Available online: http://faolex.fao.org/docs/pdf/zam3090.pdf [Last accessed 21.09.15]205 Chilufya and Wakunuma, 2015. Nutrition post-2015: hope for Zambia’s nutrition development, in UNSCN News issue 41: 66. Available online: http://unscn.org/files/Publications/SCN_News/SCNNEWS41_web_low_res.pdf [Last accessed 24.09.15]206 Nutrition for Growth, 2013. Nutrition for Growth Executive Summary. London.207 Chilufya and Wakunuma, 2015. Nutrition post-2015: hope for Zambia’s nutrition development, in UNSCN News issue 41: 67. Available online: http://unscn.org/files/Publications/SCN_News/SCNNEWS41_web_low_res.pdf [Last accessed 24.0915]208 GrZ, 2012. The First 1000 Most Critical Days Programme. National Food and Nutrition Commission of Zambia, the Government of the Republic of Zambia209 Scaling Up Nutrition, webpage on Zambia, http://scalingupnutrition.org/sun-countries/zambia#tab-aligning-programs-around-a-common-results-framework 210 SUN, 2014. Scaling Up Nutrition In Zambia. Scaling Up Nutrition movement. Available online: http://scalingupnutrition.org/sun-countries/zambia [Last accessed 24.09.15]211 The Government of the Republic of Zambia, 2013: The First 1000 Most Critical Days Programme. The Government of the Republic of Zambia: xiii; 40212 HANCI, 2015, Hunger and Nutrition Commitment Index, Institute of Development Studies. Available online: http://www.hancindex.org/countries/zambia/ [Last accessed 30/09/15]213 Black, E. R., Allen, H. L., Bhutta, A. Z., Caulfield, E. L., De Onis, M., Ezzati, M., Mathers, C., & Rivera, J., 2008. Maternal and child undernutrition: global and regional exposures and health consequences. The Lancet, pp. 1–19.
9 BUILDING A SOCIAL PROTECTION SYSTEM214 UNICEF and the World Bank (2013), Common Ground: UNICEF and World Bank approaches to building social protection systems. Available online: http://www.unicef.org/socialpolicy/files/UNICEF-WB_systems_note_formatted(1).pdf 215 Carmona, M., 2009. report of the UN independent expert on human rights and extreme poverty. Human Rights council. Available at: http://www.un.org/esa/socdev/csocd/2011/Magdalena.pdf
10 DESIGN IMPLICATIONS OF NUTRITION-SENSITIVE SOCIAL PROTECTION216 UNICEF et al., 2009. Advancing child-sensitive social protection.217 Oxfam, 2010. Fighting Hunger in Brazil. Oxfam Case Study. 218 No results in stunting have been found though in specific for the Bolsa Familia Conditional Cash Transfer Programme (see for example: de Brauw, A., Gilligan, D., Hoddinott, J., Moreira, V., & Roy, S. (2012). The impact of Bolsa Familia on child, maternal, and household welfare. Working Paper. Washington DC: International Food Policy Research Institute. 83pp. Soares, F. V., & Silva, E. (2010). Conditional cash transfer programmes and gender vulnerabilities: case studies of Brazil, Chile and Colombia (No. 69). Working Paper, International Policy Centre for Inclusive Growth.)219 Monteiro, C. A., D’Aquino Benicio, M., H., Lisboa Conde, W., Konno, S., Lovadino, A. L., Barros, A. J. D. and Gomes Victora, C., 2009. Narrowing socioeconomic inequality in child stunting: the
MA
LNU
TR
ITIO
N IN
ZA
MB
IA

END
NO
TES
97
Brazilian experience, 1974–2007. Bulletin of the World Health Organization 88: 305–311220 CSO, 2012. Living Condition and Monitoring Report 2006 and 2010, Lusaka: Government of Zambia221 See for example: Caulfield, L, de Onic, M, Blossner, M and Black, R, 2004. Undernutrition as an underlying cause of child deaths associated with diarrhoea, pneumonia, malaria and measles, American Journal of Clinical Nutrition, July: 193–198. CSO, 2012. Living Condition and Monitoring Report 2006 and 2010, Lusaka: Government of Zambia: 38, Avert, 2015, HIV and Nutrition. Available online: www.avert.org ; ECS (European Collaborative Study), 2003. Height, weight, and growth in children born to mothers with HIV-1 infection in Europe, Pediatrics 111(1). Available online: www.avert.org/hiv-and-nutrition.htm#footnote2_y8ipezh 222 FAO, 2015. The State of Food and Agriculture: Social Protection and Agriculture: Breaking the cycle of rural poverty, p. 62.223 As, for example, the Pronaf – Programa Nacional de Fortalecimento da Agricultura Familiar has done. See FAO (2015). The State of Food and Agriculture: Social Protection and Agriculture: Breaking the cycle of rural poverty, p. 69.224 See, for example, the SEAF programme in Brazil. See FAO (2015). The State of Food and Agriculture: Social Protection and Agriculture: Breaking the cycle of rural poverty, p. 70.225 Seidenfeld, D., Handa, S., Tembo, G., Michelo, S., Harland Scott, C., and Prencipe, L. (2014). The impact of an unconditional cash transfer on food security and nutrition: The Zambia Child Grant Programme, p.44. In: Harris, J., Haddad, L. and Grütz, S. S. (2014) Turning Rapid Growth into Meaningful Growth: Sustaining the Commitment to Nutrition in Zambia, Brighton: IDS226 Slater, R, 2009. Cash transfers: graduation and growth. Project Briefing. Overseas Development Institute227 Michelo, S., 2015. Socia Cash Transfer Scale-up for Zambia. International Policy Center for Exclusive Growth, one-pager No. 287.228 GrZ, 2014. Social Cash Transfer Programme Fact Sheet, Ministry of Community Development, Mother and Child Health. The Government of the Republic of Zambia229 MOCDMCH. 2014. Social Cash Transfer Programme Fact Sheet, Ministry of Community Development, Mother and Children Health, The Government of the Republic of Zambia.230 American Institutes for Research. 2013. Zambia’s Child Grant Program: 24-month impact report: 37, 67. Seidenfeld, D., Handa, S., Tembo, G., Michelo, S., Harland Scott, C. and Prencipe, L. 2014. The impact of an unconditional cash transfer on food security and nutrition: The Zambia Child Grant Programme: 49. In: Harris, J., Haddad, L. and Grütz, S. S. 2014. Turning Rapid Growth into Meaningful Growth: Sustaining the Commitment to Nutrition in Zambia, Institute of Development Studies, Brighton231 Based on Save the Children’s own calculation from the results of the literature review. See page 88 for full literature review references. 232 CSO 2010. CSO, 2015. Mapping Subnational Poverty in Zambia. http://www-wds.worldbank.org/external/default/WDSContentServer/WDSP/IB/2015/08/10/090224b082df938b/1_0/Rendered/INDEX/Mapping0subnational0poverty0in0Zambia.txt (Last accessed 12.11.15)233 See, for example, coverage in Lusaka Times on increased prices: https://www.lusakatimes.com/2015/04/14/the-cost-of-the-basic-needs-basket-for-march-increased-jctr/; https://www.lusakatimes.com/2014/04/15/cost-living-shoots/. [Last accessed: 11.11.15]234 Devereux, S, 2009. Cash Transfers: To condition or not condition. Poverty Insights, Institute of Development Studies: 2235 Devereux, S, 2009. Cash Transfers: To condition or not condition. Poverty Insights, Institute of Development Studies: 2236 de Groot, R., Palermo, T., Handa, S., Ragno, L.P. and Peterman, A., 2015. Cash Transfers and Child Nutrition: What we know and what we need to know, Innocenti Working Paper No. 2015-07, UNICEF Office of Research, Florence: 17.
11 KEY ASPECTS OF GOVERNANCE FOR NUTRITION-SENSITIVE SOCIAL PROTECTION237 Gillespie, S., et al., 2013. identify four key issues that are important for creating an enabling environment: 1. Narrative, knowledge, and evidence; 2. Political economy and governance; 3. Capacity and resources; 4. Multi-sectoral governance. Gillespie, S., et al. 2013. ‘The politics of reducing malnutrition: building commitment and accelerating progress’, The Lancet, 382: 552–69.238 Gillespie, S. Haddad, L, Mannar, V, Menon, P. & Nisbett, N. 2013. Maternal and child nutrition 4: the politics of reducing malnutrition: building commitment and accelerating progress. The Lancet. 382: 552–69.239 Committee of Experts on Public Administration, Definition of basic concepts and terminologies in governance and public administration (E/C.16/2006/4) (New York, 2006)240 OECD, 2001. Citizens as Partners: Information, consultation and public participation in policy-making, Organisation for Economic Cooperation, Operation and Development 241 Haddad, L., Acosta, A. M. & Fanzo, J., 2012. Accelerating reductions in under nutrition: what can nutrition governance tell us? Institute of Development Studies: In Focus Policy Briefing: 22 242 Haddad, L., Acosta, A. M. & Fanzo, J., 2012. Accelerating reductions in under nutrition: what can nutrition governance tell us? Institute of Development Studies: In Focus Policy Briefing: 22. 243 Black, E. R., Allen, H., L., Bhutta, A. Z., Caulfield, E. L., De Onis, M., Ezzati, M., Mathers, C. & Rivera, J., 2008. Maternal and child undernutrition: global and regional exposures and health consequences. The Lancet: 1–19. 244 Acosta, A., 2011. Analysing success in the fight against malnutrition in Peru. Institute of Development Studies working paper: 29245 Pelletier, D. Menon, P. Ngo, T., Frongillo, E., Frongillo, D., 2011, The nutrition policy process: The role of strategic capacity in advancing national nutrition agendas, Food & Nutrition Bulletin, Volume 32, Supplement 2, June 2011, pp. 59S-69S(11)246 Harris et al. Turning Rapid Growth into Meaningful Growth: Sustaining the Commitment to Nutrition in Zambia: 1247 Harris et al. Turning Rapid Growth into Meaningful Growth: Sustaining the Commitment to Nutrition in Zambia: 1248 Zambian Economic, 2015. The scaling up of the social cash transfer programme, Statement by Minister of Community Development, Mother and Child Health Emerine Kabanshi MP. Published in the Zambian Economic. Available online: http://www.zambian-economist.com/2015/04/social-cash-transfer-progress-update.html [Last accessed 01.10.15]249 Government of the Republic of Zambia, 2015. National Social Protection Policy, Ministry of Community Development, Mother and Child Health, Government of the Republic of Zambia: 2250 Government of the Republic of Zambia, First 1000 Most Critical Days. Government of the Republic of Zambia251 Government of the Republic of Zambia, 2015. DRAFT First 1000 Most Critical Days Programme Monitoring and Evaluation Plan 2015–2018. The Government of the Republic of Zambia:13252 Haddad, L., Acosta, A. M., & Fanzo, J., 2012. Accelerating reductions in under nutrition: what can nutrition governance tell us? Institute of Development Studies: In Focus Policy Briefing 22. 253 ILO, 2014. World Social Protection Report 2014/15, International Labour Organization254 Hujo, K., & McClanahan, S. (eds). 2009. Financing social policy: Mobilizing resources for social development, Basingstoke, UN Research Institute for Social development and Palgrave Macmillan; Duran-Valverde, F., Pacheco, J. F. 2012. Fiscal space and the extension of social protection: Lessons learnt from developing countries. Extension of Social Security ESS Paper no. 33 (Geneva, ILO); Ortiz, I.; Cummins, M (eds) 2012. A recovery for all: Rethinking social-economic policies for children and poor households, New York, UNICEF, Division of Policy and Practice; and Cummins, 2012.

98
255 HANCI, 2015, Hunger and Nutrition Commitment Index, Institute of Development Studies. Available online: http://www.hancindex.org/countries/zambia/ [Last accessed 30/09/15]256 ZCEA, 2015. National Budget Analysis: A Child Rights Focus. Zambia Civic Education Association: 11257 Nutrition for Growth, 2013. Nutrition for Growth Executive Summary. London.258 Drimie, S, Chakrabarty, S, Dube, C, Smit-Mwanamwenge, M, Rawat, R and Harris, J., 2014. Intersectoral coordination for nutrition in Zambia, in Turning Rapid Growth into Meaningful Growth: Sustaining the Commitment to Nutrition in Zambia, IDS Special Collection, September: 7259 Lusaka Times, 2014. Civil Society bemoans continued low funding to nutrition programmes 16th October 2014. Lusaka Times. Available online: https://www.lusakatimes.com/2014/10/16/civil-society-bemoans-continued-low-funding-nutrition-programmes/ [Last accessed 02/10/15]260 Ministry of Health, Ministry of Agriculture and Livestock, Ministry of Community Development, Mother and Child Health, Ministry of Education, Ministry of Local Government and Housing. See National Food and Nutrition Commission of Zambia (2012). The first 1000 most critical days, p.39.261 Nutrition for Growth, 2013. Nutrition for Growth Executive Summary. London.262 Scaling Up Nutrition, 2014. Strategic Processes for Scaling Up Nutrition – Zambia. Scaling Up Nutrition. Available online: http://scalingupnutrition.org/sun-countries/zambia [Last accessed online 2.10.15]263 Zambian Economic, 2015. The scaling up of the social cash transfer programme, Statement by Minister of Community Development, Mother and Child Health Emerine Kabanshi MP. Published in the Zambian Economic. Available online: http://www.zambian-economist.com/2015/04/social-cash-transfer-progress-update.html [Last accessed 01.10.15]264 Save the Children, 2012. A Chance to Grow, Save the Children: 30265 ILO, 2012. The Strategy of the International Labour Organization. Social Security for all: Building social protection floors and comprehensive social security systems, Geneva266 HANCI, 2015, Hunger and Nutrition Commitment Index, Institute of Development Studies. Available online: http://www.hancindex.org/countries/zambia/ [Last accessed 30.09.15]267 GRZ, 2006, Vision 2030. http://unpan1.un.org/intradoc/groups/public/documents/cpsi/unpan040333.pdf: 32/33268 See section ‘Understanding the pathways approach’ on pages 17 to 19269 Save the Children, 2014. Suchana: Ending the Cycle of Malnutrition in Bangladesh, Proposal for DFID270 Chilufya, W., Smit-Mwanamwenge, M., Phiri, E., 2014. The Role of Civil Society in Spotlighting Nutrition, in IDS Special Collection September 2014. Institute of Development Studies, Sussex.: 66271 Gillespie, S. Menon, P. Kennedy, A., 2015. Scaling Up Impact on Nutrition: What Will It Take? Advances in Nutrition: An International Journal. 2015; 440–451 Available online: http://advances.nutrition.org/content/6/4/440.long [Last accessed 2.10.15]272 Zambian CSO-SUN Alliance, 2015. About us. Zambian CSO-SUN Alliance. Available online: http://www.csosun.org/index.php/about-us [Last accessed 02.10.15]273 PSP, 2015. Platform for Social Protection Zambia. Available online: http://www.pspzambia.org/#!about/c161y [Last accessed online 22.09.15]274 Government of the Republic of Zambia, 2015. National Social Protection Policy, Ministry of Community Development, Mother and Child Health, Government of the Republic of Zambia: 2275 SUN Business Network, 2014. Business Network, Scaling Up Nutrition, Accessed online at: http://scalingupnutrition.org/the-sun-network/business-network276 Zambian Economic, 2015. The scaling up of the social cash transfer programme, Statement by Minister of Community Development,
Mother and Child Health Emerine Kabanshi MP. Published in the Zambian Economic. Available online: http://www.zambian-economist.com/2015/04/social-cash-transfer-progress-update.html [Last accessed 01.10.15]277 Scaling Up Nutrition, 2014. Zambia. Scaling Up Nutrition Business Network. Available online: http://sunbusinessnetwork.org/countries/zambia/ [Last accessed 2.10.15]278 Zambia Daily Mail, 2015. Private sector role in nutrition. Zambia Daily Mail. Available online: https://www.daily-mail.co.zm/?p=43510 [Last accessed 2.10.15]279 Haddad, L., Acosta, A. M., & Fanzo, J., 2012. Accelerating reductions in under nutrition: what can nutrition governance tell us? Institute of Development Studies: In Focus Policy Briefing 22.280 Helvetas, 2012. Strengthening Local Governance in Bangladesh: Lessons of practical experience, Helvetas Swiss Intercooperation Bangladesh281 Haddad, L., Acosta, A. M., & Fanzo, J., 2012. Accelerating reductions in under nutrition: what can nutrition governance tell us? Institute of Development Studies: In Focus Policy Briefing 22.282 Government of the Republic of Zambia, 2014. 36-month report for the Child Grant, Social Cash Transfer Programme, Ministry of Community Development Mother and Child Health, Government of the Republic of Zambia. 283 HANCI, 2015, Hunger and Nutrition Commitment Index, Institute of Development Studies. Available online: http://www.hancindex.org/countries/zambia/ [Last accessed 30.09.15]284 Haddad, L. Acosta, A. M. & Fanzo, J. 2012. Accelerating reductions in under nutrition: what can nutrition governance tell us? Institute of Development Studies: In Focus Policy Briefing 22.285 Black, E. R., Allen, H, L., Bhutta, A. Z., Caulfield, E. L., De Onis, M., Ezzati, M., Mathers, C., & Rivera, J., 2008. Maternal and child undernutrition: global and regional exposures and health consequences. The Lancet: 1–19.286 International Food Policy Research Institute. 2014. Global Nutrition Report 2014: Actions and Accountability to Accelerate the World’s Progress on Nutrition. Washington, DC.: 52287 Government of the Republic of Zambia, 2015. National Social Protection Policy, Ministry of Community Development, Mother and Child Health, Government of the Republic of Zambia: 1288 Government of the Republic of Zambia, 2015. National Social Protection Policy, Ministry of Community Development, Mother and Child Health, Government of the Republic of Zambia: 8289 Government of the Republic of Zambia, 2005. Social Protection Strategy. Government of the Republic of Zambia: 17.290 MCDMCH, 2014. Presentation on Social Protection in Zambia, by Simmy Chapula – Acting Permanent Secretary, Ministry of Community Development Mother and Child Health. Available online: http://www.saspen.org/conferences/Lusaka_SP_Colloquium/2014_Aug_21_Launch/MCDMCH-PRESENTATION_Lusaka-Social-Protection-Colloquium_SASPEN-PSP-FES_Launch_21082014.pdf [Last accessed 23/09/15]291 Scaling Up Nutrition, webpage, http://scalingupnutrition.org/sun-countries/zambia/putting-policies-in-place 292 Scaling Up Nutrition, 2015, Zambia, SUN Countries. Available online: http://scalingupnutrition.org/sun-countries/zambia [Last accessed online 21.09.15]293 National Food and Nutrition Commission, Zambia, National Food and Nutrition Strategic Plan for Zambia 2011–2015, http://ucx3x320eshg jxppibt1rqg0.wpengine.netdna-cdn.com/wp-content/uploads/2013/02/Zambia_NFNC-Stratergic-Plan-2011-2015.pdf pp47294 Government of the Republic of Zambia, 2005. Social Protection Strategy. Government of the Republic of Zambia: 17295 UN, 2015. The Sustainable Development Goals. Sustainable Development Knowledge Platform. Available online: https://sustainable development.un.org/?menu=1300 [Last accessed 1.10.15]
MA
LNU
TR
ITIO
N IN
ZA
MB
IA

END
NO
TES
99
296 FAO, 2015. Social Protection, Food and Agriculture Organization of the United Nations. Available online: http://www.fao.org/economic/social-protection/en/ [Last accessed 2/10/15]297 UNDP, 2013. Millennium Development Goals Progress Report, Zambia 2013. United Nations Development Programme. Lusaka: Horizon Printing Press.298 Nutrition for Growth, 2013. Nutrition for Growth Commitments: Executive Summary, Available online: https://www.gov.uk/government/uploads/system/uploads/attachment_data/file/207274/nutrition-for-growth-commitments.pdf [Last accessed 29.09.15]299 Harris et al. Turning Rapid Growth into Meaningful Growth: Sustaining the Commitment to Nutrition in Zambia: 2
12 GLOBAL PRIORITIES RELATED TO NUTRITION-SENSITIVE SOCIAL PROTECTION300 Nutrition for Growth, 2013. Nutrition for Growth Commitments. Executive summary. Available online: https://www.gov.uk/government/uploads/system/uploads/attachment_data/file/207274/nutrition-for-growth-commitments.pdf L[ast accessed: 10.11.15]301 WHO, 2014. World Health Assembly Global Targets: http://www.who.int/nutrition/topics/nutrition_globaltargets2025/en/ [Accessed online 4 December 2014]302 ILO and World Bank (2016). A shared mission for social protection, concept note. http://www.ilo.org/global/topics/social-security/WCMS_378991/lang--en/index.htm [Last accessed 12.11.15]303 ILO, 2012. R202 – Social Protection Floors Recommendation (No.202), International Labour Organization. Available online: http://www.ilo.org/dyn/normlex/en/f?p=NORMLEXPUB:12100:0::NO:12100:P12100_INSTRUMENT_ID:3065524:NO [Last accessed 12.11.15] 304 UN, 2015. Resolution A/70/L.1 Transforming our world: the 2030 agenda for sustainable development, United Nations.305 UN System Standing Conference on Nutrition, Social protection for food ssecurity and nutrition, http://www.unscn.org/en/committee_world_food_security/committee_world_food_security_social_protection.php [Last accessed: 10.11.15]
13 CONCLUSIONS AND RECOMMENDATIONS FOR THE DEVELOPMENT OF NUTRITION-SENSITIVE SOCIAL PROTECTION IN ZAMBIA306 Save the Children’s own analysis based on results of the literature review. For full literature review references see page 88. 307 As our analysis showed, for example, the Ethiopia Productive Safety Net Programme (public works), Malawi Mchinji Social cash Transfer Scheme (unconditional cash transfer), Mexico’s Progreas/Oportunidades (conditional cash transfer). Save the Children own analysis based on results of the literature review. For full literature review references see page 88.308 See, for example, Ethiopia’s Productive Safety Net Programme: Devereux, S. and S. Coll-Black, 2007 Review of evidence and evidence gaps on the effectiveness and impacts of DFID-supported pilot social transfer schemes. DFID Evaluation Working Paper; Malawi’s Social Cash Transfer Programme: Vincent, K. and Cull, T., 2009. Impacts of social cash transfers: case study evidence from across Southern Africa. Instituto de Estudos Sociais e Económicos. 309 See, for example, Ethiopia’s Productive Safety Net Programme on a reduction of negative coping strategies: Devereux, S. and S. Coll-Black, 2007 Review of evidence and evidence gaps on the effectiveness and impacts of DFID-supported pilot social transfer schemes. DFID Evaluation Working Paper.310 See examples from Ethiopia – Devereux, 2007 and Slater, R. et al, 2006, PSNP policy, programme and institutional linkages. Final Report, ODI, the IDL group and Indak International.
and from Mexico – Gertler, P., Martinez, S. and Rubio-Codina, M., 2006, Investing cash transfers to raise long-term living standards, Report WPS 3994-IE, Washington DC, World Bank.
311 Tanner, J., Candland, T. L. and Odden, W. S. 2015. Impacts of interventions during early childhood on later outcomes: a systematic review. Washington, D.C.: World Bank Group.312 1000 Days Partnership, 2014, About 1000 days. http://www.thousanddays.org/about/ [Last accessed 16.11.15]313 See, for example, Smith, L., & Haddad, L. (2014). Reducing Child Undernutrition: Past drivers and priorities for the post-MDG era. 47 pp. Available as of August 2015 from http://opendocs.ids.ac.uk/opendocs/bitstream/handle/123456789/3816/Wp441R.pdf?sequence=4314 See for example outcomes of the Zambia Child Grants Programme Seidenfeld, D., Handa, S., Tembo, G., Michelo, S., Harland Scott, C. and Prencipe, L. (2014). The Impact of an Unconditional Cash Transfer on Food Security and Nutrition: The Zambia Child Grant Programme, In: Harris, J, Haddad, L. and Grütz, S. S. (2014) Turning Rapid Growth into Meaningful Growth: Sustaining the commitment to nutrition in Zambia, Brighton: IDS315 DFID, 2011. DFID Cash Transfers Literature Review. Policy Division, Department for International Department, UK: 28; Hörmansdörfer, C., 2009. Health and Social Protection. In: OECD, 2009. Promoting Pro-poor Growth, Social Protection: 145–153.
APPENDICES316 Note: Programmes were selected following consultation with technical advisers, including social protection advisers across the Save the Children movement, especially Zambia. All programmes included in the review have either a nutrition or food security objective.317 Design principles developed by Save the Children. Indicators for ‘impact of programme’ developed from Smith, L. and Haddad (2014), Reducing Child Undernutrition: Past drivers and priorities for the post-MDG era, IDS Working Paper Volume 2014 No 44, Transform Nutrition, Institute of Development Studies: 9318 WHA Global Targets 2025 to improve maternal, infant and young child nutrition. http://www.who.int/nutrition/topics/nutrition_globaltargets2025/en/ [Accessed online 4.122014]319 Indicators based on indicators of food security and their household level measures from: Smith, L. C., and Ali Subandoro. 2007. Measuring Food Security Using Household Expenditure Surveys. Food Security in Practice technical guide series. Washington, DC: International Food Policy Research Institute: 6. 320 World Bank Development Indication used by Smith and Haddad, 2014.321 WHO, 2008. Indicators for assessing infant and young child feeding practices, http://whqlibdoc.who.int/publications/2008/9789241596664_eng.pdf?ua=1 [Accessed online 4.12.2014]322 See page 88 for literature review references323 WFP and UNICEF (2010) Zambia Food And Nutrition Security Field Analysis, Lusaka: UNICEF: 7324 Drimie, S, Chakrabarty, S, Dube, C, Smit-Mwanamwenge, M, Rawat, R and Harris, J, 2014. Intersectoral coordination for nutrition in Zambia, Turning Rapid Growth into Meaningful Growth: Sustaining the Commitment to Nutrition in Zambia, IDS Special Collection, September: 6325 Drimie, S, Chakrabarty, S, Dube, C, Smit-Mwanamwenge, M, Rawat, R and Harris, J, 2014. Intersectoral coordination for nutrition in Zambia, Turning Rapid Growth into Meaningful Growth: Sustaining the Commitment to Nutrition in Zambia, IDS Special Collection, September: 7326 Drimie, S, Chakrabarty, S, Dube, C, Smit-Mwanamwenge, M, Rawat, R and Harris, J, 2014. Intersectoral coordination for nutrition in Zambia, Turning Rapid Growth into Meaningful Growth: Sustaining the Commitment to Nutrition in Zambia, IDS Special Collection, September: 7327 Drimie, S, Chakrabarty, S, Dube, C, Smit-Mwanamwenge, M, Rawat, R and Harris, J, 2014. Intersectoral coordination for nutrition in Zambia, Turning Rapid Growth into Meaningful Growth: Sustaining the Commitment to Nutrition in Zambia, IDS Special Collection, September: 7

savethechildren.org.uk
Tremendous progress has been made in the fight against poverty worldwide. The number of chronically malnourished – stunted – children has fallen by more than a third since 1990. The recently agreed Sustainable Development Goals (SDGs) present a unique opportunity to end hunger, achieve food security and improved nutrition, and promote sustainable agriculture. Progress towards the Millennium Development Goals revealed that too many children have been left behind, with children in the poorest 20% of households twice as likely to be stunted as those in the richest 20%.
One thing is clear – the SDGs must reach every child, including the poorest and most vulnerable. They must promote household spending to improve children’s nutrition and make links across sectors. And they must be a tool for distributing income to promote inclusive growth. In this respect, social protection systems represent a key policy solution that has great potential, but which is currently underutilised.
Zambia’s high malnutrition rates – among the highest in the world – are preventing millions of children reaching their potential and reducing the country’s chances of becoming a prosperous upper-middle-income country by 2030. The scale-up of Zambia’s Social Cash Transfer system presents a unique opportunity to use social protection as a platform to improve chronic malnutrition in the country.
Malnutrition in Zambia: Harnessing social protection for the most vulnerable explores the impact of social protection on nutrition. It makes recommendations for policy and programme development and implementation in Zambia and for global learning. The report guides the reader through a pathways approach to understand how developing social protection to address the underlying causes of malnutrition – with a greater focus on nutrition behaviour change; dietary diversity; infant and young child feeding; water, sanitation and hygiene; and the 1,000-day window of opportunity between a woman’s pregnancy and her child’s second birthday – will help shape healthier and more prosperous futures for all. In doing so, essential lessons are shared on the importance of an integrated approach to tackling malnutrition through social protection internationally, and on the importance of national systems and context-specific programmes.
CO
VER
PHO
TO
: CLEIS N
OR
DFJELL/SA
VE T
HE C
HILD
REN
malnutrition in zambiaHarnessing social protection for the most vulnerable