malaysia - listed companykpj.listedcompany.com/misc/analyst/kpj_maybank_20111130.pdf · malaysia 17...
TRANSCRIPT
SEE APPENDIX I FOR IMPORTANT DISCLOSURES AND ANALYST CERTIFICATIONS
Malaysia
17 October 2011
PP16832/01/2012 (029059)
Initiating Coverage 30 November 2011
PP16832/01/2012 (029059)
KPJ Healthcare Niche specialist with regional dreams
Initiate coverage with BUY and target price of RM5.10. KPJ is well-
positioned to benefit from the fast-growing healthcare sector in
Malaysia. This sector has been identified as one of the 12 key pillars in
the country‟s Economic Transformation Programme and is expected to
contribute USD10.4b to the Gross National Income by 2020. As a
defensive play, KPJ also offers limited revenue downside given its
domestic dominance and a wide array of positive demand factors.
Entrenched market leader. KPJ operates 20 private hospitals in
Malaysia, the largest network among local private hospital operators,
and has a 19% share of total private hospital beds. As the leader of the
domestic market, it stands to reap the greatest benefits from the rising
healthcare needs of the local population.
Limited revenue downside. The ever-growing demand for private
healthcare services in Malaysia limits the downside risk to revenue for
KPJ. This relatively inelastic demand is underpinned by structural
factors such as the increased number of elderly people, growing
population, higher per capita income and strain on public-sector
healthcare system.
New hospitals, new foreign patients. KPJ plans to add 1-2 hospitals
each year in its efforts to expand its hospital network. By end-2013,
KPJ could have added up to five new hospitals, and expanded its bed
capacity by up to 35%. We also expect the company to compete more
aggressively for foreign patients in the medical tourism sector. Its
education business could also serve as another thrust for growth.
Cheapest valuation, highest dividend yield. KPJ is the cheapest
hospital stock vis-à-vis its regional peers, trading at FY12F PER of
18.1x vs the peer average of 22.3x. Nevertheless, it offers the highest
yield at 2.4% net. We expect revenue growth of 13-18% over FY11-13
as its hospital network expands and it becomes a bigger player in
medical tourism. Corresponding net profit would grow by 8-19% over
the same period. Initiate coverage with BUY and TP of RM5.10, based
on 22x PER on FY12F fully diluted EPS, pegged to peer average.
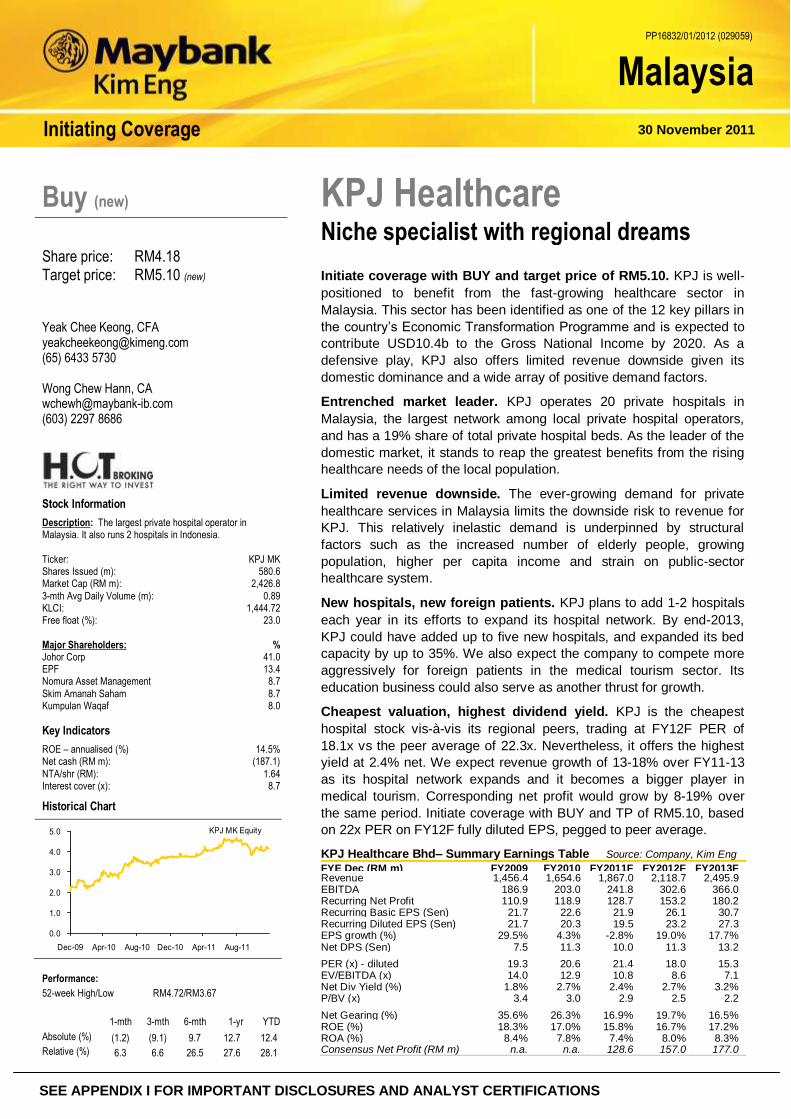
KPJ Healthcare Bhd– Summary Earnings Table Source: Company, Kim Eng
FYE Dec (RM m) FY2009 FY2010 FY2011F FY2012F FY2013F Revenue 1,456.4 1,654.6 1,867.0 2,118.7 2,495.9 EBITDA 186.9 203.0 241.8 302.6 366.0 Recurring Net Profit 110.9 118.9 128.7 153.2 180.2 Recurring Basic EPS (Sen) 21.7 22.6 21.9 26.1 30.7 Recurring Diluted EPS (Sen) 21.7 20.3 19.5 23.2 27.3 EPS growth (%) 29.5% 4.3% -2.8% 19.0% 17.7% Net DPS (Sen) 7.5 11.3 10.0 11.3 13.2 PER (x) - diluted 19.3 20.6 21.4 18.0 15.3 EV/EBITDA (x) 14.0 12.9 10.8 8.6 7.1 Net Div Yield (%) 1.8% 2.7% 2.4% 2.7% 3.2% P/BV (x) 3.4 3.0 2.9 2.5 2.2 Net Gearing (%) 35.6% 26.3% 16.9% 19.7% 16.5% ROE (%) 18.3% 17.0% 15.8% 16.7% 17.2% ROA (%) 8.4% 7.8% 7.4% 8.0% 8.3% Consensus Net Profit (RM m) n.a. n.a. 128.6 157.0 177.0
Buy (new)
Share price: RM4.18 Target price: RM5.10 (new)
Yeak Chee Keong, CFA [email protected] (65) 6433 5730 Wong Chew Hann, CA [email protected] (603) 2297 8686
Stock Information
Description: The largest private hospital operator in Malaysia. It also runs 2 hospitals in Indonesia.
Ticker: KPJ MK Shares Issued (m): 580.6 Market Cap (RM m): 2,426.8
3-mth Avg Daily Volume (m): 0.89 KLCI: 1,444.72 Free float (%): 23.0
Major Shareholders: % Johor Corp 41.0 EPF 13.4 Nomura Asset Management 8.7
Skim Amanah Saham 8.7 Kumpulan Waqaf 8.0
Key Indicators
ROE – annualised (%) 14.5% Net cash (RM m): (187.1)
NTA/shr (RM): 1.64 Interest cover (x): 8.7
Historical Chart
0.0
1.0
2.0
3.0
4.0
5.0
Dec-09 Apr-10 Aug-10 Dec-10 Apr-11 Aug-11
KPJ MK Equity
Performance:
52-week High/Low RM4.72/RM3.67
1-mth 3-mth 6-mth 1-yr YTD
Absolute (%) (1.2) (9.1) 9.7 12.7 12.4
Relative (%) 6.3 6.6 26.5 27.6 28.1

30 November 2011 Page 2 of 22
KPJ Healthcare 17 October 2011
Page 1 of 2
Investment merits
Premium valuation set to lift. Healthcare operators in Asia command
a premium valuation as the region‟s growing population and increasing
affluence fuel the need for healthcare services. There also exists a
scarcity premium by virtue of the limited number of such listed stocks.
Khazanah Nasional, Malaysia‟s sovereign wealth fund which privatised
Singapore‟s Parkway Holdings, is planning to relist its healthcare unit,
Integrated Healthcare, in the next 1-3 years. If this eventuates, it could
stir up further interest and the valuations of healthcare operator stocks
would be primed for a lift.
Stable base for scaling up foreign patient market. KPJ‟s niche has
been in the domestic private sector, owning the largest network of
community hospitals. It has thus been shielded from the more volatile
medical tourism market. With this stable and established base in the
domestic market, we believe the time is ripe for the company to move to
a higher plane and play a bigger, if not more aggressive role in medical
tourism.
Asset-light structure a boon to ROE. KPJ‟s modus operandi involves
selling its hospital assets to Al-„Aqar REIT and leasing back the
buildings for its operations. This allows the company to maintain an
asset-light structure, which, in turn, enhances its ROE. The proceeds
from the disposals also provide a stream of cash to enable continued
investment and expansion of its hospital network without straining its
balance sheet.
Good risk-reward proposition; initiate with BUY and target price of
RM5.10. The defensive nature of hospital stocks makes them attractive
investments in the current volatile equity market. In our view, KPJ offers
an appealing risk-return proposition premised on its stable earnings
from a strong domestic market focus and growth opportunities in the
medical tourism arena. The stock currently trades at the lowest FY12F
PER of 18.1x among regional peers and yet offers the highest gross
dividend yield of 3.2% (2.4% net). We initiate coverage with a BUY
recommendation and target price of RM5.10.

30 November 2011 Page 3 of 22
KPJ Healthcare 17 October 2011
Page 1 of 2
Cheapest hospital stock by far
Premium valuation for Asian healthcare stocks. In Asia, long-term
positive structural factors pointing to an increasing demand for quality
healthcare have enabled the region‟s healthcare stocks to enjoy
premium valuations. Stocks of hospital operators offer one of the purest
plays on such a theme. Recent M&A activities saw hospital stocks
(Parkway Holdings and Thomson Medical) being acquired at 23-32x
PERs, reaffirming their premium valuation. At the same time, such
stocks should also command a scarcity premium. Parkway Pantai,
formed by a merger of Singapore‟s Parkway Holdings and Malaysia‟s
Pantai Group, is seeking a possible relisting under its parent, Integrated
Healthcare, and this could spark more interest in the sector, thereby
lifting valuation.
Moving to a higher plane. A study of the valuations of regional
hospital stocks over the past five years shows that KPJ has been
trading at much lower PERs compared with its peers. Although the
valuation gap is closing over the past two years, its PER is still trailing
behind its peers. We guess the reason for the discount is its domestic
market focus, while other hospital stocks offer the potential to benefit
from medical tourism. But KPJ now has a strong domestic base, which
it can leverage to grow its foreign patient volume more aggressively.
We believe this will push the company to compete on a higher plane. In
our opinion, KPJ offers one of the most attractive risk-reward
propositions.
Figure 1: Regional hospital stocks – historical PER at a glance
Source: Bloomberg

30 November 2011 Page 4 of 22
KPJ Healthcare 17 October 2011
Page 1 of 2
Healthcare in Malaysia
A two-tier system. Malaysia operates a two-tier health system, split
between the public and private sectors. Public healthcare is provided
and managed by the Ministry of Health (MOH) and funded by the tax
system. It is also heavily subsidised by the government and is used by
the majority of its 28m population. The private system, on the other
hand, is user-charged and demand is mainly driven by the more affluent
who seek shorter waiting time as well as a higher quality of care and
service. The private sector is beginning to play a more important role in
alleviating the strain on the public system.
Private versus public sector. In terms of the number of hospital beds,
the private sector accounted for about 26% of the 50,087 licensed
hospital beds in Malaysia last year. Admissions-wise, the private
hospitals recorded about 29% of total hospital admissions. However, a
disproportionate split became apparent in the distribution of resources,
as evidenced by human resource allocation and hospital expenditure.
About 45% of doctors were employed in the private sector in 2008
despite the sector having only 22% of total hospital beds. Expenditure
in the private sector also exceeded that in the public sector by about
10%.
Figure 2: Distribution of resources, 2008 Figure 3: Distribution of beds
Source: Ministry of Health, Malaysia Source: Ministry of Health, Malaysia
Large burden on government. Government expenditure on healthcare
in Malaysia comprised 44% of the total national health expenditure in
2008. The figure seemed reasonable vis-à-vis other countries.
However, if the social security portion of the expenditure were
excluded, the healthcare burden on the Malaysian government would
appear to be rather high at 43%, compared to less than 20% for upper-
middle income and above nations. In fact, in the latter, a large part of
the government spending on healthcare is funded by social security
schemes, which Malaysia currently lacks. Hence, the large burden on
government spending. We understand that the government is seeking
to address this asymmetry by encouraging growth in the private sector.
Room for more healthcare spending. According to data from the
Ministry of Health, total national health expenditure in 2008 formed
about 4.8% of total GDP (WHO measured it at 4.3%). Though this
figure might be higher than some of its neighbouring countries, it was
significantly below that of the more developed nations. The US, for
example, spends about 15% of its GDP on healthcare while the global
average is about 8% in 2008. This suggests that Malaysia has room to
raise its healthcare expenditure.

30 November 2011 Page 5 of 22
KPJ Healthcare 17 October 2011
Page 1 of 2
Figure 4: Worldwide healthcare expenditure as a % of GDP, 2008
Source: World Health Organisation
Table 1: Health expenditure data Health expenditure ratios Per capita health expenditures
General government expenditure on
health as % of total expenditure on
health
Social security expenditure on health as % of
general government expenditure on
health
General government expenditure on health (excl. social security)
as % of total expenditure on health
Private expenditure on health as % of
total expenditure on
health
General government expenditure
on health as % of total
government expenditure
Per capita total expenditure on
health (PPP int. $)
Per capita government
expenditure on health
(PPP int. $)
Member states 2000 2008 2000 2008 2000 2008 2000 2008 2000 2008 2000 2008 2000 2008
Malaysia 52.4 44.1 0.6 0.8 51.8 43.3 47.6 55.9 6.2 6.9 67 156 159 274
Singapore 44.9 34.1 4.8 13.2 40.1 20.9 55.1 65.9 6.2 7.8 291 479 421 625
India 27.5 32.4 16.9 17.2 10.6 15.2 72.5 67.6 3.9 4.4 69 122 19 40
Indonesia 36.6 54.4 6.2 12.3 30.4 42.1 63.4 45.6 4.5 6.2 47 91 17 49
Thailand 56.1 74.3 9.4 9.0 46.7 65.3 43.9 25.7 9.9 14.2 165 328 92 244
US 43.2 47.8 33.5 27.8 9.7 20.0 56.8 52.2 17.1 18.7 4 703 7 164 2 032 3 426
Range of values
Minimum 3.0 6.5 0 0 3.0 6.5 0.4 0.3 1.2 0.7 9 18 <1 2
Median 57.6 60.9 1.6 3.1 56.0 57.8 42.5 39.2 9.8 11.5 274 442 141 259
Maximum 99.6 99.7 100 98.5 -0.4 1.2 97.0 93.5 21.7 26.1 4 703 7 164 2 785 5 028
Income group
Low income 37.1 40.5 4.6 11.5 32.5 29.0 62.9 59.5 7.7 8.9 37 74 14 30
Lower middle income 37.1 45.4 36.0 44.4 1.1 1.0 62.9 54.6 7.1 7.8 95 197 35 88
Upper middle income 54.0 57.2 41.3 41.5 12.7 15.7 47.1 42.9 9.0 9.9 438 830 236 479
High income 59.3 62.2 46.3 42.3 13.0 19.9 40.4 36.4 15.3 16.7 2 740 4 246 1 626 2 589
Global 56.4 60.5 44.9 42.2 11.5 18.3 43.5 38.4 13.3 13.9 566 899 320 524
Source: World Health Organisation (PPP int. $) = Purchasing Power Parity International $

30 November 2011 Page 6 of 22
KPJ Healthcare 17 October 2011
Page 1 of 2
Bigger role for private sector
Public system experiencing strain. While Malaysia‟s public
healthcare system has progressed over the years, the rising demand
for healthcare services has put a strain on it. Long waiting times and
high bed occupancy rates are some of the problems plaguing the
system. As a result, middle-income earners who have the means are
increasingly turning to private healthcare. This presents opportunities
for private healthcare operators to step up its role in alleviating the
stress on the public healthcare system.
Regular checks on service and cost. To ensure quality service and
rein in medical costs, the government regularly monitors the private
sector. The regulatory environment is strengthened by the passage of
the Private Healthcare Facilities and Services Act 1998. A key
regulation is the zoning regulation limit, which requires a general 20km
distance between private hospitals unless one is a centre of excellence.
A centre of excellence focuses on a specialised field of medicine. The
Act helps to curb competition while promoting a more even distribution
of private hospitals in the country. The Act also involves a doctors‟ fee
schedule, which caps the maximum amount of fees that doctors can
charge, thereby controlling medical costs.
Government lending support
Figure 5: GNI contribution from Heathcare National Key Economic Area
Source: PEMANDU, a unit of Malaysia’s Prime Minister’s Department
Ultimate vision for healthcare sector. The Malaysian government
launched the Economic Transformation Programme (ETP) on 25
October 2010 in a bid to transform the country into a high-income
economy by 2020. Healthcare is one of the 12 National Key Economic
Areas (NKEAs) identified as a driver of economic activity. The ETP
would identify private sector opportunities to reframe health as an
economic commodity as well as a social right. The ultimate vision is to
have the healthcare sector contribute an incremental GNI impact of
RM35.3b in 2020 with an additional 181,000 jobs by the same year.
One of the strategic opportunities identified in the Healthcare NKEA is
health travel or medical tourism.

30 November 2011 Page 7 of 22
KPJ Healthcare 17 October 2011
Page 1 of 2
Next goal: international medical tourism
An emerging player in medical tourism. Travelling abroad for
medical treatment is a rapidly growing phenomenon in recent years.
The high cost of medical procedures in many developed countries,
coupled with rising medical standards in Asia, has attracted patients to
come to the region. This trend is also emerging as a lucrative business
proposition as affluence and mobility increases in Asia. In Malaysia,
medical tourism grew at a steady rate of 38% pa from 2003 to 2008 but
suffered a contraction in 2009. Last year, the market was estimated at
RM350m, still relatively small compared with that in countries like
Singapore, Thailand and India who were the forerunners. However,
Malaysia has its plans to gain a slice of the pie.
Attracting 1.9m health tourists by 2020. The Malaysian government
has set up the Malaysia Healthcare Travel Council (MHTC) in
December 2009 to spearhead efforts to market the country as a
preferred healthcare destination. The target is to attract 1.9m health
tourists by 2020, from about 400,000 last year, with planned investment
of RM335m in infrastructure and human capital.
Table 2: Cost comparison of selected medical procedures
Procedure (US$) US India Thailand Singapore Malaysia
Heart bypass 130,000+ 10,000 11,000 18,500 9,000 Heart valve
replacement 160,000 9,000 10,000 12,500 9,000
Angioplasty 57,000 11,000 13,000 13,000 11,000 Hip replacement 43,000 9,000 12,000 12,000 10,000
Hysterectomy 20,000 3,000 4,500 6,000 3,000 Knee replacement 40,000 8,500 10,000 13,000 8,000 Spinal fusion 62,000 5,500 7,000 9,000 6,000
Source: Patients beyond borders © 2008 by Josef Woodman
Accreditation required to be competitive. The Joint Commission
International (JCI) accreditation is arguably the gold standard for
international credentialling. Although individual countries have their own
accreditation systems, such as the Malaysian Society for Quality in
Health (MSQH) in Malaysia, possessing a JCI accreditation will find
favour with more international tourists. We understand that two of KPJ‟s
hospitals are in the process of seeking the JCI accreditation. However,
most of its hospitals already have the MSQH accreditation.
Hospitals appointed for health tourism. The MHTC has appointed
several hospitals (Table 3) to participate in attracting foreign patients to
the country. 11 of KPJ‟s current portfolio of 20 hospitals are in the
MHTC list. Hospitals owned by Parkway Pantai, Columbia, Prince Court
and Sime Darby all have the JCI accreditation.

30 November 2011 Page 8 of 22
KPJ Healthcare 17 October 2011
Page 1 of 2
Table 3: Cost comparison of selected medica procedures
Private hospital No. of
beds
Quality certification*
1 Assunta Hospital, Selangor 344 ISO, MSQH
2 Columbia Asia Hospital, Bukit Rimau, Selangor 84
3 Gleneagles Hospital Kuala Lumpur, Wilayah Persekutuan - Kuala Lumpur 330 JCI, ISO, MSQH
4 Gleneagles Medical Centre, Pulau Pinang 227 MSQH
5 Hospital Fatimah, Perak 223 ISO, MSQH
6 HSC Medical Center, Wilayah Persekutuan - Kuala Lumpur 7
7 Island Hospital, Pulau Pinang 7
8 KPJ Ampang Puteri Specialist Hospital, Selangor 230 ISO
9 KPJ Damansara Specialist Hospital, Selangor 250 MSQH
10 KPJ Ipoh Specialist Hospital, Perak 260 ISO, MSQH
11 KPJ Johor Specialist Hospital, Johor 206 ISO, MSQH
12 KPJ Kajang Specialist Hospital, Selangor 118
13 KPJ Penang Specialist Hospital, Pulau Pinang 236
14 KPJ Selangor Specialist Hospital, Selangor 173 MSQH
15 Lam Wah Ee Hospital, Pulau Pinang 422 ISO, MSQH
16 LohGuanLye Specialists Centre, Pulau Pinang 265 ISO, MSQH
17 Mahkota Medical Centre, Melaka 365 ISO, MSQH
18 Mawar Renal Medical Centre, Negeri Sembilan 78
19 Mount Miriam Cancer Hospital, Pulau Pinang 40 ISO
20 National Heart Institute (IJN), Wilayah Persekutuan - Kuala Lumpur 270 JCI, ISO, MSQH
21 NCI Cancer Hospital, Negeri Sembilan 0 ISO
22 Normah Medical Specialist Centre, Sarawak 130 MSQH
23 Pantai Hospital Ayer Keroh, Melaka 250
24 Pantai Hospital Ipoh, Perak 121
25 Pantai Hospital Kuala Lumpur, Wilayah Persekutuan - Kuala Lumpur 332 JCI
26 Pantai Hospital Penang, Pulau Pinang 180 ISO, MSQH
27 Penang Adventist Hospital, Pulau Pinang 216 JCI, MSQH
28 Prince Court Medical Centre, Wilayah Persekutuan - Kuala Lumpur 300 JCI, MSQH
29 Puteri Specialist Hospital, Johor 102
30 Putra Specialist Hospital, Melaka 225 ISO
31 Sabah Medical Centre, Sabah 95
32 Sentosa Medical Centre, Wilayah Persekutuan - Kuala Lumpur 135 ISO
33 Sime Darby Medical Centre Subang Jaya, Selangor 393 JCI, ISO, MSQH
34 Sunway Medical Centre, Selangor 240 ISO, MSQH
35 Taman Desa Medical Centre, Wilayah Persekutuan - Kuala Lumpur 128
36 Tawakal Hospital, Wilayah Persekutuan - Kuala Lumpur 158 ISO, MSQH
37 Timberland Medical Centre, Sarawak 72
38 Tropicana Medical Centre, Selangor 70 ISO
39 Tun Hussein Onn National Eye Hospital (THONEH), Selangor 46
40 Tung Shin Hospital, Wilayah Persekutuan - Kuala Lumpur 247 ISO
41 UM Specialist Centre, Wilayah Persekutuan - Kuala Lumpur 60
Private healthcare facilities in Malaysia are required to be licensed under the Private Healthcare Facilities and Services Act 1998. Joint Commission International (JCI) and Malaysian Society for Quality in Health (MSQH) are two accreditations that many of the private hospitals
have. Both are recognised members of the International Accreditation Federation Council (IAFC), a body under the umbrella of the International Society for Quality Healthcare (ISQuA). These accreditations ensure a minimum level of quality. Source: Association of Private Hospitals

30 November 2011 Page 9 of 22
KPJ Healthcare 17 October 2011
Page 1 of 2
Positive structural factors
Population growth and demographic shift. Malaysia‟s total
population stood at about 28.3m in 2010, having grown at an annual
rate of 2.0% in the past decade. Longer life spans also resulted in a
larger number of people aged 65 and above. As at last year, they
accounted for about 4.7% of the total population and are still growing.
This demographic shift will underpin the factors fuelling the ever-
increasing need for healthcare services.
Rising national income. In the meantime, Malaysians are getting
wealthier as income levels rise in tandem with the country‟s progress.
Better education, longer life span and a desire for a better lifestyle also
make them more willing to spend on healthcare. As evidence, per
capita expenditure on health has increased along with higher income
levels over the years.
Admission rates on the rise. Rising admission figures from data
released by the MOH support our notion. Inpatients and outpatients are
growing in both the public and private sectors. However, the statistics
also show that admission figures in the private sector are growing at a
much higher rate than in the public sector.
Figure 6: Population growth Figure 17: Ageing population
Source: Department of Statistics, Malaysia Source: Ministry of Health, Malaysia
Figure 8: Rising GNI per capita Figure 9: Rising per capita expenditure on health
Source: World Health Organisation Source: World Health Organisation
30 November 2011 Page 10 of 22
KPJ Healthcare 17 October 2011
Page 1 of 2
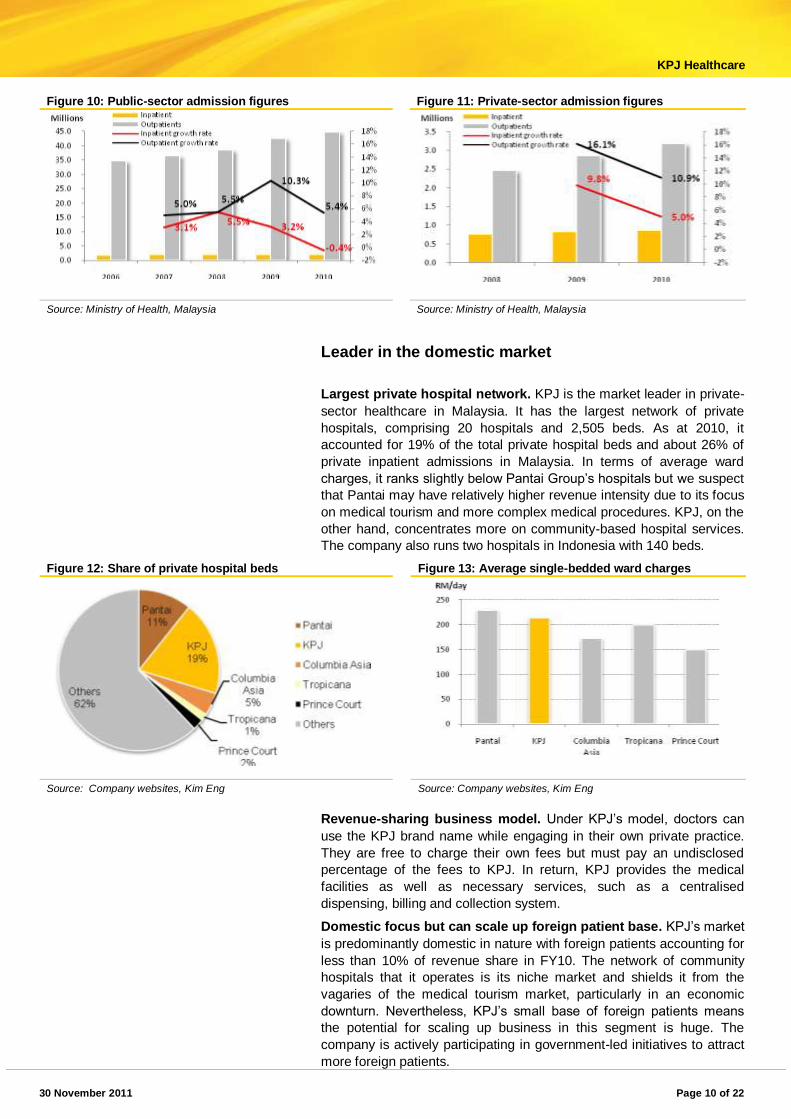
Figure 10: Public-sector admission figures Figure 11: Private-sector admission figures
Source: Ministry of Health, Malaysia Source: Ministry of Health, Malaysia
Leader in the domestic market
Largest private hospital network. KPJ is the market leader in private-
sector healthcare in Malaysia. It has the largest network of private
hospitals, comprising 20 hospitals and 2,505 beds. As at 2010, it
accounted for 19% of the total private hospital beds and about 26% of
private inpatient admissions in Malaysia. In terms of average ward
charges, it ranks slightly below Pantai Group‟s hospitals but we suspect
that Pantai may have relatively higher revenue intensity due to its focus
on medical tourism and more complex medical procedures. KPJ, on the
other hand, concentrates more on community-based hospital services.
The company also runs two hospitals in Indonesia with 140 beds.
Figure 12: Share of private hospital beds Figure 13: Average single-bedded ward charges
Source: Company websites, Kim Eng Source: Company websites, Kim Eng
Revenue-sharing business model. Under KPJ‟s model, doctors can
use the KPJ brand name while engaging in their own private practice.
They are free to charge their own fees but must pay an undisclosed
percentage of the fees to KPJ. In return, KPJ provides the medical
facilities as well as necessary services, such as a centralised
dispensing, billing and collection system.
Domestic focus but can scale up foreign patient base. KPJ‟s market
is predominantly domestic in nature with foreign patients accounting for
less than 10% of revenue share in FY10. The network of community
hospitals that it operates is its niche market and shields it from the
vagaries of the medical tourism market, particularly in an economic
downturn. Nevertheless, KPJ‟s small base of foreign patients means
the potential for scaling up business in this segment is huge. The
company is actively participating in government-led initiatives to attract
more foreign patients.
30 November 2011 Page 11 of 22
KPJ Healthcare 17 October 2011
Page 1 of 2
Hospital expansion on the cards. KPJ is operating at high occupancy
rate of about 70-75% and will need to expand its capacity to cope with
the increasing demand in the sector. It intends to add 1-2 hospitals
each year to its network. Since 2005 when it had only 15 hospitals, it
has established another five by last year to take the number of hospitals
to 20. In the pipeline, there are already plans for seven more new
hospitals, one replacement hospital and an expansion plan for the
existing Penang Specialist hospital. By end-2013, we could see its
hospital bed capacity expand by up to 35%. We believe its revenue
intensity would also rise in tandem with the opening of more sub-
specialist hospitals/centres of excellence. Going by its past cash flow
trends, it may not be necessary for KPJ to raise much money to fund
these expansion plans. For one, its operating cash flow is robust.
Secondly, there would be cash generated from the sale of its hospitals
to Al-„Aqar REIT. Finally, the company currently has a cash position of
RM219.4m as at end-9M11.
Table 4: Hospital expansion plans
Hospital name/Location No. of beds
Estimated Completion Remarks
Bandar Baru Klang Specialist Hospital 200 End-2011 Muar 120 2012 Pasir Gudang 120 2012
New Sabah Medical Centre 250 2012 Replacement Tanjung Lumpur, Kuantan 180 2013 70:30 JV with Pasdec Corp KPJ Perlis Specialist Hospital 90 End-2013 60:40 JV with Yayasan Islam Perlis
Bandar Datuk Onn 400 2014-2015 Specialist hospital in Klang n.a. 2015 Acquired 1.8 acres of land for construction Penang Specialist hospital n.a. End 2014 Expansion of existing hospital
Source: Company
Entering the Australian retirement market. In September last year,
KPJ announced plans to venture into Australia‟s retirement/aged care
market through an agreement to buy a 51% stake in Jeta Gardens
Waterford Trust (JGWT) for cash consideration of RM19m. JGWT owns
and operates a 64-acre retirement village called Jeta Gardens, in
Waterford, Queensland, Australia. The retirement village includes a
108-bedded aged care facility, 23 retirement villas and 32 apartments
located between Brisbane and the Gold Coast.
At the same time, Al-„Aqar REIT announced the acquisition of the
assets owned by JGWT, which include 14.75ha of properties, for
RM134.9m. JGWT was still running a loss in FY Jun09, with a net loss
of A$3.1m and net liabilities of A$1.8m as it was probably in a gestation
period, having only started operating 3-4 years ago. The injection of
these assets into the REIT could turn it around as losses were mainly
due to high financial charges from borrowings incurred in starting the
business.
Education arm a second thrust for growth. KPJ also has a
healthcare education arm through KPJ International University College
of Nursing and Health Sciences (KPJIUC). KPJUC‟s main campus is
located in Nilai, Negeri Sembilan and has branches in Johor Bahru and
Bukit Mertajam. The institution was awarded university college status in
July this year. The college and hospitals play complementary roles –
the former supporting the clinical staff KPJ requires and the latter
providing the training ground for the undergraduates. KPJ intends to
spend about RM$120m to expand the college in two phases. It is
targeting 5,000 students in three years‟ and 10,000 in five years from
about 2,500 currently.

30 November 2011 Page 12 of 22
KPJ Healthcare 17 October 2011
Page 1 of 2
Risks
Competition from other hospitals. KPJ faces competition from other
hospitals with established networks. Its two largest rivals are Pantai
Group and Columbia Asia. There are also many other small players in
the market. It would also face more competition from regional players
as it begins to compete for foreign patients.
Liberalisation of the healthcare sector. Healthcare is one of the three
services sector (the others being education and professional services)
which is heading towards liberalization to raise its overall
competitiveness. Some of the recommendations announced in the
government‟s Strategic Reform Initiatives in July 2011 are the removal
of restrictions to foreign equity participation in setting up specialised
private hospitals if they meet a minimum number of beds and the
relaxation of entry restrictions for foreign specialists such as doctors
and dentists.
Shortage of healthcare professionals. Malaysia faces a shortage of
doctors and nurses. Expanding the capacity of a hospital or building
new ones would require a corresponding increase in the number of
doctors and nurses to operate it. In the event that KPJ fails to engage
such professionals to support its expansion plans, it may not be able to
achieve optimal operation. Conversely, if it fails to retain such
professionals and an exodus occurs, its operations would also be
affected.
Price pressure by insurance companies. The insurance industry in
Malaysia has grown bigger and more established. This has enhanced
its bargaining power in negotiations for more discounts for medical
procedures and treatments. This development could negatively affect
pricing.
Delay in expansion plans. We expect KPJ to pursue its expansion
plans to continue to grow its hospital network, which would in turn lead
to an overall increase in patient volume and revenue. Any delay in
expansion would retard the pace of growth that we have assumed. Cost
overrun for building new hospitals poses further risk.

30 November 2011 Page 13 of 22
KPJ Healthcare 17 October 2011
Page 1 of 2
Financials
Double-digit revenue growth. KPJ reports its revenue under four
major segments as illustrated in Figure 19. Last year, the bulk of the
revenue came from Malaysia with less than 1% from Indonesia. Over
FY06-10, revenue grew by strong double-digit CAGR of 19% as patient
volume swelled on hospital network expansion and increase in revenue
intensity. Future base revenue growth would be driven by the
expansion of hospital network via acquisitions or building new hospitals,
thereby increasing revenue intensity and foreign patient numbers.
Figure 14: Revenue and profit history Figure 15: FY10 segmental revenue, (RM’000)
Source: Company Source: Company
Figure 16: Patient volume growth Figure 17: Margin trends
Source: Company Source: Company
Figure 18: COGS breakdown for FY10
Source: Company

30 November 2011 Page 14 of 22
KPJ Healthcare 17 October 2011
Page 1 of 2
Stable margins and cost trends. Gross margins have been stable at
29-30% over the past five years with net profit margins trending up from
4.9% in FY06 to 7.2% in FY10 due mainly to lower net interest
expense. Going forward, we expect gross margins to remain stable at
the 30-31% level. Medical consultants‟ fees and material cost are the 2
major cost components, making up about 75% of total COGS. KPJ has
managed to keep these cost increases in tandem with revenue growth,
thereby maintaining its gross margins and we expect that it would
continue to do so going forward.
Cash flows. KPJ has generated increasingly strong operating cash
flows in tandem with the growth in revenue. The investment cash flows
mainly reflect its acquisition of hospitals, facilities as well as proceeds
from the disposal of its hospital assets to Al-„Aqar REIT. Going forward,
KPJ intends to continue to expand its hospital network by acquiring or
building 1-2 hospitals a year. We estimate that this would require about
RM150-200m capex per year. In addition, it has capital commitments of
RM19m for the acquisition of Jeta Gardens, RM120m for its university
expansion and we forecast it would need about RM35m yearly for
maintenance capex. However, the sale of more hospital assets to Al-
„Aqar REIT would generate about RM83.3m of positive cash flow for
KPJ.
Table 5: Future investing cash inflows/(outflows)
Purpose (RM m) 2011 2012 2013 2014
Jeta Gardens (19) - - -
University Expansion (10) (30) (30) (30)
Hospital Expansion Plans (150) (150) (150) (150)
Sale of hospitals to REIT 83.3
Purchase of land in Klang (23.8)
Maintenance capex (35) (35) (35) (35)
(130.7) (238.8) (215) (215)
Source: Kim Eng estimates
Figure 19: Historical cash flows Figure 20: Improving gearing
Source: Company Source: Company
Table 6: Working capital efficiency
FY06 FY07 FY08 FY09 FY10
Inventory days 6.9 11.5 11.5 10.5 11.3 Receivable days 28.8 46.9 50.2 55.0 59.8
Payable days 53.8 89.7 90.6 87.4 90.2
Cash conversion cycle (18.1) (31.2) (28.8) (21.9) (19.1)
Source: Company, Kim Eng
30 November 2011 Page 15 of 22
KPJ Healthcare 17 October 2011
Page 1 of 2
Favourable working capital cycle and improving gearing. With short
inventory days and long payable days, KPJ‟s cash conversion cycle is
favourable at about negative 20-30 days. Gearing has also improved
with net gearing decreasing from 0.63x as at end-FY06 to 0.20x as at
end-9M11. Other than strong cash flows from its business, the disposal
of its assets to Al-„Aqar REIT contributed to the improved gearing. Our
cash flow projections derive a strengthening gearing level. We expect
net gearing to reduce further to 0.17x by end-FY13.
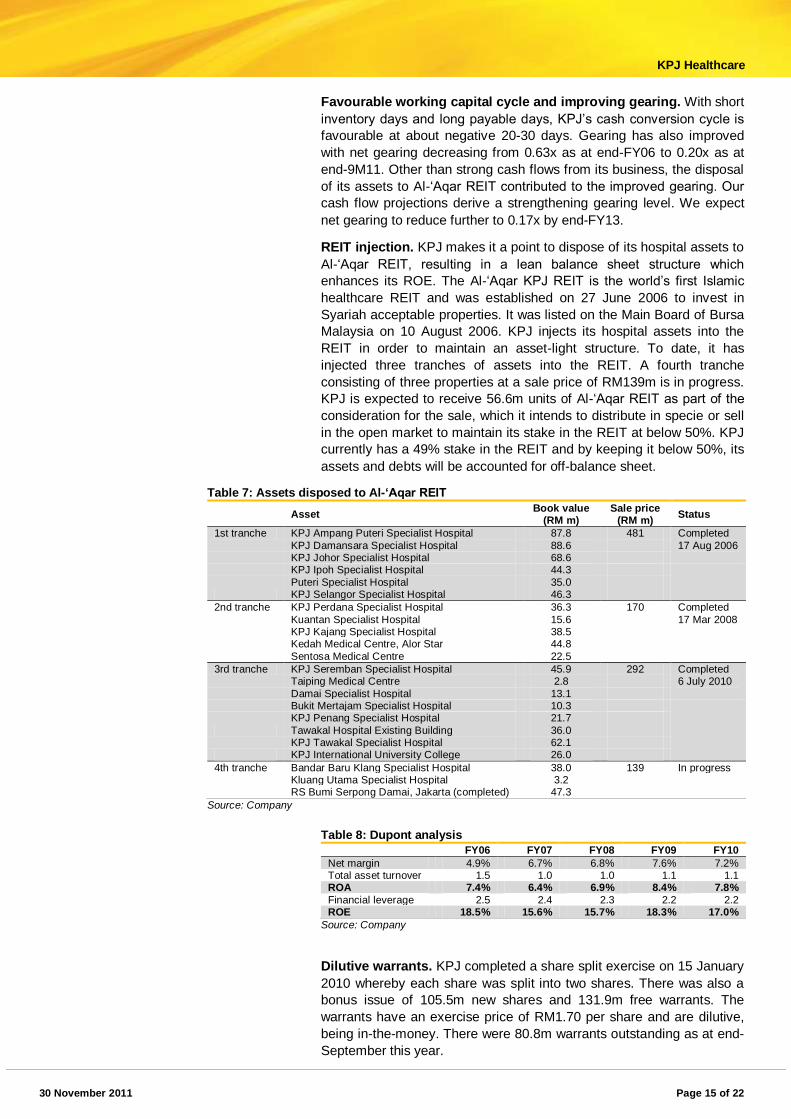
REIT injection. KPJ makes it a point to dispose of its hospital assets to
Al-„Aqar REIT, resulting in a lean balance sheet structure which
enhances its ROE. The Al-„Aqar KPJ REIT is the world‟s first Islamic
healthcare REIT and was established on 27 June 2006 to invest in
Syariah acceptable properties. It was listed on the Main Board of Bursa
Malaysia on 10 August 2006. KPJ injects its hospital assets into the
REIT in order to maintain an asset-light structure. To date, it has
injected three tranches of assets into the REIT. A fourth tranche
consisting of three properties at a sale price of RM139m is in progress.
KPJ is expected to receive 56.6m units of Al-„Aqar REIT as part of the
consideration for the sale, which it intends to distribute in specie or sell
in the open market to maintain its stake in the REIT at below 50%. KPJ
currently has a 49% stake in the REIT and by keeping it below 50%, its
assets and debts will be accounted for off-balance sheet.
Table 7: Assets disposed to Al-‘Aqar REIT
Asset Book value
(RM m) Sale price
(RM m) Status
1st tranche KPJ Ampang Puteri Specialist Hospital 87.8 481 Completed
17 Aug 2006
KPJ Damansara Specialist Hospital 88.6
KPJ Johor Specialist Hospital 68.6
KPJ Ipoh Specialist Hospital 44.3
Puteri Specialist Hospital 35.0
KPJ Selangor Specialist Hospital 46.3
2nd tranche KPJ Perdana Specialist Hospital 36.3 170 Completed
17 Mar 2008
Kuantan Specialist Hospital 15.6
KPJ Kajang Specialist Hospital 38.5
Kedah Medical Centre, Alor Star 44.8
Sentosa Medical Centre 22.5
3rd tranche KPJ Seremban Specialist Hospital 45.9 292 Completed 6 July 2010
Taiping Medical Centre 2.8
Damai Specialist Hospital 13.1
Bukit Mertajam Specialist Hospital 10.3
KPJ Penang Specialist Hospital 21.7
Tawakal Hospital Existing Building 36.0
KPJ Tawakal Specialist Hospital 62.1
KPJ International University College 26.0
4th tranche Bandar Baru Klang Specialist Hospital 38.0 139 In progress
Kluang Utama Specialist Hospital 3.2
RS Bumi Serpong Damai, Jakarta (completed) 47.3
Source: Company
Table 8: Dupont analysis
FY06 FY07 FY08 FY09 FY10
Net margin 4.9% 6.7% 6.8% 7.6% 7.2% Total asset turnover 1.5 1.0 1.0 1.1 1.1 ROA 7.4% 6.4% 6.9% 8.4% 7.8%
Financial leverage 2.5 2.4 2.3 2.2 2.2 ROE 18.5% 15.6% 15.7% 18.3% 17.0%
Source: Company
Dilutive warrants. KPJ completed a share split exercise on 15 January
2010 whereby each share was split into two shares. There was also a
bonus issue of 105.5m new shares and 131.9m free warrants. The
warrants have an exercise price of RM1.70 per share and are dilutive,
being in-the-money. There were 80.8m warrants outstanding as at end-
September this year.
30 November 2011 Page 16 of 22
KPJ Healthcare 17 October 2011
Page 1 of 2
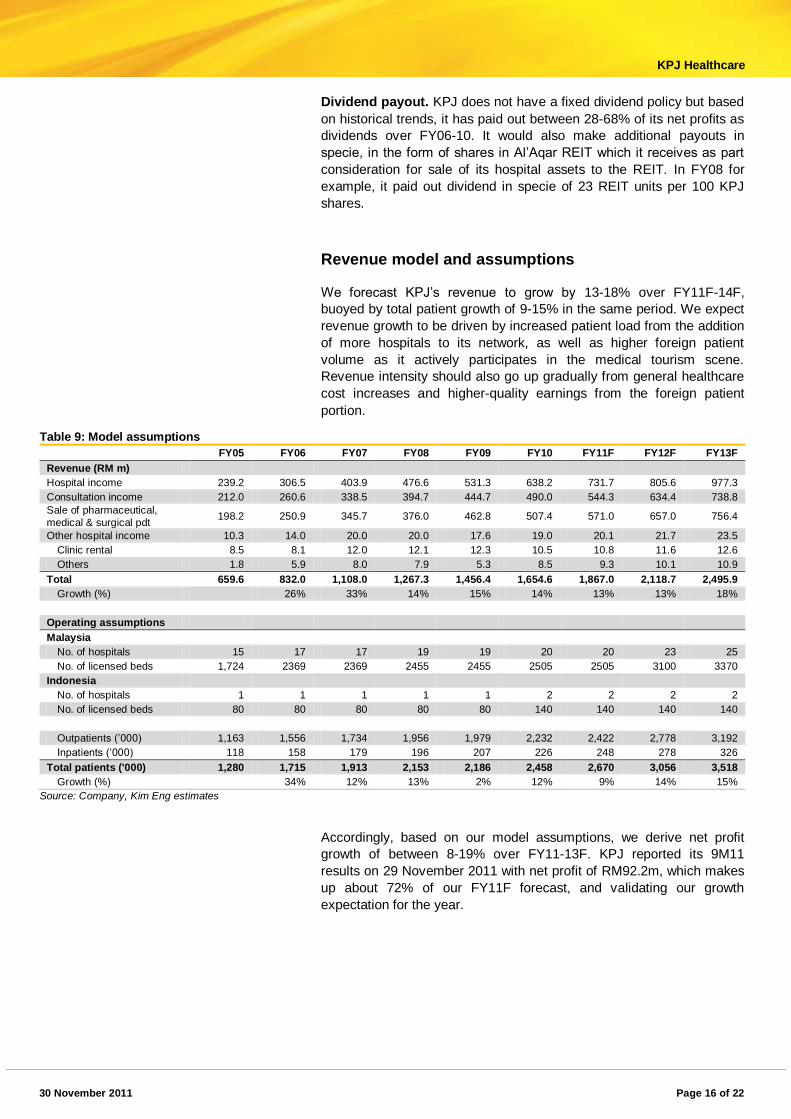
Dividend payout. KPJ does not have a fixed dividend policy but based
on historical trends, it has paid out between 28-68% of its net profits as
dividends over FY06-10. It would also make additional payouts in
specie, in the form of shares in Al‟Aqar REIT which it receives as part
consideration for sale of its hospital assets to the REIT. In FY08 for
example, it paid out dividend in specie of 23 REIT units per 100 KPJ
shares.
Revenue model and assumptions We forecast KPJ‟s revenue to grow by 13-18% over FY11F-14F,
buoyed by total patient growth of 9-15% in the same period. We expect
revenue growth to be driven by increased patient load from the addition
of more hospitals to its network, as well as higher foreign patient
volume as it actively participates in the medical tourism scene.
Revenue intensity should also go up gradually from general healthcare
cost increases and higher-quality earnings from the foreign patient
portion.
Table 9: Model assumptions
FY05 FY06 FY07 FY08 FY09 FY10 FY11F FY12F FY13F
Revenue (RM m)
Hospital income 239.2 306.5 403.9 476.6 531.3 638.2 731.7 805.6 977.3
Consultation income 212.0 260.6 338.5 394.7 444.7 490.0 544.3 634.4 738.8
Sale of pharmaceutical,
medical & surgical pdt 198.2 250.9 345.7 376.0 462.8 507.4 571.0 657.0 756.4
Other hospital income 10.3 14.0 20.0 20.0 17.6 19.0 20.1 21.7 23.5
Clinic rental 8.5 8.1 12.0 12.1 12.3 10.5 10.8 11.6 12.6
Others 1.8 5.9 8.0 7.9 5.3 8.5 9.3 10.1 10.9
Total 659.6 832.0 1,108.0 1,267.3 1,456.4 1,654.6 1,867.0 2,118.7 2,495.9
Growth (%)
26% 33% 14% 15% 14% 13% 13% 18%
Operating assumptions
Malaysia
No. of hospitals 15 17 17 19 19 20 20 23 25
No. of licensed beds 1,724 2369 2369 2455 2455 2505 2505 3100 3370
Indonesia
No. of hospitals 1 1 1 1 1 2 2 2 2
No. of licensed beds 80 80 80 80 80 140 140 140 140
Outpatients (‟000) 1,163 1,556 1,734 1,956 1,979 2,232 2,422 2,778 3,192
Inpatients (‟000) 118 158 179 196 207 226 248 278 326
Total patients ('000) 1,280 1,715 1,913 2,153 2,186 2,458 2,670 3,056 3,518
Growth (%) 34% 12% 13% 2% 12% 9% 14% 15%
Source: Company, Kim Eng estimates
Accordingly, based on our model assumptions, we derive net profit
growth of between 8-19% over FY11-13F. KPJ reported its 9M11
results on 29 November 2011 with net profit of RM92.2m, which makes
up about 72% of our FY11F forecast, and validating our growth
expectation for the year.

30 November 2011 Page 17 of 22
KPJ Healthcare 17 October 2011
Page 1 of 2
Valuation and recommendation
We initiate coverage on KPJ with a BUY recommendation and target
price of RM5.10 based on 22x PER on fully-diluted FY12F earnings.
This valuation is hardly expensive considering that some of its peers
are trading as high as 29x PER. At its current price, KPJ is the
cheapest hospital stock in the region in terms of PER valuation, trading
at 18.1x FY12F PER compared with the peer average of 22.3x. It also
offers the highest gross dividend yield of 3.2% (2.4% net yield) and one
of the highest ROEs among its peers. With a stable domestic earnings
base, we see limited downside to KPJ‟s earnings. Moreover, structural
demand factors would provide further support and present vast
opportunities for growth in areas such as medical tourism.
Table 10: Peer comparison
Mkt cap
Rating TP Price PER (x) P/S P/B ROE NPM Net D/E
Yld
Company
(lcl b) (lcl) (lcl) Hist Curr Fwd (x) (x) (%) (%) (%) (%)
Raffles Medical Group SGD 1.1 BUY 2.73 2.15 24.9 24.2 21.2 4.3 3.6 16.9 18.9 (29.5) 1.6
Healthway Medical Corp SGD 0.2 NR n.a. 0.08 38.1 - - 2.0 0.8 1.7 3.3 9.1 0.0
Apollo Hospitals Enterprise Rs 80.5 NR n.a. 612.50 41.3 33.5 29.2 2.9 4.0 10.4 7.1 37.8 0.6
Fortis Healthcare India Rs 46.4 NR n.a. 114.50 35.4 - - 3.0 1.4 4.8 8.4 26.2 0.0
Bangkok Dusit Medical Bt 115.5 NR n.a. 74.75 26.6 27.5 23.5 3.2 3.8 15.4 9.7 39.7 1.1
Bumrungrad Hospital Bt 33.3 NR n.a. 45.75 21.5 22.4 19.5 3.0 5.2 21.8 12.8 14.9 2.1
KPJ Healthcare RM 2.4 BUY 5.10 4.18 20.6 21.3 18.1 1.3 2.9 17.0 7.2 24.0 3.2
Average
29.8 25.8 22.3 2.8 3.1 12.6 9.6 17.5 1.2
Average excl. KPJ
31.3 26.9 23.3 3.1 3.1 11.8 10.0 16.4 0.9
Source: Bloomberg, Kim Eng

30 November 2011 Page 18 of 22
KPJ Healthcare 17 October 2011
Page 1 of 2
Company profile
Overview. KPJ Healthcare Berhad is the largest private hospital
operator in Malaysia, operating 20 hospitals and licensed for 2,505
beds. It also runs two hospitals in Indonesia with a total of 140 beds.
KPJ maintains an asset-light structure by selling its hospital buildings to
Al-‟Aqar REIT and then leasing them back. It owns a 49% stake in the
REIT. Johor Corporation, a government-linked corporation of the Johor
state and one of Malaysia‟s leading conglomerates, is the parent
company of KPJ and holds a 41% interest in it. KPJ was listed on the
Main Board of Bursa Malaysia, then known as the Kuala Lumpur Stock
Exchange, on 29 November 1994 and remains the only listed hospital
group on Bursa.
Table 11: KPJ’ s hospital network
No. of licensed beds No. of licensed beds
Malaysia Johor
Negeri Sembilan KPJ Johor Specialist Hospital 200 KPJ Seremban Specialist Hospital 130
Puteri Specialist Hospital 146
Kluang Utama Specialist Hospital 40 Perak
KPJ Ipoh Specialist Hospital 250
Kuala Lumpur/Selangor
Taiping Medical Centre 46
KPJ Ampang Puteri Specialist Hospital 217 KPJ Damansara Specialist Hospital 158 Penang
KPJ Selangor Specialist Hospital 169 KPJ Penang Specialist Hospital 236
KPJ Kajang Specialist Hospital 110 KPJ Tawakal Specialist Hospital 147 Pahang
Sentosa Medical Centre 135 Kuantan Specialist Hospital 72
Kelantan
Sarawak
KPJ Perdana Specialist Hospital 83 Kuching Specialist Hospital 80
Sibu Specialist Medical Centre 50
Kedah
Kedah Medical Centre, Alor Star 98 Sabah
Damai Specialist Hospital 43
Sabah Medical Centre 95
Total Malaysia 2,505
Indonesia RS Medika Permata Hijau, Jakarta 60
RS Bumi Serpong Damai, Jakarta 80
Total Indonesia 140
Total no. of beds 2,645
Source: Company

30 November 2011 Page 19 of 22
KPJ Healthcare 17 October 2011
Page 1 of 2
Figure 31: Corporate structure
Source: Company
Key management
Datin Paduka Siti Sa’diah Sheikh Bakir, Managing Director. Datin
Paduka has been the managing director of KPJ since March 1993. She
graduated with a Bachelor of Economics from the University of Malaya
and holds an MBA from Henley Management College, University of
Reading, London. She is also the chairman of various hospitals and
companies in the KPJ Group and sits as a director for various other
companies in Malaysia. She has served as an independent non-
executive director of Bursa Malaysia since 2004 and the president of
the Malaysian Society for Quality in Health (MSQH) since 1997.
Mohd Sahir Rahmat, Chief Financial Officer. Previously the group
general manager, Mr Mohd took over the role of chief financial officer
from Lee Swee Hee on 4 July 2011. He holds an MBA from Henley
Management College, London, and has served as the executive
director of Johor Specialist Hospital and Puteri Specialist Hospital.
Amiruddin Abdul Satar, Chief Operating Officer. Mr Amiruddin is an
accountant by profession and holds an MBA from Henley Business
School, University of Reading, London. He is also an executive director
of KPJ, having spent more than 15 years with the group and
contributing in areas of hospital operations, finance, strategic planning
and investment decisions.

30 November 2011 Page 20 of 22
KPJ Healthcare 17 October 2011
Page 1 of 2
INCOME STATEMENT (RM m) BALANCE SHEET (RM m)
FY Dec FY2010 FY2011F FY2012F FY2013F FY Dec FY2010 FY2011F FY2012F FY2013F
Revenue 1,654.6 1,867.0 2,118.7 2,495.9 Fixed Assets 1,024.6 1,193.1 1,374.8 1,513.6
EBITDA 203.0 241.8 302.6 366.0 Other LT Assets 0.0 0.0 0.0 0.0
Depreciation & Amortisation 59.0 69.7 87.2 106.6 Cash/ST Investments 197.1 240.5 248.4 317.1
Operating Profit (EBIT) 144.0 172.1 215.4 259.4 Other Current Assets 458.4 362.8 411.5 484.6
Interest (Exp)/Inc (6.4) (9.5) (12.0) (13.5) Total Assets 1,680.0 1,796.4 2,034.7 2,315.3
Associates 30.4 22.8 30.1 30.4
One-offs 0.0 0.0 0.0 0.0 ST Debt 362.7 128.5 147.1 166.8
Pre-Tax Profit 168.0 185.5 233.5 276.3 Other Current Liabilities 362.2 386.4 428.3 492.4
Tax (41.7) (43.4) (62.0) (72.1) LT Debt 36.7 257.1 294.1 333.6
Minority Intereset (7.3) (13.4) (18.3) (23.9) Other LT Liabilities 55.0 55.6 57.7 60.7
Net Profit 118.9 128.7 153.2 180.2 Minority Interest 94.7 112.0 127.1 149.8
Recurring Net Profit 118.9 128.7 153.2 180.2 Shareholders' Equity 768.6 856.8 980.4 1,112.1
Total Liabilities-Capital 1,680.0 1,796.4 2,034.7 2,315.3
Revenue Growth (%) 13.6% 12.8% 13.5% 17.8%
EBITDA Growth (%) 8.6% 19.1% 25.1% 21.0% Share Capital (m) 280.0 289.3 289.3 289.3
EBIT Growth (%) 2.5% 19.5% 25.2% 20.4% Gross Debt/(Cash) 399.4 385.6 441.2 500.4
Net Profit Growth (%) 7.2% 8.3% 19.0% 17.7% Net Debt/(Cash) 202.3 145.0 192.8 183.3
Recurring Net Profit Growth (%) 7.2% 8.3% 19.0% 17.7% Working Capital (69.4) 88.5 84.5 142.5
Tax Rate (%) 24.1% 22.7% 25.8% 25.3%
CASH FLOW (RM m) RATES & RATIOS
FY Dec FY2010 FY2011F FY2012F FY2013F FY Dec FY2010 FY2011F FY2012F FY2013F
Profit before taxation 168.0 185.5 233.5 276.3 EBITDA Margin % 12.3% 13.0% 14.3% 14.7% Depreciation 59.0 69.7 87.2 106.6 Op. Profit Margin % 8.7% 9.2% 10.2% 10.4% Net interest receipts/(payments) 6.4 9.5 12.0 13.5 Net Profit Margin % 7.2% 6.9% 7.2% 7.2% Working capital change 31.2 2.9 (7.3) (9.7) ROE % 17.0% 15.8% 16.7% 17.2% Cash tax paid (37.1) (43.3) (62.5) (72.9) ROA % 7.8% 7.4% 8.0% 8.3% Others (incl'd exceptional items) (13.3) (17.2) (19.3) (22.0) Net Margin Ex. El % 7.2% 6.9% 7.2% 7.2% Cash flow from operations (32.2) (16.0) (39.1) (30.6) Dividend Cover (x) 2.0 2.2 2.3 2.3 Capex 182.0 191.1 204.5 261.2 Interest Cover (x) 10.6 10.0 11.2 11.8 Disposal/(purchase) (227.5) (214.0) (238.8) (215.0) Asset Turnover (x) 1.0 1.0 1.0 1.1 Others 64.7 83.3 0.0 0.0 Asset/Debt (x) 4.2 4.7 4.6 4.6 Cash flow from investing (36.6) 50.8 34.4 35.8 Debtors Turn (days) 59.8 59.2 56.4 55.5 Debt raised/(repaid) (199.5) (80.0) (204.4) (179.2) Creditors Turn (days) 90.2 88.1 84.9 83.3 Equity raised/(repaid) 30.6 (13.8) 55.6 59.3 Inventory Turn (days) 11.3 11.8 11.3 11.1 Dividends (paid) 54.9 9.4 0.0 0.0 Net Gearing % 26% 17% 20% 16% Interest payments (26.5) (63.3) (47.9) (72.5) Debt/ EBITDA (x) 2.0 1.6 1.5 1.4 Others 0.0 0.0 0.0 0.0 Debt/ Market Cap (x) 0.17 0.16 0.18 0.21 Cash flow from financing 59.0 (67.7) 7.7 (13.3)
Change in cash 41.6 43.4 7.8 68.8
Source: Company, Kim Eng

30 November 2011 Page 21 of 22
KPJ Healthcare 17 October 2011
Page 1 of 2
APPENDIX 1
Definition of Ratings
Maybank Investment Bank Research uses the following rating system:
BUY Total return is expected to be above 10% in the next 12 months
HOLD Total return is expected to be between -5% to 10% in the next 12 months
SELL Total return is expected to be below -5% in the next 12 months
Applicability of Ratings
The respective analyst maintains a coverage universe of stocks, the list of which may be adjusted according to needs. Investment ratings are
only applicable to the stocks which form part of the coverage universe. Reports on companies which are not part of the coverage do not
carry investment ratings as we do not actively follow developments in these companies.
Some common terms abbreviated in this report (where they appear):
Adex = Advertising Expenditure FCF = Free Cashflow PE = Price Earnings
BV = Book Value FV = Fair Value PEG = PE Ratio To Growth
CAGR = Compounded Annual Growth Rate FY = Financial Year PER = PE Ratio
Capex = Capital Expenditure FYE = Financial Year End QoQ = Quarter-On-Quarter
CY = Calendar Year MoM = Month-On-Month ROA = Return On Asset
DCF = Discounted Cashflow NAV = Net Asset Value ROE = Return On Equity DPS = Dividend Per Share
NTA = Net Tangible Asset ROSF = Return On Shareholders‟ Funds
EBIT = Earnings Before Interest And Tax P = Price WACC = Weighted Average Cost Of Capital
EBITDA = EBIT, Depreciation And Amortisation P.A. = Per Annum YoY = Year-On-Year
EPS = Earnings Per Share PAT = Profit After Tax YTD = Year-To-Date
EV = Enterprise Value PBT = Profit Before Tax
Disclaimer
This report is for information purposes only and under no circumstances is it to be considered or intended as an offer to sel l or a solicitation
of an offer to buy the securities referred to herein. Investors should note that income from such securi ties, if any, may fluctuate and that each
security‟s price or value may rise or fall. Opinions or recommendations contained herein are in form of technical ratings and fundamental
ratings. Technical ratings may differ from fundamental ratings as technical valuations apply different methodologies and are purely based on
price and volume-related information extracted from Bursa Malaysia Securities Berhad in the equity analysis.Accordingly, investors may
receive back less than originally invested. Past performance is not necessarily a guide to future performance. This report is not intended to
provide personal investment advice and does not take into account the specific investment objectives, the financial situation and the
particular needs of persons who may receive or read this report. Investors should therefore seek financial, legal and other advice regarding
the appropriateness of investing in any securities or the investment strategies discussed or recommended in this report.
The information contained herein has been obtained from sources believed to be reliable but such sources have not been independently
verified by Maybank Investment Bank Berhad and consequently no representation is made as to the accuracy or completeness of this report
by Maybank Investment Bank Berhad and it should not be relied upon as such. Accordingly, no liability can be accepted for any direct,
indirect or consequential losses or damages that may arise from the use or reliance of this report. Maybank Investment Bank Berhad, its
affiliates and related companies and their officers, directors, associates, connected parties and/or employees may from time to time have
positions or be materially interested in the securities referred to herein and may further act as market maker or may have assumed an
underwriting commitment or deal with such securities and may also perform or seek to perform investment banking services, advisory and
other services for or relating to those companies. Any information, opinions or recommendations contained herein are subject to change at
any time, without prior notice.
This report may contain forward looking statements which are often but not always identified by the use of words such as “ant icipate”,
“believe”, “estimate”, “intend”, “plan”, “expect”, “forecast”, “predict” and “project” and statements that an event or result “may”, “will”, “can”,
“should”, “could” or “might” occur or be achieved and other similar expressions. Such forward looking statements are based on assumptions
made and information currently available to us and are subject to certain risks and uncertainties that could cause the actual results to differ
materially from those expressed in any forward looking statements. Readers are cautioned not to place undue relevance on thes e forward-
looking statements. Maybank Investment Bank Berhad expressly disclaims any obligation to update or revise any such forward looking
statements to reflect new information, events or circumstances after the date of this publication or to reflect the occurrenc e of unanticipated
events.
This report is prepared for the use of Maybank Investment Bank Berhad's clients and may not be reproduced, altered in any way, transmitted
to, copied or distributed to any other party in whole or in part in any form or manner without the prior express written consent of Maybank
Investment Bank Berhad and Maybank Investment Bank Berhad accepts no liability whatsoever for the actions of third parties in this respect.
This report is not directed to or intended for distribution to or use by any person or entity who is a citizen or resident of or located in any
locality, state, country or other jurisdiction where such distribution, publication, availability or use would be contrary to law or regulation.

30 November 2011 Page 22 of 22
KPJ Healthcare 17 October 2011
Page 1 of 2
APPENDIX 1
Additional Disclaimer (for purpose of distribution in Singapore)
This report has been produced as of the date hereof and the information herein maybe subject to change. Kim Eng Research Pte Ltd
("KERPL") in Singapore has no obligation to update such information for any recipient. Recipients of this report are to contact KERPL in
Singapore in respect of any matters arising from, or in connection with, this report. If the recipient of this report is not an accredited investor,
expert investor or institutional investor (as defined under Section 4A of the Singapore Securities and Futures Act), KERPL shall be legally
liable for the contents of this report, with such liability being limited to the extent (if any) as permitted by law.
As of 30 November 2011, KERPL does not have an interest in the said company/companies.
Additional Disclaimer (for purpose of distribution in the United States)
This research report prepared by Maybank Investment Bank Berhad is distributed in the United States (“US”) to Major US Institutional
Investors (as defined in Rule 15a-6 under the Securities Exchange Act of 1934, as amended) only by Kim Eng Securities USA, a broker-
dealer registered in the US (registered under Section 15 of the Securities Exchange Act of 1934, as amended).
All responsibility for the distribution of this report by Kim Eng Securities USA in the US shall be borne by Kim Eng. All resulting transactions
by a US person or entity should be effected through a registered broker-dealer in the US.
This report is for distribution only under such circumstances as may be permitted by applicable law. The securities described herein may not
be eligible for sale in all jurisdictions or to certain categories of investors. This report is not directed at you if Kim Eng Securities is prohibited
or restricted by any legislation or regulation in any jurisdiction from making it available to you. You should satisfy yourself before reading it
that Kim Eng Securities is permitted to provide research material concerning investments to you under relevant legislation and regulations.
Without prejudice to the foregoing, the reader is to note that additional disclaimers, warnings or qualifications may apply i f the reader is
receiving or accessing this report in or from other than Malaysia.
As of 30 November 2011, Maybank Investment Bank Berhad and the covering analyst does not have any interest in in any companies
recommended in this Market themes report.
Analyst Certification:
The views expressed in this research report accurately reflect the analyst's personal views about any and all of the subject securities or
issuers; and no part of the research analyst's compensation was, is, or will be, directly or indirectly, related to the specific recommendations
or views expressed in the report.
Additional Disclaimer (for purpose of distribution in the United Kingdom)
This document is being distributed by Kim Eng Securities Limited, which is authorised and regulated by the Financial Services Authority and
is for Informational Purposes only.This document is not intended for distribution to anyone defined as a Retail Client under the Financial
Services and Markets Act 2000 within the UK. Any inclusion of a third party link is for the recipients convenience only, and that the firm does
not take any responsibility for its comments or accuracy, and that access to such links is at the individuals own risk. Nothing in this report
should be considered as constituting legal, accounting or tax advice, and that for accurate guidance recipients should consult with their own
independent tax advisers.
Published / Printed by
Maybank Investment Bank Berhad (15938-H)
(A Participating Organisation of Bursa Malaysia Securities Berhad) 33rd Floor, Menara Maybank, 100 Jalan Tun Perak, 50050 Kuala Lumpur
Tel: (603) 2059 1888; Fax: (603) 2078 4194 Stockbroking Business:
Level 8, Tower C, Dataran Maybank, No.1, Jalan Maarof 59000 Kuala Lumpur Tel: (603) 2297 8888; Fax: (603) 2282 5136
http://www.maybank-ib.com