making more out of less - pwc
TRANSCRIPT

pwc.com.au
PwC analysis of the major banks results for half year 2013
Making more out of less...

2 Major banks analysis – May 2013
Making more out of less...
In the last six months, the Australian banks have continued to grow headline cash earnings by 7.3% prior half (hoh) to $13.4b and by 7.2% over the prior comparable period (pcp), in what seems, on the surface, to be improving market conditions. There is no doubt, however, the growth in profitability has been ‘hard-won’ with the banks having an uptick in return on equity to 15.9% from 15.2% hoh.In the last six months global market conditions have shown some notable improvements. We have observed improving debt and capital markets as evidenced through rising equity indices, contracting credit spreads, and improved liquidity. The question in everyone’s mind is will the politicians and central bankers be able to agree on the structural and tactical decisions needed to sustain these trends and maintain the current level of confidence?
Despite these positive sentiments, world growth expectations are flat-to-lower, with the modest recovery in the US not yet sufficient to offset slowing elsewhere. Most Western economies continue to struggle to make headway in fiscal consolidation with a number of European periphery nations particularly challenged and on bankers’ watchlists. Aggressive monetary stimulus continues apace with Japan the latest convert to aggressive expansion of central bank balance sheets. The ECB has just reduced its policy rate by 25bp to 0.5%. Concerted central bank determination has the upper hand at present over market concerns about policy sustainability, including around the potential for “currency wars”.
In relative terms the Australian economy remains robust, albeit with a little less gloss. The impact of monetary easing is evident, with house prices and retail sales recently on upward trends. Population growth is doing its part as well, although residential construction remains stubbornly low. Conversely the impact of the high AUD and lower commodity prices on trade exposed industries is evident. Given these factors and low CPI readings, the recent easing by the Reserve Bank of Australia seems justified with an ongoing bias towards easing monetary policy.
Corporate Australia continues to respond to these pressures by focusing on financial growth through improving productivity and efficiency rather than expansion.
The slower pace of investment and reduced level of economic activity are reflected in low credit growth, which makes it all the more notable that the major banks have found themselves in a ‘sweet spot’ in the last six months with their share prices at or near all-time highs. By international comparisons, our sector remains well capitalised and delivering solid returns on equity within a strong regulatory framework.
One interesting development is the increasing dividends paid to shareholders. This reflects the fact that the Australian banks are well placed in terms of their capital position under Basel III. While cash earnings have increased 7.2% pcp, their combined dividends have risen 16.1% compared to the same period. In the short term, this has provided an impetus, helping to support the ongoing rise in the share prices.
The underlying mechanics of the banks’ earnings growth follow a pattern we have become relatively familiar with in this low credit growth environment. Net interest income has improved half on half, as did non-interest income. Costs continue to be well managed and the bad debt charge fell as the credit environment remained benign.
This half we have seen a consistent trend in the emergence of revenue growth, albeit at low levels, across core business activities. Total operating income grew 2.3% hoh, reflecting the increase in net interest income 2.3% hoh, while non-interest income grew by 2.4% hoh.
Digging further into net interest income lending assets grew by 1.4% hoh while margins were unchanged from 2H12 at 2.14%. The flat margin has been a function of the banks holding back part of the monetary policy easing in 2012 through lending rates, which added 6bp to margins. This was partly offset by continued price competition in retail and business deposits, together with the reduced margin benefit of transaction accounts in a lower rate environment – these factors reduced margin by 4bp. Wholesale funding costs where broadly flat, with other markets movements accounting for the balance.
The reduced margin benefit of transaction accounts will continue to have an adverse impact as the cash rate continues to fall. The liquidity and funding benefits of deposits will underpin bank competition for a good while longer, with an ongoing drag on relative funding costs. Consistent with this, we are seeing more banks introduce “notice saver” style deposit products in the local market.
Making more out of less seems to be an ongoing challenge for all businesses in Australia. The Australian banking sector is no different.
Stuart Scoular Banking and Capital Markets Leader
Hugh Harley Financial Services Leader

Major banks analysis – May 2013 3
Slow credit growth continues to be a constraining factor on the banks’ results. Overall credit grew 3.2%pa in the year to March, virtually identical to the 3.3% and 3.4% growth rates recorded in the years to March 2012 and 2011 respectively. Housing credit growth continues to edge down modestly, but more interestingly credit growth for business seems to have stalled once more in recent months. When combined with a fall in business deposits and falling business tax collections, this suggests that the business sector might be struggling a little more than is generally understood. These trends are likely to be part of the RBA’s reasoning to recently ease monetary policy. It should equally be noted that large corporates have been active in tapping global bond markets to take advantage of further declines in borrowing spreads.
Bad debt expense, which is a key driver of the banks underlying profitability and earnings volatility, has decreased by 17% in the last six months. This reflects a continuation of improving delinquencies in the retail portfolios, assisted by low interest rates. Impaired assets are running down as impaired loans are worked-out, offset by new SME and Corporate loans falling into arrears. We continue to see very disciplined workout behaviour by the banks to achieve fuller values on the sale of assets.
We believe the ongoing trend for a decreasing bad debt expense is unlikely to continue given the challenging business environment and the fact that some of the more recent cohorts of home loans have a higher proportion of > 90% LVR loans which are yet to season. We are also seeing the banks
competing more aggressively in terms of price and conditions for new credit. Longer-term the bad debt expense to loans and acceptances ratio is likely to be in the range of 25 – 35 bpts.
Other areas of revenue affecting the results include:
• Wealth management returns were perhaps not as strong as anticipated, with investors taking a cautious approach to investing in the rebounding equities market and insurance premiums remaining flat half on half. Wealth management income grew by 1.4% hoh.
• Bank trading income was a real positive, with income up 38% hoh and approaching the 2009 GFC highs. Contracting credit spreads boosted asset valuations. And continued demand from customers for risk mitigation products has been a noticeable positive, as was the growth in trading income from offshore expansion initiatives.
The banks’ discipline on cost management in response to weak revenue growth is delivering some real efficiency dividends. The cost-to-income ratio is now at 44.6% compared to 45.6% at September 2012. Costs have been an area of focus across the sector and the recent improvement is all the more impressive given the increased expenses being incurred by the banks in delivering their IT initiatives. Staff expenses remained flat half on half, while technology expenses rose by 5.4% hoh.1
Regulatory change continues to be front and centre for the sector. While this has been very intensive of management time, they have been able to manage
and fund these changes without overly constraining their broader strategic agendas. With these important building blocks in place we are now seeing the banks shifting focus towards customer centricity through large investments in digital initiatives, improved customer analytics (see Customer analytics: herdings stats article), and changing philosophies around branches. In many ways, the Australian banks are ‘paving the way’ globally in this space.
The outlook for the sector remains challenging. The recent cash rate cut and subsequent passing on of the lower rates to customers is likely to have an adverse impact on margin. Equally, in certain products we are seeing intense competition, for example in loans for corporate and institutional clients, and retail deposits. We have seen that the Australian banks are very good at responding to new challenges. The key is likely to be around growing non-interest income and effectively managing costs in a tough environment.
Looking to the more immediate future, the PwC Banking Gauge – a consensus view across five leading banking analysts – predicts that the four major banks will deliver cash earnings growth of 7.4% in FY13, 5.6% in FY14 and 6.8% in FY15.
Note: PwC Banking gauge is a consensuss four banks with five of Australia’s leading analysts – Brian Johnson (CLSA), James Ellis (Credit Suisse), James Freeman (Deutsche Bank), Jonathan Mott (UBS), and Scott Manning (JP Morgan).
1 (After adjusting for one bank’s capitalised software impairment write-down in September 2012).
Four majors’ combined performance – A$ million – underlying cash earnings
1H13 2H12 1H12 1H13 vs 2H12 1H13 vs 1H12
Net interest income 26,151 25,568 25,559 2.3% 2.3%
Other operating income 12,982 12,682 12,029 2.4% 7.9%
Total income 39,133 38,250 37,588 2.3% 4.1%
Operating expenses 17,472 17,444 17,167 (0.2%) (1.8%)
Core earnings 21,661 20,806 20,421 4.1% 6.1%
Bad debt expense 2,745 3,320 2,854 17.3% 3.8%
Tax expense 5,425 4,923 4,984 (10.2%) (8.8%)
Outside equity interests 52 43 49 (20.9%) (6.1%)
Underlying cash earnings after tax before significant items
13,439 12,520 12,534 7.3% 7.2%
Statutory results 12,425 11,241 11,562 10.5% 7.5%

4 Major banks analysis – May 2013
Credit growth The ongoing low growth in credit continues. Annual credit growth for the whole economy has now been stuck in “the low threes” for three years – 3.2%, 3.3%, and 3.4% for the years to March 2013, March 2012, and March 2011 respectively.The hopes of six months ago that credit growth might be picking up now seem premature. Total credit has only grown by 1.1% in the six months to March 2013, a pace not seen since the very start of 2010 when we were climbing out of the depths of the GFC.
In historic context, the picture for bank loans and advances across the economy is even weaker in the sense that growth is now slower than the depths of the GFC – we have to go back to the 1991/92 recession to see comparably slow growth.1
Bank loans and advances rose by 5.1% in the year to March 2013, compared to 6.1% in the year to March 2012. While the annual growth did drop to 5.6% in the middle of 2011, you have to go back to 1992 –rather than the immediate GFC period – to find annual growth rates of 5.1% or lower.
One element of the explanation for this is that housing credit growth continues to be very weak as consumers take advantage of low interest rates to repay debt. Over the past year, these low growth rates have been steady, rather than deteriorating. Total housing credit grew by 4.3% in the year to March 2013, the same as in the year to March 2012.
The bigger shift has been in business credit, which has begun to contract again in recent months. Having grown steadily since the latter months of 2010, the stock of total business credit peaked in September 2012 and is now about -0.7% (or $5b) lower than that peak. This means the annual growth in business credit has fallen from 3.5% in the year to March 2012 to 1.4% in the year to year to March 2013. This is another pointer to the cautious mood prevailing in business at present.
Other personal credit is tiny in comparison to housing and business, only about 6% of total credit. Nonetheless, it is has picked up in recent months – for instance it grew by 1.1% in the last six months, compared to a fall of 2.5% in the six months to March 2012. Lower interest rates may be assisting on this front. This category is down 10% on September 2008.
1Bank loans now account for about 84% of total credit.
Net Interest Income
Domestic credit growth (Annual % growth – 12 month rolling average)Domestic Credit Growth (Annual % growth – 12 month rolling average)
-10%
-5%
0%
5%
10%
15%
20%
25%
30%
2003 2004 2005 2006 2007 2008 2009 2010 2011 2012 2013
Total Housing Personal Business
Source: RBA data
In the six months to March 2013 business credit fell 0.7%, equal to about $5b over the period – and business deposits shrunk by $2b down 0.4%

Major banks analysis – May 2013 5
Customer DepositsThe broad trends in bank funding from customers are largely unchanged over the past six months.Core bank deposits grew by 10.1% in the year March 2013, compared to 9.2% in the year to March 2012. In the six months to March 2013 deposits grew 3.5%, the same as the 3.5% seen in the same period last year and consistent with the usual seasonal pattern.
This growth in total deposits is being driven by households, By contrast, total deposits from business have shrunk by $2b in the last six months (-0.4%), whereas they had been growing for a good while prior to that. We think this is probably best interpreted as an indicator of less robust cash-flow conditions for business, given the other anecdotal evidence. There is an obvious parallel to what we are seeing on the credit growth split between households and business.
In market share terms, the major banks increased their share of household deposits (by 23 bps to 81.2% at March 2013) but lost share of business deposits (down 34 bps to 79.4% at March 2013). Share in the business category was mostly lost to the regional banks.
Another consequence of comparatively strong overall growth in core deposits is that the Australian banks continue to be able to fund all their lending through deposit growth. In the past six months, core deposits grew by $43b while lending grew by $39b; for the twelve months the positive gap was wider – $115b of deposit growth compared to $87b of lending. In consequence the ratio of core deposits to lending is now above 70% for the first time since late 1999. It has increased from 67.0% to 70.6% over the past year. While only a short-hand measure of funding, it highlights that the banks continue to be able improve their reliance on retail funding.
We expect this trend to continue, supported by the bank’s own cautious risk settings and the regulator’s determination that the Basel III liquidity rules are implemented cleanly and swiftly by global standards. For the same reasons, we have not been surprised to see pricing competition for retail deposits remaining keen; this is another trend we expect to continue.
Core bank deposits to bank loans and advances (%)Core bank deposits to bank loans and advances (%)
0
20
40
60
80
100
120
140
1986 1989 1992 1995 1998 2001 2004 2007 2010 2013
%
Another consequence of comparatively strong overall growth in core deposits is that the Australian banks continue to be able to fund all their lending through deposit growth

6 Major banks analysis – May 2013
Net interest marginThe banks combined net interest margin was flat half on half and down 6 bps pcp to 2.14%. Looking at the margin for 1H13, loan re-pricing added 6 bps to the net interest margin as banks held on to part of the interest rate cuts delivered by the RBA over 2012. Continued price competition for deposits and the impact of lower interest rates on rate insensitive deposit products reduced margins by (-3 bps).
Falling interest rates due to monetary policy easing reduced the margin benefit of transaction accounts by (-1 bp).
Wholesale funding costs eased over the past six–to–nine months with credit spreads reducing by more than 100 bps. Banks are now replacing wholesale debt at lower rates and longer maturities than has been possible since the start of the GFC, reflecting more confidence in European markets. The impact of wholesale funding costs on the margin was broadly flat.
Our outlook is for bank interest margins to decline, reflecting competition for the limited pool of bank lending and competition for deposits given their funding and liquidity benefits. In addition, the banks’ decision to pass on the recent cash rate reduction in full, plus the reduced margin benefit of transaction accounts will detract from margins.
Combined net interest margin
2.052.09
2.14
2.29 2.28
2.23 2.252.27
2.20
2.14 2.14
1.9%
2.0%
2.1%
2.2%
2.3%
2.4%
1H08 2H08 1H09 2H09 1H10 2H10 1H11 2H11 1H12 2H12 1H13
Our outlook is for bank interest margins to decline, reflecting competition for the limited pool of bank lending and competition for deposits given their funding and liquidity benefits

Major banks analysis – May 2013 7
Other Operating Income
Analysis of other operating income
0
2
4
6
8
10
12
14
1H08 2H08 1H09 2H09 1H10 2H10 1H11 2H11 1H12 2H12 1H13
$b
Banking fees & other income Trading Income Wealth Management
Trading income, at $2.3b, was the strongest it’s been since 2009, up 38% hoh and pcp. The drivers were contracting credit spreads on traded assets and increased customer flow for risk management products.
Some recovery in equity markets offset sluggish insurance revenue growth to leave wealth management revenues broadly flat hoh.
Other income performance was mixed.
Growth in fee income of 0.8% hoh reflects the low level in underlying credit growth and the extent of competition to win new lending business, particularly in the corporate and institutional sectors.

8 Major banks analysis – May 2013
ExpensesCombined expense-to-income ratio
47.1% 46.5%
44.1%
45.1%
45.2%
46.8%
45.6%
46.1%45.7% 45.6%
44.6%
43.0%
44.0%
45.0%
46.0%
47.0%
48.0%
1H08 2H08 1H09 2H09 1H10 2H10 1H11 2H11 1H12 2H12 1H13
The banks combined cost to income ratio improved an impressive 100bpts hoh to 44.6% at March 2013.
Virtually flat expenses both hoh and pcp confirm that the banks continued focus on all areas of expenditure is paying off.
This cost management is all the more impressive given increases in IT and regulatory costs.
A 0.2% hoh increase in staff costs reflects salary increases offset by a 1.0% hoh reduction in full time equivalent employees.

Major banks analysis – May 2013 9
Banks asset quality indicators have improved hoh.
Bad debt expense fell 17.3% hoh reflecting fewer new bad debts emerging.
Portfolios are well provisioned, with a total provision to loan ratio of 0.89% at March 2013 down 4 bps from September 2012.
Delinquencies are steady at $29b hoh and down 5.7% pcp, reflecting lower interest rates and modest household deleveraging.
Asset Quality
Impaired assets and bad debt expense
0.0%
0.5%
1.0%
1.5%
2.0%
2.5%
0.0%
1992
1993
1994
1995
1996
1997
1998
1999
2000
2001
2002
2003
2004
2005
2006
2007
2008
2009
2010
2011
2012
2013
1.0%
2.0%
3.0%
4.0%
5.0%
6.0%
7.0%
Impaired assets/gross loans & acceptances (left axis)
Bad debt charge/gross loans & acceptances (right axis)Notes: Pre 2006 AGAAP; post 2006 AIFRS.
Gross impaired assets to gross loans stand at 0.96%, down 7 bps hoh, as banks work through impaired assets and fewer new problem loans emerge.

10 Major banks analysis – May 2013
Attitudes and regulation in relation to conduct and mis-selling risk are changing quickly and have the potential to be quite profound. While this is an area where Australia has been ahead of the curve over recent years – and so spared from the worst present problems – these global trends nonetheless carry important implications for us.
We are seeing significant change in many markets, not least in the UK.
Experience in the UKThe current mis-selling experience in respect of Payment Protection Insurance (PPI) has been almost 10 years in the making and can be added to previous dark episodes of pension and endowment policy mis-selling which cost the UK insurance sector GBP15b. PPI has been a painful experience for UK banks in terms of reputation, financial cost and management time during a period of recession, credit contraction and the aftermath of the GFC. The industry has paid out approximately GBP10b since January 2011 and many expect this to rise to GBP15b. Putting this in perspective, the one year cut in UK GST of 2.5% in 2008 was estimated to have cost GBP12b. Some commentators have argued this has provided a significant fiscal stimulus to a recessionary economy as well as removing in excess of GBP150b of banks’ lending capacity. More recently, there have also been identified instances of mis-selling interest rate swaps to small business.
The UK banks’ approach to PPI was a classic example of cross-sell by finding ways to meet additional needs of existing customers. PPI provided insurance to ensure loan repayments would be made in the case of certain events, such as unemployment. It was therefore sold as a natural compliment to a loan, priced into the loan’s interest rate. In essence, the trouble was that the product pricing was both opaque and aggressive.
When concerns first arose in 2005 around mis-selling of PPI, the Financial Services Authority (FSA) applied a “light touch”, a position broadly supported by government. Consistent with this, the banks responded to the concerns from a “compliance with the rules” perspective, rather than really standing back and assessing whether they had embedded the intent of regulatory principles such as Treating Customers Fairly into the product design and sales process, and so whether they had truly met their customers’ needs.
Against that background, the Complaints Management Companies (CMCs) began using aggressive marketing and social media strategies to inform the broader public of the wide availability of compensation. Typically the CMCs charge clients 30% of redress payments.
These events were an important factor behind the decision to split the UK FSA into two new entities from 1 April 2013 – the Financial Conduct Authority (FCA), responsible for sound market functioning and appropriate protection of consumer interests, and the Prudential Regulation Authority, responsible for prudential supervision. The early indications are that the FCA will set a very different tone in these matters than the FSA. The goal-posts have moved from “is this a fair product?” to “is this product demonstrably in the customer’s best interests?”. The importance of this latter change should not be under-estimated, perhaps best summarised in FCA CEO Martin Wheatley’s commitment to “Shoot first and ask questions later”.
Conduct and mis-selling risk

Major banks analysis – May 2013 11
Conduct Risk Management Framework
The product lifecycle
Complaints
Close/ Retention
Product development and suitability
Service and Claims
Sales and Advice
Customer information and marketing
Implications for AustraliaThis is another area where the combination of a stronger regulatory framework and better behaviours from our financial institutions has spared us from excesses seen elsewhere in the world, much the same factors which underpinned our relative success through the GFC. Notwithstanding this, there have been bumps along the road, as evidenced by ASIC Enforceable Undertakings, especially in Wealth Management.
More recently, we have experienced ASIC increasing its surveillance on the marketing around products to ensure they are properly represented. Some of the challenges have been around capital-guaranteed products and the advertising around structured products.
We have also seen the recent strengthening of the legislative framework in Australia. Such examples include the Australian Consumer Credit Act (governing the selling of lending products), Future of Financial Advise (FOFA, governing financial advice quality and incentives), and the new privacy principles (governing customers’ data).
When we take a step back, there are a number of products in Australia which exhibit underlying similarities to the problematic products in the UK. Examples include the selling of payment protection insurance, swaps and structured instruments including hybrids and the provision of investment advice.
While there is not a one-for-one convergence with the UK, the UK experience nonetheless reminds us that there can be no room for complacency. There is no doubt that regulators around the world, including in Australia, are watching the wholesale changes and much higher benchmarks of acceptable behaviour in the UK with much interest. Experience tells us that higher benchmarks adopted in offshore markets do tend to filter in time to Australia. In our view, Australian bankers need to watch these trends very carefully.
In short, banks need to continue to rise above ticking off the rules and implement clear metrics around which products are appropriate for a customer, based upon three critical elements – a clear evaluation of the benefits and costs to that customer; an assessment of how effective a bank is at delivering to those (and not other) customers; and ongoing monitoring of the extent to which the
customer continues to enjoy those benefits. Compliance with applicable regulations becomes a subset of these activities. Banks are now considering the product lifecycle (see diagram) when evaluating their exposure to mis-selling risk.
We believe that the controls which mitigate mis-selling risks are closely linked to the sales and service requirements and initiatives to improve the customer experience. This makes the case for such controls all the more compelling.

12 Major banks analysis – May 2013
Customer analytics: herding stats?Harnessing customer analytics is a priority for banks everywhere, driven by a desire to improve both the customer service experience and revenue outcomes across multiple channels while reducing marketing costs. Australian banks have made significant advances in their use of analytics in recent years however many still lag the world leaders in this space.One outstanding example is the Singapore-based OCBC Bank. Its success reflects three factors:
• a genuine and robust single view of customers
• the insight strength of the analytics engine and capabilities
• efficiency of real-time delivery to the multiple customer touch-points.
In combination these strengths are ensuring that 70% of all new sales and 95% of all successfully retained “at-risk” customers are now associated with leads generated from their analytical engines. Cross-sell conversion rates across the organisation are now up around 40%, well above Australian experience.
As impressive as OCBC is, other industries are further ahead again in their use of customer analytics. Research by PwC estimates that the customer analytics opportunity for Australia’s retailing and consumer goods sector is worth $3.8b or a 10-20% increase in EBIT for supply chain participants. This figure is realised from both reduced marketing spend and cross-selling.
An example of the world class use of customer analytics in a retailing context is Amazon. Amazon increased its sales by 30% (or $3b), largely through the integration of product recommendations at every stage of its sales process from product discovery to purchase, with estimates of Amazon’s conversion to sales of on-site recommendations as high as 60%. Amazon also uses targeted
email marketing but is very disciplined in only sending out promotional emails with the highest potential profitability for their business, and in consequence email conversion rates exceed on-site recommendations.
Indeed, we believe that a core reason why Amazon is such a benchmark in analytic success is that their creed from the start has been to use analytics as the key enabler of their business rather than an end in itself. We still see plenty of instances in Australia where the emphasis is on analytics techniques rather than analytics business cases. For example, the business case should be about raising customer retention rates for a significant product line as opposed to building a capability to do CHAID decision-tree analyses.
The three factors which explain OCBC’s success point to the main challenges which most organisations have in making solid market progress on analytics: poor customer data; insufficient skill to build differentiated analytics engines; and failure to build robust lead management processes to translate the insights to customer channels. Each of these deserves separate comment.
The focus on improving customer data, particularly the single view, is gathering momentum across the Australian financial services sector. In banking, it is being given added momentum by the single-view requirements of the Financial Claims Scheme, although some institutions seem to assume that a regulatory solution can serve their marketing needs too. There is also more interest in cloud-based single view solutions to overlay legacy systems.
We previously highlighted in our May 2012 Major Banks Analysis the role of “big data” tools in the development of differentiated analytics engines. However the uncovering of insights requires more than raw computing power. “Data scientist” is the name for those who can combine the software engineering skills with statistical expertise and business savvy to ask the right question to begin with. We have seen forecasts of a 50 to 60 percent gap
in the supply of data scientists relative to demand. This means that Australian banks must compete with Facebook, Google and Amazon for talent. Some organisations are meeting this need by deploying cross-skilled teams instead of individuals and looking to grow their own data science experts from business savvy engineers and statisticians.
One further source of differentiation is a more explicit use of scientific methods in building and deploying these analytics engines. Disciplined organisations are using experimental design approaches that deliver on the build-test-refine method based on robust sample sizes. Some Australian banks have already deployed techniques like A/B testing in their marketing campaigns and others will need to catch up to remain competitive.
The final success element is delivering the leads to the customer touch-point. Here the core skill is not analytics but customer management, both in the traditional person-to-person channels and in the digital/social media channels. The analytic lead is wasted unless it changes something in relation to how a customer is treated – an outbound call from a Customer Service Officer; a contact through Facebook; or a needs-based question next time a customer transacts at a branch. Again we observe considerable variation between institutions in relation to these disciplines. Only those who master all three ingredients well will actually shift the dial on customer experience and hence buying propensity and retention.
The application of analytics for banks may begin in the customer space where interventions can quickly demonstrate a return on investment. However, banks should not stop here. Analytics can be applied to every element of a bank’s operations such as product development, risk management and talent. Ultimately analytics promises to answer the biggest question facing Australian banks today – how do they become more productive?

Major banks analysis – May 2013 13
View A genuine and robust single view of customers
Success reflects
threefactors
Insights The insight strength of the analytics engines
Actions Efficiency of real-time delivery
1
2
Major banks analysis – May 2013 13
3

14 Major banks analysis – May 2013
pwc.com.au/mba
FS Connect iPad App
For further information on articles please contact:
Download the FS Connect iPad App to find a wealth of publications, industry insights and news around the financial services sector published in Australia and globally.
Mark Hannam +61 (2) 8266 2129 [email protected]
John Studley +61 (3) 8603 3770 [email protected]
Conduct and mis-selling risk Customer analytics:
Scan the QR Code with your iPad or search FS Connect on the App Store.

Major banks analysis – May 2013 15
For further information or copies of this report, please contact:
NationalHugh HarleyFinancial Services [email protected]+61 (2) 8266 5746
SydneyStuart ScoularBanking and Capital Markets Leader [email protected] +61 (2) 8266 5498
MelbourneJohn [email protected] +61 (3) 8603 3820
BrisbaneMichael O’Donnell [email protected] +61 (7) 3257 5149
AdelaideKim [email protected] +61 (8) 8218 7407
PerthJustin [email protected] +61 (8) 9238 5240
New ZealandSam Shuttleworth [email protected]+64 9 355 8119
Sarah Clarke+61 (2) 8266 1592 [email protected]
This document is provided by PwC as general guidance only and does not constitute the provision of accounting, legal advice, tax services, investment advice, or professional consulting of any kind. The information is provided “as is” with no assurance or guarantee of completeness, accuracy or timeliness of the information and without warranty of any kind, express or implied, including but not limited to warranties of performance, merchantability and fitness for a particular purpose. In no event will PwC or its professionals be liable in any way to you or to anyone else for any decision made or action taken in reliance on the information or for any direct, indirect, consequential, special or other damages related to you or your use of information, even if advised of the possibility of such damages. Before making any decision or taking any action, you should consult a professional adviser who has been provided with all the pertinent facts relevant to your particular situation.
© 2013 PwC. All rights reserved. PwC refers to the Australian member firm, and may sometimes refer to the PwC network. Each member firm is a separate legal entity. Please see www.pwc.com/structure for further details.
Liability limited by a scheme approved under Professional Standards Legislation.
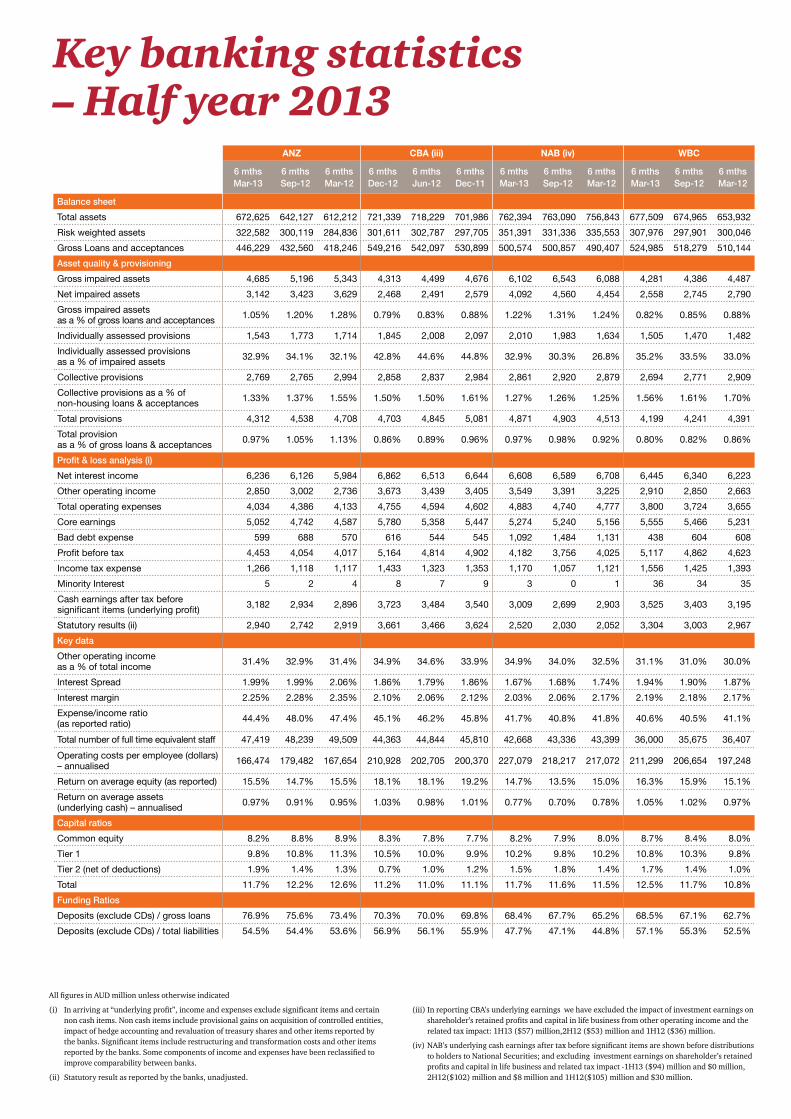
All figures in AUD million unless otherwise indicated
(i) In arriving at “underlying profit”, income and expenses exclude significant items and certain non cash items. Non cash items include provisional gains on acquisition of controlled entities, impact of hedge accounting and revaluation of treasury shares and other items reported by the banks. Significant items include restructuring and transformation costs and other items reported by the banks. Some components of income and expenses have been reclassified to improve comparability between banks.
(ii) Statutory result as reported by the banks, unadjusted.
(iii) In reporting CBA’s underlying earnings we have excluded the impact of investment earnings on shareholder’s retained profits and capital in life business from other operating income and the related tax impact: 1H13 ($57) million,2H12 ($53) million and 1H12 ($36) million.
(iv) NAB’s underlying cash earnings after tax before significant items are shown before distributions to holders to National Securities; and excluding investment earnings on shareholder’s retained profits and capital in life business and related tax impact -1H13 ($94) million and $0 million, 2H12($102) million and $8 million and 1H12($105) million and $30 million.
ANZ CBA (iii) NAB (iv) WBC
6 mths Mar-13
6 mths Sep-12
6 mths Mar-12
6 mths Dec-12
6 mths Jun-12
6 mths Dec-11
6 mths Mar-13
6 mths Sep-12
6 mths Mar-12
6 mths Mar-13
6 mths Sep-12
6 mths Mar-12
Balance sheet
Total assets 672,625 642,127 612,212 721,339 718,229 701,986 762,394 763,090 756,843 677,509 674,965 653,932
Risk weighted assets 322,582 300,119 284,836 301,611 302,787 297,705 351,391 331,336 335,553 307,976 297,901 300,046
Gross Loans and acceptances 446,229 432,560 418,246 549,216 542,097 530,899 500,574 500,857 490,407 524,985 518,279 510,144
Asset quality & provisioning
Gross impaired assets 4,685 5,196 5,343 4,313 4,499 4,676 6,102 6,543 6,088 4,281 4,386 4,487
Net impaired assets 3,142 3,423 3,629 2,468 2,491 2,579 4,092 4,560 4,454 2,558 2,745 2,790
Gross impaired assets as a % of gross loans and acceptances 1.05% 1.20% 1.28% 0.79% 0.83% 0.88% 1.22% 1.31% 1.24% 0.82% 0.85% 0.88%
Individually assessed provisions 1,543 1,773 1,714 1,845 2,008 2,097 2,010 1,983 1,634 1,505 1,470 1,482
Individually assessed provisions as a % of impaired assets 32.9% 34.1% 32.1% 42.8% 44.6% 44.8% 32.9% 30.3% 26.8% 35.2% 33.5% 33.0%
Collective provisions 2,769 2,765 2,994 2,858 2,837 2,984 2,861 2,920 2,879 2,694 2,771 2,909
Collective provisions as a % of non-housing loans & acceptances 1.33% 1.37% 1.55% 1.50% 1.50% 1.61% 1.27% 1.26% 1.25% 1.56% 1.61% 1.70%
Total provisions 4,312 4,538 4,708 4,703 4,845 5,081 4,871 4,903 4,513 4,199 4,241 4,391
Total provision as a % of gross loans & acceptances 0.97% 1.05% 1.13% 0.86% 0.89% 0.96% 0.97% 0.98% 0.92% 0.80% 0.82% 0.86%
Profit & loss analysis (i)
Net interest income 6,236 6,126 5,984 6,862 6,513 6,644 6,608 6,589 6,708 6,445 6,340 6,223
Other operating income 2,850 3,002 2,736 3,673 3,439 3,405 3,549 3,391 3,225 2,910 2,850 2,663
Total operating expenses 4,034 4,386 4,133 4,755 4,594 4,602 4,883 4,740 4,777 3,800 3,724 3,655
Core earnings 5,052 4,742 4,587 5,780 5,358 5,447 5,274 5,240 5,156 5,555 5,466 5,231
Bad debt expense 599 688 570 616 544 545 1,092 1,484 1,131 438 604 608
Profit before tax 4,453 4,054 4,017 5,164 4,814 4,902 4,182 3,756 4,025 5,117 4,862 4,623
Income tax expense 1,266 1,118 1,117 1,433 1,323 1,353 1,170 1,057 1,121 1,556 1,425 1,393
Minority Interest 5 2 4 8 7 9 3 0 1 36 34 35
Cash earnings after tax before significant items (underlying profit) 3,182 2,934 2,896 3,723 3,484 3,540 3,009 2,699 2,903 3,525 3,403 3,195
Statutory results (ii) 2,940 2,742 2,919 3,661 3,466 3,624 2,520 2,030 2,052 3,304 3,003 2,967
Key data
Other operating income as a % of total income 31.4% 32.9% 31.4% 34.9% 34.6% 33.9% 34.9% 34.0% 32.5% 31.1% 31.0% 30.0%
Interest Spread 1.99% 1.99% 2.06% 1.86% 1.79% 1.86% 1.67% 1.68% 1.74% 1.94% 1.90% 1.87%
Interest margin 2.25% 2.28% 2.35% 2.10% 2.06% 2.12% 2.03% 2.06% 2.17% 2.19% 2.18% 2.17%
Expense/income ratio (as reported ratio) 44.4% 48.0% 47.4% 45.1% 46.2% 45.8% 41.7% 40.8% 41.8% 40.6% 40.5% 41.1%
Total number of full time equivalent staff 47,419 48,239 49,509 44,363 44,844 45,810 42,668 43,336 43,399 36,000 35,675 36,407
Operating costs per employee (dollars) – annualised 166,474 179,482 167,654 210,928 202,705 200,370 227,079 218,217 217,072 211,299 206,654 197,248
Return on average equity (as reported) 15.5% 14.7% 15.5% 18.1% 18.1% 19.2% 14.7% 13.5% 15.0% 16.3% 15.9% 15.1%
Return on average assets (underlying cash) – annualised 0.97% 0.91% 0.95% 1.03% 0.98% 1.01% 0.77% 0.70% 0.78% 1.05% 1.02% 0.97%
Capital ratios
Common equity 8.2% 8.8% 8.9% 8.3% 7.8% 7.7% 8.2% 7.9% 8.0% 8.7% 8.4% 8.0%
Tier 1 9.8% 10.8% 11.3% 10.5% 10.0% 9.9% 10.2% 9.8% 10.2% 10.8% 10.3% 9.8%
Tier 2 (net of deductions) 1.9% 1.4% 1.3% 0.7% 1.0% 1.2% 1.5% 1.8% 1.4% 1.7% 1.4% 1.0%
Total 11.7% 12.2% 12.6% 11.2% 11.0% 11.1% 11.7% 11.6% 11.5% 12.5% 11.7% 10.8%
Funding Ratios
Deposits (exclude CDs) / gross loans 76.9% 75.6% 73.4% 70.3% 70.0% 69.8% 68.4% 67.7% 65.2% 68.5% 67.1% 62.7%
Deposits (exclude CDs) / total liabilities 54.5% 54.4% 53.6% 56.9% 56.1% 55.9% 47.7% 47.1% 44.8% 57.1% 55.3% 52.5%
Key banking statistics – Half year 2013