maize vca report v46 - unido
TRANSCRIPT

UNITED NATIONS INDUSTRIAL DEVELOPMENT ORGANIZATION Vienna International Centre, P.O. Box 300, 1400 Vienna, Austria
Tel: (+43-1) 26026-0 · www.unido.org · [email protected]
OCCASION
This publication has been made available to the public on the occasion of the 50th
anniversary of the
United Nations Industrial Development Organisation.
DISCLAIMER
This document has been produced without formal United Nations editing. The designations
employed and the presentation of the material in this document do not imply the expression of any
opinion whatsoever on the part of the Secretariat of the United Nations Industrial Development
Organization (UNIDO) concerning the legal status of any country, territory, city or area or of its
authorities, or concerning the delimitation of its frontiers or boundaries, or its economic system or
degree of development. Designations such as “developed”, “industrialized” and “developing” are
intended for statistical convenience and do not necessarily express a judgment about the stage
reached by a particular country or area in the development process. Mention of firm names or
commercial products does not constitute an endorsement by UNIDO.
FAIR USE POLICY
Any part of this publication may be quoted and referenced for educational and research purposes
without additional permission from UNIDO. However, those who make use of quoting and
referencing this publication are requested to follow the Fair Use Policy of giving due credit to
UNIDO.
CONTACT
Please contact [email protected] for further information concerning UNIDO publications.
For more information about UNIDO, please visit us at www.unido.org

Pulat Batirbaev, TaeYoung Kim, Rezvan Ma’ani, Ryung Shim, Jen Singer, Matt Snyder, Freda Yawson
COLUMBIA UNIVERSITY (SIPA)
FOR
THE EAST WEST MANAGEMENT INSTITUTE & UNIDO
M A Y 2 0 1 3
Maize in Rwanda: A Value Chain Analysis
2
1 Table of Contents
EXECUTIVE SUMMARY 5
1 MAIZE IN RWANDA: PROJECT OVERVIEW 8 1.1 BACKGROUND 8 1.2 OBJECTIVES 9 1.3 METHODOLOGY 9 1.4 HISTORY AND DEVELOPMENT OF MAIZE IN RWANDA 11 1.5 MAIZE VALUE CHAIN MAP 12 1.6 STAKEHOLDER ANALYSIS 15 1.7 MAIZE VALUE ADDITION DISTRIBUTION MAP 18 1.8 RWANDAN PRODUCTION AND CONSUMPTION 21 1.9 REGIONAL MAIZE PRODUCTION AND CONSUMPTION 23 1.10 GLOBAL MAIZE PRODUCTION AND CONSUMPTION 26 1.11 LOCAL, REGIONAL AND INTERNATIONAL MAIZE MARKET PRICES 28 1.12 MAIZE EXPORTS AND IMPORTS IN RWANDA 30
2 ANALYSIS OF THE MAIZE VALUE CHAIN 33 2.1 KEY CONSTRAINTS 34 2.2 SECONDARY CONSTRAINTS 40
APPENDIX 42 PROFIT DISTRIBUTION DETAIL (PRICES, RWF) 42
REFERENCES 44 BIBLIOGRAPHY 44 INTERVIEWS 45

3
LIST OF ACRONYMS
• CIP – Crop Intensification Program • COMESA -‐ Common Market for Eastern and Southern Africa (COMESA). • EAC -‐ East African Community (EAC) • EDPRS – Economic Development and Poverty Reduction Strategy • EICV -‐Integrated Household Living Conditions Survey (EnquêteIntégralesur les
Conditions de Vie des Ménages) • EWMI – East West Management Institute • GoR – Government of Rwanda • MINAGRI – Ministry of Agriculture • MINICOM – Ministry of Trade and Commerce • NISR – National Institute of Statistics Rwanda • OPV –Open Pollination Variety • PHHS – Post Harvest Handling and Storage • RAB – Rwandan Agricultural Board • SIPA – School of International and Public Affairs • SSA – Sub-‐Saharan Africa • WFP – World Food Program • UNIDO -‐ United Nations Industrial Development Organization

4
LIST OF FIGURES Figure 1: Research Methodology .................................................................................................................... 10 Figure 2: Maize Value Chain Map ................................................................................................................... 12 Figure 3: Maize Profit Distribution Map ...................................................................................................... 19 Figure 4: Processing capacity of Rwanda’s largest millers (‘000 tons per year) ....................... 20 Figure 5: Rwandan maize flour production (‘000 MT per year) ....................................................... 21 Figure 6: Opportunities for Competition – Ugandan and Rwandan Harvest Seasons ............ 22 Figure 7: Rwandan maize four consumption (‘000 MT per year) .................................................... 23 Figure 8: Rwandan tariffs on EAC maize imports (% of value) ......................................................... 24 Figure 9: EAC country tariffs on Rwandan maize exports (% of value) ........................................ 24 Figure 10: Uses of Maize in Selected Countries in 2011/12 (million MT) .................................. 26 Figure 11: Largest maize producers (2011-‐2012) (million MT) ...................................................... 27 Figure 12: Total world maize production and consumption (million MT) .................................. 27 Figure 13: Trends in International Prices (USD per MT) .................................................................... 28 Figure 14: Average monthly maize flour price per city (2010-‐2012) (USD per kg) ................ 29 Figure 15: Official Cross-‐border Trade of Unprocessed Maize in Rwanda (MT) ...................... 30 Figure 16: Official Cross-‐border Trade of Processed maize in Rwanda (MT) ........................... 31 Figure 17: Cross-‐border maize flour trade (2009-‐2012) (MT) ......................................................... 31 LIST OF TABLES Table 1: Key Stakeholders in the Maize Value Chain ............................................................................. 15 Table 2: Maize Value Add Per Kg Of Dried Maize And Improved Storage .................................... 19 Table 3: Maize Value Chain Constraints and Recommendation Summary .................................. 33

5
Executive Summary The goal of the maize value chain analysis is two-‐fold. Firstly, to create visibility of the current ‘end-‐to-‐end’ maize value chain in Rwanda, and secondly to describe the constraints limiting the development of the industry and suggested recommendations to address these. Key findings on the current status of the maize value chain include:
• Production: Maize production in Rwanda has increased by 129 percent from 175,000 tons in 2008 to 400,000 in 2011 due to crop intensification programs.
• Usage: In Rwanda, fresh maize, maize flour, and maize grits are used for food products, while maize bran is used as animal feed.
• Data: Consistent data is difficult to obtain, however it is estimated that consumption of maize flour has increased by 450 percent from 100,000 tons in 2004 to 550,000 tons in 2012.
• Formal Trade: Rwanda is a net importer of maize grain and general processed maize products, but is a net exporter of maize flour.
• Informal Trade: There is a significant informal trade in green maize between Rwanda and the DRC, however no official data exists to make a clear assessment of this activity.
• Value Addition: Most of the value addition to the value chain occurs at the agricultural level, followed by the processing stage.
Recommendations are summarized in table below and the five perhaps highest priority recommendations are as follows: Recommendation A -‐ Form MINICOM-‐MINAGRI integrated maize value chain working group to address enhance cross-‐Ministerial visibility of planning, investment and data collection. Recommendation B – Co-‐operatives can provide smallholder farmers with better access to market information and more efficiently invest in equipment and smooth income risks. Continue to strengthen existing initiatives to foster maize co-‐operatives to reduce their post-‐harvest losses, increase yields and crop quality. Recommendation C -‐ Address credit availability for both working capital and investment in the context of broader financial sector reforms. Recommendation D -‐ Explore demand for additional value-‐added maize products (e.g. grits, bran, corn oil) to diversify and increase the value of the maize industry. Recommendation E -‐ Improve enforcement of certification requirement on processors and institutional buyers to incentivize farmers to produce higher quality maize grain and millers to process at a higher quality.

6
The total list of 16 constraints with associated recommendations is as follows (prioritized recommendations are labeled A-‐E:
# Constraint Actions Taken Actions In Process
Recommendation (Future)
1 Limited cross-‐Ministerial visibility of the maize value chain.
Informal liaisons between the two ministries may exist.
A. Form MINICOM-‐MINAGRI integrated maize value chain working group to address the limited cross-‐Ministerial visibility of planning, investment and data collection.
2 High Post Harvest Losses (22 percent).
MINAGRI Post Harvest Taskforce w/ USAID exists.
MINAGRI Post Harvest Taskforce w/ USAID scheduled for termination
B. Continue to strengthen existing initiatives to foster maize co-‐operatives to reduce their post-‐harvest losses, increase yields and crop quality. Determine implications of the termination of USAID program to MINAGRI capacity.
3 Individual farmers have limited market information.
Text Messaging program exists for farmers.
4 Cooperatives have limited management and production capacity. No baseline data for quality exists.
Government support for cooperatives (incentives).
Baseline study of cooperatives in progress.
5 Limited access to long-‐term credit for cooperatives, and limited use of short-‐term credit by farmers.
Access to SACCOs have increased (farmers).
C. Address credit availability for both working capital and investment in the context of broader financial sector reforms.
6 Limited irrigation facilities and the high cost of construction of large-‐scale facilities.
Large scale construction of 9 irrigation facilities started.
7 Seeds and fertilizers subsidies are likely to be removed.
Phase-‐out plan prepared.
9 Limited product diversification.
Mix Sosoma currently produces vitamin enriched maize flour.
Minimex’s exploring enriched corn maize blends.
D. Explore demand for additional value-‐added maize products (e.g. grits, bran, corn oil, ethanol, mixed flours, corn

7
starch).
10 Limited implementation of certification standards by millers.
RBS Standards Exist, processes in place for monitoring compliance.
E. Improve enforcement of certification requirement on processors and institutional buyers.
11 Production and consumption trade data inconsistencies exist.
Commission a review and analysis of all data gathered for consolidation and standardization.
12 Limited maize farm mechanization.
Ongoing efforts to increase mechanized process.
Conduct cost-‐benefit analysis of farm mechanization for value-‐add.
13 Limited agricultural insurance mechanisms.
IFC / WB / Earth Institute insurance project being explored.
Evaluate weather index insurance (IFC-‐WB, Earth Institute).
14 Limited information about the impact of maize development on the environment.
-‐ Study environmental impact of maize farming and consider shifting maize production growth to the Eastern province.
15 Infrastructure needs impact productivity
Action plans underway for improvements
Continue to address under existing programs.
Unit (1) describes the project methodology, discusses the history and development of maize in Rwanda, maps the value chain between agricultural production, post-‐harvest processing, transportation, milling and processing, packaging, trading, the retail market and exports. Unit (2) is a detailed constraints analysis of processes and stakeholders in the maize value chain, with suggested recommendations.

8
1 Maize In Rwanda: Project Overview 1.1 Background This maize value chain analysis was completed upon request from Rwanda’s Ministry of Trade and Industry (MINICOM), the United Nations Industrial Development Organization (UNIDO) and the East West Management Institute (EWMI). The authors of this report are Master’s students at Columbia University’s School of International and Public Affairs (SIPA), and have a cumulative 24 years of work experience in management consulting, finance, international development, research and microfinance across five continents. This report will be used by UNIDO in its consultative capacity with Rwanda’s Ministry of Trade and Industry (MINICOM) to identify opportunities and associated risks for the development of the Rwandan maize industry. This exercise aims to contribute to the development of the Rwandan economy and support the ongoing activities to improve food security. In consultation with the Permanent Secretary of MINICOM, UNIDO and EWMI, maize was identified as a priority crop and selected for the research and development of a comprehensive value chain analysis. Key drivers for this include the following:
Maize is a staple crop that ensures food security in many sub-‐Saharan African countries and has the potential to do the same in Rwanda.
Maize production has increased significantly in the past six years. Analytical work on ‘end-‐to-‐end’ maize value chains in Rwanda, covering
agriculture, post-‐harvest processing, transportation, milling, packaging, trading and retail is limited.
In Sub-‐Saharan Africa (SSA), maize is a key ingredient in ensuring food security. Compared to other cereals, maize is higher yielding, lower risk, easier to process, and more versatile, with the ability to grow across agro-‐ecological conditions. Maize is consumed as a starchy base in a variety of items and provides an important source of carbohydrates, proteins, iron, minerals, and vitamin B.1 White maize has the highest demand in the region and is therefore priced higher and represents the vast majority of regional maize crops.2 SSA has historically not been a large producer of maize due to food aid from abroad, which has centered on maize and wheat. The World Food Program (WFP) has acknowledged the effects of this and has implemented local and regional procurement policies.3This has been a key driver in the increase in maize production throughout the region. In Rwanda, the economy has shown strong signs of recovery from the global recession
1TechnoServe. Addressing Food Security in Rwanda by Transforming the Maize Sector. February 2010 2Ibid 3Interview. Mashayo, Emmanuela (WFP). Mar 27, 2013

9
with an estimated growth of 7.7 percent in 2012.4. This growth can largely be attributed to expansion in the services sector, increased productivity in the agriculture sector, and increased public and private investment.5 The Government of Rwanda’s Economic Development and Poverty Reduction Strategy (EDPRS) and Vision 2020 Strategy clearly define its strategic objectives and identify interventions to achieve middle-‐income status by 2020. One of the key goals within the EDPRS strategy is to modernize subsistence agriculture through the Crop Intensification Program (CIP).6The CIP was started in 2007 to address food security and strengthen the country’s agricultural productivity. Seven priority crops were identified including maize, wheat, rice, Irish potato, beans and cassava. Under the program, a focus has been made on farm consolidation, farm inputs (seeds and fertilizers), mechanization, irrigation, and extension services on the use of inputs and improved cultivation practices.7The results on productivity have been positive with the production of maize and wheat increasing six-‐fold and Irish potato and cassava tripling. The production of rice and beans has increased by 30 percent.8
1.2 Objectives This maize value chain report for Rwanda aims to achieve the following objectives:
Create visibility of the current status of the maize value chain in Rwanda, including a flow chart, an analysis of key stakeholders, production and consumption figures, trade statistics.
Drive problem solving amongst key stakeholders at MINICOM, MINAGRI, the private sector and others.
Share high-‐level recommendations with MINICOM and MINAGRI concerning the strengthening of the Rwandan maize value chain to promote food security and economic development.
1.3 Methodology The team’s research methodology makes use of three types of research tools, an analytical framework and has three outputs. Research tools include:
Desk research: Research was completed on maize value chain best practices, as well as regional and global trends.
4 (Clover, Jenny. Rwanda Sees GDP growth hit if aid doesn’t restart. Reuters. 02/11/2012. <http://www.reuters.com/article/2012/11/02/us-‐rwanda-‐economy-‐idUSBRE8A10SL20121102>) 5Bank Group Country Strategy Paper 2012-‐2016. African Development Bank. October 2011 6 World Bank. Rwanda Overview. September 2012 <http://www.worldbank.org/en/country/rwanda/overview> 7Kathiresan, Arumugam. Strategies for Sustainable Crop Intensification in Rwanda. MINAGRI. 2011) 8Ibid

10
In-‐country interviews: Over 50 interviews were carried out with stakeholders across various stages of the maize value chain in Rwanda.
In-‐country focus groups: Discussions were facilitated with groups of maize farmers in Rwanda.
The analytical framework follows a unit (one kilogram) of dried maize through the value chain to determine opportunities for development throughout the following stages:
Agriculture and post-‐harvest Processing Retail, wholesale and exports
The outputs of the report include:
The current status of the Rwandan maize value chain Diagnostic analysis of constraints within thevalue chain Recommendations for the development of Rwanda’s maize value chain
Figure 1: Research Methodology
!"#$%&"#"'()*%+%,"-".*/01)%10,"(21"3#%
&"#"'()*%4",*/5/-/67% 80'-79)'-%:(';"3/($% <=,.=,#%
>0?)/=0,(7%10,"(21"3#%
>0?)/=0,(7%@/)=#%6(/=.#%
A=(("0,%#,',=#%/@%&3'05'0%4'1B"%C'-="%A*'10%
!1'60/#9)%/@%&3'05'0%4'1B"%C'-="%A*'10%
&")/;;"05'9/0#%@/(%,*"%
5"2"-/.;"0,%/@%&3'05'D#%4'1B"%C'-="%A*'10%
86(1)=-,=("%'05%./#,?*'(2"#,%
41--106%'05%.(/)"##106%
&",'1-%'05%"E./(,#%

11
1.4 History and Development of Maize in Rwanda Maize is sold and consumed in both fresh cobs and dried grain in Rwanda, however this report focuses primarily on dried maize and secondary products, primarily maize flour. Other secondary products include bran and grits. Due to the Crop Intensification Program (CIP), over 65 percent of Rwandan farmers now grow maize, both for household consumption and commercial sale to traders and millers.9 Rwanda is a net importer of maize grain and a net exporter of maize meal (it is a net importer of processed maize products including maize meal, animal feed, beer, and all of the other types). Since 2007, the CIP has increased production six-‐fold due to four areas of intervention:10
Distribution of Improved Inputs: Within the CIP, imported seeds from neighboring countries are distributed free of charge to farmers to increase productivity. Imported fertilizers have also been distributed through private distributors. Vouchers are available for farmers to buy the fertilizer at a 50 percent discount.11
Consolidation of land use: This involves rearranging land parcels to consolidate the use of farm holdings. Farmers in a given area are encouraged to grow a particular crop that will improve productivity. This pillar has been implemented in roughly half of all farms in Rwanda.12
Proximity to extension services: The Rwandan Agricultural Board (RAB)
coordinates the provision of extension support from seed production to post-‐harvest and consumption.13
Post-‐Harvest Handling and Storage (PHHS): This initiative focuses on identifying
gaps in community harvest and storage facilities and providing training to farmers on PHHS.14
Despite this boost in production, domestic supplies of maize have been insufficient in terms of quality standards required by the major buyers.15 This is driven largely by high moisture content and impurities. As a result, much maize continues to be imported from neighboring countries.16
9MINAGRI, 2013 10United States Department of Agriculture 11Kathiresan, Arumugam. Strategies for Sustainable Crop Intensification in Rwanda. MINAGRI. 2011 12Musabyimana, Innocent (RAB). March 2013 13Nsemgiyumva, Francois. March 2013 14Kathiresan, Arumugam. Strategies for Sustainable Crop Intensification in Rwanda. MINAGRI. 2011 15 Rwanda Post-‐Harvest Handling and Storage. March 2013 <http://www.rwandaphhs.com/?q=node/95> 16Ibid

12
1.5 Maize Value Chain Map The Maize Value Chain Map depicted in Figure 2 below can be broken down into three key stages: (a) Agricultural Production, (b) Processing, and (c) Market: Figure 2: Maize Value Chain Map
(1) Agricultural Production
Seeds: At the provincial level, local administrators estimate their necessary seed requirements and relay this information to the federal government. The government in turn purchases and distributes the seed at no cost to farmers (plans are underway to phase-‐out this subsidy). Seeds (hybrid and OPV) have historically been sourced from Zambia, Kenya, Tanzania, and South Africa however seed multiplication is now done by Rwandan cooperatives under the guidance and supervision of RAB.17 In 2012, MINAGRI was able to locally source the majority of
17Interview. Nsenguyuma, Francois. (MINAGRI). Jan 2013
!"#$%&'"($$'")%$*%+,-".+/$0+&"1$%%23/$0+&"42%56327-"860679%:"$;"<'=3+/$0-"49%+92*63"($$'">272%52"?+7@"($%32-">A+0'+"B%+60"C"12%2+&"1$%D$%+/$0"E>B11F-"8G.HB>G"E722'7FI"J"?K2"+''6/$0+&"5+&=2"$;"23$0$,63"+3/569:"*202%+92'"9K%$=*K"5+&=2"+''2'"72%56327"2*L")%$'=3/$0-"D%$327760*"-"%29+6&"4$=%32M"?2+,-"6092%562A7"
<0'N>29+6&")%$'=39"
!"#$$%&%'()*+"#$%,#+-./0%"
1
23
45+67
8$/8+#$%
9+*:
87;*
(%
<#+"6(5%&%=#+>.0;(5%%
'(0;/8;*(#$%?8@.+03%
<#+".+0%EO+P$%"C"O+0'F"
9+*7.006(5%
,#+-./%!..:0% <.+;$6A.+% 9.0;76:.%
9+*7.00*+0%%E86&&60*-")+3@+*60*F"
B+6/0%
?+#(%
,#6A.%<$*8+%C#(:%D$.(:0E%
?..+%
4(6"#$%<..:%
F+@6(5%%EQ$,27/3-"1$$D2%+/52-"$%"8G.HB>G"
;+36&69:F"
<+.0G%,#6A.%
F+@%,#6A.%
'"H*+/.:%F+@%,#6A.%
I+#:.+0"
!8H.+"#+-./0J%$#+5.%8+D#(%"#+-./0%#(:%
KG*$.0#$.+0"

13
seeds, however the remaining 25 percent was imported from Kenya, Zambia and Tanzania.18 Fertilizer: MINAGRI imports a range of fertilizers for use in farms across the country. MINAGRI identifies appropriate maize fertilizers based on annual research. Tenders are then put out to companies to import DAP (for the planting phase) and Urea (for the weeding phase).19 This fertilizer is provided to farmers for 50 percent of the cost. Plans are underway to phase-‐out this subsidy.
Pesticides: RAB relies on the private sector but also purchases a strategic stock of pesticides to control for the risk of outbreaks. Pesticides were not cited as a major input for maize production.20 Farmers: About 50 percent of Rwandan farmers are organized into co-‐operative farms (under the CIP’s land consolidation efforts) through support from MINAGRI and other stakeholders. The majority of maize farmers in Rwanda continue to rely on rainfall and low technology for maize production (only 10 to 12 percent of farms are mechanized). There are large-‐scale hillside and marshland irrigation projects underway through MINAGRI, the World Bank and DFID, however it is estimated that these have reached only approximately four percent of farmers. The target for irrigation access is 17 percent of farms by 2017.21
Farming and harvesting: The Government of Rwanda has implemented programs to increase access to mechanization through village mechanization centers, which offer selling of machinery, renting, maintenance, and training. The target for mechanization is 25 percent by 2017. 22 These centers support farmers in implementing improved agricultural practices. At harvest time, farmers keep some maize, sell some fresh maize (often to the DRC) and much is kept for sale as dried maize. The selling of fresh maize allows farmers to gain access to their field earlier to plant a new crop.23 However, since the government promotes dried maize, little data is available on the sale of fresh maize as farmers are hesitant to share this information.
Drying: Drying is done in a variety of ways from very informal methods at the farm level to formal drying facilities. It is estimated that 60 percent of farmers dry their crops at large-‐scale drying facilities provided by MINAGRI through cooperatives.24 The remaining farmers dry maize in trees or other informal methods with or without a tarp (provided by USAID) for protection. The maize is then threshed
18Interview. Gervais, Ngerero (RAB). March 2013 19Interview. Murkozi, Charles (MINAGRI). Mar 2013 20Ibid 21Interview. Nzeyiman, Innocent (MINAGRI). Mar 2013 22Ibid 23Interview. Smith, Bruce (USAID/MINAGRI). March 2013 24Field Visit, Nasho. March 2013

14
either manually or with machines. The dried maize is then stored in bags with and without insecticide and sold to traders.25
(2) Processing
Traders: Traders serve as middlemen both in the delivery of maize from farmers to millers as well as the delivery of flour from millers to the marketplace or institutional buyers. There are a range of larger traders in the Rwandan marketplace including ENAS, Morenzi, Tubura/One Acre Fund, and Nsekuye.26 Some of these organizations also engage in further drying and packaging depending on buyer requirements. The remaining individual traders are smaller operators with one or two trucks.
Processors: Maize is processed by a range of milling companies who act as both processors and traders. Some purchase dried maize from domestic cooperatives and traders while others import from neighboring countries. Rwanda’s largest miller, Minimex, was founded in 2002andis the only miller to be certified by the Rwanda Bureau of Standards.27This certification supports their institutional sales. A second group of smaller millers produce the majority of maize annually and are organized into a cooperative called AMIRWA.28 Outside of these larger millers, small-‐scale milling facilities exist at the local level to assist farmers with subsistence needs. Silos and grain bags for storage are provided by MINAGRI as well.29
End Products: The milled maize is then produced into three key end-‐products:
1. Maize flour (and blends): Maize flour is the main product however there has been an increased demand for maize flour blends recently. These blends, which are enhanced with vitamins and minerals, have been developed by Sosoma.30
2. Bran. The outer coat of the grain, bran, is a byproduct of the milling process, and is sold as animal feed and used as biomass for energy.31
3. Grits: Another byproduct in the milling process, grits, can be used in beer
production. Minimex has a contract to sell this at the same price as maize flour to Heineken.32
25 Jean Marie (USAID). March 2013 26Rutayisire, Mark (ENAS). March 2013 27Mansell, Claude (MINIMEX). March 2013 28AMIRWA interview, March 2013 29AMIRWA interview, March 2013 30Thedee (Sosoma). March 2013 31Nsemgiyumva, Francois (MINAGRI). Jan 2013 32 Jean Marie (USAID). March 2013

15
(3) Market
Institutional Buyers: The main institutional buyer of dried maize and maize flour is WFP. Additional buyers include schools, and prisons that don’t require the high quality and certification of WFP. Market: The three end products are sold to markets including supermarkets, large urban markets, wholesalers and through informal markets.33
1.6 Stakeholder Analysis There are a number of stakeholders throughout the value chain, however about 20 key players have been identified below. These stakeholders vary from governmental actors, to private companies and farmers at the village level.
Table 1: Key Stakeholders in the Maize Value Chain
STAKEHOLDER ANALYSIS
Stakeholder Description Role in the Maize Value Chain Key Constraints/ Challenges
GOVERNMENT / ORGANIZATIONAL LEVEL
Ministry of Agriculture
Ministry overseeing agricultural development.
Provides training for farmers, subsidizes inputs, communicates price information, manages strategic grain reserve, and oversees irrigation and mechanization transformation
Changing farmer behavior, inter-‐agency communication
Ministry of Trade and Industry
Ministry overseeing industrial development and trade
Promotes exports of maize, provides loans to public-‐private millers.
Inter-‐agency communication.
Rwandan Development Board
Oversees Rwandan Development across several sectors
Conducts parallel agricultural programs to MINAGRI
Rwandan Bureau of Standards
Regulatory body for industry. Sets regulatory standards for maize millers
Limited capacity to carry-‐out certification
33According to the USAID report, “Rwanda Cross-‐Border Agriculture Analysis”, the huge informal trade exists between the neighboring countries, such as Rwanda, Uganda, Burundi, DR Congo, and Tanzania. The data in the report says that Rwanda’s total informal exports for unprocessed maize between these countries are 4,681 MT, and for processed maize are 11,574 MT.

16
Rwandan Grain and Cereal Corporation
Public-‐private partnership for maize storage.
Purchases maize kernels from farmers to stabilize prices. Will manage strategic maize reserve in future.
Low purchasing capacity
Rwandan Business Development Fund
Small and Medium Business Credit Provider.
Works with financial institutions to guarantee loans for small and medium businesses.
Rwandan Cooperative Authority
Certifies farmer, miller, and trader cooperatives
Certifies farmer, miller, and trader cooperatives
Insufficient staff to regulate cooperatives.
Bilateral Aid Organizations USAID, DFID
USAID assists MINAGRI in technical training and development strategies. Promotes better post-‐harvest storage and farmer marketing through "Sell More for More" program.
Farmers
Farmer Cooperatives
Cooperatives of farmers consolidating land for joint crop production. May or may not have government assistance
Producers of maize. Vary by maturity and market linkage. Produce kernels for seed and milling.
Poor post-‐harvest storage, erosion.
Individual Farmers
Farmers on non-‐consolidated land
Producers of maize for milling and seed. Receive less training from government, may or may not use fertilizer.
Poor post-‐harvest storage, erosion, transportation problems, poor market linkage.
Millers& Traders
AMIRWA
Cooperative of several small-‐scale millers located throughout Rwanda
Largest milling association in Rwanda (400,000 metric tons milled per year). Mill with simple machines, buy kernels from traders and local farmers. Mill maize into flour and residue.
Difficulty reliably acquiring maize for milling. Lack of operating capital. High rent in Kigali.
Minimex Miller
Largest single milling plant in Rwanda (48,000 metric tons milled per year). Possesses most advanced milling facilities, mills maize into flour, grits, and bran. Sells to institutional buyers-‐-‐WFP, prisons-‐-‐and consumers. Operates storage facility in Eastern Rwanda.
Lack of working capital. Not milling at full capacity. Difficulty finding mature farming cooperatives.
Sosoma Multiproduct miller
Relatively low milling capacity (1,825 metric tons per year). Mix maize with other products to produce mixed flours. Purchase from farmer cooperatives
Lack of supply from farmer cooperatives

17
Traders34
Small Traders Trader
Provide transportation to/from regional trading centers and farmers. These individual traders work with trucks, bikes, and by foot.
High fuel costs and road quality.
Morenzi Medium-‐size trader
Outsources milling to Minimex. Sells to WFP, GoR, and traders. Has fleet of six trucks for transportation. Outsources milling to Minimex.
Poor quality maize due to poor post-‐harvest storage.
Nsukye Medium-‐size trader
Medium size miller. Possesses a few trucks for transportation. Sells to MINAGRI, WFP, and exports to Uganda, Burundi, and DRC.
Poor quality maize due to poor post-‐harvest storage.
ENAS Medium-‐size trader
Collects maize from farmers and smaller traders and delivers to millers. Possesses largest maize warehouse in Rwanda. Offers some training to farmers.
Difficulty acquiring quality maize kernels, especially from Uganda. Difficulty up-‐scaling storage facility.
FINANCE
Commercial Banks
Access Bank, Banque Populaire, Ecobank, and others.
427 branches providing loans to farmer cooperatives and millers. Typical 18% interest rate.
Assessing creditworthiness
Microfinance Institutions
Equity Bank, Urwego Opportunity Bank, Vision Finance Company
Provides loans to farmer cooperatives and some instruction. There are 22 MFIs publicly reporting which serve 40.2 million clients.35
Community-‐level savings and credit groups.
Savings and Credit Co-‐operatives (SACCOS) and informal savings groups.
1 million Rwandans served through a strengthened network of SACCOs. Provides savings and loan services to individual farmers at local level. Widespread through country.Over 100,000 are served through informal savings groups. 36
Institutional Buyers World Food Program
UN Food Distributor
Buys maize flour from MINIMEX and other millers.
Rwandan Government
Schools and prisons Purchases dried maize and maize meal
34 Other traders include Tubura (formerly of One Acre Fund), and SOPAR. 35 MIX Market. Microfinance in Rwanda: Country Profile. < http://www.mixmarket.org/mfi/country/Rwanda> (Savings Groups Information Exchange, 2013) 36 Savings Groups Information Exchange. <http://savingsgroups.com/projects/search/country/206>

18
1.7 Maize Value Addition Distribution Map Each segment of the value chain adds value to the original agricultural output. All of the following data was collected during field research in March 2013, and reflects prices at that time. (1) Agricultural Production: Farmers input cost was 23 RWF/kg, which includes the cost of fertilizer and seeds. The average sale price of dried maize was 200 RWF per kg, giving the typical farmer an average of 177 RWF/kg of profit, which is also ‘value addition’ to the economy. (2) Trading: Small traders purchase dried maize for an average of 200 RWF/kg and have the additional cost of petrol, labor and trucks to collect the dried maize and transport it to millers for processing. This costs an average of 10 RWF/kg, so the total cost to traders is 210 RWF/kg. Traders sell dried maize to millers for about 220 RWF/kg, giving the traders an average of 10 RWF/kg of profit, a further ‘value addition’ to the economy. (3) Processors: Millers and processors purchase the dried maize from small traders for 220 RWF/kg but then have additional fixed and variable costs including labor, overhears, machinery, energy and packaging material. This costs an average of 10 RWF/kg, so the total cost to processors is 230 RWF/kg. Millers and processors sell maize flour (and other products like bran and grits) for an average of 260 RWF/kg, giving the processors an average of 30 RWF/kg of profit.

19
Figure 3: Maize Profit Distribution Map37
Table 2: Maize VCA Value Add Per Kg Of Dried Maize And Improved Storage
Farmer/Miller Value Addition per kg of dried maize
Additional profit from improved storage
Farming Cooperative (sample) 182 RWF 12 RWF
Individual Farmer (typical case) 177 RWF 13 RWF
MINIMEX(milling) 70 RWF 0 RWF
Amirwa 30 RWF 0 RWF
Different farmer types add varying amounts of value to each kilogram of maize. Co-‐
37Input costs do not match revenue from previous step due to additional inputs: for example gasoline for traders or electricity for millers.
!"#$%&"''()*+&'(,-.(/$)*+&0%.&1(#*2."3&*4&3"(5%&6&780(9"#&:",%&
;<&
=>>&;??&
@+0$-&:*,-& !"#$%&A''()*+&
B%C%+$%&
;<?&
<?&
;D?&&
@+0$-&:*,-& !"#$%&A''()*+&
B%C%+$%&
;=?&
=?&
;;?&
@+0$-&:*,-& E.*F-& B%C%+$%&
G=?&G=?&
G=?& !""#$%&'()*%+,+)#&-./,0//&)1'(2/)*3'#&)+,'4/+)
A2.(9$#-$."#&0.*'$9)*+& 7."'(+2& E.*9%,,(+2&
!"#$%&A''()*+&H(,-.(/$)*+&0I12&&50'&"'&)67'&*+)
6'78/7+)'"")596:;;)<=>4))
?7'"/7+)'"")596:@)<=>4))
A7%*/++%7+)'"")596B@)<=>4))

20
operative farmers add the most value with an average of 182 RWF/kg. The farmers we visited had access to excellent irrigation facilities; good drying stations, used DAP fertilizer, and had relatively low levels of post-‐harvest losses. In contrast, most individual farmers do not use fertilizer, had no access to irrigation, and experienced post-‐harvest losses around 24 percent.38 Post-‐harvest losses were often cited as a major loss to farmer’s incomes. A 5 percent decrease was simulated in post-‐harvest losses for both farmers and found a 12 RWF value addition for the cooperative farmer and a 13RWF value addition for the individual farmer per kilogram. Minimex adds 70 RWF of value to each kg of dried maize. AMIRWA, the largest maize miller co-‐operative adds 30 RWF per kg. This is largely due to the fact that Minimex produces certified high quality flour and produces and sells more expensive maize products such as maize grits, while AMIRWA produces only flour. Minimex is currently not operating at full capacity and there is a great opportunity to improve the value addition of Rwandan maize by increasing production at Minimex. However, as Minimex has currently exhausted the domestic demand for grits, it will need to find international buyers or alter the mix of maize products it produces. The current mixture of maize products is reflected in Minimex’s value addition above.39 All of the data above was obtained through interviews at the time of our field visits in January and March 2013.
Figure 4: Processing capacity of Rwanda’s largest millers (‘000 tons per year)
Source: MINAGRI, 2009 38Nasho visit, March 2009 39AMIRWAand Minimex interviews. March & January 2013.
0
10
20
30
40
50
60
Minimex Coamv Maiserie SOPAR Duhamic Adri

21
1.8 Rwandan production and consumption Production Total maize production has increased dramatically since the introduction of the Crop Intensification Program (CIP), from 175,000 MT40 in 2008 to 400,000 MT fresh maize produced in 201141; with 2012 estimated at a record of 575,000 MT.42 The chart below clearly shows the impact of the CIP in 2007, after which production increased dramatically. Production had been historically low due to the relatively recent introduction of maize and the gradual change in eating patterns towards maize (and away from other crops like beans, potatoes, cassava, and bananas). It is important to note that although minimal, there is a data inconsistency in Rwanda’s maize production across entities. For instance, the United States Department of Agriculture estimates production around 525,000 MT per year, whereas USAID estimates around 575,000 MT based on MINAGRI’s data.43
Figure 5: Rwandan maize flour production (‘000 MT per year)
Source: United States Department of Agriculture
Maize is grown throughout Rwanda, although there are some areas more suited to production. The CIP identified the Eastern Province for its’ flatter topography as the best 40 Metric Tons 41Rwanda Post-‐Harvest Handling and Storage. March 2013 <http://www.rwandaphhs.com/?q=node/95> 42Nsemgiyumva, Francois. MINAGRI. January 2013. 43 Rwanda Cross-‐Border Agricultural Trade Analysis, USAID February 2013. Due to the fact that the consumption data from USAID is not a time-‐series data and only covers the year 2012, this report uses the production/consumption data from the U.S. Department of Agriculture.
0
100
200
300
400
500
600
2004 2005 2006 2007 2008 2009 2010 2011 2012

22
location for large-‐scale development.44 Maize is produced in three seasons in Rwanda.45The first season runs from September to February when most of the maize is grown (75 percent). The second is from March to June when less maize is grown (20-‐25 percent) as fields are often interchanged for other legumes. The last season, July to September, is the driest season and the season when little maize (5-‐10 percent) is produced. Due to these seasonal production variations, Rwandan maize is competitive with Uganda during particular periods of the year – specifically the months of January, February, May, June and July (see Figure 18).46
Figure 6: Opportunities for Competition – Ugandan and Rwandan Harvest Seasons
Source: FEWS NET and USAID, 2010
Consumption With the growing maize demand in the country and persistent food insecurity concerns, maize is an important crop in that it has the ability to address not only food security, but income for individual farmers. Maize consumption has consistently grown according to the United States Department of Agriculture, with total maize consumption in Rwanda increasing from 100,000 MT per year in 2004 to 550,000 MT in 201247.
46 Going Local. Agri-‐Profocus, Janna van Der Laan, January 2011 47United States Department of Agriculture. 2013.
Ugandan maize season
Rwandan maize season

23
Figure 7: Rwandan maize four consumption (‘000 MT per year)
Source: United States Department of Agriculture 1.9 Regional Maize production and consumption Regional Production Rwanda is a relatively small maize producer in the East African region48. It shares borders with four countries (Uganda, Tanzania, Burundi, and Democratic Republic of Congo) and is integrated in the regional East African Community. Two trade agreements dominate East Africa’s regional trade system. The first is the East African Community (EAC) and the second is the Common Market for Eastern and Southern Africa (COMESA). Food can flow relatively freely across the borders within the Eastern African Customs Union, which was established in 2005, although there are still some non-‐tariff trade barriers. Free flow of goods also applies to intra-‐regional trade although more exceptions apply, including a list of sensitive goods such as maize, wheat, and milk that are excluded from the tax exemption.49
48Lalui, Armin, External Trade Department, MINICOM. March 2013. 49 Comprehensive Food Security and Vulnerability Analysis and Nutrition Survey, World Food Programme. December 2012.
0
100
200
300
400
500
600
2004 2005 2006 2007 2008 2009 2010 2011 2012
24
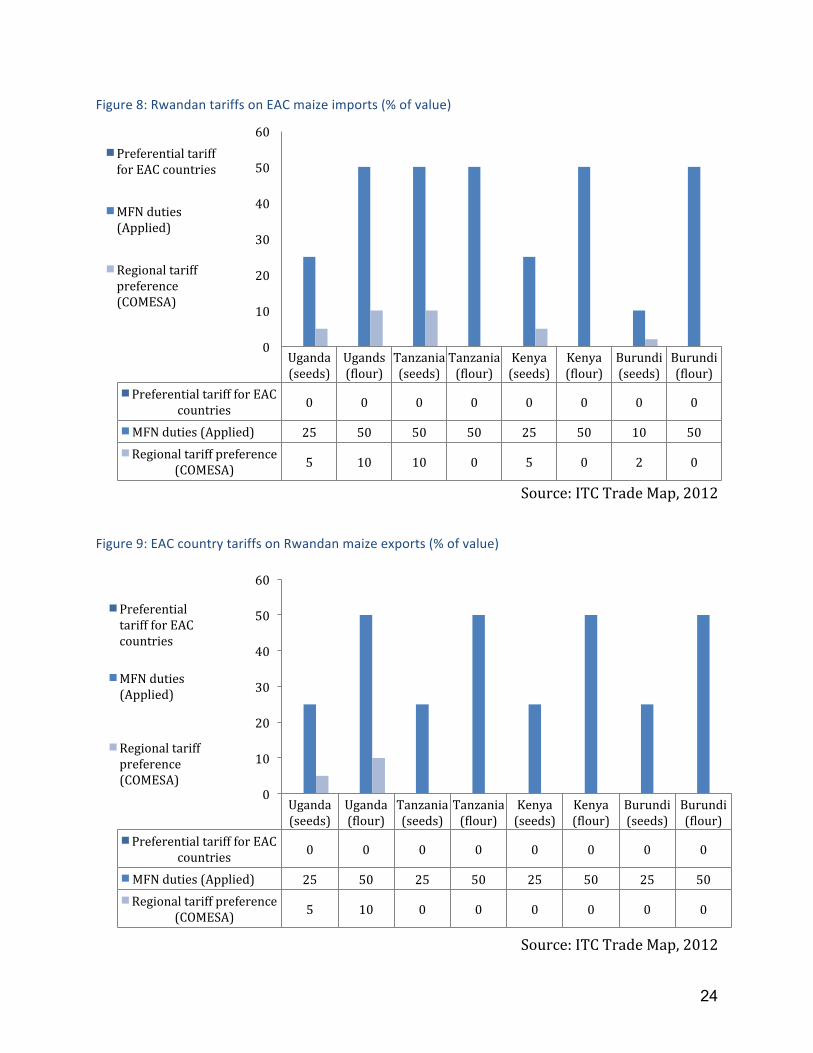
Figure 8: Rwandan tariffs on EAC maize imports (% of value)
Source: ITC Trade Map, 2012
Figure 9: EAC country tariffs on Rwandan maize exports (% of value)
Source: ITC Trade Map, 2012
Uganda (seeds)
Ugands (ulour)
Tanzania (seeds)
Tanzania (ulour)
Kenya (seeds)
Kenya (ulour)
Burundi (seeds)
Burundi (ulour)
Preferential tariff for EAC countries 0 0 0 0 0 0 0 0
MFN duties (Applied) 25 50 50 50 25 50 10 50 Regional tariff preference
(COMESA) 5 10 10 0 5 0 2 0
0
10
20
30
40
50
60 Preferential tariff for EAC countries
MFN duties (Applied)
Regional tariff preference (COMESA)
Uganda (seeds)
Uganda (ulour)
Tanzania (seeds)
Tanzania (ulour)
Kenya (seeds)
Kenya (ulour)
Burundi (seeds)
Burundi (ulour)
Preferential tariff for EAC countries 0 0 0 0 0 0 0 0
MFN duties (Applied) 25 50 25 50 25 50 25 50 Regional tariff preference
(COMESA) 5 10 0 0 0 0 0 0
0
10
20
30
40
50
60
Preferential tariff for EAC countries
MFN duties (Applied)
Regional tariff preference (COMESA)

25
There is no maize tariff between EAC member states. However, all states impose Most-‐Favored Nation (MFN) duties of either 25 percent or 50 percent, along with COMESA regional tariffs around 5 to 10 percent on maize seeds and flour (for some)50.In East Africa, Tanzania is the largest maize producer (average production: 4.7 million MT/year), followed by Kenya (2.7 million MT/year), Uganda (2.4 million MT/year), Rwanda (0.2 million MT/year), and then Burundi (0.1 million MT/year)51. To satisfy regional demand, maize has become one of the most traded commodities into and across East Africa. For example, the monetary value of the maize traded within the EAC has steadily increased from USD 13 million (2009) to USD 21 million (2011).52 Regional Trade The nature of the regional maize trade has varied depending on the direction of trade and the trading partner. There is significant informal cross-‐border trade about which there is limited data. As far as formal trade is concerned, the major external source of maize is Uganda (88 percent of all imports), followed by Tanzania (9 percent, mainly as grain) and Kenya. The main destinations of Rwanda’s exported maize are the DRC (69 percent of all exports, mainly maize meal) and Burundi.53 The stakeholders of regional trade in maize and maize meal include small informal traders who carry no more than 100 kg of maize meal per day across the border to commercial importers who purchase as much as 20,000 MT. 54 Both maize and maize meal is occasionally exported from Rwanda to Burundi and Uganda through formal and informal channels. The cross-‐border trade reflects the lack of barriers to trade at these crossing points, so that the trade is highly dependent on local demand and supply55. The majority of formally traded maize meal in Uganda and Tanzania is produced using roller-‐milling techniques. This produces two grades of maize meal (generally designated No.1, No.1.5 or No.2). The finest grade has an extraction percentage of just 60 percent, while the second grade is higher at 70 percent. By contrast, less than 20 percent of the maize meal produced in Rwanda is of this quality. Instead it is mainly produced by hammer mills, which can extract 90 percent or more of the grain as flour, albeit of lower quality.56 The cost of producing meal through a hammer mill is at least 22 percent less than producing using a second grade roller meal57. The result is that commercially imported maize meal from Uganda and Tanzania is less competitive in the Rwandan market, which is dominated by hammer mill production.
50 ITC Trade Map, 2012. 51 EAC Study on the Review of the Common External Tariff Rates on Sensitive Items in the Partners States, MINICOM. March 2013. 52Lalui, Armin, External Trade Department, MINICOM. March 2013. 53Rwanda Cross-‐Border Agricultural Trade Analysis, USAID. February 2013. 54Ujeneza, Noel, IFDC. March 2013. 55Rwanda Cross-‐Border Agricultural Trade Analysis, USAID. February 2013. 56Rwanda Cross-‐Border Agricultural Trade Analysis, USAID. February 2013. 57Rwanda Cross-‐Border Agricultural Trade Analysis, USAID. February 2013.

26
1.10 Global Maize Production and Consumption Maize is traded as a staple crop for food, for animal feed and for industrial use. Most of the increase in world maize production during the past decade can be attributed to rapid production expansion in Asia. Asian maize production grew by nearly 35 percent during the past decade, accounting for almost 30 percent of the global increase.58 Both area and yield increases contributed to this high level of growth, with China making the most significant advances. It has contributed to as much as 60 percent of the total gains in Asian maize production over the past decade.59 The chart below shows the differences in the use of maize (food, industrial, and feed) by large-‐scale producers in different regions. In 2011/12, a majority of the countries used the biggest portion of maize for animal feed, but the United States used the largest part of maize for industrial purposes.60 Among the major maize producers, developing countries such as Argentina and Brazil tend to use maize mainly for animal feed and food. In these regions, a larger percentage of land area is dedicated to planting white maize, which is used for food consumption.61 However, developed countries such as the USA and EU states, generally use more maize for industrial purposes than developing countries.
Figure 10: Uses of Maize in Selected Countries in 2011/12 (million MT)
Source: Grain Market Report, International Grains Council, March 2013
Annual world production of maize in 2013 is forecasted around 860 million MT.62The United States alone produces over 40 percent of the world’s supply, followed by China and
58Abbasian, FAO 2010 59Abbasian, FAO 2010 60 International Granis Council, March 2013 61Addressing Food Security in Rwanda by Transforming the Maize Sector, Technoserve. Feb. 2010 62World Grain Report.International Grains Council,March 2013
0 50 100 150 200 250 300
Argentina
Brazil
EU
USA
Argentina Brazil EU USA Food 0.3 3.8 4.2 5.2 Industrial 1.4 0.8 11 157.7 Feed 4.7 42 46.7 115.5

27
about 65 percent to 75 percent of total worldwide maize production is yellow maize, which is primarily used for animal feed, but in the developing world, maize is still a significant part of the human diet.63
Figure 11: Largest maize producers (2011-‐2012) (million MT)
Source: Grain Market Report, International Grains Council, March 2013
Figure 12: Total world maize production and consumption (million MT)
Source: Grain Market Report, International Grains Council, March 2013
63Addressing Food Security in Rwanda by Transforming the Maize Sector, Technoserve. Feb. 2010
23.8
57.4
55.8
10.9
22.8
313.9
192.8
Argentina
Brazil
EU
South Africa
Ukraine
USA
China
0 50 100 150 200 250 300 350
720 740 760 780 800 820 840 860 880 900
2008/09 2009/10 2010/11 2011/12 2012/13 (Feb) 2013/14 (Mar)
Production Consumption

28
The demand for maize in developing countries in 2020 is estimated to exceed the demand for both wheat and rice.64 On average, per capita consumption of maize in urban areas is lower than in rural areas, primarily due to the higher diversity of food substitutes like rice and bread, but the maize farms in Western and Central Africa increased from 3.2 million hectares in 1961 to 8.9 million hectares in 2005, leading to a production increase from 2.4 million MT to 10.6 million MT, and this dramatic increase was almost exclusively driven by area expansion, not productivity increases – in fact, the average yield of maize production has remained very low in sub-‐Saharan Africa (approximately 1.3 MT per hectare) compared to those in developed countries (e.g., 8.6 MT per hectare in the U.S., 7.8 in Egypt, 5.0 in China).65 1.11 Local, Regional and International Maize Market Prices The international price of maize has increased by 100 percent in past five years. In December 2008, the price was near USD $163 per MT, but in December 2012, it was USD $329 per MT. A rapid increase of international prices occurred between June 2010 and March 2011.66
Figure 13: Trends in International Prices (USD per MT)
Source: International maize price fluctuations, WFP, Aug. 2012
64Cereal Knowledge Bank, International Rice Research Institute 65Addressing Food Security in Rwanda by Transforming the Maize Sector, Technoserve. Feb. 2010 66Maize price data based on U.S. Department of Agriculture, maize monthly price, IndexMundi

29
In the East African Community, imports of maize from Uganda and Tanzania are driven by lower wholesale prices, reflecting lower production costs. Although transport costs are substantial from the market in Mwanza (Tanzania) to Kigali (USD $65 per MT), these costs are generally less than the product price differential.67 Imports from Tanzania therefore remain feasible for most of the year. For Kabale (Uganda), however, prices are not only lower than those of Mwanza, but transport costs are lower still. Imports of maize from Kabale therefore remain viable through the year.68
Figure 14: Average monthly maize flour price per city (2010-‐2012) (USD per kg)
Sources: FAO, InfoTrade Uganda; Rwanda eSoko; WFP
Average retail prices of maize flour in Rwanda, between 2010-‐2012 are higher than neighboring countries. The reasons for this are not clear and may include the fact that the exchange rate of Rwanda is relatively overvalued compared to the other countries.69 Localized trade is subject to exchange rate fluctuations, which can favor the movement of maize in one direction or the other. Cross-‐border trade of this nature is common in Burundi and Uganda where areas adjacent to Rwanda are highly populated and share similar agro-‐ecological zones.70
67Rwanda Cross-‐Border Agricultural Trade Analysis, USAID. February 2013. 68Rwanda Cross-‐Border Agricultural Trade Analysis, USAID. February 2013. 69Lalui, Armin, External Trade Department, MINICOM. March 2013. 70Lalui, Armin, External Trade Department, MINICOM. March 2013.
0.2
0.25
0.3
0.35
0.4
0.45
0.5
0.55
0.6
Jan Feb Mar Apr May Jun Jul Aug Sep Oct Nov Dec
Kigali (Rwanda)
Bujumbura (Burundi)
Goma (DRC)
Mwanza (Tanzania)
Kabale (Uganda)

30
1.12 Maize Exports and Imports in Rwanda Both imports and exports of maize grain have grown steadily since 2009, with Rwanda remaining a net importer of maize grain and a net exporter of maize meal (it is a net importer of total processed maize products including maize meal, animal feed, beer, and others). Most of the imports are grains, which are then processed and milled in Rwanda.71Most countries in Africa are importers of maize. In recent decades, to satisfy growing consumption demand, SSA has become increasingly reliant on grain imports, which now account for at least 20 percent of the region’s supplies. Since the liberalization of trade in the 1980s and 1990s, the affordability of these grain imports have become sensitive to world prices. World prices have increased in recent years due to competition and reduced supply. This dependency, plus the region’s inability to reliably produce and distribute food, has exacerbated the food insecurity situation for half of the region’s population72. There is an undeveloped market for quality maize seed in neighboring countries, especially in Uganda and Tanzania (the top two exporters of maize to Rwanda). Rwanda imports a substantial and consistent amount of maize grain and meal from Uganda and, to a lesser extent, Tanzania.
Figure 15: Official Cross-‐border Trade of Unprocessed Maize in Rwanda (MT)
Source: Rwanda Cross-‐Border Agricultural Trade Analysis, 2013, USAID
71Nsemgiyumva, Francois, MINAGRI. January 2013. 72Addressing Food Security in Rwanda by Transforming the Maize Sector, Technoserve. Feb. 2010
149 1820 1521 1732
44532
114181
64339 64990
0
20000
40000
60000
80000
100000
120000
2009 2010 2011 2012
MT
Total Export Total Import

31
Figure 16: Official Cross-‐border Trade of Processed maize in Rwanda (MT)
Source: Rwanda Cross-‐Border Agricultural Trade Analysis, 2013, USAID
Figure 17: Cross-‐border maize flour trade (2009-‐2012) (MT)
Source: Rwanda Cross-‐Border Agricultural Trade Analysis, 2013, USAID
150
2510
666 1664 1265
10860
2881 2859
0
2000
4000
6000
8000
10000
12000
2009 2010 2011 2012
Total Export Total Import
-‐15000
-‐10000
-‐5000
0
5000
10000
15000
Burundi DRC Tanzania Uganda
2009 2010 2011 2012

32
The WFP’s Purchase for Progress (P4P) Program, established in 2008, has supported domestic production to decrease imports from the US and other countries. WFP has acted as a catalyst for supporting domestic maize farmers and intervenes from the post-‐harvest process onwards. In 2012 they purchased 1,200 MT of maize for distribution in Rwanda only.73 WFP also runs the Forward Purchase Facility (FPF), where maize is purchased regionally at a low price and sold to other countries for emergency preparedness. Rwanda is a supplier in this effort and contributed to the total 9,600 MT purchased by WFP. WFP Rwanda is a regional office for this program in partnership with MINAGRI74. Unofficial Trade In general, the eastern portion of the DRC is currently Rwanda’s largest regional export market, comprising more than two million consumers who are not well-‐supplied by their own domestic agricultural sector. The DRC has a high degree of urban concentration in the areas near Rwanda’s border, and therefore represents the largest cross-‐border export market for Rwandan products. Having grown at an average rate of 50 percent since 2002, the DRC now consumes 70 percent of formal exports and 80 percent of informal exports from Rwanda.75MINICOM estimates that the market potential of the region is $1.1 billion in North Kivu and $1.2 billion in South Kivu, with $387 million within Goma and Bukavu alone. Goma, in North Kivu, has an approximate population of 800,000 people and Bukavu, in South Kivu, 1 million.76 Similarly, porous borders between Rwanda and Uganda and Burundi indicate short-‐term seasonal price fluctuations within the region. Informal traders in the border regions carry maize and travel as far as 30km on foot or by bicycle to purchase and sell77. This can be a lucrative business, but it is based on seasonal price differences between the local markets in Rwanda and its neighboring countries, and is therefore intermittent.78Unfortunately, there is no official data or studies on the amount of this unofficial trade along the border. Almost all maize and maize meal entering Rwanda has been formally imported, with less than estimated 0.5 percent entering through informal channels. Conversely it is estimated that 54 percent of all exports have been through informal channels. Where informal trade is concerned, the DRC has the highest, with around 61 percent of all trade occurring informally.79
73Sheeran, Josette, WFP Rwanda, March 2013. 74Sheeran, Josette, WFP Rwanda, March 2013. 75Rwanda Cross Border Agricultural Trade Analysis, USAID/EAT. 2013. 76 Addressing Food Security in Rwanda by Transforming the Maize Sector, Technoserve. February 2010 77Lalui, Armin, External Trade Department, MINICOM. March 2013 78Rwanda Cross Border Agricultural Trade Analysis, USAID/EAT. 2013. 79Rwanda Cross Border Agricultural Trade Analysis, USAID/EAT. 2013.

33
2 Analysis of the Maize Value Chain In an analysis of constraints to the development of the maize in Rwanda, the team has identified a number of challenges and opportunities. The following table summarizes all constraints, activities in progress and future recommendations identified, however key priorities (recommendations A-‐E) are discussed in detail below.
Table 3: Maize Value Chain Constraints and Recommendation Summary
# Constraint Actions Taken Actions In Process
Recommendation (Future)
1 Limited cross-‐Ministerial visibility of the maize value chain.
Informal liaisons between the two ministries may exist.
A. Form MINICOM-‐MINAGRI integrated maize value chain working group to address the limited cross-‐Ministerial visibility of planning, investment and data collection.
2 High Post Harvest Losses (22 percent).
MINAGRI Post Harvest Taskforce w/ USAID exists.
MINAGRI Post Harvest Taskforce w/ USAID scheduled for termination
B. Continue to strengthen existing initiatives to foster maize co-‐operatives to reduce their post-‐harvest losses, increase yields and crop quality. Determine implications of the termination of USAID program to MINAGRI capacity.
3 Individual farmers have limited market information.
Text Messaging program exists for farmers.
4 Cooperatives have limited management and production capacity. No baseline data for quality exists.
Government support for cooperatives (incentives).
Baseline study of cooperatives in progress.
5 Limited access to long-‐term credit for cooperatives, and limited use of short-‐term credit by farmers.
Access to SACCOs have increased (farmers).
C. Address credit availability for both working capital and investment in the context of broader financial sector reforms.
6 Limited irrigation facilities and the high cost of construction of large-‐scale facilities.
Large scale construction of 9 irrigation facilities started.
7 Seeds and fertilizers Phase-‐out plan

34
subsidies are likely to be removed.
prepared.
9 Limited product diversification.
Mix Sosoma currently produces vitamin enriched maize flour.
Minimex’s exploring enriched corn maize blends.
D. Explore demand for additional value-‐added maize products (e.g. grits, bran, corn oil, ethanol, mixed flours, corn starch).
10 Limited implementation of certification standards by millers.
RBS Standards exist, processes in place for monitoring compliance.
E. Improve enforcement of certification requirement on processors and institutional buyers.
11 Production and consumption trade data inconsistencies exist.
Commission a review and analysis of all data gathered for consolidation and standardization.
12 Limited maize farm mechanization.
Ongoing efforts to increase mechanized process.
Conduct cost-‐benefit analysis of farm mechanization for value-‐add.
13 Limited agricultural insurance mechanisms.
IFC / WB / Earth Institute insurance project being explored.
Evaluate weather index insurance (IFC-‐WB, Earth Institute).
14 Limited information about the impact of maize development on the environment.
-‐ Study environmental impact of maize farming and consider shifting maize production growth to the Eastern province.
15 Infrastructure needs impact productivity
Action plans underway for improvements
Continue to address under existing programs.
2.1 Key Constraints
1. Limited cross-‐ministerial visibility of the comprehensive maize value chain: Historically, MINAGRI has overseen the development of maize agricultural production while MINICOM oversaw the development of trade and industry. Within the maize value chain, MINICOM has been concerned with milling, processing, retail, wholesale and export components. Limited visibility exists regarding planning, strategies, actions, and budgets between the two Ministries due to poor communication. Full visibility of the value chain at a program level is needed in order to plan, prioritize, execute, monitor and evaluate the development of the comprehensive ‘end-‐to-‐end’ maize value chain.

35
A. Recommendation: Form MINICOM/MINAGRI integrated agricultural value chain working group. Appoint high-‐performing staff from both ministries to form a working group that will integrate knowledge-‐sharing, planning, execution, and escalate and communicate challenges on either end of the value chain. Empower the team with the appropriate resources and decision-‐making power.
2. Post-‐harvest losses, limited market information, and management and production capacity challenges: • High post-‐harvest losses: Poor post-‐harvest drying and storage facilities
account for a loss of about 22 percent of the total maize produced.80 USAID and MINAGRI have conducted post-‐harvest storage programs that have greatly reduced losses in participating cooperatives, yet the problem remains for a majority of Rwandan farmers.
o Labor: Skilled manual labor is needed at various stages of production including the shelling and cleaning stages to ensure minimal losses and that maize bags do not contain impurities.
o Drying Facilities: While some farmers within co-‐operatives such as COVAMIS may have access to drying centers in their communities, others do not.81At the drying centers, co-‐op members are able to store their crop for about three months in protected shelters. For those outside the co-‐ops, drying takes place at home under tarps and in trees. This makes the maize highly susceptible to consumption by birds and rodents, being blown by wind, and damage from rain. This often results in grains with high moisture content making the maize susceptible to mold and discoloration.82
o Storage bags: Finally, USAID estimates that 90 percent of Rwandan
farmers store their crop in ordinary bags. Since these bags are not airtight and do not include pesticide, they also result in a high moisture content and have the potential to rot.
• Individual Farmers (outside of cooperatives) have limited market information: Cooperatives who sell directly to millers have good price information and market linkages, however farmers outside of these groups do not appear to be taking advantage of price information provided by MINAGRI.83 Farmers are currently receiving larger returns on maize than traditional
80Interview with Bruce Smith, Post-‐Harvest Storage Task Force. 81Nasho Field Visit. March 2013. 82 Ibid. 83 Ibid.

36
crops.84. Ideally, farmer cooperatives would gain enough information on price and production information to select the most valuable crop themselves. This information is out of reach as many farmers are delinked from markets and lack familiarity with certain crops to determine potential opportunities.85 A text-‐message system exists that allows farmers to see what prices their products reach at market, however its reach is limited and has proven cumbersome for some farmers to navigate.86
• Cooperatives have limited management and production capacity. Cooperatives are a relatively new concept in Rwanda. Cooperatives coordinate farmers and facilitate technical assistance efforts, which make it easier for farmers to secure linkages with millers.87 At the same time, market-‐oriented cooperatives guide farmers away from subsistence agriculture and encourage them to provide higher quality maize. Much work has been done in developing the 348 maize cooperatives currently legally registered. 88 However, cooperatives are of varying quality and not all are effective.
o Capacity: Many have limited management (contracting, investment) and
production (post-‐handling, technical assistance to farmers) capacity. This can result in a lack of contract fulfillment. 89 Many also remain unregistered as a legal entity to carry-‐through on contracts.90
o Product Quality: Maize cooperatives need to be carefully vetted to address other stakeholder’s concerns regarding quality. Notably, millers have expressed difficulty interacting with cooperatives that fail to deliver adequate quantities of kernels or that have disconnects between representatives and members.91
An independent study is underway by the Rwandan Cooperative Authority (RCA) to categorize all cooperatives according to performance.92 This study will constitute a baseline to be regularly updated in the future.
B. Recommendation: Continue existing initiatives to strengthen co-‐operatives to improve post-‐harvest handling, increase yields and crop quality; and determine impact of termination of USAID program. The organization of farmers into cooperatives has been effective in overcoming a number of constraints and should
84 Ibid. 85 Interview with Armin Lalui, MINICOM. 86MINAGRI. March 2013. 87Mugabo, Damien. RCA. March 2013. 88Mugabo, Damien. RCA. March 2013. 89Ibid. 90Mansell, Claude. Minimax. March 2013. 91Nasho Field Visit. March 2013. 92Mugabo, Damien. RCA. March 2013.

37
continue. The current study underway will provide important information on where to drive further cooperative capacity building. Post-‐harvest storage has been a priority for USAID and MINAGRI, however, USAID’s Sell More for More post-‐harvest program will be completed in 2013 and therefore it will be important to determine implications of the termination of USAID program to MINAGRI capacity.
• Training: Strengthening cooperatives through training and access financing to invest in shared mechanization and post-‐harvest storage facilities are particularly important.
• Grain Bags: Research needs to be done to identify less expensive options for air-‐tight grain bags with pesticide. 93
• Price Information: Price information should be readily accessible for maize farmers both on an individual basis and through the cooperative. Further analysis needs to be done on other successful text-‐message market information programs in order to increase the reach and uptake of these services to all farmers. In the short-‐run, cooperatives could be linked with traders and millers to secure stronger ties to maize markets. Additionally, this information could be physically posted in central locations at cooperatives as opposed to requiring a complicated navigation of a text message system.
• Diversification: While mono-‐cropping is encouraged by MINAGRI,
cooperatives should also be encouraged to experiment with other crops in very small plots of land. The returns on these crops should be broadcasted to other farmers within the cooperative so that farmers acquire familiarity with new crops and a sense of what returns they can bring. Over time, cooperatives will be mature enough to select high-‐value crops on their own.
3. Limited access to long-‐term credit for cooperatives, and limited use of short-‐term credit by farmers. Removal of seeds and fertilizer subsidies • Millers – working capital: While credit is available to finance equipment,
Minimex, the largest individual maize producer in Rwanda, is unable to produce at full capacity due to limited access to working capital to purchase inputs. In 2012, Minimex operated at 30 percent capacity and expects to reach 40 percent capacity in 2013.94 They lacked the capital required to bring in the maximum quantity of maize for storage during the high seasons. AMIRWA reported that its biggest constraint is access to operating capital and inputs. This limitation on credit may also limit the opportunity for expansion with smaller millers seeking to diversify their product mix through the purchase of costly equipment.
93Bruce Smith, MINAGRI. March 2013. 94Mansell, Claude (MINIMEX). March 2013

38
• Farmers – low utilization of credit: Among farmers, Saving and Credit Cooperatives (SACCO’s) have greatly improved access to finance in Rwanda.95 SACCO’s offer credit to individual farmers and are present in almost every district of Rwanda. Interest rates from interviewees averaged around 18 percent for individual farmers.96 However, while access to credit has expanded, many Rwandan farmers are not taking advantage of it. Some observers attribute this to a lack of understanding as to the opportunities of credit.97. Farmers shifting from subsistence farming to a commercial outlook has taken time. However, reluctance to take credit may be perfectly rational response of farmersto uncertainty. The constraints on the demands for credit by farmers need to be better understood but reducing uncertainty will clearly help. Farmers interviewed indicated a hesitance to accessing credit due to fears of over indebtedness. Finally, interviews in Nasho district revealed that many farmers do take out loans to pay for fertilizer (50 percent of which is subsidized by the government). These loans often remain unpaid. The reason for this lack of repayment is unclear but may be driven by a lack of understanding of financial products.
• Cooperatives –Long-‐term credit: Interviews suggested that some cooperatives make use of credit to buy maize from their members, but less so to improve storage facilities or improve infrastructure. This indicates a lack of use of longer-‐term credit for more significant investments. This may be because while SACCOs have reached out into the rural areas of Rwanda (91 percent of adults live within a 5 km radius of a SACCO)98, formal financial institutions, more able to meet the longer-‐term and larger credit needs of cooperatives, have not reached this population yet (60% of adults live within a 5km radius of a bank).99 In addition, cooperatives are relatively nascent in Rwanda and taking on credit requires a level of sophistication in terms of management capacity.
• Seed and fertilizer subsidy phase-‐out: MINAGRI is planning a phase-‐out of input
subsidies for farmers. The phase-‐out of seed and fertilizer subsidies underway poses a risk for farmers’ ability to pay for these critical inputs.
C. Recommendation: Address credit availability for both working capital and investment in the context of broader financial sector reforms in Rwanda, ease removal of seed subsidy. Access to finance needs to be improved at the individual farmer level, at the cooperative level (assuming high quality cooperatives that can handle credit), and at the miller level. Analysis must be done to understand the level of reach of formal banks and the reasons that cooperatives are not accessing finance. Closing this gap would enable cooperatives to make long-‐term investments
95Finmark Trust, Finscope, 2012, pg. 3 96 Nasho field visit. 97Ibid, pg. 4 98Ibid, pg 21 99Ibid, pg 21

39
in their members and in post-‐harvest handling. It will be important to investigate options to increase access to affordable financing mechanisms to enable maize millers to upgrade their technology and equipment and purchase maize in bulk for processing. This credit issue becomes particularly important given the planned transition away from subsidies to private seed and fertilizer distribution. An analysis of regional prices for seeds and fertilizers must be made in order to determine if the best prices are being achieved in Rwanda. The flow of high quality seeds to maize producers must not be interrupted, and subsidies for seeds and fertilizer should be gradually phased out to minimize disruptions.
4. Limited Product Diversification: Aside from Minimex, most Rwandan millers produce principally flour and bran. Minimex obtains much higher levels of value addition by producing grits which it sells to beer breweries. Greater product diversification would allow millers to produce more valuable products and more profitably use every part of a maize kernel.
D. Recommendation: Explore demand for other maize products in Rwanda: A regional market analysis of demand for other maize products must be done to identify potential products for expansion. These may include, but is not limited to: fortified flours, maize oil, cornstarch, mixed flours, and ethanol. Proposing specific products for diversification is beyond the scope of this study, but the opportunity should be further explored.
5. Limited implementation of certification standards: Though maize is a product that is certified by the Rwanda Bureau of Standards (RBS), its reach is limited. Currently, Minimex is the only certified maize meal producer and the WFP is the only buyer that requires certified maize meal. This combined lack of certified millers and lack of market demand for certified product results in highly variable quality of maize meal. This carries its way throughout the value chain with traders then not being driven by quality in their purchases and farmers also lacking a focus on quality.
E. Recommendation: Improve enforcement of certification requirements on processors and institutional buyers. While maize standards exist, there is an opportunity to improve the quality of dried maize produced by farmers and subsequently, the maize products produced by millers. To achieve this, enforcement of current RBS standards to address storage, food safety, pest control grievances, and other quality issues are necessary especially for smaller millers. Additionally, incentives for higher quality products by millers may be beneficial in improving quality all the way through the value chain.

40
2.2 Secondary Constraints
Limited maize farm mechanization: Mechanization saves labor for farm owners, but does not strictly add value to their product and will result in lower employment for farmhands. 90 percent of Rwandan farmers do not use mechanized tilling and planting equipment and transportation vehicles to move goods to drying facilities and markets. Interviews with farmers in Nasho region who had access to machinery such as planting machines indicated that while these machines are expensive to rent, they increase farmer profits and are widely used where available. They were preferred to using manual labor for financial reasons as well as quality. Sixteen village mechanization service centers offer rental and maintenance facilities for farm machinery, but it is estimated that there is a need to invest USD $60 million to achieve the MINAGRI goal of reaching 45 percent of farmers by 2017.100
Recommendation: Conduct cost-‐benefit analysis of mechanization: A full cost-‐benefit analysis of different levels of mechanization for maize farming is recommended. Mechanization benefits are offset by the fact that it can reduce employment on a net basis. A balance between these two effects is required.
Limited agricultural insurance mechanisms: Most Rwandan farmers still practice subsistence farming, growing several different crops in the same field. This is an effective insurance strategy against crop failure, but it does not link farmers with markets and does not allow farmers to capitalize on producing more valuable crops. The CIP has therefore advocated for land consolidation resulting in joint production of a single crop through farmer cooperatives. However, the lack of insurance opportunities may drive cooperative members to some level of multi-‐cropping of their fields in the future which may decrease overall production.
Recommendation: Evaluate weather index insurance (IFC-‐WB, Earth Institute): Mono-‐cropping opens farmers to greater risks than multi-‐cropping. Recently created weather-‐based insurance schemes could provide a possible model for insurance for Rwandan farmers.
Limited information about the impact of maize development on the environment: There remains little in the way of data and studies to show the impact of the increased agricultural production on the environment. The FAO estimates that 40 percent or Rwanda’s land faces significant soil erosion threat due to steep inclines and 37 percent require soil retention measures.101 MINAGRI has sought to alleviate this concern by moving maize production to flatter areas in the East. Rwandan soil is often acidic and due to intensive utilization can be depleted without organic fertilizer use.102
100 Interview, MINAGRI Mechanization Task Force. 101 Rwandan Environmental Management Authority Report, Ch 3 p 10 102Enviro Report, Ch 1 p12
41
Recommendation: Study environmental impact of maize farming and consider increasing share of maize production in the Eastern province: Due to soil erosion, it may be beneficial to further promote maize production on flatter terrain, particularly in the East. MINAGRI should also attempt to measure the impact of soil erosion on production to assess this and other environmental threats.
Infrastructure needs impact productivity: Rwanda’s cost of doing business remains high due to the high transport and energy costs and poor national and regional connectivity. As a consequence, the private sector has yet to play its expected role as a growth driver.103 Many millers and traders interviewed, cited the unstable electricity supply (particularly outside of Kigali), and poor physical and financial infrastructure as key issues impacting their bottom lines. There are growing efforts from the government to upgrade these different infrastructure sectors, however stakeholders agree that it is a still long way ahead.104
Recommendation: Continue transportation and electricity development. The government of Rwanda has highlighted transportation costs and unreliable electricity as key challenges to industrial development. These challenges are high on the government’s list of priorities and should remain so.
103http://www.afdb.org/fileadmin/uploads/afdb/Documents/Project-‐and-‐Operations/Rwanda%20-‐%20CSP%202012-‐2016.pdf

42
Appendix Profit Distribution Detail (Prices, RWF) Farmers Coop Worst Case Yield per hectare (KG) 4000 500 Fertilizer price (/kg) 600 600 Fertilizer use (/hect) 100 0 Seed Price (/kg) 450 450 Seed Use (/hect) 25 25 Wage/day 0 0 Planting Machine 70000 0 Irrigation Capital Cost 7000000000 0 Post harvest losses 15.00% 24.00% Costs per kg Fertilizer 15 0 Seeds 2.8125 22.5 Planting Costs 0 0 Post Harvest Losses 0 0 Irrigation Capital Cost 0 0 Total Cost (kg) 17.8125 22.5 Revenue 200 200 Profit 182.1875 177.5 Traders Kg per day 80000 Price of Truck 21000000 Years of Use 6 Costs per kg Fuel 10 Truck Capital Cost 0.168269231 Kernels 200 Total 210 Revenue 220 Profit 10

43
Millers AMIRWA MINIMEX % Processed to Flour 66.60% 50.00% % Residue 33.33% 0.00% % Processed to Bran 0.00% 30.00%
% Processed to Grits 0.00% 20.00% Capacity per month 150000 3583333 Utilization 100.00% 60.00% Kernels Milled / month 150000 2149999.8 Fixed Cost/ month 525833.33 80000000.00 Price of Flour/kg 360.00 400.00 Price of Bran/kg 100.00 100.00 Price of Grits/kg 400.00 400.00 Price of Residue/kg 60.00 60.00 Costs per kg Kernels 220.00 220.00 Packaging 10.00 9.30 Electricity, Water 0.01 10.23 Fixed Costs 0.00 0.00 Total Cost/kg 230.01 239.53 Revenue from flour 239.76 200.00 Revenue from Bran 0 30 Revenue from Grits 0 80 Revenue from Residue 19.998 0 Total Revenue/kg 259.758 310 Total Profit/kg 29.75 70.47

44
References Bibliography African Development Bank. (October 2011 ). Bank Group Country Strategy Paper 2012-‐2016. Authority, R. E. (Unknown). Rwandan Environmental Management Authority Report. Clover, J. (2012, February). Rwanda sees GDP growth hit if aid doesn’t restart. Reuters . Finmark Trust. (2012). FinScope: Financial Inclusion in Rwanda 2008-‐2012. International Grains Council. (n.d.). World Grain Report. ITC. (2012). ITC Trade Map. Kathiresan, A. (2011). Strategies for Sustainable Crop Intensification in Rwanda. . MINAGRI. Laan, J. v. (2011, January). Going Local. Agri-‐Profocus . Market, M. (2013, March). Microfinance in Rwanda: Country Profile. . Retrieved from MIX Market: http://www.mixmarket.org/mfi/country/Rwanda MINICOM. (2013). EAC Study on the Review of the Common External Tariff Rates on Sensitive Items in the Partners States. . Savings Groups Information Exchange. (2013, March). Retrieved from Savings Groups Information Exchange: http://savingsgroups.com/projects/search/country/206 Storage., R. P.-‐H. (2013 , March ). Rwanda Post-‐Harvest Handling and Storage. . Retrieved from Rwanda Post-‐Harvest Handling and Storage. : http://www.rwandaphhs.com TechnoServe. (2010). Addressing Food Security in Rwanda by Transforming the Maize Sector. . Unknown. (2013). Rwanda Cross Border Trade Analysis -‐ Draft. USAID . (2013). Rwanda Cross-‐Border Agricultural Trade Analysis. World Bank. (2012, September). World Bank Rwanda Overview. Retrieved from World Bank: http://www.worldbank.org/en/country/rwanda World Food Programme (WFP). (2012). Comprehensive Food Security and Vulnerability Analysis and Nutrition Survey .
45
Interviews 1. Abbasian, FAO 2010
2. Cereal Knowledge Bank
3. CICA, MINAGRI
4. Gervais, Ngerero (RAB). March 2013
5. Lalui Armin, Consultant to External Trade Department. MINICOM. March 2013.
6. Sheeran, Josette, WFP Rwanda. March 2013.
7. Jean Marie, USAID. March 2013
8. Mansell, Claude. MINIMEX. March 2013
9. Mashayo, Emmanuela. WFP. Mar 27, 2013
10. Mugabo, Damien. RCA. March 2013
11. Murkozi, Charles. MINAGRI. Mar 2013
12. Musabyimana, Innocent. RAB. March 2013
13. Nsemgiyumva, Francois. MINAGRI. Jan 2013
14. Nzeyiman, Innocent. MINAGRI. Mar 2013
15. Rutayisire, Mark. ENAS. March 2013
16. Smith, Bruce. USAID/MINAGRI. March 2013
17. Thedee, SOSOMA. March 2013