maintaining u.s. beef industry competitiveness with high-priced grain derrell s. peel breedlove...
TRANSCRIPT

Maintaining U.S. Beef Industry Competitiveness with High-Priced Grain
Derrell S. Peel
Breedlove Professor of Agribusiness
And Livestock Marketing Specialist
Oklahoma State University
Major Beef Industry Issues
• Changes in U.S. Agriculture• Increased Global Demands on Agriculture• Current U.S. Beef Market Situation• Long Run Structural Change in the U.S. Beef
Industry• Other Issues
– Environmental, animal welfare, local foods, etc

U.S. Beef Industry Opportunities and Challenges
• Ability to use forage implies an important role in meeting global food demand
• High grain prices means that the beef industry must adjust production systems
• Beef industry must take advantage of flexibility in production to maintain competitiveness
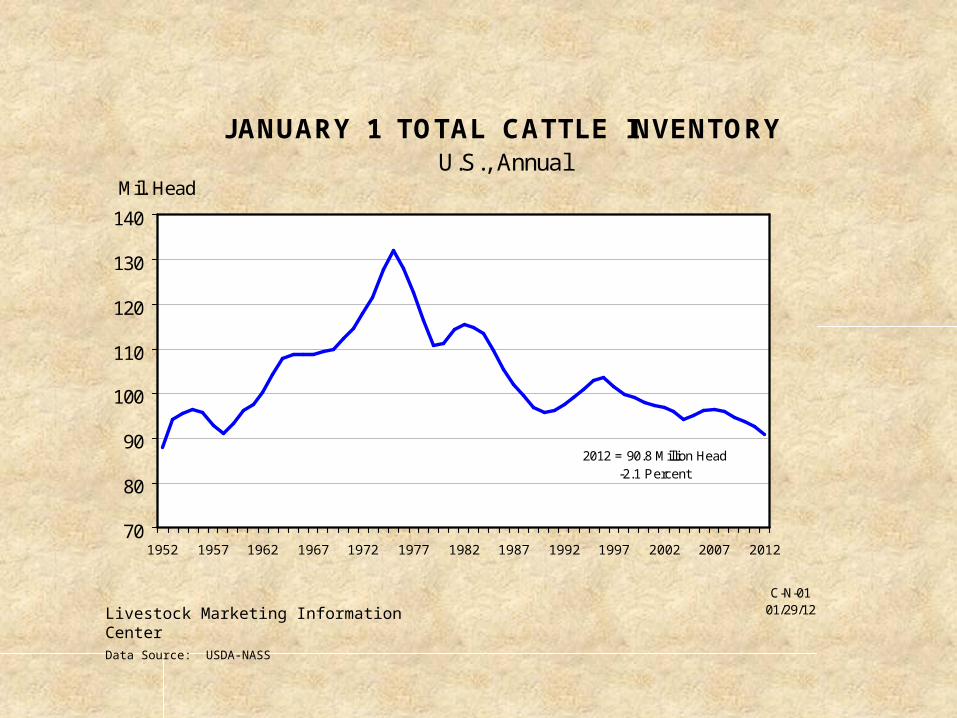
JANUARY 1 TOTAL CATTLE INVENTORYU.S., Annual
70
80
90
100
110
120
130
140
1952 1957 1962 1967 1972 1977 1982 1987 1992 1997 2002 2007 2012
Mil. Head
C-N-0101/29/12
-2.1 Percent2012 = 90.8 Million Head
Livestock Marketing Information CenterData Source: USDA-NASS
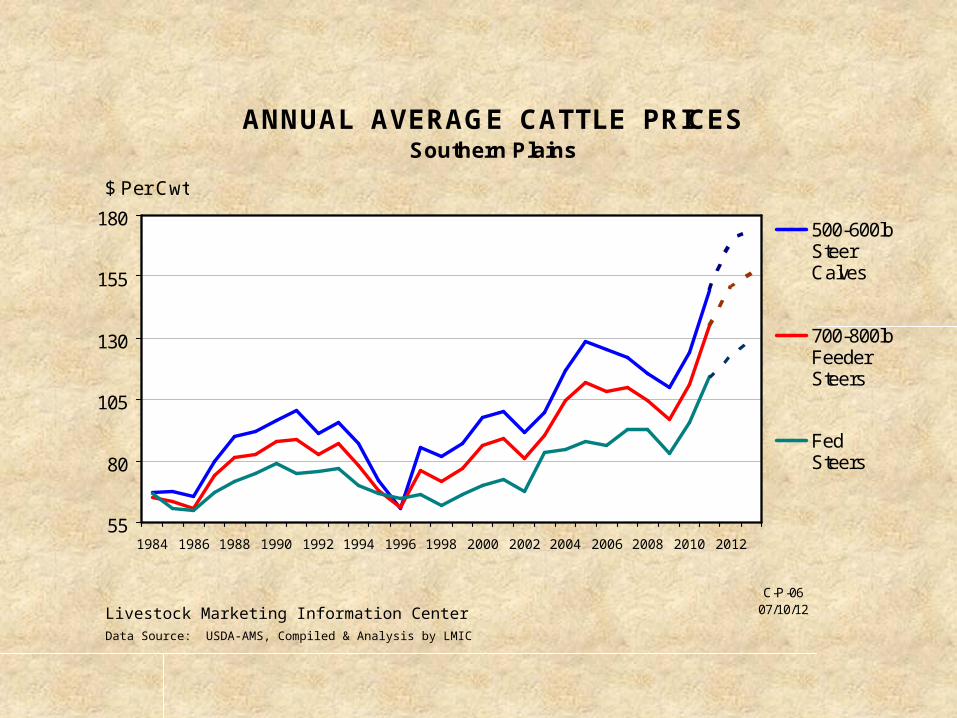
ANNUAL AVERAGE CATTLE PRICESSouthern Plains
55
80
105
130
155
180
1984 1986 1988 1990 1992 1994 1996 1998 2000 2002 2004 2006 2008 2010 2012
$ Per Cwt
500-600lbSteerCalves
700-800lbFeederSteers
FedSteers
C-P-0607/10/12Livestock Marketing Information Center
Data Source: USDA-AMS, Compiled & Analysis by LMIC

BEEF PRODUCTIONU.S., Annual
10
12
14
16
18
20
22
24
26
28
30
1955 1960 1965 1970 1975 1980 1985 1990 1995 2000 2005 2010
Bil. Pounds
Livestock Marketing Information CenterData Source: USDA-NASS
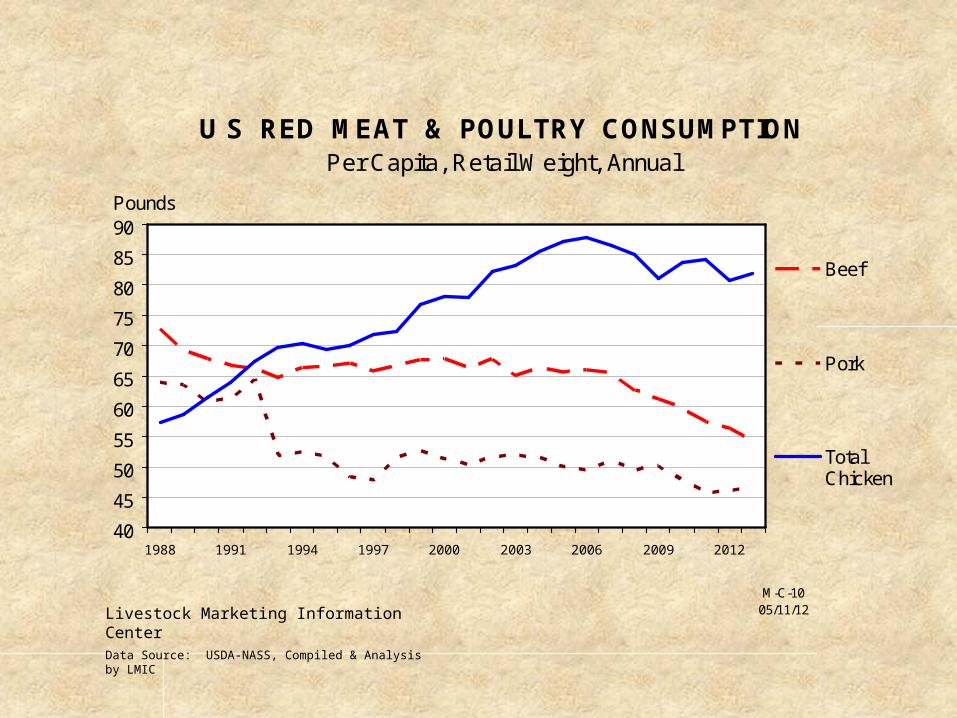
U S RED MEAT & POULTRY CONSUMPTIONPer Capita, Retail Weight, Annual
40
45
50
55
60
65
70
75
80
85
90
1988 1991 1994 1997 2000 2003 2006 2009 2012
Pounds
Beef
Pork
TotalChicken
M-C-1005/11/12Livestock Marketing Information Center
Data Source: USDA-NASS, Compiled & Analysis by LMIC

United States: Beef Trade
0200400600800
10001200140016001800
1,00
0 M
ET
RIC
TO
NS
Exports Imports
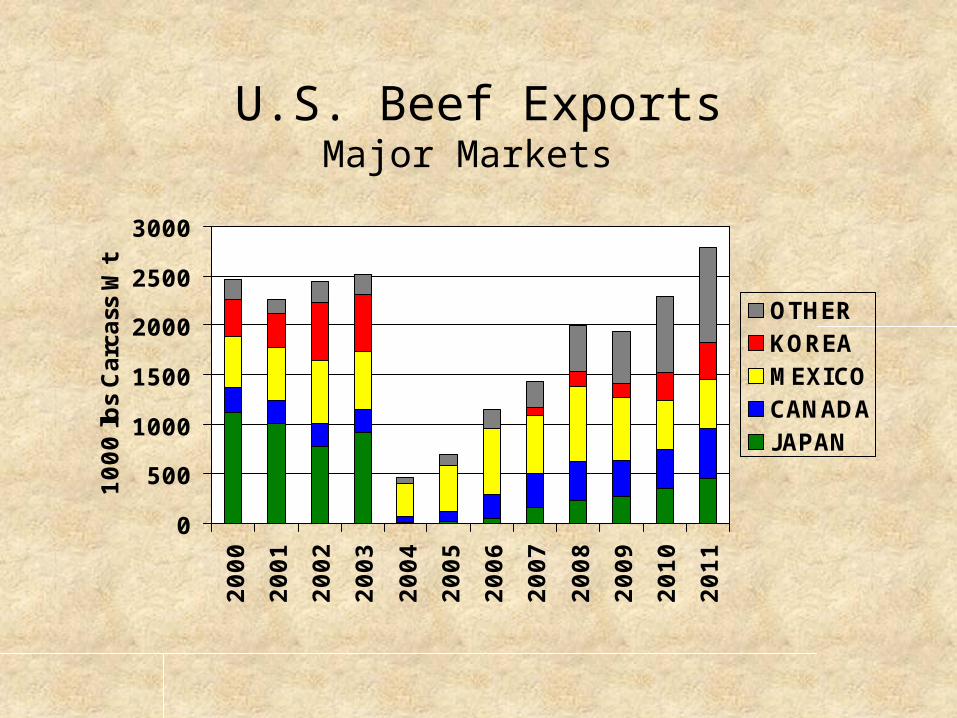
U.S. Beef ExportsMajor Markets
0
500
1000
1500
2000
2500
30002000
2001
2002
2003
2004
2005
2006
2007
2008
2009
2010
2011
1000 lbs
Carc
ass
Wt
OTHERKOREAMEXICOCANADAJAPAN

MAJOR U S BEEF IMPORT SOURCESCarcass Weight, Annual
0
200
400
600
800
1000
1200
Australia NewZealand
Canada Mexico Nicaragua Uruguay Brazil Argentina
Mil. Pounds
Avg.2005/09
2010
2011
I-N-3605/11/12Livestock Marketing Information Center
Data Source: USDA-ERS & USDA-FAS, Compiled & Analysis by LMIC

CATTLE IMPORTS FROM CANADA AND MEXICO
Annual
0
500
1000
1500
2000
1986 1989 1992 1995 1998 2001 2004 2007 2010
Thou. Head
Mexico
Canada
I-N-1305/11/12Livestock Marketing Information Center
Data Source: USDA-ERS & USDA-FAS, Compiled & Analysis by LMIC
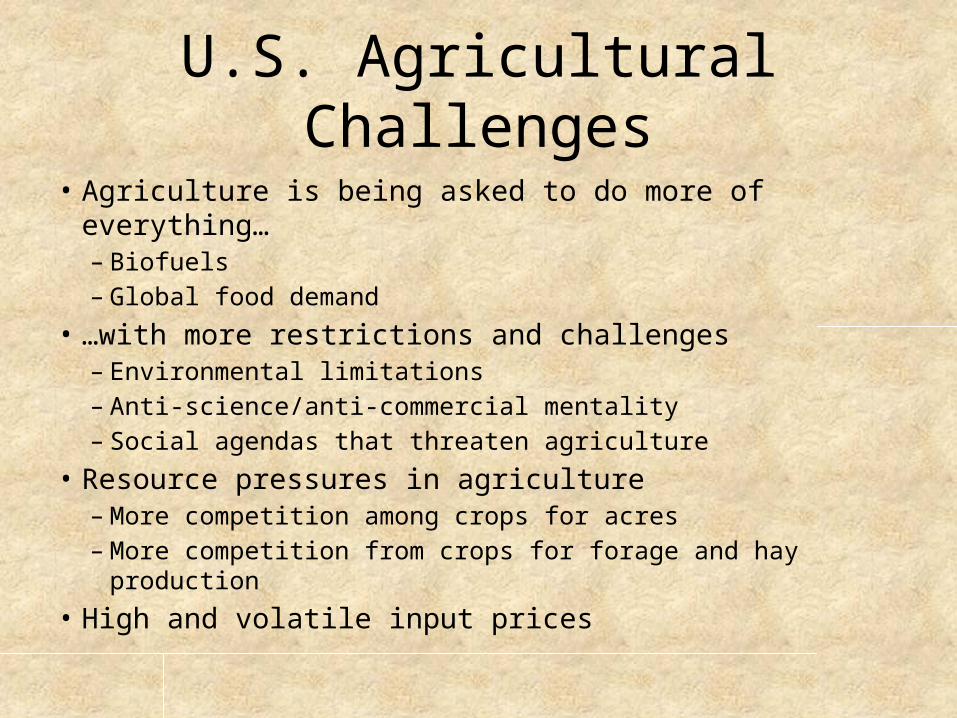
U.S. Agricultural Challenges
• Agriculture is being asked to do more of everything…– Biofuels – Global food demand
• …with more restrictions and challenges– Environmental limitations– Anti-science/anti-commercial mentality– Social agendas that threaten agriculture
• Resource pressures in agriculture– More competition among crops for acres– More competition from crops for forage and hay production
• High and volatile input prices

Corn for Food, Seed and Industrial Use
0
1000
2000
3000
4000
5000
6000
7000
Mil
lio
n B
ush
els
Ethanol
Other

U.S. CORN DISAPPEARANCE AND STOCKSCrop Year
0
2
4
6
8
10
12
14
16
1988 1990 1992 1994 1996 1998 2000 2002 2004 2006 2008 2010 2012
Bil. Bushels
Stocks
Exports
Food, Seed& Industrial
Feed &Residual
G-NP-1206/29/12Livestock Marketing Information Center
Data Source: USDA-NASS, Compiled & Forecasts by LMIC
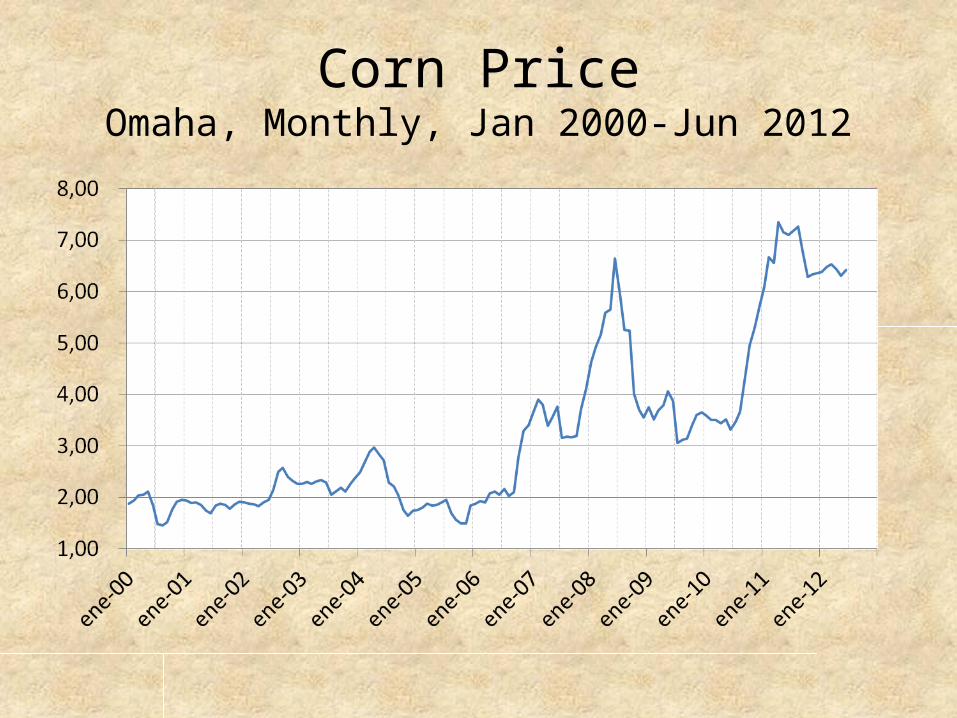
Corn PriceOmaha, Monthly, Jan 2000-Jun 2012
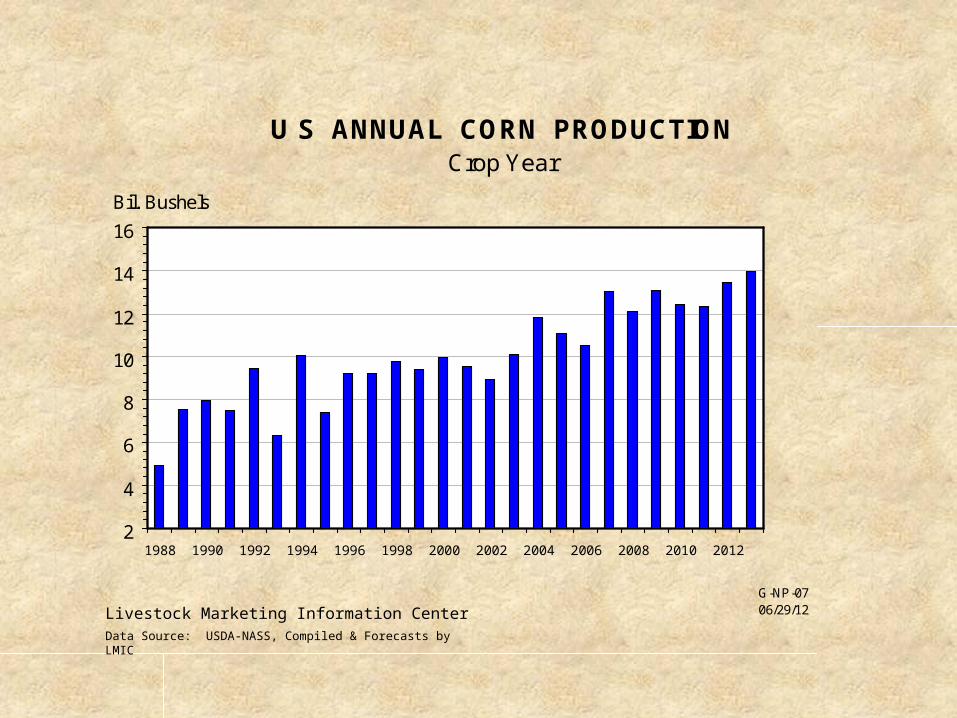
U S ANNUAL CORN PRODUCTIONCrop Year
2
4
6
8
10
12
14
16
1988 1990 1992 1994 1996 1998 2000 2002 2004 2006 2008 2010 2012
Bil. Bushels
G-NP-0706/29/12Livestock Marketing Information Center
Data Source: USDA-NASS, Compiled & Forecasts by LMIC
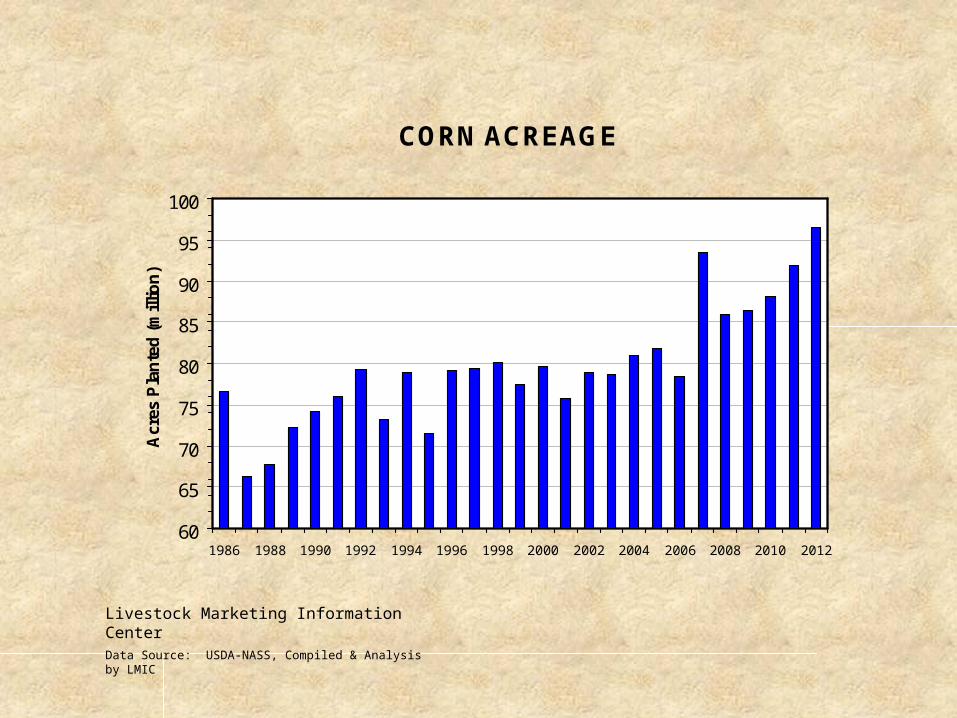
CORN ACREAGE
60
65
70
75
80
85
90
95
100
1986 1988 1990 1992 1994 1996 1998 2000 2002 2004 2006 2008 2010 2012
Acr
es P
lan
ted
(m
illio
n)
Livestock Marketing Information CenterData Source: USDA-NASS, Compiled & Analysis by LMIC
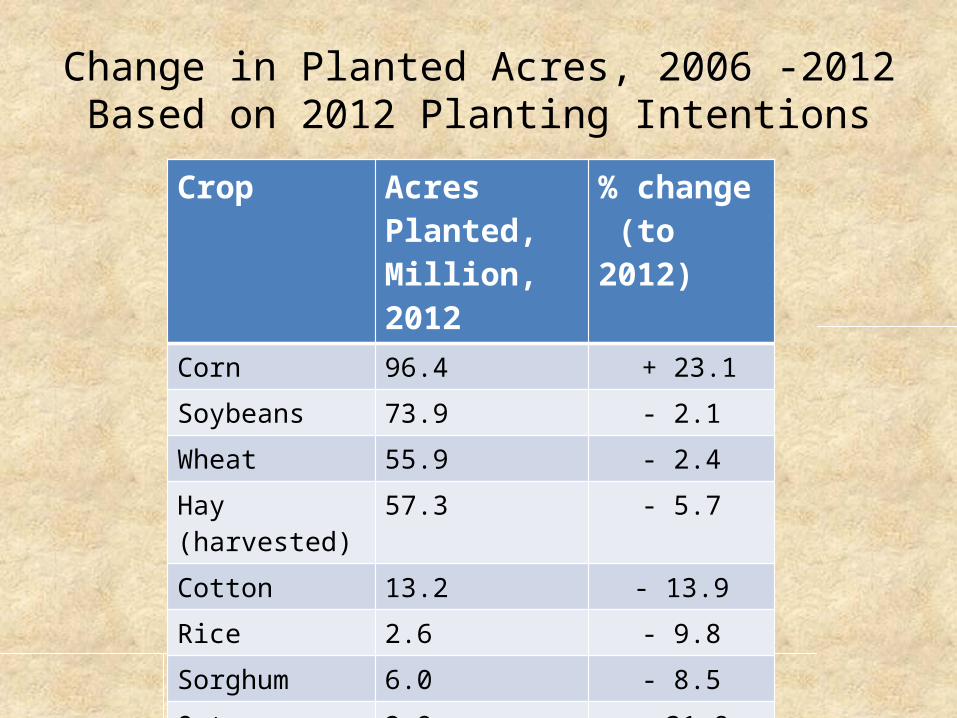
Change in Planted Acres, 2006 -2012Based on 2012 Planting Intentions
Crop Acres Planted, Million, 2012
% change (to 2012)
Corn 96.4 + 23.1Soybeans 73.9 - 2.1Wheat 55.9 - 2.4Hay (harvested) 57.3 - 5.7Cotton 13.2 - 13.9Rice 2.6 - 9.8Sorghum 6.0 - 8.5Oats 2.9 - 31.8Barley 3.3 - 4.9
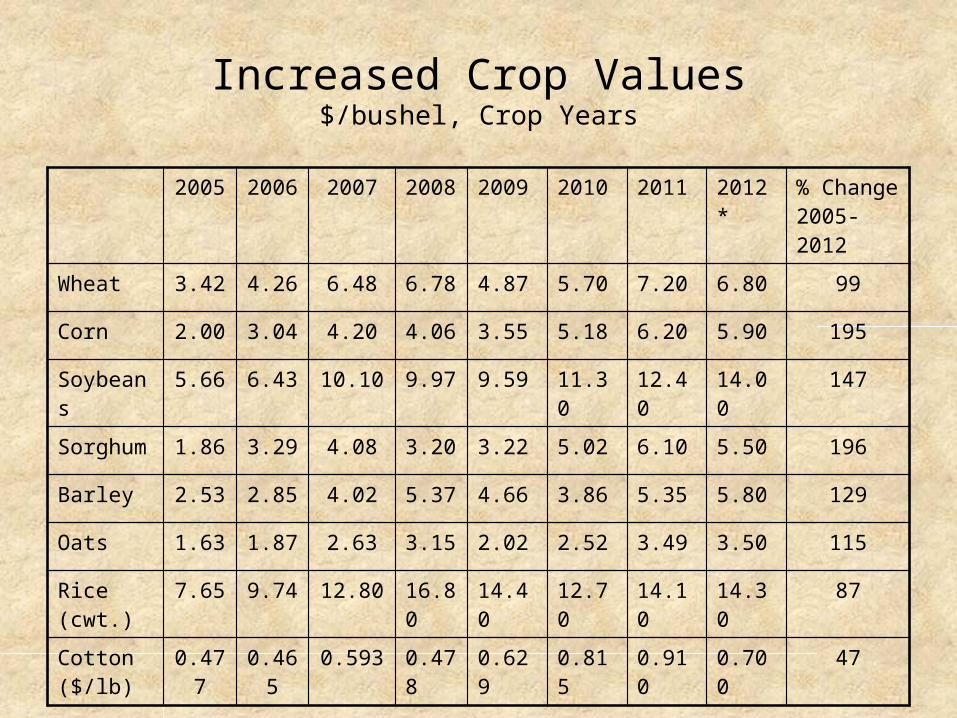
Increased Crop Values$/bushel, Crop Years
2005 2006 2007 2008 2009 2010 2011 2012* % Change 2005-2012
Wheat 3.42 4.26 6.48 6.78 4.87 5.70 7.20 6.80 99
Corn 2.00 3.04 4.20 4.06 3.55 5.18 6.20 5.90 195
Soybeans 5.66 6.43 10.10 9.97 9.59 11.30 12.40 14.00 147
Sorghum 1.86 3.29 4.08 3.20 3.22 5.02 6.10 5.50 196
Barley 2.53 2.85 4.02 5.37 4.66 3.86 5.35 5.80 129
Oats 1.63 1.87 2.63 3.15 2.02 2.52 3.49 3.50 115
Rice (cwt.)
7.65 9.74 12.80 16.80 14.40 12.70 14.10 14.30 87
Cotton ($/lb)
0.477 0.465 0.593 0.478 0.629 0.815 0.910 0.700 47

Short and Long Run Impacts of High Grain Prices on Beef Cattle
• Short Run– Adjustments within current production systems
• Tweaking the current system
– Other factors dominating • Current market situation
• Long Run– Adjustments to new production systems
• Different fundamental market incentives
– Within the context of dynamic short market conditions
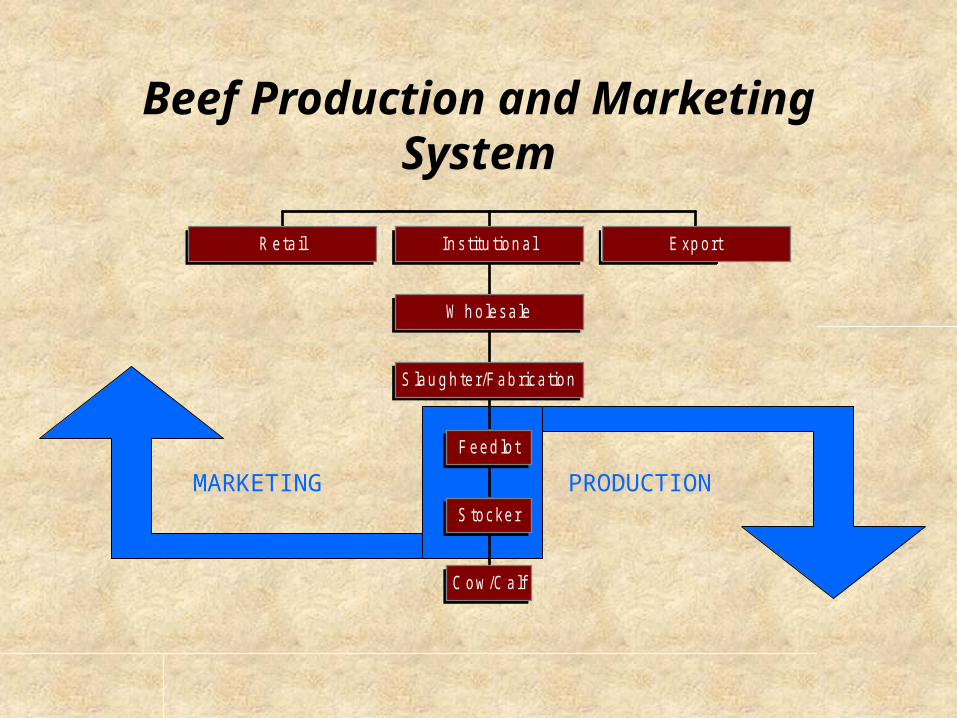
Beef Production and Marketing System
R eta il
C ow /C a lf
S tocker
F eed lo t
S lau g h te r/F ab rica tion
W h o lesa le
In s titu tion a l E xp ort
MARKETING PRODUCTION
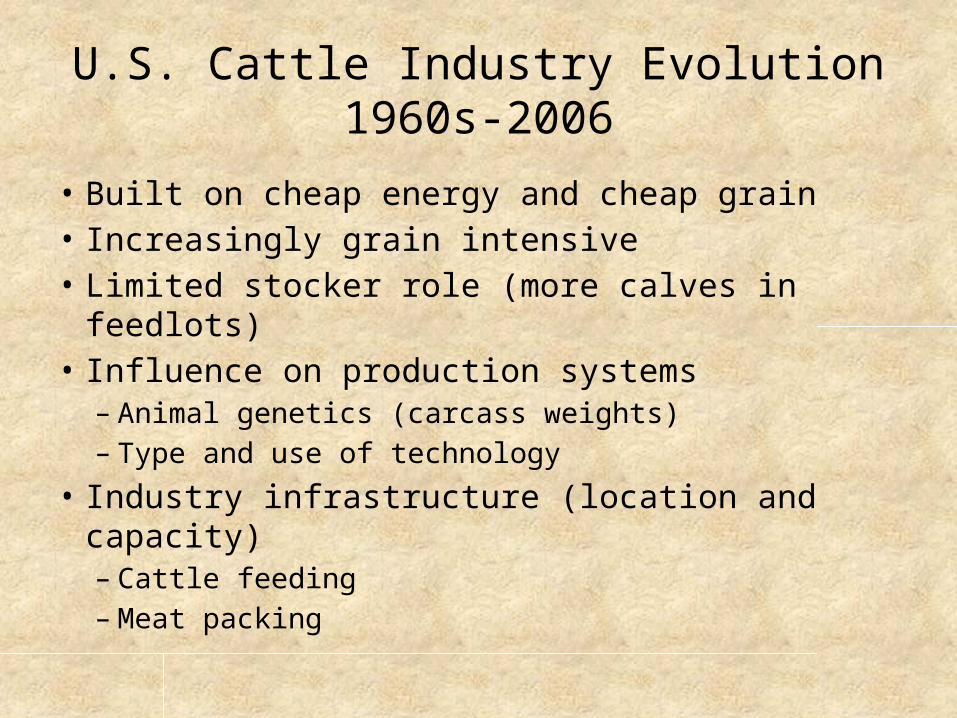
U.S. Cattle Industry Evolution1960s-2006
• Built on cheap energy and cheap grain• Increasingly grain intensive• Limited stocker role (more calves in feedlots)• Influence on production systems
– Animal genetics (carcass weights)– Type and use of technology
• Industry infrastructure (location and capacity)– Cattle feeding – Meat packing
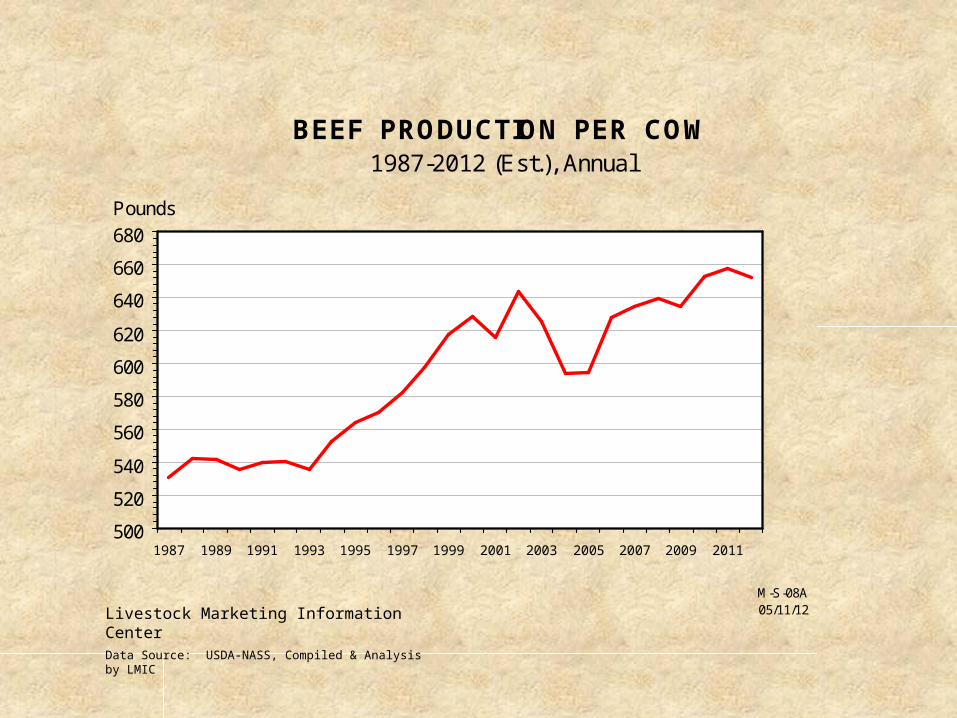
BEEF PRODUCTION PER COW1987-2012 (Est.), Annual
500
520
540
560
580
600
620
640
660
680
1987 1989 1991 1993 1995 1997 1999 2001 2003 2005 2007 2009 2011
Pounds
M-S-08A05/11/12Livestock Marketing Information Center
Data Source: USDA-NASS, Compiled & Analysis by LMIC
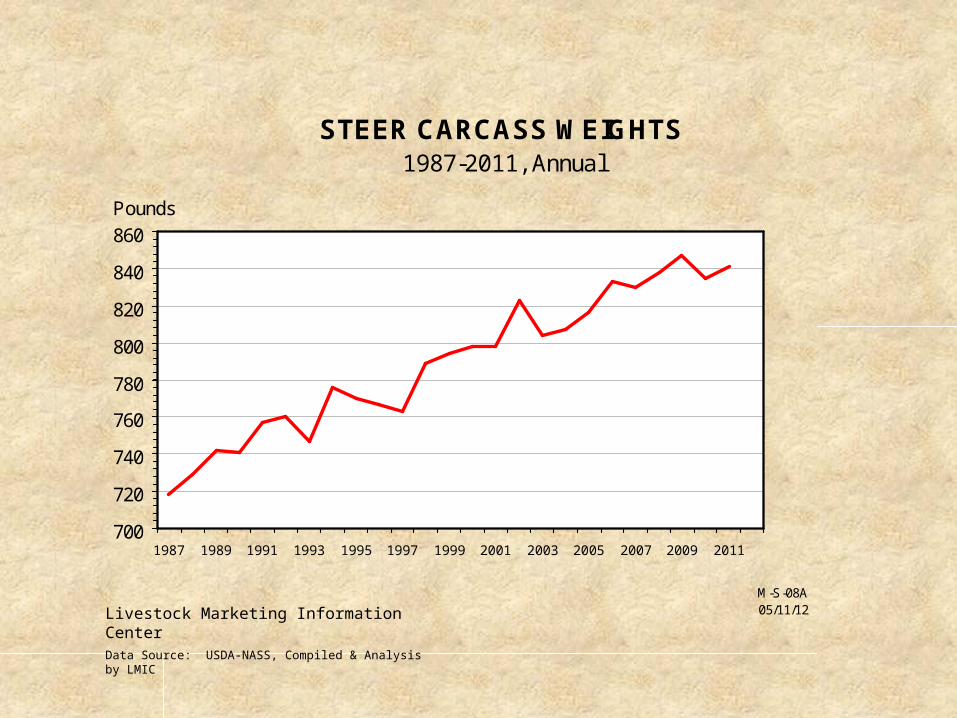
STEER CARCASS WEIGHTS1987-2011, Annual
700
720
740
760
780
800
820
840
860
1987 1989 1991 1993 1995 1997 1999 2001 2003 2005 2007 2009 2011
Pounds
M-S-08A05/11/12Livestock Marketing Information Center
Data Source: USDA-NASS, Compiled & Analysis by LMIC
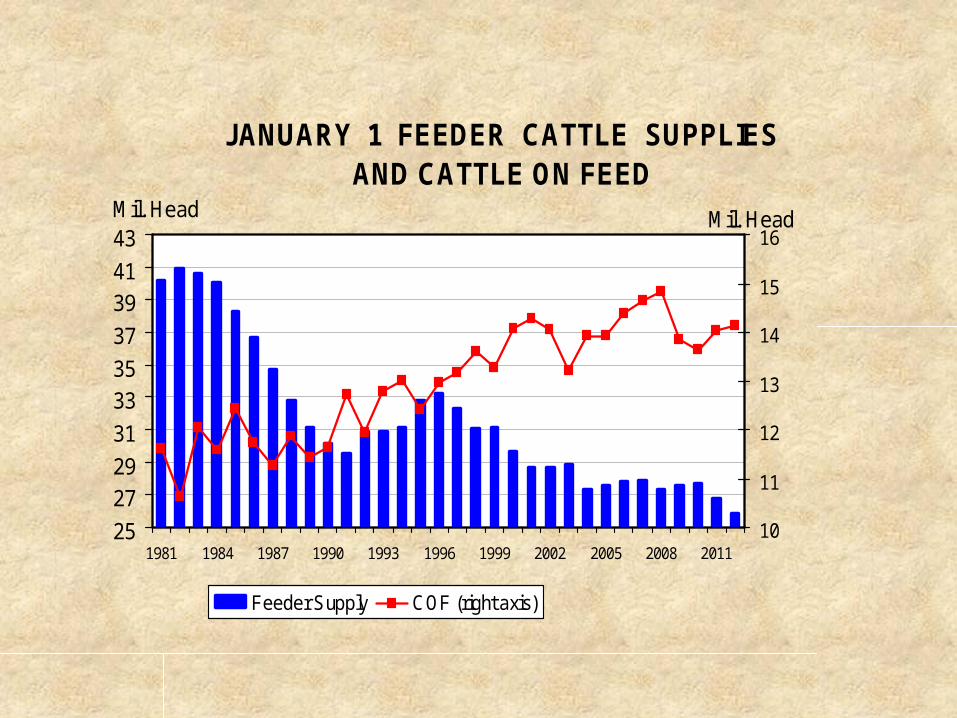
JANUARY 1 FEEDER CATTLE SUPPLIES AND CATTLE ON FEED
25
2729
31
3335
37
3941
43
1981 1984 1987 1990 1993 1996 1999 2002 2005 2008 2011
Mil. Head
10
11
12
13
14
15
16Mil. Head
Feeder Supply COF (right axis)

Cattle on Feed as a % of Feeder Supply, January 1
24%
28%
32%
36%
40%
44%
48%
52%
56%

“The Beef Industry Can Survive High Corn Prices Better Than the
Pork and Poultry Industries”
• True statement?• What are the implications for the beef industry?
It is often said:

KANSAS FEEDLOT CLOSEOUTSPounds of Feed (Dry Basis)Per Pound of Gain, Steers
5.6
5.7
5.8
5.9
6.0
6.1
6.2
6.3
6.4
6.5
Jan Feb Mar Apr May Jun Jul Aug Sep Oct Nov Dec
Pounds
Avg.2006/10
2011
2012
06/29/12Data Source: KSU Focus on Feedlots, Compiled by LMIC

Estimated Concentrate Feed per Pound of Meat Produced
• Broilers 1.80• Hogs 2.90• Beef (by feedlot placement weight)
– 550 lb. 3.50– 750 lb. 3.02– 1000 lb. 2.39
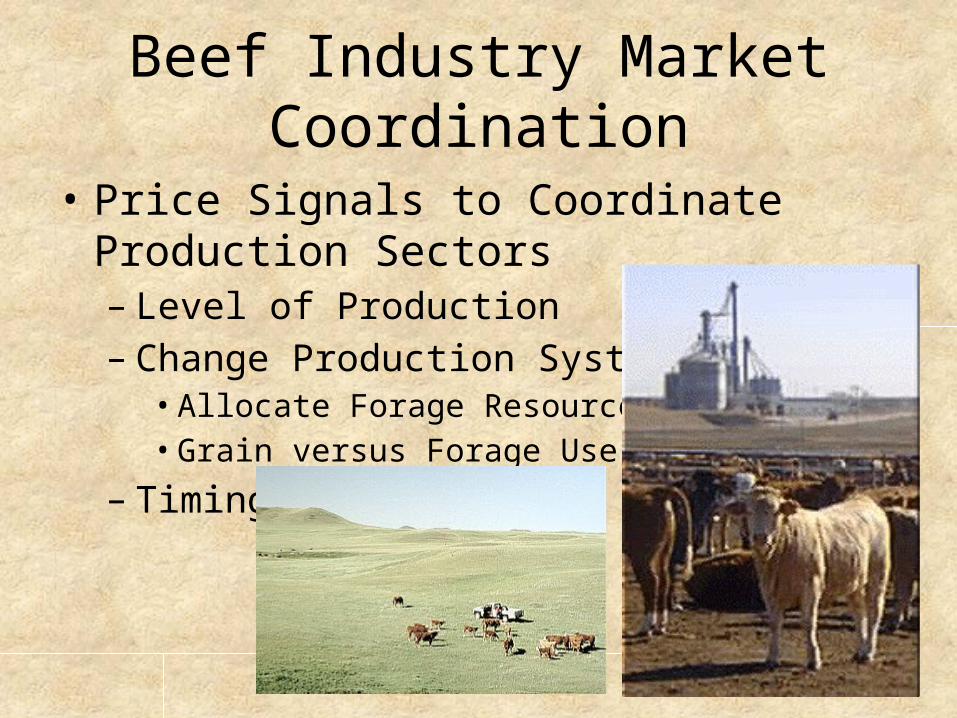
Beef Industry Market Coordination
• Price Signals to Coordinate Production Sectors– Level of Production– Change Production System
• Allocate Forage Resources• Grain versus Forage Use
– Timing
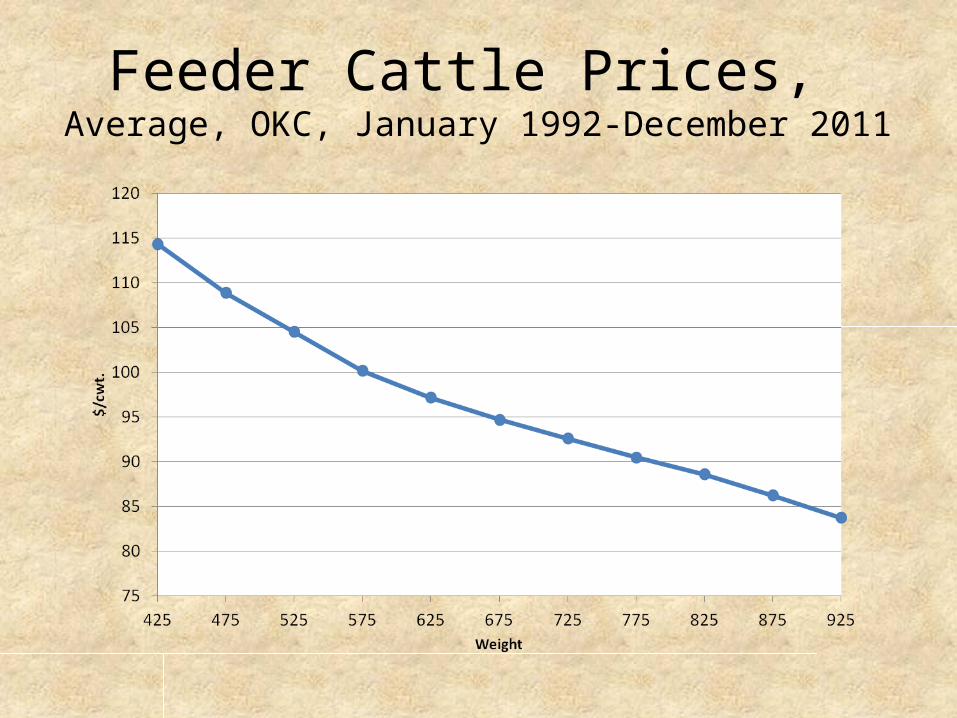
Feeder Cattle Prices, Average, OKC, January 1992-December 2011

Price Signals in the Beef Industry
• Cow-calf Production– Increase or decrease cattle production based on calf
prices• Stocker Production
– Increase or decrease forage use based on price relationship between light and heavy feeder cattle
• Feedlot Production– Increase or decrease grain use based on grain price
and relationship between light and heavy feeder cattle
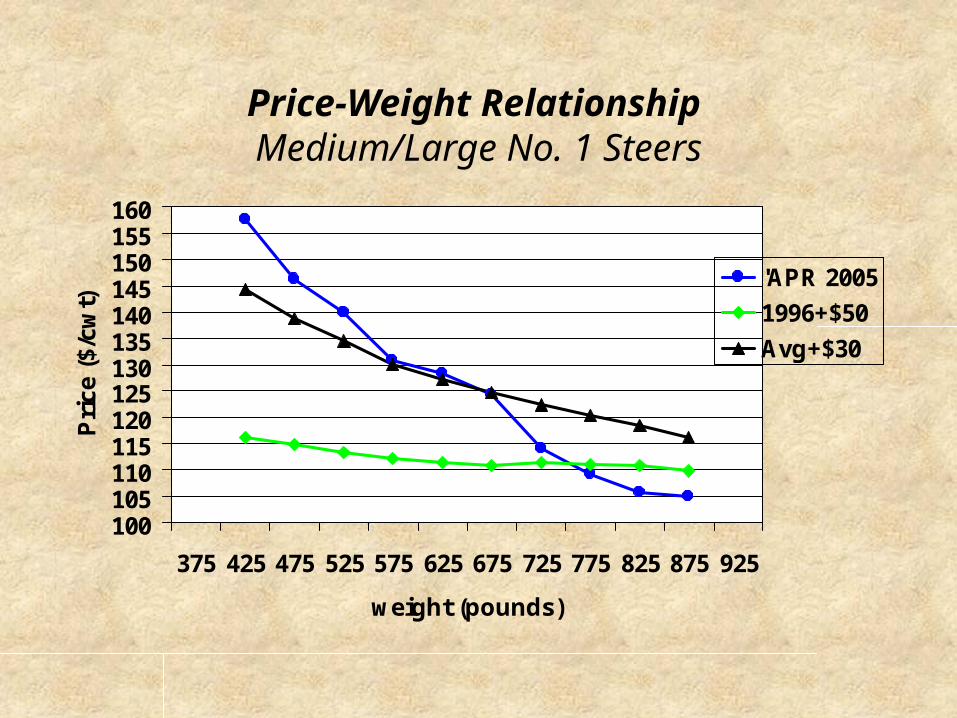
Price-Weight Relationship Medium/Large No. 1 Steers
100105110115120125130135140145150155160
375 425 475 525 575 625 675 725 775 825 875 925
weight (pounds)
Pri
ce (
$/cw
t)
'APR 2005
1996+$50
Avg+$30
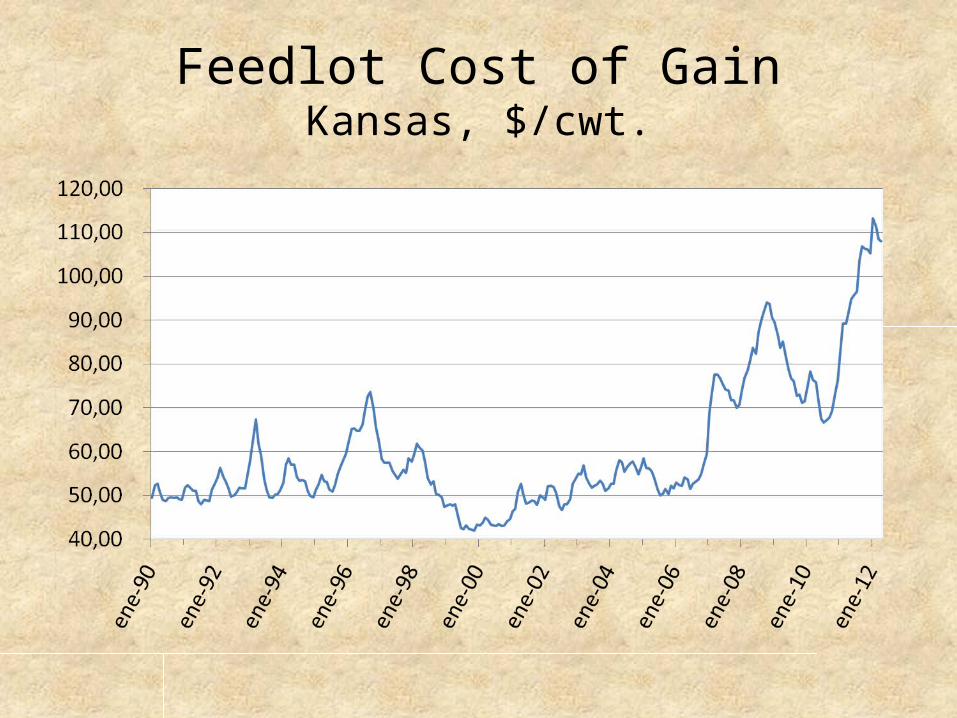
Feedlot Cost of GainKansas, $/cwt.

Cattle Markets are Providing Twin Signals to U.S. Producers at the Current Time
• Increase Calf Production– Herd Expansion– May change in 3-6 years
• More Stocker Production– Keep feeder cattle on forage longer– More flexibility– Likely to be permanent
• Both Signals Imply Increased Demand for Forage

Permanently Higher Grain Prices is a Game Changer for the U.S. Beef Industry
• Change from grain intensive to forage intensive to maintain competitiveness– Must emphasize ruminant advantages– Will continue to use grain finishing but in a less intensive way– Enhanced role for stocker production
• Influence on production systems– Animal genetics (change animal size?)– Type and use of technology?– Better forage management– New forages and new forage systems?
• Industry infrastructure (location and capacity)– Different feeding industry?– Regional shifts in cattle feeding, cow-calf and stocker production

Potential Structural Change in the U.S. Beef Industry
Current System New System?
Cow Size (pounds) 1100-1500 950-1350
Stocker (Forage based) Gain (pounds) 0-400 150-500
Feedlot Placement Weight (pounds) 550-850 750-1050
Slaughter Weight (pounds) 1250-1500 1050-1300
Days on Feed (Feedlot) 130-200 90-120
Feedlot (Grain based) Gain (pounds) 450-700 300-500
Age at Slaughter 15-20 18-22
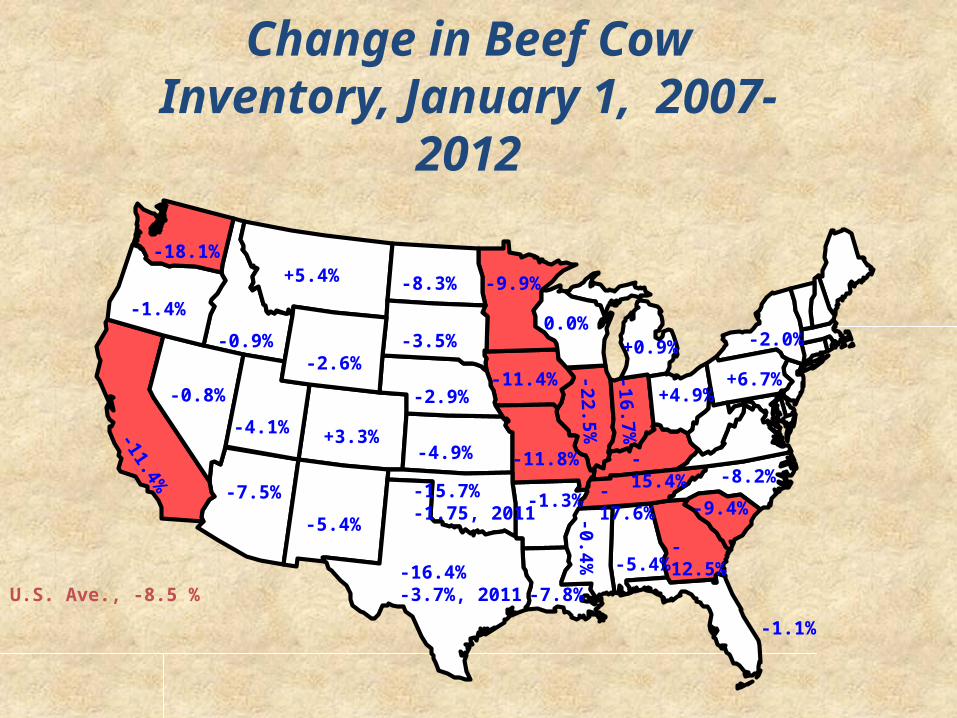
U.S. Ave., -8.5 %
Change in Beef Cow Inventory, January 1, 2007-2012
-11.4%
-18.1%
-1.4%
+5.4%
-0.9%-2.6%
+3.3%-4.9%
-15.7%-1.75, 2011-5.4%
-4.1%
-16.4%-3.7%, 2011
-11.8%
-1.1%
-15.4%
-8.3%
-3.5%
-2.9%
-17.6%
-5.4%-12.5%
-1.3%
-11.4%-0.8%
-7.5%
-9.9%
-7.8%
0.0%
-22.5%
-16.7%
-0.4%
-9.4%
-8.2%
+4.9%
+0.9%
+6.7%
-2.0%
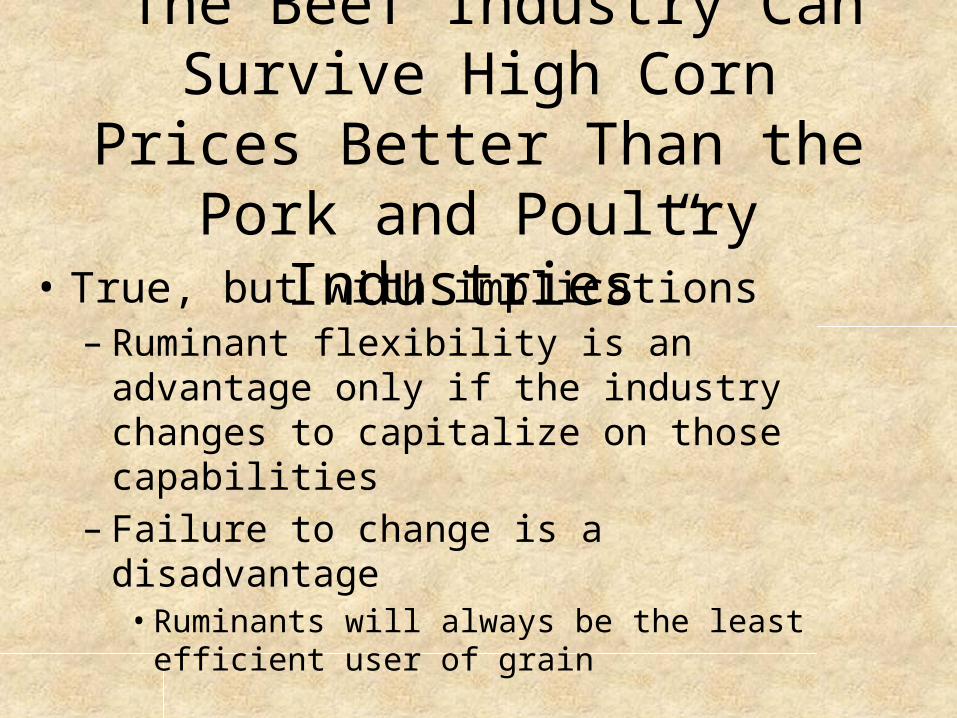
“The Beef Industry Can Survive High Corn Prices Better Than the
Pork and Poultry Industries”• True, but with implications
– Ruminant flexibility is an advantage only if the industry changes to capitalize on those capabilities
– Failure to change is a disadvantage• Ruminants will always be the least efficient user of
grain
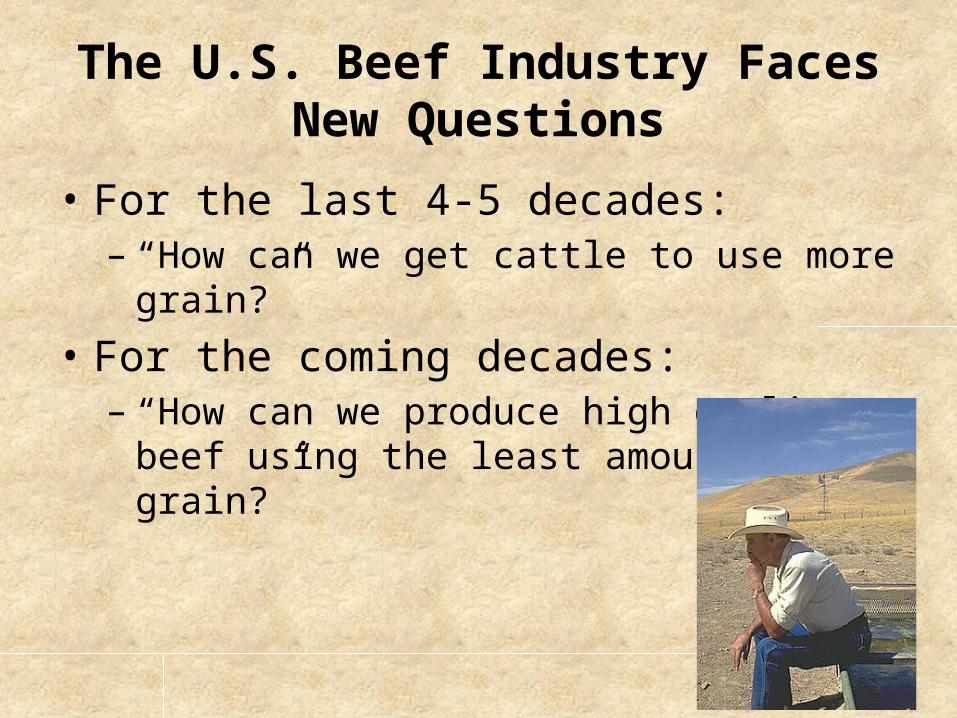
The U.S. Beef Industry Faces New Questions
• For the last 4-5 decades:– “How can we get cattle to use more grain?”
• For the coming decades:– “How can we produce high quality beef using the
least amount of grain?”

The Weekly Email NewsletterFrom OSU Animal Science and Agricultural Economics
Send Email to [email protected]

THANK YOU!