(maintained) xinyi glass · pdf filedeclining natural gas import prices and potentially...
TRANSCRIPT

Hong Kong Reinitiating Coverage
See important disclosures at the end of this report 1
Powered by the EFA Platform
14 September 2016 Industrial | Misc. Manufacturer
Xinyi Glass Holdings Buy (Maintained)
Target Price: HKD8.40
Price: HKD7.21
Recovery To Continue Market Cap: USD3,543m
Bloomberg Ticker: 868 HK We resume coverage on Xinyi with a BUY and higher TP of HKD8.40 (from HKD5.20, 17% upside). We remain bullish on the stock due to: 1. Strong recurring net profit CAGR of 28% in FY15-17F, primarily driven
by continued float glass GPM expansion and low-teen topline growth; 2. Undemanding valuations – TP implies 10x FY17F P/E, close to 10-year
mean (ex-Xinyi Solar implied P/E of 11x vs 10-year mean of 13x). This report marks the transfer of coverage to Cyrus Chong.
Share Data
Avg Daily Turnover (HKD/USD) 77.0m/9.93m
52-wk Price low/high (HKD) 3.23 - 7.08
Free Float (%) 53
Shares outstanding (m) 3,881
Estimated Return 17%
Shareholders (%)
Chairman Lee Yin Yee 21.3
Other management staff 25.6
Share Performance (%)
YTD 1m 3m 6m 12m
Absolute 64.8 6.5 31.9 66.3 121.1
Relative 56.3 (0.9) 18.8 48.4 107.0
Source: Bloomberg
Source: Bloomberg
Recovery at float glass segment to sustain, premised on:
i. Volume growth, stable pricing, market share gains from weaker competitors, Government supply-side reforms and industry rationalisation;
ii. Improved demand from the property construction sector, a key user of float glass in China;
iii. Declining natural gas import prices and potentially further domestic price cuts by China’s National Development and Reform Commission (NDRC).
Our price checks indicate that industry float glass prices are up 10% YoY in 9M16 (1H16: 5.9%) while imported natural gas cost fell by c.31% YoY in 8M16 (2015: -26%). We expect float glass sales to grow by 6%/6% and GPM to expand to 22.4%/24.4% in FY16/17F respectively (1H16 GPM: 22.3%).
Automobile and construction glass are stable growth drivers, given:
i. Strategic focus on high value-added low-emission (low-e) glass (for construction) and stable after-sales market (for automobile);
ii. High level of vertical integration and economies of scale;
iii. Rising demand for low-e glass on supportive Government policies.
We expect the automobile/construction glass segments to deliver revenue CAGR of 6%/10% respectively in FY15-18F on resilient gross margins.
Solar exposure via top-of-class platform. Xinyi Glass Holdings (Xinyi) has
valuable solar sector exposure via c.27%-associate, Xinyi Solar Holdings (Xinyi Solar) (968 HK, NR), a well-run solar business platform with a dominant market position and experiencing explosive growth in downstream solar farm operations. Profit contributions from Xinyi Solar are expected to rise by 77%/37%/27% in FY16-18F, and account for c.17-22% of Xinyi’s pre-tax profit. The stake in Xinyi Solar is worth c.HK$5.8bn (c.21% of Xinyi’s market cap).
BUY with higher HKD8.40 TP, pegged at 10x FY17F P/E, close to 10-year
mean. Our new TP also implies 2.1x FY17F P/BV (1SD> LT-average), which we believe is fair as the company is in an earnings upcycle. Excluding Xinyi Solar, our TP implies 11x FY17F P/E for its non-solar glass businesses, below the historic average of 13x. Key risks include a rebound in production capacity in the float glass industry and sharp recovery in natural gas prices.
Source: Company data, RHB
Forecasts and Valuations Dec-14 Dec-15 Dec-16F Dec-17F Dec-18F
Total turnover (HKDm) 10,861 11,460 12,926 14,283 15,725
Reported net profit (HKDm) 1,364 2,113 2,852 3,293 3,813
Recurring net profit (HKDm) 1,146 1,819 2,852 3,293 3,813
Recurring net profit growth (%) (45.9) 58.7 56.8 15.5 15.8
Recurring EPS (HKD) 0.30 0.46 0.73 0.84 0.97
DPS (HKD) 0.15 0.26 0.35 0.41 0.47
Recurring P/E (x) 23.9 15.3 9.7 8.4 7.3
P/B (x) 2.25 2.18 1.93 1.76 1.60
P/CF (x) 14.1 9.9 7.8 6.8 6.0
Dividend Yield (%) 2.1 3.7 5.0 5.8 6.7
EV/EBITDA (x) 15.3 11.4 8.0 7.2 6.5
Return on average equity (%) 11.1 16.9 21.0 21.8 23.1
Net debt to equity (%) 42.0 37.2 33.1 26.7 20.1
Our vs consensus EPS (adjusted) (%) 5.4 3.7 5.7
88
119
150
181
212
2.8
3.8
4.8
5.8
6.8
Xinyi Glass Holdings (868 HK)Price Close Relative to Hang Seng Index (RHS)
10
20
30
40
50
60
70
九月
-15
十一月
-15
一月
-16
三月
-16
五月
-16
七月
-16
Vol m
Analyst
Cyrus Chong
+852 2103 9424

Xinyi Glass Holdings Hong Kong Initiating Coverage
14 September 2016 Industrial | Misc. Manufacturer
See important disclosures at the end of this report 2
Financial Exhibits
Financial model updated on: 2016-09-07.
Asia
Hong Kong
Industrial
Xinyi Glass Holdings
Bloomberg 868 HK
Buy
Valuation basis
Long-term average P/E.
Key drivers
i. Float glass price; ii. Natural gas costs.
Key risks
i. Weaker-than-expected glass demand and sharp rebound in raw material costs (in particular natural gas cost).
Company Profile
Founded in 1988 and listed in 2005, Xinyi Glass (Xinyi) is one of the largest glass producers in China. It has six major production bases – in Dongguan, Shenzhen, Jiangmen, Wuhu, Tianjin and Yingkou. It is also a one-stop maker of float glass, solar glass, auto glass and construction glass. The company's three major business segments – float glass, low-e construction glass and auto glass – accounted for 44%, 23% and 33% of total revenue in FY15. Xinyi spun off its solar business arm, Xinyi Solar (968 HK, NR), in late 2013, and now holds a 26.6% stake in the latter. The company also has an overseas production base in Malacca, Malaysia.
Xinyi’s 1-year forward P/E
Source: Bloomberg
Source: Company data, RHB
0
5
10
15
20
25
Ja
n-0
6
Ju
l-0
6
Ja
n-0
7
Ju
l-0
7
Ja
n-0
8
Ju
l-0
8
Ja
n-0
9
Ju
l-0
9
Ja
n-1
0
Ju
l-1
0
Ja
n-1
1
Ju
l-1
1
Ja
n-1
2
Ju
l-1
2
Ja
n-1
3
Ju
l-1
3
Ja
n-1
4
Ju
l-1
4
Ja
n-1
5
Ju
l-1
5
Ja
n-1
6
Ju
l-1
6
Mean: 10.5x
-1sd: 7.0x
-2sd: 3.4x
+1sd: 14.1x
+2sd: 17.64x
(x)
Financial summary Dec-14 Dec-15 Dec-16F Dec-17F Dec-18F
Recurring EPS (HKD) 0.30 0.46 0.73 0.84 0.97
EPS (HKD) 0.35 0.54 0.73 0.84 0.97
DPS (HKD) 0.15 0.26 0.35 0.41 0.47
BVPS (HKD) 3.15 3.24 3.67 4.02 4.41
Weighted avg adjusted shares (m) 3,877 3,922 3,922 3,922 3,922
Valuation metrics Dec-14 Dec-15 Dec-16F Dec-17F Dec-18F
Recurring P/E (x) 23.9 15.3 9.7 8.4 7.3
P/E (x) 20.1 13.1 9.7 8.4 7.3
P/B (x) 2.25 2.18 1.93 1.76 1.60
FCF Yield (%) 0.8 3.0 6.8 9.3 11.3
Dividend Yield (%) 2.1 3.7 5.0 5.8 6.7
EV/EBITDA (x) 15.3 11.4 8.0 7.2 6.5
EV/EBIT (x) 23.8 17.1 10.6 9.5 8.3
Income statement (HKDm) Dec-14 Dec-15 Dec-16F Dec-17F Dec-18F
Total turnover 10,861 11,460 12,926 14,283 15,725
Gross profit 2,733 3,133 4,451 4,943 5,473
EBITDA 1,707 2,282 3,344 3,709 4,100
Depreciation and amortisation (612) (763) (820) (880) (922)
Operating profit 1,095 1,518 2,525 2,829 3,177
Net interest (38) (50) (51) (52) (33)
Income from associates & JVs 138 317 560 767 975
Exceptional income - net 254 331 0 0 0
Pre-tax profit 1,593 2,380 3,279 3,830 4,434
Taxation (228) (266) (426) (536) (621)
Minority interests (1) (0) (0) (0) (0)
Recurring net profit 1,146 1,819 2,852 3,293 3,813
Cash flow (HKDm) Dec-14 Dec-15 Dec-16F Dec-17F Dec-18F
Cash flow from operations 1,944 2,806 3,576 4,077 4,639
Capex (1,729) (1,967) (1,700) (1,500) (1,500)
Cash flow from investing activities (1,729) (1,967) (1,700) (1,500) (1,500)
Proceeds from issue of shares (165) 0 0 0 0
Dividends paid (902) (608) (1,284) (1,482) (1,716)
Cash flow from financing activities (72) (625) (1,284) (1,482) (1,716)
Balance sheet (HKDm) Dec-14 Dec-15 Dec-16F Dec-17F Dec-18F
Total cash and equivalents 832 1,300 1,264 1,813 2,553
Tangible fixed assets 13,205 13,350 14,741 15,373 15,961
Intangible assets 79 75 75 75 75
Total investments 2,912 2,972 2,972 2,972 2,972
Total other assets 34 29 29 29 29
Total assets 21,034 21,422 22,837 24,408 26,149
Short-term debt 2,529 2,514 2,514 2,514 2,514
Other liabilities 255 63 63 63 63
Total liabilities 8,699 8,696 8,441 8,631 8,830
Shareholders' equity 12,333 12,718 14,388 15,770 17,311
Minority interests 2 7 7 7 7
Total equity 12,335 12,726 14,396 15,777 17,318
Net debt 5,181 4,729 4,764 4,215 3,475
Total liabilities & equity 21,034 21,422 22,837 24,408 26,149
Key metrics Dec-14 Dec-15 Dec-16F Dec-17F Dec-18F
Revenue growth (%) 9.3 5.5 12.8 10.5 10.1
Recurrent EPS growth (%) (47.1) 56.9 56.8 15.5 15.8
Gross margin (%) 25.2 27.3 34.4 34.6 34.8
Operating EBITDA margin (%) 15.7 19.9 25.9 26.0 26.1
Net profit margin (%) 12.6 18.4 22.1 23.1 24.2
Dividend payout ratio (%) 43.1 48.7 48.7 48.7 48.7
Capex/sales (%) 15.9 17.2 13.2 10.5 9.5
Interest cover (x) 12.1 16.8 26.2 29.3 32.9

Xinyi Glass Holdings Hong Kong Reinitiating Coverage
14 September 2016 Industrial | Misc. Manufacturer
See important disclosures at the end of this report 3
Head-To-Head Comparison Of Listed Peers
Source: Company data, RHB
Xinyi Glass Flat Glass China Glass Fuyao Glass Luoyang Glass CSG (南玻集团) Kibing (株洲旗滨)Recovery Play PV Glass Manufacturing Play Victim of Industry Consolidation Best-in-Class Auto Glass in OEM A High-Cost Producer Expensive Recovery Play Over-Diversification
Company Background
Ticker 868 HK 6865 HK 3300 HK 3606 HK, 600660 CH 1108 HK 000012 CH 601636 CH
Rating BUY NR NR NR NR NR NR
Year est. 1988 1998 2004 1987 1994 1984 2005
Major shareholder Lee Yin Yee Ruan Hongliang Cao Zhijiang Cho Tak Wong State-owned Qianhai Insurance Kibing Group
Operation Background
# of employees 12,746 ~3,000 4,078 21,833 ~4,000 ~10,000 ~6,000
# of production lines n/a ~60 17 n/a n/a ~15 23
o/w: float n/a 2 14 n/a n/a 10 n/a
Daily float glass melting capacity (tpd) ~13,800 ~1,200 7,630 n/a ~2,000 ~7,000-8,000 14,600
Export as % of sales ~30% ~40% ~29% ~50% Limited ~10% ~3%
Foothold markets Anhui, Tianjin, Guangdong Jiangsu, Shandong Fujian, Shanghai, Chongqing Henan Fujian, Guangdong, Hunan
Key products Float, Low-E, Auto glass PV, float, Low-E Float, PV, Low-E Auto glass, float Ultra-thin float, silica sand Flat, Low-E, PV, electronic glass Float, Low-E, PV
Key COGS items (our estimates)Natural gas (30% ), Electricity (12),
Soda ash (10), PVB (9)
Fuel (24% ), Electricity (13), Soda ash
(13), Packaging materials and coating
liquid (12), Silica sand (11)
Energy (45), Soda ash (15)Float glass (28% ), Energy (16), PVB
(11)Energy (45% ), Soda ash (10) Natural gas (30% ), Soda ash (10) Natural gas (30% ), Soda ash (10)
Float glass capacity growth (2015) +9.6% Flat Flat n/a n/a n/a n/a
Float glass capacity growth (2016e) +15.8% Flattish Flattish n/a n/a n/a n/a
Customer/Product Mix
Automotive glass 33% 0% ~97% 0% n/a
Construction glass 23% ~12% 0% 0% ~36%
Float glass 44% ~10% ~100% for internal use ~100% ~44%
PV glass Thru' 26%-owned XYS ~75%
Others 0% ~3% ~3% 0 ~20%
Financial data - 1H16
Revenue (Rmb mn) 5,885 1,522 918 7,584 137 4,228 3,013
% y/y 11% 1.6% -3% 15% -63% 27% 30%
Net profit (Rmb mn) 1,369 331 -94 1,440 -26 467 125
% y/y 45% 71% n/a 18% n/a 127% 100%
GPM (% ) 34.7% 36.8% 10.5% 42.2% 5.9% n/a 20.5%
NPM (% ) 23.3% 21.8% -10.3% 19.0% -18.8% 11.0% 4.1%
Financial data - FY15
Revenue (Rmb mn) 11,460 2,914 1,969 13,573 662 7,430 5,169
% y/y 6% 3% -21% 5% 0% 5% 4%
Net profit (Rmb mn) 2,113 434 -426 2,605 144 300 171
% y/y 55% 10% n/a 17% 583% -32% -45%
GPM (% ) 27.3% 29.3% 4.0% 41.5% 2.4% 21.6% 18.0%
NPM (% ) 18.4% 14.9% -21.7% 19.2% Core NPM: -0.1% 8.4% 3.3%
Staff costs as % of sales 8.5% 6.9% 13.7% 15.0% 7.6% 3.7% 2.2%
R&D as % of sales n/a 3.5% 0.1% 4.4% 2.1% 3.2% n/a
Net debt to equity 38% 5% 47% -7% 221% 65% 82%
Primarily construction glass Primarily construction glass

Xinyi Glass Holdings Hong Kong Reinitiating Coverage
14 September 2016 Industrial | Misc. Manufacturer
See important disclosures at the end of this report 4
Float Glass Business Recovery Intact
Float glass business recovery momentum to sustain
We expect the float glass business of Xinyi (c.44%/18% of total revenue/GP respectively in FY15 and historically a key swing factor to Xinyi’s overall profitability) to report decent profit growth and continued margin recovery in 2H16 and FY17.
In our view, the recovery is premised on:
i. Mid-single digit to low-teen volume growth and stable pricing, as Xinyi gains market share from weaker competitors on Government’s supply-side reform initiatives and rationalisation of industry supply;
ii. Improved demand from the property construction sector, a key user of float glass in China;
iii. Declining natural gas import prices into China and further potential domestic price cuts by China’s National Development and Reform Commission in 2016/2017.
Accelerated float glass price rebound since May
Float glass market prices across major cities in China have rebounded since Jun-2015. Following a 5.9% YoY increase in 1H16, industry float glass prices continued to rise c.12% since end-1H16.
In our view, this recovery trend should continue into 2H16 and FY17F on the back of improved industry supply dynamics. We reckon that many high-cost regional producers with substandard production lines have exited the market following years of cost pressures as a result of high raw material costs (including heavy oil and natural gas). We estimate that every 1% change in float glass average selling prices (ASPs) will lead to a 1.5% change in Xinyi’s net profit.
In fact, effective capacity (ie capacity operating on a regular basis) of the flat glass industry (of which float glass represented c.80% in 2015) declined by c.3% YoY in 2015, according to Xinyi.
As at August, there were 352 float glass production lines in China, of which 239 were effective. The number of suspended lines accounted for c.32% of total production lines in China. While we believe that some idle lines have been put back to operation on improved margin outlook – given that suspended lines fell from 38% in April – we believe the rebound in effective capacity will be manageable, as many remain unprofitable even at the current price/cost levels.
In addition, as private enterprises represent some 80% of the float glass market, chances of having poor performing state-owned players are lower. For instance, the collapse of the Jiangsu Farun (the largest glass manufacturer for over a decade until 2010) in 2015 due to over expansion and substandard pollution control, shows inefficient players will not be bailed out.
Overall, we are projecting flattish effective industry capacity growth in 2016/17, as smaller players exit the market on low efficiency, and the Government pushes supply-side reform initiatives.

Xinyi Glass Holdings Hong Kong Reinitiating Coverage
14 September 2016 Industrial | Misc. Manufacturer
See important disclosures at the end of this report 5
Figure 1: Average float glass prices in China
Source: Wind, RHB
Figure 2: Number of float glass production lines in China Figure 3: Percentage of production lines in suspension
Source: Wind, RHB Source: Wind, RHB
Although we saw a modest rebound in effective daily capacity in recent months as some idle production lines have been put back to operation, we are of the view that the modest supply increase has been largely absorbed by the market given stable industry inventory levels.
Inventory levels have actually declined from c.35m weight cases to c.32m weight cases since March. Inventory levels as a percentage of effective capacity has been stable at c.3-4% for the past one year, implying healthy supply/demand dynamics.
100
150
200
250
300
350
400
Jan-0
7
Jul-07
Jan-0
8
Jul-08
Jan-0
9
Jul-09
Jan-1
0
Jul-10
Jan-1
1
Jul-11
Jan-1
2
Jul-12
Jan-1
3
Jul-13
Jan-1
4
Jul-14
Jan-1
5
Jul-15
Jan-1
6
Jul-16
# of production lines # of effective production lines
32.10
0
5
10
15
20
25
30
35
40
Jan-0
7
Jul-07
Jan-0
8
Jul-08
Jan-0
9
Jul-09
Jan-1
0
Jul-10
Jan-1
1
Jul-11
Jan-1
2
Jul-12
Jan-1
3
Jul-13
Jan-1
4
Jul-14
Jan-1
5
Jul-15
Jan-1
6
Jul-16
(%)
1,236
1,123
1,214
1,000
1,200
1,400
1,600
1,800
2,000
2,200
Dec - 09 Dec - 10 Dec - 11 Dec - 12 Dec - 13 Dec - 14 Dec - 15
Float Glass Price 2014 Ave.
2015 Ave. YTD Ave. (CNY/ton)

Xinyi Glass Holdings Hong Kong Reinitiating Coverage
14 September 2016 Industrial | Misc. Manufacturer
See important disclosures at the end of this report 6
Figure 4: Float glass industry capacity in China Figure 5: Float glass sales in China
Source: Wind, RHB Source: Wind, RHB
Figure 6: Float glass industry utilisation rates in China Figure 7: Float glass industry inventory levels in China
Source: Wind, RHB Source: Wind, RHB
End-market demand stabilises
According to the China Architectural and Industrial Glass Industry Association, around 60% of float glass produced in China is used in construction and related industries (eg windows and walls), while automobile-related demand accounts for c.20% (a typical passenger vehicle uses 5-6 pieces of glass as wind shield, windows and display boards).
The turnaround in accumulated property new starts since February (c.13.7% YoY growth during 7M16) shows that demand from the property sector is picking up following two years of sluggishness.
The automobile market data also paints an encouraging picture. According to China Association of Automobile Manufacturers (CAAM), accumulated auto sales during 7M16 were up 9.8% YoY. The robust growth in new-energy vehicles (+98.1% YoY to 207,000 units during 7M16) and rising middle class in China should continue to drive auto-glass demand for both the new car and replacement markets.
According to CAAM, auto sales in China are expected to rise 6.1% YoY in 2016, which implies a healthy growth pace for the rest of 2016. CAAM also forecasts new-energy car sales to reach 700,000 in 2016.
300
500
700
900
1,100
1,300
1,500
Jan-10 Jan-11 Jan-12 Jan-13 Jan-14 Jan-15 Jan-16
Total capacity (mn weight cases)
Effective daily capacity (mn weight cases)
(20)
(10)
0
10
20
30
0
100
200
300
400
500
600
700
Jan
-08
Au
g-0
8
Ma
r-0
9
Oct
-09
Ma
y-1
0
De
c-1
0
Jul-1
1
Fe
b-1
2
Se
p-1
2
Ap
r-1
3
No
v-1
3
Jun
-14
Jan
-15
Au
g-1
5
Ma
r-1
6
Accumulated sales (mn weight cases, LHS)
% y/y (RHS)
50
60
70
80
90
100
110
Jan-0
7
Jul-07
Jan-0
8
Jul-08
Jan-0
9
Jul-09
Jan-1
0
Jul-10
Jan-1
1
Jul-11
Jan-1
2
Jul-12
Jan-1
3
Jul-13
Jan-1
4
Jul-14
Jan-1
5
Jul-15
Jan-1
6
Jul-16
Utilization (%)
0.0
1.0
2.0
3.0
4.0
5.0
6.0
0
5
10
15
20
25
30
35
40
Jan-0
7
Aug-0
7
Mar-
08
Oct-
08
May-
09
Dec-0
9
Jul-10
Feb-1
1
Sep-1
1
Apr-
12
Nov-1
2
Jun-1
3
Jan-1
4
Aug-1
4
Mar-
15
Oct-
15
May-
16
Inventory (mn weight cases)
Inventory (as % of effective capacity, RHS)

Xinyi Glass Holdings Hong Kong Reinitiating Coverage
14 September 2016 Industrial | Misc. Manufacturer
See important disclosures at the end of this report 7
Figure 8: Property new start gross floor area (GFA) in China Figure 9: Auto sales growth in China
Source: Wind, RHB Source: Wind, RHB
Natural gas price decline, stable soda ash price – additional margin drivers
Based on information disclosed by peer companies – including Flat Glass Group (FGG) (6865 HK, NR) and Fuyao Glass Industry Group (Fuyao) (3606 HK, NR) – we estimate that natural gas cost accounts for c.30% of Xinyi’s total cost of goods sold (COGS), followed by electricity (c.12%), soda ash (c.10%) and polyvinyl butyral (PVB) (c.9%). According to Xinyi’s management, imported natural gas accounts for c.40% of total gas usage (mainly for its production plants in Guangdong) while domestic gas sources account for the remaining c.60%.
Figure 10: Estimated float glass COGS breakdown Figure 11: Estimated automobile glass COGS breakdown
Source: Company data, RHB Source: Company data, RHB
The imported natural gas price is closely tied to international gas prices, which have plummeted c.50% since 2014 as the shale gas boom in US ignited an oversupply situation. For instance, imported gas price (in USD terms) has declined by c.31% YoY during 8M16, after falling c.26% YoY in 2015.
Domestic gas prices are regulated by the NDRC with price adjustments on an irregular basis. In Nov 2017, NDRC initiated a price cut of CNY0.7/cubic meter (c.28% cut on average) for non-residential city-gate gas. The market is generally expecting another price cut in late-2016 or 2017, given weak downstream industrial demand on elevated domestic prices.
Soda ash, another key cost component, has seen stable price movements in the range of c.CNY1,200-1,500/tonne in the past few years. Given the balanced supply and demand situation in China and globally, we expect the stable price trend for soda ash to continue into 2H16F and FY17F.
(40)
(20)
0
20
40
60
80
0
500
1,000
1,500
2,000
2,500
Aug-0
6
Feb-0
7
Aug-0
7
Feb-0
8
Aug-0
8
Feb-0
9
Aug-0
9
Feb-1
0
Aug-1
0
Feb-1
1
Aug-1
1
Feb-1
2
Aug-1
2
Feb-1
3
Aug-1
3
Feb-1
4
Aug-1
4
Feb-1
5
Aug-1
5
Feb-1
6
Accumulated Property New Start GFA (mn sqm., LHS)
Accumulated Property New Start GFA (% y/y, RHS)
(40)
(30)
(20)
(10)
0
10
20
30
40
50
60
Jan-1
1
Apr-
11
Jul-11
Oct-
11
Jan-1
2
Apr-
12
Jul-12
Oct-
12
Jan-1
3
Apr-
13
Jul-13
Oct-
13
Jan-1
4
Apr-
14
Jul-14
Oct-
14
Jan-1
5
Apr-
15
Jul-15
Oct-
15
Jan-1
6
Apr-
16
Jul-16
Cumulative Auto Sales Growth (% y/y)
Energy costs, 45.0%
Soda ash, 14.9%
Other raw materials, 12.7%
D&A, 12.6%
Others, 11.0%
Wages, 3.8%
Float glass, 33.8%
Other raw materials, 17.9%
PVB, 13.4%
Wages, 11.6%
Energy costs, 10.0%
Others, 6.7%
D&A, 6.6%

Xinyi Glass Holdings Hong Kong Reinitiating Coverage
14 September 2016 Industrial | Misc. Manufacturer
See important disclosures at the end of this report 8
Figure 12: Liquefied natural gas import price in China Figure 13: Soda ash price in China
Source: Wind, RHB Source: Wind, RHB
Respectable market share gains over the past decade
The float glass industry in China is highly fragmented with the top 10 players accounting for c.34% of total capacity. According to our estimates, Xinyi is the largest player with c.6.6% market share by capacity as at August.
Our calculations show that Xinyi has gained market share from competitors since the financial crisis in 2008, by leveraging on its solid balance sheet and ready access to international funding sources supported by its HK listing status. We highlight that Xinyi’s float glass capacity has jumped from c.2,600 tonnes/day at end-2006 to c.13,800 tonnes/day at the end of August, whilst its market share has increased from an estimated 2% to 6.6% over the same period.
Figure 14: Xinyi’s market share in China by capacity Figure 15: Float glass market share by capacity (August)
Source: Wind, RHB Source: Wind, RHB
611
451
348
0
100
200
300
400
500
600
700
800
Jul-06 Jul-07 Jul-08 Jul-09 Jul-10 Jul-11 Jul-12 Jul-13 Jul-14 Jul-15
LNG Price 2014 Ave. 2015 Ave. YTD Ave.(US$/ton)
1,398
1,332
1,356
700
900
1,100
1,300
1,500
1,700
1,900
2,100
2,300
2,500
Jan-10 Jan-11 Jan-12 Jan-13 Jan-14 Jan-15 Jan-16
Soda Ash Px 2014 Ave. 2015 Ave. YTD Ave.(CNY/ton)
0
1
2
3
4
5
6
7
Jul-07
Jan-0
8
Jul-08
Jan-0
9
Jul-09
Jan-1
0
Jul-10
Jan-1
1
Jul-11
Jan-1
2
Jul-12
Jan-1
3
Jul-13
Jan-1
4
Jul-14
Jan-1
5
Jul-15
Jan-1
6
Jul-16
(%)Xinyi信义, 6.6%
Kibing旗滨,
5.5%
Taiwan Glass台玻集团,
3.4% Hebei Yingxin迎
新, 3.4%
CSG南玻, 3.2%
Greatwall长
城, 3.0%
China Glass中国
玻璃, 2.7%
Zhejiang浙江
玻璃, 2.4%
Anquan安全,
2.3%
Fuyao福耀, 1.8%
Others, 65.6%
Xinyi Glass Holdings Hong Kong Reinitiating Coverage
14 September 2016 Industrial | Misc. Manufacturer
See important disclosures at the end of this report 9
Stable Auto Glass Business
Xinyi focuses on after-sales replacement market
The automotive glass market is typically divided into two segments:
i. Original equipment manufacturers (OEM) market for glass products that are sold to automobile manufacturers for installation on new vehicles;
ii. After sales replacement glass (ARG) market for products sold to aftermarket suppliers for replacement purposes.
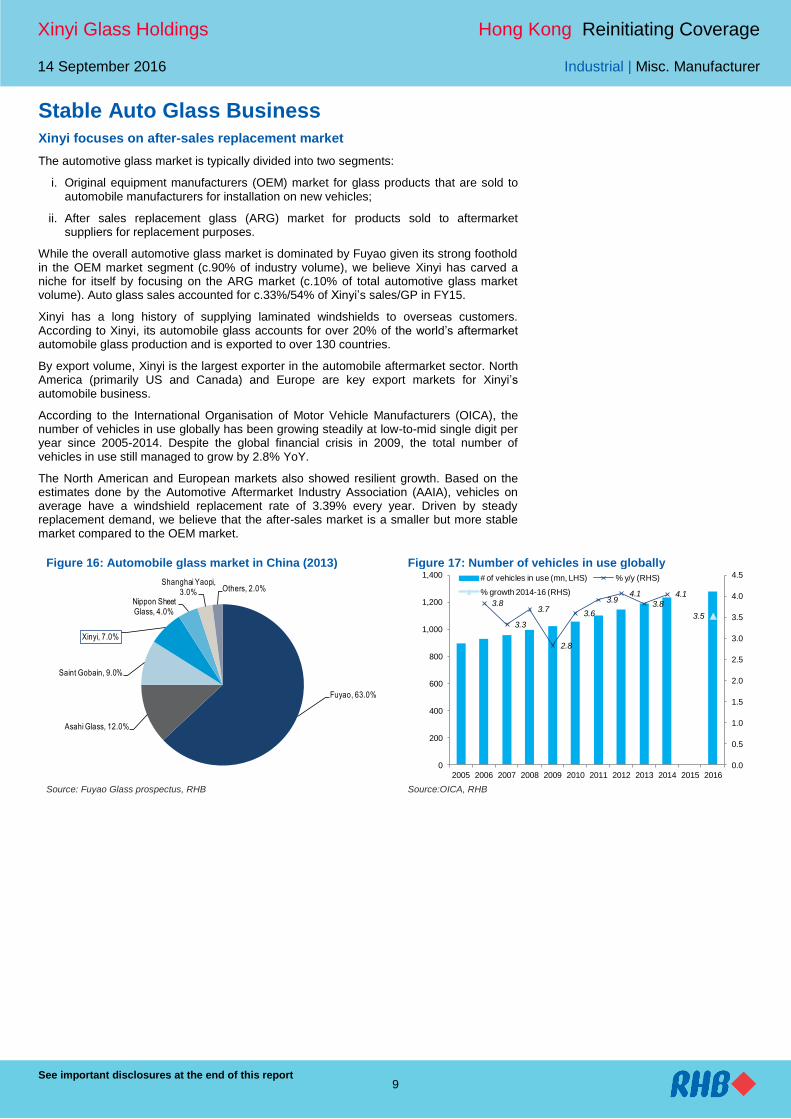
While the overall automotive glass market is dominated by Fuyao given its strong foothold in the OEM market segment (c.90% of industry volume), we believe Xinyi has carved a niche for itself by focusing on the ARG market (c.10% of total automotive glass market volume). Auto glass sales accounted for c.33%/54% of Xinyi’s sales/GP in FY15.
Xinyi has a long history of supplying laminated windshields to overseas customers. According to Xinyi, its automobile glass accounts for over 20% of the world’s aftermarket automobile glass production and is exported to over 130 countries.
By export volume, Xinyi is the largest exporter in the automobile aftermarket sector. North America (primarily US and Canada) and Europe are key export markets for Xinyi’s automobile business.
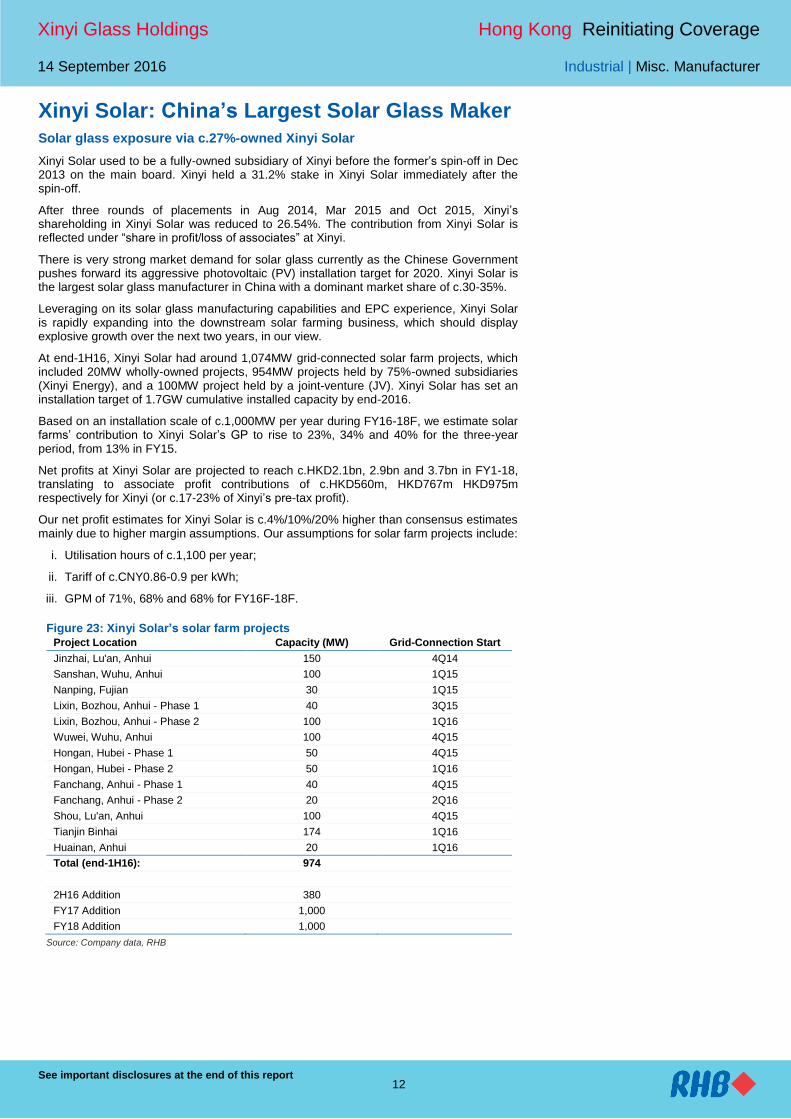
According to the International Organisation of Motor Vehicle Manufacturers (OICA), the number of vehicles in use globally has been growing steadily at low-to-mid single digit per year since 2005-2014. Despite the global financial crisis in 2009, the total number of vehicles in use still managed to grow by 2.8% YoY.
The North American and European markets also showed resilient growth. Based on the estimates done by the Automotive Aftermarket Industry Association (AAIA), vehicles on average have a windshield replacement rate of 3.39% every year. Driven by steady replacement demand, we believe that the after-sales market is a smaller but more stable market compared to the OEM market.
Figure 16: Automobile glass market in China (2013) Figure 17: Number of vehicles in use globally
Source: Fuyao Glass prospectus, RHB Source:OICA, RHB
Fuyao, 63.0%
Asahi Glass, 12.0%
Saint Gobain, 9.0%
Xinyi, 7.0%
Nippon Sheet Glass, 4.0%
Shanghai Yaopi, 3.0% Others, 2.0%
3.8
3.3
3.7
2.8
3.6
3.94.1
3.8
4.1
3.5
0.0
0.5
1.0
1.5
2.0
2.5
3.0
3.5
4.0
4.5
0
200
400
600
800
1,000
1,200
1,400
2005 2006 2007 2008 2009 2010 2011 2012 2013 2014 2015 2016
# of vehicles in use (mn, LHS) % y/y (RHS)
% growth 2014-16 (RHS)

Xinyi Glass Holdings Hong Kong Reinitiating Coverage
14 September 2016 Industrial | Misc. Manufacturer
See important disclosures at the end of this report 10
Figure 18: Number of vehicles in use in North America Figure 19: Number of vehicles in use in Europe
Source: OICA, RHB Source:OICA, RHB
Industry supply-demand dynamics
Float glass is a major type of raw flat glass, generally used for further processing into other glass products (eg curtail walls, household glass, automobile glass) and accounted for over 90% of all flat glass production in China. Therefore, flat glass industry data is highly representative of the float glass industry.
The flat glass industry has long been a target for the NDRC to impose out-dated capacity elimination and tighter environmental controls on new capacity. According to the Ministry of Industry and Information Technology (MIIT) in China, flat glass capacity of c.173m weight cases per year has been eliminated by the Chinese Government since 2010-2014.
We estimate a further c.51.8m/53.8m of capacity to be eliminated by the Government in 2015/2016. Together with some out-dated capacity eliminated (to be eliminated) by market forces, we estimate that effective capacity has declined by c.11% in 2015, and will only grow by a modest 4%/3% in 2016/2017.
Figure 20: Flat glass industry supply and demand
(m weight case/year) 2008 2009 2010 2011 2012 2013 2014 2015 2016F 2017F
New addition
88.0 106.0 117.0 84.0 82.0 87.0 -46.0 46.0 40.0
Total capacity 603.0 691.0 797.0 914.0 998.0 1080.0 1167.0 1121.0 1167.0 1207.0
Capacity phased out by Gov't
18.4 30.4 58.6 28.0 37.6 51.8^ 53.8 55.8
Idle/Phased-out capacity 104.0 107.0 90.0 174.0 169.0 190.0 196.0 259.0 269.0 279.0
Effective capacity 499.0 584.0 707.0 740.0 829.0 890.0 971.0 862.0 898.0 928.0
% YoY
17% 21% 5% 12% 7% 9% -11% 4% 3%
Production 598.9 585.7 663.3 791.1 750.5 792.9 831.3 738.6 769.5 795.2
Source: Wind, MIIT, RHB. ^Our estimates
3.7
2.2
1.3
0.30.2
0.9
1.31.1
2.2
0.0
0.5
1.0
1.5
2.0
2.5
3.0
3.5
4.0
250,000
260,000
270,000
280,000
290,000
300,000
310,000
320,000
2005 2006 2007 2008 2009 2010 2011 2012 2013 2014
# of Vehicles in use in North America (mn, LHS) % y/y (RHS)
2.4
1.4
3.0
1.1
1.7
2.0
1.8 1.9 1.9
0.0
0.5
1.0
1.5
2.0
2.5
3.0
3.5
290,000
300,000
310,000
320,000
330,000
340,000
350,000
360,000
370,000
380,000
390,000
2005 2006 2007 2008 2009 2010 2011 2012 2013 2014
# of Vehicles in use in Europe (mn, LHS) % y/y (RHS)

Xinyi Glass Holdings Hong Kong Reinitiating Coverage
14 September 2016 Industrial | Misc. Manufacturer
See important disclosures at the end of this report 11
Leader In Energy-Saving Construction Glass
Largest low-e glass manufacturer in China
Xinyi is the largest manufacturer of energy-saving low-e construction glass in China, with a market share of c.18% in terms of sales volume (2014).
Low-e glass is a type of glass that is coated with a thin film to reduce the emission of radiant infrared energy. Low-e glass is generally used in the real estate industry to improve the energy efficiency of buildings via reducing thermal exchange between the building and the outside environment.
Low-e glass is a major product within the architectural glass product type. The low-e glass segment is rather consolidated with the top four players accounting for c.57% of the total market.
According to Frost & Sullivan, the sales volume for low-e glass in China is expected to reach 280.9m square meter in 2020 from 158.2m sqm in 2014, translating to c.10% CAGR over the same period. We believe the strong growth is primarily driven by rising standards on the energy efficiency of buildings in China.
The penetration rate of low-e glass in China is still very low at c.11%, compared to >80% in developed countries such as Germany and the US. Construction glass (primarily low-e glass) accounted for c.23%/29% of Xinyi’s sales/GP in FY15.
Figure 21: Low-e glass penetration rates Figure 22: China’s low-e glass industry market share by volume (2014)
Source: ASKCI, RHB Source: Flat Glass, RHB
0
10
20
30
40
50
60
70
80
90
100
Chin
a
Pola
nd
South
Kore
a
Germ
any
(%)
Xinyi, 18.0%
Kibing, 14.2%
CSG, 13.3%Taiwan Glass, 11.4%
Others, 43.1%
Xinyi Glass Holdings Hong Kong Reinitiating Coverage
14 September 2016 Industrial | Misc. Manufacturer
See important disclosures at the end of this report 12
Xinyi Solar: China’s Largest Solar Glass Maker
Solar glass exposure via c.27%-owned Xinyi Solar
Xinyi Solar used to be a fully-owned subsidiary of Xinyi before the former’s spin-off in Dec 2013 on the main board. Xinyi held a 31.2% stake in Xinyi Solar immediately after the spin-off.
After three rounds of placements in Aug 2014, Mar 2015 and Oct 2015, Xinyi’s shareholding in Xinyi Solar was reduced to 26.54%. The contribution from Xinyi Solar is reflected under “share in profit/loss of associates” at Xinyi.
There is very strong market demand for solar glass currently as the Chinese Government pushes forward its aggressive photovoltaic (PV) installation target for 2020. Xinyi Solar is the largest solar glass manufacturer in China with a dominant market share of c.30-35%.
Leveraging on its solar glass manufacturing capabilities and EPC experience, Xinyi Solar is rapidly expanding into the downstream solar farming business, which should display explosive growth over the next two years, in our view.
At end-1H16, Xinyi Solar had around 1,074MW grid-connected solar farm projects, which included 20MW wholly-owned projects, 954MW projects held by 75%-owned subsidiaries (Xinyi Energy), and a 100MW project held by a joint-venture (JV). Xinyi Solar has set an installation target of 1.7GW cumulative installed capacity by end-2016.
Based on an installation scale of c.1,000MW per year during FY16-18F, we estimate solar farms’ contribution to Xinyi Solar’s GP to rise to 23%, 34% and 40% for the three-year period, from 13% in FY15.
Net profits at Xinyi Solar are projected to reach c.HKD2.1bn, 2.9bn and 3.7bn in FY1-18, translating to associate profit contributions of c.HKD560m, HKD767m HKD975m respectively for Xinyi (or c.17-23% of Xinyi’s pre-tax profit).
Our net profit estimates for Xinyi Solar is c.4%/10%/20% higher than consensus estimates mainly due to higher margin assumptions. Our assumptions for solar farm projects include:
i. Utilisation hours of c.1,100 per year;
ii. Tariff of c.CNY0.86-0.9 per kWh;
iii. GPM of 71%, 68% and 68% for FY16F-18F.
Figure 23: Xinyi Solar’s solar farm projects Project Location Capacity (MW) Grid-Connection Start
Jinzhai, Lu'an, Anhui 150 4Q14
Sanshan, Wuhu, Anhui 100 1Q15
Nanping, Fujian 30 1Q15
Lixin, Bozhou, Anhui - Phase 1 40 3Q15
Lixin, Bozhou, Anhui - Phase 2 100 1Q16
Wuwei, Wuhu, Anhui 100 4Q15
Hongan, Hubei - Phase 1 50 4Q15
Hongan, Hubei - Phase 2 50 1Q16
Fanchang, Anhui - Phase 1 40 4Q15
Fanchang, Anhui - Phase 2 20 2Q16
Shou, Lu'an, Anhui 100 4Q15
Tianjin Binhai 174 1Q16
Huainan, Anhui 20 1Q16
Total (end-1H16): 974
2H16 Addition 380
FY17 Addition 1,000
FY18 Addition 1,000
Source: Company data, RHB

Xinyi Glass Holdings Hong Kong Reinitiating Coverage
14 September 2016 Industrial | Misc. Manufacturer
See important disclosures at the end of this report 13
Figure 24: Xinyi Solar’s raw PV glass capacity Figure 25: Xinyi Solar’s solar farm cumulative installed capacity
Source: Company data, RHB Source: Company data, RHB
Earnings Forecasts And Financials
Changes to our estimates
We have raised our earnings estimates for Xinyi after factoring in:
i. Higher ASP and margin estimates for the float glass segment following the strong 1H16 results, and sustained ASP and cost trends into 2H16F. We expect continued gross margin recovery for the float glass segment to 22.4%/24.2% in FY17F/FY18F due to the pick-up in property new start activities and more controlled industry capacity expansion;
ii. Stronger earnings contributions from Xinyi Solar, as we believe the solar farm expansion will accelerate into FY16F/FY17F. We have also introduced estimates for FY18 post the release of 1H16 results.
Overall, we have revised up our recurring net profit estimates by 38%/34% in FY16F/17F and are projecting growth of 57%/16%/16% in FY16-18F. The growth is primarily driven by:
i. Steady auto glass and construction glass businesses;
ii. Continued margin recovery at the float glass business;
iii. Rising contributions from solar power associate, Xinyi Solar.
Our net profit estimates for Xinyi are 4.3%/3.0%/4.2% higher than consensus estimates in FY16-18F.
2,000 2,000
3,800 3,900
5,800
6,800
0
1,000
2,000
3,000
4,000
5,000
6,000
7,000
8,000
FY12 FY13 FY14 FY15 FY16F FY17F
(tpd)
40250
610
1,600
2,600
3,600
0
500
1,000
1,500
2,000
2,500
3,000
3,500
4,000
FY13 FY14 FY15 FY16F FY17F FY18F
(MW)

Xinyi Glass Holdings Hong Kong Reinitiating Coverage
14 September 2016 Industrial | Misc. Manufacturer
See important disclosures at the end of this report 14
Figure 26: Changes to our Xinyi earnings estimates and turnover mix
FY16F FY17F FY18F
(HKDm) New Old Chg New Old Chg New
Turnover
Auto glass 4,014 4,211 -4.7% 4,255 4,378 -2.8% 4,510
Construction glass 2,946 3,412 -13.7% 3,213 3,829 -16.1% 3,505
Float glass 5,936 5,930 0.1% 6,714 6,554 2.4% 7,595
Total 12,895 13,553 -4.9% 14,182 14,761 -3.9% 15,610
GPM
Auto glass 49.0% 43.7% 5.3 ppt 48.0% 43.7% 4.3 ppt 48.0%
Construction glass 39.0% 31.0% 8.0 ppt 39.0% 31.0% 8.0 ppt 39.0%
Float glass 22.4% 11.9% 10.5 ppt 24.2% 13.8% 10.4 ppt 25.2%
Blended 34.4% 26.6% 7.8 ppt 34.6% 27.1% 7.5 ppt 34.8%
Revenue 12,926 13,553 -4.6% 14,283 14,761 -3.2% 15,725
Gross profit 4,451 3,605 23.5% 4,943 4,005 23.4% 5,473
Operating profit 2,770 2,005 38.2% 3,115 2,307 35.0% 3,492
Share of profit of an associate 560 439 27.6% 767 607 26.4% 975
Profit before tax 3,279 2,407 36.2% 3,830 2,876 33.2% 4,434
Reported net profit 2,852 2,061 38.4% 3,293 2,463 33.7% 3,813
Recurring net profit 2,852 2,061 38.4% 3,293 2,463 33.7% 3,813
Gross margin 34.4% 26.6% 7.8 ppt 34.6% 27.1% 7.5 ppt 34.8%
Operating margin 21.4% 14.8% 6.6 ppt 21.8% 15.6% 6.2 ppt 22.2%
Net margin 22.1% 15.2% 6.9 ppt 23.1% 16.7% 6.4 ppt 24.2%
Recurring profit margin 22.1% 15.2% 6.9 ppt 23.1% 16.7% 6.4 ppt 24.2%
Source: Company data, RHB
Figure 27: Xinyi’s net profit estimates vs consensus
(HKD m) 2016F 2017F 2018F
RHB 2,852 3,293 3,813
Consensus 2,734 3,198 3,658
% Difference 4.3% 3.0% 4.2%
Source: Bloomberg, Company data, RHB

Xinyi Glass Holdings Hong Kong Reinitiating Coverage
14 September 2016 Industrial | Misc. Manufacturer
See important disclosures at the end of this report 15
Figure 28: Xinyi’s detailed P&L
(HKDm) 1H15 2H15 1H16 2H16F FY14 FY15 FY16F FY17F FY18F
Revenue
Auto glass 1,897 1,890 1,990 2,024 3,593 3,787 4,014 4,255 4,510
Construction glass 1,206 1,445 1,220 1,711 2,556 2,651 2,931 3,197 3,488
Float glass 2,180 2,843 2,675 3,306 4,712 5,022 5,981 6,831 7,728
Total 5,283 6,177 5,885 7,040 10,861 11,460 12,926 14,283 15,725
% YoY
Auto glass 6.5% 4.2% 4.9% 7.1% 9.3% 5.4% 6.0% 6.0% 6.0%
Construction glass 11.8% -2.1% 1.1% 18.4% 18.6% 3.8% 10.6% 9.1% 9.1%
Float glass 0.2% 12.0% 22.7% 16.3% 4.9% 6.6% 19.1% 14.2% 13.1%
Total 4.9% 6.0% 11.4% 14.0% 9.3% 5.5% 12.8% 10.5% 10.1%
% Mix
Auto glass 35.9% 30.6% 33.8% 28.7% 33.1% 33.0% 31.1% 29.8% 28.7%
Construction glass 22.8% 23.4% 20.7% 24.3% 23.5% 23.1% 22.7% 22.4% 22.2%
Float glass 41.3% 46.0% 45.5% 47.0% 43.4% 43.8% 46.3% 47.8% 49.1%
GPM
Auto glass 44.1% 44.6% 48.7% 49.3% 41.8% 44.3% 49.0% 48.0% 48.0%
Construction glass 31.7% 35.6% 39.0% 39.0% 35.3% 33.9% 39.0% 39.0% 39.0%
Float glass 8.7% 12.9% 22.3% 22.5% 7.0% 11.1% 22.4% 24.2% 25.2%
Blended 26.7% 27.9% 34.7% 34.2% 25.2% 27.3% 34.4% 34.6% 34.8%
Revenue 5,283 6,177 5,885 7,040 10,861 11,460 12,926 14,283 15,725
% YoY 4.9% 6.0% 11.4% 14.0% 9.3% 5.5% 12.8% 10.5% 10.1%
COGS (3,873) (4,455) (3,844) (4,631) (8,128) (8,328) (8,475) (9,340) (10,252)
Gross profit 1,410 1,723 2,041 2,409 2,733 3,133 4,451 4,943 5,473
GPM 26.7% 27.9% 34.7% 34.2% 25.2% 27.3% 34.4% 34.6% 34.8%
Other income 112 103 104 51 178 215 155 186 204
Selling and marketing costs (312) (367) (351) (411) (608) (680) (763) (843) (912)
Administrative expenses (441) (494) (533) (630) (1,030) (935) (1,163) (1,271) (1,384)
Opex% sales (14.2%) (14.0%) (15.0%) (14.8%) (15.1%) (14.1%) (14.9%) (14.8%) (14.6%)
Gain on spin off -- -- -- -- -- -- -- -- --
Operating profit 944 1,168 1,304 1,467 1,494 2,113 2,770 3,115 3,492
OPM 17.9% 18.9% 22.2% 20.8% 13.8% 18.4% 21.4% 21.8% 22.2%
% YoY 11.9% 79.7% 38.1% 25.5% (59.2%) 41.4% 31.1% 12.4% 12.1%
Non-recurring items 156 -- -- -- 254 331 -- -- --
Finance costs (46) (44) (60) (36) (91) (90) (96) (96) (96)
Share of profit of an associate 161 157 312 248 138 317 560 767 975
PBT 1,085 1,295 1,572 1,707 1,593 2,380 3,279 3,830 4,434
Tax (138) (128) (202) (224) (228) (266) (426) (536) (621)
Tax rate (12.7%) (9.9%) (12.9%) (13.1%) 14.3% 11.2% 13.0% 14.0% 14.0%
Minority interests (2) 1 0 (0) (1) (0) (0) (0) (0)
Reported NP 945 1,168 1,370 1,483 1,364 2,113 2,852 3,293 3,813
NPM 17.9% 18.9% 23.3% 21.1% 12.6% 18.4% 22.1% 23.1% 24.2%
% YoY 24.0% 94.1% 45.0% 26.9% (61.3%) 55.0% 35.0% 15.5% 15.8%
Recurring NP 789 1,168 1,370 1,483 1,146 1,819 2,852 3,293 3,813
NPM 14.9% 18.9% 23.3% 21.1% 10.6% 15.9% 22.1% 23.1% 24.2%
% YoY 39.1% 130.1% 73.7% 26.9% (45.9%) 58.7% 56.8% 15.5% 15.8%
Source: Company data, RHB

Xinyi Glass Holdings Hong Kong Reinitiating Coverage
14 September 2016 Industrial | Misc. Manufacturer
See important disclosures at the end of this report 16
Figure 29: Xinyi’s key assumptions
2013 2014 2015 2016F 2017F 2018F
Sales (HK$ m)
Auto glass 3,287 3,593 3,787 4,014 4,255 4,510
Construction glass 2,155 2,556 2,651 2,931 3,197 3,488
Float glass 4,494 4,712 5,022 5,981 6,831 7,728
Total 9,936 10,861 11,460 12,926 14,283 15,725
Sales Mix (%)
Auto glass 33.1% 33.1% 33.0% 31.1% 29.8% 28.7%
Construction glass 21.7% 23.5% 23.1% 22.7% 22.4% 22.2%
Float glass 45.2% 43.4% 43.8% 46.3% 47.8% 49.1%
Revenue growth (%)
Auto glass 6.8% 9.3% 5.4% 6.0% 6.0% 6.0%
Construction glass 36.8% 18.6% 3.8% 10.6% 9.1% 9.1%
Float glass 18.9% 4.9% 6.6% 19.1% 14.2% 13.1%
Total 17.8% 9.3% 5.5% 12.8% 10.5% 10.1%
Capacity growth (%)
Auto glass 14% 10% 1% 5% 3% 2%
Construction glass 8% 40% 32% 19% 5% 4%
Float glass 5% 8% 10% 16% 7% 5%
Volume growth (%)
Auto glass 3% 6% 5% 6% 6% 6%
Construction glass 10% 18% 4% 10% 8% 8%
Float glass n/a 20% 10% 12% 11% 11%
ASP growth (%)
Auto glass 3% 3% 0% 0% 0% 0%
Construction glass 24% 0% 0% 1% 1% 1%
Float glass n/a -13% -3% 7% 3% 2%
Cost growth (%)
Per-unit natural gas cost n/a 4% -25% -25% 4% 4%
Gross margin (%)
Auto glass 43.3% 41.8% 44.3% 49.0% 48.0% 48.0%
Construction glass 39.9% 35.3% 33.9% 39.0% 39.0% 39.0%
Float glass 19.0% 7.0% 11.1% 22.4% 24.2% 25.2%
Total 31.6% 25.2% 27.3% 34.4% 34.6% 34.8%
Source: Company data, RHB
Figure 30: Xinyi’s sensitivity analysis summary
% Impact on 2017F net profit
Float glass price: 1% increase 1.5%
Natural gas cost: 5% increase (1.3%)
Float glass segment GPM: 1ppt increase 1.8%
Source: Company data, RHB

Xinyi Glass Holdings Hong Kong Reinitiating Coverage
14 September 2016 Industrial | Misc. Manufacturer
See important disclosures at the end of this report 17
Valuations We have lifted our TP to HKD8.40 on our refreshed earnings forecasts. Our new TP offers a 17% upside from the current price level, and is pegged at 10x FY17F P/E (previously 10x FY16F P/E), which is in line with the stock’s 10-year average forward P/E multiple.
By comparison, HK-listed peers are trading at FY17F P/E of 8.8x, whilst China A-shares peers are trading at a substantially higher FY17F P/E of 25.9x.
We have also cross-checked against the stock’s implied forward P/BV multiple, which stands at 2.1x or 2.1SD above the 10-year average. We believe the P/BV premium above its long-term average is fair, given that Xinyi is experiencing an earnings up-cycle.
As Xinyi Solar was spun off from Xinyi in Dec 2013, we also highlight the valuations by stripping out Xinyi Solar. Based on the current market capitalisation and valuations of Xinyi and Xinyi Solar, the market is currently implying a FY17F P/E of 8.7x for Xinyi’s non-solar business, which is well-below the 10-year average 1-year forward P/E of 13.1x, or 1.1SD below the mean.
Key risks to our call include an abrupt rebound in production capacity in the float glass industry, and a sharp rebound in imported natural gas costs. Key catalysts are a faster-than-expected float glass price rebound and further decline in natural gas costs.
Figure 31: Xinyi’s valuations excluding Xinyi Solar
(HKDm) FY17F Notes
Recurring net profit 3,293
Target multiple (x) 10x
Target price (HKD) 8.40
Recurring net profit 3,293
(-) share of interests from Xinyi Solar (767)
Core glass profit 2,526
Current mkt cap of Xinyi Glass 27,757 (a)
Current mkt cap of Xinyi Solar 21,934 (b)
Implied core glass mkt cap 21,923 (c)=(a)-(b)*26.6%
Implied P/E for core glass business 8.7x
Source: Company data, RHB
Figure 32: Xinyi’s TP sensitivity to target P/E and recurring EPS
Target P/E
8x 9x 10x 11x 12x
FY17F Recurring
EPS
+25% 8.4 9.4 10.5 11.5 12.6
+20% 8.1 9.1 10.1 11.1 12.1
+15% 7.7 8.7 9.7 10.6 11.6
+10% 7.4 8.3 9.2 10.2 11.1
+5% 7.1 7.9 8.8 9.7 10.6
Base case 6.7 7.6 8.4 9.2 10.1
-5% 6.4 7.2 8 8.8 9.6
-10% 6 6.8 7.6 8.3 9.1
-15% 5.7 6.4 7.1 7.9 8.6
-20% 5.4 6 6.7 7.4 8.1
-25% 5 5.7 6.3 6.9 7.6
Source: Company data, RHB

Xinyi Glass Holdings Hong Kong Reinitiating Coverage
14 September 2016 Industrial | Misc. Manufacturer
See important disclosures at the end of this report 18
Figure 33: Xinyi’s past 10-year forward P/E Figure 34: Xinyi’s past 10-year forward P/BV
Source: Bloomberg, Company data, RHB Source: Bloomberg, Company data, RHB
Figure 35: Xinyi’s (excl. Xinyi Solar) past 10-year forward P/E
Source: Bloomberg, Company data, RHB
Figure 36: Peer comparison I
Note: Share price related data as at 13 Sep 2016.
Source: RHB, Bloomberg
0
5
10
15
20
25
Ja
n-0
6
Ju
l-0
6
Ja
n-0
7
Ju
l-0
7
Ja
n-0
8
Ju
l-0
8
Ja
n-0
9
Ju
l-0
9
Ja
n-1
0
Ju
l-1
0
Ja
n-1
1
Ju
l-1
1
Ja
n-1
2
Ju
l-1
2
Ja
n-1
3
Ju
l-1
3
Ja
n-1
4
Ju
l-1
4
Ja
n-1
5
Ju
l-1
5
Ja
n-1
6
Ju
l-1
6
Mean: 10.5x
-1sd: 7.0x
-2sd: 3.4x
+1sd: 14.1x
+2sd: 17.64x
(x)
0.0
0.5
1.0
1.5
2.0
2.5
3.0
3.5
4.0
Ja
n-0
6
Ju
l-0
6
Ja
n-0
7
Ju
l-0
7
Ja
n-0
8
Ju
l-0
8
Ja
n-0
9
Ju
l-0
9
Ja
n-1
0
Ju
l-1
0
Ja
n-1
1
Ju
l-1
1
Ja
n-1
2
Ju
l-1
2
Ja
n-1
3
Ju
l-1
3
Ja
n-1
4
Ju
l-1
4
Ja
n-1
5
Ju
l-1
5
Ja
n-1
6
Ju
l-1
6
(x)
Mean: 1.5x
-1sd: 1.0x
-2sd: 0.4x
+1sd: 2.1
+2sd: 2.6x
0
5
10
15
20
25
30
35
Ja
n-0
6
Ju
l-0
6
Ja
n-0
7
Ju
l-0
7
Ja
n-0
8
Ju
l-0
8
Ja
n-0
9
Ju
l-0
9
Ja
n-1
0
Ju
l-1
0
Ja
n-1
1
Ju
l-1
1
Ja
n-1
2
Ju
l-1
2
Ja
n-1
3
Ju
l-1
3
Ja
n-1
4
Ju
l-1
4
Ja
n-1
5
Ju
l-1
5
Ja
n-1
6
Ju
l-1
6
Mean: 13.1x
-1sd: 8.9x
-2sd: 4.61
+1sd: 17.4x
+2sd: 21.6x
(x)
Company Ticker Price Mkt cap
(USDm)
3-mth
avg t/o
(USDm)
P/E Hist
(x)
P/E FY1
(x)
P/E FY2
(x)
EPS
FY1
YoY%
EPS
FY2
YoY%
3-Yr EPS
Cagr (%)
PEG (x) Div yld
Hist (%)
Div yld
FY1 (%)
P/B Hist
(x)
P/B FY1
(x)
Xinyi Glass 868 HK 7.21 3,613 11.2 13.4 9.9 8.6 35.0 15.5 28.0 0.5 4.7 4.5 2.1 1.8
HK-listed peers
Fuyao Glass In-H 3606 HK 20.10 6,165 4.8 15.7 14.5 12.7 8.6 13.9 11.0 1.3 4.4 4.5 2.6 2.4
Xinyi Solar Hlds 968 HK 3.28 2,853 9.2 17.7 11.1 8.6 59.7 28.7 33.5 0.3 5.1 3.8 3.4 2.9
Flat Glass Group 6865 HK 1.79 415 0.4 5.0 5.3 5.0 (6.8) 6.9 7.8 0.7 4.7 N/A 1.1 0.8
Average 12.8 10.3 8.8 20.5 16.5 17.5 0.8 4.7 4.1 2.4 2.0
China A-shares peers
Fuyao Glass-A 600660 CH 16.19 6,165 25.8 14.7 13.8 12.1 6.5 14.5 10.2 1.4 4.6 4.7 2.5 2.2
Csg Holding Co-A 000012 CH 11.40 2,896 44.8 38.0 28.3 22.5 34.3 25.8 27.2 1.0 2.6 2.6 N/A 2.7
Changzhou Alma-A 002623 CH 34.00 814 15.1 100.0 91.9 54.0 8.8 70.3 42.3 2.2 0.1 N/A 2.5 2.5
Zhuzhou Kibing-A 601636 CH 3.69 1,383 35.9 53.1 14.6 15.2 264.0 (4.0) 60.4 0.2 1.1 N/A 1.7 1.6
Average 51.5 37.1 25.9 78.4 26.7 35.0 1.2 2.1 3.7 2.3 2.3

Xinyi Glass Holdings Hong Kong Reinitiating Coverage
14 September 2016 Industrial | Misc. Manufacturer
See important disclosures at the end of this report 19
Figure 37: Peer comparison II
Source: RHB
Company Rev Hist
(USDm)
Rev FY1
(USDm)
NP Hist
(USDm)
NP FY1
(USDm)
Net
gearing
Hist (%)
Net
gearing
FY1 (%)
Unlev
beta
Gross
margin
Hist (%)
Net
margin
Hist (%)
Net
margin
FY1 (%)
ROE Hist
(%)
ROE FY1
(%)
Sh px
1-mth %
Sh px
3-mth %
Xinyi Glass 1,477 1,657 272 366 38.3 33.1 0.7 27.3 18.4 22.1 19.5 21.0 5.3 41.9
HK-listed peers
Fuyao Glass In-H 2,032 2,375 390 450 0.0 1.8 N.A 41.5 19.2 19.0 20.6 17.4 (2.0) 14.9
Xinyi Solar Hlds 612 846 155 260 10.5 45.6 0.8 36.0 25.4 30.8 30.4 29.9 1.5 13.0
Flat Glass Group 436 455 65 78 5.4 N/A N.A 29.3 14.9 17.1 20.5 19.1 10.5 19.3
Average 5.3 23.7 0.8 35.6 19.8 22.3 23.9 22.1 3.4 15.7
China A-shares peers
Fuyao Glass-A 2,032 2,349 390 440 0.0 2.4 0.6 41.5 19.2 18.7 18.3 16.7 (1.1) 18.7
Csg Holding Co-A 1,107 1,364 94 125 64.5 N/A 0.6 21.2 8.5 9.2 N/A 9.8 (4.8) 4.4
Changzhou Alma-A 163 234 8 9 0.0 N/A 1.3 15.7 5.0 3.7 1.7 2.7 2.8 11.5
Zhuzhou Kibing-A 770 1,051 26 95 81.6 N/A 0.6 17.6 3.3 9.1 4.4 11.1 (1.1) 18.6
Average 36.5 2.4 0.7 24.0 9.0 10.2 8.1 10.1 (1.0) 13.3

Xinyi Glass Holdings Hong Kong Reinitiating Coverage
14 September 2016 Industrial | Misc. Manufacturer
See important disclosures at the end of this report 20
SWOT Analysis
China’s largest glass manufacturer with a strong track record in cost control and capacity expansion
Strong cash inflow from auto glass supports capacity expansion at the float glass, construction glass and electric glass segments
Volatile supply and demand dynamics for float glass and construction glass
A sudden surge in energy (in particular natural gas) or raw materials prices could hurt margins
Industry consolidation and elimination of rivals to cement the group's leading position
Fast expansion in solar farm and solar engineering, procurement and construction (EPC) business through associate, Xinyi Solar
Price takers in float glass and construction glass business due to the fragmented and competitive nature of the industry
Volatility in raw materials and energy prices
Recommendation Chart
Source: RHB, Bloomberg
Source: RHB, Bloomberg
2.0
3.0
4.0
5.0
6.0
7.0
8.0
九月-11 十二月-12 三月-14 六月-15
Price Close
na
7.1
3
8.1
9
9.3
3
8.7
8
8.9
5
5.7
0
4.6
0
5.8
0
5.5
0
5.2
0 Recommendations & Target Price
Buy Neutral Sell Trading Buy Take Profit Not Rated
Date Recommendation Target Price Price
2015-11-05 Buy 5.20 3.87
2015-07-29 Buy 5.50 3.62
2015-03-03 Buy 5.80 4.40
2015-02-25 Neutral 4.60 4.04
2014-07-24 Neutral 5.70 4.48
2014-02-27 Buy 8.95 6.44
2013-12-09 Buy 8.78 6.74
2013-10-16 Buy 9.33 6.47
2013-07-24 Buy 8.19 5.91
2013-03-21 Buy 7.13 4.75

Xinyi Glass Holdings Hong Kong Reinitiating Coverage
Industrial | Misc. Manufacturer
21
RHB Guide to Investment Ratings Buy: Share price may exceed 10% over the next 12 months Trading Buy: Share price may exceed 15% over the next 3 months, however longer-term outlook remains uncertain Neutral: Share price may fall within the range of +/- 10% over the next 12 months Take Profit: Target price has been attained. Look to accumulate at lower levels Sell: Share price may fall by more than 10% over the next 12 months Not Rated: Stock is not within regular research coverage
Investment Research Disclaimers
RHB has issued this report for information purposes only. This report is intended for circulation amongst RHB and its affiliates’ clients generally or such
persons as may be deemed eligible by RHB to receive this report and does not have regard to the specific investment objectives, financial situation and
the particular needs of any specific person who may receive this report. This report is not intended, and should not under any circumstances be construed
as, an offer or a solicitation of an offer to buy or sell the securities referred to herein or any related financial instruments.
This report may further consist of, whether in whole or in part, summaries, research, compilations, extracts or analysis that has been prepared by RHB’s
strategic, joint venture and/or business partners. No representation or warranty (express or implied) is given as to the accuracy or completeness of such
information and accordingly investors should make their own informed decisions before relying on the same.
This report is not directed to, or intended for distribution to or use by, any person or entity who is a citizen or resident of or located in any locality, state,
country or other jurisdiction where such distribution, publication, availability or use would be contrary to the applicable laws or regulations. By accepting
this report, the recipient hereof (i) represents and warrants that it is lawfully able to receive this document under the laws and regulations of the jurisdiction
in which it is located or other applicable laws and (ii) acknowledges and agrees to be bound by the limitations contained herein. Any failure to comply with
these limitations may constitute a violation of applicable laws.
All the information contained herein is based upon publicly available information and has been obtained from sources that RHB believes to be reliable and
correct at the time of issue of this report. However, such sources have not been independently verified by RHB and/or its affiliates and this report does not
purport to contain all information that a prospective investor may require. The opinions expressed herein are RHB’s present opinions only and are subject
to change without prior notice. RHB is not under any obligation to update or keep current the information and opinions expressed herein or to provide the
recipient with access to any additional information. Consequently, RHB does not guarantee, represent or warrant, expressly or impliedly, as to the
adequacy, accuracy, reliability, fairness or completeness of the information and opinion contained in this report. Neither RHB (including its officers,
directors, associates, connected parties, and/or employees) nor does any of its agents accept any liability for any direct, indirect or consequential losses,
loss of profits and/or damages that may arise from the use or reliance of this research report and/or further communications given in relation to this report.
Any such responsibility or liability is hereby expressly disclaimed.
Whilst every effort is made to ensure that statement of facts made in this report are accurate, all estimates, projections, forecasts, expressions of opinion
and other subjective judgments contained in this report are based on assumptions considered to be reasonable and must not be construed as a
representation that the matters referred to therein will occur. Different assumptions by RHB or any other source may yield substantially different results
and recommendations contained on one type of research product may differ from recommendations contained in other types of research. The
performance of currencies may affect the value of, or income from, the securities or any other financial instruments referenced in this report. Holders of
depositary receipts backed by the securities discussed in this report assume currency risk. Past performance is not a guide to future performance. Income
from investments may fluctuate. The price or value of the investments to which this report relates, either directly or indirectly, may fall or rise against the
interest of investors.
This report does not purport to be comprehensive or to contain all the information that a prospective investor may need in order to make an investment
decision. The recipient of this report is making its own independent assessment and decisions regarding any securities or financial instruments referenced
herein. Any investment discussed or recommended in this report may be unsuitable for an investor depending on the investor’s specific investment
objectives and financial position. The material in this report is general information intended for recipients who understand the risks of investing in financial
instruments. This report does not take into account whether an investment or course of action and any associated risks are suitable for the recipient. Any
recommendations contained in this report must therefore not be relied upon as investment advice based on the recipient's personal circumstances.
Investors should make their own independent evaluation of the information contained herein, consider their own investment objective, financial situation
and particular needs and seek their own financial, business, legal, tax and other advice regarding the appropriateness of investing in any securities or the
investment strategies discussed or recommended in this report.
This report may contain forward-looking statements which are often but not always identified by the use of words such as “believe”, “estimate”, “intend”
and “expect” and statements that an event or result “may”, “will” or “might” occur or be achieved and other similar expressions. Such forward-looking
statements are based on assumptions made and information currently available to RHB and are subject to known and unknown risks, uncertainties and
other factors which may cause the actual results, performance or achievement to be materially different from any future results, performance or
achievement, expressed or implied by such forward-looking statements. Caution should be taken with respect to such statements and recipients of this

Xinyi Glass Holdings Hong Kong Reinitiating Coverage
Industrial | Misc. Manufacturer
22
report should not place undue reliance on any such forward-looking statements. RHB expressly disclaims any obligation to update or revise any forward-
looking statements, whether as a result of new information, future events or circumstances after the date of this publication or to reflect the occurrence of
unanticipated events.
The use of any website to access this report electronically is done at the recipient’s own risk, and it is the recipient’s sole responsibility to take precautions
to ensure that it is free from viruses or other items of a destructive nature. This report may also provide the addresses of, or contain hyperlinks to,
websites. RHB takes no responsibility for the content contained therein. Such addresses or hyperlinks (including addresses or hyperlinks to RHB own
website material) are provided solely for the recipient’s convenience. The information and the content of the linked site do not in any way form part of this
report. Accessing such website or following such link through the report or RHB website shall be at the recipient’s own risk.
This report may contain information obtained from third parties. Third party content providers do not guarantee the accuracy, completeness, timeliness or
availability of any information and are not responsible for any errors or omissions (negligent or otherwise), regardless of the cause, or for the results
obtained from the use of such content. Third party content providers give no express or implied warranties, including, but not limited to, any warranties of
merchantability or fitness for a particular purpose or use. Third party content providers shall not be liable for any direct, indirect, incidental, exemplary,
compensatory, punitive, special or consequential damages, costs, expenses, legal fees, or losses (including lost income or profits and opportunity costs) in
connection with any use of their content.
The research analysts responsible for the production of this report hereby certifies that the views expressed herein accurately and exclusively reflect his or
her personal views and opinions about any and all of the issuers or securities analysed in this report and were prepared independently and autonomously.
The research analysts that authored this report are precluded by RHB in all circumstances from trading in the securities or other financial instruments
referenced in the report, or from having an interest in the company(ies) that they cover.
RHB and/or its affiliates and/or their directors, officers, associates, connected parties and/or employees, may have, or have had, interests in the securities
or qualified holdings, in subject company(ies) mentioned in this report or any securities related thereto and may from time to time add to or dispose of, or
may be materially interested in, any such securities. Further, RHB and/or its affiliates may have, or have had, business relationships with the subject
company(ies) mentioned in this report and may from time to time seek to provide investment banking or other services to the subject company(ies)
referred to in this research report. As a result, investors should be aware that a conflict of interest may exist.
The contents of this report is strictly confidential and may not be copied, reproduced, published, distributed, transmitted or passed, in whole or in part, to
any other person without the prior express written consent of RHB and/or its affiliates. This report has been delivered to RHB and its affiliates’ clients for
information purposes only and upon the express understanding that such parties will use it only for the purposes set forth above. By electing to view or
accepting a copy of this report, the recipients have agreed that they will not print, copy, videotape, record, hyperlink, download, or otherwise attempt to
reproduce or re-transmit (in any form including hard copy or electronic distribution format) the contents of this report. RHB and/or its affiliates accepts no
liability whatsoever for the actions of third parties in this respect.
The contents of this report are subject to copyright. Please refer to Restrictions on Distribution below for information regarding the distributors of this
report. Recipients must not reproduce or disseminate any content or findings of this report without the express permission of RHB and the distributors.
The securities mentioned in this publication may not be eligible for sale in some states or countries or certain categories of investors. The recipient of this
report should have regard to the laws of the recipient’s place of domicile when contemplating transactions in the securities or other financial instruments
referred to herein. The securities discussed in this report may not have been registered in such jurisdiction. Without prejudice to the foregoing, the
recipient is to note that additional disclaimers, warnings or qualifications may apply based on geographical location of the person or entity receiving this
report.
RESTRICTIONS ON DISTRIBUTION
Malaysia
This report is issued and distributed in Malaysia by RHB Research Institute Sdn Bhd. The views and opinions in this report are our own as of the date
hereof and is subject to change. If the Financial Services and Markets Act of the United Kingdom or the rules of the Financial Conduct Authority apply to a
recipient, our obligations owed to such recipient therein are unaffected. RHB Research Institute Sdn Bhd has no obligation to update its opinion or the
information in this report.
Thailand
This report is issued and distributed in the Kingdom of Thailand by RHB Securities (Thailand) PCL, a licensed securities company that is authorised by the
Ministry of Finance, regulated by the Securities and Exchange Commission of Thailand and is a member of the Stock Exchange of Thailand. The Thai
Institute of Directors Association has disclosed the Corporate Governance Report of Thai Listed Companies made pursuant to the policy of the Securities
and Exchange Commission of Thailand. RHB Securities (Thailand) PCL does not endorse, confirm nor certify the result of the Corporate Governance
Report of Thai Listed Companies.
Xinyi Glass Holdings Hong Kong Reinitiating Coverage
Industrial | Misc. Manufacturer
23
Indonesia
This report is issued and distributed in Indonesia by PT RHB Securities Indonesia. This research does not constitute an offering document and it should
not be construed as an offer of securities in Indonesia. Any securities offered or sold, directly or indirectly, in Indonesia or to any Indonesian citizen or
corporation (wherever located) or to any Indonesian resident in a manner which constitutes a public offering under Indonesian laws and regulations must
comply with the prevailing Indonesian laws and regulations.
Singapore
This report is issued and distributed in Singapore by RHB Research Institute Singapore Pte Ltd and it may only be distributed in Singapore to accredited
investors, expert investors and institutional investors as defined in the Financial Advisers Regulations and the Securities and Futures Act (Chapter 289), as
amended from time to time. By virtue of distribution to these categories of investors, RHB Research Institute Singapore Pte Ltd and its representatives are
not required to comply with Section 36 of the Financial Advisers Act (Chapter 110) (Section 36 relates to disclosure of RHB Research Institute Singapore
Pte Ltd ’s interest and/or its representative's interest in securities). Recipients of this report in Singapore may contact RHB Research Institute Singapore
Pte Ltd in respect of any matter arising from or in connection with the report.
Hong Kong
This report is issued and distributed in Hong Kong by RHB Securities Hong Kong Limited (興業金融證券有限公司) (CE No.: ADU220) (“RHBSHK”) which is
licensed in Hong Kong by the Securities and Futures Commission for Type 1 (dealing in securities) and Type 4 (advising on securities) regulated activities.
Any investors wishing to purchase or otherwise deal in the securities covered in this report should contact RHB Securities Hong Kong Limited.
United States
This report was prepared by RHB and is being distributed solely and directly to “major” U.S. institutional investors as defined under, and pursuant to, the
requirements of Rule 15a-6 under the U.S. Securities and Exchange Act of 1934, as amended (the “Exchange Act”). RHB is not registered as a broker-
dealer in the United States and does not offer brokerage services to U.S. persons. Any order for the purchase or sale of the securities discussed herein
that are listed on Bursa Malaysia Securities Berhad must be placed with and through Auerbach Grayson (“AG”). Any order for the purchase or sale of all
other securities discussed herein must be placed with and through such other registered U.S. broker-dealer as appointed by RHB from time to time as
required by the Exchange Act Rule 15a-6.
This report is confidential and not intended for distribution to, or use by, persons other than the recipient and its employees, agents and advisors, as
applicable.
Additionally, where research is distributed via Electronic Service Provider, the analysts whose names appear in this report are not registered or qualified
as research analysts in the United States and are not associated persons of Auerbach Grayson AG or such other registered U.S. broker-dealer as
appointed by RHB from time to time and therefore may not be subject to any applicable restrictions under Financial Industry Regulatory Authority
(“FINRA”) rules on communications with a subject company, public appearances and personal trading.
Investing in any non-U.S. securities or related financial instruments discussed in this research report may present certain risks. The securities of non-U.S.
issuers may not be registered with, or be subject to the regulations of, the U.S. Securities and Exchange Commission. Information on non-U.S. securities
or related financial instruments may be limited. Foreign companies may not be subject to audit and reporting standards and regulatory requirements
comparable to those in the United States.
The financial instruments discussed in this report may not be suitable for all investors.
Transactions in foreign markets may be subject to regulations that differ from or offer less protection than those in the United States.
OWNERSHIP AND MATERIAL CONFLICTS OF INTEREST
Malaysia
RHB does not have qualified shareholding (1% or more) in the subject company (ies) covered in this report except for:
a) -
RHB and/or its subsidiaries are not liquidity providers or market makers for the subject company (ies) covered in this report except for:
a) -
RHB and/or its subsidiaries have not participated as a syndicate member in share offerings and/or bond issues in securities covered in this report in the
last 12 months except for:
a) -
RHB has not provided investment banking services to the company/companies covered in this report in the last 12 months except for:
a) -

Xinyi Glass Holdings Hong Kong Reinitiating Coverage
Industrial | Misc. Manufacturer
24
Thailand
RHB Securities (Thailand) PCL and/or its directors, officers, associates, connected parties and/or employees, may have, or have had, interests and/or
commitments in the securities in subject company(ies) mentioned in this report or any securities related thereto. Further, RHB Securities (Thailand) PCL
may have, or have had, business relationships with the subject company(ies) mentioned in this report. As a result, investors should exercise their own
judgment carefully before making any investment decisions.
Indonesia
PT RHB Securities Indonesia is not affiliated with the subject company(ies) covered in this report both directly or indirectly as per the definitions of
affiliation above.
Pursuant to the Capital Market Law (Law Number 8 Year 1995) and the supporting regulations thereof, what constitutes as affiliated parties are as follows:
1. Familial relationship due to marriage or blood up to the second degree, both horizontally or vertically;
2. Affiliation between parties to the employees, Directors or Commissioners of the parties concerned;
3. Affiliation between 2 companies whereby one or more member of the Board of Directors or the Commissioners are the same;
4. Affiliation between the Company and the parties, both directly or indirectly, controlling or being controlled by the Company;
5. Affiliation between 2 companies which are controlled, directly or indirectly, by the same party; or
6. Affiliation between the Company and the main Shareholders.
PT RHB Securities Indonesia is not an insider as defined in the Capital Market Law and the information contained in this report is not considered as insider
information prohibited by law.
Insider means:
a. a commissioner, director or employee of an Issuer or Public Company;
b. a substantial shareholder of an Issuer or Public Company;
c. an individual, who because of his position or profession, or because of a business relationship with an Issuer or Public Company, has access to
inside information; and
d. an individual who within the last six months was a Person defined in letters a, b or c, above.
Singapore
RHB Research Institute Singapore Pte Ltd and/or its subsidiaries and/or associated companies do not make a market in any securities covered in this
report, except for:
(a) -
The staff of RHB Research Institute Singapore Pte Ltd and its subsidiaries and/or its associated companies do not serve on any board or trustee positions
of any issuer whose securities are covered in this report, except for:
(a) -
RHB Research Institute Singapore Pte Ltd and/or its subsidiaries and/or its associated companies do not have and have not within the last 12 months had
any corporate finance advisory relationship with the issuer of the securities covered in this report or any other relationship (including a shareholding of 1%
or more in the securities covered in this report) that may create a potential conflict of interest, except for:
(a) -
Hong Kong
RHBSHK or any of its group companies may have financial interests in in relation to an issuer or a new listing applicant (as the case may be) the securities
in respect of which are reviewed in the report, and such interests aggregate to an amount equal to or more than (a) 1% of the subject company’s market
capitalization (in the case of an issuer as defined under paragraph 16 of the Code of Conduct for Persons Licensed by or Registered with the Securities
and Futures Commission (the “Code of Conduct”); and/or (b) an amount equal to or more than 1% of the subject company’s issued share capital, or issued
units, as applicable (in the case of a new listing applicant as defined in the Code of Conduct). Further, the analysts named in this report or their associates
may have financial interests in relation to an issuer or a new listing applicant (as the case may be) in the securities which are reviewed in the report.

Xinyi Glass Holdings Hong Kong Reinitiating Coverage
Industrial | Misc. Manufacturer
25
RHBSHK or any of its group companies may make a market in the securities covered by this report.
RHBSHK or any of its group companies may have analysts or their associates, individual(s) employed by or associated with RHBSHK or any of its group
companies serving as an officer of the company or any of the companies covered by this report.
RHBSHK or any of its group companies may have received compensation or a mandate for investment banking services to the company or any of the
companies covered by this report within the past 12 months.
Note: The reference to “group companies” above refers to a group company of RHBSHK that carries on a business in Hong Kong in (a) investment
banking; (b) proprietary trading or market making; or (c) agency broking, in relation to securities listed or traded on The Stock Exchange of Hong Kong
Limited.
Kuala Lumpur Hong Kong Singapore
RHB Research Institute Sdn Bhd Level 11, Tower One, RHB Centre
Jalan Tun Razak Kuala Lumpur
Malaysia Tel : +(60) 3 9280 2185 Fax : +(60) 3 9284 8693
RHB Securities Hong Kong Ltd.
12th Floor
World-Wide House 19 Des Voeux Road Central, Hong Kong
Tel : +(852) 2525 1118 Fax : +(852) 2810 0908
RHB Research Institute Singapore
Pte Ltd. 10 Collyer Quay
#09-08 Ocean Financial Centre Singapore 049315
Tel : +(65) 6533 1818 Fax : +(65) 6532 6211
Jakarta Shanghai Bangkok
PT RHB Securities Indonesia
Wisma Mulia, 20th Floor Jl. Jenderal Gatot Subroto No. 42
Jakarta 12710, Indonesia Tel : +(6221) 2783 0888 Fax : +(6221) 2783 0777
RHB (China) Investment Advisory Co. Ltd.
Suite 4005, CITIC Square 1168 Nanjing West Road
Shanghai 20041 China
Tel : +(8621) 6288 9611 Fax : +(8621) 6288 9633
RHB Securities (Thailand) PCL
10th Floor, Sathorn Square Office Tower 98, North Sathorn Road, Silom
Bangrak, Bangkok 10500 Thailand
Tel: +(66) 2 862 9999 Fax : +(66) 2 862 9799