maine solid waste generation and disposal …...generation, diversion, and disposal activities for...
TRANSCRIPT

Report to the Joint Standing Committee on the Environment and Natural Resources
128th Legislature, First Session
MAINE DEPARTMENT OF ENVIRONMENTAL PROTECTION 17 State House Station | Augusta, Maine 04333-0017
www.maine.gov/dep
Maine Solid Waste Generation and Disposal Capacity Report:
Calendar Year 2015
January 2017
Contact:
George MacDonald, Director Sustainability Division
(207) 287-2870 [email protected]

Maine Department of Environmental Protection - 2016 Waste Generation & Disposal Capacity Report
Contents I Executive Summary ................................................................................................................... 2
II. Background .............................................................................................................................. 3
III. Management of Maine-generated Solid Waste in 2015 .......................................................... 4
A. Maine's Waste Management and Food Recovery Hierarchies ............................................ 4
B. Overview of the management of Maine's solid waste in 2015 ............................................ 5
IV. Progress toward Maine’s Waste Reduction and Recycling Goals .......................................... 8
A. Maine’s Municipal Solid Waste Disposal Reduction Goal .............................................. 8
B. Maine’s Municipal Solid Waste Recycling Rate ................................................................... 9
C. Special Wastes and Beneficial Use .................................................................................... 12
V. Solid Waste Disposal Capacity .............................................................................................. 13
VI. Solid Waste Industry Consolidation in 2015 ........................................................................ 18
VII. Disposal Fees and Supracompetitive Prices ........................................................................ 19
A. Disposal Fees.................................................................................................................. 19
B. Supracompetitive Prices ................................................................................................. 19
Appendix A - Definitions and Acronyms ..................................................................................... 21
Appendix B – Current Management of Municipal Solid Waste in Maine ................................... 22

Maine Department of Environmental Protection - 2016 Waste Generation & Disposal Capacity Report
2
I Executive Summary This report is submitted to the Joint Standing Committee on Environment and Natural Resources and the Governor, pursuant to 38 M.R.S. § 2124-A. It provides an overview of Maine’s solid waste generation, diversion, and disposal activities for 2015, the most recent full calendar year of data available, and a projection of how those activities will impact available solid waste disposal capacity. It also includes an evaluation of Maine’s progress toward our waste reduction and recycling goals. The report includes a projection of the solid waste disposal needs of Maine for the next 5, 10, and 20 years. The report also projects how the fill rate at each solid waste landfill could affect the expected lifespan of that landfill. The information in this report can assist policymakers with planning for future solid waste disposal capacity investment. When the Department of Environmental Protection (Department) determines that a decline in available landfill capacity has generated or has the potential to generate supracompetitive prices, the Department shall include this and recommendations for legislative or regulatory changes as necessary. Highlights The total amount of solid waste generated in Maine in 2015 was 2,475,213 tons (exclusive of
solid waste disposed of in generator-owned landfills). This shows a decrease from the total of the 2,770,991 tons of solid waste tonnage generated in 2014. Within that total, the tonnage of Municipal Solid Waste (MSW) decreased only slightly from 2014 to 2015, the generation of Construction or Demolition Debris (CDD) dropped from 695,876 to 537,744 tons, and the tonnage of Special Wastes also decreased from 887,850 to 743,260 tons.
Using a calculation method that permits Maine’s recycling rate to be compared to that of other states, Maine’s MSW recycling rate in 2015 was 36.76%, up from the 2014 rate of 36.24%.
The tonnage of food scraps and other organic materials diverted from disposal and sent to composting or anaerobic digestion increased by 68% from 2014 to 2015, from 23,627 tons to 39,659 tons.
The capacity for disposal of MSW generated in Maine remains adequate into the near term future, based on the currently operating disposal facilities and management systems in place. This includes three waste-to-energy (WTE) facilities, seven municipally-owned landfills, two state-owned landfills (one of which is in the process of being closed), and one commercially-owned landfill.

Maine Department of Environmental Protection – 2017 Waste Generation & Disposal Capacity Report
3
II. Background 38 M.R.S. § 2124-A requires the Maine Department of Environmental Protection (Department) to annually submit a “Solid Waste Generation and Disposal Capacity Report” to the joint standing committee of the Legislature having jurisdiction over natural resources matters and the Governor. This report must set forth information on the generation of solid waste in Maine, the statewide recycling rate for municipal solid waste (MSW), and the remaining available disposal capacity for solid waste. The report must also include an analysis of how changes in available disposal capacity have affected or are likely to affect disposal prices, an analysis of how the rate of fill at each solid waste landfill has affected the expected lifespan of that solid waste landfill, and an analysis of consolidation of ownership in the disposal, collection, recycling and hauling of solid waste. This report focuses on (MSW) as defined by Maine law (06-096 CMR 400, General Provisions, Maine Solid Waste Management Regulations). MSW is comprised of household baggable waste and construction demolition debris, including such items as furniture, tires, and metal. The report includes certain sludge and ash tonnages which are considered "special wastes", since the disposal of those wastes at landfills impacts the disposal capacity remaining at the disposal facility, which is one of the metrics tracked in this report. Special wastes are wastes that are generated by other than households or typical businesses and, due to their quantity or chemical or physical properties, require particular handling. Construction and demolition debris (CDD) is solid waste resulting from construction, remodeling, repair, and demolition of structures, including building materials, discarded furniture, wall board, pipes, metal conduits, and similar debris. Most CDD is generated by the household and commercial (building industries) sector, and is considered to be a subset of MSW. To help with planning for solid waste management, solid waste facilities accepting CDD track those materials separately from MSW, to the extent practicable. The industrial sector also generates significant amounts of other types of solid wastes that are regulated as “special waste” under Maine law [38 M.R.S. §1303-C(34)] because they have chemical or physical properties that make them difficult to handle, or potentially pose a threat to public health, safety or the environment. This report includes various tables that contain data on solid waste generated in Maine, as well as data on the amounts and types of solid waste managed by disposal facilities in Maine, including sources and tonnages of solid wastes imported to Maine for disposal. The data on solid waste generated in Maine is used to calculate Maine’s recycling rate, while the data on wastes accepted for disposal at waste-to-energy facilities and landfills (including solid waste from out of state) is used to project available disposal capacity into the future (i.e., current fill rates are assumed to continue when projecting future fill rates).

Maine Department of Environmental Protection – 2017 Waste Generation & Disposal Capacity Report
4
III. Management of Maine-generated Solid Waste in 2015
A. Maine's Waste Management and Food Recovery Hierarchies Maine statute includes two hierarchies to be used as guiding principles in decision-making in the management of solid waste.
38 M.R.S. § 2101, Solid Waste Management Hierarchy, establishes: 1. Priorities. It is the policy of the State to plan for and implement an integrated approach to solid waste management for solid waste generated in this State and solid waste imported into this State, which must be based on the following order of priority:
A. Reduction of waste generated at the source, including both amount and toxicity of the waste;
B. Reuse of waste;
C. Recycling of waste;
D. Composting of biodegradable waste;
E. Waste processing that reduces the volume of waste needing land disposal, including incineration; and
F. Land disposal of waste.
It is the policy of the State to use the order of priority in this subsection as a guiding principle in making decisions related to solid waste management.
2. Waste reduction and diversion. It is the policy of the State to actively promote and encourage waste reduction measures from all sources and maximize waste diversion efforts by encouraging new and expanded uses of solid waste generated in this State as a resource.

Maine Department of Environmental Protection – 2017 Waste Generation & Disposal Capacity Report
5
38 M.R.S. § 2101-B, the Food Recovery Hierarchy, was enacted in 2016 to provide additional guidance on the management of food wastes. It establishes:
B. Overview of the management of Maine's solid waste in 2015 Maine’s solid waste management infrastructure includes municipal, commercial, and private industrial waste handling services, operations and facilities. Once collected, solid waste in Maine is stored, transported, recycled, processed, composted, anaerobically digested, or beneficially used in place of virgin materials and as fuel, combusted at one of three waste-to-energy facilities, or landfilled. The most current, complete data available for solid waste management in calendar year 2015 come from a variety of sources, including:
1. Priorities. It is the policy of the State to support the solid waste management hierarchy in section 2101 by preventing and diverting surplus food and food scraps from land disposal or incineration in accordance with the following order of priority:
A. Reduction of the volume of surplus food generated at the source;
B. Donation of surplus food to food banks, soup kitchens, shelters and other entities that will use surplus food to feed hungry people;
C. Diversion of food scraps for use as animal feed;
D. Utilization of waste oils for rendering and fuel conversion, utilization of food scraps for digestion to recover energy, other waste utilization technologies and creation of nutrient-rich soil amendments through the composting of food scraps; and
E. Land disposal or incineration of food scraps.
2. Guiding principle. It is the policy of the State to use the order of priority in this section, in conjunction with the order of priority in section 2101, as a guiding principle in making decisions related to solid waste and organic materials management.

Maine Department of Environmental Protection – 2017 Waste Generation & Disposal Capacity Report
6
licensed public and private processing, composting, and disposal facilities’ annual reports submitted to the Department (in accordance with 38 M.R.S. §§ 1304-C, 2205, and 2232), and to other states’ regulatory agencies (from out-of-state facilities which receive waste from Maine);
data on the recycling of electronics, tires, vehicle batteries, consumer batteries, mercury- added lamps and textiles was obtained through a combination of voluntary and mandatory reports from the specialized businesses that manage these consumer products. Along with voluntary reporting by major collectors of these items, this included data reported under Maine’s product stewardship laws as well as data from hazardous waste manifests; and
voluntary reporting1 by commercial entities managing recyclables generated in Maine. Table 1 presents a summary of the types and amounts of solid waste generated in Maine in 2015.
These same categories reported 2,561,555 tons of waste being generated in 2014 (MSW 1,187,265; CDD 695,876; special wastes 887,850). Table 2 (next page) shows the amounts of each waste type managed through disposal, recycling, composting, and beneficial use, and includes calculated recycling rates for Maine-generated MSW, and CDD and land-clearing debris.
1 The Department is appreciative of the data voluntarily provided by generators/brokers of recyclables and acknowledges the reluctance of others in providing data due to that information not being identified as ‘confidential business information’.
Table 1 - 2015 Maine Generated Solid Waste by Type and Amount
Waste type 2015 Amount Generated (tons)
Municipal Solid Waste (MSW) 1,194,209
Construction / Demolition Debris (CDD)/wood waste/land-clearing debris 537,744
Special solid wastes (see Table 3 for break out by waste types and amounts) 743,260 Total Maine Generated Solid Waste - 2015 2,475,213

Maine Department of Environmental Protection – 2017 Waste Generation & Disposal Capacity Report
7
Table 2 - 2015 Management of Maine’s Solid Waste (except Special Solid Wastes) and
Calculation of Maine's Recycling & Diversion Rates
Municipal Solid Waste (MSW) Disposition Tons Maine MSW landfilled in state 279,231 Maine MSW disposed of at waste-to-energy facilities in state (amount destroyed through combustion) 322,670
Maine MSW waste-to-energy ash landfilled in-state 101,862 Maine MSW disposed of out-of-state 53,251
Subtotal Maine MSW (exclusive of CDD) disposed 757,014
Recycling/Organics Management
Paper, cardboard, plastics, metals, glass and textiles recycled 228,326
Other MSW recycled (electronics, white goods and other metals not reported by brokers, tires, and vehicle batteries) 171,965
Reported MSW composted (includes leaf & yard rakings, food scraps) 39,659
Subtotal Maine MSW recycled or composted 439,950 Total Maine MSW (exclusive of CDD) 1,196,964
Maine’s MSW recycling rate (exclusive of CDD) 36.76%
Construction or Demolition Debris Mixed CDD disposed of in state 393,189 Mixed CDD disposed of out of-state 15,708 Beneficial use of processed CDD and land-clearing debris as fuel (counts as recycling per 38 M.R.S. § 2132.3) 37,309
Other beneficial use of processed CDD and land-clearing debris 93,230 Total CDD and landclearing debris 539,436
Maine’s CDD & land-clearing debris recycling rate 6.92%
Summary of Management and Disposition
Total tonnage of MSW, CDD & land-clearing debris 1,736,400
Total MSW, CDD and land-clearing debris recycled (including wood used as fuel) 477,259
Total MSW, CDD and land-clearing debris diverted from disposal 570,489
Maine's combined MSW, CDD & land-clearing debris recycling rate 27.49%
Maine's Combined MSW, CDD & Landclearing Debris Diversion from Disposal Rate (includes all beneficial uses) 32.85%

Maine Department of Environmental Protection – 2017 Waste Generation & Disposal Capacity Report
8
IV. Progress toward Maine’s Waste Reduction and Recycling Goals In keeping with the Solid Waste Management Hierarchy (38 M.R.S. § 2101), there are a variety of options employed for managing Maine’s solid waste. Appendix B is a table that provides an overview of management options currently employed for the various components of Maine’s municipal solid waste stream. This table provides a qualitative assessment of the comparative use of the management options. The options are grouped by levels on the Solid Waste Management Hierarchy, with the most preferred management option farthest to the left. By examining Maine’s waste stream by material type and current management options, we can identify opportunities for “moving up the hierarchy”, decreasing disposal and increasing waste reduction, reuse, recycling and beneficial use.
A. Maine’s Municipal Solid Waste Disposal Reduction Goal In 2016, the focus of Maine’s statutory goal for waste reduction was changed to focus on reducing the amount of MSW sent for disposal. 38 M.R.S. § 2132(1-B) states:
State waste disposal reduction goal. It is the goal of the State to reduce the statewide per capita disposal rate of municipal solid waste tonnage to 0.55 tons disposed per capita by January 1, 2019 and to further reduce the statewide per capita disposal rate by an additional 5% every 5 years thereafter. The baseline for calculating this reduction is the 2014 solid waste generation and disposal capacity data gathered by the department.
In 2014, Maine generated and sent for disposal (landfilling and incineration) 757,049 tons of MSW, exclusive of CDD. This established the baseline per capita disposal rate at 0.57 tons per person (Maine's estimated 2014 population was 1,330,256).2 Maine's per capita disposal rate held steady in 2015 (757,014 tons Maine-generated MSW disposed/1,329,328 residents); this waste generation/disposal rate has been virtually unchanged from 2010 - 2015. The most recent regional comparisons of per capita disposal rates available for the Northeast show Maine generated on average less MSW per person in 2012 than most other northeast states. The northeast states had an average of 0.7 tons of MSW generation per person, with the rate ranging from 0.52 tons per person for New Hampshire to 0.91 tons per person for Rhode Island (RI data may not fully exclude CDD).3
2 U.S. Census Bureau, https://factfinder.census.gov/faces/tableservices/jsf/pages/productview.xhtml?src=CF, accessed December 28, 2016 3Municipal Solid Waste (MSW) Interstate Flow in 2012, March 27, 2015, Northeast Waste Management Officials’ Association, http://www.newmoa.org/solidwaste/MSW2012DatatReport3-27-15.pdf

Maine Department of Environmental Protection – 2017 Waste Generation & Disposal Capacity Report
9
2010 & 2012 Per Capita Disposal Rates in the Northeast States
B. Maine’s Municipal Solid Waste Recycling Rate In 1989, the Maine Legislature enacted a statewide goal for the recycling of municipal solid waste at 38 M.R.S. § 2132.1. The timeline for achieving the goal was subsequently amended, most recently in 2016. The current goal is:
1. State recycling goal. It is the goal of the State to recycle or compost, by January 1, 2021, 50% of the municipal solid waste tonnage generated each year within the State.
Recycling and composting are valuable tools for reducing overall solid waste management costs, lessening the need to develop additional solid waste disposal capacity, and reaping the environmental benefits of decreased extraction of virgin materials to make new products and of increased fertility of local soils. Maine's MSW recycling rate is calculated by dividing the total amount of MSW recycled and composted by the total amount of reported in-state generated MSW in accordance with 38 M.R.S. § 2132 (3). The term “municipal solid waste” is defined in 06-096 CMR 400, Solid Waste Management Rules: General Provisions:
"Municipal solid waste" means solid waste emanating from household and normal commercial sources. Municipal solid waste includes front end process residue from the processing of municipal solid waste.
Although CDD is a component of MSW, when calculating MSW recycling rates other states and the U.S. Environmental Protection Agency (US EPA) generally exclude CDD from their calculations. To
0
0.2
0.4
0.6
0.8
1
1.2
2010 Per Capita MSWDisposed (tons/year)
2012 Per Capita MSWDisposed (tons/year)

Maine Department of Environmental Protection – 2017 Waste Generation & Disposal Capacity Report
10
be transparent about what is included in Maine's calculated recycling rate, the Department has calculated the recycling rate for MSW exclusive of CDD, for CDD only, and for MSW including CDD. This approach allows Maine to perform an ‘apples-to-apples' comparison with other states’ MSW recycling rates, while also enabling Maine to evaluate where further efforts are needed to improve diversion of the broader spectrum of disposed materials handled by municipalities in Maine. For 2015, Maine's recycling rate for MSW exclusive of CDD was 36.76%, up slightly from 2014 (36.24%) In 2015, Maine's CDD recycling rate remained low at 6.92% (down from 8.73% in 2014) (see Table 2). Changes in the management of organics in Maine from 2014 to 2015 show a positive trend in the increased recovery and utilization of food scraps and leaf and yard wastes to composting or anaerobic digestion facilities, which climbed from 23,627 tons in 2014 to 39,659 tons in 2015. Most of this increase is due to the implementation of new programs to collect food scraps separately from other trash, with savings potentially realized for the generators due to lower tip fees for organics composting (including anaerobic digestion with recycling of residuals) than if that same material was sent for disposal with MSW. In November 2015, the Northeast Waste Management Officials’ Association (NEWMOA) and the Northeast Recycling Council (NERC) prepared a Fact Sheet on Challenges Facing Municipal Solid Waste (MSW) Recycling in the Northeast.4 This document provides a broader context through which to view recycling efforts in Maine. Some notable issues and trends highlighted in this report are:
• The overall U.S MSW recycling rate was approximately 34 percent for 2013, according to EPA’s data, which primarily looks at ‘bagged MSW’ tonnage.
• Recycled materials are part of an international marketplace, with many factors contributing to market volatility. The prices of oil and virgin resin, the value of the U.S. dollar, the economies of foreign markets, and communication among the U.S. materials recovery facilities (MRFs), brokers, processors, and manufacturers about the industry’s changing needs, all contribute to the dynamic economics of recycling markets.
• The materials in the traditional recycling stream are changing, creating on-going handling
and economic challenges to the recycling industry. There is less newsprint, glass, aluminum, steel packaging, paper board, and paper packaging, and more aluminum foil and closures, corrugated card, high-density polyethylene (HDPE) bottles and other containers, polyethylene terephthalate (PET) bottles and jars, and other plastic packaging.
4Presented by Terri Goldberg, NEWMOA Executive Director, November 9-10, 2015 to the Northeast Committee on the Environment (comprised of the Commissioners of the state environmental agencies in New England, New York, and New Jersey); available at https://nerc.org/documents/recycling/NEWMOA%20&%20NERC%20Fact%20Sheet%20on%20Challenges%20Facing%20Municipal%20Solid%20Waste%20Recycling%20.pdf

Maine Department of Environmental Protection – 2017 Waste Generation & Disposal Capacity Report
11
• Packaging is rapidly changing away from the use of glass and metal toward lighter materials,
including multi-layer, multi-resin pouches, plastic packaging, and other types of containers that are either less recyclable or not recyclable. In addition, the plastic that is used for packaging has been light-weighted. The changing waste stream means MRFs need to process more volume with less weight, resulting in increased processing costs per ton managed.5
• Single stream programs typically result in significantly more recyclables being collected due
to the convenience for residents and the additional space for a bulky recycling stream. However, the quality and value of commodity materials generated from single-stream systems is often lower than that from source-separated systems.
5 Susan Robinson, Waste Management, November 13, 2014 Presentation, EPA SMM Webinar Academy - http://www2.epa.gov/sites/production/files/2015-09/documents/changng_wste_stream.pdf

Maine Department of Environmental Protection – 2017 Waste Generation & Disposal Capacity Report
12
C. Special Wastes and Beneficial Use Table 3 shows the amounts of solid wastes other than MSW, CDD and land-clearing debris generated in Maine and how each waste type was managed in 2015. The last two rows show 2014 data for comparative purposes.
Table 3 - 2015 Disposition of Maine-Generated Special Wastes (in tons)
WASTE TYPE Compost/ N –Viro*
Beneficial Use
Land applied
Anaerobic digestion Combusted Landfilled Totals
Asbestos/Asbestos Containing Waste - - - - - 3,016 3,016
Ash - Coal, oil and multi-fuel boiler 2,592 24,709 23,830 - - 142,970 194,101
Ash - MSW Incinerator - - - - - 104,121 104,121
Ash- wood & burn pile/hot loads - - - - 1,132 1,132
Ash/Liming Agent – Other - 8,393 - - - 8,393
Catch basin grit and street sweepings - 4,456 - - - 1,303 5,759
Contam. Soils – contam. unknown - - - - - 4,221 4,221
Contam. Soils - non-petroleum - - - - - 682 682
Contaminated soils - Oil - 2,047 - - - 14,763 16,810
Dredge Spoils - 16,752 - - - 479 17,231 Fish/Food Process
Residue 729 1,976 39,853 10,000 - 260 52,818
Industrial/Industrial Process Waste - - - - - 34,703 34,703
Other Special Wastes - - - - 1,051 19,818 20,869
Pulp/Papermill Sludge 1,871 21,722 - - - 20,830 44,423
Sandblast Grit - 2,096 - - - 289 2,385 Short-Paper Fiber - 13,011 - - - 15,298 28,309 Shredder Residue - - - - - 10,658 10,658 WWTP Sludge -
industrial - 4 - - 82,443 82,447
WWTP Sludge - municipal 39,887 - 12,783 61 - 54,104 106,835
2015 Totals 45,079 86,769 84,863 10,061 1,051 511,090 738,913 2015 percentages 6.10% 11.74% 11.48% 1.36% 0.14% 69.17% 100.00%
2014 Totals 61,752 204,517 77,538 1,458 5,016 537,545 887,826 2014 percentages 7.0% 23.0% 8.7% 0.2% 0.6% 60.5% 100.00%
*N-Viro is a soil amendment created from sludge through a treatment process.

Maine Department of Environmental Protection – 2017 Waste Generation & Disposal Capacity Report
13
The overall tonnage of special solid wastes in 2015 decreased 144,566 tons, when compared with 2014. A significant portion of the decrease is due to a reduction in wastes generated by paper mills, some of which are no longer operating. In 2014 a high proportion of these wastes were beneficially used or composted, so the reduction in this waste stream in 2015 caused a decrease in the percentage of special wastes which were beneficially used in land application as a soil amendment. Special waste disposition – 2014 Special Waste Disposition – 2015 887,826 tons total 743,260 tons total
In 2015, Exeter Agri-Energy, began accepting food scraps and food processing wastes, and other organic based materials, resulting in the anaerobic digestion of 1.5% of special wastes generated and managed in Maine. 15.6% of special wastes were composted or used as soil amendments for agronomic benefit, and an additional 12.4% was beneficially used in some other way. The beneficial use of waste is the use or reuse of a solid waste as a raw material substitute in manufacturing, as construction material or construction fill, as fuel, or in agronomic utilization.
V. Solid Waste Disposal Capacity Based on the current operations of the licensed disposal facilities in Maine, the Department projects that disposal capacity for MSW (including CDD) generated in Maine will remain adequate into the near term. This conclusion is based on projections calculated using fill rates and capacity data reported by licensed facilities in their annual reports on calendar year 2015 activity. Table 4 shows the current and projected available waste-to-energy (WTE) processing and landfill disposal capacity in Maine, by licensed facility, through 2035. In 2015, Maine’s solid waste disposal facilities included three WTE facilities, seven municipally-owned landfills, two state-owned landfills, and one commercially owned landfill. The State has another licensed landfill site, known as Carpenter Ridge, located in T2 R8, that remains undeveloped. That site, with a landfill design for approximately two million cubic yards of special wastes, was acquired by the State in the mid-1990’s and is held by the State for development of

Maine Department of Environmental Protection – 2017 Waste Generation & Disposal Capacity Report
14
disposal capacity when needed. The state-owned Dolby Landfill in East Millinocket accepted minimal amounts of solid waste in 2015, and ceased operations in 2016. In 2015, 1,239,086 cubic yards of remaining landfill capacity were consumed in Maine by MSW (264,588 tons), CDD (439,766 tons), and special wastes (333,439 tons). Additionally, 355,445 tons of MSW were destroyed through combustion at the three waste-to-energy incinerators. This 1,393,238 tons of waste disposed of in Maine included waste from out-of-state sources as well as wastes from Maine, but does not include special wastes disposed of in generator owned landfills affiliated with specific industrial facilities and operations. Solid wastes generated in other states can be disposed of at the waste-to-energy facilities and the commercially owned landfill in Maine. The disposal capacity at the state-owned Juniper Ridge Landfill is restricted by license condition to wastes generated in Maine, including waste generated by processing facilities which may accept wastes from other states. All the MSW disposed of in landfills in Maine was generated in Maine; and 90% of the MSW disposed of through incineration in Maine were also generated in Maine. The Juniper Ridge Landfill has an application pending with the Department that, if approved, would create an additional 9,350,000 cubic yards of capacity. In addition, in 2016 the Municipal Review Committee, Inc. and Fiberight L.L.C. received a permit from the Department to develop a new solid waste processing facility designed to manage 650 tons per day of MSW. The projections considered in this report do not take into account the proposed and undeveloped capacity of these two facilities.

Maine Department of Environmental Protection – 2017 Waste Generation & Disposal Capacity Report
15
Table 4 - Available Licensed MSW Disposal Capacity in Maine as of December 31, 2015
Waste-to-Energy (WTE) Incinerators
Annual capacity
2015 (tons/year)
2020 (tons/year)
2025 (tons/year)
2035 (tons/year)
MMWAC – Auburn 70,000 70,000 70,000 70,000 70,000
ecomaine – Portland 170,000 170,000 170,000 170,000 170,000
PERC – Orrington 304,000 304,000 304,000 304,000 304,000
Total WTE capacity in tons 544,000 544,000 544,000 544,000 544,000
2015 Fill rate (yd3)
2015 available (yd3)
2020 available (yd3)
2025 available (yd3)
2035 available (yd3)
State-owned landfills Carpenter Ridge – T 2 R 8 N/A not constructed not constructed not constructed not constructed
Dolby – East Millinocket 627 335,000 0 (closed) 0 (closed) 0 (closed)
Juniper Ridge – Old Town* 714,803 3,188,797 0 0 0
Municipal MSW landfills Hatch Hill (Augusta) 48,170 819,430 578,580 337,730 0
Bath 50,200 245,100 0 0 0 Brunswick 10,808 199,637 145,597 0 (closed) 0 (closed) Presque Isle 12,721 1,416,201 1,352,596 1,288,991 1,161,781 Tri-Community (Fort Fairfield) 41,091 1,602,336 1,396,881 1,191,426 780,516
W-T-E ash landfills ecomaine 44,569 640,208 417,363 194,518 0 Lewiston 46,039 531,026 447,001 362,976 194,926 Commercial landfill Waste Management Crossroads - Norridgewock
270,058 2,849,492 1,499,202 148,912 0
Total landfill capacity in yd3 - 11,827,227 5,837,220 3,524,553 2,137,223
Total remaining
landfill capacity in tons (MSW)**
- 8,870,420 4,040,415 2,643,415 1,602,917
*Application pending for 9,350,000 cubic yards additional capacity would add 10-12 operating years **Assumes average weight of 1 cubic yard of landfilled MSW =1500 pounds, and all remaining licensed landfill
capacity will be used for MSW

Maine Department of Environmental Protection – 2017 Waste Generation & Disposal Capacity Report
16
Table 5, below, shows the types and amounts of solid wastes delivered to landfills in Maine in 2015, and the estimated remaining disposal capacity in cubic yards and years.
TABLE 5 - 2015 Solid Waste Tonnage that was Landfilled, and Remaining Landfill Capacity for MSW (as of December 31, 2015)
Landfill MSW (tons)
CDD (tons)
Special Wastes (tons)
Capacity Consumed
in 2015 (yds3)
Constructed Capacity
Remaining (yds3)
Licensed Capacity
Remaining (yds3)
Years of Licensed Capacity
Remaining at current fill
rate
Augusta (Hatch Hill) 30,753 (included
in MSW) 4,666 48,170 819,430 819,430 17.0
Bath 10,305 1,051 4411 50,200 245,100 245,100 4.9
Brunswick 4,598 (included in MSW) 0 10,808 199,637 199,637 18.5*
Presque Isle 7,306 2,074 4,484 12,721 226,201 1,416,201 111.3 Tri-
Community 23,246 1,624 4,234 41,091 488,891 1,602,336 39.0
ecomaine 5,324 0 45,796 44,569 640,208 640,208 14.4 Lewiston** 0 20571 17,339 46,039 531,026 531,026 31.6
Waste Management / Crossroads
81,484 69,289 93,742 270,058 2,849,492 2,849,492 10.6
Juniper Ridge*** 121,245 361,527 148,990 714,803 1,688,797 3,188,797 4.5
TOTALS 284,261 456,136 323,662 1,238,459 7,688,782 11,492,227 -- *Brunswick is planning to close by 2021 **Assumes average fill rate of 16,805 cubic yards/year, excluding 1-time disposal volume that occurred in 2015 ***Application pending for 9,350,000 cubic yards additional capacity would add 10-12 operating years Table 6 shows the state’s source of generation of the MSW which was received by each of the three WTE facilities (does not include non-MSW waste received).
Table 6 – Tons of MSW Received at Waste-to-Energy Facilities in 2015 by State of Origin
Facility Maine MA NH Total Tons % ME % MA % NH
ecomaine 179,973 0 7,512 187,485 95.99% 0.00% 4.01%
Mid Maine Waste Action Corporation 78,114 0 125.18 78,239 99.84% 0.00% 0.16%
Penobscot Energy Recovery Company 260,596 49,875 1,247 311,718 83.60% 16.00% 0.40%
Totals 522,473 49,875 9,029 577,422 89.82% 8.64% 1.54%
Maine Department of Environmental Protection - 2016 Waste Generation & Disposal Capacity Report
17
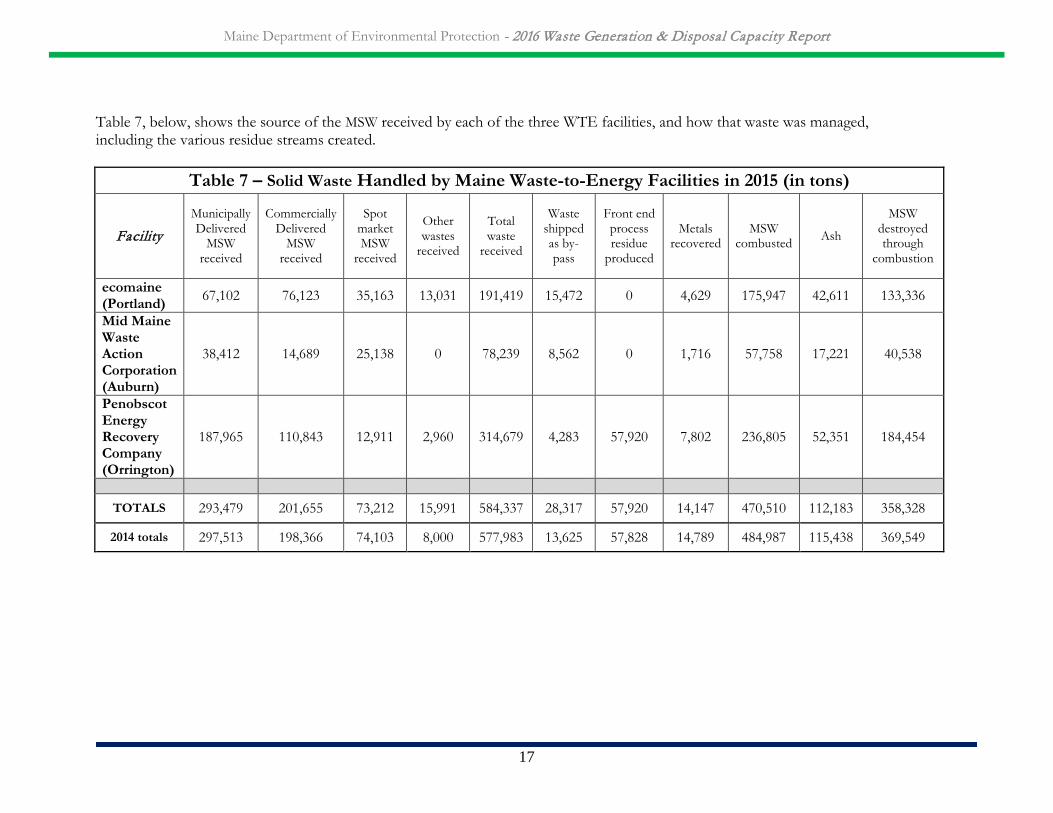
Table 7, below, shows the source of the MSW received by each of the three WTE facilities, and how that waste was managed, including the various residue streams created.
Table 7 – Solid Waste Handled by Maine Waste-to-Energy Facilities in 2015 (in tons)
Facility Municipally Delivered
MSW received
Commercially Delivered
MSW received
Spot market MSW
received
Other wastes
received
Total waste
received
Waste shipped as by-pass
Front end process residue
produced
Metals recovered
MSW combusted Ash
MSW destroyed through
combustion
ecomaine (Portland) 67,102 76,123 35,163 13,031 191,419 15,472 0 4,629 175,947 42,611 133,336
Mid Maine Waste Action Corporation (Auburn)
38,412 14,689 25,138 0 78,239 8,562 0 1,716 57,758 17,221 40,538
Penobscot Energy Recovery Company (Orrington)
187,965 110,843 12,911 2,960 314,679 4,283 57,920 7,802 236,805 52,351 184,454
TOTALS 293,479 201,655 73,212 15,991 584,337 28,317 57,920 14,147 470,510 112,183 358,328
2014 totals 297,513 198,366 74,103 8,000 577,983 13,625 57,828 14,789 484,987 115,438 369,549

Maine Department of Environmental Protection – 2017 Waste Generation & Disposal Capacity Report
18
VI. Solid Waste Industry Consolidation in 2015 The Waste Generation and Disposal Capacity Report includes an analysis of consolidation in the ownership of the collection, recycling, hauling, and disposal sectors. This is performed to review Maine’s solid waste industry for possible consolidation and the potential for unfavorable impacts on competition. The Department examines these industry sectors for conditions that may either create a decrease in services or a monopolistic situation. During 2015, Maine’s solid waste (or "materials management") industry continued to be a mix of public and private investments and services that handled over 7,500 tons of materials each day. A review of that system and its components shows the interrelated services of collection and hauling of recyclables and trash. The processing and disposal of collected materials were provided in a steady and consistent fashion, responding to Maine’s solid waste management needs. Disposal Facilities During 2015, there were no noted changes in the ownership/operation of the licensed disposal facilities in Maine. Collection and Hauling Services Since the last Waste Generation and Disposal Capacity Report, the Department has not learned of any significant ownership changes in, or to service areas of trash hauling service providers. However, in 2015, there was marked growth in the development of organics collection services, primarily in the Southern Maine to Lewiston region. Previously, a few collection service businesses had begun working with institutions, restaurants and residents, providing collection of unwanted food scraps, with those scraps being delivered to one of many options: a farm based composting operation; a composting facility that is owned and operated by a collection company; and, to a farm based anaerobic digester. Other haulers, whose primary focus has been trash and recyclables, have also looked into this separated stream of organics, but the Department is not currently aware of any significant commitment by those haulers to separate organics collection and utilization. Recycling Services Two "materials recovery facilities" (MRFs) (facilities that sort mixed recyclables into marketable commodities) are now in operation within, and serving Maine’s municipalities and businesses: ecomaine, a non-profit waste management company owned by 21 municipalities based in Portland, and Casella Waste Services, Inc., in partnership with the City of Lewiston, converting that city’s recycling facility into a ‘Zero Sort®’ materials processing facility. The number of municipalities participating within one of these 'single stream recycling' programs continues to grow over time.
Maine Department of Environmental Protection – 2017 Waste Generation & Disposal Capacity Report
19
This has led to the abandonment of many long established ‘source separated’ recycling programs and facilities that had successfully been baling and marketing recyclables for many years. Household participation in single-sort recycling programs tends to be higher than in "source separated" programs. However, single sort programs have more "residual", i.e., non-recyclable materials, and some of the resultant commodities may be of a lower grade.
VII. Disposal Fees and Supracompetitive Prices
A. Disposal Fees Disposal expenses are comprised of collection and transportation costs, and tipping fees on the disposal of waste at a licensed facility, with the tipping fee often being a major share of those costs. Current tipping fees range from $40 to $95 per ton at Maine’s waste-to-energy facilities and landfills. These have stabilized in most instances, allowing predictability for municipal budgeting and long-term planning. Many transfer stations impose a fee on municipal solid waste delivered to them, and that fee may reflect the cost of the transfer station’s operation, as well as partial or full value of the tipping fee at the intended disposal facility. The State, in its operating services agreement with Casella Waste Systems Inc. for the state owned Juniper Ridge Landfill, established a ceiling for tipping fees. This sets an upper limit on how much can be charged for various categories of wastes delivered to that landfill which continues to have a stabilizing impact on pricing for the disposal of similar materials at other solid waste disposal facilities. Tipping fees at WTE facilities are influenced by revenues received from the sale of the electricity they generate. The revenues reduce operating expenses, yielding a reduction in the tip fee charged for solid waste. Should electricity sales revenue drop, tipping fees may increase; conversely, should the electricity sales value increase, the possibility exists that lower tipping fees, or maintaining current fees, would occur.
B. Supracompetitive Prices Supracompetitive, as applied to ‘prices,’ means prices that are higher than they would be in a normally functioning, competitive market; usually as a result of overconcentration, collusion, or some form of monopolistic, oppressive practice. State law requires the Department to determine whether changes in available landfill capacity have generated, or have the potential to generate, supracompetitive prices and if so, provide recommendations for legislative or regulatory changes as necessary.
Maine Department of Environmental Protection – 2017 Waste Generation & Disposal Capacity Report
20
Currently, the disposal capacity situation does not appear to have generated, nor does it appear in the near term to have the potential to generate, supracompetitive disposal fees. It is important to consider the pending application for 9,350,000 cubic yards additional capacity, which would add 10-12 operating years at the Juniper Ridge Landfill, where existing capacity is projected to be sufficient for the next 4.5 years. Should that application be delayed, restricting the ability to construct additional disposal capacity, the possibility of supracompetitive pricing may arise. In looking ahead, at that point when disposal capacity exists with fewer facilities than today, it is possible that prices could become supracompetitive. Where the actual date and timing of this is not known, nor predictable, it is critical that the Department maintains awareness of this possibility and keeps the Governor and Legislature informed.
Maine Department of Environmental Protection – 2017 Waste Generation & Disposal Capacity Report
21
Appendix A - Definitions and Acronyms The following definitions and acronyms are provided to assist the reader in reviewing this document:
Beneficial Use – to use or reuse a solid waste or waste derived product: as a raw material substitute in
manufacturing, as construction material or construction fill, as fuel, or in agronomic utilization. Construction/Demolition Debris (CDD) – wastes generated by building, remodeling and/or destruction
activities and may include such wastes as wood and wood products, concrete and brick, gypsum board, shingles and other common components of buildings.
Diversion Rate – Waste diversion is the prevention and reduction of generated waste through source
reduction, recycling, reuse (including beneficial reuse), or composting. Front-end Process Residue (FEPR) – residual of municipal solid waste resulting from the processing of
solid waste prior to incineration or landfilling, and includes, but is not limited to, ferrous metals, glass, grit and fine organic matter.
Municipal Solid Waste (MSW) – solid waste emanating from household and normal commercial activities. Special Waste – wastes that are generated by other than domestic and typical commercial establishments that
exist in such an unusual quantity or in such a chemical or physical state that require special handling, transportation and disposal procedures.
Supracompetitive – when applied to prices means prices that are higher than they would be in a normally
functioning, competitive market -- usually as a result of overconcentration, collusion or some form of monopolistic, oppressive practice.
Universal Wastes – a category of wastes that includes: PCB containing lighting ballasts, Cathode Ray Tube
(CRT) containing devices, fluorescent lamps, other lamps containing hazardous wastes, and, mercury-added devices from commercial sources.
Waste-to-Energy Ash – residue from the combustion of municipal solid waste at waste-to-energy facilities. It
may also contain fly ash from the facility’s operation and is designated as a “special solid waste”. Waste-to-Energy facilities (W-T-E) – facilities which receive municipal solid waste, and through processing
and combustion, recover energy and convert it into electricity, while reducing the volume of waste requiring disposal.

Maine Department of Environmental Protection – 2017 Waste Generation & Disposal Capacity Report
22
Appendix B – Current Management of Municipal Solid Waste in Maine Appendix B provides an overview of the various management options currently employed for the larger components of Maine’s municipal solid waste stream. This table provides a qualitative assessment of the comparative use of the ‘end of life’ management options for these products and materials. Options are grouped by levels based upon the Solid Waste Management Hierarchy, with the most preferred management choice being located farthest to the left. By examining Maine’s waste stream by material type and current ‘end of life’ management options, opportunities can be identified for “moving those disposal choices up the hierarchy”, thereby increasing waste reduction, reuse, recycling and beneficial use efforts, while decreasing the need for disposal and preventing loss of resources.
Waste categories & types
Source reduc-
tion
Reuse and re-
purpose Recycle Compost
Beneficial Use -
Agronomic
Beneficial Use - raw material substitution
Beneficial Use - fuel
Anaerobic Digestion
Conversion (gasification / pyrolysis)
WTE incineration Landfill
N = None, I = Incidental, L = Low, M = Medium, H = High, gray shaded = Not applicable (not possible) Organics L L L/M L N H H Paper & cardboard M M M L N M M Plastics
#1 PETE/PET & #2 HDPE M I H N L N L L #3 - 7 L I M N N M M
Metals Steel & aluminum
cans/foil M I H L L
other ferrous & non-ferrous metals N I H L L
Glass I L H L L L CDD/wood waste/ Bulky Wastes
Mixed CDD L N I H Clean C&D wood I N M N I M
Carpet L I L N N I H Furniture / mattresses L L N L H
Asphalt roofing material N M N N I M Wallboard L L N I H
Maine Department of Environmental Protection – 2017 Waste Generation & Disposal Capacity Report
23
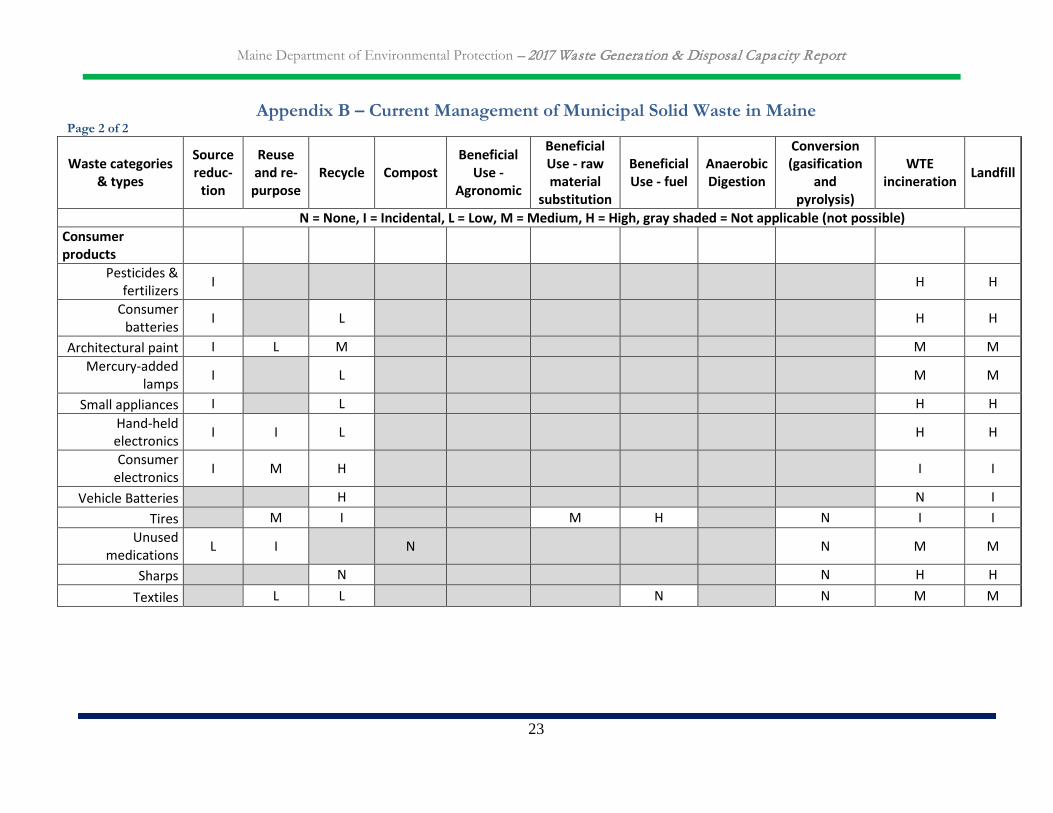
Appendix B – Current Management of Municipal Solid Waste in Maine Page 2 of 2
Waste categories & types
Source reduc-
tion
Reuse and re-
purpose Recycle Compost
Beneficial Use -
Agronomic
Beneficial Use - raw material
substitution
Beneficial Use - fuel
Anaerobic Digestion
Conversion (gasification
and pyrolysis)
WTE incineration Landfill
N = None, I = Incidental, L = Low, M = Medium, H = High, gray shaded = Not applicable (not possible) Consumer products
Pesticides & fertilizers I H H
Consumer batteries I L H H
Architectural paint I L M M M Mercury-added
lamps I L M M
Small appliances I L H H Hand-held electronics I I L H H
Consumer electronics I M H I I
Vehicle Batteries H N I Tires M I M H N I I
Unused medications L I N N M M
Sharps N N H H Textiles L L N N M M