work package 1-743 waste disposal outcomes and …...work package 1-743 waste disposal outcomes and...
TRANSCRIPT

Work Package 1-743 Waste Disposal Outcomes and Diversion Impacts
Final report
E4tech (UK) Ltd for the UK Department for Transport
in partnership with Anthesis
May 2019

Contents
Glossary ............................................................................................................................................................. 4
Executive Summary ........................................................................................................................................... 5
1 Aims and overview of the study .............................................................................................................. 10
2 Categorisation and definitions of wastes ................................................................................................ 10 2.1 Wastes which are in scope .............................................................................................................................. 10 2.2 Categorisation and definition of solid wastes ................................................................................................. 10 2.3 Categorisation and definition of gaseous wastes ............................................................................................ 16
3 Typical end-of-life fate of wastes ............................................................................................................ 18 3.1 Typical end-of-life fate of solid feedstocks ..................................................................................................... 18 3.2 Typical end-of-life fate of gaseous feedstocks ................................................................................................ 25 3.3 Potential future changes to end-of-life fates and waste compositions .......................................................... 26
3.3.1 England ....................................................................................................................................................... 26 3.3.2 Scotland ...................................................................................................................................................... 27 3.3.3 Wales .......................................................................................................................................................... 27 3.3.4 Northern Ireland ......................................................................................................................................... 28
4 GHG impacts of end-of-life fates ............................................................................................................. 28 4.1 Methodology ................................................................................................................................................... 28
4.1.1 Overview ..................................................................................................................................................... 28 4.1.2 Limitations of this method .......................................................................................................................... 29 4.1.3 Calculation of emissions from previous fate............................................................................................... 29 4.1.4 Calculation of emissions from replacing utility generated in previous fate ............................................... 30 4.1.5 Estimation of GHG emissions from final fuel .............................................................................................. 30
4.2 Results ............................................................................................................................................................. 31 4.2.1 Feedstock counterfactual emissions for SW1 across different EoL fates ................................................... 31 4.2.2 Feedstock counterfactual emissions for all feedstocks .............................................................................. 32 4.2.3 Estimated fuel GHG emissions for SW1 across different EoL fates ............................................................ 33 4.2.4 Estimated fuel GHG emissions for GW1 across different EoL fates ............................................................ 34 4.2.5 Estimated fuel GHG emissions for all feedstocks........................................................................................ 34 4.2.6 Sensitivity – replacement fuel in cement kilns ........................................................................................... 35 4.2.7 Sensitivity – feedstock diverted from energy from waste .......................................................................... 35 4.2.8 Sensitivity – Conversion efficiency of fuel into feedstock .......................................................................... 37
5 Conclusions and limitations of results ..................................................................................................... 38
Appendix A – Detailed information on definition of each solid waste stream ........................................... 40
Appendix B – Data on volumes and end of life fates of solid wastes ......................................................... 45
Appendix C – Solid waste compositions ..................................................................................................... 54
Appendix D – Key data and assumptions used in GHG assessment ........................................................... 56
Appendix E – UK grid electricity emission factors ...................................................................................... 58

E4tech (UK) Ltd 83 Victoria Street London SW1H 0HW United Kingdom Tel: +44 20 3008 6140 Fax: +44 20 3008 6180
Incorporated in England and Wales Company no. 4142898 Registered address:
133-137 Alexandra Road, Wimbledon, London SW19 7JY United Kingdom
www.e4tech.com

Final Report
4
Glossary BMW Biodegradable municipal waste
BF Blast furnace
BOF Basic oxygen furnace
C&I Commercial and industrial
CHP Combined heat and power
DMR Dry mixed recyclables
EfW Energy from waste
EWC European waste catalogue
GHG Greenhouse gas
GW Gaseous waste
HHV Higher heating value
LACMW Local authority collected municipal waste
LACW Local authority collected waste
LCA Life cycle assessment
LCFFs Low carbon fossil fuels
LHV Lower heating value
RDF Refuse derived fuel
RFNBO Renewable fuel of non-biological origin
RTFO Renewable transport fuel obligation
RWS Resources and waste strategy
SRF Solid recovered fuel
SW Solid waste
WTT Well to tank
WTW Well to wheel

Final Report
5
Executive Summary Fuels produced from fossil wastes and residues, termed secondary fossil feedstocks, are being considered to meet the UK’s transport sector decarbonisation targets, so an assessment is needed of the potential GHG emissions savings from these fuels. This study aimed to provide the UK Department for Transport (DfT) with detailed data to calculate GHG emission factors for fuels derived from secondary fossil feedstocks.
A number of categories of fossil wastes and residues were defined, encompassing those feedstocks which are currently being considered for conversion into transport fuel, and considering only the non-biogenic portion of these wastes. Seven different solid wastes and two different gaseous wastes categories were defined (Table 1), although it should be noted that residual waste is very heterogeneous, and there is likely to be substantial variation in composition even within the categories used in this study.
Table 1 Definition of feedstocks for this study
Code Waste stream SW1 Non-biogenic fractions of residual mixed waste (black bag/bin waste) derived from
households (and some businesses) via Local Authority collections (carried out by the Local Authority and private third-party contractors).
SW2 Non-biogenic fractions of residual mixed waste derived from commercial & industrial premises collected via private contractors.
SW3 Non-biogenic fractions of solid recovered fuels (SRF), which are meeting the required CEN or customer specifications of the cement, steel and power plants in the UK & Europe
SW4 Non-recyclable fossil waste plastic being collected as a separated waste stream from households, commercial and industrial premises
SW5 Non-recyclable fossil waste rubber being collected from commercial premises
SW6 Non-biogenic residue streams from material sorting and separation facilities
SW7 Non-biogenic residue streams from composting and AD processes
GW1 BOF/BF gas – Gases from steel mill basic oxygen furnace or blast furnace
GW2 Refinery waste gas – Gas from refineries which would otherwise have been combusted within the refinery or flared.
The current end-of-life (EoL) fate of each of these feedstocks was identified, along with the volumes of feedstock destined to each EoL fate in England, Wales, Scotland and Northern Ireland. This was based on the best available data, which is typically from 2017 or before, and varied in completeness of coverage between the different waste categories and UK nations. Based on this information, a UK-wide weighted average EoL fate was calculated for each feedstock (Figure 1 and Figure 2).

Final Report
6
Figure 1 UK weighted average EoL fate for each solid feedstock based on data available in 2019
Figure 2 UK weighted average EoL fate for each gaseous feedstock based on data available in 2019
Using the methodology previously developed for the DfT1 Figure 3, summarised in , the emissions associated with using each feedstock for transport fuel production were calculated. Using this method, the feedstock is given a credit for the emissions which no longer occur when it is diverted from an existing EoL fate, hence the term ‘emissions from previous fate’ in Figure 3 is negative. For example if a material is diverted from an energy-from-waste (EfW) plant to produce transport fuel then the combustion of that feedstock is avoided. The feedstock is also attributed GHG emissions associated with replacing any useful products that were previously produced from that waste, shown by the term ‘emissions from replacing utility generated in previous fate’ in Figure 3. In the case that waste is diverted from power production in an EfW plant, this term corresponds to the GHG emissions from providing that electricity by an alternative means.
1 E4tech (2018) Low Carbon Fossil Fuels Sustainability Risks and Accounting Methodology, Available from: http://www.e4tech.com/wp-content/uploads/2018/02/LCFF_Sustainability-FinalReport.pdf

Final Report
7
Figure 3 WTW GHG emissions of a transport fuel made from fossil wastes
Using this calculation methodology, the feedstock counterfactual emissions vary substantially depending on the end of life fate from which the feedstock was diverted. Emissions from fossil feedstocks diverted from an existing use to transport fuel production are lowest when:
a) The feedstock would have been combusted anyway b) The feedstock did not produce any useful heat or power in previous EoL fate, or it produced
heat/power at low efficiency c) The heat/power which was previously generated from the feedstock is replaced with a low-
carbon source of heat/power
For each feedstock the average feedstock GHG emissions were calculated, based on the UK weighted average EoL fate of that feedstock and an average GHG intensity for replacing the heat or power generated in that EoL fate (Figure 4).
Figure 4 Feedstock counterfactual emissions for all feedstocks
Of the solid wastes, SW1 has the lowest GHG emissions when converted into transport fuel, because a large proportion of this feedstock is used for energy from waste (EfW). When feedstock is diverted from EfW to make transport fuels the power generated in the EfW plant is assumed to be replaced with UK average grid electricity, with a relatively low GHG intensity of 43gCO2eq./MJ. SW4 and SW7 have the highest feedstock GHG emissions amongst the solid wastes, as the majority of this material currently goes to landfill, which is assumed to act as a carbon store. GW1 has low feedstock GHG emissions. This is because there is a large amount of inert CO2 within the BOF/BF gas which is considered as an avoided emission, giving a large negative result for feedstock GHG intensity. This CO2 would be released during fuel production or combustion so would contribute an equally large positive GHG emission to the ‘fuel production and use emissions’ part of the formula in Figure 3.

Final Report
8
For those feedstocks which could have a number of different EoL fates (SW1, SW2, SW5, SW6, GW1), counterfactual emissions could vary quite substantially from the average depending on which EoL fate that feedstock is diverted from. Conversely, for those feedstocks which have only one predominant EoL fate (SW3, SW4, SW7 and GW2), the variation from the average is smaller.
The GHG intensity of fuels made from these waste fossil feedstocks has been estimated for all feedstocks based on the weighted average EoL fate for each feedstock, an average GHG intensity for replacing the heat or power previously generated by that feedstock, and a single assumption for process emissions (Figure 5). Figure 5 shows that based on a weighted average EoL fate, there is little GHG saving made compared to the fossil fuel counterfactual for transport fuels made from these waste fossil feedstocks. Figure 6 provides the estimated GHG emissions of fuel made from one feedstock, across the different EoL fates of that feedstock. This indicates that fuels made from waste fossil feedstocks could save GHG emissions compared to the fossil fuel counterfactual if that feedstock is diverted from particular EoL fates. In particular, diversion of feedstocks from UK energy-from-waste plants to transport fuel production is likely to reduce GHG emissions. This indicates that it is important to consider the EoL fate from which fossil feedstocks are diverted when assessing GHG emissions of fuels made from waste fossil feedstocks. The most accurate results are obtained when the assessment is done on a case by case basis due to the high level of uncertainty and variation in feedstock composition, plant efficiency and alternative EoL use of feedstocks when using a weighted average approach.
Figure 5 Estimated fuel GHG emissions for all feedstocks

Final Report
9
Figure 6 Estimated fuel GHG emissions for SW1 across different EoL fates
This study has not focussed on the policy context for low-carbon fossil fuels, but nevertheless this will be important to consider going forwards, particularly in the case of mixed fossil/biogenic waste and waste diverted from landfill. Due to the existing treatment of biogenic waste under the RTFO, this study considers non-biogenic waste in isolation. However, several of the feedstocks assessed in this study are produced as a mixed fossil/biogenic waste stream. Therefore, the impact of any policy concerning fossil wastes on the corresponding biogenic portion of that waste should also be considered. In addition, it is important that any policy developed by DfT around low-carbon fossil fuels is aligned with existing waste policy so it does not create contradictory incentives, and remains aligned as waste management policy develops over time.
There are several important limitations of these results which should be noted, including the uncertainty around a number of key assumptions used. In particular, when considering the power/heat which would be used to replace the fossil feedstock when it is diverted from its existing EoL fate, an average GHG intensity has been used. However the utility provided by the waste fossil feedstock could be replaced with power/heat which has a GHG intensity quite different to the average. For example waste fossil feedstock diverted from a cement kiln is assumed to be replaced with the average fuel mix used in cement kilns today, but an individual operator could use 100% coal which has a GHG intensity 80% higher than the average fuel mix, or waste biomass which has a GHG intensity 90% lower than the average fuel mix.
Further, this study does not assess the impact of how these counterfactual feedstock emissions may change over time. The average EoL fate of each feedstock is calculated in this study using data that is typically at least a year old, and this distribution of EoL fates across the different feedstocks may change in the future, for example as the 2018 Waste and Resources Strategy2 is implemented. In addition, the GHG intensity of replacing the utility generated by that waste feedstock might also change, for example as electricity grids generally decarbonise. Finally, the conversion of feedstocks into fuel has not been considered in detail in this study, and therefore the fuel GHG emissions presented reflect one set of assumptions only, and there may be substantial variation possible amongst the different conversion processes for turning waste into fuel.
2 DEFRA (2018) Our waste, our resources: a strategy for England, Available from: https://assets.publishing.service.gov.uk/government/uploads/system/uploads/attachment_data/file/765914/resources-waste-strategy-dec-2018.pdf

Final Report
10
1 Aims and overview of the study As part of its responsibility to deliver the UK’s renewable fuel and greenhouse gas targets in the transport sector, DfT’s Low Carbon Fuels team aims to develop the economic potential of renewable, and potentially low carbon fossil fuel, transport fuel industry in the UK. Inclusion of fossil fuels derived from unconventional fossil feedstocks (‘low carbon fossil fuels’ – LCFFs) in the RTFO would require demonstration of their GHG reduction potential.
In 2018, E4tech provided DfT with methodological foundations for assessing the GHG emissions from LCFFs.3 This work builds on that study, providing DfT with the detailed data necessary to calculate specific GHG emission factors for fuels derived from different secondary fossil feedstocks. This report is supplemented by a fully functioning model, which will allow DfT to identify the emission factors for various waste streams, including the effects of diverting them from their existing disposal options.
3 E4tech (2018) Low Carbon Fossil Fuels Sustainability Risks and Accounting Methodology, Available from: http://www.e4tech.com/wp-content/uploads/2018/02/LCFF_Sustainability-FinalReport.pdf
2 Categorisation and definitions of wastes
2.1 Wastes in scope
This study considers the non-biogenic portion of wastes arising in the UK, defined as waste which is non-biological in origin. This is also termed ‘fossil’ waste. Throughout the report, waste volumes provided refer to the fossil portion of the waste only. This is in line with the existing RTFO methodology, which considers the biogenic and fossil portion of mixed waste streams as separate consignments. Moreover, focus has been placed on wastes which are currently being considered as feedstocks for transport fuel production, in order to provide maximum policy relevance for DfT. However, it is worth noting that it may be theoretically possible to produce transport fuels from a range of other materials.
The following feedstocks are not within scope:
• Material which are recycled, as this does not comply with the waste hierarchy • CO2, as fuels made from CO2 are considered by the RTFO to be renewable fuels of non-
biological origin (RFNBOs) and are dealt with under existing legislation
2.2 Categorisation and definition of solid wastes
A material is considered a waste when the producer or holder of the material discards it, intends to discard it, or is required to discard it4. Producers are required to apply the waste hierarchy, with prevention the most preferable action and disposal to landfill as the least environmentally desirable option (Figure 7). This principle of driving waste up the hierarchy to more sustainable waste management options forms the basis of waste management policy in the UK. The production of fuel is considered a recovery operation in the waste hierarchy.
4 https://assets.publishing.service.gov.uk/government/uploads/system/uploads/attachment_data/file/69590/pb13813-waste-legal-def-guide.pdf

Final Report
11
Figure 7: The Waste Hierarchy5
5 DEFRA (2011) Guidance on applying the Waste Hierarchy, Available from: https://assets.publishing.service.gov.uk/government/uploads/system/uploads/attachment_data/file/69403/pb13530-waste-hierarchy-guidance.pdf
Given that transport fuel and energy generation is currently classified as a recovery operation, this study has focussed on the waste elements which are currently being sent to for recovery or disposal, and not for waste streams already being collected or separated for mechanical recycling or re-use, as use of these materials for transport fuel production would contravene the waste hierarchy. This is illustrated in Figure 8.
Figure 8: Fate of all household and commercial waste arising in the UK. Those within scope of the study are ticked.
This approach reflects the status quo at the time of writing the report. However, in the waste streams sent for recovery or disposal there is likely to be material that is theoretically recyclable but

Final Report
12
is not currently being recycled as it is either not economic to do so e.g. the cost of separating or processing to the desired quality is not cost effective, or there is not a viable end market for the recycled output materials. Key risks of this approach include (1) future development in waste separation technology means the material becomes recyclable; or (2) indirectly dis-incentivising recycling and re-using waste by incentivising transport fuel production from waste. These risks are discussed in more detail in E4tech (2018)6, and specific information on likely changes to waste composition in the UK over time is given in section 3.3 to inform assessment of this risk.
6 http://www.e4tech.com/wp-content/uploads/2018/02/LCFF_Sustainability-FinalReport.pdf
Solid wastes are defined based on European Waste Catalogue codes. The European Waste Catalogue (EWC) is an EU-wide common terminology for waste classification, and each material classified as waste is given an EWC code. All waste producers have a duty of care to ensure that their waste is being classified and managed appropriately. This includes having waste transfer notes with detailed descriptions and EWC coding for the wastes leaving their premises. In addition, permitted waste sites need to provide quarterly reports (waste returns) on the waste they receive, their waste sorting and processing activities and their outputs, which also require the use of EWC codes to trace waste across the waste supply chain to its final destination. Therefore, EWC codes have been used to define and track EoL fates of the waste types being considered in this study.
The solid waste categories code which is used as shorthand in this study, and the EWC codes by which each waste is defined are summarised in Table 2. The EWC codes do not map exclusively to each feedstock category as defined in this study, so more information is provided in Appendix A to enable DfT to categorise any given feedstock into the correct category.
While all UK nations use EWC codes, the timing and granularity of the data reported varies within the UK and depends on their respective data capture system, the latest data sets made publicly available and the level of public reporting. To enable comparison and analysis across the UK, the data has been caveated and assumptions have been noted throughout the section.
Table 2: Definition of solid waste streams
Waste stream EWC code
EWC description EWC sub-description
SW1 Non-biogenic fractions of residual mixed waste (black bag/bin waste) derived from households (and some businesses) via Local Authority collections (carried out by the Local Authority and private third-party contractors).
20 03 01 (sub-set of)
Municipal wastes (household waste and similar commercial, industrial and institutional wastes)
Mixed municipal waste
SW2 Non-biogenic fractions of residual mixed waste derived from commercial & industrial
20 03 01 (sub-set of)
Municipal wastes (household waste and similar
Mixed municipal waste

Final Report
13
Waste stream EWC code
EWC description EWC sub-description
premises collected via private contractors.
commercial, industrial and institutional wastes)
SW3 Non-biogenic fractions of solid recovered fuels (SRF), which are meeting the required CEN or customer specifications of the cement, steel and power plants in the UK & Europe
19 12 10 Waste from waste management facilities, from the mechanical treatment of waste (e.g. sorting, crushing, compacting, pelletising)
Combustible waste (refuse derived fuel)
SW4 Non-recyclable fossil waste plastic being collected as a separated waste stream from households, commercial and industrial premises
19 12 04 Waste from waste management facilities, from the mechanical treatment of waste (e.g. sorting, crushing, compacting, pelletising)
Plastic and rubber
16 01 19 End of life vehicles from different means of transport (including off-road machinery) and wastes from dismantling of end-of-life vehicles and vehicle maintenance (except 13, 14, 16 06 and 16 08)7
Plastic
17 02 03 Construction and demolition wastes
Plastic
SW5 Non-recyclable fossil waste rubber being collected from commercial premises
19 12 04 Waste from waste management facilities, from the mechanical treatment of waste (e.g. sorting, crushing, compacting, pelletising)
Plastic and rubber
16 01 03 End of life vehicles from different means of transport (including off-road machinery) and wastes from dismantling of end-of-life vehicles and vehicle maintenance (except 13, 14, 16 06 and 16 08)
End-of-life tyres
7 These exceptions are part of the EWC code definition and exclude catalysts, oils and organic solvents.

Final Report
14
Waste stream EWC code
EWC description EWC sub-description
SW6 Non-biogenic residue streams from material sorting and separation facilities
19 12 10 Waste from waste management facilities, from the mechanical treatment of waste (e.g. sorting, crushing, compacting, pelletising)
Combustible waste (refuse derived fuel)
19 12 12 Other wastes (including mixtures of materials)
SW7 Non-biogenic residue streams from composting and AD processes
19 06 99 Waste from anaerobic treatment of waste
Wastes not otherwise specified
19 05 Waste from aerobic treatment of waste
01: non-composted fraction of municipal and similar wastes
99: wastes not otherwise specified
There is some overlap between some of the codes and the solid waste streams identified. Further detail, therefore, is required to help define each of the waste streams, mainly relating to the source of the waste (i.e. understanding whether waste has been collected by a local authority, or on behalf of a local authority by private contractors, or directly by private contractors from businesses) but in some cases, compositional information (e.g. to determine an SRF from an RDF).
This study principally considers residual waste (the waste which remains after materials have been separated for reuse and/or recycling8), which is a mixed waste stream comprised of multiple material types, and is given the EWC code 20 03 01. This waste is usually either recovered in EfW facilities or goes to landfill. However, it may also go to an interim treatment facility (e.g. mechanical biological treatment (MBT) or RDF/SRF production), where additional recyclable materials are separated. The remaining waste is then pre-processed and dried before being sent as a solid waste fuel to EfW facilities, cement kilns etc. After undergoing this type of processing, it is given a different EWC code beginning with 19, indicating wastes after processing.
8 Materials which are recycled tend to be done so because there is a market for them, and so it is economically viable to do so.
For the purposes of quantifying and more easily defining the waste types by EWC code, waste which goes directly to EfW or landfill (EWC code 20 03 01) has been considered under SW1 (local authority

Final Report
15
collected waste) and SW2 (commercial and industrial waste). EWC codes beginning with 19 do not distinguish between waste origin i.e. it is not traceable back to either its household or commercial and industrial (C&I) source, but the composition is likely to be very similar and so should not make a significant difference in terms of fuel production and CO2 impact. So SW3 – 7 includes waste originating from both local authority and C&I sources.
Sorting, separation and recycling activities create approximately 5-10% processing residues, which cannot be further recycled. This represents an additional waste stream for potential fuel production, encompassed by SW6 and SW7. For example, dry mixed recyclables (DMR) are separated at material recovery facilities (MRFs). However, there tends to be contaminants or non-target materials present in the DMR, which are not recyclable and must be removed from the process. These contaminants and non-target materials go to EfW or landfill disposal. Similarly, in AD and composting activities, there are often fossil rejects such as packaging materials, which cannot be processed and need to be screened out from either the final compost or digestate product.
Most of the solid wastes within scope of this study are mixed wastes comprised of both fossil and biogenic material. Only the fossil fraction of each waste stream is relevant for this study, but waste data, recorded by government and local authorities, typically records the total volume of waste. Therefore, a composition analysis was required to estimate the relevant fossil content9 for each waste stream identified. Table 3 outlines the assumed fossil content for each waste stream. Further details around these assumptions are presented in Appendix C. It should be noted that the mixed waste streams are very heterogenous and their compositions can vary considerably depending on the source, season, collection methods and the actual sampling and composition analysis methodology. Composition can also vary by nation within the UK, due to differences in implemented collections of dry recyclables and organic wastes, which result in different residual waste compositions. Due to these variations in waste compositions across the UK, a range is given in Table 3 for the likely fossil fraction of each waste stream.
9 Percentage of total waste mass that is non-biogenic
Table 3: For each category of waste, percentage by mass of total waste volume which is non-biogenic material
Waste stream Percentage (mass) of total waste stream which is non-biogenic
SW1 30 - 40%
SW2 30 - 40%
SW3 30%
SW4 100%
SW5 60%
SW6 30 - 40%
SW7 100%
Final Report
16
2.3 Categorisation and definition of gaseous wastes
The gaseous waste streams which are currently being considered as feedstock for liquid fuel production are10:
• Refinery fuel gas • Steel mill waste gas • Ferro-alloy waste gas
10 Based on industry feedback
These are discussed in more detail below
Refinery fuel gas
The UK currently has six operating refineries.11 Gases can be produced in the refinery as by-products of the various processing units, or may come from the crude oil itself. Typically these gases contain a mixture of hydrogen and short-chain hydrocarbons with between 1 and 4 carbon atoms. The hydrogen is generally separated out to be used internally in the refinery, while other useful products, such as propane and butane, are separated out and sold for example as feedstock in petrochemical plants, fuels for heating, cooking and drying, and additives in gasoline production.12 The remaining gas is known as ‘refinery fuel gas’ and is comprised of the gas components which were not separated out for onwards use or sale (mostly 1 and 2 chain carbon molecules) and small amounts of the other gases which could not be recovered. This refinery fuel gas is used to fire the various furnaces and boilers within the refinery. 13 Note that refinery gas can also be referred to as refinery off-gas, refinery fuel-gas, and refinery-gas, with little distinction between these streams. In this study, ‘refinery gas’ refers to the non-condensable gas obtained during crude oil distillation or treatment.14 Further, ‘refinery fuel-gas’ refers to the residual refinery gas once the useful molecules have been removed, which is used which is used to provide heat or power in the refinery.
11 UK PIA, Available from: http://www.ukpia.com/industry_information/refining-and-uk-refineries/refineries.aspx 12 https://www.eia.gov/energyexplained/index.php?page=hgls_home 13 INEOS (2012) Available from: https://www.ineos.com/globalassets/ineos-group/grangemouth/community/4429_ineos_flaring_dec12_v2.pdf 14 Definition in line with OECD (2002) Glossary of statistical terms, Available from: https://stats.oecd.org/glossary/detail.asp?ID=4621
Some gases are also likely to be flared from the refinery (burned in the atmosphere). As flaring generates no value to the plant, and may be associated with noise, particulates and other environmental impacts, refineries typically aim to reduce the amount of flaring they do.15,16 Flaring is predominantly used as a safety system to avoid gas pressure build-up during start-up, shut-down or emergencies.17 In theory this gas could be used for liquid fuel production, so it is included within the definition. However, in practice, in the UK, due to the intermittent nature of refinery gas flaring, and its requirement as a safety feature of the refinery, flaring is not a typical EoL fate for the refinery gas.
15 http://www.essaroil.co.uk/responsibility/environment/the-use-of-flares/ 16 https://www.ineos.com/globalassets/ineos-group/grangemouth/community/4429_ineos_flaring_dec12_v2.pdf 17 INEOS (2012) https://www.ineos.com/globalassets/ineos-group/grangemouth/community/4429_ineos_flaring_dec12_v2.pdf

Final Report
17
If gases are already being used to produce products, for example in the petrochemical sector, then they should not be used for liquid fuel production, as this would not meet the waste hierarchy. Therefore refinery fuel gas is defined as refinery gas from which all products which can economically be separated have been removed, which would otherwise be combusted for heat/power within the refinery or flared.
Flaring of gases from refineries should not be confused with gas flaring from oil and gas extraction facilities (also called associated gas). As noted in E4tech (2018)18, associated gas flaring is decreasing globally, and any reductions in associated gas flaring can already be counted as Upstream Emission Reductions (UERs). Moreover, there has been little interest in the UK in producing transport fuels from associated gas. Therefore, gas flared at oil and gas extraction sites is not within scope of this definition.
18 E4tech (2018) Low Carbon Fossil Fuels Sustainability Risks and Accounting Methodology, Available from: http://www.e4tech.com/wp-content/uploads/2018/02/LCFF_Sustainability-FinalReport.pdf
Steel mill waste gas
The UK currently has two integrated steelworks in operation (Port Talbot Steelworks, still currently owned by Tata Steel Europe, but merged with Thyssenkrupp pending approval by EU Commission19, and Scunthorpe Steelworks, owned by Greybull and operating as British Steel20).
19 https://www.handelsblatt.com/unternehmen/industrie/stahlriesen-tata-steel-schwaechelt-vor-buendnis-mit-thyssen-krupp/23840402.html 20 https://www.bbc.com/news/uk-england-humber-44870938
In the 40 years to 2013, the UK iron and steel sector reduced its energy consumption by 40% per tonne of steel produced. This reduction is largely related to the investment in technologies, now standard in modern plants, to capture and manage gases for energy recovery, thereby significantly reducing flaring.21 Nevertheless, a small proportion of BF/BOF gases, are still flared.22
21 https://assets.publishing.service.gov.uk/government/uploads/system/uploads/attachment_data/file/416667/Iron_and_Steel_Report.pdf 22 https://www.gov.uk/government/collections/digest-of-uk-energy-statistics-dukes
Steel mill waste gases that could conceivably be used as feedstock for transport fuel production occur at the coke oven, blast furnace (BF) and basic oxygen furnace (BOF) of integrated steelworks. Steel making via the electric arc furnace does not produce these types of gases and is therefore not further considered. Independent coke works do produce coke oven gas, but the last such plant in the UK (Monckton Coke & Chemicals, Barnsley) closed permanently at the end of 201423.
23 https://www.thestar.co.uk/business/workers-empty-coke-oven-for-final-time-1-7014288
The composition of these three types of gases varies.24, 25,26,27 Coke oven gas typically has a higher hydrogen and methane content compared to BOF/BF gas, and a heating value around 3 times higher than BOF gas and 10 times higher than BF gas,28 therefore is more valuable to use within the steel
24 https://ispatguru.com/coke-oven-gas-its-characteristics-and-safety-requirements/ 25 https://www.clarke-energy.com/steel-production-gas/ 26 http://ispatguru.com/blast-furnace-gas-its-characteristics-and-safety-requirements/ 27 http://ispatguru.com/converter-gas-its-characteristics-and-safety-requirements/ 28 On a mass basis, based on calculations from: https://uk-air.defra.gov.uk/assets/documents/reports/cat07/1107061136_IP_Task_9_CV_Review_Non-Standard_Gaseous_Fuels.pdf

Final Report
18
mill. 66% of the coke oven gas is used either for electricity production or to provide heat back to the coke ovens.29 Correspondence with steel industry representatives suggested that it is unlikely that coke oven gas would be diverted from combustion at the steelworks to fuel production as it already plays a valuable role as a low-carbon fuel within the steel mill.30 Therefore, whilst COG could in theory be used for the production of transport fuel, it is not included within the scope of this study as it is considered unlikely that this would happen in practice.
29 https://assets.publishing.service.gov.uk/government/uploads/system/uploads/attachment_data/file/729412/Ch2.pdf 30 This was confirmed by discussions with steel industry representatives
Therefore, for this study, the relevant gas stream is BOF/BF gas from the steel mill. These gases are considered as a mixed stream, as they are typically mixed within the steel mill. Further, they are treated as one mixed waste stream within the BEIS DUKES data31. However, the BOF and BF gases have substantially different compositions. Therefore, based on information on the gas mixture produced at an operating steel mill, the default calculations given in the attached excel assume a mixture of 10% BF gas and 90% BOF gas, on a mass basis.32
31 https://assets.publishing.service.gov.uk/government/uploads/system/uploads/attachment_data/file/729412/Ch2.pdf 32 Pugh, D. (2013) Combustion Characterisation of Compositionally Dynamic Steelworks Gases. PhD thesis, Cardiff University
Ferro-alloy waste gas
Ferro-alloy is iron with a high percentage of other elements such as manganese, aluminium or silicon. There are a range of ferro-alloy production processes including electric arc furnaces and blast furnaces, not all of which produce waste gases. The only major ferro-alloy plant in the UK is a producer of ferro-titanium in Sheffield.33 Waste gases from ferro-titanium plants are not currently being considered as a feedstock for liquid fuel production. Therefore ferro-alloy gases are not included as one of the key waste categories within scope of this study.
33 http://www.femottram.com/ferro-titanium
3 Typical end-of-life fate of wastes In this section we review the typical EoL fate of each of the feedstocks defined above; what utility is associated with that EoL fate, and what that utility is replaced by when feedstock is diverted to transport fuel production.
3.1 Typical end-of-life fate of solid feedstocks
The focus on currently non-recyclable wastes of this study leads to a small selection of waste management routes and EoL fates, which can be summarised as follows:
• Landfill; • EfW power only (UK) -– classed as recovery or disposal operation depending on efficiency; • EfW with Combined Heat and Power (CHP) (UK) – classed as recovery operation; • EfW with CHP (exported) – classed as recovery operation;

Final Report
19
• Cement kiln (UK) • Cement kiln (exported)
For each feedstock, data has been gathered on the proportion of that feedstock undergoing each EoL fate, in England, Scotland, Wales and Northern Ireland. Then based on the total portion of waste arising in each of these nations, a weighted average EoL fate for the feedstock across the UK is calculated. This weighted average is summarised in Figure 9, and the full data is provided in Table 6 Appendix B . A variety of datasets have been used, with further details on sources and assumptions/transformations available in Appendix B. The total waste arising figure given in Table 6 corresponds to the fossil component of the waste stream only, which has been derived from total waste volumes based on the average waste composition in Appendix C. SW1 and SW2 represent the residual stream, as opposed to total waste, of local-authority-collected and C&I waste (LACW). Therefore, for example, the 93% of SW1 and SW2 waste going to landfill, in Scotland, does not suggest that 93% of LACW does to landfill, but rather 93% of the non-biogenic residual LACW stream does.
Figure 9 UK weighted average EoL fate for each solid feedstock
Landfill
There is no utility associated with landfill, so no replacement utility is modelled.
Fossil wastes typically take a long time to degrade in landfill, usually outside of GHG accounting timescales. Therefore, emissions linked to the degradation of fossil material in landfill are not usually accounted for (e.g. DEFRA, 2014).34
34 DEFRA (2014) Energy recovery for residual waste. A carbon based modelling approach, Available from: http://randd.defra.gov.uk/Document.aspx?Document=11918_WR1910Energyrecoveryforresidualwaste-Acarbonbasedmodellingapporach.pdf

Final Report
20
Schonfield (2008)35 estimates the GHG impacts from landfilling waste plastic at 154 kgCO2eq/tonne of waste. This includes the impacts from waste degradation in a landfill, as well as landfill maintenance and treatment of leachate from the plastic. These relatively small emissions are assumed to be avoided when waste is diverted from landfill.
35 Sconfield, P. (2008) LCA of Management Options for Mixed Waste Plastic, Available from: http://www.wrap.org.uk/sites/files/wrap/LCA%20of%20Management%20Options%20for%20Mixed%20Waste%20Plastics.pdf
EfW power only (UK)
Electricity is generated in power-only EfW plants. Therefore, when material is diverted from power-only EfW plants, that electricity must be produced in another way. For this study, this is assumed to be replaced by UK grid electricity, which has an estimated GHG intensity of 42.6 gCO2eq./MJ in 201936. However, there is substantial uncertainty around the appropriate GHG intensity for electricity and this is further investigated in a sensitivity analysis. Further details on the GHG intensity of grid electricity are given in Appendix E.
36 https://www.gov.uk/government/publications/valuation-of-energy-use-and-greenhouse-gas-emissions-for-appraisal
According to recent data,37 1 tonne of waste processed in a power-only EfW plant in the UK generates on average 588 kWh of electricity.38 Based on the average calorific value provided in that source, this corresponds to a net electrical efficiency of 21% (kWhelectricity/kWhwaste). This can vary substantially over time and between different plants. Sconfield (2008) assumed an average net efficiency of 23% for EfW plants in the UK but investigated a high-efficiency case of 30% and a low-efficiency case of 15%. Under the Waste Framework Directive, an energy efficiency standard, the R1 standard, was established in order to differentiate between EfW plants which are classified as ‘recovery’ under the waste hierarchy and those which classify as ‘disposal’.39 EfW plants must achieve the R1 efficiency standard, i.e. net efficiency of approximately 25.5%, to be classified as a ‘recovery’ operation.40,41 There are some drivers to achieve R1 standard in the UK, for example the standard must be achieved by a facility to issue packaging recovery notes (PRNs) and planning to comply with the R1 standard can facilitate obtaining planning permission.42However it is not a mandatory standard for incineration facilities. A typical value of 26% is used as a baseline in the model, but a sensitivity analysis is carried out on this figure.
37 Tolvik (2017) Available from: http://www.tolvik.com/wp-content/uploads/Tolvik-UK-EfW-Statistics-2017.pdf 38 This covers both power only and CHP EfW plants. Extracting heat generally reduces the electrical efficiency of the EfW plant (for every 5MW heat extracted electrical generation is reduced by 1MW: http://www.recyclingwasteworld.co.uk/in-depth-article/uk-challenges-of-efw-facilities/157645/); so it is likely that power-only EfW has a slightly higher efficiency than this, and CHP EfW has a lower electrical efficiency than this. 39 European Commission (2011) Guidelines on the interpretation of the R1 energy efficiency formula for incineration facilities dedicated to the processing of municipal solid waste according to Annex II of directive 2008/98/EC on waste, Available from: http://ec.europa.eu/environment/waste/framework/pdf/guidance.pdf 40 https://www.ciwm.co.uk/ciwm/knowledge/the-r1-energy-efficiency-formula.aspx 41 DEFRA (2014) Energy recovery for residual waste. A carbon based modelling approach, Available from: http://randd.defra.gov.uk/Document.aspx?Document=11918_WR1910Energyrecoveryforresidualwaste-Acarbonbasedmodellingapporach.pdf 42 https://www.mrw.co.uk/home/uk-efws-slow-to-adopt-r1-efficiency-standards/8687631.article

Final Report
21
The ETI estimate that currently the electrical efficiency of EfW plants, based on optimally-running conventional combustion technology, is between 25% and 30%. The ETI also explore the efficiency of gasification-based treatment methods for waste. They note that currently overall efficiency from prepared feedstock to net electricity output can reach 35%, and improved innovation may increase efficiency to 40%. 43 Therefore, as a sensitivity an EfW electrical efficiency of 40% is also explored.
43 ETI (2017) Targeting new and cleaner uses for wastes and biomass using gasification, Available from: https://d2umxnkyjne36n.cloudfront.net/insightReports/Targeting-new-and-cleaner-uses-for-wastes-and-biomass-using-gasification.pdf?mtime=20170623145223
EfW with CHP (UK)
In 2017 eight out of over forty EfW plants in the UK exported heat alongside power (CHP).44 Calculations from Tolvik (2018) suggest that in these CHP EfW plants, on average 13% of the energy contained in the feedstock is converted into useful heat.
45 https://www.bioenergy-news.com/display_news/13764/uks_new_chp_efficiency_requirements_will_be_a_challenge/
In 2018 the government introduced new efficiency requirements on CHP plants bidding into the CFD auctions in the UK.45 The minimum overall efficiency for CHP plants of any size increased to 70% (net calorific value basis, defined as the sum of a plant’s electrical and heat efficiencies).46 All plants are still required to deliver a minimum 10% heat efficiency and 10% primary energy saving. Based on information in the Renewable Energy Planning Database published when the new efficiency policy was introduced, the average electrical efficiency for new biomass CHP plants was 31% and the average heat efficiency was 10% (net calorific value).47
45 https://www.bioenergy-news.com/display_news/13764/uks_new_chp_efficiency_requirements_will_be_a_challenge/ 46 https://www.legislation.gov.uk/ukia/2018/118/pdfs/ukia_20180118_en.pdf 47 https://www.legislation.gov.uk/ukia/2018/118/pdfs/ukia_20180118_en.pdf
Extracting heat can reduce the electrical efficiency of the EfW plant. However, based on feedback from industry, this reduction in electrical efficiency is not statistically significant given the variation in efficiency between different EfW plants. Therefore in this study, for CHP EfW plants, the electrical efficiency is assumed to be 26% (same as the power-only EfW), and the heat efficiency is assumed to be 13%.
Electricity is assumed to be replaced by UK grid electricity, which has an estimated GHG intensity of 42.6 gCO2eq./MJ in 201948 (see section 4.1.4 for discussion of marginal and average emissions), and heat is assumed to be replaced by heat generated in a natural gas boiler (90% efficiency).
48 https://www.gov.uk/government/publications/valuation-of-energy-use-and-greenhouse-gas-emissions-for-appraisal
EfW with CHP (export)
Waste exported from the UK predominantly goes to countries in the North and West of Europe (Figure 10). Further, due to European regulations, all waste exported from the UK to EfW plants must go to R1 accredited facilities.49
49 https://www.mrw.co.uk/home/uk-efws-slow-to-adopt-r1-efficiency-standards/8687631.article
Final Report
22
Figure 10 Destination of waste exported from the UK in 2018, based on Environment Agency International shipment notices.
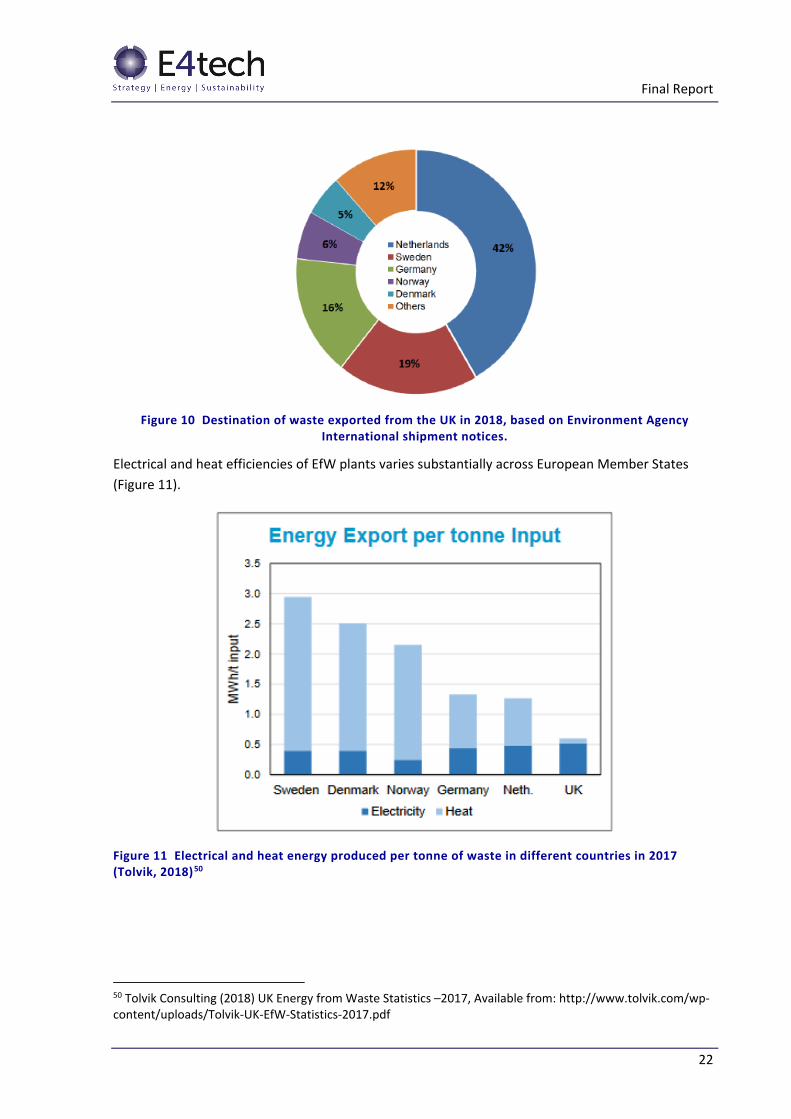
Electrical and heat efficiencies of EfW plants varies substantially across European Member States (Figure 11).
Figure 11 Electrical and heat energy produced per tonne of waste in different countries in 2017 (Tolvik, 2018)50
50 Tolvik Consulting (2018) UK Energy from Waste Statistics –2017, Available from: http://www.tolvik.com/wp-content/uploads/Tolvik-UK-EfW-Statistics-2017.pdf

Final Report
23
A weighted electrical and heat efficiency based on the each countries’ efficiency (Figure 11) and their respective share of UK waste (Figure 10) was calculated at 0.14 MWelec/MWfeedstock and 0.59 MWheat/MWfeedstock(Tolvik, 2018).51
51 The average LHV of MSW as given in Tolvik (2018) was used to convert from figures on a tonne basis to figures on an energy basis. Note this may slightly overestimate the efficiency of these facilities, as typically RDF has a slightly higher energy content than MSW on average. However, data on RDF LHV was not available from the source.
Electricity is assumed to be replaced by grid electricity in each country where the UK currently exports its waste. A weighted grid emissions intensity was calculated based on each country’s grid factor and their respective share of UK waste. Consistent data was only available for average, but not marginal, grid emissions for these countries. Heat is assumed to be replaced by heat generated from natural gas in 90% efficient boiler. However, while this assumption is appropriate for the UK, it is more uncertain for non-UK countries, where other fuels such as biomass and wastes may be the default fuels. Therefore, assuming a natural gas replacement is likely to be conservative.
It should be noted that all figures for efficiency of heat and power generation from waste given in this section, and used as baseline in this study, are derived from data on the conversion efficiency of mixed fossil and biogenic wastes. In addition, no differentiation is made between the efficiency with which the different solid wastes are converted to heat or power. This was not possible within the timeframe of the study.
Cement kiln (UK)
Traditionally, coal is the default fuel used in cement kilns, but a wide range of alternative fossil fuels and biomass fuels can also be used. These include waste plastic, mixed waste, SRF, tyres, waste oil and solvents, agricultural waste, waste animal products and other biomass. 52,53
52 https://www.ifc.org/wps/wcm/connect/bb652356-1d43-4421-b7eb-e0034d8d6b8f/Alternative+Fuels_06+27.pdf?MOD=AJPERES 53 Alternative Fuels (n.d.) http://www.alternativefuelsinc.co.uk/faqs.html
The current fuel mix in cement kilns in the UK is: 54
• Coal and petcoke = 54% • RDF = 20% • Tyres = 10% • Other biomass = 5% • Other waste = 8% • Liquid fuels and natural gas = 2%
54 Based on email correspondence with the Mineral Products Association, the trade association for the aggregates, asphalt, cement, concrete, dimension stone, lime, mortar and silica sand industries in the UK. Figures add to 99% due to rounding
Given the wide range of heat sources which can be used in cement kilns, the required replacement fuel when wastes are diverted to transport fuel production is likely to depend on a number of factors, including: relative cost of other fuels, existing fuel mix at the plant, availability of other fuels, and CO2 reduction targets. These will likely vary between different companies and plants. Contacts within the industry voiced concern over diverting SRF away from cement kilns. They suggested that if SRF/RDF were diverted away from cement manufacture, it would likely be replaced by coal, at least

Final Report
24
in the short to medium term. Replacing SRF with an alternative fuel would require investment in new storage and handling facilities and lines to feed the fuel into the kiln.
The replacement fuel for this study is assumed to be equivalent to the current fuel mix used in cement kilns in the UK. No GHG emissions are assigned to the RDF, tyres or ‘other waste’ which make up 38% of the current fuel mix. This may underestimate the emissions associated with diverting material from cement kilns if the replacement material (RDF, tyres, other wastes) themselves have indirect effects. The high uncertainty around the SRF replacement fuel in cement kilns is explored in a sensitivity analysis, exploring the range of results if the replacement fuel is 100% biomass or 100% coal.
Cement kiln (export)
Wastes, typically SRF, is used in many cement kilns in Europe and can be adapted to many different process types. For example, SRF is currently used in the main burner of Lepol55 and preheater kilns and in both the main burner and in the calciner in precalciner kilns. When used in the main burner of the kilns, SRF is usually burnt with coal, as it supports the SRF and maintains the flame shape. When used in the calciner, SRF can either be used on its own or in a blend with other alternative fuels.56 SRF is widely traded between countries in Europe, from countries with surplus material to countries with demand for these materials. All major international companies such as LafargeHolcim, CEMEX, Italcementi and Heidelberg use SRF at their European plants57. The fuel mix for EU cement kilns was only available for 2014 (Figure 12).
55 Type of cement kiln (https://www.cementkilns.co.uk/lepol_kilns.html) 56 http://www.alternativefuelsinc.co.uk/faqs.html 57 http://www.alternativefuelsinc.co.uk/faqs.html
Figure 12 Average thermal energy consumptions in cement kilns in 201458
58 https://cembureau.eu/media/1616/11602-ecofys-coprocessing-waste-cement-kilns-case-studies-20170511602.pptx
As with waste used in UK cement kilns, the replacement fuel when waste is diverted from non-UK cement kilns depends on a wide range of factors. Therefore for the purpose of this study, and in line with the method adopted for UK cement kilns, waste diverted from non-UK cement kilns is assumed

Final Report
25
to be replaced on an energy basis by the EU average fuel mix for cement kilns (Figure 12). ‘Alternative fossil fuels’ are assumed to be wastes and as noted above, no emissions are given to this portion of the replacement fuel.
3.2 Typical end-of-life fate of gaseous feedstocks
Refinery waste gas
As noted in section 2, only gases that are currently either combusted or flared in the refinery are within the scope of ‘refinery fuel gas’. In practice, it is not anticipated that, in the UK, gases which are currently flared could be practically and safely diverted towards liquid fuel production. Therefore, the counterfactual fate for all refinery fuel gas is assumed to be combustion for heat production in the refinery. Its replacement is likely to be either natural gas or fuel oil. Natural gas has lower GHG emissions (65gCO2eq./MJ) compared to fuel oil (94gCO2eq./MJ). Industry representatives suggested that, in the UK, natural gas is increasingly used instead of fuel oil. This is further supported by the price of natural gas in the UK, which is substantially cheaper than fuel oil or gas oil per kWh.59 Contacts within the refinery industry and CONCAWE also suggested that natural gas would most likely be used to make up the shortfall if refinery fuel gas were diverted to transport fuel production. Therefore, a default replacement by 100% natural gas is assumed. Nevertheless, there is substantial uncertainty over the composition of the ‘replacement fuel’ in practice, i.e. the relative share between natural gas and fuel oil. This will also likely be impacted by changes to the relative price of these heating fuels and specific refinery circumstances.
59 Average natural gas price for large industrial consumers including tax from 2017 to the middle of 2018 was 1.69 p/kWh (BEIS Industrial gas prices in the EU for small, medium and large consumers, published 25/10/2018, Available from: https://www.gov.uk/government/statistical-data-sets/international-industrial-energy-prices); compared to average price of heavy fuel oil sold to large consumers of 3.38 p/kWh and average price of gas oil sold to large consumers of 4.54 p/kWh (Prices of fuels purchased by manufacturing industry in Great Britain (p/kWh), published 20/12/2018, Available from: https://www.gov.uk/government/statistical-data-sets/prices-of-fuels-purchased-by-manufacturing-industry. Averages are taken as average of 2017 and Q1 and Q2 2018)
Steel mill waste gas
In 2017, UK integrated steelworks generated 9,756 GWh of blast furnace (BF) and basic oxygen furnace (BOF) gases (down from 14,131 GWh in 2015). Of this, 52% of the gases were used for electricity generation, 35% for heat generation in coke ovens and blast furnaces, 11% lost/flared and 2% for ‘other’ purposes in the iron and steel industry. 60
60 DUKES (2018) Chapter 2, Available from: https://assets.publishing.service.gov.uk/government/uploads/system/uploads/attachment_data/file/729412/Ch2.pdf
Electricity generation is assumed to be replaced by UK grid electricity (see section 4 for discussion of the grid electricity emission factor used in the model). Electricity generation from BOF/BF gas is assumed to have a 26% net electrical efficiency, based on an 80% gas-fired boiler efficiency and a typical steam turbine efficiency of 33%61. More modern technology may be able to reach higher electrical efficiencies.
61 http://www.iea-etsap.org/web/e-techds/pdf/i01-ind_boilers-gs-ad-gct1.pdf

Final Report
26
BOF/BF gas used for heat generation in the coke ovens and blast furnaces and ‘other’ uses in the iron and steel industry is assumed to be replaced directly by natural gas.
The steel mill waste gas recorded as lost / flared is assumed to be flared, generating no useful products.
3.3 Potential future changes to end-of-life fates and waste compositions
As waste is a devolved policy matter in the UK, each of the constituent nations have implemented their own distinct waste policy frameworks and waste strategies with regional targets and implementation plans. This section outlines different policies in each nation and some potential impacts on both the quantities and EoL fates of wastes.
In addition, the increasing number of UK EfW facilities and additional availability of EfW capacity is likely to reduce the amount of landfilled waste, reduce the amount of RDF produced for export, and increase the amount of processed residual waste in the UK.
3.3.1 England
The Resources and Waste Strategy (RWS) (2018) 62 sets out how England will preserve material resources by minimising waste, promoting resource efficiency and moving towards a circular economy. It’s five strategic ambitions include:
1. Doubling resource productivity by 2050 2. Eliminating avoidable waste of all kinds by 2050 3. Eliminating avoidable plastic waste over the lifetime of the 25 Year Environment Plan 4. Aiming to eliminate food waste to landfill by 2030 5. Aiming to have all plastic packaging on the market be recyclable, reusable or compostable by
2025.
62 https://assets.publishing.service.gov.uk/government/uploads/system/uploads/attachment_data/file/765914/resources-waste-strategy-dec-2018.pdf
There are specific targets within these ambitions such as a 50% recycling rate for household waste by 2020 and 75% recycling rate for packaging by 2030. Further, there are targets to, by 2035, increase the MSW (including household waste) recycling rate to 65% and reduce the municipal waste to landfill to 10% or less, aligning with the targets set in EU Regulations and Directives derived from the EU Circular Economy Package (CEP).
The impact of the RWS targets to increase recycling and recovery and the particular focus on plastics and packaging may change the composition and fossil content of residual waste in the future. Ambitions 3 and 5 may result in a lower proportion of plastic in the residual waste stream. The correspondingly higher proportion of non-carbon based materials (e.g. metals and glass) may make processing the residual waste into fuel more challenging. Given that targets are implemented in the RWS to reduce both biogenic and non-biogenic waste, it is difficult to anticipate how the relative proportions of fossil and biogenic material in the residual waste stream might evolve. Nevertheless,

Final Report
27
ambition 4 to eliminate food waste to landfill may prompt more segregated food waste collections, which could make sourcing only the biogenic fraction of waste for transport fuel production easier.
Furthermore, increasing recycling rates are likely to decrease the overall quantity of residual waste going to recovery and disposal depending on the future growth in waste, which has not been accounted for in this study.
3.3.2 Scotland
By 2025, Scotland aims to63:
reduce total waste arising in Scotland by 15% against 2011 levels reduce food waste by 33% against 2013 levels recycle 70% of remaining waste send no more than 5% of remaining waste to landfill
63 https://www.gov.scot/policies/managing-waste/
Again, these future targets are likely to impact the residual waste composition and the EoL fates of relevant waste streams. As Scotland currently sends a large proportion of non-recyclable plastic, residual local-authority collected waste and residual C&I waste to landfill (Table 6), the target to send no more than 5% of remaining waste to landfill may result in greater waste availability for recovery options such as transport fuel production.
Scotland also has a Biodegradable Municipal Waste (BMW- biogenic component of the residual waste collected by Local Authorities) landfill ban which comes into effect from the 1 January 2021. This is expected to reduce the amount of biogenic residual waste going to landfill, impacting both biogenic waste collected as a separate stream, and mixed waste containing biogenic material. This could lead to diversion of waste to landfills in England, increasing RDF/SRF exports until additional UK EfW capacity becomes available, and increasing the pre-treatment of residual waste through interim facilities. There is already legislation in place in Scotland to promote separate food waste collections.
In addition, the thermal treatment of waste guidelines 201464set out SEPA’s approach to permitting thermal treatment of waste facilities in Scotland. To obtain planning and environmental permits, it requires residual waste to be pre-treated (if exemptions cannot be obtained for individual Local Authorities) and EfW facilities to have high energy efficiency ratings, including submitting plans for recovery of heat from CHP generation.
64 Natural Scotland and SEPA (2014) Thermal treatment of waste guidelines 2014, Available from: https://www.sepa.org.uk/media/28983/thermal-treatment-of-waste-guidelines_2014.pdf
3.3.3 Wales
‘Towards Zero Waste’ is the overarching waste strategy document for Wales. Its sets out threshold targets, including a 10% maximum for municipal waste to landfill by 2019/20, which is further reduced to just 5% by 2024/25. These two targets have also been set for C&I and C&D waste. Further, the minimum target levels for reuse, recycling, and composting are 70% by 2025 for municipal waste, with a further potential target of 80% by 2035. In 2017, Wales had reportedly already achieved 64% reuse, recycling and composting of municipal waste65.
65 https://resource.co/article/reuse-next-step-welsh-zero-waste-strategy-12745

Final Report
28
Wales is aiming to limit EfW, by 2025, to 30% of municipal waste from individual Local Authorities (not including recycled bottom and fly ash from the plants). Given this specific policy goal around limiting EfW, it should be carefully considered whether incentivising transport fuel production from waste, which is also a ‘recovery’ option, could contradict the Welsh waste policy aims. The combination of a restricted landfill disposal, high recycling rates and EfW thresholds is expected to reduce the percentage of residual waste going to disposal and recovery. However, the absolute volume will depend on future waste growth and the success of waste reduction and product re-use measures. This is especially the case when looking forward to 2050, when Wales aims to achieve ‘zero waste’, defined as all waste being reused or recycled with no waste being directly sent to landfill or incineration. Additionally, other actions mentioned in the strategy include making packaging more recyclable, further reducing landfilled biodegradable waste and prioritising material recycling. These all can impact the composition of future waste streams, potentially reducing the quantity of fossil content in the residual waste stream generated in Wales.
3.3.4 Northern Ireland
The first waste management strategy for Northern Ireland was published in 2000 and was revised in 2006 and in 2013. The latest version ‘Delivering Resource Efficiency- Northern Ireland Waste Management Strategy66’ covers relevant aspects required by the EU Directive, as well as a waste policy framework for Northern Ireland. Key targets from this document include a 60% recycling rate (including preparing for re-use) of LACMW by 2020, in line with the EU Waste Framework Directive. A higher recycling rate than currently being achieved will likely reduce the amount of residual waste sent for recovery or landfill.
66 https://www.daera-ni.gov.uk/sites/default/files/publications/doe/waste-policy-delivering-resource-efficiency-northern-ireland-waste-management-strategy-2013.pdf
4 GHG impacts of end-of-life fates
4.1 Methodology
4.1.1 Overview
In previous work,67 a methodology was developed to calculate the GHG impact of diverting waste fossil feedstocks from an existing use to liquid transport fuel production, illustrated in Figure 13. Using this method, the feedstock is given a credit for the emissions which no longer occur when it is diverted from an existing EoL fate, hence the term ‘emissions from previous fate’ in Figure 13 is negative. For example if a material is diverted from an energy-from-waste (EfW) plant to produce transport fuel then the combustion of that feedstock is avoided. The feedstock is also attributed GHG emissions associated with replacing any useful products that were previously produced from that waste, shown by the term ‘emissions from replacing utility generated in previous fate’ in Figure 13. For example in the case that waste is diverted from power production in an EfW plant, this term corresponds to the GHG emissions from providing that electricity by an alternative means. These feedstock emissions (together termed ‘feedstock counterfactual emissions’) are added to the direct fuel emissions to calculate the total WTW GHG emissions from the transport fuel.
67 E4tech (2018) Low carbon fossil fuels sustainability risks and accounting methodology, Available from: http://www.e4tech.com/wp-content/uploads/2018/02/LCFF_Sustainability-FinalReport.pdf

Final Report
29
Figure 13 Diagram illustrating breakdown of WTW GHG emissions of a transport fuel made from fossil wastes
The feedstock emissions are specific to the previous EoL fate of a given feedstock. However, for each feedstock there may be a number of possible EoL fates that it could currently undergo. Therefore, in this study, the feedstock emissions of each waste identified in section 2 are calculated for each of the EoL fates. The average feedstock emissions are then calculated for each feedstock based on the average EoL fate which that feedstock undergoes in the UK.
4.1.2 Limitations of this method
Taking the weighted average of all possible EoL fates for a given feedstock in the UK provides an average impact of using that feedstock in the UK for transport fuel production. However, this may not be the most appropriate way to assess an individual supplier’s feedstock, for which the existing EoL fate might be quite different to the average given here. In particular, if fuel producers are using wastes from an individual ‘point source’ or from a limited number of suppliers, they may know precisely the previous use(s) of their waste.
The current study only considers the non-biogenic fraction of the wastes, as the biogenic fraction is already considered under the RTFO, where a different methodology is used that does not include counterfactual emissions (i.e. the biogenic fraction of the waste is assumed to have zero emissions at the point of collection). However, several of the feedstocks assessed in this study are produced as a mixed fossil/biogenic waste stream (Table 3).
The method used in this study does not reflect how EoL fates of wastes might change over time, or how the way in which the utility generated by these wastes is replaced might change over time. The expected decarbonisation of UK grid electricity is investigated in section 4.2.7.
4.1.3 Calculation of emissions from previous fate
The previous EoL fate of all wastes within scope of this study was either landfill or combustion.
For materials going to landfill, no emissions from the degradation of the fossil portion of the waste in landfill are assumed, as discussed in section 3, and emissions from operation of the landfill itself are taken as 159kgCO2eq/tonne waste.68 This reflects a landfill with a base seal, landfill gas and leachate collection systems and treatment of leachate in a municipal wastewater treatment plant.
68 Schonfield, P (2008) LCA of management options for mixed waste plastics, for Wrap, ISBN: 1-84405-397-0, available from: http://bit.ly/2vRjb3D
For combusted materials, combustion emissions are calculated from the average carbon content in the feedstock, which is derived from its typical waste composition (Appendix C), assuming complete

Final Report
30
combustion to CO2. The exception to this is refinery gas, where a typical figure from BEIS (2018)69 for the combustion emissions from other petroleum gas is used. The figures used in the GHG calculation are provided in Appendix D.
69 BEIS (2018) full set of conversion factors: https://www.gov.uk/government/publications/greenhouse-gas-reporting-conversion-factors-2018
4.1.4 Calculation of emissions from replacing utility generated in previous fate
In order to calculate emissions from replacing the previous utility provided by a feedstock, three aspects must be defined:
1. What is the previous utility gained from that EoL fate? E.g. none, electricity, heat etc.
2. What would that utility be replaced by? E.g. grid electricity, coal burned in furnace
3. What are the GHG emissions associated with that alternative way of providing the same utility?
Previous utility gained from that EoL fate?
The EoL fates considered in this report either generate: heat only (cement kilns and industrial uses), power only (EfW power only), heat and power (EfW CHP), or no utility (landfill and gas flaring). The heat and power efficiencies (0% if none are produced) for each waste and its existing EoL fates are given in Appendix D.
What would that utility be replaced by?
There is substantial uncertainty around what a given utility would be replaced by if the waste feedstock is diverted to transport fuel production. This is discussed in more detail in section 3 for each EoL fate considered. Default assumptions are provided in the model, but these can be modified.
GHG emissions associated with providing the same utility?
Where possible, published emission factors have been used to represent the fuel that is used instead of the waste feedstock, when it has been diverted to produce transport fuels. In the model it is possible to choose average or marginal grid electricity emission factors for the UK for 2019, and more discussion of these is given in Appendix E.
4.1.5 Estimation of GHG emissions from final fuel
The purpose of this study was not to assess the GHG emissions from fuel, but only from the feedstocks used to make those fuels. Nevertheless, it is useful to estimate the fuel emissions which could result from these feedstocks, for comparison with other transport fuels. Several assumptions were required in order to make this estimation. The conversion efficiency for all feedstocks is assumed to be 0.6 MJfuel/MJfeedstock, which is within the range of conversion parameters seen in Benavides (2017).70 The processing emissions are assumed to be 15 gCO2eq./MJfuel based on typical waste to fuel processes. All the carbon in the feedstock is assumed to enter the fuel and hence is
70 Benavides, P.T., Sun, P., Han, J., Dunn, J.B., Wang, M. (2017) Life-cycle analysis of fuels from post-use non-recycled plastics, Fuel, 203, 11-22 . This paper was used as the basis for updates made to GREET in 2017 to introduce the plastics-to-fuel pathway.

Final Report
31
released when the fuel is combusted. Therefore, the combustion emissions from fuel use are calculated as combustion emissions of feedstock divided by process efficiency. This method for calculating combustion emissions is a simplification, as some of the carbon in the feedstock may not end-up in the final transport fuel, if it is emitted during the production process or is converted into by-products. In this study no by-products from the fuel production process are assumed, for the sake of simplification. We note that actual fuel chains could differ substantially from these assumptions.
4.2 Results
In this section the results are presented in graphical form and further discussed. To avoid repetition and a lengthy document, detailed results for some of the feedstocks are given within this report, and full results were provided to DfT in an Excel spreadsheet. The results are presented in the following format:
• Feedstock counterfactual emissions o For one feedstock (SW1), over all its possible EoL fates o For all feedstocks, weighted average of EoL fates
• Estimated fuel GHG emissions o For one solid feedstock (SW1), over all its possible EoL fates o For one gaseous feedstock (GW1), over all its possible EoL fates o For all feedstocks, weighted average of EoL fates
4.2.1 Feedstock counterfactual emissions for SW1 across different EoL fates
The feedstock counterfactual emissions for Solid Waste 1 (SW1) are represented in Figure 14 as yellow dots. These are shown as the sum of the avoided emissions from the original EoL fate (which are negative, as they are avoided) and the emissions from replacing heat/power previously produced from the feedstock. For example, in the case of EfW generating power only, the avoided emissions are those from the combustion of the waste, and the emissions from replacing the utility are those from replacing the electricity, which would have been generated, by grid electricity. Figure 14 illustrates that feedstock counterfactual emissions are lowest when: (a) the feedstock would have been combusted anyway; (b) it would have been used inefficiently; and (c) the heat / power with which it is replaced is low-carbon.

Final Report
32
Figure 14 Feedstock counterfactual emissions from SW1 across all end-of-life fates
4.2.2 Feedstock counterfactual emissions for all feedstocks
A feedstock counterfactual emissions factor was calculated for each of the feedstocks, as a weighted average across all EoL fates (Figure 15). The variation in the results seen across the different feedstocks is due to several factors, including: the different heating values of waste types, the different carbon contents (and hence combustion emissions) of the waste types, and the different EoL fates of the waste types. SW1 (LA waste) and SW2 (C&I waste) have the same carbon content and heating value, but SW1 has a higher probability of going to EfW whilst SW2 has higher probability of going to landfill. Therefore, feedstock counterfactual emissions for SW2 are higher. SW3 (SRF) has slightly higher carbon content than SW1 and SW2 (therefore larger avoided CO2 emissions from combustion) but also almost 100% of it goes to cement kilns, which means there is a large positive GHG impact from replacing that fuel in the cement kiln. A substantial proportion of SW5 also goes to cement kilns. For both SW4 and SW7, most of the feedstock goes to landfill, and, therefore feedstock counterfactual emissions are higher than for other feedstocks.
For the gaseous wastes, there are large negative emissions associated with diverting GW1 from its existing fate. This is because there is a large amount of inert CO2 within the BOF/BF gas which is considered as an avoided emission hence giving a large negative result for feedstock GHG intensity. This CO2 would be released during fuel production or combustion so would contribute an equally large positive GHG emission to the overall fuel GHG intensity.

Final Report
33
Figure 15 Feedstock counterfactual emissions for all feedstocks
Figure 16 Estimated fuel GHG emissions for fuel produced from SW1 across all end-of-life fates
4.2.3 Estimated fuel GHG emissions for SW1 across different EoL fates
An estimation of the fuel GHG emissions, including combustion, is provided based on the assumptions stated in section 4.1.5. As this was not a focus of this study, these are intended to give DfT an indication only of final fuel GHG emissions. Estimated fuel GHG emissions are given for SW1 and GW1 to illustrate the impact of the different EoL fates. Finally, in section 4.2.5 the estimated fuel GHG emissions for all feedstocks are given.
The feedstock emissions are equivalent to those given in Figure 14, but expressed on a gCO2eq./MJfuel
basis, assuming conversion efficiency of 0.6 MJfuel/MJfeedstock. The process emissions are assumed to be the same for all feedstocks, and the combustion emissions are calculated from the carbon content of the feedstock as described in section 4.1.5. Figure 16 illustrates that there is substantial variation in the fuel GHG intensity, depending on the EoL fate that the feedstock is diverted from. Fuels produced from waste which are diverted from energy from waste can have a GHG intensity lower than fossil fuel comparator, illustrating that making feedstock into transport fuel in these cases reduces GHG emissions.

Final Report
34
4.2.4 Estimated fuel GHG emissions for GW1 across different EoL fates
Estimated fuel GHG emissions, including combustion, for GW1 across the different possible EoL fates are given in Figure 17. This illustrates that, as for SW1 (section 4.2.3), the fuel has lower GHG emissions than the fossil comparator when the BOF/BF gas would have been used to generate electricity. The lowest emissions are achieved when the gaseous waste would previously have been burned with no energy recovery. As for SW1, there is substantial variations in the fuel GHG intensity depending on the EoL fate from which the feedstock is diverted.
Figure 17 Estimated fuel GHG emissions for fuel produced from GW1 across all end-of-life fates
Figure 18 Estimated fuel GHG emissions across all feedstocks
4.2.5 Estimated fuel GHG emissions for all feedstocks
Estimated fuel GHG emissions, including combustion, for all waste feedstocks are given in Figure 18, comprised of a weighted average of all EoL fates. Figure 18 suggests that on average, for most of the feedstocks considered, diversion of the feedstock from its existing use to the transport sector does not save GHG emissions. SW1 and GW1 have lower fuel GHG emissions than the other feedstocks because a greater share of SW1 and GW1 feedstocks are currently used in EfW plants.

Final Report
35
4.2.6 Sensitivity – replacement fuel in cement kilns
For feedstock currently used in cement kilns, there are high GHG emissions associated with using it for transport fuel, as the replacement fuel is assumed to be predominantly fossil in nature (for UK cement kilns 55% coal and 2% natural gas and for non-UK cement kilns 59% coal). However, there is significant uncertainty around the exact composition of the replacement fuel, if waste feedstocks are diverted away from cement kilns. Therefore, the sensitivity analysis reflects both a best-case situation, where the waste is replaced with biomass (which has low GHG emissions associated with it – 6 gCO2eq./MJ – reflecting only the impact of residue collection, transport and pelletisation71), and a worse-case scenario, where the waste is replaced with coal (110gCO2eq./MJ).
Figure 19 Estimated fuel GHG emissions when feedstock is SW1 and it is diverted from combustion in cement kilns showing range of fuel GHG emissions when replacement fuel is either 100% coal or 100%
biomass
71 JRC (2014) Solid and gaseous bioenergy pathways: input values and GHG emissions. Available from: https://ec.europa.eu/energy/sites/ener/files/2014_jrc_biomass_report.pdf
Figure 19 illustrates that if the replacement fuel is 100% biomass, then the transport fuel produced from the diverted waste can generate GHG savings compared to the fossil fuel comparator. However, if the replacement fuel is 100% coal, then the transport fuel does not produce GHG savings and is substantially worse than the fossil fuel comparator. Therefore, if transport fuel is produced from waste feedstocks diverted from cement kilns, there is a risk that GHG emissions could increase, depending on the replacement fuel used.
4.2.7 Sensitivity – feedstock diverted from energy from waste
Figure 16 illustrates that a fuel produced from waste feedstocks diverted from UK EfW plants can reduce GHG emissions, when compared to the fossil fuel comparator. However, there is uncertainty over both the GHG intensity of the replacement electricity and the EfW plant’s efficiency in converting waste to power. Therefore, these factors are both investigated in more detail to understand whether this uncertainty can have a significant impact on the GHG emissions of the resulting fuel.

Final Report
36
The estimated 2019 GHG emission factors for average and marginal grid electricity provided in the Green Book72 vary substantially (42.6 gCO2eq./MJ and 89.7 gCO2eq./MJ respectively). By 2030, the average and marginal grid emissions intensities decrease, as does the gap between the two (24.3 gCO2eq./MJ and 37.8 gCO2eq./MJ respectively). Figure 20 illustrates the estimated GHG impacts for a fuel made from SW1, where the waste is diverted from an EfW (power only) plant in the UK and the replacement electricity has either the 2019 or (anticipated) 2030 GHG intensity. The error bars represent the average and the marginal grid electricity emissions factors (see Appendix E for further discussion on the source of this data) and the central point reflects the average of these two GHG intensities.73 Figure 20 illustrates that as the UK grid is anticipated to decarbonise between 2019 and 2030, use of waste for fuels production instead of electricity production becomes increasingly attractive from a GHG point of view. It also illustrates that even if marginal grid emissions factors are used, the fuel can generate GHG savings compared to the fossil fuel comparator.
72 See Appendix E for further discussion of data sources for electricity emission factors 73 Note the central point does not reflect the baseline results from section 4.2.1 to 4.2.5, which uses the 2019 average electricity GHG intensity – i.e. the lower end of this sensitivity result.
Figure 20 Estimated GHG intensity of fuel made from SW1 when it is diverted from EfW (power only, UK), using either 2019 or 2030 grid electricity as replacement.74
74 Note model uses average 2019 emissions factor as default, and graphs given elsewhere in this paper use average 2019 GHG emissions factor to reflect replacement electricity in EfW UK EoL scenario.
Finally, the impact of diverting waste from a higher or lower efficiency EfW (power only) plant was investigated. Figure 21 demonstrates the range of fuel GHG emissions when the EfW efficiency is varied between 20% and 40% and an SW1 feedstock is used. The yellow dot on the graph represents the fuel emissions when the counterfactual is electricity produced at an EfW plant with an efficiency of 26%, the baseline figure used in this study. This sensitivity shows that even if waste is diverted from 40% efficient EfW plant – representing a plant using state of the art advanced thermal conversion technology – the resulting transportation fuel can still generate GHG savings.

Final Report
37
Figure 21 Estimated GHG intensity of fuel made from SW1 when it is diverted from EfW (power only), based on electricity with 2019 average grid GHG intensity replacing electricity that was generated
from the waste at between 40% and 20% efficiency.
4.2.8 Sensitivity – Conversion efficiency of fuel into feedstock
In this study, a 60% feedstock-to-fuel conversion efficiency (LHV basis) is assumed. However, this could vary substantially. Therefore, a sensitivity analysis was completed to illustrate the GHG impact of varying this conversion efficiency. Figure 22 illustrates the GHG impact for a fuel produced from SW1 (with a counterfactual EoL fate of EfW power-only) with a feedstock-to-fuel conversion efficiency of 20% and 70%. A process with a significantly lower conversion efficiency results in higher fuel GHG emissions, compared to a process with a higher conversion efficiency. For the specific case modelled in Figure 22, the fuel produced, even in a plant with a 20% feedstock-to-fuel conversion efficiency, has a lower GHG impact than the fossil fuel comparator. However for other feedstock and EoL fate combinations, a lower conversion efficiency from feedstock to fuel may result in fuel produced from that feedstock having GHG emissions above the FF comparator.
Figure 22 Estimated GHG intensity of fuel made from SW1 when it is diverted from EfW (power only), showing range of results if conversion efficiency of feedstock into fuel varies from 20% to 70%

Final Report
38
5 Conclusions and limitations of results This study has calculated, using the methodology outlined in section 4.1, the GHG emissions when a feedstock is diverted from an existing EoL fate to transport fuel production. Emissions from fossil feedstocks diverted from an existing use to transport fuel production are lowest when:
a) The feedstock would have been combusted anyway b) The feedstock did not produce any useful heat or power in previous EoL fate, or it produced
heat/power at low efficiency c) The heat/power which was previously generated from the feedstock is replaced with a low-
carbon source of heat/power
There is substantial variation in the feedstock GHG emissions across the different EoL fates. Therefore, for those feedstocks which could have several different EoL fates (SW1, SW2, SW5, SW6, GW1), counterfactual emissions could vary substantially from the average, depending on which EoL fate that feedstock is diverted from. On the other hand, for feedstocks with only one predominant EoL fate (SW3, SW4, SW7 and GW2), the variation in GHG emissions is smaller.
The GHG intensity of fuels made from waste fossil feedstocks has been estimated. These estimations are subject to a high degree of uncertainty given the range of processes that can be used to turn waste fossil feedstocks into fuel. Nevertheless, calculations indicate that fuels made from some waste fossil feedstocks could save GHG emissions compared to the fossil fuel counterfactual, particularly feedstocks diverted from UK EfW plants. The most accurate results are obtained when the assessment is done on a case by case basis due to the high level of uncertainty and variation in feedstock composition, plant efficiency and alternative EoL use of feedstocks when using a weighted average approach.
This study has not focussed on the policy context for low-carbon fossil fuels, but nevertheless this will be important to consider going forwards, particularly in the case of mixed fossil/biogenic waste and waste diverted from landfill. Due to the existing treatment of biogenic waste under the RTFO, this study considers non-biogenic waste in isolation. However, several of the feedstocks assessed in this study are produced as a mixed fossil/biogenic waste stream (Table 3). Therefore, the impact of any policy concerning fossil wastes on the corresponding biogenic portion of that waste should also be considered. For example, incentivising fuels made from biogenic wastes more than those made from fossil wastes would likely encourage greater separation of the biogenic portion of the waste, which could increase costs.
It is important that any policy developed by DfT around low-carbon fossil fuels is aligned with existing waste policy so it does not create contradictory incentives, and remains aligned as waste management policy develops over time. For example, fuels derived from feedstocks which have been diverted from landfill have relatively high GHG emissions, but wider government policy is aiming to reduce the amount of waste going to landfill, illustrating the potential for contradictory policies.
There are several important limitations of these results which should be noted, including the uncertainty around a number of key assumptions used. In particular, when considering the power/heat which would be used to replace the fossil feedstock when it is diverted from its existing EoL fate, an average GHG intensity has been used. However an individual plant could replace the utility provided by the fossil feedstock with power/heat which has a GHG intensity quite different to

Final Report
39
the average. For example waste fossil feedstock diverted from a cement kiln is assumed to be replaced with the average fuel mix used in cement kilns today, but an individual operator could use 100% coal, which has a GHG intensity 80% higher than the average fuel mix, or waste biomass, which has a GHG intensity 90% lower than the average fuel mix.
Further, this study does not assess the impact of how these counterfactual feedstock emissions may change over time. The average EoL fate of each feedstock is calculated in this study using data that is typically at least a year old, and this distribution of EoL fates across the different feedstocks may change in the future, for example as the 2018 Waste and Resources Strategy75 is implemented. In addition, the GHG intensity of replacing the utility generated by that waste feedstock might also change, for example as electricity grids generally decarbonise. Finally, the conversion of feedstocks into fuel has not been considered in detail in this study, and therefore the fuel GHG emissions presented reflect one set of assumptions only, and there may be substantial variation possible amongst the different conversion processes for turning waste into fuel.
75 DEFRA (2018) Our waste, our resources: a strategy for England, Available from: https://assets.publishing.service.gov.uk/government/uploads/system/uploads/attachment_data/file/765914/resources-waste-strategy-dec-2018.pdf

Final Report
40
Appendix A – Detailed information on the definition of each solid waste stream Table 4: Solid waste streams
Waste stream EWC code EWC description EWC sub-description Notes Certainty of volumes / composition
SW1: Non-biogenic fractions of residual mixed waste (black bag/bin waste) derived from households (and some businesses) via Local Authority collections (carried out by the Local Authority and private third-party contractors).
20 03 01 (sub-set of)
Municipal wastes (household waste and similar commercial, industrial and institutional wastes)
Mixed municipal waste
Wastes with this code includes both:
• Mixed residual waste (i.e. non-recycled); and
• Dry mixed recyclables (DMR) which have been separated for recycling but require further separation.
The first group is the waste type of interest, and that which specifically goes directly to EfW and landfill. The latter group of waste will predominantly be made of paper/card, glass, plastics and metals. The waste of interest will also contain food and other organic waste, and other materials not collected for recycling (e.g. for some example compositions see Appendix C).
Local authorities are required to report waste data quarterly, therefore data reliability is considered good.
Compositional studies have also been carried out relatively regularly on LACW residual waste, although some UK nations have undertaken these more recently, and in more detail, than others. Therefore a range of likely fossil content of this waste has been used.
SW2: Non-biogenic fractions of residual
20 03 01 (sub-set of)
Municipal wastes (household waste and
Mixed municipal waste
Wastes with this code includes both:
Data on commercial and industrial wastes tend to be generated through

Final Report
41
Waste stream EWC code EWC description EWC sub-description Notes Certainty of volumes / composition mixed waste derived from commercial & industrial premises collected via private contractors.
similar commercial, industrial and institutional wastes)
• Mixed residual waste (i.e. non-recycled); and
• Mixed recyclables which have been separated for recycling but require further separation.
The first group is the waste type of interest, and that which specifically goes directly to EfW and landfill. The latter group of waste will predominantly be made of paper/card, glass, plastics and metals. The waste of interest will also contain food and other organic waste, and other materials not collected for recycling (e.g. for some example compositions see Appendix C).
surveys which are costly to undertake and therefore are not done very frequently. Therefore data relating to this waste stream has to be derived from Waste Data Interrogator and there is limited compositional data available.
However, the definition of municipal wastes includes commercial waste which is of a similar composition to household, and as such, some LACW composition has been used where compositional data is not available. A range of likely fossil content of this waste has been used.
SW3: Non-biogenic fractions of solid recovered fuels (SRF), which are meeting the required CEN or customer specifications of the
19 12 10 Waste from waste management facilities, from the mechanical treatment of waste (e.g. sorting, crushing, compacting, pelletising)
Combustible waste (refuse derived fuel)
There is no separate EWC code for a solid recovered fuel (SRF), in comparison to an RDF. SRF are usually of a much higher calorific value than RDF (e.g. > 20 MJ/kg) and has undergone
It is assumed that solid waste reported as being used for co-incineration (e.g. cement kilns) has been processed to an SRF specification. However, these can vary, and as such may have different compositions. A Shanks specification
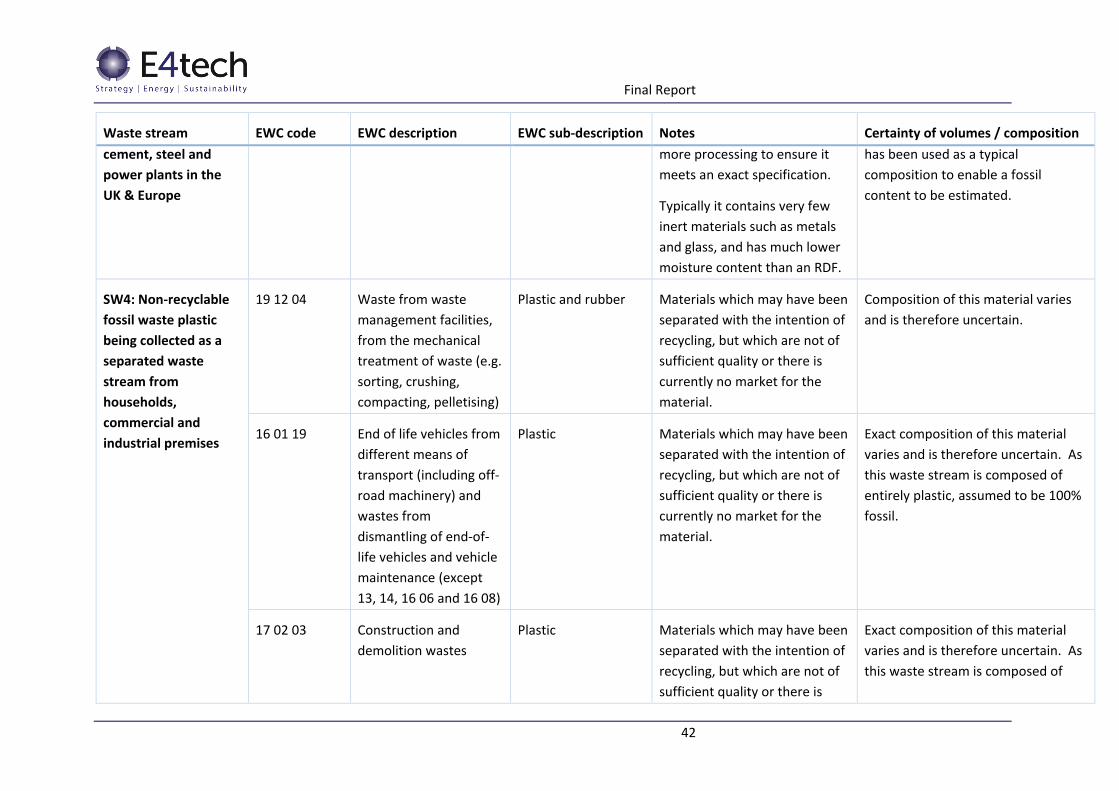
Final Report
42
Waste stream EWC code EWC description EWC sub-description Notes Certainty of volumes / composition cement, steel and power plants in the UK & Europe
more processing to ensure it meets an exact specification.
Typically it contains very few inert materials such as metals and glass, and has much lower moisture content than an RDF.
has been used as a typical composition to enable a fossil content to be estimated.
SW4: Non-recyclable fossil waste plastic being collected as a separated waste stream from households, commercial and industrial premises
19 12 04 Waste from waste management facilities, from the mechanical treatment of waste (e.g. sorting, crushing, compacting, pelletising)
Plastic and rubber Materials which may have been separated with the intention of recycling, but which are not of sufficient quality or there is currently no market for the material.
Composition of this material varies and is therefore uncertain.
16 01 19 End of life vehicles from different means of transport (including off-road machinery) and wastes from dismantling of end-of-life vehicles and vehicle maintenance (except 13, 14, 16 06 and 16 08)
Plastic Materials which may have been separated with the intention of recycling, but which are not of sufficient quality or there is currently no market for the material.
Exact composition of this material varies and is therefore uncertain. As this waste stream is composed of entirely plastic, assumed to be 100% fossil.
17 02 03 Construction and demolition wastes
Plastic Materials which may have been separated with the intention of recycling, but which are not of sufficient quality or there is
Exact composition of this material varies and is therefore uncertain. As this waste stream is composed of

Final Report
43
Waste stream EWC code EWC description EWC sub-description Notes Certainty of volumes / composition currently no market for the material.
entirely plastic, assumed to be 100% fossil.
SW5: Non-recyclable fossil waste rubber being collected from commercial premises
19 12 04 Waste from waste management facilities, from the mechanical treatment of waste (e.g. sorting, crushing, compacting, pelletising)
Plastic and rubber Materials which may have been separated with perhaps the intention of recycling, however is not of sufficient quality or there is currently no market for the material.
Composition of this material varies and is therefore uncertain.
16 01 03 End of life vehicles from different means of transport (including off-road machinery) and wastes from dismantling of end-of-life vehicles and vehicle maintenance (except 13, 14, 16 06 and 16 08)
End-of-life tyres Materials which may have been separated with perhaps the intention of recycling, however is not of sufficient quality or there is currently no market for the material.
Uncertain how much of this waste stream is composed of synthetic rubber (i.e. fossil carbon) versus natural rubber.
SW6: Non-biogenic residue streams from material sorting and separation facilities
19 12 10 Waste from waste management facilities, from the mechanical treatment of waste (e.g. sorting, crushing, compacting, pelletising)
Combustible waste (refuse derived fuel)
Residual wastes are sometimes sent to interim waste management facilities where further sorting and processing is undertaken. One of the outputs may be an RDF which is
Composition can vary as RDF is produced to different specifications. Residues are heavily dependent on the input material, which vary depending on the processing facility. Therefore, a fossil content range has

Final Report
44
Waste stream EWC code EWC description EWC sub-description Notes Certainty of volumes / composition
19 12 12 Other wastes (including mixtures of materials)
generally used in a UK EfW or exported. Other residues are also generated in the process and are destined for disposal.
This waste stream also includes rejects from material recovery facilities (MRF), which separate DMR collected for recycling.
been applied to reflect municipal waste sources.
SW7: Non-biogenic residue streams from composting and AD processes
19 06 99 Waste from anaerobic treatment of waste
Wastes not otherwise specified
These materials are outputs from the anaerobic treatment of wastes, which are sent to landfill or EfW.
Assumed to be predominantly plastic packaging which has been contaminated by an organic waste stream. The contaminated material is assumed to be entirely fossil, as the biogenic content is broken down during the AD process.
19 05 Waste from aerobic treatment of waste
01: non-composted fraction of municipal and similar wastes
99: wastes not otherwise specified
This material relates specifically to the outputs from composting facilities which are sent to either landfill or EfW.
Assumed to be predominantly plastic packaging which has been contaminated by an organic waste stream. The contaminated material is assumed to be entirely fossil, as the biogenic content is broken down during the AD process.

Final Report
45
Appendix B – Data on volumes and end of life fates of solid wastes
The quality of solid waste data in the UK varies widely depending on the source. Local authorities are required to report on the waste they collect from households and businesses (local authority collected waste – LACW). Conversely, private contractors, servicing commercial and industrial enterprises, are not obliged to report waste collected. There are requirements on operators of permitted waste sites to provide data on the waste they receive, but challenges exist when using this data to quantify waste streams, for example due to mistakes in waste input or output classifications, incoming wastes being classified as recyclables or non-waste and then re-classified as a waste (e.g. due to contamination) at the next stage of the waste management supply chain.
The EWC codes do not distinguish between sources of waste i.e. they are focussed on the waste composition and the potential waste management routes instead. The most relevant to this study is EWC 20 03 01, which covers waste from household and commercial industrial sources and therefore includes waste from both SW1 and SW2. Anthesis has applied a set of assumptions based on supporting data sets and in-house experience to calculate the split for SW1 and SW2 for the purpose of this study. The breakdown will change depending on population and household growth driving municipal waste growth and the economic growth and structural changes to the commercial and industrial sectors in the UK.
Waste is a devolved issue in the UK, and as such, data is reported to different levels of granularity by the different nations of the UK. For example, England and Wales both report permit waste site returns by EWC code. However, Scotland reports summarised data: waste from all sources, business waste and household wastes. Northern Ireland doesn’t report any recent C&I waste data separately. Therefore, UK Defra summary statistics have been used, where possible, to fill in gaps. There are also some data gaps for some waste streams. However, these are considered to be waste streams which are relatively small quantities.
The datasets and assumptions made have been outlined in Table 5 below. The breakdown of EoL fate for each feedstock across each country is provided in Table 6.
Table 5: Waste datasets and assumptions
Solid waste stream
Datasets Assumptions
England
SW1 • Defra report, Management of Local Authority Collected Waste, England, 2017/18
• WasteDataFlow (WDF) questions 100 (2017)
• EA RDF export data 2017 • EA waste incinerator returns
2017
• Defra report was used to calculate residual waste, minus rejects and waste that has been through interim facilities, to calculate what goes directly to EfW and landfill.
• WDF was used to estimate proportion of RDF which is exported (~25%) compared to that recovered in the UK (~75%).

Final Report
46
Solid waste stream
Datasets Assumptions
• UK based EfW with CHP were identified by Anthesis (internal database).
SW2 • EA Waste Data Interrogator (WDI) 2017
• EA waste incinerator returns 2017
• Results from SW1
Waste reported in WDI and incinerator returns data as 20 03 01 includes both local authority and commercial mixed wastes. Therefore it assumes that the commercial element would equal total waste in WDI reported as going to landfill and EfW, minus that reported by local authorities.
SW3 • EA RDF export data 2017 • EA waste incinerator returns
2017
Assumed that all waste reported as going to co-incineration in the UK was of SRF standard. SRF reported separately to RDF exports in the export data.
SW4 • EA Waste Data Interrogator (WDI) 2017
• EA waste incinerator returns 2017
WDI and waste incinerator returns were used to identify the relevant codes going to EfW and landfill. Assumed code 19 12 04 was composed of 50% plastic and 50% rubber.
SW5 • EA Waste Data Interrogator (WDI) 2017
• EA waste incinerator returns 2017
WDI and waste incinerator returns were used to identify the relevant codes going to EfW and landfill. Assumed code 19 12 04 was composed of 50% plastic and 50% rubber.
SW6 • EA Waste Data Interrogator (WDI) 2017
• EA RDF export data 2017 • EA waste incinerator returns
2017
WDI and waste incinerator returns were used to identify the relevant codes going to EfW and landfill. Export and incinerator returns data used to identify waste exported and used in EfW facilities in the UK. Assumed exported RDF goes to facilities with CHP.
SW7 • EA Waste Data Interrogator (WDI) 2017
• EA waste incinerator returns 2017
WDI and waste incinerator returns were used to identify the relevant codes going to EfW and landfill.
Scotland
SW1 • Waste from all sources: waste data tables 2016
Waste data for Scotland is not published by EWC code. Therefore, Anthesis have

Final Report
47
Solid waste stream
Datasets Assumptions
• Household waste summary data 2016
• Business waste data 2016
identified the relevant waste for this as ‘Household and similar wastes’ wastes going to landfill or EfW. 67% of this is assumed to come from household sources and the remaining 33% from business sources (calculated from the cited datasets).
No incineration in Scotland is designated as recovery (i.e. R1 facilities) and therefore assumed not to have a CHP (according to above datasets).
SW2 • Waste from all sources: waste data tables 2016
• Household waste summary data 2016
• Business waste data 2016
Waste data for Scotland is not published by EWC code. Therefore, Anthesis have identified the relevant waste for this as ‘Household and similar wastes’ going to landfill or EfW. 67% of this is assumed to come from household sources and the remaining 33% from business sources (calculated from the cited datasets).
No incineration in Scotland is designated as recovery (i.e. R1 facilities) and therefore assumed not to have a CHP (according to above datasets).
SW3 • Waste from all sources: waste data tables 2016
Identified relevant waste as ‘sorting residues’ going to landfill or EfW.
All exports go to CHP rather than co-incineration facilities. Assumed sorting residues going to co-incineration are of SRF quality.
SW4 • Waste from all sources: waste data tables 2016
Identified relevant waste as ‘plastic wastes’ going to landfill or EfW.
SW5 • Waste from all sources: waste data tables 2016
Identified relevant waste as ‘rubber wastes’ going to landfill or EfW.
SW6 • Waste from all sources: waste data tables 2016
Identified relevant waste as ‘sorting residues’ going to landfill or EfW.

Final Report
48
Solid waste stream
Datasets Assumptions
SW7 • Waste from all sources: waste data tables 2016
Assumed that ‘mixed animal and food wastes’, and ‘vegetal wastes’ going to landfill/incineration, are rejects from AD and composting facilities.
Northern Ireland
SW1 • Northern Ireland Environment Agency (NIEA): Northern Ireland Local Authority Collected Municipal Waste Management Statistics, 2017/18
Waste going to interim waste facilities is not included in this stream, as waste to interim facilities is captured in SW6. As there are no EfW plants in Northern Ireland, all waste to EfW is considered exported and therefore considered under SW6, as it requires processing before it is exported for energy recovery.
SW2 • UK Waste Statistical note Defra, 2019
Commercial waste for Northern Ireland is very sparse. A Defra summary report, which reports total Mixed municipal waste (i.e. 20 03 01) has been used to estimate the commercial proportion of this, as the difference between the municipal and the local authority collected.
SW3 • No data on exports of SRF specifically
Assumed all exports are RDF and go to EfW with CHP.
SW4 • Data not available
SW5 • Data not available
SW6 • UK Waste Statistical note Defra, 2019
• Department of Agriculture, Environment and Rural Affairs (DAERA) - Export Records for RDF Shipped from Northern Ireland
Defra Statistical note reported totals to landfill of wastes from mechanical treatment of waste (19 12 12).
SW7 • Data not available
Wales
SW1 • StatsWales, 2017/18, Local authority municipal waste -
Municipal waste (20 03 01) going to landfill and EfW identified in the waste returns data.

Final Report
49
Solid waste stream
Datasets Assumptions
Annual management of waste by management method (tonnes)
• Natural Resources Wales (NRW), Wales waste permit returns, 2017
• C&I waste survey 2012
Local authority data reported is removed from totals and C&I proportion estimated from results of C&I survey 2012.
SW2 • StatsWales, 2017/18, Local authority municipal waste - Annual management of waste by management method (tonnes)
• Natural Resources Wales (NRW), Wales waste permit returns, 2017
• C&I waste survey 2012
Municipal waste (20 03 01) going to landfill and EfW identified in the waste returns data. Local authority data reported is removed from totals and C&I proportion estimated from results of C&I survey 2012.
SW3 • No data on exports of SRF specifically
Assumed all exports are RDF and go to EfW with CHP.
SW4 • Natural Resources Wales (NRW), Wales waste permit returns, 2017
Relevant codes identified as going to landfill or EfW.
SW5 • Natural Resources Wales (NRW), Wales waste permit returns, 2017
Relevant codes identified as going to landfill or EfW.
SW6 • Natural Resources Wales (NRW), Wales waste permit returns, 2017
• RDF export data 2017
Relevant codes identified as going to landfill or EfW. Export data used to identify exported portion.
SW7 • Natural Resources Wales (NRW), Wales waste permit returns, 2017
Relevant codes identified as going to landfill or EfW.
These data-sources have therefore been used to put together the breakdown of EoL fate for each waste type by nation of the UK, which is used to derive the UK weighted average as given in the main report.

Final Report
50
Table 6: End of life fates for the solid waste streams (arisings figure refers to fossil portion of waste only, ranges given refer to observed range in fossil content of waste)
Secondary fossil feedstock UK weighted
average England Scotland Northern Ireland Wales
Low High Low High Low High Low High Low High
SW1 (LACW residual waste)
Arisings (000 tonnes) 3,041 4,055 2,660 3,547 273 364 69 92 39 52 Landfill 35% 27% 93% 100% 59% EfW power only (UK) 54% 61% 7% 0% 41% EfW CHP (UK) 10% 12% 0% 0% 0% EfW with CHP (export) 0% 0% 0% 0% 0%
Cement kiln (UK) 0% 0% 0% 0% 0%
Cement kiln (exported) 0% 0% 0% 0% 0%
Total 100% 100% 100% 100% 100%
SW2 (C&I residual waste)
Arisings (000 tonnes) 461 614 282 376 133 177 4 5 42 56 Landfill 62% 48% 93% 100% 59% EfW power only (UK) 33% 45% 7% 0% 41% EfW CHP (UK) 4% 7% 0% 0% 0% EfW with CHP (export) 0% 0% 0% 0% 0%
Cement kiln (UK) 0% 0% 0% 0% 0%
Cement kiln (exported) 0% 0% 0% 0% 0%
Total 100% 100% 100% 100% 100%

Final Report
51
Secondary fossil feedstock UK weighted
average England Scotland Northern Ireland Wales
Low High Low High Low High Low High Low High
SW3 (SRF)
Arisings (000 tonnes) 144 142 2 - - Landfill 0% 0% 0% 0% 0% EfW power only (UK) 0% 0% 0% 0% 0% EfW CHP (UK) 0% 0% 0% 0% 0% EfW with CHP (export) 0% 0% 0% 0% 0%
Cement kiln (UK) 62% 61% 100% 0% 0%
Cement kiln (exported) 38% 39% 0% 0% 0%
Total 100% 100% 100% 0% 0%
SW4 (non-recyclable plastic being collected separately)
Arisings (000 tonnes) 27 26 1.5 No data 0.15 Landfill 91% 90% 100% 100% EfW power only (UK) 2% 2% 0% 0% EfW CHP (UK) 0% 0% 0% 0% EfW with CHP (export) 0% 0% 0% 0%
Cement kiln (UK) 8% 8% 0% 0%
Cement kiln (exported) 0% 0% 0% 0%
Total 100% 100% 100% 0% 100%
SW5 (non-recyclable rubber being
Arisings (000 tonnes) 63 61 1.8 No data 0.04 Landfill 23% 24% 1% 100% EfW power only (UK) 0% 0% 0% 0%

Final Report
52
Secondary fossil feedstock UK weighted
average England Scotland Northern Ireland Wales
Low High Low High Low High Low High Low High collected from commercial premises)
EfW CHP (UK) 0% 1% 0% 0% EfW with CHP (export) 0% 0% 17% 0%
Cement kiln (UK) 76% 76% 82% 0%
Cement kiln (exported) 0% 0% 0% 0%
Total 100% 100% 100% 0% 100%
SW6 (non-biogenic residue streams from material sorting and separation facilities)
Arisings (000 tonnes) 4,692 6,256 4,077 5,437 313 417 111 149 190 253 Landfill 57% 56% 82% 58% 48% EfW power only (UK) 14% 15% 4% 0% 39% EfW CHP (UK) 6% 7% 2% 0% 3% EfW with CHP (export) 21% 22% 12% 42% 10%
Cement kiln (UK) 0% 0% 0% 0% 0%
Cement kiln (exported) 0% 0% 0% 0% 0%
Total 100% 100% 100% 100% 100%
SW7 (non-biogenic residue streams from composting and AD processes)
Arisings (000 tonnes) 69 41 15.6 No data 13.2 Landfill 99% 100% 97% 100% EfW power only (UK) 1% 0% 3% 0% EfW CHP (UK) 0% 0% 0% 0% EfW with CHP (export) 0% 0% 0% 0%

Final Report
53
Secondary fossil feedstock UK weighted
average England Scotland Northern Ireland Wales
Low High Low High Low High Low High Low High
Cement kiln (UK) 0% 0% 0% 0%
Cement kiln (exported) 0% 0% 0% 0%
Total 100% 100% 100% 0% 100%

Interim Report
54
Appendix C – Solid waste compositions This section outlines the assumptions used to assess the fossil waste content of each of the solid waste streams. The composition of waste streams, particularly mixed wastes, can vary significantly. Table 7 outlines the assumed breakdown of materials in each waste stream. The waste composition for mixed municipal waste (SW1, SW2 and SW6) is based on the average of several sources recording waste composition in England, Wales and Scotland. The composition of SRF is taken from a literature source (Shanks).76 It should be noted that Solid Recovered Fuel (SRF) is produced to individual client requirements and often agreed as a specific fuel in bilateral feedstock supply agreements depending on the final use and destination. Key features of SRF products are the high energy content of > 20 MJ/kg, the low moisture content and low level of contamination, which distinguishes this waste stream from residual waste and RDF. Composition of SW4, SW5 and SW7 were assumed based on knowledge of these waste streams. For SW4 (plastics), an assumption was made about the mass split between dense plastics and plastic films. SW5 (rubber) is assumed to be predominantly tyres77. SW7 is assumed to be packaging material, i.e. plastics.
76 Shanks spec - Solid Recovered Fuel: An sustainable and deliverable source of renewable energy 77 http://www.seas.columbia.edu/earth/RRC/documents/recycling_rubber.pdf
The percentage by mass of each material within the overall waste stream is multiplied by the percentage by mass of that material that is non-biogenic. Summing over all materials therefore gives the percentage by mass of the total waste stream that is non-biogenic, as given in Table 7
Table 7 Assumed average composition of all solid waste
Material % of that material that is non-biogenic
Percentage of that material within each waste
SW1 SW2 SW3 SW4 SW5 SW6 SW7
Paper and card
19% 19% 58% 19% 19%
Plastic film 7.0% 7.0% 20% 50% 7.0% 50% 7.0%
Dense plastic 8.8% 8.8% 50% 8.8% 50% 8.8%
Textiles 4.1% 4.1% 15% 4.1% 4.1%
Absorbent hygiene products
3.7% 3.7% 3.7% 3.7%

Interim Report
55
Wood 2.1% 2.1% 5.0% 2.1% 2.1%
Combustibles 8.7% 8.7% 2.0% 8.7% 8.7%
Non-combustibles
4.2% 4.2% 4.2% 4.2%
Glass 4.3% 4.3% 4.3% 4.3%
Ferrous metal 2.1% 2.1% 2.1% 2.1%
Non-ferrous metal
1.2% 1.2% 1.2% 1.2%
Organic - kitchen
27% 27% 27% 27%
Organic - green 4.1% 4.1% 4.1% 4.1%
Fine material <10mm 1.8% 1.8% 1.8% 1.8%
Waste Electrical and Electronic Equipment 1.2% 1.2% 1.2% 1.2%
Specific Hazardous Household Waste Items (including all batteries) 0.7% 0.7% 0.7% 0.7%
Rubber 100%
Total composition
100% 100% 100% 100% 100% 100% 100%
Total fossil fraction of mixed waste stream
34% 34% 29% 100% 60% 34% 100%

Interim Report
56
Appendix D – Key data and assumptions used in GHG assessment
In this section we report the key data that makes up the GHG assessment of each feedstock.
Table 8 provides the lower heating values that were used in this study. There can be substantial variation in the heating values of all these wastes. The more mixed the waste, and hence variable the composition, the greater range of LHV that is typically seen. These heating values refer to the fossil fraction of the waste stream only.
Table 8: Lower heating value of the feedstocks identified in this study
Waste code Lower heating value (MJ/kg)
Reference
SW1 18.2 Calculated from assumed waste composition
SW2 18.2 Calculated from assumed waste composition
SW3 26.0 Calculated from assumed waste composition
SW4 36.6 Calculated from assumed waste composition
SW5 31.3 Calculated from assumed waste composition
SW6 18.2 Calculated from assumed waste composition
SW7 36.6 Calculated from assumed waste composition
GW1 2.78 Calculated from assumed waste composition
GW2 46.6 BEIS (2018)
Table 9: GHG emissions associated with a given end of life fate of a feedstock
Waste code
Emission factor landfill of that waste (kgCO2eq./tonne)
Reference Emission factor combustion of that waste (kgCO2eq./tonne)
Reference
SW1 154 Shonfield (2008) 1683
Calculated from assumed waste composition
SW2 154 Shonfield (2008) 1683
SW3 154 Shonfield (2008) 2624
SW4 154 Shonfield (2008) 2804
SW5 154 Shonfield (2008) 3117
SW6 154 Shonfield (2008) 1683
SW7 154 Shonfield (2008) 2804

Interim Report
57
GW1 N/A 681
GW2 N/A 2906 BEIS (2018)

Interim Report
58
Appendix E – UK grid electricity emission factors Green Book:
Long run average and marginal GHG emission factors for UK grid electricity from 2010 to 2100 are given in the government ‘Green Book’ for policy assessment.78 This data was most recently updated in March 2019, with the average grid emissions in this most recent update substantially lower than in previous versions of the data.79
78 BEIS (2019) Valuation Of Energy Use And Greenhouse Gas, Supplementary Data table 1, Available from: https://www.gov.uk/government/publications/valuation-of-energy-use-and-greenhouse-gas-emissions-for-appraisal 79 Therefore in the interim report submitted to DfT the 2019 marginal emissions were 89.7 gCO2eq./MJ and the 2019 average emissions were 62.2 gCO2eq./MJ. Question pending with the publishers around why the average emissions have decreased so substantially in this update of the Green Book figures.
Figures are given on a ‘generation’ basis and on a ‘consumption’ basis (covering consumption from domestic, commercial/public sector and industry). Consumption figures include transmission and distribution losses post-production. Neither the generation nor consumption-based figures include the ‘upstream’ emissions from e.g. natural gas extraction. An uplift of 15% was applied to the emission factor provided in the Green Book, in order to approximate the addition of upstream emissions. This is consistent with a methodology employed at DfT. The guidance states that the average emissions factor is used for emissions footprinting, whilst the marginal emissions factor should be used for analysing sustained changes in energy consumption for the purposes of cost-benefit analysis, including policy appraisal.
The marginal emissions factor is an annual average that reflects which plants are expected to come online to support a sustained increase in electricity demand. In 2010 this was a Combined Cycle Gas Turbine (CCGT) plant, but it is currently modelled as a mix of technologies with an emissions factor substantially below that of a CCGT plant. The 2019 figure is an interpolation between the 2010 CCGT emissions factor and a 2030 marginal emissions factor calculated by BEIS using their Dynamic Dispatch Model.
BEIS Company reporting:
BEIS also publish electricity emission factors to use in company reporting.80 These are sub-divided into ‘direct’ emissions which are those directly from the generation asset and from T&D losses, and ‘indirect’ emissions which are those from upstream extraction of the fossil resource. Due to requirements for data, the most recent company reporting data from 2018 is based on available data from 2016. The data factors in net imports of electricity from Ireland, the Netherlands and France.
80 BEIS (2018) 2018 GOVERNMENT GHG CONVERSION FACTORS FOR COMPANY REPORTING , Available from: https://assets.publishing.service.gov.uk/government/uploads/system/uploads/attachment_data/file/726911/2018_methodology_paper_FINAL_v01-00.pdf
Comparison:
In the table below we compare the emissions from these two sources (in both cases excluding the transmission and distribution losses). This demonstrates the rapid recent drop in UK grid GHG

Interim Report
59
emissions, and the further expected drop to 2030. This has a significant impact on the results of the current study.
Table 10 Electricity emission factors from BEIS Company reporting and UK government Green Book
Source: BEIS company reporting
Green Book
Date to which data refers:
2016 2016 2019 2030
Average GHG intensity (gCO2eq./MJ)
90.3 85.0 42.6 24.1
Marginal GHG intensity (gCO2eq./MJ)
N/A 99.2 89.7 37.8