main drying and wetting curves of soils: on measurements
TRANSCRIPT

ENGINEERING TRANSACTIONS • Engng. Trans. • 63, 1, 5–34, 2015Polish Academy of Sciences • Institute of Fundamental Technological Research (IPPT PAN)
National Engineering School of Metz (ENIM) • Poznan University of Technology
Main Drying and Wetting Curves of Soils:On Measurements, Prediction and Influence
on Wave Propagation
Bettina ALBERS
Technical University of Berlin, Institute for GeotechnicalEngineering and Soil Mechanics
Germanye-mail: [email protected]
Depending on the initial degree of saturation of a soil, different capillary pressure curvesoccur. If a sample is initially water saturated and then drained (process of drainage) the maindrying curve results. On the other hand, if the sample is initially dry and water is supplieduntil saturation is reached (process of imbibition) the main wetting curve is the consequence.These two curves build a hysteresis loop. If after the first process the other is followed up(possibly a number of times), then inner hysteresis curves arise. The focus of this paper isthe investigation of some aspects of the main drying curve (MDC) and the main wettingcurve (MWC). Some methods of their measurement are discussed. Because of big differencesin the capillary pressure for different degrees of saturation the measurement is laborious andtime consuming and often application of more than one method is necessary. Consequently,often only the MDC is measured and the data is used to predict the MWC and inner curves.Exemplarily, one prediction method is shown and subsequently, for one soil type the resultingcurves are used to calculate the wave speeds and attenuations of the appearing sound waves.The dependence of these wave features on frequency and saturation for the current exampleshows, that the hysteresis effect of the capillary pressure curve has only a slight effect on thepropagation of sound waves in partially saturated sand.
Key words: capillary pressure curves, partially saturated porous media, hysteresis.
1. Introduction
The final aim of the investigation of certain aspects of partially saturatedsoils is the preferably closed-form description of the propagation of sound wavesincluding the hysteresis effects of the capillary pressure curve. Partially saturatedsoils consist of three components: the solid (index S) and two immiscible porefluids (indices F and G) which here are expected to be water and air.

6 B. ALBERS
Although it is well known that the capillary pressure exhibits two branchesdepending on the initial state of the sample, for simplicity in earlier investiga-tions (e.g. [6]) only one of them has been considered. In order to describe wavepropagation processes a hyperbolic model is needed. Such a model has beenintroduced in [7] and applied to the wave propagation in air-water mixtures insandstones [4] and other soil types [5, 8]. The wave propagation analysis pre-dicts the existence of four sound waves in partially saturated porous media –one transversal wave, S, and three compressional waves, P1, P2 and P3. Theirphase speeds and attenuations are determined in dependence on frequency anddegree of saturation, i.e. of the fraction of the wetting pore fluid to the wholevoid volume. The P1-wave is mainly driven by the skeleton. The P2-wave showsa similar behavior to the sound wave in suspensions: its speed has a deep mini-mum in dependence on the saturation. The P3-wave only exists if at least twoimmiscible pore fluids occur (in the case of one fluid filling the pores, the soilis called ’saturated’). Its speed is attributed to the capillary pressure betweenthe pore fluids. This enters the model by the use of an empirical law by vanGenuchten [42]
(1.1) pc =1
αvG
[S(−1/mvG)e − 1
]1/nvG
.
This relation, which obviously only describes one of the branches of the capillarypressure curve (see the left panel of Fig. 1), contains three parameters mvG, nvGand αvG. The choice of these parameters controls the shape of the curve (mvG
and nvG) and its position in the capillary pressure-saturation-diagram (αvG).The effective saturation Se accounts for the fact that for most soil types in thelimits of the capillary pressure there remains a certain amount of the other porefluid – the residual saturation or irreducible saturation – in the pores.As mentioned above, with the van Genuchten formula usually only the main
drying curve is described. However, depending on the initial degree of saturationof a soil, different capillary pressure curves occur. If a sample is initially watersaturated and then drained (process of drainage; see left hand side of Fig. 2) themain drying curve (MDC) results. On the other hand, if the sample is initiallydry and water is supplied until saturation is reached (process of imbibition; seeright hand side of Fig. 2) the main wetting curve is obtained. These two curves,often also called boundary curves, build a hysteresis loop (see right panel ofFig. 1). This figure also demonstrates that, if after the first drying or wettingprocess the opposite process follows subsequently, then primary curves arise.Further cycles of wetting or drying lead to further inner – so called – scanningcurves.Figure 2, showing the capillary menisci during drainage and imbibition of a
soil sample, impressively illustrates the effect of surface tension. The surface of

MAIN DRYING AND WETTING CURVES OF SOILS. . . 7
a) b)
Fig. 1. a) Main drying curve for sandstone created with the van Genuchten formula (1.1);b) hysteresis in capillary pressure curves, main (boundary) wetting and drying curves and
inner (scanning) curves (taken from Bear and Bachmat [11]).
Fig. 2. Capillary menisci during drainage (left) and imbibition (right); figures from [38].

8 B. ALBERS
soil particles is curved and has two principal radii of curvature, r1 and r2 (seethe following figure which is based on a figure of a pendular ring of Reinson,Fredlund & Wilson [37]). They are the radii of a water-air interface. Byconsidering the change in the direction of the forces acting on opposite sides,one obtains the Young-Laplace equation
(1.2) ∆p = pc = p2 − p1 = σ12
(1
r1+
1
r2
)= 2
σ12r∗,
where r∗ is the mean radius of curvature (2/r∗ = 1/r1 + 1/r2). The capillarypressure is, thus, a measure of the tendency of a porous medium to suck inthe wetting fluid (whose molecules or atoms are preferentially adsorbed on solidsurfaces) or to repel the nonwetting phase. The radius r∗ is of the order of mag-nitude of the pore or grain size. The capillary pressure, thus, depends on thegeometry of the void space, on the nature of the solids and fluids and on the de-gree of saturation. In soils, the geometry of the void space is extremely irregularand complex. Hence, the determination of radii r1 and r2 is nearly impossibleand instead an idealized model may be adopted. Laboratory experiments areprobably the only method to derive the relationship pc = pc(S).The phenomenon of hysteresis, i.e. different values of the capillary pressure
for the same degree of saturation for drying and wetting, is attributed to anumber of causes. The first, called ink-bottle effect, results from the shape ofthe pore space with interchanging narrow and wide passages (for an illustrationsee Fig. 3, top left). During drainage and re-wetting, menisci having the samecurvature occur at different elevations, thus yielding different wetting fluid sat-urations for the same capillary pressure. The second, called the raindrop effect(see Fig. 3, top right), is due to the fact that the contact angle at the advanc-ing trace of an interface on a solid differs from that at the receding one. Thishappens, e.g. because of impurities, roughness or variability of the solid surface.The third cause for hysteresis is the entrapment of droplets in the void space asthe non-wetting fluid is replaced by the wetting one during wetting the sample.This effect is called snap-off and it is illustrated in the bottom of Fig. 3. It oc-curs if the void space diameter is very different from the void opening diameter.Of course, also the non-wetting fluid can be entrapped in the pore space dur-ing re-wetting. Finally, especially in fine porous media, consolidation, swellingand shrinkage of the solid matrix may contribute to hysteresis in the capillarypressure curve.

MAIN DRYING AND WETTING CURVES OF SOILS. . . 9
Fig. 3. Illustration of causes for hysteresis in capillary pressure curves. Top left: ink-bottleeffect, top right: raindrop effect (both taken from Bear and Bachmat [11]), bottom: snap-off
effect (taken from Sheta [40]).
2. Measurements
The relation between the water content and the matric potential in a soil isreferred to by various names, such as water retention curve, soil water character-istic curve (SWCC), water content-matric potential curve or capillary pressure-saturation relation. This function relates a capacity factor, the water content,to an intensity factor, the energy state of the soil water. The energy state isexpressed by names such as suction, tension, capillary pressure (head) or matrichead. The potential of the soil water may be expressed in units of energy perunit mass [J kg−1], energy per unit volume [Pa] or energy per unit weight [m].The latter corresponds to the matric head which is expressed as the height ofa fluid column of a given density. While suction, tension and capillary pressurevalues are positive, the matric head is negative. The soil water content may beexpressed on a weight basis (gravimetric water content [kg kg−1]), on a volumebasis (volumetric water content [m3 m−3]) or on a degree of saturation basis(ratio of volumetric water content and volumetric pore content). The water re-tention relation is hysteretic which means that the water content/saturation

10 B. ALBERS
during drainage will be greater than during wetting for a given value of thematric head/capillary pressure [16].The probably first measurements of such curves for different types of soils
were conducted by E. Buckingham [13] in 1907. He obtained curves fromcolumns of six soils of various types, analyzed after from fifty-three to sixty-eight days, when they had apparently ceased to take up any more water. Thesoils were in metal cylinders 48 inches long and 2.5 inches in diameter, closedat the top. Water was supplied through side tubes at the bottom. He plottedthe height from the water level over the water content in percent (see Fig. 4).It is obvious that he only measured one of the branches of the water retentioncurve.
Fig. 4. Distribution of water in 48-inch columns of soil after 53 to 68 days(from Buckingham [13] 1907).
In the following description of different contemporary measuring methodsfor water retention curves, we mainly rely on the book by Lu and Likos [29].Therein the term total suction quantifies the thermodynamic potential of soil

MAIN DRYING AND WETTING CURVES OF SOILS. . . 11
pore water relative to a reference potential of free water. Free water has nointeractions with other components which impart curvature to the air-water in-terface and has no external forces other than gravity. Total suction is consideredas the sum of matric suction and osmotic suction. The former arises from thecombined effects of capillarity and short-range adsorption. The term “matric”stems from the term “matrix” since it stands for the part of suction arising frominteraction between the pore water and the soil solid or soil matrix. Osmoticsuction arises from the presence of dissolved solutes. While short-range adsorp-tion and osmotic effects may also appear in saturated soils capillarity effects areunique to unsaturated or partially saturated soils.As pointed out above, the range of suction is very large. This is especially
true for soils with very fine grains because the capillary forces arising in thesmall voids are exceptionally high. For such soil types one measuring methodmay not be sufficient to determine the whole curve. Lu and Likos [29] dividethe measuring techniques in such a way to find the matric suction (methods a)–d) in Fig. 5) and others for the determination of total suction (methods e)–h)in Fig. 5). Although the first group seems to be more important also the secondgroup will be presented roughly. In the figure the ranges of the different mea-suring methods are compared to the Soil Water Characteristic Curves (SWCC)of three soil types. Note that in the upper part of the figure the suction is givenin kPa while in the bottom part in MPa.Both methods a) by tensiometers and b) axis translation techniques rely
on the properties of so-called High-Air-Entry materials (HAE). On the righthand side of the following figure the reproduction from [29] of a sketch of thesituation is presented. Saturated HAE materials have the capability of restrictingthe advection of air while allowing free advection of water. If a soil sampleis placed in contact with a saturated HAE material, air pressure which actson the air in the pores may be applied on one side and the pore water mayfreely drain through the material under atmospheric pressure maintained onthe other side. The separation of air and water pressure happens as long as theapplied pressure does not exceed the air-entry pressure of the HAE material.The air-entry pressure of a certain material is reflected by the beginning of thedeviation from the horizontal part (for low suction values) of the curves (seeFig. 5, bottom). It is determined by the radius of the largest pore. The smallerthe largest pore, the higher the air entry value.a) Tensiometers (suction range 0–100 kPa)
The surface tension acts as a membrane for separating the two phases,thus, allowing the negative water pressure to be directly measured. Porepressure measurements are made by a direct exchange of water between thesensor and the soil. Negative pressure is transmitted through the saturatedpores of the HAE ceramic tip such that water is withdrawn from the

12 B. ALBERS
Fig. 5. Top: Ranges of several soil suction measuring methods (after [29]), bottom: qualitativeview of the Soil Water Characteristic Curves (SWCC) of three soil types – compare the rangesto the measuring methods in the upper panel of the figure considering that there the suction
is given in [kPa] here in [MPa] (from [28]).

MAIN DRYING AND WETTING CURVES OF SOILS. . . 13
tensiometer until the internal pressure in the sensor body is equivalent tothe matric potential of the soil water.
Left: Schematic drawing of a tensiometer, top right: operating principle ofan HAE ceramic disk showing how air and water pressure are separatedby surface tension, bottom right: schematic showing a porous ceramic tipin contact with unsaturated soil grains (figures from [29]).
b) Axis translationAxis translation techniques rely on controlling the difference between thepore air pressure and pore water pressure and measuring the correspondingwater content of soil in equilibrium with the applied matric suction.
Top left: Schematic drawing of the interface between unsaturated soil anda HAE disk for an axis translation measurement, top right: Tempe cell,bottom: pressure plate (drawings from [29], picture of the Tempe cell [3],picture of the pressure plates [2]).

14 B. ALBERS
Pressure plates (suction range 0–1 500 kPa) consist of a steel vessel anda saturated HAE ceramic plate. The latter are designated by differentair-entry pressures. A small water reservoir is formed beneath the plateand is vented to the atmosphere through an outflow tube allowing theair pressure in the vessel and the water pressure in the reservoir to beseparated. Soil samples are initially saturated. The air pressure in thevessel is then increased and simultaneously, the pore water is allowed todrain. The outflow of the water content is monitored until it ceases.Tempe cells (suction range 0–100 kPa) are similar in concept. However,while in pressure plates several soil samples can be investigated simul-taneously, in Tempe cells points of the soil characteristic curve of onlya single sample are measured. They are smaller than pressure plates.
c) Conductivity sensors (electrical/thermal, suction range 0–400 kPa)The electrical and thermal conductivities of a rigid porous medium (a ce-ramic block) are direct functions of the water content. If such a porousmedium is embedded in a mass of unsaturated soil, any change in thesuction of the soil results in a corresponding change in the water contentof the porous medium. Sensors measuring the change of water contentare typically constructed of porous ceramic, polymer synthetics, sinteredmetal/glass, or gypsum plaster – their notion used in practice is gypsumblocks. The thermal conductivity is measured by measuring the rate ofinternal heat dissipation following an applied heat pulse, the electricalconductivity by use of two embedded electrodes. However, the latter mea-surements are difficult because of the inherent sensitivity to changes inelectrical conductivity which are not related to the moisture content, e.g.from dissolved solutes.
Left: picture of two types of gypsum blocks (from [15]), right: cross-sectio-nal diagram of a thermal conductivity sensor (from [20]).
MAIN DRYING AND WETTING CURVES OF SOILS. . . 15
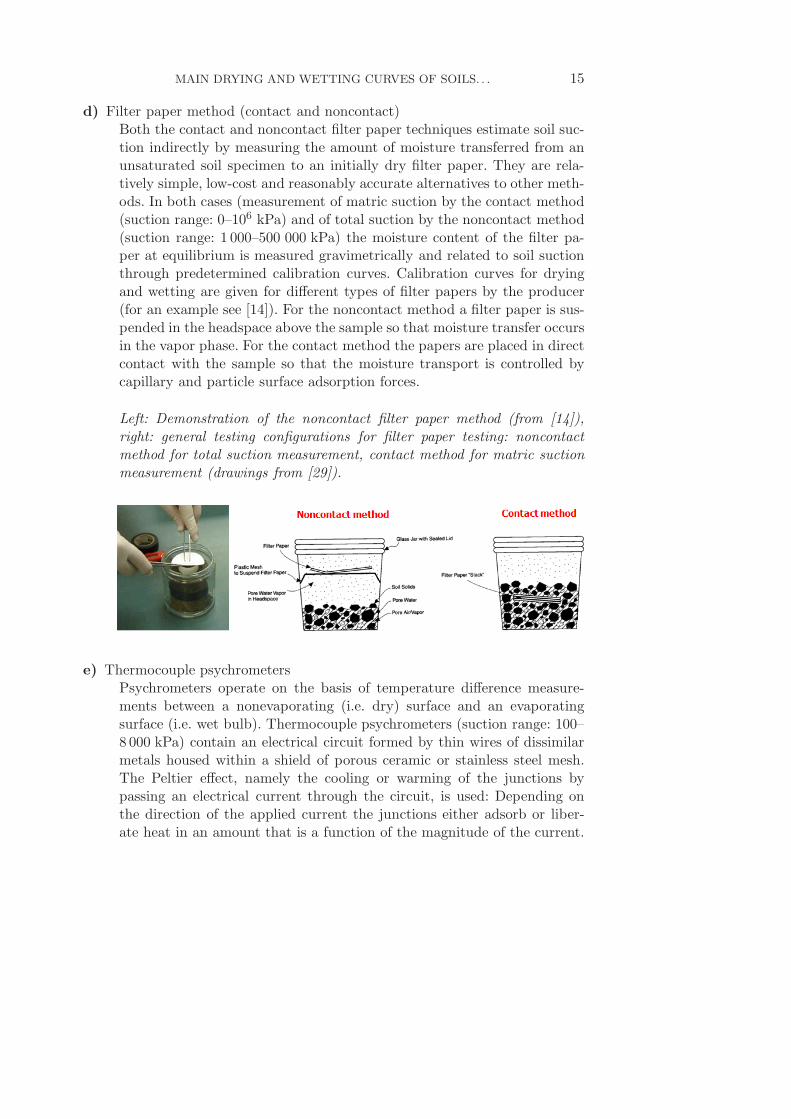
d) Filter paper method (contact and noncontact)Both the contact and noncontact filter paper techniques estimate soil suc-tion indirectly by measuring the amount of moisture transferred from anunsaturated soil specimen to an initially dry filter paper. They are rela-tively simple, low-cost and reasonably accurate alternatives to other meth-ods. In both cases (measurement of matric suction by the contact method(suction range: 0–106 kPa) and of total suction by the noncontact method(suction range: 1 000–500 000 kPa) the moisture content of the filter pa-per at equilibrium is measured gravimetrically and related to soil suctionthrough predetermined calibration curves. Calibration curves for dryingand wetting are given for different types of filter papers by the producer(for an example see [14]). For the noncontact method a filter paper is sus-pended in the headspace above the sample so that moisture transfer occursin the vapor phase. For the contact method the papers are placed in directcontact with the sample so that the moisture transport is controlled bycapillary and particle surface adsorption forces.
Left: Demonstration of the noncontact filter paper method (from [14]),right: general testing configurations for filter paper testing: noncontactmethod for total suction measurement, contact method for matric suctionmeasurement (drawings from [29]).
e) Thermocouple psychrometersPsychrometers operate on the basis of temperature difference measure-ments between a nonevaporating (i.e. dry) surface and an evaporatingsurface (i.e. wet bulb). Thermocouple psychrometers (suction range: 100–8 000 kPa) contain an electrical circuit formed by thin wires of dissimilarmetals housed within a shield of porous ceramic or stainless steel mesh.The Peltier effect, namely the cooling or warming of the junctions bypassing an electrical current through the circuit, is used: Depending onthe direction of the applied current the junctions either adsorb or liber-ate heat in an amount that is a function of the magnitude of the current.

16 B. ALBERS
If the temperature of the cooling junction is depressed beyond the dew-point temperature of the ambient environment, then water condenses onthe junction at a temperature that is a function of the ambient relativehumidity [29].
Photograph and schematic drawing of a typical laboratory set up for mea-suring total suction using a thermocouple psychrometer (both from [29]).
f) Chilled mirror hygrometers (suction range: 1–450 MPa)Humidity measurement involves thermoelectric chilling of a reflective sur-face, usually a metallic mirror, to a temperature at which condensation ofambient water vapor is visible on the mirror surface.
Left: condensation at a window glass (from [1]), right: schematic diagramof the chilled-mirror sensing technology (from [29]).
g) Isopiestic humidity control (suction range: 4–600 MPa)Using isopiestic humidity control, saturated or unsaturated salt or acidsolutions are allowed to come to the thermodynamic equilibrium in smallsealed containers. Under isothermal conditions the relative humidity inthe headspace above the solution approaches a fixed, reproducible valuewhich is dependent on the solution concentration.

MAIN DRYING AND WETTING CURVES OF SOILS. . . 17
Example testing configuration using isopiestic humidity control (from [29]).
h) Humidity/capacitance sensorsIn semiarid and arid regions soils can be so dry that total suctions andsoil gas relative humidities may exist at values beyond the limits for whichthermocouple psychrometers can be used (8 MPa or 94%). Polymer sensors(see the subsequent figure) consist of two electrodes separated by a film ofthermoset polymer that absorbs or releases water as the relative humidityof the surrounding gas changes. Measurements of resistance or capacitanceof the polymer film are used along with a calibration curve to determinethe relative humidity. The electrodes and polymer film are enclosed in aporous body.
Polymer capacitance sensor: components and sensor assembled with leadwire, sealant, and geotextile covering (from [10]).
3. Prediction
3.1. One branch
As mentioned in Sec. 2 different authors use different quantities to describethe water retention, or rather the capillary pressure curve. For instance, in [21]
18 B. ALBERS
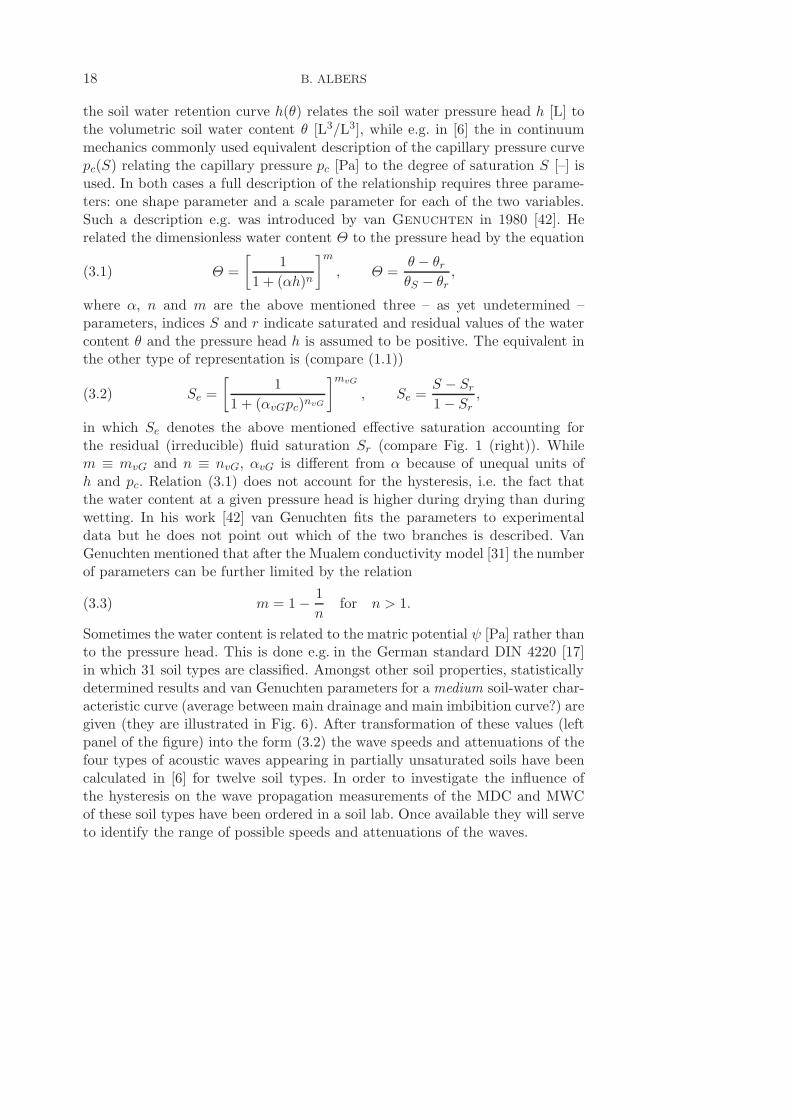
the soil water retention curve h(θ) relates the soil water pressure head h [L] tothe volumetric soil water content θ [L3/L3], while e.g. in [6] the in continuummechanics commonly used equivalent description of the capillary pressure curvepc(S) relating the capillary pressure pc [Pa] to the degree of saturation S [–] isused. In both cases a full description of the relationship requires three parame-ters: one shape parameter and a scale parameter for each of the two variables.Such a description e.g. was introduced by van Genuchten in 1980 [42]. Herelated the dimensionless water content Θ to the pressure head by the equation
(3.1) Θ =
[1
1 + (αh)n
]m, Θ =
θ − θrθS − θr
,
where α, n and m are the above mentioned three – as yet undetermined –parameters, indices S and r indicate saturated and residual values of the watercontent θ and the pressure head h is assumed to be positive. The equivalent inthe other type of representation is (compare (1.1))
(3.2) Se =
[1
1 + (αvGpc)nvG
]mvG
, Se =S − Sr1− Sr
,
in which Se denotes the above mentioned effective saturation accounting forthe residual (irreducible) fluid saturation Sr (compare Fig. 1 (right)). Whilem ≡ mvG and n ≡ nvG, αvG is different from α because of unequal units ofh and pc. Relation (3.1) does not account for the hysteresis, i.e. the fact thatthe water content at a given pressure head is higher during drying than duringwetting. In his work [42] van Genuchten fits the parameters to experimentaldata but he does not point out which of the two branches is described. VanGenuchten mentioned that after the Mualem conductivity model [31] the numberof parameters can be further limited by the relation
(3.3) m = 1− 1
nfor n > 1.
Sometimes the water content is related to the matric potential ψ [Pa] rather thanto the pressure head. This is done e.g. in the German standard DIN 4220 [17]in which 31 soil types are classified. Amongst other soil properties, statisticallydetermined results and van Genuchten parameters for a medium soil-water char-acteristic curve (average between main drainage and main imbibition curve?) aregiven (they are illustrated in Fig. 6). After transformation of these values (leftpanel of the figure) into the form (3.2) the wave speeds and attenuations of thefour types of acoustic waves appearing in partially unsaturated soils have beencalculated in [6] for twelve soil types. In order to investigate the influence ofthe hysteresis on the wave propagation measurements of the MDC and MWCof these soil types have been ordered in a soil lab. Once available they will serveto identify the range of possible speeds and attenuations of the waves.

MAIN DRYING AND WETTING CURVES OF SOILS. . . 19
Fig. 6. Top: statistically determined values for the matric potential in depen-dence on the water content for medium sand (values taken from [17]), bottom:values from the left panel rescaled to a capillary pressure-saturation depen-
dence and van Genuchten curve resulting from (3.2).
3.2. Main curves
Most hysteresis models for soils presented in the literature (on modelinghysteresis see e.g. [9]) presume that both MDC and MWC are measured andinterpolate scanning curves (i.e. inner curves for further drying and wettingprocesses) from the data of both curves. The majority of models is based onthe independent domain theory which goes back to works of Neel [32], Eve-rett [19], Enderby [18] and Poulovassilis [36]. Only the latter approach
20 B. ALBERS
focused on soil-moisture hysteresis and was the basis for a couple of theories tointerpolate scanning water retention curves from both main drying and wettingcurves (e.g. Topp [41] or Mualem [30]). Also some further empirical hysteresismodels rely on values of both main curves, i.e. for instance, Scott et al. [39],Kool and Parker [25] or Parker and Lenhard [33]. Parlange [34] pre-sented in 1976 an approach to predict the second boundary and scanning curvesin between from only one boundary curve. Since the measurements – as we haveseen in the last section – are laborious and time consuming this offers advantagescompared with other methods. The basic equation of the original model [34], is
(3.4) θd(h, hstd) = θw(h)− [h− hstd]dθwdh
, θd ≤ θstd = θ(hstd),
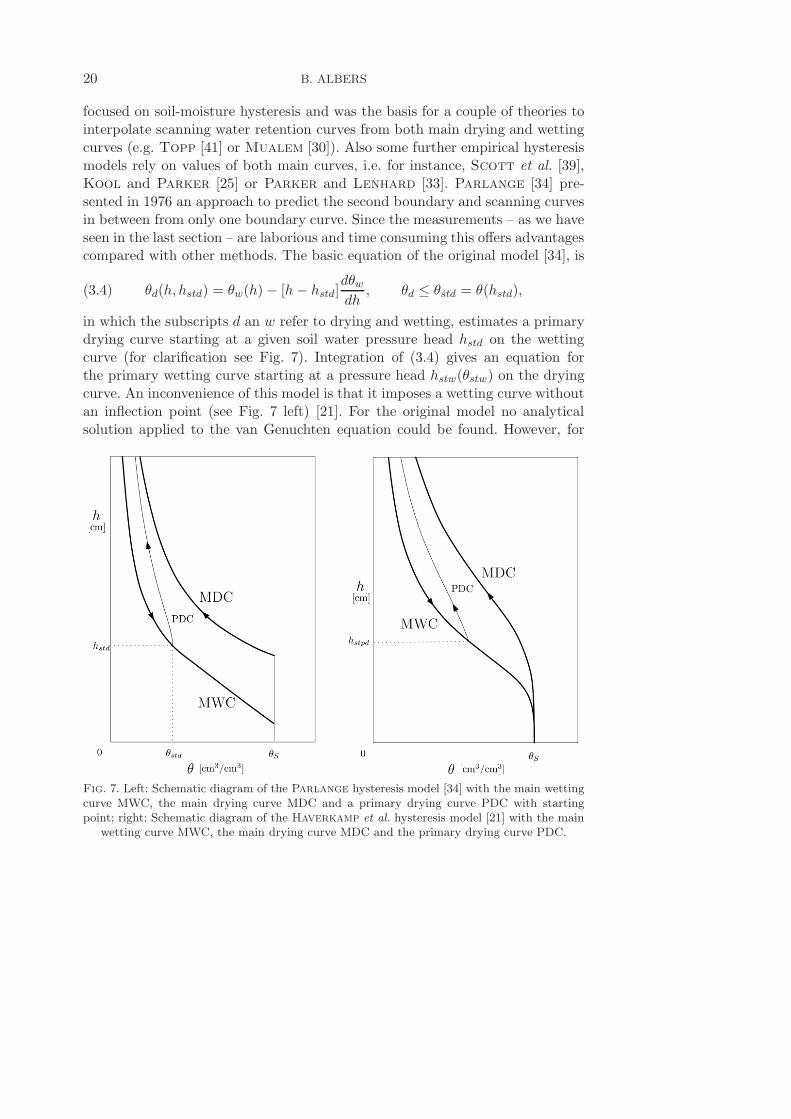
in which the subscripts d an w refer to drying and wetting, estimates a primarydrying curve starting at a given soil water pressure head hstd on the wettingcurve (for clarification see Fig. 7). Integration of (3.4) gives an equation forthe primary wetting curve starting at a pressure head hstw(θstw) on the dryingcurve. An inconvenience of this model is that it imposes a wetting curve withoutan inflection point (see Fig. 7 left) [21]. For the original model no analyticalsolution applied to the van Genuchten equation could be found. However, for
Fig. 7. Left: Schematic diagram of the Parlange hysteresis model [34] with the main wettingcurve MWC, the main drying curve MDC and a primary drying curve PDC with startingpoint; right: Schematic diagram of the Haverkamp et al. hysteresis model [21] with the mainwetting curve MWC, the main drying curve MDC and the primary drying curve PDC.

MAIN DRYING AND WETTING CURVES OF SOILS. . . 21
the construction of the model presented in [6] which will be used to compareresults with and without hysteresis this approach has been used. Therefore, anextension by Haverkamp et al. [21] is introduced here which implies that alldrying and wetting curves (regardless of the scanning order) have the shape ofthe van Genuchten Eq. (3.1) in normalized form
(3.5) θ∗ =θ − θrθS − θr
=
[1 +
(h
hg
)n]−m
,
where the soil pressure head h [L] is taken to be negative and hg denotes thevan Genuchten pressure head scale parameter. Haverkamp et al. state that forlarge negative pressure heads only the product mn is significant. They pointout that for the majority of soils 0 < mn < 1 and call the product the waterretention shape indicator.The above mentioned postulation that all curves are expressed in form of
the van Genuchten function leads to the following equations for the MWC andthe MDC
(3.6)
θ∗mw ≡ θmw
θSmw=
[1 +
(h
hgmw
)nmw]−mmw
,
θ∗md ≡ θmd
θSmd=
[1 +
(h
hgmd
)nmd]−mmd
,
where the subscripts mw and md refer to main wetting and main drying, re-spectively. Differently from the Parlange model these curves possess an inflectionpoint (see Fig. 7 right) and the two main points meet at θSmw = θSmd = θSand θrmw = θrmd = 0. The relations between the specific wetting parametersmmw, nmw and hgmw and the drying parameters mmd, nmd and hgmd are un-known at first but it should be kept in mind that the MWC should not crossthe MDC.According to [21] the differential Eq. (3.4) of Parlange does not permit direct
calculation of a main wetting curve following the van Genuchten form (insteadParlange used the Brooks and Corey water retention function [12] to obtainthe curve illustrated in Fig. 7 left). However, in [21] appropriate conditions arederived for a van Genuchten main wetting curve which approximates the solutionof the differential equation. To provide these conditions first the area under thewater retention curve is chosen since it is directly related to the work done inwetting or drying the soil. Integration of (3.4) gives
(3.7)
∫θpd(h) dh =
∫θmw(h) dh −
∫(h− hstpd) dθmw + c
= 2
∫θmw(h) dh − [h− hstpd]θmw + c,

22 B. ALBERS
where c is a constant of integration, hstpd is the soil water pressure head valueon the main wetting curve at which the primary drying curve departs and pddenotes the primary drying curve. When hstpd = 0, then θ equals θS and theprimary drying curve becomes the main drying curve. Combining Eqs. (3.6) and(3.7)2 results in
(3.8) θS
h∫
0
[1 +
(h
hgmd
)nmd]−mmd
dh
= 2θS
h∫
0
[1 +
(h
hgmw
)nmw]−mmw
dh− θSh
[1 +
(h
hgmw
)nmw]−mmw
.
Obviously, for largeh
hgmwor
h
hgmdthe van Genuchten functions (3.6) behave
as a power function with exponent −mmwnmw or −mmdnmd. On integratingin (3.8) an exponent 1 − mmwnmw or 1 − mmdnmd is obtained. Hence, unlessthe product mmwnmw > 1 (or mmdnmd > 1) the area under the curve becomesinfinite. Since, as mentioned above, for the majority of soils, 0 < mmwnmw ≤ 1(or 0 < mmdnmd ≤ 1), Haverkamp et al. sought for conditions canceling theterms in h. Therefore, for 0 < mmwnmw ≤ 1 and/or 0 < mmdnmd ≤ 1 each term
of (3.8) is expanded about1
h= 0 as follows
(3.9)
[1+
(h
hgmd
)nmd]−mmd
=
(hgmd
h
)mmdnmd
−mmd
(hgmd
h
)(1+mmd)nmd
+... .
Integrating and retaining only the leading terms, (3.8) becomes
(3.10)hgmd
1−mmdnmd
(hgmd
h
)mmdnmd−1
=hgmw
1−mmwnmw
(hgmw
h
)mmwnmw−1
− hgmw
(hgmw
h
)mmwnmw−1
+ ... .
In order to satisfy Eq. (3.10) two conditions are required, namely
(3.11) mmwnmw = mmdnmd and hgmd = hgmw(1 +mmwnmw)1
mmwnmw .
Together with (3.3) it follows from (3.11)1 that
(3.12) mmw = mmd and nmw = nmd.

MAIN DRYING AND WETTING CURVES OF SOILS. . . 23
For mmwnmw ≥ 1 and/or mmdnmd ≥ 1 it has been shown in [21] that (3.11)2simplifies to
(3.13) hgmd = 2hgmw for
{mmwnmw ≥ 1,
mmdnmd ≥ 1.
The above described procedure and, moreover, the prediction of the primarywetting curve (PWC) from measured data has been demonstrated in [21] for22 different soil samples. The soil textures range from sands to clayey loams.For each type the MDC has been fitted to experimental data, the MWC andPWC have been predicted theoretically and the latter curve been compared tomeasured data. In Fig. 8 one example (Del Monte sand, originally presentedin [27]) is picked and the measured data of the MDC, the fitted MDC andthe predicted MWC are reproduced. The resulting curves are used in the nextsection to calculate the wave speeds and attenuations of the four waves occurringin partially saturated soils. The range of the acoustic properties is determinedin calculating them for the limit cases: once the MDC, the other time the MWCis used as the relation between capillary pressure and saturation.
Fig. 8. Left: Main drying curve (MDC) fitted to measured drying data (•) for Del Montesand taken from Liakopoulos 1966 [27]. The main wetting curve (MWC) has been predictedaccording to the procedure presented in Subsec. 3.2. Example taken from [21]; right: MDC andMWC for Del Monte sand transformed into capillary pressure-saturation relationship.

24 B. ALBERS
4. Influence on wave propagation
In the example of Del Monte sand filled by an air-water mixture the influenceof the hysteresis in the capillary pressure curve on the propagation of soundwaves is studied. This soil type has been chosen because the van Genuchtenparameters needed for the prediction of the MWC from the MDC have beenalready determined in [21] and further material parameters necessary for thecalculation of the acoustic properties have been specified in the literature before(e.g. [26]). The material properties of Del Monte sand filled by an air-watermixture are summarized in Table 1. Interestingly, this sand does not possess theabove mentioned property that the water retention shape indicator, the productmn, is less than one. In the present case mn = 2.15. Since the irreduciblesaturation is very small nearly the whole range of saturations 0.01 ≤ S0 ≤ 1 hasbeen studied. By specifying the porosity of Del Monte sand by n0 = 0.2975 in
Table 1. Material properties of Del Monte sand filled by an air-water mixture.
real compressibility grains Ks = 35 GPa
real compressibility fluid Kf = 2.25 GPa
real compressibility gas Ks = 0.101 MPa
Poisson’s ratio ν = 0.4
shear modulus µS = 0.85 GPa
solid grain density ρSR = 2000 kg m−3
fluid density ρFR = 1000 kg m−3
initial porosity n0 = 0.2975
intrinsic permeability k = 4.5 · 10−13 m2
water conductivity K = kρFRg
µw= 4.44 · 10−6 m/s
water resistance πF =n0ρ
FRg
K= 6.573 · 108 kg m−3s−1
air resistance πG = 1.82 · 105 kg m−3s−1
water viscosity µw = 1 · 10−3 Pa s
air viscosity µa = 1.82 · 10−5 Pa s
van Genuchten parametern = 4.150
m = 0.518
hg for drying and wettinghgd = 116.56 cm
hgw = 58.28 cm
α for drying and wettingαd = 8.745 · 10−5 Pa
αw = 1.749 · 10−4 Pa
earth acceleration g = 9.81 m s−2
pressure head h [m H2O] =capillary pressure pc[Pa]ρFR [kg m−3] g [m s−2]
⇒ 1 [cm H2O] = 100 [Pa]
αd/w [Pa] =1
10 g [m s−2] hgd/gw [cm]

MAIN DRYING AND WETTING CURVES OF SOILS. . . 25
[26] it is referred to measurements of Liakopoulos. Therefore this value is alsoused here even if in the literature bigger values between 34.5% and 37% arealso mentioned [22] which in principle sound more realistic for a sand. Also thePoisson ratio of 0.4 seems rather high and the solid grain density of 2000 kg m−3
rather low (compared to pure sand (mS) classified in the German standard DIN4220 and studied in [6]). The rather low value for the water conductivity followsfrom the small value for the porosity. The value of the shear modulus has beenestimated according to experiences gained on the study of some sands in [6].
4.1. Linear model for three-component materials
The linear model for three-component materials with an immiscible mixtureof two pore fluids (F and G) in the voids of a solid material (S) has been intro-duced e.g. in [6]. The fields
{vS ,vF ,vG, eS , εF , εG
}, the velocities of the three
components, the macroscopic deformation tensor eS and the volume changes offluid and gas, respectively, satisfy the following field equations
(4.1)
ρS0∂vS
∂t= div
{λSe1+ 2µSeS +QF εF1+QGεG1
}
+ πFS(vF − vS
)+ πGS
(vG − vS
),
ρF0∂vF
∂t= grad
{ρF0 κ
F εF +QF e+QFGεG}− πFS
(vF − vS
),
ρG0∂vG
∂t= grad
{ρG0 κ
GεG +QGe+QFGεF}− πGS
(vG − vS
),
∂eS
∂t= symgradvS ,
∂εF
∂t= div vF ,
∂εG
∂t= div vG, e ≡ tr eS .
Instead of the partial mass densities of the components, ρS , ρF , ρG, the equationsdepend on the volume changes of the components e, εF , εG for which hold
(4.2) e =ρS0 − ρS
ρS0, εF =
ρF0 − ρF
ρF0, εG =
ρG0 − ρG
ρG0.
Quantities with subindex zero are initial values of the corresponding currentquantity. QF , QG and QFG are coupling parameters between solid-fluid, solid-gas and fluid-gas, respectively. λS and µS are Lame parameters. The compress-ibilities of fluid and gas are denoted by κF and κG.In principle, the porosity n is also a field and satisfies its own balance equa-
tion. However, if we neglect memory effects, the balance equation can be solvedand its consideration is no longer necessary to solve the problem. The current
26 B. ALBERS
saturation of the fluid S is not included in the series of fields. Instead, a consti-tutive law of van Genuchten type will be used for this quantity.Instead of permeabilities resistances of fluid and gas, πFS and πGS, appear
in the model which reflect the resistance of the flow through the channels of theskeleton. These parameters are given by
(4.3) πFS =πF
kf, πGS =
πG
kg.
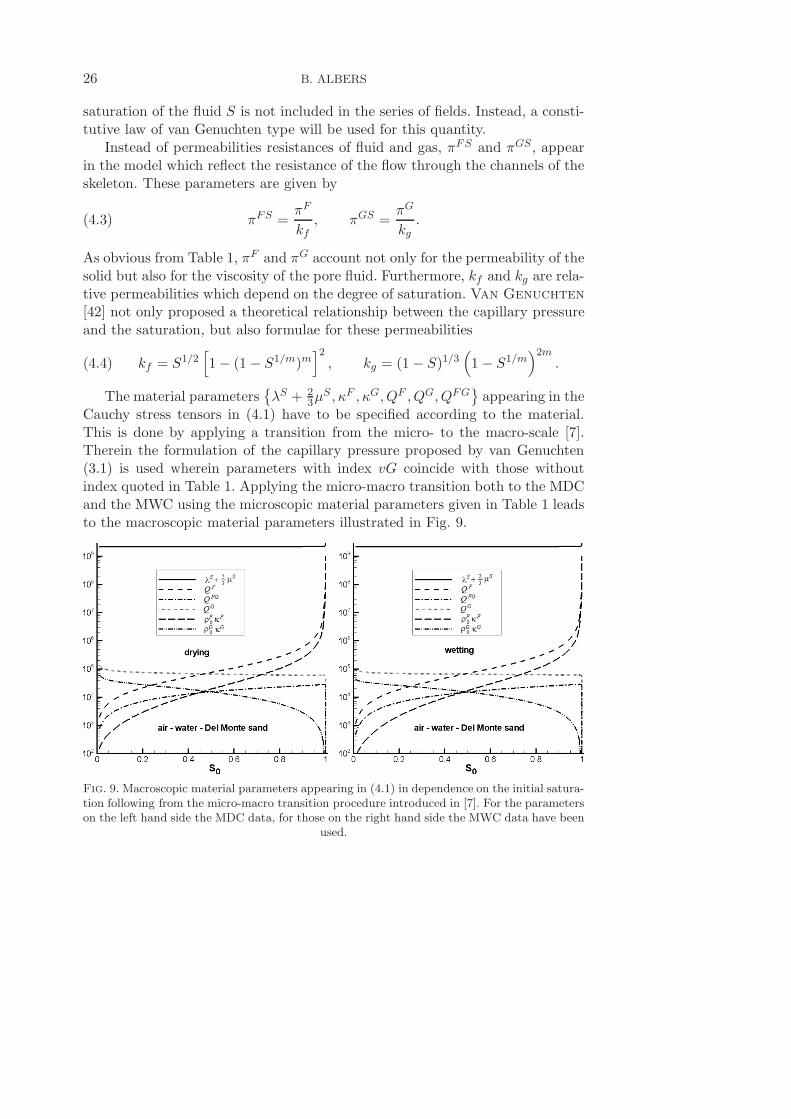
As obvious from Table 1, πF and πG account not only for the permeability of thesolid but also for the viscosity of the pore fluid. Furthermore, kf and kg are rela-tive permeabilities which depend on the degree of saturation. Van Genuchten[42] not only proposed a theoretical relationship between the capillary pressureand the saturation, but also formulae for these permeabilities
(4.4) kf = S1/2[1− (1− S1/m)m
]2, kg = (1− S)1/3
(1− S1/m
)2m.
The material parameters{λS + 2
3µS , κF , κG, QF , QG, QFG
}appearing in the
Cauchy stress tensors in (4.1) have to be specified according to the material.This is done by applying a transition from the micro- to the macro-scale [7].Therein the formulation of the capillary pressure proposed by van Genuchten(3.1) is used wherein parameters with index vG coincide with those withoutindex quoted in Table 1. Applying the micro-macro transition both to the MDCand the MWC using the microscopic material parameters given in Table 1 leadsto the macroscopic material parameters illustrated in Fig. 9.
Fig. 9. Macroscopic material parameters appearing in (4.1) in dependence on the initial satura-tion following from the micro-macro transition procedure introduced in [7]. For the parameterson the left hand side the MDC data, for those on the right hand side the MWC data have been
used.
MAIN DRYING AND WETTING CURVES OF SOILS. . . 27
4.2. Propagation of monochromatic waves
The fields of the model (4.1) are assumed to satisfy the following relations
εF = EFE , εG = EGE , eS = ESE ,
vF = VFE , vG = VGE , vS = VSE ,(4.5)
n− n0 = DE , E : = exp i (k · x− ωt) ,
where ES, EF , EG, VS , VF , VG, D are constant amplitudes, ω is a givenfrequency, k is the, possibly complex, wave vector. This means that k = kn,where k is the complex wave number and n is a unit vector in the direction ofpropagation. Such a solution describes the propagation of plane monochromaticwaves in an infinite medium whose fronts are perpendicular to n.Substitution of the above relations in the field Eqs. (4.1)4 yields the following
compatibility relations
EF = − 1
ωkn ·VF , EG = − 1
ωkn ·VG,
ES = − 1
2ωk(n⊗VS +VS ⊗ n
),(4.6)
i.e. e = − 1
ωkn ·VSE .
Making use of these relations in the remaining field equations leads to the fol-lowing set
(4.7) ω2VS =λS
ρS0k2(VS · n
)n+
µS
ρS0k2((VS · n
)n+VS
)+QF
ρS0k2(VF · n
)n
+QG
ρS0k2(VG · n
)n+ i
πFSω
ρS0
(VF −VS
)+ i
πGSω
ρS0
(VG −VS
)= 0,
(4.8) ω2VF = κF k2(VF · n
)n+
QF
ρF0k2(VS · n
)n
+QFG
ρF0k2(VG · n
)n− i
πFSω
ρF0
(VF −VS
)= 0,
(4.9) ω2VG = κGk2(VG · n
)n+
QG
ρG0k2(VS · n
)n
+QFG
ρG0k2(VF · n
)n− i
πGSω
ρG0
(VG −VS
)= 0.
28 B. ALBERS
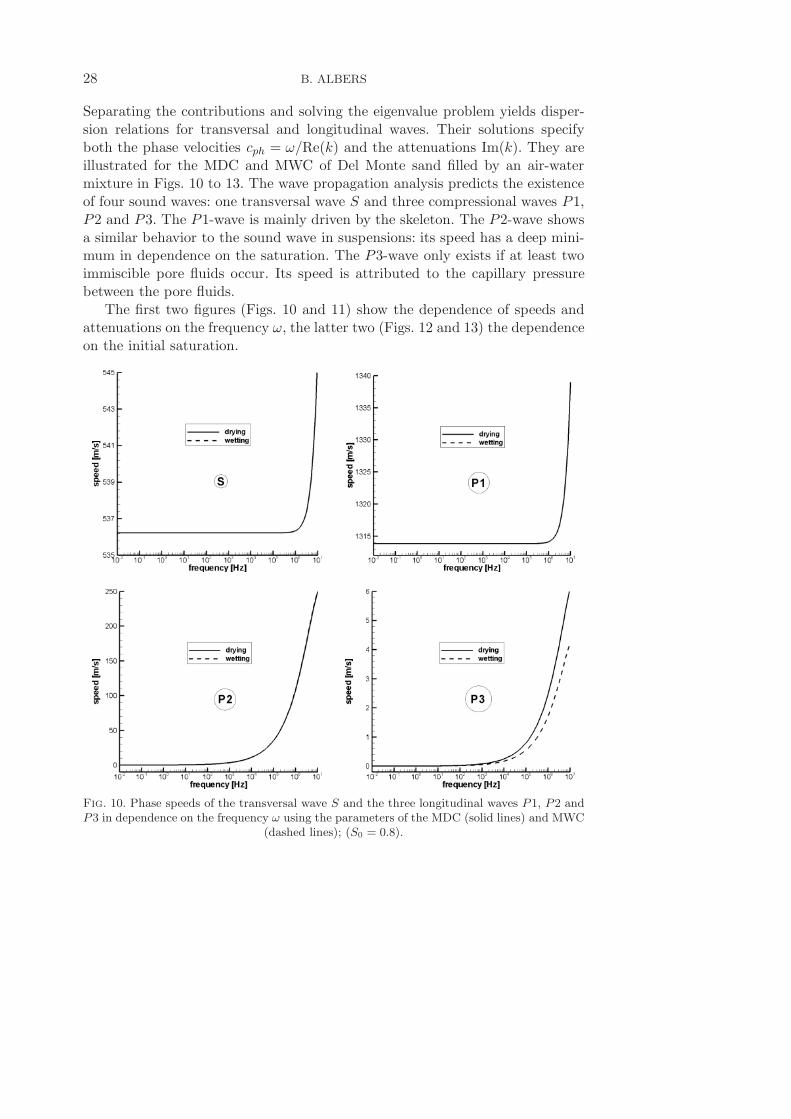
Separating the contributions and solving the eigenvalue problem yields disper-sion relations for transversal and longitudinal waves. Their solutions specifyboth the phase velocities cph = ω/Re(k) and the attenuations Im(k). They areillustrated for the MDC and MWC of Del Monte sand filled by an air-watermixture in Figs. 10 to 13. The wave propagation analysis predicts the existenceof four sound waves: one transversal wave S and three compressional waves P1,P2 and P3. The P1-wave is mainly driven by the skeleton. The P2-wave showsa similar behavior to the sound wave in suspensions: its speed has a deep mini-mum in dependence on the saturation. The P3-wave only exists if at least twoimmiscible pore fluids occur. Its speed is attributed to the capillary pressurebetween the pore fluids.The first two figures (Figs. 10 and 11) show the dependence of speeds and
attenuations on the frequency ω, the latter two (Figs. 12 and 13) the dependenceon the initial saturation.
Fig. 10. Phase speeds of the transversal wave S and the three longitudinal waves P1, P2 andP3 in dependence on the frequency ω using the parameters of the MDC (solid lines) and MWC
(dashed lines); (S0 = 0.8).

MAIN DRYING AND WETTING CURVES OF SOILS. . . 29
Fig. 11. Attenuations of the transversal wave S and the three longitudinal waves P1, P2 andP3 in dependence on the frequency ω using the parameters of the MDC (solid lines) and MWC
(dashed lines); (S0 = 0.8).
4.3. Discussion of results
The results illustrated in Figs. 10 to 13 show that – at least for the exampleof Del Monte sand filled with an air-water mixture – the influence of the hys-teresis is nearly negligible. In the range of frequencies appearing in geophysicalapplications (around 0 to 1000 Hz) all waves behave almost non-dispersively, i.e.their acoustic properties are nearly unaffected of the frequency. From Figs. 10and 11 it is obvious that the phase speeds and the attenuations change only forvery high values of the frequency. For the waves which are mainly driven by thesolid (transversal wave S and the fastest longitudinal wave P1) the frequencyfor which the influence starts lies around 106 Hz, for the waves which reflect theproperties of the pore fluids (P2 and P3) it is around 103 Hz.An influence of the application of drying or wetting data is noticeable only for
the P3 wave. However, this observation most likely does not have any practical
30 B. ALBERS
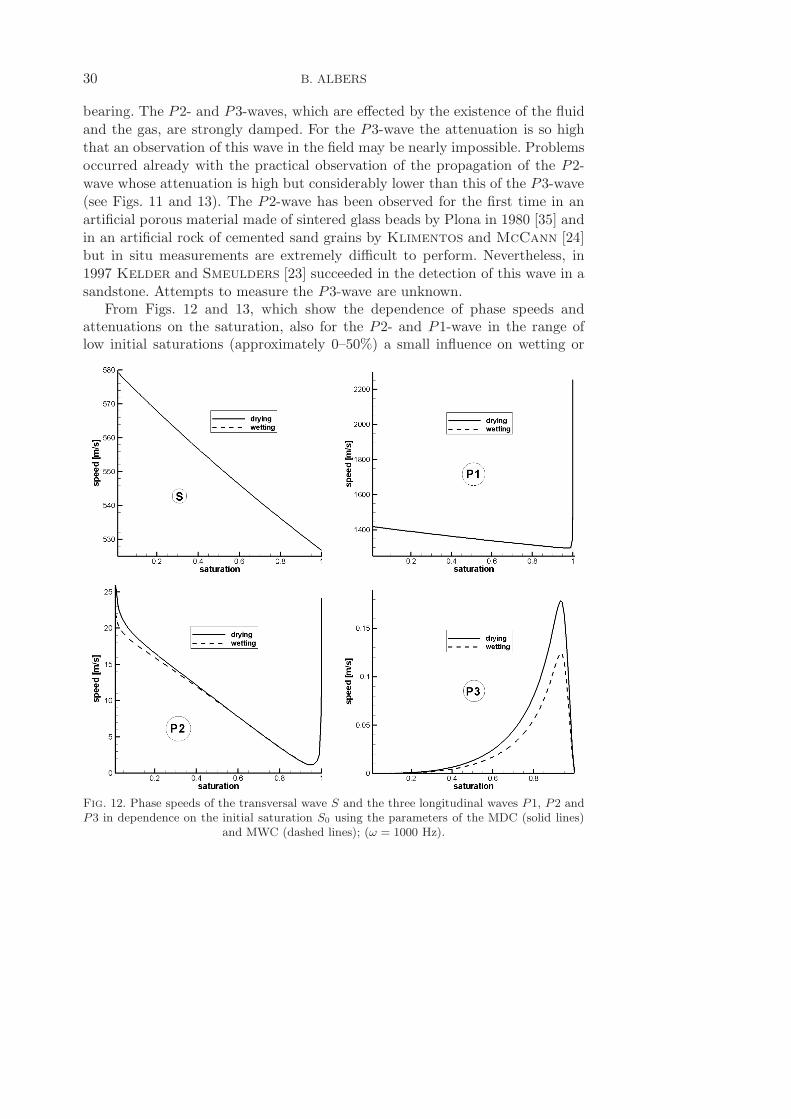
bearing. The P2- and P3-waves, which are effected by the existence of the fluidand the gas, are strongly damped. For the P3-wave the attenuation is so highthat an observation of this wave in the field may be nearly impossible. Problemsoccurred already with the practical observation of the propagation of the P2-wave whose attenuation is high but considerably lower than this of the P3-wave(see Figs. 11 and 13). The P2-wave has been observed for the first time in anartificial porous material made of sintered glass beads by Plona in 1980 [35] andin an artificial rock of cemented sand grains by Klimentos and McCann [24]but in situ measurements are extremely difficult to perform. Nevertheless, in1997 Kelder and Smeulders [23] succeeded in the detection of this wave in asandstone. Attempts to measure the P3-wave are unknown.From Figs. 12 and 13, which show the dependence of phase speeds and
attenuations on the saturation, also for the P2- and P1-wave in the range oflow initial saturations (approximately 0–50%) a small influence on wetting or
Fig. 12. Phase speeds of the transversal wave S and the three longitudinal waves P1, P2 andP3 in dependence on the initial saturation S0 using the parameters of the MDC (solid lines)
and MWC (dashed lines); (ω = 1000 Hz).
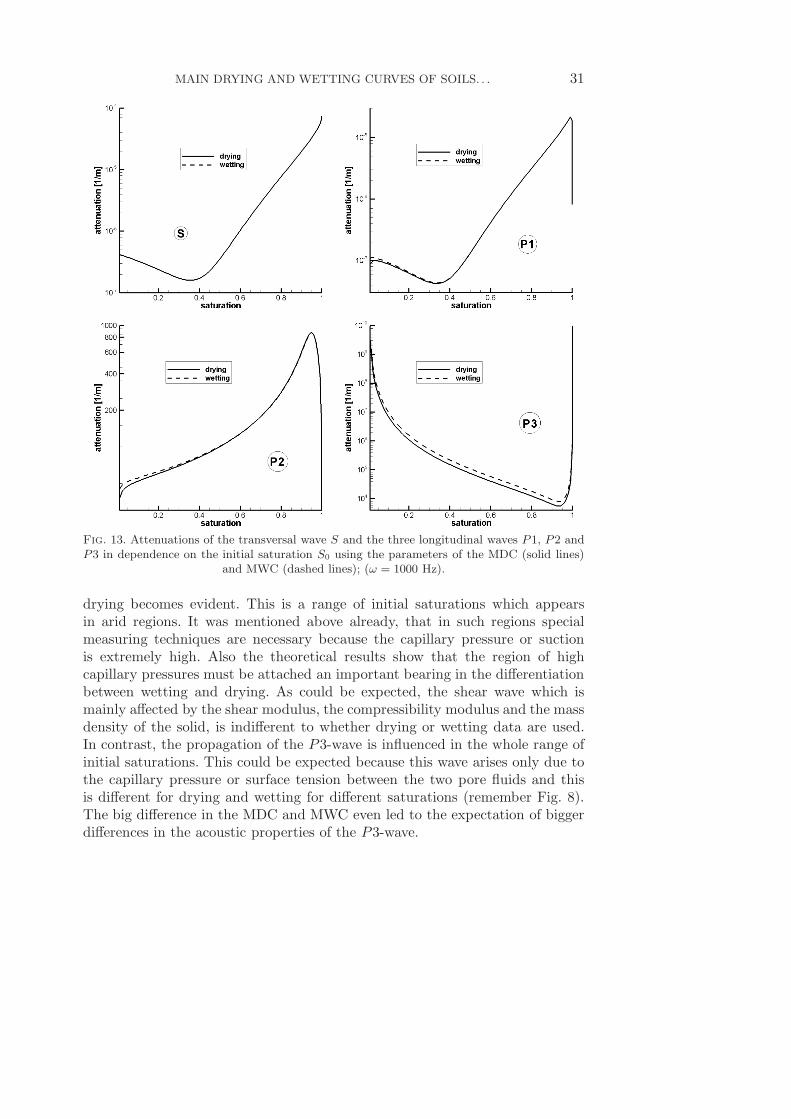
MAIN DRYING AND WETTING CURVES OF SOILS. . . 31
Fig. 13. Attenuations of the transversal wave S and the three longitudinal waves P1, P2 andP3 in dependence on the initial saturation S0 using the parameters of the MDC (solid lines)
and MWC (dashed lines); (ω = 1000 Hz).
drying becomes evident. This is a range of initial saturations which appearsin arid regions. It was mentioned above already, that in such regions specialmeasuring techniques are necessary because the capillary pressure or suctionis extremely high. Also the theoretical results show that the region of highcapillary pressures must be attached an important bearing in the differentiationbetween wetting and drying. As could be expected, the shear wave which ismainly affected by the shear modulus, the compressibility modulus and the massdensity of the solid, is indifferent to whether drying or wetting data are used.In contrast, the propagation of the P3-wave is influenced in the whole range ofinitial saturations. This could be expected because this wave arises only due tothe capillary pressure or surface tension between the two pore fluids and thisis different for drying and wetting for different saturations (remember Fig. 8).The big difference in the MDC and MWC even led to the expectation of biggerdifferences in the acoustic properties of the P3-wave.
32 B. ALBERS
5. Conclusions and outlook
In this work the phenomenon of different drying and wetting curves for thecapillary pressure in partially saturated soils has been brought up. Measurementmethods of the capillary pressure or suction and their ranges of application havebeen shown. The van Genuchten approach for the description of one branch ofthe capillary pressure curve has been highlighted. It is used in the predictionmethod for main drying and main wetting curves (also for further scanningcurves which is not covered in this paper) of Haverkamp et al. which has beenused for the investigation of the influence of the application of drying and wet-ting data on the propagation of sound waves. It has been studied theoreticallyby means of a linear continuum model presented in [6] and numerically exploitedfor the example of Del Monte sand filled by an air-water mixture. Four wavesappear: one transversal wave and three longitudinal waves. For the waves drivenmainly by the skeleton it could be expected that the influence of the hysteresisin the capillary pressure curve is negligible. This is different from the expecta-tions for the pore fluid driven waves. The numerical results exhibit a smallerinfluence than expected. This may have several reasons: firstly, the porosity ofthe studied sand has been chosen rather small – in the literature are also highervalues reported. Secondly, the soil type definitely has an influence. It may be notsufficient to investigate only one soil type. Thirdly, the prediction of the mainwetting curve should be proven by experimental data. In order to clarify whetherany of these causes is responsible for the small influence of the hysteresis on thewave properties, measurements of the main drying and wetting curves of thetwelve soil types studied in [6] have been requested in a laboratory and will beinterpreted theoretically once available. Moreover, the hysteresis phenomenonwill be studied mathematically in closed form by use of an hysteresis operator.
Acknowledgment
Financial support as an Einstein Junior Fellow by the Einstein FoundationBerlin is highly appreciated.
References
1. http://archives.sensorsmag.com/articles/0505/30/main.shtml.
2. http://beesl.syr.edu/ht 1d-sutud-moist-stor.htm.
3. http://www.soilmeasurement.com/tempe.html.
4. Albers B.,On the influence of saturation and frequency on monochromatic plane waves inunsaturated soils, [in:] Coupled site and soil-structure interaction effects with applicationto seismic risk mitigation, T. Schanz and R. Iankov [Eds.], NATO Science Series, SpringerNetherlands, pp. 65–76, 2009.

MAIN DRYING AND WETTING CURVES OF SOILS. . . 33
5. Albers B., Micro-macro transition and linear wave propagation in three-component com-pacted granular materials, [in:] AIP Conference Proceedings of the Joint IUTAM-ISIMMSymposium on Mathematical Modeling and Physical Instances of Granular Flows, J. God-dard and P. Giovine [Eds.], AIP, 2010.
6. Albers B., Modeling and Numerical Analysis of Wave Propagation in Saturated and Par-tially Saturated Porous Media, Veroffentlichungen des Grundbauinstitutes der TechnischenUniversitat Berlin, Habilitation thesis, Shaker Verlag, Aachen, vol. 48, 2010.
7. Albers B., On a micro-macro transition for a poroelastic three-component model, ZAMM,90, 12, 929–943, 2010.
8. Albers B., Linear elastic wave propagation in unsaturated sands, silts, loams and clays,Transport in Porous Media, 86, 537–557, 2011.
9. Albers B.,Modeling the hysteretic behavior of the capillary pressure in partially saturatedporous media – a review, Acta Mech., 225, 2163–2189, 2014.
10. Albrecht B.A., Benson C.H., Beuermann S., Polymer capacitance sensors for mea-suring soil gas humidity in drier soils, J. Geotechnical Testing, 26, 1, 1–9, 2003.
11. Bear J., Bachmat Y., Introduction to Modeling of Transport Phenomena in PorousMedia, Kluwer Academic Publishers, Dordrecht, 1991.
12. Brooks R.H., Corey A.T., Hydraulic properties of porous media, [in:] Hydrology Papers,vol. 3, Colorado State University, Fort Collins, 1964.
13. Buckingham E., Studies on the Movement of Soil Moisture, United States Departmentof Agriculture, Bureau of Soils Bulletin, vol. 38, U. S. Department of Agriculture, 1907.
14. Bulut R., Total and matric suction measurements with the filter paper method,http://www.foundationperformance.org/pastpresentations/FilterPapSuctMeasDemonstrtn.pdf.
15. Campbell-Clause J.M., Using gypsum blocks to measure soil moisture in vineyards,Farmnotes, 3, 1998.
16. Dane J.H., Hopmans J.W., Water retention and storage, Methods of Soil Analysis, 4,671–717, 2002.
17. DIN 4220: Pedologic site assessment – Designation, classification and deduction of soilparameters (normative and nominal scaling), DIN Deutsches Institut fur Normung e.V.,Beuth Verlag GmbH (draft, in German: Bodenkundliche Standortbeurteilung – Kennze-ichnung, Klassifizierung und Ableitung von Bodenkennwerten (normative und nominaleSkalierungen), 2005.
18. Enderby J.A., The domain model of hysteresis, Part 1 – independent domains, Trans.Faraday Soc., 51, 835–848, 1955.
19. Everett D.H., A general approach to hysteresis. Part 3 – a formal treatment of theindependent domain model of hysteresis, Transactions of the Faraday Society, 50, 1077–1096, 1954.
20. Fredlund D.G., Rahardjo H., Soil Mechanics for Unsaturated Soils, John Wiley &Sons, 1993.
21. Haverkamp R., Reggiani P., Ross P.J., Parlange J.-Y., Soil water hysteresis predic-tion model based on theory and geometric scaling, [in:] Environmental Mechanics, Water,Mass and Engergy Transfer in the Biosphere, A. W. P.A.C. Raats, D. Smiles [Eds.], Amer-ican Geophysical Union, pp. 213–246, 2002.
22. Johnson A.I., Morris D.A., Vibratory compaction in the laboratory of granular materi-als in long columns, [in:] Evaluation of relative density and its role in geotechnical projectsinvolving cohesionless soils: a symposium presented at the 75th annual meeting, ASTMSTP 523, American Society for Testing and Materials, 1973.

34 B. ALBERS
23. Kelder O., Smeulders D.M.J., Observation of the Biot slow wave in water-saturatedNivelsteiner sandstone, Geophysics, 62, 6, 1794–1796, 1997.
24. Klimentos T., McCann C., Why is the Biot slow compressional wave not observed inreal rocks?, Geophysics, 53, 12, 1605–1609, 1988.
25. Kool J.B., Parker J.C., Development and evaluation of closed-form expressions forhysteretic soil hydraulic properties, Water Resources Research, 23, 1, 105–114, 1987.
26. Lewis R.W., Schrefler B.A., The finite element method in the static and dynamicdeformation and consolidation of porous media, Wiley, Chichester, 1998.
27. Liakopoulos A.C., Theoretical approach to the solution of the infiltration problem, In-ternational Association of Scientific Hydrology, Bulletin, 11, 1, 69–110, 1966.
28. Lins Y., Hydro-mechanical properties of partially saturated sand, PhD Thesis, Schriften-reihe des Lehrstuhls fur Grundbau, Boden- und Felsmechanik, vol. 42, Ruhr-UniversitatBochum, 2010.
29. Lu N., Likos W., Unsaturated Soil Mechanics, Wiley, Hoboken, New Jersey, 2004.
30. Mualem Y., A conceptual model of hysteresis, Water Resources Research, 10, 514–520,1974.
31. Mualem Y., A new model predicting the hydraulic conductivity of unsaturated porousmedia, Water Resour. Res., 12, 513–522, 1976.
32. Neel L., Theories des lois d’aimanation de Lord Rayleigh, I: Les deplacements d’uneparoi isolee, Cahiers de Physique, 12, 1, 1–20, 1942.
33. Parker J.C., Lenhard R.J., A model for hysteretic constitutive relations governingmultiphase flow, 1. saturation-pressure relations, Water Resources Research, 23, 12, 2187–2196, 1987.
34. Parlange J.-Y., Capillary hysteresis and the relationship between drying and wettingcurves, Water Resources Research, 12, 2, 224–228, 1976.
35. Plona T.J., Observation of a second bulk compressional wave in a porous medium atultrasonic frequencies, Appl. Phys. Lett., 36, 4, 259–261, 1980.
36. Poulovassillis A., Hysteresis of pore water in granular porous bodies, Soil Science, 109,1, 5–12, 1970.
37. Reinson J.R., Fredlund D.G., Wilson G.W.,Unsaturated flow in coarse porous media,Can. Geotech. J., 42, 252–262, 2005.
38. Schanz T., Mikulitsch V., Lins Y., Untersuchungen an teilgesattigten, granularen rei-bungsmaterialien, [in:] 3. Workshop – Teilgesattigte Boden (Bauhaus-Universitat Weimar),pp. 145–159, 2001.
39. Scott P.S., Farquhar G.J., Kouwen N., Hysteretic effects on net infiltration, [in:]Advances in Infiltration, pp. 163–171, 1983.
40. Sheta H., Simulation von Mehrphasenvorgangen in porosen Medien unter Einbeziehungvon Hysterese-Effekten [in German], PhD Thesis, Universitat Stuttgart, 1999.
41. Topp G.C., Soil water hysteresis in silt loam and clay loam soils, Water Resources Re-search, 7, 4, 914–920, 1971.
42. van Genuchten M.T., A closed-form equation for predicting the hydraulic conductivityof unsaturated soils, Soil Sci. Soc. Am. J., 44, 892–898, 1980.