magnetism and granulometry of pleistocene sediments of dhapasi section, kathmandu (nepal):...
TRANSCRIPT
8/8/2019 Magnetism and granulometry of Pleistocene sediments of Dhapasi section, Kathmandu (Nepal): implications for de…
http://slidepdf.com/reader/full/magnetism-and-granulometry-of-pleistocene-sediments-of-dhapasi-section-kathmandu 1/12
*Pitambar Gautam1, Tetsuya Sakai2, Khum Narayan Paudayal3, Sudarshan Bhandari3,
Bulletin of the Department of Geology, Tribhuvan University, Kathmandu, Nepal, Vol. 12, 2009, pp. 17–28
1Creative Research Institution Sousei (CRIS), Hokkaido University, Sapporo, Japan
2 Department of Geoscience, Shimane University, Matsue, Japan
3Central Department of Geology, Tribhuvan University, Kirtipur, Kathmandu, Nepal
42-Gha, Sanepa, Ring Road, Lalitpur, Kathmandu, Nepal
5Center for Applied Geoscience, University of Tuebingen, Tuebingen, Germany
ABSTRACT
*Corresponding author:
E-mail address: [email protected]
INTRODUCTION
The Kathmandu intermontane basin consists of
late Pliocene to Holocene fluvio-lacustrine, fluvial
and fluvio-deltaic sediments resting unconformably
over the Palaeozoic rocks of the Kathmandu Complex
(DMG 1980). Based on earlier mapping (Yoshida
and Igarashi 1984; Yoshida and Gautam 1988), these
sediments were divided into eight units. It is believed
that following the deposition of the Lukundol
Formation of late Pliocene to early Pleistocene age
(Sakai H. et al. 2006; Goddu et al. 2007) throughout
the basin, the Mahabharat range started to experience
accelerated upheaval at ca. 1 Ma, and as a result the
Bulletin of the Department of Geology
Babu Ram Gyawali4, Chinta Mani Gautam4 and Moti Lal Rijal5
Magnetism and granulometry of Pleistocene sediments of
Dhapasi section, Kathmandu (Nepal): implications for
depositional age and paleoenvironment
A 28-m thick exposure of the younger stage deposits of Kathmandu Valley fluvio-deltaic deposits at Dhapasi has been studied
for magnetic susceptibility (MS), remanent magnetization (RM), grain size characteristics of fine-grained sediments, and sedimentary
fabric by anisotropy of magnetic susceptibility (AMS) . In situ volume MS (k; in 10-3 SI) of the natural sediments ranges from0.001 to 0.15, with lower range (<0.02) restricted to quartz-rich coarse sand, whereas the uppermost 20-cm thick section affected
by anthropogenic activity exhibits enhanced range (0.15–2). RM of specimens from some 80 levels reveals predominantly normal
polarity except for a part of ca. 80cm thick sandy silt, located about 6-m above the base, yielding reverse polarity attributed to the
Laschamp Reversal Event/Excursion (LRE) dated in literature at ca. 41 Ka. This inference, along with majority of other 14C data,
lends fur ther support to the aff in i ty of Dhapasi sec t ion to the Gokarna Formation (ca . >45 to 34 Ka) .
Laser granulometry of fine-grained sediments from 76 levels reveals polymodal (2–4 modes) nature. With two prominent modes
corresponding at 7.3 and 57.5 µm, these sediments plot into sandy silt, silt, and silty sand regions. MS correlates positively among
broad grain size classes (i.e., increasing trend from sand through silt to clay). Mainly oblate susceptibility ellipsoids and low
anisotropy degree shown by AMS data suggest a depositional fabric contributed by mainly paramagnetic minerals (e.g.,
phyllosilicates) responsible to low magnitudes of mass-specific MS (5–15 × 10-8 m3kg-1). Magnetic lineations or maximum
susceptibility axes (kmax) are inferred to be predominantly NNW to SSE below ca. 18-m level, but NNE to SSW above. Such
difference points to shift of paleoflow during the sediment deposition, and together with slight differences in grain-size parameters,
in two prominent intervals of prodelta deposits, suggests significant changes in the paleodrainage configuration and source-sink relationship.
8/8/2019 Magnetism and granulometry of Pleistocene sediments of Dhapasi section, Kathmandu (Nepal): implications for de…
http://slidepdf.com/reader/full/magnetism-and-granulometry-of-pleistocene-sediments-of-dhapasi-section-kathmandu 2/12
18
old lake started to shift northwards leading
subsequently to the formation of a series of terrace
deposits found today in the southern part of the
Kathmandu Valley (e.g., Pyanggaon: 1,480–1,520 m,Chapagaon: 1,440–1,460 m, and Boregaon:
1,410–1,430 m; Yoshida and Igarashi 1984). The
upper part of the valley sediments exposed over the
wide area in its central and northern part belong to
the younger stage deposits called as the Gokarna
Formation, Thimi Formation, and Patan Formation
(Yoshida and Igarashi 1984), whose tops are
demarcated by Gokarna (I: 1,380–1,390 m; II:
1,350–1,370m), Thimi (1,330–1,340 m) and Patan
(1,300–1,320 m) terraces (Sakai T. et al. 2006),
assigned loosely between ca. 50 to 10 Ka based ona number of 14C radiometric dates (see Gautam et al.
2001 and references therein).
Detailed analyses of lithofacies, radiocarbon dates
and magnetic polarity data led to revision of the
lithostratigraphic divisions especially in the northern
part of the Kathmandu Basin Group (name proposed
by Sakai H. 2001) into the followings: Dharmasthali
(partly older than 780 Ka, corresponding to the
Tarebhir, the Lukundol and the Itaiti Formations in
southern part of the basin), Kalimati (>10 Ka),
Gokarna (50–34 Ka), Thimi (33–24 Ka), Tokha (19–14Ka), and Patan (14–10 Ka) Formations as shown in
Fig. 1. Only the Kalimati Formation is distributed in
the central basin, and appears to be the distal equivalent
of the others.
This study is a part of an integrated magnetic,
sedimentological and pollen analytical approach to
better constrain the depositional age of the younger
stage deposits, to device the field-based techniques
for lateral correlation, and to decipher the depositional
environment and paleoclimate based on research
concentrated on the northern part of the Kathmanduvalley (e.g., Gautam et al. 2001; Paudayal 2006; Sakai
T. et al. 2006). Facies analysis of the younger stage
deposits led to recognition of 5 distinct groups (I-III:
delta plain; IV: delta front; and V: prodelta) in the
fluvio-lacustrine and deltaic facies given below (Sakai
T. et al. 2006).
I. Fluvial channel fill deposits (cross and parallel-
laminated sandy and lenticular sandy gravel beds;
high-energy environment),
II. Marsh or flood plain deposits (black silt beds
with intercalations of very fine to fine sand layers;
relatively calmer hydraulic environment with
intermittent deposition by low-energy streams),
III. Interdistributary bay deposits (black laminated
or massive, often rich in diatoms and organic material,
silt beds alternating with sand layers; deposition
mainly from suspension with minor role of currents
in crevasse-splay or crevasse-delta setting),
IV. Delta front deposits (sand, sandy gravel, or
alternating sand and sandy silt beds with features
typical to subaqueous deposition in area affected by
wave-generation, and gravity-induced flow regime),
and
V. Prodelta deposits (alternating sand and black silt beds, with or without traceable diatomaceous
interbeds rich in organic material; deposition in open
lake environment with intermittent supply of sand
from traction or as a suspended load from the delta
front).
The Gokarna terraces exhibit no remarkable traces
of gradual fall in lake level such as the record of
gradual decrease in the height of the delta front
deposits. Hence, their formation is attributed to plug
destruction (at the basin outlet in the Bagmati gorge
situated in the south) that led to rapid fall in the lakelevel (Sakai T. et al. 2006). It is likely that Gokarna,
Thimi and Patan terraces with their distinct heights
result from at least 3 consecutive phases of significant
plug destruction at the basin outlet.
DETAILS OF INVESTIGATIONS AND
RESULTS OBTAINED
A ca. 28 m thick exposure of the Gokarna
Formation (below Gokarna II terrace; altitude: ca.
1,358 m) at a scarp at Dhapasi (27°44'50"N and85°19'45"E), situated NE of Basundhara at Ring
Road, was measured in 2006 for this study. Paudayal
(2006) described an earlier exposure comprising
alternating layers of black and grey clay, silt, fine-
to coarse-grained arkosic sand, and gravel, where the
thickness of clay and silt beds ranged from 0.3 to 3
m, and the sand beds, often cross-bedded, were found
to become thicker upward. Pollens extracted from
carbonaceous clay/silt layers were used to suggest
six pollen assemblage zones: GOK-I to GOK-VI,
some of them into several subzones, from bottom to
P. Gautam et al. / Bulletin of the Department of Geology, Vol. 12, 2009, pp. 17–28

8/8/2019 Magnetism and granulometry of Pleistocene sediments of Dhapasi section, Kathmandu (Nepal): implications for de…
http://slidepdf.com/reader/full/magnetism-and-granulometry-of-pleistocene-sediments-of-dhapasi-section-kathmandu 3/12
19
Magnetism and granulometry of Pleistocene sediments of Dhapasi section, Kathmandu (Nepal): implications for depositional age and paleoenvironment
Fig. 1 (a) Index map showing the location of Kathmandu valley in the Nepal Lesser Himalaya. (b) Geological zonation of the
northwestern part of Kathmandu valley characterized by widespread occurrence of the younger stage deposits. Star indicates the
location of the Dhapasi section. (c) The columnar section at Dhapasi outcrop as of March 2009, with identification of fluvial (FL),
delta front (DF), and prodelta (PD) depositional environments. M, S, G in at the base of the lithological column denote mud, sand
and gravel, respectively

8/8/2019 Magnetism and granulometry of Pleistocene sediments of Dhapasi section, Kathmandu (Nepal): implications for de…
http://slidepdf.com/reader/full/magnetism-and-granulometry-of-pleistocene-sediments-of-dhapasi-section-kathmandu 4/12
the top of the section. Those pollen/paleoclimatic
zones have been interpolated to the newly measured
section (Fig. 2, extreme left), which will be used to
present the results of our in situ measurements and
laboratory studies related to magnetism and
granulometry given below.
In situ Magnetic Susceptibility (MS)
Magnetic susceptibility (volume MS; k expressed
hereafter in 10
-3
SI) of the natural sediments was
measured at the outcrop at 0.1 m spacing along the
vertical section using a SM-30 pocket-sized magnetic
susceptibility meter (sensitivity: 1 × 10⁻⁷ SI; operating
frequency: 8 kHz) by ZH Instruments. For natural
section, values of k range between 0.001 and 0.15,
with lower range (<0.02) being restricted to coarse
sand layers that are very rich in quartz (Fig. 2). Within
the 0.2 m thick uppermost sediment interval that
shows traces of anthropogenic activities, k gradually
increases from 0.15 to 2. Besides the spike in MS
20
P. Gautam et al. / Bulletin of the Department of Geology, Vol. 12, 2009, pp. 17–28
Fig. 2 The Dhapasi Section exposed NW of Basundhara, Ring Road. The columns arranged from left to right are as follows: (i)
Lithological variation shown as horizontal bars approximately proportional to grain size accompanied by pollen assemblage data
after Paudayal (2006); intervals of silt around 4.5–6 m and 20–23 m belong to prodelta deposits, whereas the rest belong to fluvial
(e.g., near the top around 26 m) and delta front deposits, as mentioned in column given in Fig. 1; (ii) Magnetic susceptibility (in situ
volume susceptibility); (iii) Magnetic polarity zonation; (iv) Mass-specific susceptibility measured on discrete specimens; (v)-(vii)
selected grain size parameters (median diameter, % clay fraction, and % sand fraction) for samples subjected to laser granulometry.
Note the thin interval marked by reverse polarity labeled LRE. Five specimens from <0.20 m interval collected during two field
campaigns (2006 & 2008) exhibit dual polarity (see Fig. 6). The reverse polarity is attributed to the Laschamp Reversal Event or
Excursion (LRE) dated at ca. 39–45 Ka (Champion et al. 1988) or more narrowly at 41±1 Ka (Lund et al. 2006)

8/8/2019 Magnetism and granulometry of Pleistocene sediments of Dhapasi section, Kathmandu (Nepal): implications for de…
http://slidepdf.com/reader/full/magnetism-and-granulometry-of-pleistocene-sediments-of-dhapasi-section-kathmandu 5/12
21
Magnetism and granulometry of Pleistocene sediments of Dhapasi section, Kathmandu (Nepal): implications for depositional age and paleoenvironment
and 4.5–6 m, however, show significant differences
in the parametric values. The former (upper or younger
interval) is finer (in general, clay: 15%, sand: 20%,
median diameter: 10–30 µm) than the latter (lower or older interval; clay: 7%, sand: 40%, median
diameter: 40–50 µm). Despite relatively higher
fluctuations in the grain size parameters of the
sediments from the flood plain deposits, it is important
to note that parametric values identical to one of these
prodelta intervals are not uncommon implying that
the discrimination of the fine-grained layers in terms
of their affinity to prodelta and flood plain facies
based solely on grain size parameters is not possible.
Relationship between magnetic susceptibility
and the grain-size parameters
In order to examine any correlation between
susceptibility and fine-scale variations in grain size,
all samples analyzed for grain size were measured
for volume susceptibility by AGICO Kappabridge
(KLY-3) and normalized by mass to obtain mass-
specific MS (c, expressed in 10-8 m3kg-1). Although
the results shown in Fig. 2 (left part) reveal inverse
correlation of MS (k) with broad grain size classes
(i.e., increasing trend from sand through silt to clay),
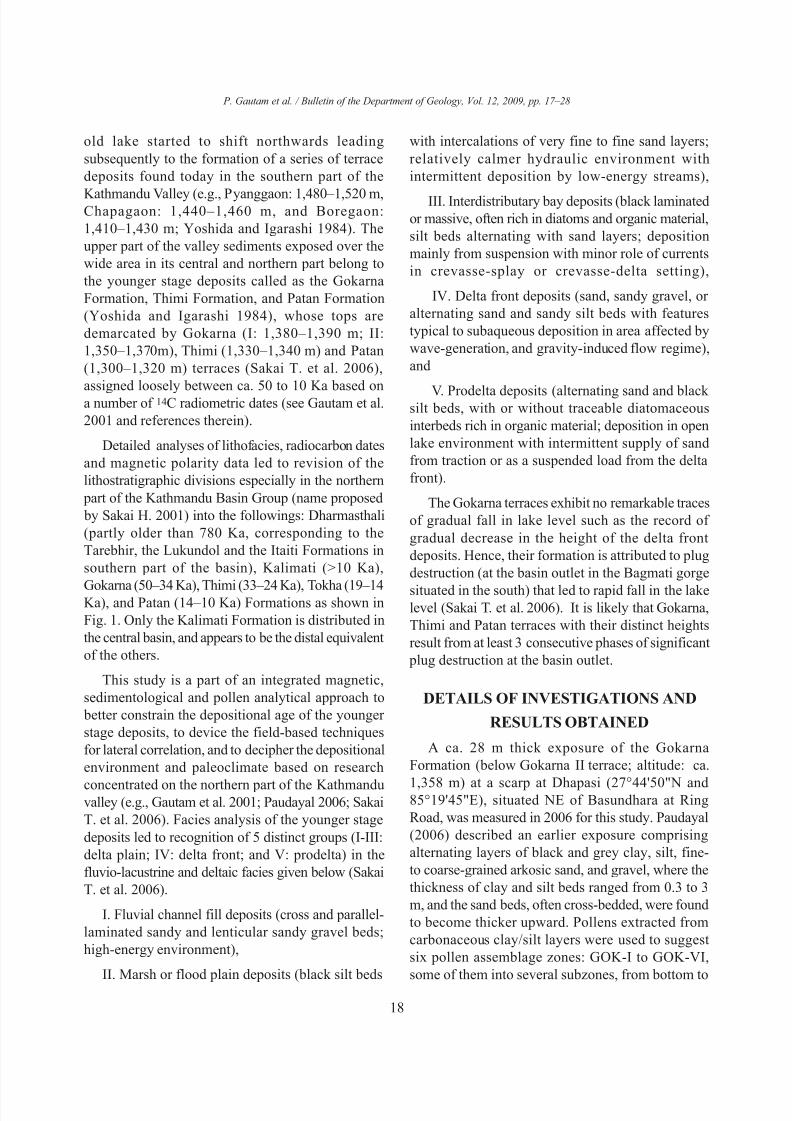
c vs. percent silt fraction implies that such relationshipis not that obvious (Fig. 5).
Magnetic polarity stratigraphy
The age of Gokarna Formation has been inferred
from 14C radiometric dating to vary widely somewhere
between ca. 50 and 34 Ka (see a summary in Gautam
2001, and Table 2 below). In order to constrain the
age, basically by careful analysis for the occurrence
of the Laschamp Reverse Polarity Event or
Geomagnetic Excursion (LRE) within this particular
section, oriented specimens of silt were subjected to
measurement of the magnetic remanence.
Natural remanent magnetization and magnetization
intensity remaining after stepwise alternating field
demagnetization were measured using 2G squid
magnetometers at Tuebingen University and Kochi
Core Center, Japan. After ensuring that an unstable
magnetic component was commonly erased below
20-30 mT, the magnetization direction obtained after
demagnetization at 25 or 30 mT was commonly used
to determine the magnetic polarity. The plots in central
caused by human-induced disturbance, prominent
lithology-dependent variability of MS found to be
inversely proportional to the grain size, makes it
suitable for rapid screening of the vertical sedimentsections and their lithostratigraphic interpretation
especially in terms of broad grain-size classes.
Laser granulometry
Seventy six specimens of fine-grained sediments
spaced mostly 0.1 m apart along the vertical were
measured by Shimadzu Laser Diffraction Particle
Size Analyzer (Model SALD-3000S) at Shimane
University. These sediments constitute relatively thick
prodelta deposits as well as relatively thin layers as
a part of the package of floodplain deposits (cf.
lithological columns in Figs. 1c & 2).
Grain size data were analyzed first using SALD-
3000-WJA2:V1.21 software and then using Blott’s
GRADISTAT v.4 program (Blott and Pye 2001).
Results of analyses are listed in Table 1 and plots of
some selected parameters shown in Fig. 2. Analytical
dataset leads to the following ranges for grain size
parameters for the fine-grained sediments of the
Dhapasi section: (i) median diameter (D50, µm):
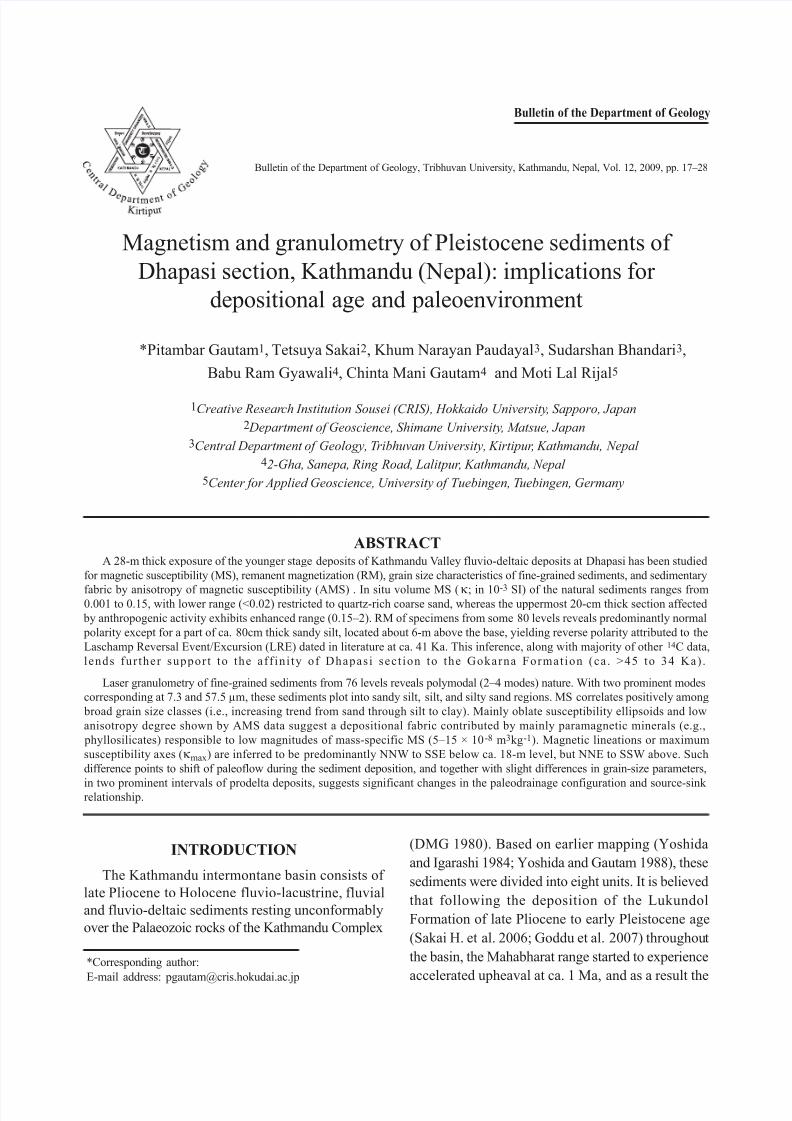
10–60; (ii) clay fraction (%): 5–20 ; (iii) sand fraction(%): 5–40. The gradistat analysis shows the majority
(ca. 70%) of specimens to be polymodal (>3 modes),
with the rest being mostly trimodal with common
modes of 0.45, 7.3 and 57.5 µm. Three representative
specimens, that yield similar results when modeled
for Gaussian lognormal distributions (Fig. 3), confirm
the presence of 3–5 significant modes with distinct
dispersion parameters. In the sand-clay-silt triangular
diagram, the specimens plot predominantly in sandy
silt area, followed by silt except for a few falling into
the silty sand area (Fig. 4.).
The finest fraction (mode = 0.45 µm) contributing
up to <11% of total volume found in many specimens
might be a measurement artifact caused by the lack
of precise adjustment in the diffraction rate and is
not considered further. Neglecting this mode doesn’t
influence the overall interpretation except that the
number of significant modes will be lower (2 to 4).
The prodelta deposits seem to be distinct from others
in that they yield relatively consistent values of the
selected parameters. Their intervals at ca. 20–23 m

8/8/2019 Magnetism and granulometry of Pleistocene sediments of Dhapasi section, Kathmandu (Nepal): implications for de…
http://slidepdf.com/reader/full/magnetism-and-granulometry-of-pleistocene-sediments-of-dhapasi-section-kathmandu 6/12
22
P. Gautam et al. / Bulletin of the Department of Geology, Vol. 12, 2009, pp. 17–28
Table 1: A condensed summary of grain-size analysis using Gradistat v. 4.0 by S. Blott (Blott and Pye 2001) of the fine sediments
of the Dhapasi section. Sample levels (m) correspond to the section in Fig. 2
Sample Level Sample type Sediment name Skewness Kurtosis Mode 1 Mode 2 Mode 3 D50 % Sand % Clay
(m) (µm) (100 - % Mud) (% Mud - % Silt)
d1 3.95 Polymodal, vps vf Sandy vc Silt vfsk Lepto 40.68 0.45 7.26 27.50 20.7% 11.6%d2 4.1 Trimodal, vps vf Sandy c Silt fsk Meso 24.19 7.26 0.45 15.09 11.4% 14.3%
d3 4.2 Polymodal, vps f Sandy c Silt sym Meso 20.34 7.26 0.45 16.86 22.9% 13.6%
d4 4.9 Trimodal, vps vf Sandy vc Silt vfsk Lepto 57.53 0.45 7.26 44.90 39.1% 7.0%
d5 5.35 Trimodal, vps vf Sandy vc Silt fsk Lepto 68.41 0.45 7.26 55.64 46.5% 6.1%
d6 5.45 Polymodal, vps vf Sandy vc Silt vfsk v Lepto 57.53 193.50 0.45 51.23 42.6% 7.6%
d7 5.55 Polymodal, vps vf Sandy c Silt fsk Meso 28.76 0.45 96.75 17.77 19.3% 13.9%
d8 5.65 Polymodal, vps f Sandy vc Silt vfsk Lepto 40.68 162.70 0.45 36.87 34.5% 12.0%
d10 5.75 Polymodal, vps vf Sandy vc Silt vfsk Lepto 115.10 40.68 0.45 29.39 25.7% 11.7%
d11 5.95 Polymodal, vps vf Sandy vc Silt vfsk Lepto 48.38 162.70 0.45 34.56 33.6% 10.3%
d12 6.05 Polymodal, vps vf Sandy vc Silt vfsk v Lepto 57.53 162.70 0.45 51.14 42.6% 7.0%
d13 6.15 Polymodal, vps vf Sandy vc Silt vfsk Lepto 48.38 162.70 0.45 40.18 35.9% 9.0%
d14 6.25 Trimodal, ps vf Sandy c Silt sym Meso 7.26 17.10 5.09 13.92 10.3% 7.1%
d15 6.35 Trimodal, vps c Silt fsk Lepto 20.34 7.26 0.45 12.97 7.4% 14.2%
d16 6.45 Polymodal, vps vc Silty m Sand vfsk Lepto 325.40 48.38 0.45 95.87 58.2% 5.9%
d17 6.5 Polymodal, vps vf Sandy vc Silt fsk Lepto 48.38 193.50 0.45 45.92 40.0% 8.2%
d18 6.9 Bimodal, ps vc Silty c Sand fsk Platy 774.00 81.36 187.10 75.4% 2.5%
d20 7.2 Bimodal, vps vc Silty f Sand vfsk v Lepto 162.70 0.45 108.50 69.5% 5.3%
d21 7.9 Polymodal, vps vf Sandy vc Silt fsk Lepto 40.68 162.70 0.45 31.63 30.0% 9.8%
d22 8 Polymodal, vps vf Sandy c Silt fsk Meso 7.26 17.10 5.09 12.86 10.9% 11.9%
d24 8.2 Polymodal, vps f Sandy vc Silt fsk Meso 34.21 162.70 7.26 25.66 27.8% 10.1%
d25 8.3 Polymodal, vps vf Sandy vc Silt vfsk Lepto 48.38 162.70 0.45 40.03 35.3% 8.5%
d26 8.4 Polymodal, vps f Sandy vc Silt fsk Lepto 162.70 40.68 0.45 39.99 36.3% 9.1%
d27 8.5 Polymodal, vps vf Sandy vc Silt vfsk Lepto 48.38 193.50 0.45 45.74 40.4% 8.8%
d30 9.3 Trimodal, ps vf Sandy vc Silt vfsk v Lepto 40.68 0.45 7.26 29.35 16.6% 7.9%
d32 9.5 Trimodal, ps vf Sandy vc Silt fsk Lepto 57.53 0.45 7.26 54.95 45.0% 5.5%
d34 11.15 Polymodal, vps vf Sandy vc Silt fsk Lepto 57.53 162.70 0.45 56.67 46.7% 5.1%
d35 11.3 Polymodal, vps vf Sandy vc Silt vfsk v Lepto 48.38 162.70 0.45 36.68 26.4% 6.8%
d36 11.45 Trimodal, vps vf Sandy vc Silt fsk v Lepto 48.38 0.45 7.26 52.54 42.9% 5.5%
d37 11.6 Bimodal, ps vc Silty vf Sand fsk Lepto 68.41 0.45 65.27 51.7% 4.7%
d38 16.4 Trimodal, ps vf Sandy vc Silt fsk Lepto 57.53 0.45 7.26 54.23 44.3% 4.1%
d39 16.9 Polymodal, vps vf Sandy vc Silt vfsk Meso 40.68 0.45 7.26 18.05 14.6% 13.8%
d40 17.05 Polymodal, vps c Silt fsk Meso 7.26 0.45 12.09 9.99 8.1% 17.8%
d41 17.2 Polymodal, vps vf Sandy c Silt fsk Lepto 34.21 0.45 7.26 20.15 16.4% 13.4%
d42 17.4 Polymodal, vps vf Sandy vc Silt vfsk Lepto 136.80 48.38 0.45 31.42 29.7% 10.6%
d43 17.5 Trimodal, vps vf Sandy vc Silt vfsk Meso 34.21 0.45 7.26 16.61 10.6% 15.3%
d44 19.05 Polymodal, vps vf Sandy vc Silt vfsk Lepto 40.68 7.26 0.45 22.13 15.8% 11.7%
d45 19.15 Trimodal, ps c Silt sym Meso 7.26 12.09 5.09 11.95 6.3% 8.9%
d47 19.35 Polymodal, vps vf Sandy m Silt fsk Lepto 7.26 12.09 0.45 12.11 10.2% 12.0%
d48 19.45 Trimodal, ps vf Sandy c Silt sym Meso 17.10 7.26 115.10 15.60 12.6% 4.7%d49 19.55 Trimodal, ps c Silt fsk Lepto 17.10 7.26 0.45 11.65 1.5% 11.8%
d50 19.65 Trimodal, ps vf Sandy c Silt sym Meso 17.10 7.26 115.10 17.86 14.4% 4.1%
d51 19.75 Trimodal, ps m Silt fsk Lepto 14.38 7.26 0.45 11.27 3.2% 13.8%
d52 19.85 Trimodal, vps c Silt fsk Lepto 28.76 7.26 0.45 14.67 9.3% 14.1%
d54 20.25 Polymodal, vps c Silt fsk Meso 7.26 14.38 0.45 12.25 9.1% 14.5%
d55 20.35 Polymodal, vps vf Sandy vc Silt vfsk Lepto 34.21 0.45 115.10 26.00 21.0% 12.2%
d56 20.45 Trimodal, vps vf Sandy vc Silt vfsk Lepto 34.21 0.45 7.26 20.50 14.9% 13.0%
d58 20.65 Trimodal, vps vf Sandy vc Silt vfsk v Lepto 48.38 0.45 7.26 32.80 22.1% 8.6%
d59 20.75 Polymodal, vps vf Sandy vc Silt vfsk Lepto 40.68 0.45 7.26 23.96 16.6% 13.0%
d60 20.85 Polymodal, vps m Silt fsk Lepto 7.26 10.17 5.09 10.56 8.4% 13.5%
d61 20.95 Polymodal, ps c Silt sym Meso 7.26 14.38 28.76 12.32 9.3% 10.5%
d62 21.05 Polymodal, vps c Silt fsk Meso 7.26 10.17 24.19 10.81 8.8% 14.9%
d64 21.25 Polymodal, ps m Silt fsk Meso 7.26 10.17 5.09 7.89 1.6% 15.5%
d65 21.35 Trimodal, ps m Silt sym Meso 7.26 10.17 5.09 8.67 0.7% 11.1%
d66 21.45 Polymodal, ps c Silt fsk Meso 7.26 20.34 5.09 11.19 1.7% 10.2%
d67 21.5 Polymodal, vps vf Sandy vc Silt fsk Lepto 40.68 0.45 162.70 27.85 24.9% 11.7%
d68 21.6 Polymodal, vps vf Sandy vc Silt vfsk Lepto 48.38 0.45 7.26 25.97 15.0% 15.0%
d69 21.7 Trimodal, vps vf Sandy vc Silt vfsk Lepto 40.68 0.45 7.26 31.63 23.2% 8.5%
d70 21.8 Polymodal, vps vf Sandy vc Silt vfsk Lepto 115.10 48.38 0.45 34.37 29.9% 14.3%
d71 21.9 Polymodal, vps c Silt fsk Meso 7.26 17.10 0.45 10.33 6.9% 17.1%
d72 22 Polymodal, vps vf Sandy vc Silt vfsk Meso 34.21 0.45 7.26 19.84 12.6% 16.5%
d73 22.1 Polymodal, vps c Silt vfsk Meso 34.21 0.45 7.26 16.06 6.3% 16.1%
d74 22.2 Trimodal, vps vf Sandy vc Silt vfsk Lepto 48.38 0.45 7.26 35.11 26.8% 9.0%
d77 22.5 Polymodal, vps c Silt vfsk Meso 48.38 28.76 0.45 15.15 2.4% 16.9%
d78 22.6 Polymodal, vps vf Sandy c Silt fsk Meso 20.34 0.45 7.26 13.32 11.9% 16.5%
d79 22.7 Polymodal, vps vf Sandy vc Silt vfsk Meso 40.68 115.10 0.45 24.93 22.6% 13.7%
d80 22.8 Polymodal, vps vf Sandy c Silt fsk Lepto 34.21 7.26 0.45 15.43 11.9% 14.5%
d81 22.9 Polymodal, vps m Silt fsk Meso 7.26 12.09 0.45 8.71 0.8% 18.7%
d82 23 Polymodal, vps vf Sandy m Silt fsk Meso 115.10 0.45 7.26 12.18 20.8% 18.4%
d83 23.1 Very Fine vfsk Platy 920.40 970.80
d84 23.2 Polymodal, vps f Sandy c Silt fsk Lepto 34.21 193.50 0.45 26.72 24.9% 10.7%
d85 23.3 Polymodal, vps vf Sandy vc Silt vfsk Lepto 40.68 96.75 0.45 32.64 23.1% 9.3%
d86 23.4 Polymodal, vps f Sandy vc Silt fsk Lepto 48.38 230.10 0.45 55.58 46.4% 8.2%
d88 24.35 Polymodal, vps vf Sandy vc Silt vfsk Lepto 40.68 0.45 136.80 27.69 25.5% 14.6%
d89 24.45 Polymodal, vps vf Sandy vc Silt vfsk Lepto 40.68 0.45 7.26 27.50 20.7% 11.6%
d90 24.55 Trimodal, vps vf Sandy vc Silt vfsk Lepto 40.68 0.45 7.26 26.05 14.0% 12.4%
( Folk & Ward) (µm)
Note: the columns and the abbreviations used in them are as follows.Column 1. d for the sample name stands for Dhapasi - the sampled location.Column 3. ps: poorly sorted; vps:
very poorly sorted, Column 4. f: fine; vf: very fine; m: medium; c:coarse; vc: very coarse,Column 5. sym: symmetric; fsk: finely skewed; vfsk: very finely skewed, Column 6. Lepto:
leptokurtic; Meso: mesokurtic; v: very; Platy: platykurtic
8/8/2019 Magnetism and granulometry of Pleistocene sediments of Dhapasi section, Kathmandu (Nepal): implications for de…
http://slidepdf.com/reader/full/magnetism-and-granulometry-of-pleistocene-sediments-of-dhapasi-section-kathmandu 7/12
23
Magnetism and granulometry of Pleistocene sediments of Dhapasi section, Kathmandu (Nepal): implications for depositional age and paleoenvironment
Fig. 3 Grain size gradient analysis to separate modal fractions. The uppermost graph shows the cumulative grain size distribution
curves for 3 representative specimens. Logarithmic Gaussian distribution functions (Kruiver et al. 2001) model the curves in terms
of 4–5 curves with shown modes (arrows), logarithmic dispersion parameters (in brackets) and contributions (%). The finest mode
seems to be a measurement artifact due to calibration problem and therefore will be ignored in further interpretation
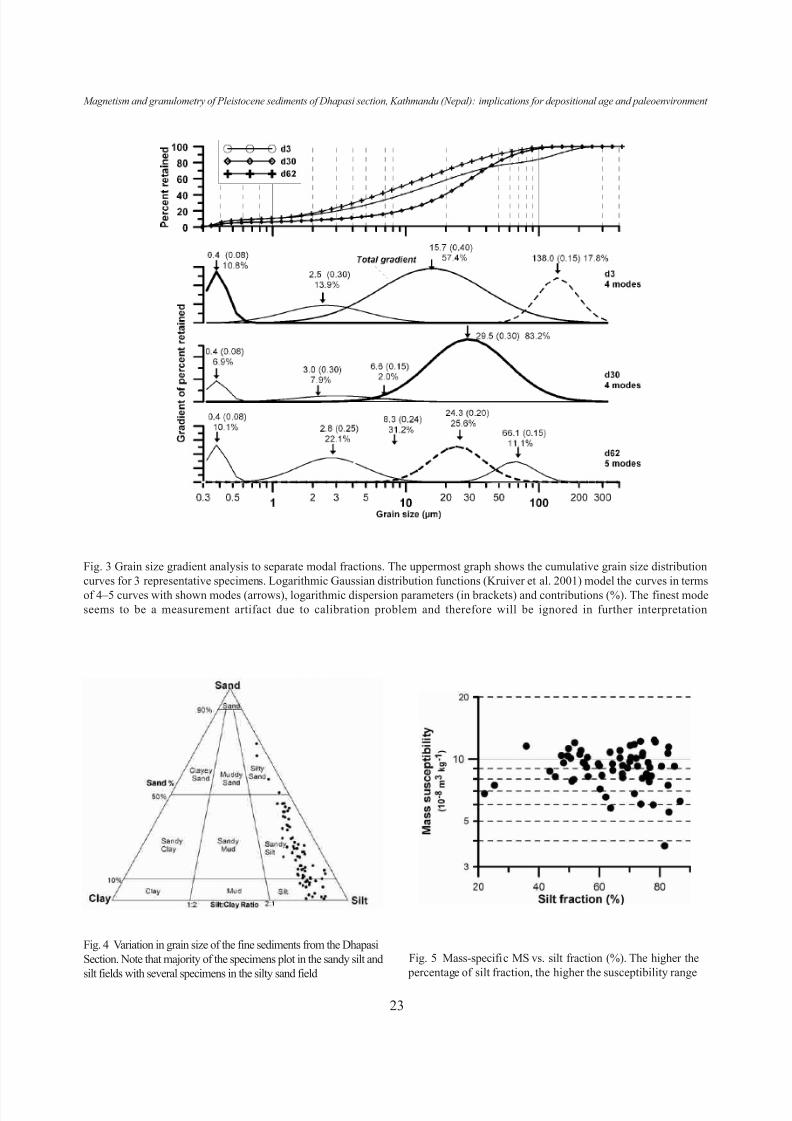
Fig. 5 Mass-specific MS vs. silt fraction (%). The higher the
percentage of silt fraction, the higher the susceptibility range
Fig. 4 Variation in grain size of the fine sediments from the Dhapasi
Section. Note that majority of the specimens plot in the sandy silt and
silt fields with several specimens in the silty sand field

8/8/2019 Magnetism and granulometry of Pleistocene sediments of Dhapasi section, Kathmandu (Nepal): implications for de…
http://slidepdf.com/reader/full/magnetism-and-granulometry-of-pleistocene-sediments-of-dhapasi-section-kathmandu 8/12
24
P. Gautam et al. / Bulletin of the Department of Geology, Vol. 12, 2009, pp. 17–28
part of Fig. 2 show the polarity inferred using the 25
or 30 mT data, except for a very thin interval (ca.
0.25 m, at about 6 m above the base of the measured
section) from which several specimens were found
to exhibit great circle trends indicative of the
composite nature of RM comprising normal (recent
field) and reverse (primary field) polarity directions.
Hence, Dhapasi section was revisited in 2008 to
sample a new exposure near the base.
Resampling was carried out after confirming the
match between the past section and the new exposure
through new in situ MS measurements (compare the
main MS curve with the short MS curve plotted at
its side given in Fig. 2). Analysis to estimate the
reverse polarity direction from the newly acquired
dataset is shown in Fig. 6. The analytical results reveal
the presence of a short reversely magnetized interval
that can be attributed to the Laschamp Reversal Event
Fig. 6 Great circle analysis
to estimate the reverse
polarity remanence. Solid
circle (upper part) is the present day field direction
(D=0º, I=47º) in Kathmandu.
The open circle with
confidence ellipse (lower
part) is the mean estimate
from the intersection of
circles, whereas the squares
are the projections of the
mean estimate in each of the
great circles. Analysis done
using the pmagtool software
from CEMP systems (M.
Hounslow, Liverpool)
Table 2: Some recent radiometric 14C age data for the Gokarna Formation, Kathmandu Valley
Age (years BP)
with error bars
Kapan 44,900 ± 1,100 Sakai et al. (2009), in
prep.
-
Dharmasthali 35,500 ± 500 ,, ,, -
,, ,, 43,300 ± 300 ,, ,, -
,, ,, 44,600 ± 400 ,, ,, -
Kapan 47,600 ± 1,500 ,, ,, Basal part of the section
Mulpani, near Gokarna 34,500 ± 400 ,, ,, Top of the Gokarna Fm.
Gothatar, E of airport 39,200 ± 300 ,, ,, Wood fragment from slump deposit
indicating lake level fall, at alt. 1310 m
Dhapasi >36,100 Paudayal (2006) Ca. 22.3 m below top in the section
mentioned above
49,300±2100/1700
Location/section Author(s) or
Reference
Remarks
Dhapasi Paudayal (2006) 7m below the top (alt. ca. 1,358 m) of
section. See Fig. 2, this paper, for approx.
height

8/8/2019 Magnetism and granulometry of Pleistocene sediments of Dhapasi section, Kathmandu (Nepal): implications for de…
http://slidepdf.com/reader/full/magnetism-and-granulometry-of-pleistocene-sediments-of-dhapasi-section-kathmandu 9/12
25
Magnetism and granulometry of Pleistocene sediments of Dhapasi section, Kathmandu (Nepal): implications for depositional age and paleoenvironment
or geomagnetic excursion (LRE) dated in literature
in between ca. 39 to 45 Ka (Champion et al. 1988)
or more narrowly at 41±1 Ka (Excursion 3b:
Laschamp excursion, recorded from Europe/Arcticand holes 172, 202; Lund et al. 2006).
Magnetic mineralogy
Several specimens were subjected to stepwise
isothermal remanent magnetization (IRM) acquisition
using magnetic pulses of up to 2.5 T. The aim was
to study the saturation remanence characteristics of
the constituent magnetic phases and thereby extract
information on magnetic minerals corresponding to
them. Results for two representative specimens, which
possessed rather strong initial NRM, are presentedin Fig. 7. Gradient analysis of IRM acquisition curves
(corresponding to saturation IRM or SIRM curves as
the samples studied are completely saturated)
following the method of Kruiver (2001) reveals the
main magnetic minerals (median acquisition field
B1/2) as follows: magnetite (1.48 mT), maghemite
(1.95–2.02 mT), hematite (2.80–2.90 mT) and possibly
Fig. 7 Magnetic mineralogy deduced from IRM component analysis. Sample d3 has 3 components (A: magnetite, B:maghemite,
D: hematite), whereas d58 contains additionally pyrrhotite or greigite

8/8/2019 Magnetism and granulometry of Pleistocene sediments of Dhapasi section, Kathmandu (Nepal): implications for de…
http://slidepdf.com/reader/full/magnetism-and-granulometry-of-pleistocene-sediments-of-dhapasi-section-kathmandu 10/12
26
P. Gautam et al. / Bulletin of the Department of Geology, Vol. 12, 2009, pp. 17–28
pyrrhotite or greigite (2.40 mT). Contribution of hard
coercivity mineral (hematite) to total IRM (is 6-8%
meaning that it is probably the major magnetic mineral
in terms of concentration as inferred also from previous magnetic studies of sediments from the
Kathmandu Valley (Gautam et al. 2001).
Anisotropy of the magnetic susceptibility
(AMS) and depositional fabric
AMS measurements were made on fine-grained
sediment specimens already subjected to RM
measurements acquiring a set of susceptibility data
for 15 different positions using the Kappabridge
(AGICO Inc., KLY-3) at Kochi Core Center (for
details of methodology and interpretation, see Gautam
and Rösler 1999; Goddu et al. 2007). The results
reveal a magnetic fabric characterized by magnetic
foliation subparallel to the bedding plane
(paleohorizontal, predominantly oblate susceptibility
ellipsoids (T >0), low absolute susceptibility
magnitudes (ca. 10-4 SI) that collectively point to the
depositional fabric contributed by paramagnetic
minerals (e.g., phyllosilicates) (Fig. 8). Magnetic
lineation, as shown by the maximum susceptibility
axes (kmax), is predominantly from NNW to SSE
(peak trend: Azimuth = 324º, plunge = 15º) below ca
18-m level in the Dhapasi section. Above the 18-mlevel, the magnetic lineation is basically from NNE
to SSW (peak trend: Azimuth = 229º, plunge = 7.3º;
despite the observed slight plunge to SSW the flow
direction is inferred to be from NNE) and thus is
almost perpendicular to that in the lower part (Fig.
9). Such a shift in the lineation trend is likely caused
by differences in paleoflow direction during the
respective sediment deposition intervals implying the
occurrence of a significant change in palaeodrainage
configuration.
DISCUSSION AND CONCLUSION
The fluvio-deltaic sediments of the Kathmandu
Basin group in the Northern part of the Kathmandu
valley exhibit significant variations in MS. For Dhapasi
section represented by the Gokarna Formation, MS
(k; in 10-3 SI) ranges from 0.001 to 0.15 for natural
sediments such that rapid and effective susceptibility
logging of several such sections and their mutual
correlation become possible.
Laser granulometry data reveal polymodal (up to4 modes) of the gain size distribution with 2 significant
modes at 57.5 and 7.3 µm. The fine-grained sediments
belong basically to sandy silt and silt classes in
triangular diagram. Although it is difficult to explain
the polymodal distribution pattern, the plausible
mechanisms are: (i) contribution of mica grains,
which are abundant in the source area lying in the
northern part of the Kathmandu valley; simultaneous
accumulation of rounded fine particles and platy
grains of larger micas lead to multimodal distribution;
(ii) post-depositional mixing of sediments (withdiffering modes) due to biological processes such as
root intrusion, burrowing or dewatering; and (iii)
mixed nature of sediments as a result of accumulation
from multiple and asynchronous flow events. The
fine-grained sediments of the flood plain deposits,
though characterized by much variability of grain-
size parameters compared to the prodelta deposits,
can’t be clearly distinguished from the prodelta
deposits. This is because the latter show distinct
differences at two widely separated levels despite
consistency in grain size parameters in each level.
Fig. 8 Relationship of the mass-specific magnetic susceptibility
and the shape parameter (T) with the degree of anisotropy (PJ,
after Jelinek) for fine-grained sediments from Dhapasi section.
Specimens with higher PJ exhibit larger variation in susceptibility
but more restricted and highly oblate shapes

8/8/2019 Magnetism and granulometry of Pleistocene sediments of Dhapasi section, Kathmandu (Nepal): implications for de…
http://slidepdf.com/reader/full/magnetism-and-granulometry-of-pleistocene-sediments-of-dhapasi-section-kathmandu 11/12
27
Magnetism and granulometry of Pleistocene sediments of Dhapasi section, Kathmandu (Nepal): implications for depositional age and paleoenvironment
The absence of distinct differences is due probably
to the same sediment transport mode (i.e. suspension) by flood flow to the flood plain and prodelta regimes.
Magnetic lineations suggest differences in the
paleocurrent directions below and above ca. 18 m of
the Dhapasi section. This phenomenon and the
differences in grain-size parameters of prodelta
deposits at two levels (falling below and above ca.
18 m) may be genetically related. These changes
probably reflect the differences in the age-dependent
paleodrainage configurations and source-sink variables
(composition, distance of transport, etc.).
Measurements of the magnetic remanence for
Dhapasi section reveal mostly normal polarity with
an exception of the presence of a short interval (ca.
0.25 m thick, within the ca. 0.80 m thick silt near the base) that can be attributed to Laschamp Reversal
Event or Excursion (LRE) dated variably between
39 and 45 Ka. This new reverse polarity finding along
with recent 14C dates lend further support to validity
of >45–34 Ka age range for, and the affinity of the
Dhapasi section to the Gokarna Formation.
ACKNOWLEDGEMENTS
This research was funded through a JSPS Grant-
in-aid for scientific research (kiban kenkyú C, No.
17540427) led by PG and the manuscript was
completed during his affiliation to Hokkaido
University Museum as a Research Fellow. Critical
comments by Naresh K. Tamrakar helped improve
the manuscript. The authors gratefully acknowledge
the use of the magnetic measurements facilities at
Kochi Core Center (Japan) and the University of
Tuebingen (Germany), and also the sedimentological
laboratory of Shimane University (Japan) for laser
granulometry measurements.
REFERENCES
Blott, S. J. and Pye, K., 2001. GRADISTAT: A grain size
distribution and statistics package for the analysis of
unconsolidated sediments. Earth Surf. Process.
Landforms, v. 26, pp. 1237–1248. doi:10.1002/esp.261
Champion, D. E., Lanphere, M. A. and Kuntz, M. A., 1988.
Evidence for a new geomagnetic reversal from lava
flows in Idaho: Discussion of short polarity reversals
in the Brunhes and Late Matuyama polarity chrons. J.
Geophys. Res. , v. 93, pp. 11667–11680.
doi:10.1029/JB093iB10p11667
Department of Mines and Geology (DMG), Nepal, 1980.Geological Map of Kathmandu Area and Central
Mahabharat Range, 1:250 000 (compiled by J. Stöcklin,
K. D. Bhattarai, and others). Ministry of Industry and
Commerce, Kathmandu, Nepal.
Gautam, P., Hosoi, A., Sakai, T. and Arita, K., 2001.
Magnetostratigraphic evidence for the occurrence of
pre-Brunhes (>780 kyr) sediments in the northwestern
part of the Kathmandu Valley, Nepal. Jour. Nepal Geol.
Soc., v. 25, pp. 99–109.
Gautam, P. and Rösler, W., 1999. Depositional chronology
and fabric of Siwalik Group sediments in central Nepal
from magnetostratigraphy and magnetic anisotropy. In
Fig. 9 Change in azimuth of magnetic lineation (declination of
maximum susceptibility) versus stratigraphic height for Dhapasi
section (left) and stereograms showing the downward pointing
directions in lower-hemisphere (right). The azimuth remains
essentially NW–SE below ca. 18 m but above that changes to
predominantly N–S to NNE–SSW. The magnetic lineation is
equated to the paleocurrent direction during the sediment
deposition.

8/8/2019 Magnetism and granulometry of Pleistocene sediments of Dhapasi section, Kathmandu (Nepal): implications for de…
http://slidepdf.com/reader/full/magnetism-and-granulometry-of-pleistocene-sediments-of-dhapasi-section-kathmandu 12/12
28
P. Gautam et al. / Bulletin of the Department of Geology, Vol. 12, 2009, pp. 17–28
Geology of the Nepal Himalaya: Recent Advances (P.
LeFort and B. N. Upreti, eds). J. Asian Earth Sci., v.
17, pp. 659–682.
Goddu, S. R., Appel, E., Gautam, P., Oches, E. A. andWehland, F., 2007. The lacustrine section at Lukundol,
Kathmandu basin, Nepal: Dating and magnetic fabric
aspects. J. Asian Earth Sci., v. 30, no.1, pp. 73-81.
doi:10.1016/j.jseaes.2006.07.009
Kruiver, P. P., Dekkers, M. J., and Heslop, D., 2001.
Quantification of magnetic coercivity components by
the analysis of acquisition curves of isothermal remanent
magnetization. Earth Planet. Sci. Lett., v. 189, pp.
269–276. doi:10.1016/S0012-821X(01)00367-3
Lund, S., Stoner, J. S., Channell, J. E. T., and Acton, G.,
2006. A summary of Brunhes paleomagnetic field
variability recorded in Ocean Drilling Program cores.Phys. Earth and Planetary Int., v. 156, pp. 194–204.
doi:10.1016/j.pepi.2005.10.009
Paudayal, K. N., 2006. Late Pleistocene pollen assemblages
from Gokarna Formation (Dhapasi section) in
Kathmandu valley, Nepal. Jour. Nepal Geol. Soc., v.
33, pp. 33–38.
Sakai, H., 2001. Stratigraphic division and sedimentary
facies of the Kathmandu Basin Group, central Nepal.
Jour. Nepal Geol. Soc., v. 25, pp. 19–32.
Sakai H., Sakai H., Wataru Y., Fujii, R., Hayashi, T., and
Upreti B. N., 2006. Pleistocene rapid uplift of the
Himalayan frontal ranges recorded in the Kathmandu
a n d S i w a l i k b a s i n s . P a l a e o g e o g r a p h y ,
Palaeoclimatology, Palaeoecology, v. 241, pp. 16–27.
doi:10.1016/j.palaeo.2006.06.017
Sakai, T., Takagawa, T., Gajurel, A.P., Tabata, H., Ooi N.,
and Upreti, B.N., 2006. Discovery of sediments
indicating rapid lake-level fall in the Late Pleistocene
Gokarna Formation, Kathmandu Valley, Nepal:
Implication for lake terrace formation. Daiyonki
Kenkyuu (The Quaternary Research), v. 45, no.2,
99–112. doi:10.4116/jaqua.45.99
Yoshida, M. and Gautam, P., 1988. Magnetostratigraphyof Plio-Pleistocene Lacustrine Deposits in the
Kathmandu Valley, Central Nepal. Proc. Indian National
Sci. Acad., A, v. 54, no.3, pp. 410–417.
Yoshida, M. and Igarashi, Y., 1984. Neogene to Quaternary
Lacustrine Sediments in the Kathmandu Valley, Nepal.
Jour. Nepal Geol. Soc., v. 4 (Sp. Issue), pp. 73–100.