magnetic resonance imaging of the normal equine larynx … · (g) cricothyroideus m. and submucosa;...
TRANSCRIPT
Magnetic Resonance Imaging of the Normal Equine Larynx
by
Cortney Erik Henderson, DVM
Thesis submitted to the faculty of Virginia Polytechnic Institute and State University in partial
fulfillment of the requirements for the degree of
Master of Science
In
Biomedical and Veterinary Sciences
Kenneth E. Sullins, Chairman
Nathaniel A. White II
Jill McCutcheon
C. Douglas Phillips
June 22, 2006
Leesburg, Virginia Keywords: magnetic resonance imaging, MRI, larynx, horse, respiratory
Copyright 2006, Cortney Erik Henderson

Magnetic Resonance Imaging of the Normal Equine Larynx
by
Cortney Erik Henderson, DVM Committee Chairman: Kenneth E. Sullins, DVM, MS
Diplomate American College of Veterinary Surgeons Professor of Equine Surgery
(ABSTRACT)
A study was performed to establish the appearance of normal equine laryngeal cartilages
using magnetic resonance imaging. Specimens were acquired from clinically normal horses that
were euthanized for reasons other than respiratory disease. Three in situ and 5 ex vivo larynges
were imaged using a 0.3 Tesla system. Images were obtained in the transverse plane using T1-
weighted 3D spin echo, T2-weighted 3D spin echo, T2-weighted gradient echo, short tau
inversion recovery (STIR), and proton density spin echo sequences. Five ex vivo larynges were
also imaged in the transverse plane using a 1.5 Tesla system, sequences included T1-weighted
3D spin echo, T2-weighted 3D turbo-spin echo, turbo inversion recovery (TIRM), and proton
density spin echo sequences. A frozen gross laryngeal specimen was sliced in 5-mm transverse
sections for comparison to the MR images. Excellent correlation was found between MR images
and the gross transverse sections. Successful imaging was accomplished using both imaging
systems; however, the 1.5 Tesla system yielded superior image resolution. The 0.3 Tesla
imaging system would accommodate the intact equine head, which was not possible using the
1.5 Tesla MRI system. The internal morphology of the laryngeal cartilages was clearly
identified in all imaging sequences obtained. Cartilages were found to differ in signal intensity
iii
based on the tissue composition and imaging sequences performed. MRI was determined to be a
useful imaging modality for evaluating the cartilage morphology of the equine larynx. Further
investigation is required to document pathologic morphology.

iv
GRANT INFORMATION
This research effort was funded by the Patricia Bonsall Stuart Equine Research Award.
v
DEDICATED TO Cara Henderson My wife, who has provided never-ending support throughout our marriage and my career. Eddie and Sandy Henderson My father and mother, who gave me the opportunity to pursue my interest in veterinary medicine.

vi
ACKNOWLEDGEMENTS Kenneth E. Sullins – my research advisor, for his help and guidance with the MRI research
study, assorted publications and the masters program. Nathaniel A. White – for help and guidance through the residency program. Jill McCutcheon – for guidance through the masters program and with thesis preparation requirements. C. Douglas Phillips – for guidance and imaging feasibility for the masters research project. Carolyn Smith - for MRI technical assistance. John Christopher - for MRI technical assistance.

vii
TABLE OF CONTENTS
1. LIST OF FIGURES…………………………………………………………………..…viii 2. LIST OF ABBREVIATIONS…………………………………………………………...xii
3. INTRODUCTION…………………………………………………………………….......1
4. LITERATURE REVIEW
A. The Development of MRI…………………..……………………………………..3 B. Basic Physics and Principles of MRI………………………………………….…..4
C. Equine Laryngeal Anatomy…………………………………………………..…...9
D. MRI of the Human Larynx………………………………………………………11
E. MRI of the Larynx in Veterinary Medicine……………………...……………....17
F. Equine Laryngeal Pathology …………………………………..……...…………18
G. References Cited………………………………………………………………....21
5. MAGNETIC RESONANCE IMAGING OF THE NORMAL EQUINE LARYNX
A. Abstract………………………………………………………………………..…26 B. Introduction………………………………………………………………………28
C. Materials and Methods………………………………………………………...…31
D. Results……………………………………………………………………………34
E. Discussion……………………………………………………………………..…38
F. References……………………………………………………………………..…44
G. List of Figures……………………………………………………………………46
6. CONCLUSION……………………………………………………………………..……59

viii
LIST OF FIGURES Page
Figure 1: 1.5 Tesla MRI T1-weighted 3D spin echo transverse image through the 50
caudal larynx at the level of the cricoid and thyroid cartilages of an ex vivo specimen:
(a) Cricoid cartilage, dorsal spine; (b) Cricoid cartilage, ventral lamina; (c) Laryngeal
cavity; (d) Laryngeal mucosa; (e) Thyroid cartilage lamina; (f) Esophagus;
(g) Cricothyroideus m. and submucosa; (h) Sternohyoideus m.
Figure 2: 0.3 Tesla MRI T2-weighted 3D spin echo transverse image through the 50
caudal larynx at the level of the cricoid and thyroid cartilage of an ex vivo specimen:
(a) Cricoid cartilage, dorsal spine; (b) Cricoid cartilage, ventral lamina; (c) Laryngeal
cavity; (d) Laryngeal mucosa; (e) Thyroid cartilage lamina; (f) Esophagus;
(g) Cricothyroideus m. and submucosa.
Figure 3: 1.5 Tesla MRI T2-weighted turbo-spin echo transverse image through the 51
caudal larynx at the level of the cricoid and thyroid cartilage of an ex vivo specimen:
(a) Cricoid cartilage, dorsal spine; (b) Cricoid cartilage, ventral lamina; (c) Laryngeal
cavity; (d) Laryngeal mucosa; (e) Thyroid cartilage lamina; (f) Esophagus;
(g) Cricothyroideus m. and submucosa; (h) Sternohyoideus m.
Figure 4: Gross anatomic specimen through the cricoid cartilage of the caudal larynx: 51
(a) Cricoid cartilage, dorsal spine; (b) Cricoid cartilage, ventral lamina; (c) Laryngeal
cavity; (d) Laryngeal mucosa; (e) Thyroid cartilage lamina; (f) Esophagus;
(g) Cricothyroideus m.
ix
Page
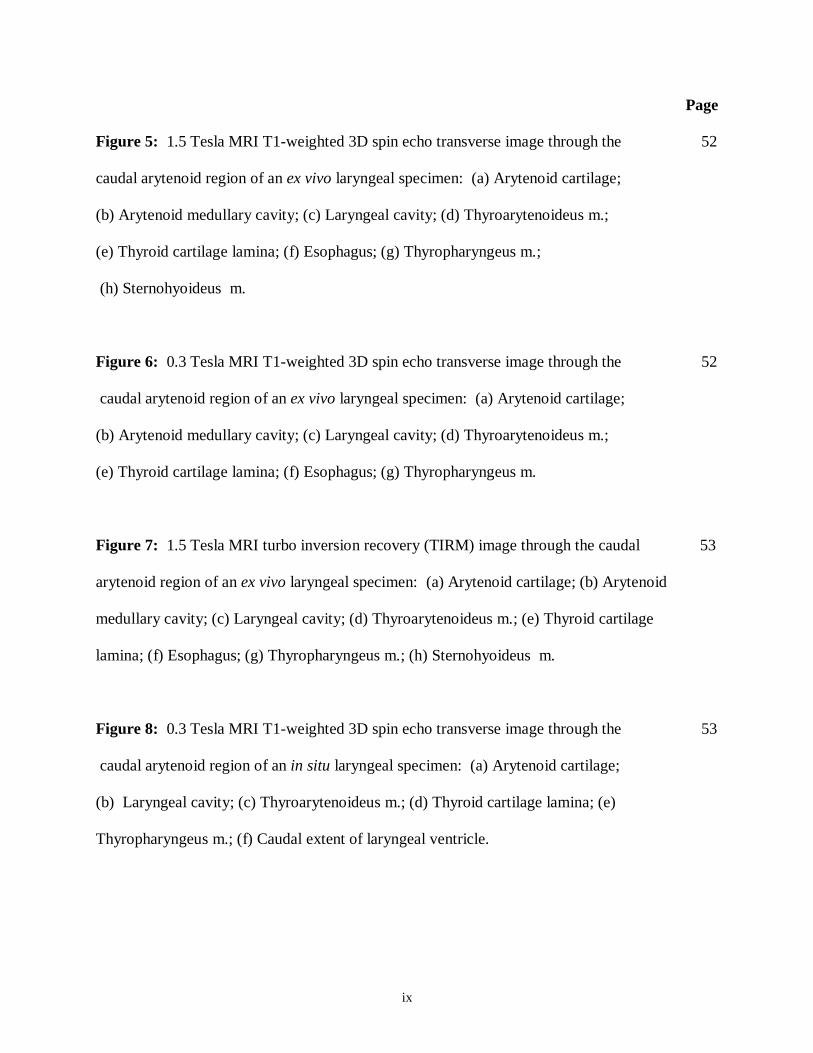
Figure 5: 1.5 Tesla MRI T1-weighted 3D spin echo transverse image through the 52
caudal arytenoid region of an ex vivo laryngeal specimen: (a) Arytenoid cartilage;
(b) Arytenoid medullary cavity; (c) Laryngeal cavity; (d) Thyroarytenoideus m.;
(e) Thyroid cartilage lamina; (f) Esophagus; (g) Thyropharyngeus m.;
(h) Sternohyoideus m.
Figure 6: 0.3 Tesla MRI T1-weighted 3D spin echo transverse image through the 52
caudal arytenoid region of an ex vivo laryngeal specimen: (a) Arytenoid cartilage;
(b) Arytenoid medullary cavity; (c) Laryngeal cavity; (d) Thyroarytenoideus m.;
(e) Thyroid cartilage lamina; (f) Esophagus; (g) Thyropharyngeus m.
Figure 7: 1.5 Tesla MRI turbo inversion recovery (TIRM) image through the caudal 53
arytenoid region of an ex vivo laryngeal specimen: (a) Arytenoid cartilage; (b) Arytenoid
medullary cavity; (c) Laryngeal cavity; (d) Thyroarytenoideus m.; (e) Thyroid cartilage
lamina; (f) Esophagus; (g) Thyropharyngeus m.; (h) Sternohyoideus m.
Figure 8: 0.3 Tesla MRI T1-weighted 3D spin echo transverse image through the 53
caudal arytenoid region of an in situ laryngeal specimen: (a) Arytenoid cartilage;
(b) Laryngeal cavity; (c) Thyroarytenoideus m.; (d) Thyroid cartilage lamina; (e)
Thyropharyngeus m.; (f) Caudal extent of laryngeal ventricle.

x
Page
Figure 9: Gross anatomic laryngeal specimen through the caudal arytenoid region: 54
(a) Arytenoid cartilage; (b) Arytenoid medullary cavity; (c) Laryngeal cavity; (d)
Thyroarytenoideus m.; (e) Thyroid cartilage lamina; (f) Esophagus.
Figure 10: 1.5 Tesla MRI T1-weighted 3D spin echo transverse image through the 54
central portion of an ex vivo larynx in the area of the ventricles: (a) Arytenoid cartilage;
(b) Laryngeal cavity; (c) Laryngeal ventricle; (d) Thyroid cartilage lamina; (e) Vocal
fold; (f) Thyropharyngeus m.; (g) Sternohyoideus m.
Figure 11: 1.5 Tesla MRI T2-weighted turbo-spin echo transverse image through the 55
central portion of an ex vivo larynx in the area of the ventricles: (a) Arytenoid cartilage;
(b) Laryngeal cavity; (c) Laryngeal ventricle; (d) Thyroid cartilage lamina; (e) Vocal
fold; (f) Thyropharyngeus m.; (g) Sternohyoideus m.
Figure 12: Gross anatomic specimen through the central portion of the larynx in the 55
area of the ventricles: (a) Arytenoid cartilage; (b) Laryngeal cavity; (c) Thyroid
cartilage lamina; (d) Vocal fold; (e) Esophagus; (f) Thyroarytenoideus m.
Figure 13: 0.3 Tesla MRI T1-weighted 3D spin echo transverse image through the 56
central portion of an ex vivo larynx in the area of the ventricles: (a) Arytenoid
cartilage; (b) Laryngeal cavity; (c) Laryngeal ventricle; (d) Thyroid cartilage lamina;
(e) Vocal fold.
xi
Page
Figure 14: 0.3 Tesla MRI T1-weighted 3D spin echo transverse image through the 56
central portion of an in situ larynx in the area of the ventricles: (a) Arytenoid
cartilage; (b) Laryngeal cavity; (c) Laryngeal ventricle; (d) Thyroid cartilage lamina;
(e) Vocal fold.
Figure 15: 1.5 Tesla MRI T1-weighted 3D spin echo transverse image through the 57
rostral portion of an ex vivo larynx at the corniculate processes: (a) Corniculate
process of the arytenoid cartilage; (b) Laryngeal cavity; (c) Thyroid cartilage lamina;
(d) Hyopharyngeus m.; (e) Sternohyoideus m.
Figure 16: 0.3 Tesla MRI proton density image through the rostral portion of an ex vivo 57
larynx at the corniculate processes: (a) Corniculate process of the arytenoid cartilage;
(b) Laryngeal cavity; (c) Thyroid cartilage lamina; (d) Hyopharyngeus m.
Figure 17: 1.5 Tesla MRI inversion recovery (TIRM) transverse image through the 58
rostral portion of an ex vivo larynx at the corniculate processes: (a) Corniculate process
of the arytenoid cartilage; (b) Laryngeal cavity; (c) Thyroid cartilage lamina;
(d) Sternohyoideus m.
Figure 18: Gross anatomic laryngeal specimen through the rostral portion of the larynx 58
at the corniculate processes: (a) Corniculate process of the arytenoid cartilage;
(b) Laryngeal cavity; (c) Thyroid cartilage lamina; (d) Hyopharyngeus m.

xii
LIST OF ABBREVIATIONS
MRI = magnetic resonance imaging
MR = magnetic resonance
TIRM = turbo inversion recovery
IR = inversion recovery
mm = millimeter
RF = radio-frequency
TR = repetition time
TE = echo time
STIR = short tau inversion recovery
CT = computed tomography
3D = three dimensional
ms = millisecond
cm = centimeter

1
INTRODUCTION
Disease of the equine larynx limits performance by causing exercise intolerance and abnormal
upper respiratory noise. Traditional evaluation of the equine larynx is based on physical
examination, upper airway endoscopy, and radiography. While these diagnostic tools contribute
to the diagnosis of certain laryngeal disorders, the majority of the structure of the laryngeal
cartilages cannot be thoroughly evaluated.
Arytenoid chondritis is an acute or chronic, often progressive, bacterial infection that results in
thickening of the arytenoid cartilage and airway obstruction. Affected horses experience
exercise intolerance and abnormal respiratory noise, and complete airway obstruction is possible
in advanced disease states or during strenuous exercise. Traditional treatment is partial
arytenoidectomy with the horse under general anesthesia.1-6 Although racing is possible
following arytenoidectomy, the procedure has potential complications and is costly.1,2,7 An
alternative minimally invasive procedure consisting of laser-assisted debridement has been
reported in the standing horse if the condition is recognized before permanent arytenoid
deformity has occurred.8,9 Case selection is critical; the diagnostic challenge lies in determining
the extent of arytenoid deformity in marginal cases. Endoscopy, radiology, and ultrasound have
not completely fulfilled this need. Additional structural diseases of the larynx occur and include
palatopharyngeal arch deformity, atrophy and fracture of the laryngeal cartilages, and
developmental abnormalities resulting in anatomic alteration of the larynges and surrounding
musculature.

2
Magnetic resonance imaging provides a detailed depiction of the morphology and composition of
the tissue based on hydrogen content. Images are produced in gray scale with specific intensities
of signal based on the tissue composition. Imaging the cartilage of the equine larynx would aid
in deciding whether to debride or remove an arytenoid cartilage.
The intent of this study was to evaluate MRI imaging of the normal equine larynx, so the severity
of internal laryngeal cartilage lesions could be determined in clinical cases. My literature review
disclosed no prior published reports of MRI of the equine larynx. The magnet configuration and
field strength are limited in equine veterinary medicine to equipment that is available in a clinical
setting. The purpose of the study was to acquire clinically useful MR images of the normal
equine larynx using the 0.3 Tesla permanent C-shaped MRI system that is currently available in
clinical practice. Images were also obtained using a 1.5 Tesla superconducting horizontal
magnet to depict and describe the normal anatomy. The images acquired were compared with
similar slices of gross specimens. We hypothesized that MRI would offer a useful, noninvasive
means for evaluation of the morphology of the equine laryngeal cartilages and that the images
obtained would correlate well with gross anatomic specimens. A diagnostic standard for normal
magnetic resonance imaging will be established to provide a reference for which laryngeal
disease may be compared in the future.

3
LITERATURE REVIEW
THE DEVELOPMENT OF MRI
Current magnetic resonance imaging is based upon the principles of nuclear induction; also
known as nuclear magnetic resonance. Bloch and Purcell independently publicized the principle
of nuclear induction in 1946 and reported that nuclei of different atoms absorb radio waves of
different frequencies.10,11 They reported that when radio waves were applied to molecules, the
orientation of the nuclear moment of the molecules changed based on the radio-wave frequency
applied. When the radio-wave frequency was removed from the molecules, nuclear relaxation
occurred. Bloch and Purcell demonstrated that the nuclear reorientation due to relaxation could
be measured as a voltage difference between terminals of an external electrical circuit.10,11 As
techniques were refined, nuclear magnetic resonance became a spectroscopic technique used in
the laboratory setting for the identification of chemical and physical characteristics of specific
molecules. Laboratory molecular analysis was the first practical use of magnetic resonance. In
1971, Damadian proposed that nuclear magnetic relaxation times could be used to non-
invasively detect disease.12 Nuclear magnetic relaxation times of neoplastic tissue differed from
that of normal tissue and the difference was recordable.12,13 In 1973, Lauterbur implemented a
tri-plane gradient magnetic field for imaging specific areas of the body.14 This report is thought
to be the foundation for current MRI technology and provided a means of spatially localizing the
MR signal.
The technique involved magnetic field gradients in the x, y, and z directions applied to the
subject, resulting in three dimensional MR signal localization.14 In 1978, medical imaging

4
technology was further advanced with the publication of the first human whole-body MRI study.
Cross-sectional images of a human thorax depicting tissue structure based on the concentration
of tissue water was produced.15 Since that time, MRI technology has been widely used in
medical imaging of the human body. MRI has gradually become more efficient, resulting in
constantly improving resolution.
BASIC PHYSICS AND PRINCIPLES OF MRI
The basic principle of magnetic resonance imaging is that hydrogen contained in tissue water
emits a signal that is detectable by a magnetic resonance scanner, and permits noninvasive
imaging of tissue architecture. Images correspond to slices through the anatomic structure
depicted in gray scale; thickness is determined by the operator. Each slice is composed of
defined 3-dimensional tissue volumes referred to as voxels, which correspond to small cubic
volumes of tissue.16 The voxel size is variable and may be manipulated to influence the
available MR signal, which correlates with the intensity of brightness of a pixel.17 Images are
composed of thousands of pixels which represent the gray scale average MR signal within each
tissue voxel. The slice thickness, field of view and the acquisition matrix determine the
dimensions of the voxel. Field of view is the square image area that contains the object of
interest and is expressed in units of mm². It represents the amount of tissue included on
each cross sectional image. The smaller the field of view, the higher the image resolution,
but the lower the measured MR signal.
The acquisition matrix is a 2-dimensional grid which represents the surface area of the
voxels composing the MR image and is expressed as width X height. Because the MR

5
signal is proportional to the number of protons resonating within each voxel, increasing the size
of the voxel will increase the MR signal and improve image acquisition.18 Therefore, increasing
the slice thickness and field of view, or decreasing the imaging matrix will increase the MR
signal. Image resolution is the ability to distinguish small objects on MR images and is critical
to medical imaging applications. Decreasing the size of the voxel will improve image resolution,
but will also decrease the number of available resonating protons, resulting in a decreased
signal.19 Therefore, the available MR signal and image resolution may be improved with
manipulation of the imaging parameters.
Variation in the hydrogen content of tissue makes magnetic resonance imaging possible.
Magnetism is a property of tissue that results from orbiting electrons. The orbiting electrons
cause atoms to have a magnetic moment associated with angular momentum referred to as spin.16
The spinning protons create a small magnetic field. The concentration of hydrogen atoms in
tissue and the large magnetic moment created by the single hydrogen proton make the hydrogen
atom extremely sensitive to magnetic resonance. When the tissue is placed within a magnetic
field, protons align with or against the applied magnetic field.16,18,20 At any given time, a slight
majority of the tissue protons will be aligned with the applied magnetic field. The aligned
position is slightly favored because the nucleus is at a lower energy state, resulting in a net tissue
magnetization pointing longitudinally in the direction of the applied magnetic field.20 The
protons wobble as they spin within the applied magnetic field. The rate of proton wobbling is
described as precession, and is unique for water protons depending on the frequency of the static
magnetic field. Precession is described as Larmor frequency, and is characteristic of the specific
tissue being imaged.16,20 Larmor frequency is the frequency at which the nucleus will absorb

6
energy to alter its alignment. The stronger the magnetic field, the higher the Larmor frequency.
If an RF pulse at the Larmor frequency is applied to the nucleus of an atom, the protons will alter
their alignment from the direction of the main magnetic field to the direction opposite the main
magnetic field. As the proton tries to realign with the main magnetic field, it will also emit
energy at the Larmor frequency. Nuclear resonance is the ability of an atom to absorb energy at
the Larmor frequency to alter its alignment. Radio-frequency radiation is applied through an RF
coil to individual nuclei at the Larmor frequency and causes the nuclei in a lower energy state to
jump into a higher energy state. Exposure of the magnetized tissue to RF radiation at the Larmor
frequency causes the net magnetization vector to rotate from a longitudinal position aligned with
the applied magnetic field to a distance proportional to the time length of the RF pulse.20
The net magnetization vector rotates 90 to 180 degrees from the applied magnetic plane and can
be detected by the MRI scanner. The angle that the net magnetization vector rotates at the end of
the RF pulse is commonly called the flip angle.20 The stronger the RF pulse delivered by the coil
to the protons, the greater the flip angle for the magnetization. The two most common flip
angles in MRI are 90 degrees and 180 degrees, but variable angles are utilized. After the
external RF pulse ceases, T1 recovery and T2 decay take place. T1 recovery and T2 decay occur
at the same time, but are completely different processes. T1 recovery is the gradual increase in
longitudinal magnetization and is referred to as longitudinal relaxation.16,18 T1 relaxation is a
time constant and is the time required for proton alignment to return to 63% of the original
longitudinal magnetization.21 The time between successive RF excitation pulses is repetition
time (TR), an imaging parameter which controls the T1 weighting of an image. A short TR
maximizes T1 weighting, whereas a long TR minimizes T1 weighting.19
7
T2 decay, or transverse relaxation, is the gradual decrease in transverse magnetization back to an
equilibrium of proton alignment.16,18 As T2 decay occurs, the MR signal “dies out”. The decay
is expressed as a time constant. The T2 time constant is the time for nuclei spinning
perpendicular to the main magnetic field to lose coherence, which results in a loss of transverse
magnetization and MRI signal.17 T2 decay occurs when the transverse magnetization has
decreased to 37% of the initial value and is more rapid than T1 recovery.21 Echo delay time (TE)
is the time interval between the RF pulse and the measurement of the first echo that determines
the T2 weighting of an image. A short TE minimizes T2 expression, whereas a long TE
maximizes T2 weighting.
Each type of tissue has a differing concentration of hydrogen atoms causing different T1 and T2
values. Contrast between various tissues is related to differences in proton resonance within the
tissues. Specific imaging parameters selected for an MR scan are referred to as pulse sequences
and typically include T1-weighted, T2-weighted, proton density, inversion recovery (IR), and
gradient echo.
T1-weighted imaging is considered a short-TR and short-TE sequence. T1-weighted images are
especially useful for depicting anatomic detail. Fat, acute hemorrhage, and proteinaceous fluid
have high signal intensity (bright).16 Muscle and most other soft tissue structures are
intermediate to low in signal intensity. Fluid composed mostly of water is of relatively low
signal when compared to muscle. Cartilage typically has higher signal intensity than muscle and
other soft tissue structures.

8
The T2-weighted sequence has a comparatively long TR and long TE.16 Fluid produces an
especially high signal. T2-weighted images identify tissue pathology well due to the increased
fluid content of affected tissue. Muscle and soft tissue structures produce intermediate signal
and fat has less signal than on a T1-weighted image.
Proton density sequences are considered an intermediate TR and short TE sequence.16 Tissue
contrast is primarily due to the proton number within specific tissues. The higher the number of
protons in a given unit of tissue, the greater the transverse component of magnetization, and the
brighter the signal on the proton density contrast image. This sequence provides good anatomic
detail, but little overall tissue contrast due to the intermediate weighting. Proton density is
particularly useful for evaluation of cartilaginous structures, such as human meniscal
pathology.17 However, this sequence is poor for detection of fluid and bone marrow pathology.
Short tau inversion recovery (STIR) and turbo inversion recovery (TIRM) are T2-weighted fat
suppression techniques that result in increased signal intensity from fluid and tissue edema. It is
very sensitive in detecting tissue fluid accumulation due to soft tissue pathology and is
commonly used in musculoskeletal imaging protocols. The disadvantages of inversion recovery
sequences are a longer acquisition time and expression of less anatomical detail.

9
Gradient echo is a type of pulse sequence generated from free induction decay by an applied
bipolar magnetic gradient.17 The gradient echo is produced by reversing the direction of a
magnetic field gradient or by applying balanced pulses of a magnetic field gradient before and
after an RF pulse.16 Gradient echo produces T1 or T2 –weighted images in less time than
conventional spin echo techniques. It is particularly useful in imaging ligaments and
cartilaginous structures, but is more susceptible to imaging artifacts. Gradient echo tends to
produce poor contrast between muscle and other soft tissue structures. The protons within the
mineralized matrix of cortical bone are unable to resonate and produce an MR signal; therefore,
cortical bone is typically black in all imaging sequences. Disadvantages of gradient echo
imaging are compromised anatomic details and artifacts.
EQUINE LARYNGEAL ANATOMY
The larynx is primarily composed of fibroelastic and hyaline cartilage.22,23 The five laryngeal
cartilages are the epiglottic, thyroid, cricoid, and the paired arytenoid cartilages. The most
rostral is the epiglottic cartilage which is composed of flexible elastic cartilage.23,24 The largest
is the thyroid cartilage which consists of two lateral hyaline cartilage plates fused along the
laryngeal floor.24 The dorsal, rostral and caudal extremities of the thyroid cartilage articulate
with the thyrohyoid bone and cricoid cartilage, respectively.22 The most caudal is the cricoid
cartilage which forms a complete “signet” ring. The cricoid cartilage is joined to the trachea by
the cricotracheal ligament. The cricoid cartilage articulates with each arytenoid cartilage via the
synovial cricoarytenoid joints and with the dorsocaudal thyroid cartilage via synovial
articulations at the lateral facets of the cricoid cartilage. The paired arytenoid cartilages lie on

10
either side of the laryngeal lumen and contain three processes. The vocal process projects
ventrally and serve as the dorsal attachment of the vocal fold. The muscular process projects
dorsolaterally for insertion of the cricoarytenoideus dorsalis muscle. The corniculate processes
form the laryngeal entrance and the dorso-lateral limits of the glottis. The corniculate process is
composed of fibroelastic cartilage and the remaining structure of the arytenoid is composed of
hyaline cartilage.23
Intrinsic and extrinsic muscles create laryngeal cartilage movement. The extrinsic muscles
function as elevators and depressors of the larynx. They include the thyrohyoideus,
hyoepiglotticus, and sternothyroideus muscles.22 The intrinsic muscles control vocal cord
tension and the size and shape of the glottis and include the cricothyroideus, cricoarytenoideus
dorsalis, cricoarytenoideus lateralis, thyroarytenoideus, and arytenoideus transverses muscles.
The cricothyroideus muscle originates from the lateral surface of the thyroid lamina and inserts
on the cricoid arch ventral to the cricothyroid joint to tense the vocal fold; it is innervated by the
cranial laryngeal nerve.22 The other intrinsic muscles are innervated by the recurrent laryngeal
branch of the vagus nerve. The cricoarytenoideus dorsalis muscle originates from the
dorsolateral surface of the cricoid cartilage and inserts on the muscular process of the arytenoid
cartilage to abduct the arytenoid cartilages, opening the rima glottidis.24 The cricoarytenoideus
lateralis muscle originates from the rostroventral part of the cricoid arch and inserts on the
muscular process of the arytenoid to abduct the arytenoid cartilages, narrowing the rima glottidis.
The thyroarytenoideus muscle originates from the thyroid cartilage on the cranial laryngeal floor
and inserts on the muscular process and body of the arytenoid cartilage and functions to adjust
the tension of the vocal fold. It is divided into two units consisting of the rostral ventricularis

11
and caudal vocalis muscles. The arytenoideus transverses muscle originates from the muscular
process of the arytenoid cartilage, inserts on the median raphe and functions to approximate and
stabilize the paired arytenoid cartilages.22
The laryngeal ventricle is a diverticulum lined with mucosal tissue which is located dorsal and
caudal to the vocal fold, between the arytenoid and thyroid cartilages. The laryngeal ventricles
are proposed to act as resonators during vocalization. The vocal folds are soft tissue structures
and run caudodorsally from the rostral laryngeal floor to attach on the mid ventral aspect of the
body of the arytenoid cartilages. Each vocal fold contains a ligament on the dorsal and ventral
free margin for stabilization. The vocal folds can be tensed and relaxed by the cricothyroideus
and the thyroarytenoideus muscles during vocalization. The pitch of vocalization is controlled
by the thickness, length, and tension of the vocal folds.
MRI OF THE HUMAN LARYNX
Magnetic resonance imaging has been used extensively in the human medical profession. The
primary role of MR in human laryngeal imaging is to define the extent of disease, especially
neoplastic processes.25,26 Laryngeal carcinoma is the most common malignancy of the human
head and neck in the western hemisphere, and can originate in the glottic, supraglottic, or
infraglottic regions.27 The most common laryngeal tumors are located within the glottic region
and are rarely associated with lymph node spread.28,29 More than 90% of laryngopharyngeal
carcinomas are of squamous cell origin.21,30 Malignancies of the larynx generally arise from the
surface epithelium and infiltrate deeper tissue.30

12
Detection of cartilage invasion is an important factor in the staging of laryngeal cancer. Direct
diagnostic endoscopy is commonly used to view mucosal malignancies; however, deep extension
of the tumors is most effectively assessed by CT and MRI. The inherently superior tissue
contrast and resolution provided by MRI in differentiating among neoplasia, soft tissue, muscle,
fat, and vessels has provided a distinct advantage over CT in evaluating human laryngeal
pathology. Compared to CT, MRI has been shown to consistently produce superior soft tissue
definition and resolution.25 MR technology is reported to be the most effective means to
diagnose and stage regional extension of laryngeal tumors and is useful in detecting cartilage
invasion by neoplastic processes.24,27,31,32 MRI has also been useful in the determination of the
normal dimensions of the laryngeal framework of adult humans. These measurements have
included the identification of the internal and external diameters of the cricoid cartilage, height
and length of the thyroid cartilage in different planes, angle of the thyroid laminae, height of the
arytenoid cartilages, width and length of the epiglottic cartilage, and internal and external
diameter of first tracheal ring.33 In 2002, a three-dimensional anatomic framework of the human
larynx was created using MR technology.34,35 This laryngeal model has proven useful in analysis
of vocal fold opening and closing action during speech, swallowing, coughing, and voice
production.34 The MR recognition of the human laryngeal framework has also advanced the
field of laryngeal electromyography and laryngeal surgery by providing a better understanding of
the functional relationship of anatomical structures. The disadvantage of MRI for laryngeal
imaging in human patients is that the technique is much more susceptible to motion artifacts that
occur during swallowing, respiration, and from pulsatile flow of the great vessels in the neck.23
Motion artifacts are reported to interfere with an accurate diagnosis in 10% to 15% of human

13
cases.36 MRI also has a limited ability to detect histologic detail or microscopic spread of
neoplastic cells.30
Optimum MR imaging protocols for the human larynx have been documented. T1-weighted spin
echo MR images are typically the most helpful is defining normal laryngeal anatomy.25,36 A 1.5
Tesla magnet and anterior neck surface coils are the current medical standard for laryngeal
imaging.23 T1-weighted spin echo axial (transverse) images are reported to be acquired using an
intermediate 256 x 256 acquisition matrix. The use of a finer acquisition matrix of 512 x 512
was reported to produce improved visualization of anatomical detail, but scanning time was
significantly increased.36 A TR of 600 ms and a TE of 20 ms with a field of view of 20 cm for
optimal T1-weighted imaging is reported in the current literature.24 It is desirable to reduce the
field of view as much as possible to improve spatial resolution. Slice thickness should be
approximately 4mm for most MRI laryngeal applications.31 Other reports exist that promote a
slice thickness of 3 mm or 5mm with 1 mm between slice sections for optimum results.23
Thinner slices have been reported to improve the visualization of anatomic detail, but require the
completion of multiple acquisitions which are averaged, resulting in longer scanning times to
maintain an equivalent signal to noise ratio.36 A coronal T1-weighted imaging sequence should
also be obtained using the same imaging parameters. A T1-weighted sagittal image is reported
to be useful in determining the extent of neoplastic infiltration and is performed using the same
imaging parameters.37 A T2-weighted axial imaging sequence provides less spatial resolution,
but has been shown to be useful in defining the interface between deep extension of the
neoplasm and the surrounding normal soft tissue structures.31 An in vitro study was conducted
using a 2.35 Tesla MR imaging system and harvested human laryngeal specimens to compare the
14
effect of an increased magnetic field strength on acquired MR laryngeal images. A higher field
strength using the 2.35 Tesla magnet produced T2-weighted images that were found to have
superior resolution, improved tissue contrast, and better soft-tissue differentiation than the T1-
weighted images produced.38 When performed at a greater magnetic field strength, T2-weighted
sequences are reported to have an improved potential to enable early detection of tumor invasion
into the laryngeal cartilage.38
MR anatomy of the human larynx has been thoroughly reported in recent literature. MRI has
been found very useful in delineating muscle planes, mucosal surfaces, and calcified laryngeal
cartilage lamina. Noncalcified hyaline cartilage is reported to be of intermediate signal intensity
and closely approximates the subcutaneous tissue and submucosal connective tissue.25,31 The
epiglottis is composed of fibroelastic cartilage and is of intermediate to high signal intensity.25,31
High signal intensity was reported to be present along the surface of the laryngeal lumen due to
the presence of the mucosal lining, which has a higher hydrogen concentration than the deeper
cartilaginous structures.24,37 A large proportion of the laryngeal skeleton of the adult human is
composed of calcified cartilage and has a similar composition as cortical bone. The epiglottic
cartilage consists of elastic cartilage and does not ossify, while the cricoid, thyroid, and arytenoid
cartilages consist of hyaline cartilage, which demonstrates a predictable pattern of ossification
with age.39,40 Calcified laryngeal cartilage is reported to be of low signal intensity, with
increased signal in the medullary space due to the presence of intra-medullary fat.24,25,31,37 The
thyroid cartilage has an inverted V configuration when viewed on an axial (transverse) MR
image and has a characteristic trilaminar appearance.24,41 The thyroid cartilage may appear
irregular depending on the age of the patient and the pattern of calcification.41 The cricoid

15
cartilage is readily identified and forms a broad posterior lamina, which is responsible for it’s
characteristic signet ring appearance.24,41 The arytenoid cartilages are viewed as symmetrical
areas of relatively high-signal intensity. The aryepiglottic folds have been reported to be well
demonstrated on human laryngeal MRI sequences.24 The aryepiglottic folds are largely
composed of mucosal tissue covering a fatty infrastructure and are viewed as bright, high
intensity signal. Generally, neoplasia is identified as having intermediate signal intensity on T1
– weighted sequences. On T2-weighted images, neoplasia usually has increased signal intensity
compared with that found on T1-weighted images.36 The preepiglottic space consists of a high
abundance of fat and creates a bright signal. Disruption of this bright signal by an intermediate
intensity signal has been reported to indicate tumor invasion.24 Nonossified laryngeal cartilage
also appears as intermediate signal intensity on T1-weighted images. Therefore, distinguishing
neoplastic tissue from nonossified laryngeal cartilage presents a challenge.23,24 Reports of false
positive findings exist in the MRI diagnosis of cartilage invasion by neoplastic cells. The false
positive findings resulted from the presence of inflammatory changes within tissue adjacent to
the tumor, by fibrosis, or extramedullary hematopoiesis.32,42 MRI is also limited in its ability to
distinguish residual from recurrent laryngeal neoplasia.30 Currently, laryngeal cancer is detected
by an alteration and distortion in the appearance of normal tissue planes in representative T1-
weighted images.30 In one study of invasion of laryngeal cartilage by neoplasia, MRI had a
specificity of 88% and a sensitivity of 89%, supporting MRI use in the evaluation of laryngeal
cancer.43 In radiologic-pathologic studies of laryngeal cartilage invasion, it has been
demonstrated that MRI is more sensitive (89%) than CT imaging (64%) for the detection of
tumoral infiltration of the laryngeal cartilages.44,45

16
The correlation between human MRI laryngeal anatomy and histologic specimens has been
reported in several studies.46,47 A study by Sakai and coworkers compared the normal MRI
anatomy of the human larynx at a high field strength of 1.5 Tesla in 2 normal excised larynges
and 62 subjects without laryngopharyngeal disease.47 The larynges were sectioned transversely
and the MR images were compared to gross and histologic sections. In the 62 subjects, MR at 1.5
T provided excellent anatomical detail of the major laryngeal cartilages, extrinsic and intrinsic
laryngeal musculature, and soft tissues including the vocal cords, laryngeal ventricles, and
aryepiglottic folds.47 There was also a reported high correlation between the MR images and the
corresponding gross histologic specimens. Unossified hyaline cartilage was found to be
intermediate in signal intensity on T1-weighted and proton density images and low intensity on
T2-weighted images. The signal intensity from ossified cartilage was determined by the amount
of fatty marrow and was high in intensity on T1-weighted and proton density images and low to
intermediate in intensity on T2-weighted images.47 The epiglottic cartilage demonstrated an
intermediate signal intensity on T1-weighted images and higher intensity on proton density and
T2-weighted images. The intrinsic laryngeal muscles were well demonstrated as low intensity
structures. In a study by Champsaur and coworkers, eight harvested laryngeal anatomic
specimens were studied: four in the transverse plane, two in the sagittal plane, and two in the
frontal plane.46 The MRI and histologic sections were made at the same level through the larynx
and were of similar slice thickness. Comparison showed all major anatomic laryngeal structures
could be identified and excellent correlation existed between the MRI and histologic
specimens.46

17
MRI OF THE LARYNX IN VETERINARY MEDICINE
Veterinary laryngeal MR imaging consists of a single report in normal dogs.48 The goal of the
study was to provide MRI reference images of the canine larynx in the sagittal and transverse
planes, using a T1-weighted spin-echo sequence. The dogs were anesthetized and positioned
into a horizontal bore Toshiba Vectra System with a superconducting magnet operating at a
magnetic field strength of 0.5 Tesla using a human head radiofrequency coil. The sequence used
was spin-echo type T1-weighted with a short pulse repetition time (TR) and a short echo time
(TE). Sagittal series were obtained with a TR of 500 msec and TE of 25 msec. Transverse series
were obtained with a TR of 450 msec and TE of 25 msec.48
The sagittal views revealed high signal in the epiglottis and corniculate processes of the
arytenoid cartilages. The body of the arytenoid cartilage was intermediate in signal intensity.
The lamina of the cricoid cartilage showed lower signal intensity than the epiglottis. The
laryngeal musculature was intermediate in signal intensity and could be clearly differentiated
from the cartilaginous structures. The thyroid cartilage was fount to be of low signal intensity
due to the hyaline composition. Cavities filled with air, such as the airway lumen, pharynx, and
nasal passages, corresponded to signal voids.48
The transverse MR images provided a more accurate anatomic representation of the laryngeal
structures. In these sequences, all laryngeal cartilages could be differentiated. The lamina of the
cricoid and thyroid cartilages were well defined and of low intensity signal. Adjacent to the
lamina of the cricoid cartilage, the cricoarytenoideus dorsalis muscle was identified as
intermediate signal intensity that enhanced the cricoid lamina morphology. The cartilaginous

18
structures of high signal intensity consisted of the epiglottis, corniculate process, and other areas
of the arytenoid cartilages. The vocal folds were clearly defined on the transverse sequences.48
Overall, the study reported that the laryngeal cartilages had different signal intensities based on
the tissue water content. The highest signal intensity was shown in the epiglottis and corniculate
process of the arytenoid cartilages. The vocal folds were also present with a high intensity tissue
signal. The MRI characteristics of these structures were thought to be due to their elastic nature.
The cricoid and thyroid cartilages contained intermediate signal intensity due to their hyaline
composition. The study speculated MRI technology to be of value in the diagnostic imaging of
canine respiratory disease.48
EQUINE LARYNGEAL PATHOLOGY
The flexible fiberoptic endoscope has enhanced the examination of the equine larynx. In 1980,
arytenoid chondritis in seven thoroughbred horses experiencing exercise intolerance and
inspiratory dyspnea during exercise was described.49 In 1988, 75 horses with arytenoid cartilage
abnormalities were endoscopically compared and identified to have asymmetry of the rima
glottidis and the inability to abduct the affected cartilage.7
Arytenoid chondritis is an infectious, usually progressive, disease in which the affected cartilage
becomes thickened and distorted. A septic process gains access to the cartilage and results in
inflammation and sinus tract formation with recurrent drainage.50,51 Abscessation is common,
but it is often detected only after it has become organized and has deformed the cartilage. This
disease may be unilateral or bilateral with diagnosis established by endoscopic examination to
19
identify axial displacement and the abnormal appearance of a thickened arytenoid.50 Palpation
via a laryngotomy and radiography may also be used to detect arytenoid deformities.
Radiographic changes of the larynx that occur in the condition of arytenoid chondritis include
enlargement and increased density of the arytenoid cartilage with abnormal patterns of
dystrophic mineralization or osseous metaplasia.52,53 These radiographic findings must be
interpreted with caution because it has also been reported that ossification of the laryngeal
cartilages may occur naturally with age in the horse.53 Radiographic abnormalities are not
pathognomonic of laryngeal dysfunction.
The management of arytenoid chondritis consists of arytenoidectomy or debridement of infected
arytenoid tissue. Severely thickened arytenoid cartilages must be removed.3-6 Partial
arytenoidectomy removes all of the arytenoid except the muscular process.6 A 1988 study by
Tulleners, et al., reported that 45% of thoroughbred racehorses and 20% of standardbred horses
raced successfully after a partial arytenoidectomy.7 Recent literature indicates a more optimistic
success rate of 60%-80% return to racing is possible.1,2
Sullins reported an endoscopically guided minimally invasive laser-assisted debridement of
infected cartilages that were not permanently deformed.9 A stab incision is made in the
cricothyroid membrane for insertion of a trocar to transmit a laser fiber and instruments to be
guided endoscopically to debride the arytenoid lesion.8,9 This procedure is performed in the
standing horse with minimal post-operative healing time and has a very high success rate. Case
selection is critical; the limitation of this technique is that it is effective only when arytenoid
mobility can be regained. Acute swelling can subside, and abscesses can be drained, but it can

20
be difficult to determine whether moderately affected cartilages can be salvaged.8,9 The use of
MRI may help identify irreversible lesions.
FOOTNOTES
a Equiscan 3000, Hallmarq Veterinary Imaging Limited, Surrey, England. b Magnetom Vision-Sonata horizontal long-bore, Siemens Medical Solutions Inc., Malvern, PA,
19355, USA.

21
REFERENCES CITED
1. Barnes AJ, Slone DE, Lynch TM. Performance after partial arytenoidectomy without
mucosal closure in 27 Thoroughbred racehorses. Vet Surg 2004;33:398-403. 2. Parente EJ. Partial arytenoidectomy for treatment of failed laryngoplasty or arytenoid
chondritis in racehorses., in Proceedings. 48th Annual Convention of the American Association of Equine Practitioners 2003;373-376.
3. Dean PW, Cohen ND. Arytenoidectomy for advanced unilateral chondropathy with
accompanying lesions. Vet Surg 1990;19:364-370. 4. Tulleners EP, Harrison IW, Mann P, et al. Partial arytenoidectomy in the horse with and
without mucosal closure. Vet Surg 1988;17:252-257. 5. Speirs VC. Partial arytenoidectomy in horses. Vet Surg 1986;15:316-320. 6. White NA, Blackwell RB. Partial arytenoidectomy in the horse. Vet Surg 1980;9:5-12. 7. Tulleners EP, Harrison IW, Raker CW. Management of arytenoid chondropathy and
failed laryngoplasty in horses: 75 cases. J Am Vet Med Assoc 1988;192:670-675. 8. Sullins KE. Minimally invasive laser treatment of arytenoid chondritis in horses. Clin
Tech Eq Prac 2002;1:13-16. 9. Sullins KE. Minimally invasive laser treatment of arytenoid chondritis in five horses. In:
Proceedings 47th Annu Conv Am Assoc Equine Practnr 2001;120-122. 10. Bloch F, Hanson WW, Packard M. Nuclear induction. Phys Rev 1946;69:127. 11. Purcell EM, Torrey HC, Pound RV. Resonance absorption by nuclear magnetic moments
in a solid. Phys Rev 1946;69:37-38. 12. Damadian R. Tumor detection by nuclear magnetic resonance. Science 1971;171:1151-
1153. 13. Damadian R, Minkoff L, Goldsmith M, et al. Field focusing nuclear magnetic resonance:
visualization of a tumor in a live animal. Science 1976;194:1430-1432. 14. Lauterbur P. Image formation by induced local interaction; examples employing
magnetic resonance. Nature 1973;242:192. 15. Damadian R, Minkoff L, Goldsmith M. Whole-body nuclear magnetic resonance
scanning: nmr studies of tumor cells. Ciba Foundation Symposium 1978;67:131-141.

22
16. Kaplan PA, Helms CA, Dussault R, et al. Musculoskeletal MRI. Philadelphia: W B Saunders, 2001: 1-23.
17. Haacke EM, Brown RW, Thompson MR, et al. Magnetic Resonance Imaging: physical
principles and sequence design. New York, NY: John Wiley and Sons, Inc., 1999:1-62. 18. Westbrook C, Kaut C. MRI in Practice. Oxford: Blackwell Scientific, 1993:12-35. 19. Chan KK, Pathria M. MRI of the Musculoskeletal System In: Lufkin RB, Bradley
WG,Zawadzki MB, eds. Lippincott Williams & Wilkins MRI Teaching File Series. Second Edition ed. Philadelphia: Lippincott Williams & Wilkins, 2001:1-205.
20. Stark DD, Bradley WG. Magnetic Resonance Imaging. Third Edition ed. New York, NY:
C V Mosby, 1999:9-520. 21. Stark DD, Moss AA, Gamsu G. Magnetic resonance imaging of the neck: Part 2.
Pathologic findings. Radiology 1983;150:455-461. 22. Dyce KM, Sack WO, Wensing CJG. Textbook of Veterinary Anatomy. 2nd Edition ed.
Philadelphia: WB Saunders Company, 1996:155-160. 23. Curtin HD. Imaging of the larynx: current concepts. Radiol 1989;173:1-11. 24. Towler CR, Young SW. Magnetic resonance imaging of the larynx. Magn Reson Q
1989;5:228-241. 25. Teresi LM, Lufkin RB, Hanafee WN. Magnetic resonance imaging of the larynx. Radiol
Clin North Am 1989;27:393-406. 26. Shorten GD, Opie NJ, Graziotti P, et al. Assessment of upper airway anatomy in awake,
sedated and anaesthetised patients using magnetic resonance imaging. Anaesth Intensive Care 1994;22:165-169.
27. Castelijns JA, Kaiser MC, Valk J, et al. MR imaging of laryngeal cancer. J Comput Assist
Tomogr 1987;11:134-140. 28. Kirchner JA. Two hundred laryngeal cancers: Patterns of growth and spread as seen in
serial section. Laryngoscope 1987;87:474-482. 29. Schneider M, Probst R, Wey W. Magnetic resonance imaging--a useful tool for airway
assessment. Acta Anaesthesiol Scand 1989;33:429-431. 30. Hasso AN, Tang T. Magnetic resonance imaging of the pharynx and larynx. Top Magn
Reson Imaging 1994;6:224-240.
23
31. Jabour BA, Lufkin RB, Hanafee WN. Magnetic resonance imaging of the larynx. Top Magn Reson Imaging 1990;2:60-68.
32. Atula T, Markkola A, Leivo I, et al. Cartilage invasion of laryngeal cancer detected by
magnetic resonance imaging. Eur Arch Otorhinolaryngol 2001;258:272-275. 33. Eckel HE, Sittel C, Zorowka P, et al. Dimensions of the laryngeal framework in adults.
Surg Radiol Anat 1994;16:31-36. 34. Selbie WS, Gewalt SL, Ludlow CL. Developing an anatomical model of the human
laryngeal cartilages from magnetic resonance imaging. J Acoust Soc Am 2002;112:1077-1090.
35. Rubin JS, Summers P, Harris T. Visualization of the human larynx: a three-dimensional
computer modeling tool. Auris Nasus Larynx 1998;25:303-308. 36. Castelijns JA, van den Brekel MW, Hermans R. Imaging of the larynx. Semin Roentgenol
2000;35:31-41. 37. Stiglbauer R, Steurer M, Schimmerl S, et al. MRI of cartilaginous tumors of the larynx.
Clin Radiol 1992;46:23-27. 38. Kikinis R, Wolfensberger M, Boesch C, et al. Larynx: MR imaging at 2.35 T. Radiology
1989;171:165-169. 39. Fatterpekar GM, Mukherji SK, Rajgopalan P, et al. Normal age-related signal change in
the laryngeal cartilages. Neuroradio 2004;46:678-681. 40. Claassen H, Kirsch T, Simons G. Cartilage canals in human thyroid cartilage
characterized by immunolocalization of collagen types I, II, pro III, IV, and X. Anat Histol Embryol 1996;94:147-153.
41. Branstetter BFt, Weissman JL. Normal anatomy of the neck with CT and MR imaging
correlation. Radiol Clin North Am 2000;38:925-940, ix. 42. Becker M, Zbaren P, Laeng H, et al. Neoplastic invasion of the laryngeal cartilage:
comparison of MR imaging and CT with histopathologic correlation. Radiology 1995;194:661-669.
43. Castelijns JA, Gerritsen GJ, Kaiser MC. MRI of normal and cancerous laryngeal
cartilages: histologic correlation. Laryngoscope 1987;97:1085-1093. 44. Zbaren P, Becker M, Lang H. Pretherapeutic staging of laryngeal carcinoma. Clinical
findings, computed tomography and magnetic resonance imaging compared with histopathology. Cancer 1996;77:1263-1273.

24
45. Yousem DM, Tufano RP. Laryngeal imaging. Magn Reson Imaging Clin N Am 2002;10:451-465.
46. Champsaur P, Parlier-Cuau C, Brunet C, et al. Serial anatomy of the larynx in MRI:
MRI-histologic correlations. Surg Radiol Anat 2000;22:5-11. 47. Sakai F, Gamsu G, Dillon WP, et al. MR imaging of the larynx at 1.5 T. J Comput Assist
Tomogr 1990;14:60-71. 48. Vazquez JM, Arencibia A, Gil F, et al. Magnetic resonance imaging of the normal canine
larynx. Anat Histol Embryol 1998;27:263-270. 49. Haynes PF, Snider TG, McClure JR, et al. Chronic chondritis of the equine arytenoid
cartilage. J Am Vet Med Assoc 1980;177:1135-1142. 50. Haynes PF. Arytenoid chondritis in the horse. In: Proceedings 27th Annu Conv Am
Assoc Equine Practnr 1981;27:63-69. 51. McKillop KL. Experimental induction of arytenoid chondritis in the horse. Masters
Thesis. Davis, CA: University of California, 1982. 52. Orsini PG, Raker CW, Reid CF, et al. Xeroradiographic evaluation of the equine larynx.
Am J Vet Res 1989;50:845-849. 53. Shapiro J, White NA, Schlafer DH, et al. Hypertrophic ossification of the laryngeal
cartilages of a horse. J Equine Med Surg 1979;3:370-374.

25
Magnetic Resonance Imaging of the Normal Equine Larynx
Cortney E. Henderson* DVM
Kenneth E. Sullins* DVM, MS, DACVS
C. Douglas Philips° MD FACR
From the Marion duPont Scott Equine Medical Center*
Virginia-Maryland Regional College of Veterinary Medicine
PO Box 1938
Leesburg, Virginia 20177
and the Department of Radiology°
University of Virginia
PO Box 800170
Charlottesville, Virginia 22908
Funded by the Patricia Bonsall Stuart Equine Research Award.
Submitted to: American Journal of Veterinary Research

26
Abstract
Objective: To establish the appearance of normal equine laryngeal cartilages as detected by
magnetic resonance imaging.
Animals: Specimens were acquired from clinically normal horses that were euthanized for
reasons other than respiratory disease.
Procedure: Three in situ and 5 ex vivo larynges were imaged using a 0.3 Tesla system. Images
were obtained in the transverse plane using T1-weighted 3D spin echo, T2-weighted 3D spin
echo, T2-weighted gradient echo, short tau inversion recovery (STIR), and proton density spin
echo sequences. Five ex vivo larynges were also imaged in the transverse plane using the 1.5
Tesla sequences including T1-weighted 3D spin echo, T2-weighted 3D turbo-spin echo, turbo
inversion recovery (TIRM), and proton density spin echo sequences. A frozen gross laryngeal
specimen was sliced in 5-mm transverse sections for comparison to the MR images.
Results: A high correlation was found between MR images and the gross transverse sections.
Successful imaging was accomplished using both imaging systems; however, the 1.5 Tesla
system yielded superior image resolution. The 0.3 Tesla imaging system could accommodate the
intact equine head, which was not possible using the 1.5 Tesla MRI system. The internal
morphology of the laryngeal cartilages was clearly identified on all imaging sequences obtained.
Cartilages were found to differ in signal intensity based on the tissue composition and imaging
sequences performed.

27
Conclusion: MRI was determined to be a useful imaging modality for evaluating the cartilage
morphology of the equine larynx.

28
Introduction
Disease of the equine larynx limits performance by causing exercise intolerance and abnormal
upper respiratory noise. Traditional evaluation of the equine larynx is based on physical
examination, upper airway endoscopy, and radiography. While these diagnostic tools are used to
diagnose certain laryngeal disorders, the majority of the structure of the laryngeal cartilages
cannot be thoroughly evaluated.
Arytenoid chondritis is an acute or chronic, often progressive bacterial infection that results in
thickening of the arytenoid cartilage and airway obstruction. Affected horses experience
exercise intolerance and abnormal respiratory noise and complete airway obstruction is possible
in advanced disease states or during strenuous exercise. Traditional treatment has been partial
arytenoidectomy with the horse under general anesthesia.1-6 Although racing is possible
following arytenoidectomy, the procedure has potential complications and is costly.1,2,7 An
alternative minimally invasive procedure consisting of laser-assisted debridement has been
reported in the standing horse if the condition is recognized before permanent arytenoid
deformity has occurred.8,9 Case selection is critical; the diagnostic challenge lies in determining
the extent of arytenoid deformity in marginal cases. Endoscopy, radiology, and ultrasound have
not fulfilled this need. Magnetic resonance imaging (MRI) has previously has led to advances in
equine orthopedics and its application to the equine larynx would prove useful. MRI of the
equine larynx would improve current diagnostic ability, limit invasive treatment techniques, and
aid in the decision to debride or remove an affected arytenoid cartilage.

29
Magnetic resonance imaging provides a detailed depiction of the morphology and composition of
the tissue based on hydrogen content.10 Images are produced in gray scale with specific
intensities of signal based on the tissue composition. Normal MRI characteristics of the larynx
have been reported in human and veterinary medicine. MRI has been found very useful in
delineating muscle planes, mucosal surfaces, and calcified laryngeal cartilage lamina. In humans
and canines, noncalcified laryngeal hyaline cartilage is reported to be of intermediate signal
intensity.11-13 The epiglottis is composed of fibroelastic cartilage and is of intermediate to high
signal intensity.11-13 High signal intensity is reported to be present along the surface of the
laryngeal lumen due to the presence of the mucosal lining, which has a higher hydrogen
concentration than the deeper cartilaginous structures.13-15 Calcified laryngeal cartilage, such as
is found in the thyroid, cricoid, and arytenoid cartilages, is reported to be of low signal intensity,
with increased signal within the medullary space due to the presence of fat.11-15 The aryepiglottic
folds are largely composed of mucosal tissue covering a fatty infrastructure and are viewed as
high intensity signal.14
Previous reports of MRI of the equine larynx do not currently exist. The magnet configuration
and field strength are limited in equine veterinary medicine to equipment that is available in a
clinical setting. The purpose of the study reported here was to acquire clinically useful MR
images of the normal equine larynx using the 0.3 Tesla permanent open magnet MRI system that
is currently available in clinical practice. Images were also obtained using a 1.5 Tesla
superconducting horizontal magnet for comparison. The images acquired were compared with
similar slices of a gross anatomic specimen. The intent of this study was to evaluate MRI
imaging of the normal equine larynx, so the severity of internal laryngeal cartilage lesions could

30
be determined in clinical cases. We hypothesized that MRI would offer a useful, noninvasive
means for evaluation of the morphology of the equine laryngeal cartilages and that the images
obtained would correlate well with gross anatomic specimens. An objective of the study was to
devise a diagnostic standard for normal magnetic resonance imaging to provide a comparison for
laryngeal disease.

31
Materials and methods
Specimens were obtained from hospital cases that were euthanized for reasons unrelated to
respiratory disease. Specimens were harvested promptly after euthanasia and verified to have
grossly normal laryngeal anatomy. Heads were harvested at the mid-cervical area and frozen at
-20°C until thawed for imaging. Ex vivo larynges including extrinsic musculature and proximal
trachea were harvested. Larynges were also frozen at -20°C until thawed for imaging. Three in
situ larynges and 5 ex vivo larynges were imaged using a 0.3 Tesla MRI systema and 5 ex vivo
larynges were imaged using a 1.5 Tesla MRI systemb.
The 0.3 Tesla systema consisted of a permanent open magnet (C-shaped) operating at a magnetic
field strength of 0.3 Tesla. For the in situ specimens, a circular-polarized, transmit and receive
equine hoof radio-frequency coilc was positioned on the ventral aspect of the throat and centered
over the larynx. A flexible, saddle configuration radio-frequency surface coil was also
developed for use in the study to reduce the signal-to-noise ratio and improve image resolution.
The saddle coil was contoured to the ventral aspect of the throat and encompassed the lateral and
ventral sides of the larynx. Each head was positioned so that the larynx was within the isocenter
of the magnet. The long axis of the neck was placed perpendicular to the long axis of the magnet
to mimic the clinical scenario for anesthetized horses. Images were acquired in the transverse
plane using an image acquisition matrix of 256 x 256 pixels with a field of view of 16.9 cm.
Sequences performed consisted of T1-weighted 3D spin echo, T2-weighted 3D spin echo, T2-
weighted gradient echo, proton density spin echo, and short tau inversion recovery (STIR). The
T1-weighted 3D spin echo pulse sequence had a short pulse repetition time (TR) of 23 ms and

32
short echo time (TE) of 7 ms with a slice thickness of 4 mm. The T2-weighted 3D spin echo
pulse sequence had a long TR of 1800 ms and a short TE of 30 ms with a slice thickness of 4
mm. T2-weighted gradient echo pulse sequence had a short pulse repetition time TR of 34 ms
and short echo time TE of 13 ms with a slice thickness of 4 mm. The proton density spin echo
pulse sequence had a long TR of 1100 ms and a short TE of 24 ms with a slice thickness of 3
mm. The short tau inversion recovery STIR sequence had a long TR of 1800 ms and a short TE
of 28 ms with a 5 mm slice thickness.
Five ex vivo larynges were also imaged with the 0.3 Tesla magneta. Each specimen was placed
in the center of a circular-polarized, transmit and receive equine hoof radio-frequency coilc and
positioned so that the larynx was within the isocenter of the magnet. The images were acquired
in the transverse plane, but sagittal images were acquired for referencing. The image acquisition
matrix for all transverse series was 256 x 256 pixels. T1 and T2 sequences had a field of view of
17 cm and slice thickness of 4 mm with 24 slices made in a transverse plane. The proton density
and inversion recovery series had a slightly larger field of view of 19.2 cm with slice thickness of
3 mm and 5 mm respectively, with 8 slices made in the transverse plane through each specimen.
Sequences performed consisted of T1-weighted 3D spin echo, T2-weighted 3D spin echo, T2-
weighted gradient echo, proton density spin echo, and short tau inversion recovery STIR. The
T1-weighted 3D spin echo pulse sequence used had a short pulse repetition time TR of 23 ms
and short echo time TE of 7 ms. The T2-weighted 3D spin echo pulse sequence used had a long
TR of 1800 ms and a short TE of 30 ms. T2-weighted gradient echo pulse sequence had a short
pulse repetition time TR of 34 ms and short echo time TE of 13 ms. The proton density spin
33
echo pulse sequence used had a long TR of 1000 ms and a short TE of 25 ms. The short tau
inversion recovery STIR sequence had a long TR of 1800 ms and a short TE of 28 ms.
Five ex vivo larynges were also imaged using a superconducting magnetb, operating at a
magnetic field strength of 1.5 Tesla. Each larynx was placed longitudinally into a circular-
polarized, transmit and receive radio-frequency extremity coild and the images were acquired in
the transverse plane; sagittal images were acquired for referencing the position of the transverse
sections. The image acquisition matrix for the T1 and T2 transverse series was 259 x 320 pixels
with a field of view of 18 cm. This configuration generated voxel sizes of .6 x .6 x 4 mm. The
proton density and inversion recovery series had a slightly larger voxel size of .9 x .7 x 4 mm
and .7 x .7 x 4 mm respectively. Slice thickness was standardized at 4 mm for all specimens and
21 slices were made in a transverse plane through each specimen. Sequences performed
consisted of T1-weighted 3D spin echo, T2-weighted 3D turbo-spin echo, proton density spin
echo, and a turbo inversion recovery (TIRM) with a slice selective inversion pulse of 150ms. The
T1-weighted 3D spin echo pulse sequence used had a short pulse repetition time TR of 519 ms
and short echo time TE of 15 ms. The T2-weighted turbo-spin echo pulse sequence used had a
long TR of 5000 ms and a long TE of 109 ms. The proton density spin echo pulse sequence used
had a long TR of 2000 ms and a short TE of 20 ms. The inversion recovery sequence TIRM had
a long TR of 4680 ms and a short TE of 24 ms.

34
Results
0.3 Tesla system and in situ larynges
The 0.3 Tesla imaging systema was found to produce an accurate anatomic depiction of the
equine larynx in situ, using the T1-weighted 3D spin echo, T2-weighted 3D spin echo, T2-
weighted gradient echo, proton density spin echo, and short tau inversion recovery STIR
sequences. The width of the open permanent magnet was limited to 23 cm, which restricted the
size of equine head to be imaged. The equine hoof radio-frequency coil functioned adequately as
a surface coil when applied to the ventral aspect of the throat. The flexible, saddle configuration
radio-frequency surface coil proved to be nonfunctional due to failure of calibration with the 0.3
Tesla imaging system. Acquired images from the 0.3 Tesla imaging systema accurately
identified most laryngeal structures; however, image resolution substantially decreased as tissue
depth increased. The T1-weighted 3D spin echo sequence subjectively produced the highest
image resolution and structural definition. T1-weighted 3D spin echo sequences were also the
least susceptible to loss of image resolution due to increased tissue depth. Despite lower image
resolution, the in situ MR images correlated well with signal intensity characteristics of the ex
vivo larynges in both systems.
0.3 Tesla system and ex vivo larynges
The 0.3 Tesla imaging systema produced image quality, resolution, and tissue contrast that was
superior in the ex vivo larynges compared to the in situ specimens based on subjective
evaluation. The equine hoof radio-frequency coil accommodated the ex vivo larynx well and
tissue depth did not affect image resolution. The laryngeal structures viewed with the T1-

35
weighted 3D spin echo, T2-weighted 3D spin echo, T2-weighted gradient echo, proton density
spin echo, and short tau inversion recovery STIR sequences were found to have consistent MR
signal intensity characteristics of each structure imaged. The signal characteristics correlated
well with images produced from the 1.5 Tesla systemb. Anatomic structures were accurately
depicted and cartilage morphology was easily evaluated. T1-weighted 3D spin echo imaging
subjectively produced greater resolution and definition of normal laryngeal structures, but was
found to lack image contrast compared to the T2-weighted and inversion recovery sequences.
T2-weighted 3D spin echo and inversion recovery sequences were very similar in appearance
and provided the highest image contrast. Proton density sequences yielded similar tissue
resolution when compared to the T1-weighted sequences, but had the least tissue contrast of the
sequences evaluated. All acquired 0.3 Tesla images proved to have excellent correlation with
gross anatomic specimens.
1.5 Tesla system and ex vivo larynges
The 1.5 Tesla systemb was found to produce high anatomic resolution of the ex vivo equine
larynges; however, the machine could not accommodate the entire equine head for in vivo MRI.
Acquired images accurately and clearly identified the individual laryngeal structures on all
imaging sequences and produced consistent MR signal characteristics of the specific structure.
The image quality, resolution, and tissue contrast were found to be superior to the in situ and ex
vivo larynges of the 0.3 Tesla system based on subjective comparison of the acquired images.
Differentiation of normal anatomic structures and image resolution was superior with T1-
weighted 3D spin echo imaging sequences. Contrast between the laryngeal cartilages and the
surrounding soft tissue was enhanced by the T2-weighted, inversion recovery, and proton density

36
sequences when subjectively compared to the T1 weighted sequences. T2-weighted turbo-spin
echo and turbo inversion recovery (TIRM) sequences were found to be very similar in signal
characteristics. Proton density spin echo sequences were found to be the least desirable images
evaluated and had lower anatomic resolution and decreased tissue contrast. All acquired 1.5
Tesla MR images proved to have excellent correlation with gross anatomic specimens.
MRI signal characteristics of laryngeal structures
The equine larynges were well evaluated with both imaging systems. The mucosa was a thin
margin of high signal intensity enclosing the perimeter of the airway lumen and was similar in all
imaging sequences. The cricoid cartilage lamina was clearly defined as a continuous ring of
intermediate to low signal intensity, surrounding the caudal laryngeal lumen (Figure 1). The
dorsal spine of the cricoid cartilage provided a reference point. The cricoid cartilage lamina on
T2-weighted, proton density, and inversion recovery sequences contained low signal compared
to the T1-weighted sequences (Figure 2, 3). The MRI representation of the cricoid cartilage
correlated well with the gross anatomic sectioned specimen (Figure 4).
The arytenoid cartilages were well defined structures of varying signal intensity. The outer
composition of the arytenoid bodies had a homogenous, intermediate signal on the T1 weighted
images (Figure 5, 6). In the center of the arytenoid cartilages, a core increased signal intensity
represented a small medullary cavity (Figure 5). The cricoarytenoideus lateralis and
thyroarytenoideus muscles were homogenous structures of intermediate signal on the T1-
weighted images had increased signal intensity on the T2- weighted and inversion recovery
sequences (Figure 5, 6, 7). The dorsal region of the arytenoid cartilages lacked resolution on the
37
in situ specimens (Figure 8). The MRI representations of the arytenoid cartilages correlated well
with the gross anatomic specimen (Figure 9). The linear thyroid cartilage lamina was a low
signal structure on all imaging sequences. It also produced bright signal intensity of fat within a
small medullary cavity most evident on the T2-weighted and inversion recovery sequences
(Figure 10, 11). The MR images of the thyroid cartilages correlated well with the gross
specimens (Figure 12).
The vocal folds were represented as well defined linear structures with increased signal intensity
on all imaging sequences. The laryngeal ventricles were very pronounced foci of signal void
with a high signal mucosal lining (Figure 10, 11, 13). The laryngeal ventricles were imaged in
the in situ specimens; however, tissue resolution was poor (Figure 14). The corniculate
processes of the arytenoid cartilages were elongated structures of variable signal intensity, but
contained higher signal intensity than the arytenoid body and muscular process on all imaging
sequences (Figure 15, 16, 17). Excellent correlation was produced between the MR images of
the corniculate processes and the gross specimens (Figure 18).

38
Discussion
MRI was a useful modality for the evaluation of the internal morphology of the equine laryngeal
cartilages in situ and ex vivo. The 0.3 Tesla imaging systema was chosen due to its current
availability in equine clinical practice. The aim of this study was to produce laryngeal MR
images that could be duplicated with anesthetized horses in a clinical setting. This goal was
accomplished with the 0.3 Tesla system and in situ larynges. The in situ laryngeal specimens
provided an accurate model that can be applied for imaging of the anesthetized patient. The
open magnet of the 0.3 Tesla MRI system accommodated an equine head of 23 cm or less in
width, which is similar to the dimensions of a racing Thoroughbred. The in situ and ex vivo
laryngeal specimens were frozen and thawed once prior to imaging. The effect of freezing and
thaw on tissue MRI characteristics and the resulting images was not known and may have
effected the results of the study. Different laryngeal specimens were used in each imaging phase
of the study, which minimized the tissue effect of repetitive freezing and thaw.
Limitations of the 0.3 Tesla imaging system and in situ larynges occurred due to decreased
image resolution as distance from the coil increased since it was not possible to position the in
situ specimen and the radio-frequency coil into the isocenter of the magnet simultaneously. This
limitation proved detrimental to image quality and would likely be improved with an alternative
coil configuration. One such alternative has been reported in human literature and consists of a
solenoidal surface coil wrapped around the neck.11,16 The solenoidal surface coil is commonly
implemented in human laryngeal MRI and fulfills the imaging criteria that the axis of the surface
coil must be orthogonal to the axis of the main magnetic field.11,17 The solenoidal configuration

39
is reported to significantly improve the signal-to-noise ratio over standard human head and neck
coils by 45% - 48%.11 A second radio-frequency surface coil that is reported to significantly
decrease the signal-noise ratio is the saddle configuration.11 The saddle coil encompasses the
larynx on the lateral and ventral sides and when positioned within the isocenter of the magnet,
image production is reported to be superior compared to standard coil configurations. In
preparation for the study reported here, a saddle configuration radio-frequency coil was
developed. The coil proved to be ineffective and non-functional due to coil positioning issues
and difficulty in calibration with the 0.3 Tesla system. Therefore, the developed saddle
configuration coil was excluded from the results of the present study.
Internal morphology of the equine ex vivo larynges were evaluated with the 0.3 Tesla and the 1.5
Tesla imaging systems. As mentioned previously, the 0.3 Tesla system is readily available to the
equine clinician in veterinary practice; therefore, an need to define normal MRI laryngeal
anatomy for that system exists. The 1.5 Tesla imaging system was included in the study for
comparison because the system is the current medical standard for human laryngeal imaging.18
The 1.5 Tesla system would not accommodate equine larynges in situ, was a disadvantage
compared to the 0.3 Tesla system. The equine hoof radio-frequency coilc and the circular-
polarized, transmit and receive radio-frequency extremity coild, were both found to
accommodate the ex vivo laryngeal specimens. Both systems produced clear, diagnostic quality
images; however, tissue resolution, contrast, and detail were improved with the 1.5 Tesla system.
The study reported here was consistent with human literature that reports improvement in image
quality with increasing magnetic field strength. An ex vivo, human study was conducted using a
2.35 Tesla MR imaging system and ex vivo laryngeal specimens to compare the effect of

40
increased magnetic field strength on laryngeal images. A higher field strength using the 2.35
Tesla magnet produced T2-weighted images with superior resolution and improved tissue
contrast than the T1-weighted images.19 The findings of the present study are consistent with
those reported by Kikinis et al. in that the T2-weighted imaging sequences acquired with the 1.5
Tesla system were found to have the highest level of image contrast when compared to the T1-
weighted images and to all of 0.3 Tesla system acquired images.
Optimum MR imaging protocols for the human larynges have been documented. An
intermediate 256 x 256 acquisition matrix is preferred in human medicine for imaging the
laryngeal structures; therefore, the same acquisition matrix was chosen for the study reported
here.20 T1-weighted 3D spin echo MR images are reported to be the most helpful in defining
normal human laryngeal anatomy.11,20 The study reported here correlated with previous reports
in that T1-weighted images had superior tissue resolution and structural definition. However,
image contrast was better expressed subjectively with T2-weighted and inversion recovery
techniques. Previous reports considered it desirable to reduce the field of view as much as
possible to improve spatial resolution.14 This principle was applied in the current study by
limiting the field of view to 16 – 18 cm. Slice thickness is reported to be approximately 4 mm
for most MRI laryngeal applications.12 Other reports exist that promote a slice thickness of 3 – 5
mm for optimum results.18,20 The study reported here adhered to this recommendation and
consisted of a limited slice thickness range of 3 mm – 5 mm. T2-weighted transverse imaging
sequences are reported to provide less spatial resolution, but have been shown to be useful in
defining the interface between deep extension of neoplasia and the surrounding normal soft
tissue structures.12 In the current study, the T2-weighted images had improved contrast when

41
subjectively compared to the other imaging sequences, a characteristic that may be helpful in
localizing laryngeal pathology.
The in situ and ex vivo equine larynges were found to have consistent MRI signal intensity
characteristics between imaging systems. Individual cartilage types were found to have
consistent MRI characteristics when imaged with each sequence. Hyaline cartilage and
fibroelastic cartilage compose the larynges of the horse and vary in degree of ossification.21,22
Hyaline cartilage has low hydrophilic capacity and low hydrogen proton density and therefore,
has a relatively low MR signal intensity.13 Fibroelastic cartilage has a substantial hydrogen
proton content and relatively high MR signal intensity.13 Noncalcified hyaline cartilage is
reported to be of intermediate signal intensity and closely approximates the subcutaneous tissue
and submucosal connective tissue.11-13 The results of the study reported here are consistent with
these previously reported findings.
The cricoid, thyroid, and majority of the arytenoid cartilages have been shown to undergo
variable age related ossification and are composed of hyaline cartilage.21-25 Calcified laryngeal
cartilage is reported to be of low signal intensity, with increased signal within the medullary
space due to the presence of intra-medullary fat.11,12,14,15 The characteristic of increased signal
within the medullary space of the thyroid and arytenoid cartilages were observed in the present
study. The thyroid cartilage had an inverted V configuration when viewed on transverse MR
images and, as reported previously in the human and veterinary literature, was characterized by a
trilaminar appearance.13,14,26 The thyroid cartilage appeared irregular depending on the age of
the patient and the pattern of calcification as reported in previous studies.26
42
The epiglottis and corniculate process of the arytenoid cartilages are composed of fibroelastic
cartilage and are reported to be of high signal intensity.11,12 Bright signal intensity was reported
to be present along the surface of the laryngeal lumen due to the presence of the mucosal lining,
which has a higher hydrogen concentration than the deeper cartilaginous structures.13-15 This
finding was also verified in the study reported here.
The correlation between human MRI laryngeal anatomy and anatomic specimens has been
reported in several studies.24,27 A study by Sakai and coworkers compared the normal MRI
anatomy of the human larynx at a high field strength of 1.5 Tesla in 2 normal excised larynges
and 62 subjects without laryngopharyngeal disease24. The transversely sectioned laryngeal
specimens had excellent correlation to the acquired MR images. In a study by Champsaur and
coworkers, eight harvested laryngeal anatomic specimens were studied with histological sections
made at the same level through the larynx and were of similar slice thickness27. When
compared to the histologic sections of this region, it was determined that all major anatomic
laryngeal structures could be identified and there was excellent correlation between the two
modalities. The results of this study support earlier reports in the human literature and found an
excellent correlation of the MR images of ex vivo larynges with anatomic specimens.
In summary, MRI was determined to be an effective, noninvasive means of evaluation of the
internal morphology of the equine larynges. The MRI characteristics of specific equine
laryngeal structures were consistent with previous reports in the human and veterinary literature
and correlated well with gross anatomic specimens. The technique will be useful in the clinical

43
setting in determining extent and severity of equine laryngeal pathology in such conditions as
arytenoid chondritis.
Footnotes
a Equiscan 3000, Hallmarq Veterinary Imaging Limited, Surrey, England.
b Magnetom Vision-Sonata horizontal long-bore, Siemens Medical Solutions Inc., Malvern, PA,
19355, USA.
c Equine hoof radio-frequency coil, Hallmarq Veterinary Imaging Limited, Surrey, England.
dCircular-polarized, transmit and receive radio-frequency extremity coil, Siemens Medical
Solutions Inc., Malvern, PA, 19355, USA.
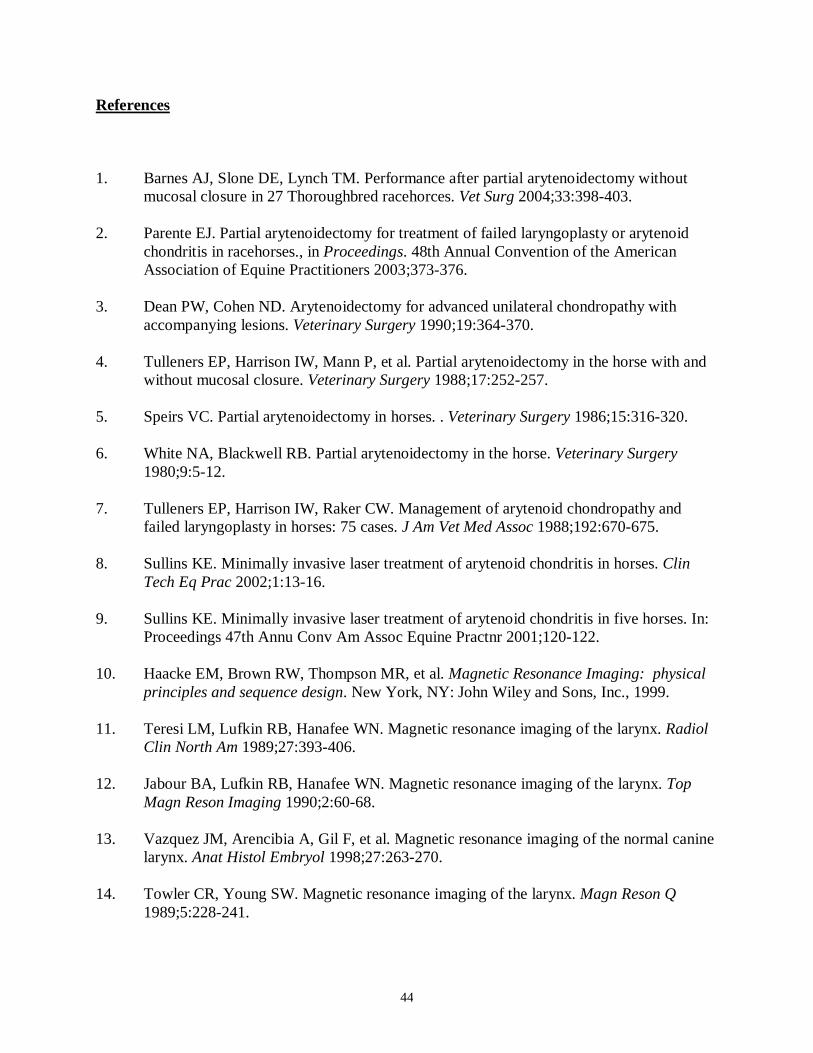
44
References
1. Barnes AJ, Slone DE, Lynch TM. Performance after partial arytenoidectomy without mucosal closure in 27 Thoroughbred racehorces. Vet Surg 2004;33:398-403.
2. Parente EJ. Partial arytenoidectomy for treatment of failed laryngoplasty or arytenoid
chondritis in racehorses., in Proceedings. 48th Annual Convention of the American Association of Equine Practitioners 2003;373-376.
3. Dean PW, Cohen ND. Arytenoidectomy for advanced unilateral chondropathy with
accompanying lesions. Veterinary Surgery 1990;19:364-370. 4. Tulleners EP, Harrison IW, Mann P, et al. Partial arytenoidectomy in the horse with and
without mucosal closure. Veterinary Surgery 1988;17:252-257. 5. Speirs VC. Partial arytenoidectomy in horses. . Veterinary Surgery 1986;15:316-320. 6. White NA, Blackwell RB. Partial arytenoidectomy in the horse. Veterinary Surgery
1980;9:5-12. 7. Tulleners EP, Harrison IW, Raker CW. Management of arytenoid chondropathy and
failed laryngoplasty in horses: 75 cases. J Am Vet Med Assoc 1988;192:670-675. 8. Sullins KE. Minimally invasive laser treatment of arytenoid chondritis in horses. Clin
Tech Eq Prac 2002;1:13-16. 9. Sullins KE. Minimally invasive laser treatment of arytenoid chondritis in five horses. In:
Proceedings 47th Annu Conv Am Assoc Equine Practnr 2001;120-122. 10. Haacke EM, Brown RW, Thompson MR, et al. Magnetic Resonance Imaging: physical
principles and sequence design. New York, NY: John Wiley and Sons, Inc., 1999. 11. Teresi LM, Lufkin RB, Hanafee WN. Magnetic resonance imaging of the larynx. Radiol
Clin North Am 1989;27:393-406. 12. Jabour BA, Lufkin RB, Hanafee WN. Magnetic resonance imaging of the larynx. Top
Magn Reson Imaging 1990;2:60-68. 13. Vazquez JM, Arencibia A, Gil F, et al. Magnetic resonance imaging of the normal canine
larynx. Anat Histol Embryol 1998;27:263-270. 14. Towler CR, Young SW. Magnetic resonance imaging of the larynx. Magn Reson Q
1989;5:228-241.

45
15. Stiglbauer R, Steurer M, Schimmerl S, et al. MRI of cartilaginous tumours of the larynx. Clin Radiol 1992;46:23-27.
16. Lufkin RB, Votruba J, Reicher M. Solenoid surface coils in magnetic resonance imaging.
AJR 1986;146:409-412. 17. Axel L. Surface coil magnetic resonance imaging. J Comput Assist Tomogr 1984;8:381. 18. Curtin HD. Imaging of the larynx: current concepts. Radiology 1989;173:1-11. 19. Kikinis R, Wolfensberger M, Boesch C, et al. Larynx: MR imaging at 2.35 T. Radiology
1989;171:165-169. 20. Castelijns JA, van den Brekel MW, Hermans R. Imaging of the larynx. Semin Roentgenol
2000;35:31-41. 21. Shapiro J, White NA, Schlafer DH, et al. Hypertrophic ossification of the laryngeal
cartilages of a horse. J Equine Med Surg 1979;3:370-374. 22. Orsini PG, Raker CW, Reid CF, et al. Xeroradiographic evaluation of the equine larynx.
Am J Vet Res 1989;50:845-849. 23. Fatterpekar GM, Mukherji SK, Rajgopalan P, et al. Normal age-related signal change in
the laryngeal cartilages. Neuroradiology 2004;46:678-681. 24. Sakai F, Gamsu G, Dillon WP, et al. MR imaging of the larynx at 1.5 T. J Comput Assist
Tomogr 1990;14:60-71. 25. Claassen H, Kirsch T, Simons G. Cartilage canals in human thyroid cartilage
characterized by immunolocalization of collagen types I, II, pro III, IV, and X. Anat Histol Embryol 1996;94:147-153.
26. Branstetter BFt, Weissman JL. Normal anatomy of the neck with CT and MR imaging
correlation. Radiol Clin North Am 2000;38:925-940, ix. 27. Champsaur P, Parlier-Cuau C, Brunet C, et al. Serial anatomy of the larynx in MRI:
MRI-histologic correlations. Surg Radiol Anat 2000;22:5-11.

46
LIST OF FIGURES Page
Figure 1: 1.5 Tesla MRI T1-weighted 3D spin echo transverse image through the 50
caudal larynx at the level of the cricoid and thyroid cartilages of an ex vivo specimen:
(a) Cricoid cartilage, dorsal spine; (b) Cricoid cartilage, ventral lamina; (c) Laryngeal
cavity; (d) Laryngeal mucosa; (e) Thyroid cartilage lamina; (f) Esophagus;
(g) Cricothyroideus m. and submucosa; (h) Sternohyoideus m.
Figure 2: 0.3 Tesla MRI T2-weighted 3D spin echo transverse image through the 50
caudal larynx at the level of the cricoid and thyroid cartilage of an ex vivo specimen:
(a) Cricoid cartilage, dorsal spine; (b) Cricoid cartilage, ventral lamina; (c) Laryngeal
cavity; (d) Laryngeal mucosa; (e) Thyroid cartilage lamina; (f) Esophagus;
(g) Cricothyroideus m. and submucosa.
Figure 3: 1.5 Tesla MRI T2-weighted turbo-spin echo transverse image through the 51
caudal larynx at the level of the cricoid and thyroid cartilage of an ex vivo specimen:
(a) Cricoid cartilage, dorsal spine; (b) Cricoid cartilage, ventral lamina; (c) Laryngeal
cavity; (d) Laryngeal mucosa; (e) Thyroid cartilage lamina; (f) Esophagus;
(g) Cricothyroideus m. and submucosa; (h) Sternohyoideus m.
Figure 4: Gross anatomic specimen through the cricoid cartilage of the caudal larynx: 51
(a) Cricoid cartilage, dorsal spine; (b) Cricoid cartilage, ventral lamina; (c) Laryngeal
cavity; (d) Laryngeal mucosa; (e) Thyroid cartilage lamina; (f) Esophagus;
(g) Cricothyroideus m.

47
Page
Figure 5: 1.5 Tesla MRI T1-weighted 3D spin echo transverse image through the 52
caudal arytenoid region of an ex vivo laryngeal specimen: (a) Arytenoid cartilage;
(b) Arytenoid medullary cavity; (c) Laryngeal cavity; (d) Thyroarytenoideus m.;
(e) Thyroid cartilage lamina; (f) Esophagus; (g) Thyropharyngeus m.;
(h) Sternohyoideus m.
Figure 6: 0.3 Tesla MRI T1-weighted 3D spin echo transverse image through the 52
caudal arytenoid region of an ex vivo laryngeal specimen: (a) Arytenoid cartilage;
(b) Arytenoid medullary cavity; (c) Laryngeal cavity; (d) Thyroarytenoideus m.;
(e) Thyroid cartilage lamina; (f) Esophagus; (g) Thyropharyngeus m.
Figure 7: 1.5 Tesla MRI turbo inversion recovery (TIRM) image through the caudal 53
arytenoid region of an ex vivo laryngeal specimen: (a) Arytenoid cartilage; (b) Arytenoid
medullary cavity; (c) Laryngeal cavity; (d) Thyroarytenoideus m.; (e) Thyroid cartilage
lamina; (f) Esophagus; (g) Thyropharyngeus m.; (h) Sternohyoideus m.
Figure 8: 0.3 Tesla MRI T1-weighted 3D spin echo transverse image through the 53
caudal arytenoid region of an in situ laryngeal specimen: (a) Arytenoid cartilage;
(b) Laryngeal cavity; (c) Thyroarytenoideus m.; (d) Thyroid cartilage lamina; (e)
Thyropharyngeus m.; (f) Caudal extent of laryngeal ventricle.

48
Page
Figure 9: Gross anatomic laryngeal specimen through the caudal arytenoid region: 54
(b) Arytenoid cartilage; (b) Arytenoid medullary cavity; (c) Laryngeal cavity; (d)
Thyroarytenoideus m.; (e) Thyroid cartilage lamina; (f) Esophagus.
Figure 10: 1.5 Tesla MRI T1-weighted 3D spin echo transverse image through the 54
central portion of an ex vivo larynx in the area of the ventricles: (a) Arytenoid cartilage;
(b) Laryngeal cavity; (c) Laryngeal ventricle; (d) Thyroid cartilage lamina; (e) Vocal
fold; (f) Thyropharyngeus m.; (g) Sternohyoideus m.
Figure 11: 1.5 Tesla MRI T2-weighted turbo-spin echo transverse image through the 55
central portion of an ex vivo larynx in the area of the ventricles: (a) Arytenoid cartilage;
(b) Laryngeal cavity; (c) Laryngeal ventricle; (d) Thyroid cartilage lamina; (e) Vocal
fold; (f) Thyropharyngeus m.; (g) Sternohyoideus m.
Figure 12: Gross anatomic specimen through the central portion of the larynx in the 55
area of the ventricles: (a) Arytenoid cartilage; (b) Laryngeal cavity; (c) Thyroid
cartilage lamina; (d) Vocal fold; (e) Esophagus; (f) Thyroarytenoideus m.
Figure 13: 0.3 Tesla MRI T1-weighted 3D spin echo transverse image through the 56
central portion of an ex vivo larynx in the area of the ventricles: (a) Arytenoid
cartilage; (b) Laryngeal cavity; (c) Laryngeal ventricle; (d) Thyroid cartilage lamina;
(e) Vocal fold.

49
Page
Figure 14: 0.3 Tesla MRI T1-weighted 3D spin echo transverse image through the 56
central portion of an in situ larynx in the area of the ventricles: (a) Arytenoid
cartilage; (b) Laryngeal cavity; (c) Laryngeal ventricle; (d) Thyroid cartilage lamina;
(e) Vocal fold.
Figure 15: 1.5 Tesla MRI T1-weighted 3D spin echo transverse image through the 57
rostral portion of an ex vivo larynx at the corniculate processes: (a) Corniculate
process of the arytenoid cartilage; (b) Laryngeal cavity; (c) Thyroid cartilage lamina;
(d) Hyopharyngeus m.; (e) Sternohyoideus m.
Figure 16: 0.3 Tesla MRI proton density image through the rostral portion of an ex vivo 57
larynx at the corniculate processes: (a) Corniculate process of the arytenoid cartilage;
(b) Laryngeal cavity; (c) Thyroid cartilage lamina; (d) Hyopharyngeus m.
Figure 17: 1.5 Tesla MRI inversion recovery (TIRM) transverse image through the 58
rostral portion of an ex vivo larynx at the corniculate processes: (a) Corniculate process
of the arytenoid cartilage; (b) Laryngeal cavity; (c) Thyroid cartilage lamina;
(d) Sternohyoideus m.
Figure 18: Gross anatomic laryngeal specimen through the rostral portion of the larynx 58
at the corniculate processes: (a) Corniculate process of the arytenoid cartilage;
(b) Laryngeal cavity; (c) Thyroid cartilage lamina; (d) Hyopharyngeus m.

50
FIGURES
Figure 1: ex vivo
Figure 2: ex vivo

51
Figure 3: ex vivo
Figure 4: ex vivo

52
Figure 5: ex vivo
Figure 6: ex vivo

53
Figure 7: ex vivo
Figure 8: in situ

54
Figure 9: ex vivo
Figure 10: ex vivo

55
Figure 11: ex vivo
Figure 12: ex vivo

56
Figure 13: ex vivo
Figure 14: in situ
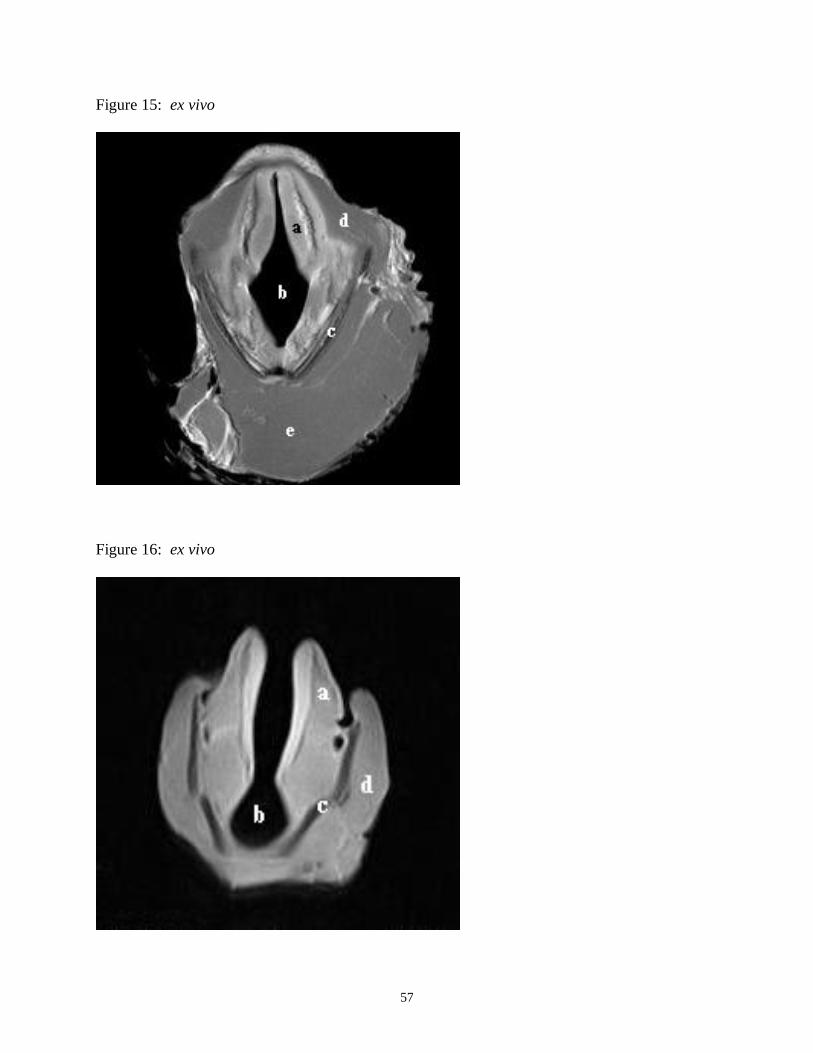
57
Figure 15: ex vivo
Figure 16: ex vivo

58
Figure 17: ex vivo
Figure 18: ex vivo

59
CONCLUSION
The 1.5 Tesla Siemens horizontal long-bore Vision-Sonatab MRI system was found to produce
the highest subjective level of anatomical resolution. The 0.3 Tesla Hallmarq Equiscan 3000 a
allowed imaging of the larynges in situ and was the most relevant to clinical equine practice.
Differentiation and resolution of normal anatomical structures was subjectively superior with T1-
weighted spin echo imaging sequences. T2-weighted sequences and inversion recovery (TIRM
and STIR) sequences were found to be very similar in the images produced. Compared to the
T1-weighted spin echo sequences, they offered improved tissue contrast. The equine larynges
were represented by MRI imaging due to the density of tissue hydrogen present. MR imaging of
the larynges was predictable and consistent in signal intensity based on the tissue composition
and had excellent correlation with gross anatomic specimens. In summary, MRI was determined
to be an effective, noninvasive means for evaluation of the internal morphology of the equine
larynges. The technique will be useful in the clinical setting in determining extent and severity
of equine laryngeal pathology in such conditions as arytenoid chondritis.