magnetic properties of lithium intercalation compounds · pdf file ·...
TRANSCRIPT

Ionics (2006) 12: 21–32DOI 10.1007/s11581-006-0007-5
ORIGINAL PAPER
C. M. Julien . A. Ait-Salah . A. Mauger . F. Gendron
Magnetic properties of lithium intercalation compounds
Received: 13 December 2005 / Accepted: 25 January 2006 / Published online: 26 April 2006# Springer-Verlag 2006
Abstract Magnetic experiments are powerful tools tostudy fundamental properties and to check the qualities ofsamples. Temperature, stress, and impurities of materialscan all affect magnetic properties and play an importantrole in the utilization of these materials for engineeringapplications. The estimation and analysis of the spontane-ous magnetization can reveal ferromagnetic particles asimpurities in samples. The shape of the temperaturedependence of magnetization is indicative of the origin ofthe magnetic properties. However, it is necessary tocorrelate the χm(T) curves and isothermal M(H) plots toachieve a complete analysis of the electronic properties ofthe materials. Highlights of magnetic properties of lithiumintercalation compounds are briefly described. Intrinsicand extrinsic properties are considered as useful parametersto determine the purity of electrode materials for recharge-able Li-ion batteries.
Keywords Li-ion batteries . Intercalation compounds .Magnetic properties . Clustering
Introduction
Magnetism continues to be an important subject, both toprovide insights into the understanding of condensedmatter and cooperative phenomena and for the develop-ment of technologically important materials and devices.Materials may be classified into five categories by their
responses to externally applied magnetic fields, i.e., dia-,para-, ferro-, ferri-, and antiferromagnetic substances. Thestudy of magnetic properties in the solid state implies anexamination of the interaction between the electronsassociated with the metal ions, which are substance-specific. Consequently, these magnetic properties differgreatly in strength. Diamagnetism is a property of allmaterials and opposes applied magnetic fields, but it is avery weak phenomenon. Paramagnetism, when present insemiconductors, can be stronger than diamagnetism andproduces magnetization in the direction of the applied field,and proportional to the applied field. Ferromagnetic andferrimagnetic effects are very large: They producemagnetizations sometimes orders of magnitude largerthan the applied field and, as such, are much larger thaneither diamagnetic or paramagnetic effects.
Magnetic measurements can be extended to studymagnetic structure and electronic properties of materialsused in lithium power sources, i.e., the so-called lithiumintercalation compounds (LiICs). Because Li ions arenonmagnetic (diamagnetic), they indirectly affect magneticproperties through influence on the cation valence of the 3diron-transition element. Magnetic properties are deter-mined by the structure of sublattice in the oxide frame-work, the nature of the metal ions, and the electronic states.In this context, magnetic properties are of particular interestbecause they are found to be a powerful tool to characterizematerials, in particular, when impurities and nanoparticlescannot be detected by classical analysis, i.e., X-raydiffraction (XRD), Fourier transform infrared (FTIR)spectroscopy, etc. Magnetism is therefore indirectlyimportant to the electrochemical properties of materialsas well.
Magnetic measurements are also tools used to check thequality of samples. The estimation and analysis of thespontaneous magnetization can reveal the existence offerromagnetic (ferrimagnetic) particles in samples. Theshape of the temperature dependence of magnetization M(H) is indicative of the origin of the magnetic properties.However, it is necessary to correlate the magnetic suscep-tibility χm(T) curves and isothermal M(H) plots for a
C. M. Julien (*) . A. Ait-Salah . F. GendronInstitut des Nano-Sciences de Paris (INSP),Université Pierre et Marie Curie,CNRS-UMR 7588,Campus Boucicaut, 140 rue de Lourmel,75015 Paris, Francee-mail: [email protected]
A. MaugerDepartment MIPPU, CNRS,Campus Boucicaut, 140 rue de Lourmel,75015 Paris, France
complete analysis of the electronic properties of materials[1].
One goal of the work carried out in our laboratory is theunderstanding of the local structure in LiICs usingresonance spectroscopy, i.e., Raman scattering, Fouriertransform infrared, electron spin resonance, and magneticmeasurements. This paper presents the magnetic propertiesof some LiICs to correlate the structural and electronicproperties of oxides used as positive electrode materials inrechargeable lithium-ion batteries. Here, we considertypical materials such as compounds of the α-NaFeO2-type structure, i.e., LiNiO2 and LiFeO2; Li–Mn–O frame-works with the spinel structure, i.e., LiMn2O4 andLiCoMnO4; and the phospho-olivine lattices, i.e.,LiFePO4, LiMnPO4, and LiNiPO4. The characterizationof the magnetic nanoparticles incorporated in these frame-works is deduced from the magnetic susceptibility andmagnetization measurements.
Experimental procedure
Nowadays, most of the magnetic properties are studied byvarious techniques such as neutron diffractometry, magne-tometry, NMR, and electron spin resonance. The tworesonance spectroscopies are also useful tools for char-acterizing the local structure in materials.
The microscopic magnetic structure of materials is mostoften studied by using neutron scattering techniques, andexperiments are performed to measure the structure andexcitation for all classes of magnetic materials. Morerecently, synchrotron sources have been used to study themagnetic scattering. The range of wavelength and energypossessed by thermal moderated neutrons allows us tostudy not only the nuclear long-range, static nature ofsolids, but also the dynamics (phonons). Similarly, theneutron’s magnetic moment (S=1/2) can be used as a probeto study the magnetism in solids, allowing unparalleledscrutiny of both the magnetic structures (short- and long-range) and the excitations (magnons) of magnetic materi-als. Neutron scattering techniques are presently consideredas the most powerful probe of magnetic materials. When amaterial has ferromagnetic ordering, the magnetic lattice is
the same as the atom lattice, and no new “Bragg reflections”are created (the intensities of existing Bragg reflectionschange). For an antiferromagnetic state, however, themagnetic lattice is not the same as the atom lattice, andnew, purely magnetic Bragg reflections occur. From thepattern of the magnetic Bragg reflections, the details of theantiferromagnetic ordering structure can be deduced, inthe same way that crystal structures are solved from thepattern of the (nonmagnetic) Bragg peaks in XRD and(nuclear) neutron diffraction. Neutron diffraction patternsare currently analyzed using the Rietveld fitting procedure[2].
The use of superconducting quantum interferencedevices (SQUID) in ultrasensitive magnetic measurementsystems may nowadays be considered as a standardtechnique, to the extent that several companies offerreliable and automated commercial SQUID magne-tometers. The SQUID consists of two superconductorsseparated by thin insulating layers to form two parallelJosephson junctions. The device uses a liquid-helium-cooled amplifier to measure the magnetic moment in therange from 10−7 to 300 emu. The field range is from −5.5 to+5.5 T [3].
Data on the temperature dependence of susceptibility arecurrently recorded on heating the sample using two modesto determine the magnetic behavior: zero-field cooling(ZFC) and field-cooling (FC). The procedure is based onperforming two consecutive magnetization measurements:In ZFC, the sample is first cooled down in the absence of amagnetic field and then measured in an applied magneticfield at increasing temperature, FC is performed in a similarmagnetic field at decreasing temperature. The resultsobtained in this way can exhibit a strong dependence ofmagnetization. The temperature range in which a magnetichysteresis appears and the temperature at which a magneticordering can be detected should be emphasized.
Magnetic properties of solid-state materials
This section summarizes the general trends of magneticproperties for solid-state materials. In electrical engineer-ing, the magnetic susceptibility is the degree of magneti-
Paramagnetism Ferromagnetism Antiferromagnetism
exchange
integral >0
exchange
integral <0
χ
T0
χ
T0 T
Com
ple
x b
ehav
ior
χ
T0 Tθ
T
Cm =χ
TT
C
−=χ
T
C
θχ
+=
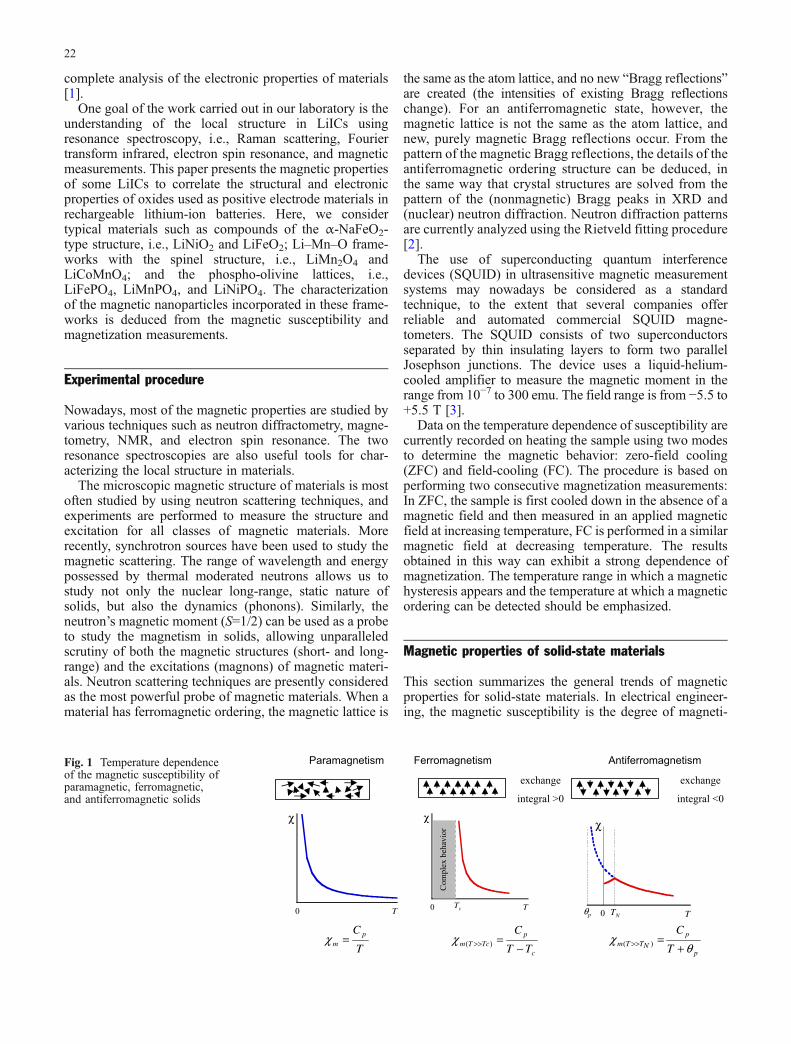
Fig. 1 Temperature dependenceof the magnetic susceptibility ofparamagnetic, ferromagnetic,and antiferromagnetic solids
22
zation of a material, M is the magnetic dipole moment perunit volume in response to a magnetic field H, as
χm ¼ @M
@H: (1)
If χm is positive, the material is called paramagnetic and themagnetic field is strengthened by the presence of thematerial. If χm is negative, then the material is diamagneticand the magnetic field is weakened in the presence of thematerial. Figure 1 displays the temperature dependence ofthe magnetic susceptibility of paramagnetic, ferromagnetic,and antiferromagnetic solids [4].
Paramagnetic materials attract and repel like normalmagnets when subjected to a magnetic field. For thermalequilibrium, the magnetization of paramagnets is treatedusing the Brillouin formalism. Under relatively lowmagnetic field saturation when the majority of atomicdipoles are not aligned with the field, paramagneticmaterials exhibit magnetization according to the well-known Curie–Weiss law, which treats the interactionbetween spins and molecular field
χm ¼ Cp
T þ θp; (2)
where Cp is the Curie constant. The Weiss constant, θp,typically accounts for magnetic ordering of the electronicmoments below the Curie or Néel temperature foruncorrelated spins (in salts, for instance) θp=0 (seeFig. 1). For a paramagnet having an effective momentμeff, the Curie constant is written as
Cp ¼ NAp2effμ2B
3kB; (3)
where NA is the molar concentration of ions and μB theBohr magneton (μB=9.274×10
−24 J/T). The effectivemomentum number peff is defined as
ptheoreff ¼ 2 S S þ 1ð Þ½ �1=2; (4)
where S refers to the electronic spin quantum number.Equation (4) is used in the case of the “quenching” of theorbital angular momentum (L=0 and J=S), which occursfrequently for transition-metal ions from the iron group.Table 1 shows the theoretical magneton numbers for irongroup ions. Paramagnetic ions with electronic spin, S (e.g.,S=3/2 for d3 ions Mn4+ and Cr4+), are associated withmagnetic moments, μeff=−gμBS, that align in the presenceof static magnetic field H0.
When the Curie constant is determined experimentallyby fitting the linear χm
−1(T) curve in the paramagneticdomain, one can estimate the experimental value for peffand then know the electronic configuration of the magneticion (in the quenched configuration) using the followingequation:
pexpeff ¼ 3kBCp
NAμ2B
� �1=2
¼ 2:84ffiffiffiffiffiffiCp
p: (5)
An important class of magnetic materials is that offerromagnets: iron, nickel, cobalt, and manganese. Aferromagnetic substance possesses a spontaneous magneticmoment even in the absence of an applied magnetic field.
Table 1 Electron configurations and net spins for transition element cations and effective magneton numbers for iron group ions [5]
Ion Configuration Basic level Free cation Cubic field
S peff S peff
Mn4+, Cr3+ 3d3 4F3/2 3/2 3.87 3/2 3.87Mn3+, Cr2+ 3d4 5D0 2 4.90 1 2.83Fe3+, Mn2+ 3d5 6S5/2 5/2 5.92 1/2 1.73Fe2+, Co3+ 3d6 5D4 2 4.90 0 0Co2+, Ni3+ 3d7 4F9/2 3/2 3.87 1/2 1.73Ni2+ 3d8 3F4 1 2.83 1 2.83Cu2+ 3d9 2D5/2 1/2 1.73 1/2 1.73
The free ions and cations in strong cubic fields are considered
0.00
0.02
0.04
0.06
0 50 100 150 200 250 300
Mola
r susceptibili
ty χ
m (em
u/m
ol)
Temperature (K)
α -NaFeO2
H=0.5 Tesla
T =11 K
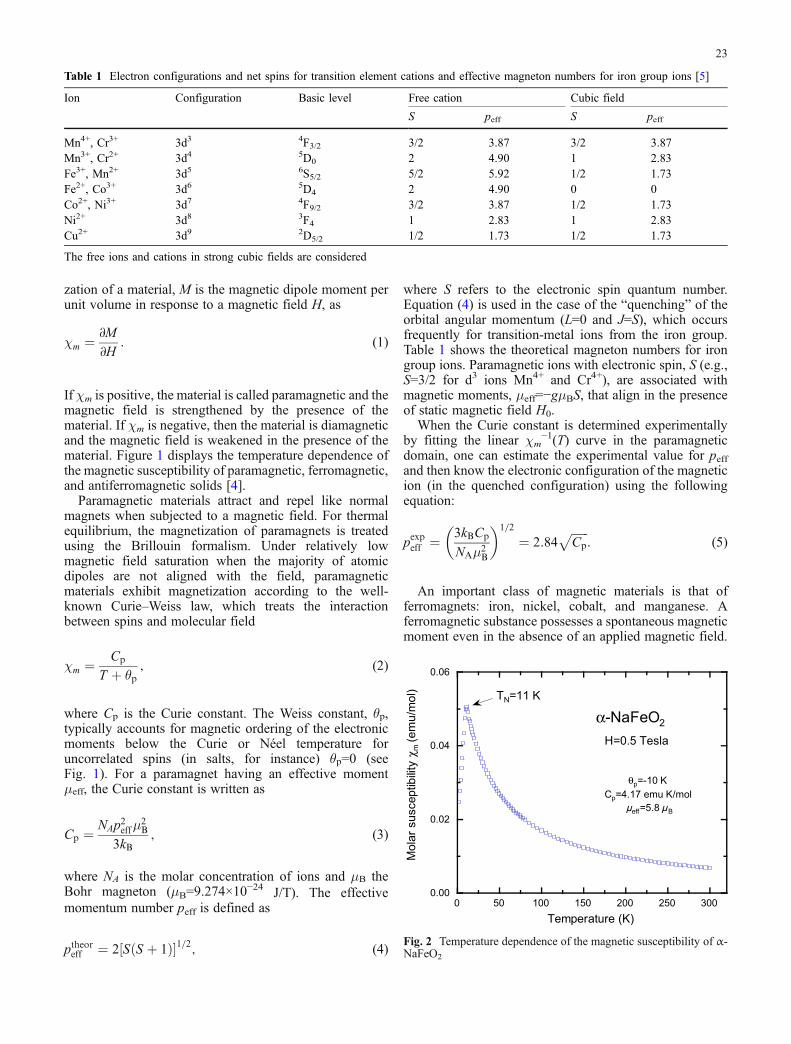
Fig. 2 Temperature dependence of the magnetic susceptibility of α-NaFeO2
23
The saturation magnetization MS is defined as the spon-taneous magnetic moment per unit volume. The Curiepoint Tc is the temperature above which the spontaneousmoment vanishes. For iron, Tc=1,043 K [4].
The antiferromagnetic state is characterized by anordered, antiparallel arrangement of electron spins. Thesimplest situation in antiferromagnetism arises when thelattice of paramagnetic ions can be divided into twointerpenetrating sublattices. We recognize antiferromagne-tism by a well-defined kink in the curve of the magneticsusceptibility vs temperature. This kink determines theNéel temperature, TN. Antiferromagnets are also character-ized by a negative value of the Curie temperature. Figure 1summarizes the temperature dependence of the magneticsusceptibility for paramagnetic, ferromagnetic, and anti-ferromagnetic solids.
The paramagnetic temperature θp (also called the Weissconstant) is defined as the intercept of the temperature-axis
of the high-temperature asymptote to the χm1(T) curve.
Depending on the type of antiferromagnetic interactions, θpcould be positive or negative. It should be emphasized thatθp is different than the Néel temperature, TN, which is thetemperature at which an antiferromagnetic materialbecomes paramagnetic—that is, the thermal energybecomes large enough to upset the magnetic orderingwithin the material. TN corresponds to the cusp in theχm
1(T) curve.In metals, the conduction electrons are not spatially
localized like electrons in partially filled ionic shells.Thus, the magnetic susceptibility of metals follows thePauli-type paramagnetism, which is essentially indepen-dent on temperature [4]. In contrast, the magnetic suscep-tibility of localized electrons closely follows inversetemperature dependence due to the thermal agitation ofspin moments. The magnetic molar susceptibility oflocalized moments will exhibit Curie–Weiss behaviors inthe absence of strong ferromagnetic, ferrimagnetic, orantiferromagnetic couplings.
Many battery-grade materials are paramagnetic in thedischarged or charged state. For example, the positiveelectrode material LiMn2O4 is a mixed-valence compoundcontaining Mn3+ (d4) and Mn4+ (d3) ions. Although thelow-spin (d6) Co3+ ions (nominally diamagnetic) inLiCoO2 have paired d-electrons in the fully dischargedstate, Li1−xCoO2 contains Co4+ (d5) ions when charged.LiNiO2 contains the paramagnetic S=1/2 ions Ni3+ (d7) inthe discharged state.
Magnetic properties of layered oxides
A wide variety of LiICs have been studied which includelayered compounds based on the α-NaFeO2-type structure(e.g., LiCoO2, LiNiO2, LiNi0.5Mn0.5O2). The structure–magnetic relationships of sodium and lithium ferrites havebeen investigated to evaluate detectable ferromagneticimpurities [6, 7]. The α-NaFeO2-type structure is built byalternating layers of trigonally distorted FeO6 and NaO6
0.0
0.5
1.0
1.5
0 100 200 300
M/H
(10
-3 c
m3/g
)
Temperature (K)
Li0.99Ni1.01O2
TN=8 K
0.6
0.8
1.0
1.2
1.4
0 5 10 15 20
ZFC
FC
TN
Temperature (K)M
/H (
em
u/g
)
a
0
40
80
120
0 50 100 150 200 250 300
χ m-1
(cm
3/g
)
Temperature (K)
Li0.99Ni1.01O2
θp=30 K
Cp=0.004 emu K/g
µ=1.77µB
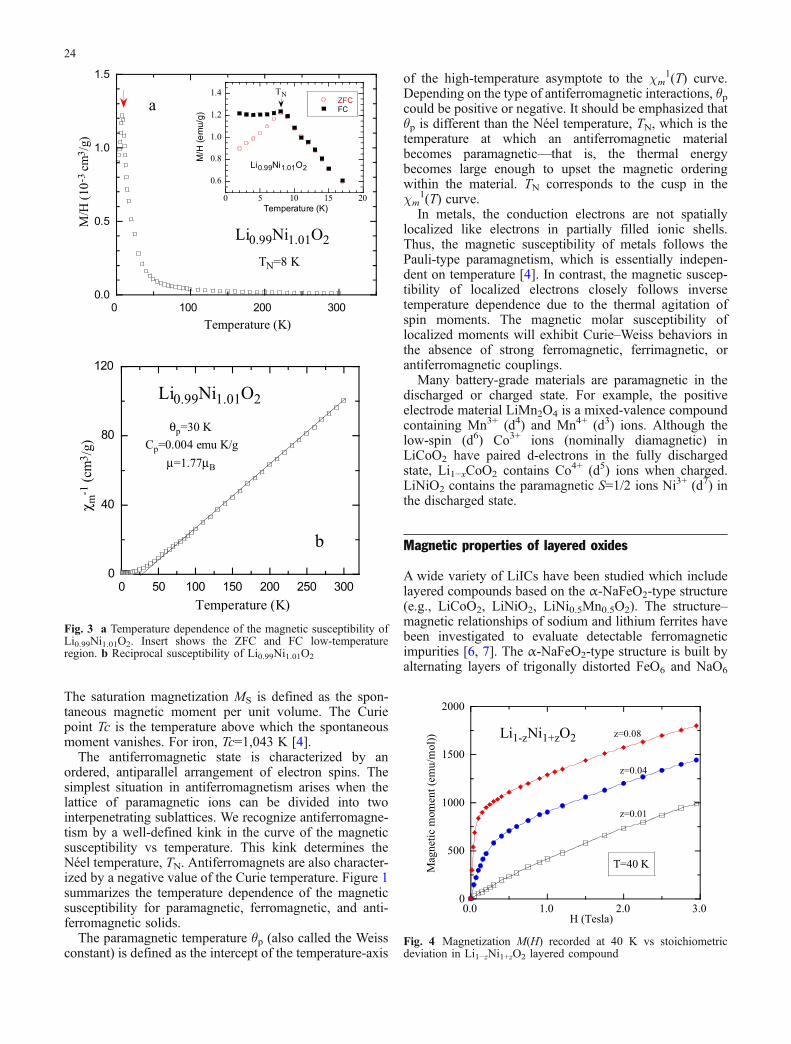
b
Fig. 3 a Temperature dependence of the magnetic susceptibility ofLi0.99Ni1.01O2. Insert shows the ZFC and FC low-temperatureregion. b Reciprocal susceptibility of Li0.99Ni1.01O2
0
500
1000
1500
2000
0.0 1.0 2.0 3.0
Mag
net
ic m
om
ent
(em
u/m
ol)
)
H (Tesla)
z=0.01
z=0.04
z=0.08Li1-zNi1+zO2
T=40 K
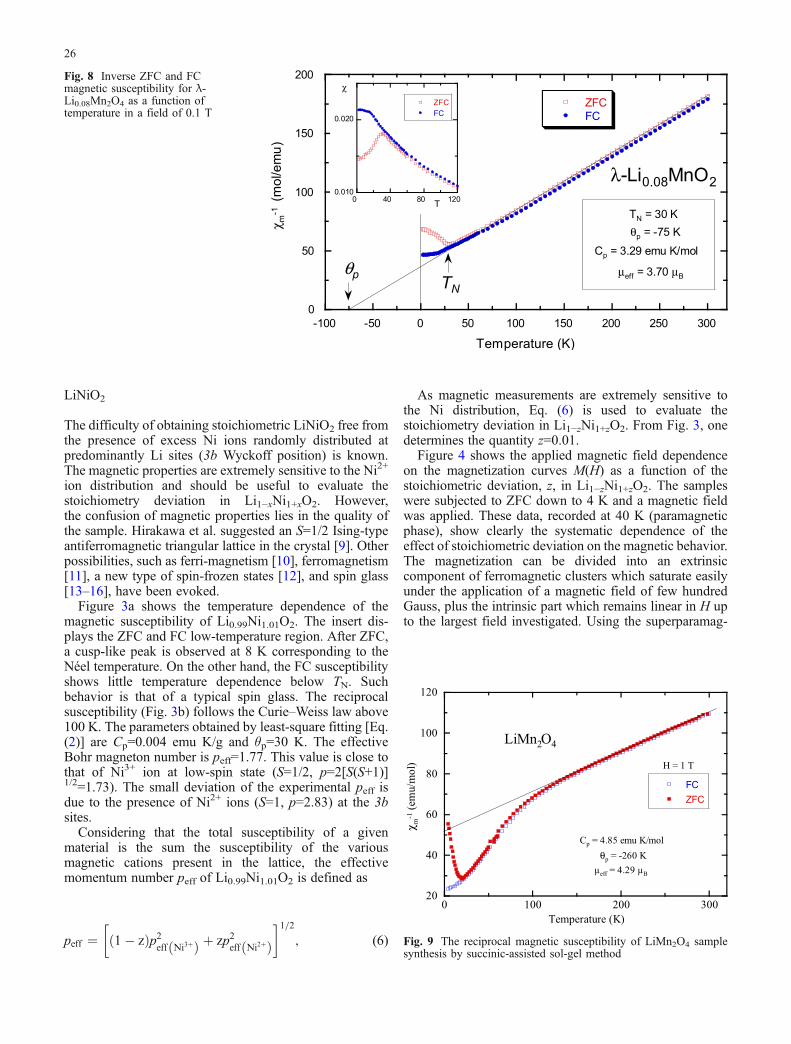
Fig. 4 Magnetization M(H) recorded at 40 K vs stoichiometricdeviation in Li1−zNi1+zO2 layered compound
24

octahedra sharing edges. Many LiMO2 (M=Ni, Co, Fe, andCr) compounds have this typical structure which is suitablefor very efficient electrochemical lithium extraction–inser-tion process. The unit cell is rhombohedral (R3m spacegroup). The transition-metal ions M are located inoctahedral 3a (000) sites, and oxygen anions are in acubic close-packing, occupying the 6c (00z, 00z) sites. Lications reside at Wyckoff 3b (001/2) sites. The transitionmetal and lithium ions are occupying the alternating (111)planes.
α-NaFeO2
Samples of α-NaFeO2 prepared by hydrothermal treatmentof a mixture of α-FeOOH and concentrated NaOH aqueous
solution appear as simple antiferromagnets below the Néeltemperature TN=11 K. Therefore, they do not include anyferromagnetic clusters such as Fe3O4 or γ-Fe2O3 particles.The temperature dependence of the molar magneticsusceptibility is shown in Fig. 2.
Fitting with the Curie–Weiss law, one obtainsCp=4.17 emu K/mol and θp=−10 K. The negative θpvalue suggests that antiferromagnetic interactions arepresent in α-NaFeO2. Using Eq. (2), the effective magneticmoment, μeff, is calculated to be 5.8 μB, which is very closeto a spin-only value of high-spin Fe3+ (5.92 μB).
The effective magnetic moment of LiFeO2 is affectedmarkedly by the contribution of ferromagnetic impurities,easily saturated at the magnetic fields used in theexperiments. Two anomalies have been revealed at 40–50and 90–280 K. The presence of a ferromagnetic impuritysuch as LiFe5O8 spinel gives a relatively high μeff value.The variation of the Néel temperature for various LiFeO2
polymorphs is related to the degree of tetragonal distortion[8].
0
5
10
0 50 100 150 200 250 300
LiNi0.8Co0.2O2
FCZFC
Lo
ng
mo
me
nt
(em
u/m
ol)
Temperature (K)
0.00
0.10
0.20
0.30
0 50 100 150 200 250 300
FC
ZFC
Lo
ng
mo
me
nt
(em
u/m
ol)
Temperature (K)
LiNi0.7Co0.3O2
H=50 Oe
Fig. 5 Temperature of the ZFC and FC molar magnetic suscepti-bility measured under a field H=50 Oe of LiNi1−yCoyO2 samples foray=0.2 and by=0.3. A strong deviation from the paramagneticbehavior is observed at low-temperatures for the y=0.2 sample
-60 -40 -20 0 20 40 60
-3000
-2000
-1000
0
1000
2000
3000
T= 5K
T=50K
T=100K
T=300K
M(e
mu/m
ol)
H(kOe)
Fig. 6 ZFC magnetization vs applied magnetic field at T=5, 50,100, and 300 K for LiNi0.8Co0.2O2
0
1
2
3
4
0.0 0.1 0.2 0.3 0.4
Clu
ste
r ra
diu
s (
nm
)
Composition y(Co)
LiNi1-yCoyO2
Fig. 7 Size of the ferromagnetic clusters in LiNi1−yCoyO2 samples
25
LiNiO2
The difficulty of obtaining stoichiometric LiNiO2 free fromthe presence of excess Ni ions randomly distributed atpredominantly Li sites (3b Wyckoff position) is known.The magnetic properties are extremely sensitive to the Ni2+
ion distribution and should be useful to evaluate thestoichiometry deviation in Li1−xNi1+xO2. However,the confusion of magnetic properties lies in the quality ofthe sample. Hirakawa et al. suggested an S=1/2 Ising-typeantiferromagnetic triangular lattice in the crystal [9]. Otherpossibilities, such as ferri-magnetism [10], ferromagnetism[11], a new type of spin-frozen states [12], and spin glass[13–16], have been evoked.
Figure 3a shows the temperature dependence of themagnetic susceptibility of Li0.99Ni1.01O2. The insert dis-plays the ZFC and FC low-temperature region. After ZFC,a cusp-like peak is observed at 8 K corresponding to theNéel temperature. On the other hand, the FC susceptibilityshows little temperature dependence below TN. Suchbehavior is that of a typical spin glass. The reciprocalsusceptibility (Fig. 3b) follows the Curie–Weiss law above100 K. The parameters obtained by least-square fitting [Eq.(2)] are Cp=0.004 emu K/g and θp=30 K. The effectiveBohr magneton number is peff=1.77. This value is close tothat of Ni3+ ion at low-spin state (S=1/2, p=2[S(S+1)]1/2=1.73). The small deviation of the experimental peff isdue to the presence of Ni2+ ions (S=1, p=2.83) at the 3bsites.
Considering that the total susceptibility of a givenmaterial is the sum the susceptibility of the variousmagnetic cations present in the lattice, the effectivemomentum number peff of Li0.99Ni1.01O2 is defined as
peff ¼ 1� zð Þp2eff Ni3þð Þ þ zp2
eff Ni2þð Þ� �1=2
; (6)
As magnetic measurements are extremely sensitive tothe Ni distribution, Eq. (6) is used to evaluate thestoichiometry deviation in Li1−zNi1+zO2. From Fig. 3, onedetermines the quantity z=0.01.
Figure 4 shows the applied magnetic field dependenceon the magnetization curves M(H) as a function of thestoichiometric deviation, z, in Li1−zNi1+zO2. The sampleswere subjected to ZFC down to 4 K and a magnetic fieldwas applied. These data, recorded at 40 K (paramagneticphase), show clearly the systematic dependence of theeffect of stoichiometric deviation on the magnetic behavior.The magnetization can be divided into an extrinsiccomponent of ferromagnetic clusters which saturate easilyunder the application of a magnetic field of few hundredGauss, plus the intrinsic part which remains linear in H upto the largest field investigated. Using the superparamag-
0
50
100
150
200
-100 -50 0 50 100 150 200 250 300
ZFC
FC
χ m-1
(m
ol/e
mu
)
Temperature (K)
λ-Li0.08MnO2
θp
TN
T
Fig. 8 Inverse ZFC and FCmagnetic susceptibility for λ-Li0.08Mn2O4 as a function oftemperature in a field of 0.1 T
20
40
60
80
100
120
0 100 200 300
FC
ZFC
χ-1
(em
u/m
ol)
Temperature (K)
LiMn2O4
H = 1 T
Fig. 9 The reciprocal magnetic susceptibility of LiMn2O4 samplesynthesis by succinic-assisted sol-gel method
26
netic formalism, the magnetization curves are readilycomputed from the equation:
M ¼ M clu þ χintH; (7)
where χint is the intrinsic susceptibility andMclu(T,H) is the
self-consistent solution of Eq. (6)
M cluðT ;HÞ ¼ Nμeffð0Þnμeffð0ÞH
kBT
� �: (8)
£ is the Langevin function, N represents cluster concentra-tion, n is the concentration of ferromagnetic particles percluster, and μeff is the magnetic moment associated withone cluster. Here the Langevin function can be used due tothe presence of macroscopic spins μeff(0). Using Eqs. (7)and (8), the fit of the magnetization curve allows us todetermine the Ni2+ content in Li1−zNi1+zO2.
LiNi1yCoyO2
Because isostructural LiCoO2–LiNiO2 solid solutionsdisplay better electrochemical cyclability than parentoxide end-members, it is now generally recognized thatLiNi0.8Co0.2O2 is a potential next-generation positiveelectrode material to replace LiCoO2. LiNi1−yCoyO2
compounds with 0≤y≤1 were prepared as polycrystallinenanomaterials (d≈200 nm) following a low-temperaturesol-gel method [17]. XRD studies indicate that thesematerials are single phase for 0.2≤y≤1.0 with an ordereddistribution of Li and Ni/Co in the layered structure.Nevertheless, as this technique provides only averaged
structural information, it is still possible that, locally, thereare some defects, among them disorder, that could affectthe electrochemical behaviors of these materials. In fact,through FTIR spectroscopy, we observe for the Li–O banda slight deviation from a linear behavior for high nickelcontent (y≤0.2), which is attributed to the presence of Nications in the octahedral interstices of the predominantlylithium layers (cation mixing). In addition, by means ofmagnetic measurements, χm(T) and M(H), we detect in allthe samples a ferrimagnetic signal, which gets smaller andsmaller as the Co content increases, but indeed reveals thepresence of some Ni2+ ions occupying Li+ sites that wouldlead to the formation of small ferromagnetic islands. Fromthose magnetic measurements, we have estimated the sizeof nanometric magnetic inhomogenities.
Figure 5a and b show the temperature dependence of themagnetic moment of LiNi1−yCoyO2 for y=0.2 and y=0.3,respectively. The first general observation is that thesamples with high Ni content (y≤0.2) show ferrimagneticbehavior with a value of Tc, which quickly decreases fromTc(y=0)∼215 K to Tc(y=0..2)∼65 K as y increases, as seen inthe χm(T) and M(H) curves (Fig. 6). Taking into accountthat perfectly stoichiometric LiNiO2 is considered to be afrustrated antiferromagnetic compound [18], this ferrimag-netic response would be indicative of the existence of Ni2+
ions occupying Li+ places [18, 19]. These interslab ionswould lead to a ferromagnetic ordering of the Ni ions intwo adjacent (Ni1−yCoyO2)n slabs and to the formation ofsmall ferromagnetic islands in their surroundings with theconcomitant apparent ferrimagnetic behavior.
In the samples with intermediate substitutions(0.2<y≤0.4), the magnetic features are different. Partialsubstitution of Ni3+ by Co3+ suppresses the ferrimagneticresponse, reflecting that the addition of Co3+ inhibits thepresence of the interlayer Ni2+ ions, and therefore favors abetter lamellar structure. The positive Curie–Weiss con-stant calculated for 100<T<300 K (θp≈+30 K) shows thatthe Ni–O–Ni nearest neighbor interactions are still presentat intermediate substitution levels. Apart from thesegeneral trends, magnetic measurements can also providean approximation to the size of these magnetic islands. Inthis context, a blocking temperature, which decreases as
0
500
1000
1500
2000
-50 0 50 100 150 200 250 300 350
y=0.0
y=0.4
y=0.6
y=1.0
1/L
on
g M
om
en
t (e
mu
)
Temperature (K)
LiMn2-yCoyO4
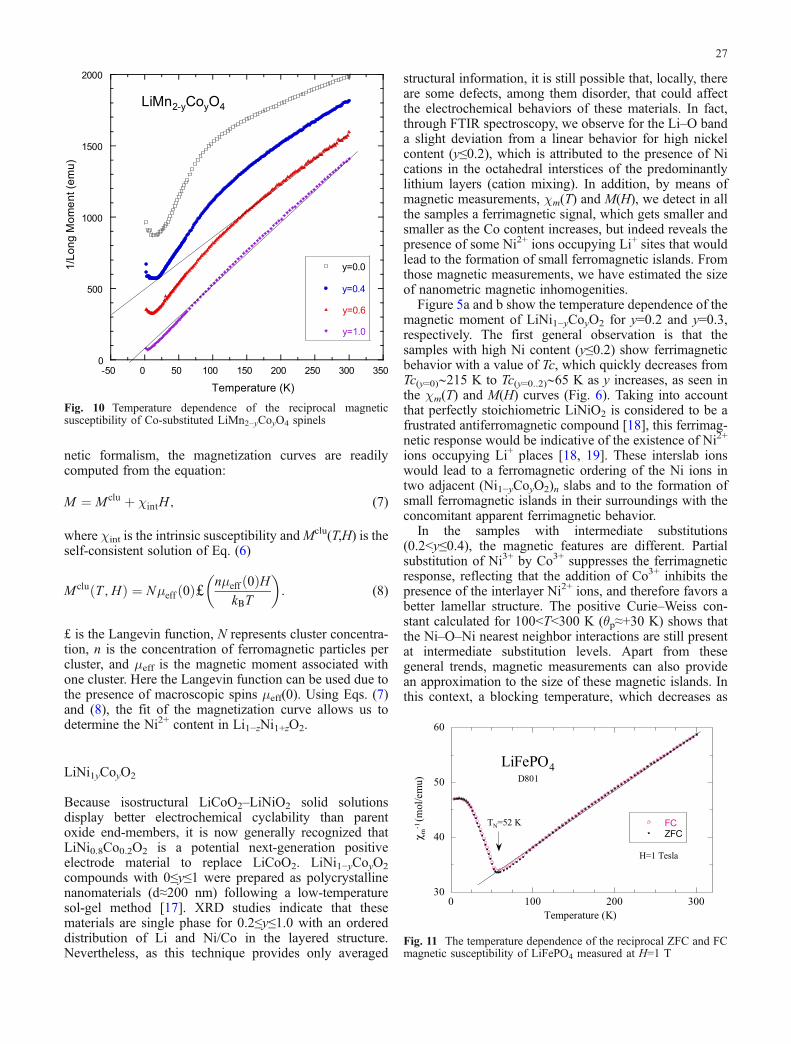
Fig. 10 Temperature dependence of the reciprocal magneticsusceptibility of Co-substituted LiMn2−yCoyO4 spinels
£
30
40
50
60
0 100 200 300
FCZFCχ
-1 (m
ol/
em
u)
Temperature (K)
LiFePO4D801
H=1 Tesla
T =52 K
Fig. 11 The temperature dependence of the reciprocal ZFC and FCmagnetic susceptibility of LiFePO4 measured at H=1 T
27
the Co content increases, is observed in all the ZFC- andFC-type curves for χm(T). In the high-field region, at thistemperature, it is possible to obtain the magnetic anisot-ropy, K, from the magnetization measurements vs themagnetic field. To do so, we have to take into account thatthe magnetization approach to saturation can be fitted to theexpression [1]
M Hð Þ ¼ MS 1� a
H� b
H2
� �þ cH ; (9)
whereMS is the saturation magnetization and a, b, and c aresuitable constants. The second term, cH, is the low-fieldcontribution, which is negligible near the saturation. Twoexamples of these fits for the LiNi1−yCoyO2 samples withy=0.2 and 0.4 can be seen in Fig. 7a,b, and that the bconstant is related to the magnetic anisotropy, K, by theexpression [20]
b ¼ βK2
M2S
; (10)
where β is a constant that depends on the type of material.Assuming a typical value for the β constant (i.e.,
β=0.0762 [21]), we can deduce the magnetic anisotropyconstant from first magnetization curves from
K ¼ bM2S
0:0762
� �1=2
: (11)
Following this procedure, we find that the magneticanisotropy value, which is 6.5×10⁶ erg/cm3 for the LiNiO2
sample at 200 K, increases upon cobalt doping. Interest-ingly enough, these values are related to the volume of themagnetic clusters that lead to the blocking temperature in
the χm(T) ZFC- and FC-type curves. In this context, we canassume [1]
KV ¼ 25kBTB; (12)
where V is the volume of the magnetic clusters, kB is theBoltzmann’s constant, and TB is the blocking temperatureof each particular sample.
Now, supposing that these magnetic clusters are spher-ical, we obtain that they would have a mean radii ofR=3.5 nm in the case of the LiNiO2 sample, and that theirsize decreases upon Co-doping, becoming R=1.2 nm in thesample with y=0.2, and being further reduced to 0.5 nm inthe samples with y=0.3 and 0.4, as shown in Fig. 7.
Magnetic properties of spinels
The spinel material LiMn2O4 can be cycled at ca. 4 V vsLi+/Li from LiMn2O4 to λ-MnO2 with manganese ions
0
100
200
300
400
500
600
700
0 5000 10000 15000 20000 25000 30000 35000
4 K100K150 K200 K220 K240 K280 K300 K
Magnet
ic m
om
ent
(em
u/m
ol)
Magnetic field (Gauss)
LiFePO4
sample D802
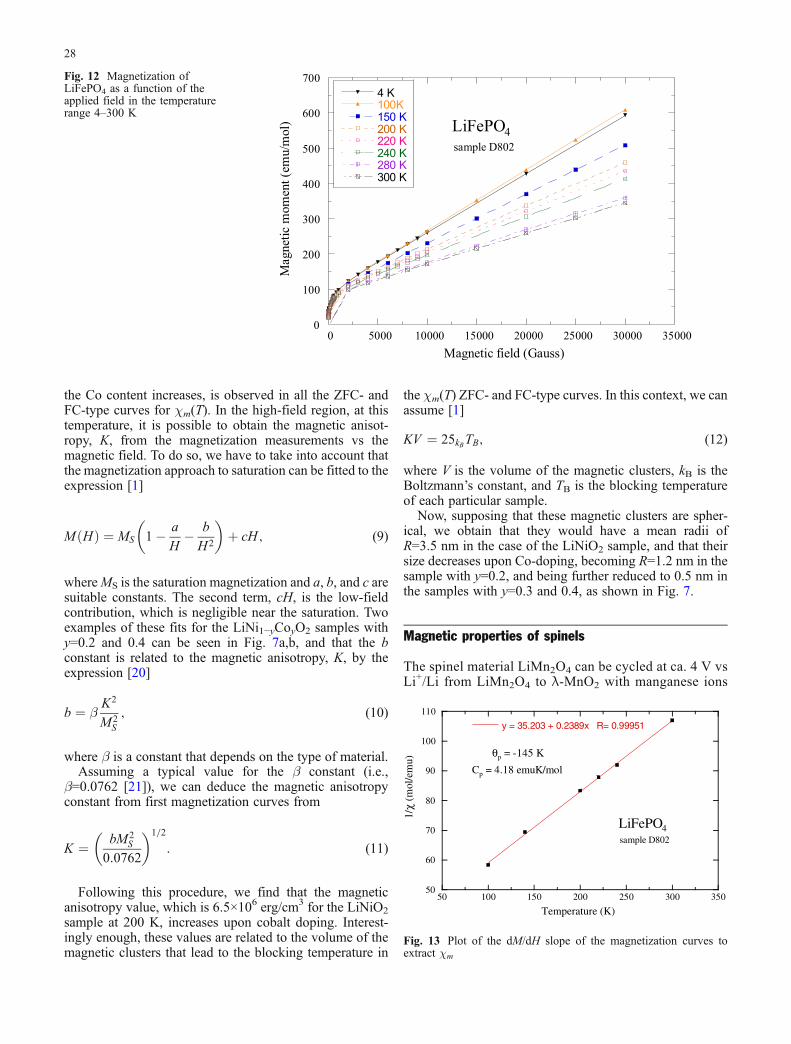
Fig. 12 Magnetization ofLiFePO4 as a function of theapplied field in the temperaturerange 4–300 K
50
60
70
80
90
100
110
50 100 150 200 250 300 350
y = 35.203 + 0.2389x R= 0.99951
1/χ
(mol
/em
u)
Temperature (K)
LiFePO4
θp = -145 K
Cp = 4.18 emuK/mol
sample D802
Fig. 13 Plot of the dM/dH slope of the magnetization curves toextract χm
28
remaining the spinel host lattice throughout. LiMn2O4 spinelhas shown interesting magnetic properties [22–27]. From thepoint of view of magnetic interactions, both direct (Mn3+/4+–Mn3+/4+) and superexchange (90°Mn3+/4+–O2−Mn3+/4+) inter-actions are conceivable between the nearest Mn neighbors.According to Goodenough, only Mn4+–O2−Mn4+ interac-tion is in ferromagnetic coupling, while all otherinteractions are in antiferromagnetic coupling [28].
λ-Li0.08MnO2
Figure 8 shows the inverse magnetic susceptibilityobtained after the lithium extraction from LiMn2O4. Overthe temperature range 100–300 K, assuming that only thespin part of the Mn ions contributes to paramagneticmoment, the fit of the Curie–Weiss law is obtained with thefollowing values: θp=−75 K and Cp=3.29 emu K/mol. Theθp value is negative, consistent with the apparentantiferromagnetic ordering below TN=30 K. From theCurie constant, the effective moment is determined to beμeff=3.70μB, which is a value smaller than the theoreticalspin-only value of 3.87μB for Mn4+ ion. An increase in thenominal manganese oxidation state from +3.5 to +4 shouldresult in a greater covalence state due to the removal of σantibonding eg electrons associated with the manganese 3dstate. So, λ-MnO2 has a greater covalency in the Li–O–Mn4+ bond than in the Li–O–Mn3.5+ bond.
The abrupt increase of magnetization (insert of Fig. 8) isnoticeable with decreasing temperature below 30 K, indi-cating the presence of a ferromagnetic component. Theorigin of this ferromagnet could be a small amount ofimpurity phases, such as ferromagnetic Mn3O4, which isprobably produced during the lithium extraction fromLiMn2O4. However, the observation of spin-glass behaviorat temperatures below the paramagnetic regime in the cubicphases LiMn2O4 and λ-Li0.07MnO2 has been reported byJang et al. [24]. The existence of frozen spins is consistentwith the presence of a significant fraction of spinsdisordered well below the Néel temperature. The value ofthe ratio f=θp/TN=2.5 is indicative of a frustrated antiferro-magnet. The geometric frustration inherent in the Mn
sublattice, which is comprised of a three-dimensional arrayof a corner-sharing tetrahedral, has been discussed byGreedan et al. [26].
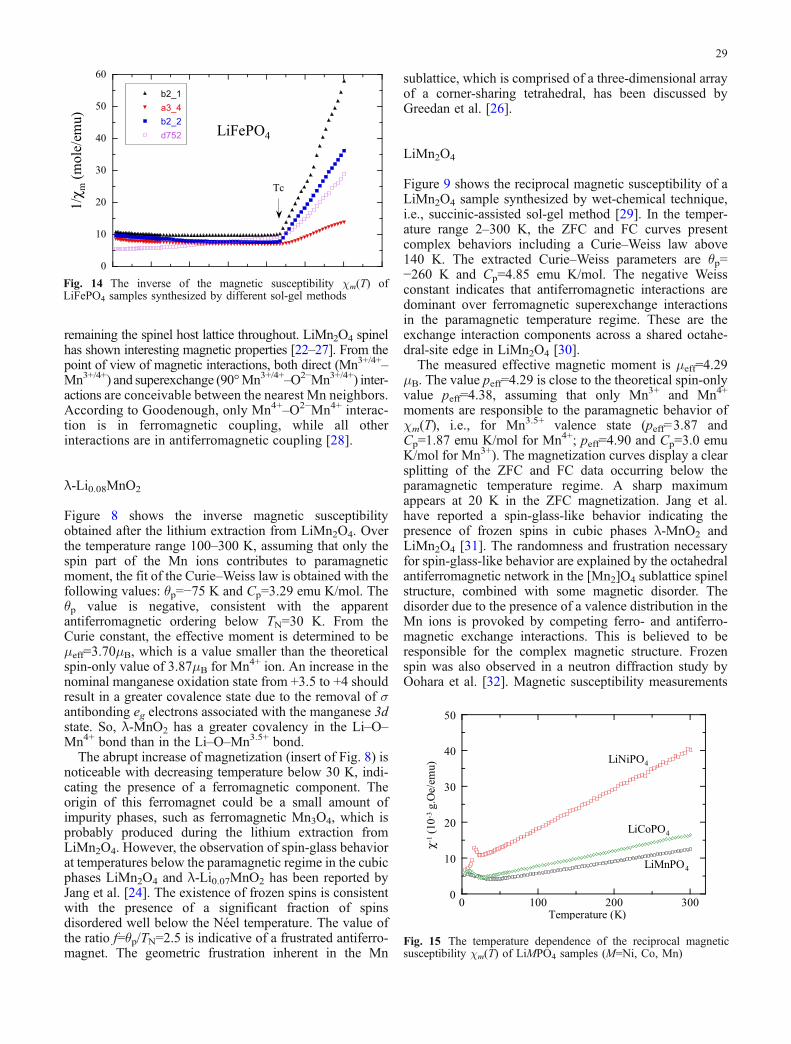
LiMn2O4
Figure 9 shows the reciprocal magnetic susceptibility of aLiMn2O4 sample synthesized by wet-chemical technique,i.e., succinic-assisted sol-gel method [29]. In the temper-ature range 2–300 K, the ZFC and FC curves presentcomplex behaviors including a Curie–Weiss law above140 K. The extracted Curie–Weiss parameters are θp=−260 K and Cp=4.85 emu K/mol. The negative Weissconstant indicates that antiferromagnetic interactions aredominant over ferromagnetic superexchange interactionsin the paramagnetic temperature regime. These are theexchange interaction components across a shared octahe-dral-site edge in LiMn2O4 [30].
The measured effective magnetic moment is μeff=4.29μB. The value peff=4.29 is close to the theoretical spin-onlyvalue peff=4.38, assuming that only Mn3+ and Mn4+
moments are responsible to the paramagnetic behavior ofχm(T), i.e., for Mn3.5+ valence state (peff=3.87 andCp=1.87 emu K/mol for Mn4+; peff=4.90 and Cp=3.0 emuK/mol for Mn3+). The magnetization curves display a clearsplitting of the ZFC and FC data occurring below theparamagnetic temperature regime. A sharp maximumappears at 20 K in the ZFC magnetization. Jang et al.have reported a spin-glass-like behavior indicating thepresence of frozen spins in cubic phases λ-MnO2 andLiMn2O4 [31]. The randomness and frustration necessaryfor spin-glass-like behavior are explained by the octahedralantiferromagnetic network in the [Mn2]O4 sublattice spinelstructure, combined with some magnetic disorder. Thedisorder due to the presence of a valence distribution in theMn ions is provoked by competing ferro- and antiferro-magnetic exchange interactions. This is believed to beresponsible for the complex magnetic structure. Frozenspin was also observed in a neutron diffraction study byOohara et al. [32]. Magnetic susceptibility measurements
0
10
20
30
40
50
60
b2_1
a3_4
b2_2
d752
1/χ
m (
mole
/em
u)
Tc
LiFePO4
Fig. 14 The inverse of the magnetic susceptibility χm(T) ofLiFePO4 samples synthesized by different sol-gel methods
0
10
20
30
40
50
0 100 200 300
χ-1
(10
-3 g
.Oe/
emu)
Temperature (K)
LiNiPO4
LiCoPO4
LiMnPO4
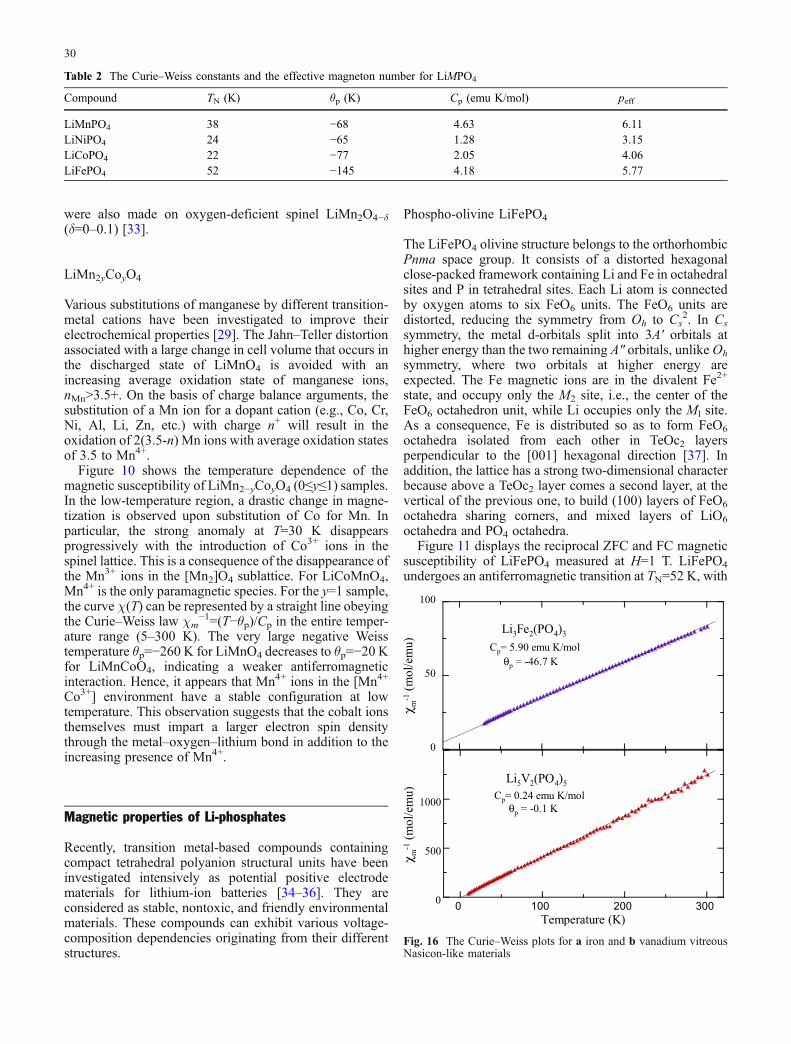
Fig. 15 The temperature dependence of the reciprocal magneticsusceptibility χm(T) of LiMPO4 samples (M=Ni, Co, Mn)
29
were also made on oxygen-deficient spinel LiMn2O4−δ(δ=0–0.1) [33].
LiMn2yCoyO4
Various substitutions of manganese by different transition-metal cations have been investigated to improve theirelectrochemical properties [29]. The Jahn–Teller distortionassociated with a large change in cell volume that occurs inthe discharged state of LiMnO4 is avoided with anincreasing average oxidation state of manganese ions,nMn>3.5+. On the basis of charge balance arguments, thesubstitution of a Mn ion for a dopant cation (e.g., Co, Cr,Ni, Al, Li, Zn, etc.) with charge n+ will result in theoxidation of 2(3.5-n) Mn ions with average oxidation statesof 3.5 to Mn4+.
Figure 10 shows the temperature dependence of themagnetic susceptibility of LiMn2−yCoyO4 (0≤y≤1) samples.In the low-temperature region, a drastic change in magne-tization is observed upon substitution of Co for Mn. Inparticular, the strong anomaly at T=30 K disappearsprogressively with the introduction of Co3+ ions in thespinel lattice. This is a consequence of the disappearance ofthe Mn3+ ions in the [Mn2]O4 sublattice. For LiCoMnO4,Mn4+ is the only paramagnetic species. For the y=1 sample,the curve χ(T) can be represented by a straight line obeyingthe Curie–Weiss law χm
−1=(T−θp)/Cp in the entire temper-ature range (5–300 K). The very large negative Weisstemperature θp=−260 K for LiMnO4 decreases to θp=−20 Kfor LiMnCoO4, indicating a weaker antiferromagneticinteraction. Hence, it appears that Mn4+ ions in the [Mn4+
Co3+] environment have a stable configuration at lowtemperature. This observation suggests that the cobalt ionsthemselves must impart a larger electron spin densitythrough the metal–oxygen–lithium bond in addition to theincreasing presence of Mn4+.
Magnetic properties of Li-phosphates
Recently, transition metal-based compounds containingcompact tetrahedral polyanion structural units have beeninvestigated intensively as potential positive electrodematerials for lithium-ion batteries [34–36]. They areconsidered as stable, nontoxic, and friendly environmentalmaterials. These compounds can exhibit various voltage-composition dependencies originating from their differentstructures.
Phospho-olivine LiFePO4
The LiFePO4 olivine structure belongs to the orthorhombicPnma space group. It consists of a distorted hexagonalclose-packed framework containing Li and Fe in octahedralsites and P in tetrahedral sites. Each Li atom is connectedby oxygen atoms to six FeO6 units. The FeO6 units aredistorted, reducing the symmetry from Oh to Cs
2. In Cs
symmetry, the metal d-orbitals split into 3A′ orbitals athigher energy than the two remaining A″ orbitals, unlikeOh
symmetry, where two orbitals at higher energy areexpected. The Fe magnetic ions are in the divalent Fe2+
state, and occupy only the M2 site, i.e., the center of theFeO6 octahedron unit, while Li occupies only the Ml site.As a consequence, Fe is distributed so as to form FeO6
octahedra isolated from each other in TeOc2 layersperpendicular to the [001] hexagonal direction [37]. Inaddition, the lattice has a strong two-dimensional characterbecause above a TeOc2 layer comes a second layer, at thevertical of the previous one, to build (100) layers of FeO6
octahedra sharing corners, and mixed layers of LiO6
octahedra and PO4 octahedra.Figure 11 displays the reciprocal ZFC and FC magnetic
susceptibility of LiFePO4 measured at H=1 T. LiFePO4
undergoes an antiferromagnetic transition at TN=52 K, with
Table 2 The Curie–Weiss constants and the effective magneton number for LiMPO4
Compound TN (K) θp (K) Cp (emu K/mol) peff
LiMnPO4 38 −68 4.63 6.11LiNiPO4 24 −65 1.28 3.15LiCoPO4 22 −77 2.05 4.06LiFePO4 52 −145 4.18 5.77
0
50
100
χ m- 1
(m
ol/
emu
)
Li3Fe2(PO4)3
Cp= 5.90 emu K/mol
θp = -46.7 K
0
500
1000
0 100 200 300
χ m-1
(m
ol/
emu
)
Temperature (K)
Li5V2(PO4)5
Cp= 0.24 emu K/mol
θp = -0.1 K
Fig. 16 The Curie–Weiss plots for a iron and b vanadium vitreousNasicon-like materials
30
moments aligned along the [010] axis. The most out-standing property of the χm
−1(T) curve for LiFePO4 lies inthe fact that the deviation from the Curie–Weiss lawremains small in the range 60–300 K. Values of Curie–Weiss constants deduced from the slope of the isothermalmagnetization data (Fig. 11) are Cp=4.18 emu K/mol andθp=−145 K. These data are consistent with the magnetismof lithium iron phosphates where an antiferromagneticordering at low temperatures was reported [37]. Thenegative value of θp is consistent with the antiferromag-netic coupling known for this compound. The value of theeffective moment μeff=5.77 μB is in agreement with what isexpected for Fe(II) ions. The analysis of the exchange pathshas been made by Mays [38].
Figure 12 displays the magnetization curves of LiFePO4
in the temperature range 4–300 K. Due to the existence of aferromagnetic component, the magnetization is not a linearfunction of the magnetic field. The first consequence is anambiguity in what is called magnetic susceptibility χm,because M/H is distinct from dM/dH. Because all themagnetic measurements have been performed on a SQUIDmagnetometer (and not a Faraday balance), the quantitymeasured is the magnetization M in an applied magneticfield H, so that we shall use the notation χm=M/H. Theother consequence of the nonlinearity of the magnetizationis that the data recorded in the “long-moment” made by theSQUID apparatus are not sufficient to get an understandingof the magnetic susceptibilities, and the full investigationof the magnetization as a function of the magnetic field atdifferent temperatures is needed for this purpose (Fig. 13).
The inverse of the magnetic susceptibility χm(T) ofLiFePO4 samples synthesized by different sol-gel methodsis reported as a function of temperature in Fig. 14. Atcontrast with prior works, these data give evidence of aferromagnetic ordering at Curie temperature Tc∼216 K,while we expected the evidence of an antiferromagneticordering at 52 K. Below Tc, the magnetic susceptibility isindependent of temperature, and thus only depends on ademagnetization factor. Above Tc, the Curie–Weiss law isapproximately satisfied with a Curie–Weiss temperatureclose to Tc. The effective Curie constant, however, issample-dependent. In addition, the Curie–Weiss law is amean-field law, and thus, valid only far from Tc. Thiscondition, even at room temperature, is not fulfilled, whichprecludes any quantitative analysis of the magneticsusceptibility curves in Fig. 14 in this framework. Due tothe existence of a large ferromagnetic component, themagnetization is not a linear function of the magnetic field[39].
LiMPO4 olivine-related compounds
Other olivine structures LiMPO4 include compounds withM=Ni, Co, and Mn. The temperature dependence of theinverse magnetic susceptibility measured with a SQUIDmagnetometer is shown in Fig. 15. All compounds exhibita Curie–Weiss-type dependence on temperature. The dataare consistent with the magnetism of LiFePO4, where
antiferromagnetic ordering appears at low temperatures.Linear fits provided the Weiss constants and the effectivemagnetic moments (Table 2), which can be compared to thetheoretical spin-only values in Table 1. The reduced MO6
symmetry has a noticeable effect on the magnetic suscep-tibility of LiCoPO4. We note that Co2+ is expected to havethree unpaired electrons (A′) in Cs symmetry, consistentwith the experimental data, but only a single unpairedelectron (eg) in Oh symmetry [40].
The magnetic structures in the ordered phases are bothcollinear for olivines: in LiMnPO4 the magnetic momentsare parallel to the a-axis, while in LiFePO4 and LiCoPO4,to the b-axis. In this case, the orbital angular momentum isnot completely quenched, and spin-orbit coupling alignsspins along the b-axis. The distance between magnetic ionsis one of the strongest factors affecting the magneticexchange strength. This distance variation accounts wellfor the observed transition temperature: The highest TNcorresponds to the strongest exchange.
For the LiFePO4 phospho-olivine structure, the magneticproperties give evidence of nano-sized ferromagneticparticles, which can be either strongly magnetic (γ-Fe2O3
clusters) or weakly ferromagnetic (Fe2P clusters), depend-ing on the preparation process. The concentration ofmagnetic clusters also depends on the preparation processand varies from small concentrations (1.0×10⁻⁶ of γ-Fe2O3
per formula), in which case, noncollective behavior isobserved, to large concentrations (1.9×10⁻⁴ of Fe2Pclusters per formula) where the dipolar interactiongenerates superferromagnetism. Ferromagnetic resonanceexperiments are also reported and are a probe of the γ-Fe2O3 nanoparticles. An overall understanding of thedifferent properties is achieved within a model of super-ferromagnetism induced by interacting Fe2P nanoparticles(Ait Salah et al., unpublished).
LixM2(PO4)x compounds
Among the lithium metal polyphosphate family, thecompounds described by formula LixM2(PO4)x (M=Fe, V,Mo and x=3, 5, 6, respectively) crystallize with theNasicon-like structure [41]. Plots of the magnetic suscep-tibility, as a function of temperature for Fe- and V-containing compounds, are shown in Fig. 16. Thecalculated Curie temperature value equals θ=−46.7 K forLi3Fe2(PO4)3 and θp=−0.1 K for Li5V2(PO4)5. The nega-tive Curie temperature indicates an antiferromagneticbehavior of the studied materials at temperatures abovetheir Néel point. For Li3Fe2(PO4)3, the magnetic momentμeff≈5.90μB is comparable with the theoretical value ofFe3+ (5.92 μB). For the Li5V2(PO4)5 sample, one obtainsμeff≈1.56 μB, while the theoretical value equals 1.55 μB forV4+ and 1.63 μB for V3+. Values of the magnetic momentfor both studied materials are associated with the mostoccupied transition metal sites [Fe3+ for Li3Fe2(PO4)3 andV4+ for Li5V2(PO4)5, respectively]. For the Mo com-pounds, a different behavior is observed. This materialbehaves as a diamagnetic material (i.e., its susceptibility is
31
negative and temperature-independent) in the whole rangeof temperature.
Conclusion
For LiNi1−yCoyO2 materials prepared by wet chemistry, themagnetic measurements of χm(T) and M(H) have revealedthe presence of small ferromagnetic islands arising fromthe fact that some Ni2+ ions are occupying Li+ places,which leads to a ferromagnetic ordering of the Ni ions intwo adjacent (Ni,CoO2)n slabs. The size of these clustersgets smaller and smaller as the Co content increases fromR(y=0)=3.5 nm to R(y=0.4)=0.5 nm.
Magnetic characterization of LiMn2O4 spinel materialsshows a spin-glass behavior below the paramagneticregime (TN<25 K). The magnetic properties are determinedby interactions between the Mn ions, which in turn dependon the Mn valence distribution in the [Mn2]O4 framework.The short-range antiferromagnetic order is also investi-gated in the case of cobalt-substituted spinels, namely,LiMn2yCoyO4.
For LiFePO4 phospho-olivine material, the magneticproperties give evidence of nano-sized ferromagneticparticles, which can be either strongly magnetic (γ-Fe2O3
clusters) or weakly ferromagnetic (Fe2P clusters), depend-ing on the preparation process. The concentration ofmagnetic clusters also depends on the preparation processand varies from small concentration (1.0×10⁻⁶ of γ-Fe2O3
per formula), in which case, noncollective behavior isobserved, to large concentrations (1.9×10⁻⁴ of Fe2Pclusters per formula) where the dipolar interactiongenerates superferromagnetism. Ferromagnetic resonanceexperiments are also reported and are a probe of the γ-Fe2O3 nanoparticles. An overall understanding of thedifferent properties is achieved within a model of super-ferromagnetism, which is induced by interacting Fe2Pnanoparticles. The magnetic structure of LiMPO4 phospho-olivine lattices is just that which is predicted by theapplication of Anderson’s theory of superexchange to M–O–P–O–M linkages.
Acknowledgements We would like to thank Dr. N. Amdouni forproviding the samples used in this work. Mr. M. Selmane isgratefully acknowledged for his assistance in XRDmeasurements. A.Ait-Salah’s work is supported by a Ph.D. grant from the Morocco–French cooperation program under contract No. MA/03/71.
References
1. Morrish AH (2001) The physical principles of magnetism.IEEE, New York
2. Rodriguez-Carjaval J (1993) Physica B 192:553. Hibbs AD, Sager RE, Kumar S, McArthur JE, Singsaas AL,
Jensen KG, Steindorf MA, Aukerman TA, Schneider HM(1994) Rev Sci Instrum 65:2544
4. Kittel C (1956) Introduction to solid state physics, 2nd edn.Wiley, New York
5. Ashcroft NW, Mermin ND (1976) Solid State Physics.Saunders College, New York
6. Ichida T, Shinjo T, Bando Y, Takada T (1970) J Phys Soc Jpn29:79
7. Shirane T, Kanno R, Kawamoto Y, Takeda Y, Takano M,Kamiyama T, Izumi F (1995) Solid State Ionics 79:227
8. Tabuchi M, Tsutsui S, Masquelier C, Kanno R, Ado K,Matsubara I, Nasu S, Kageyama H (1998) J Solid State Chem140:159
9. Hirakawa K, Kadowaki H, Ubukoshi K (1985) J Phys Soc Jpn54:3526
10. Hirakawa K, Kadowaki H (1986) Physica B 136:33511. Klemp JP, Cox PA, Hodby JW (1990) J Phys Condens Matter
2:669912. Hirota K, Nakazawa Y, Ishikawa M (1990) J Magn Magn Mater
90–91:27913. Reimers JN, Dahn JR, Greedan JE, Stager CV, Liu G, Davidson
I, von Sacken U (1993) J Solid State Chem 102:54214. Yamaura K, Takano M (1996) J Solid State Chem 127:10915. Shirakami T, Takematsu M, Hirano A, Kanno R, Yamaura K,
Takano M, Atake T (1998) Mater Sci Eng B 54:7016. Chappel E, Nunez-Regueiro MD, De Brion S, Chouteau G,
Bianchi V, Courant D, Baffier N (2002) Phys Rev B 66:13241217. Senaris-Rodriguez MA, Castro-Garcia S, Castro-Couceiro A,
Julien C, Hueso LE, Rivas J (2003) Nanotechnology 14:27718. Barra AL, Chouteau G, Stepanov A, Rougier A, Delmas C
(1999) Eur Phys B 7:55119. Saadoune I, Delmas C (1996) J Mater Chem 6:19320. Holstein T, Primakoff H (1941) Phys Rev 59:38821. Balcells L, Fontcuberta J, Martínez B, Obradors X (1998) Phys
Rev B 58:1469722. Sugiyama J, Hioki T, Noda S, Konani M (1998) Mater Sci Eng
B 54:7323. Jang Y, Chou FC, Chiang Y-M (1999) Appl Phys Lett 74:250424. Jang Y, Chou FC, Huang B, Sadoway DR, Chiang Y-M (2003)
J Phys Chem Solids 64:252525. Arillo MA, Cuello G, Lopez ML, Martin P, Pico C, Veiga ML
(2005) Solid State Sci 7:2526. Greedan JE, Raju NP, Wills AS, Morin C, Shaw SM (1998)
Chem Mater 10:305827. Wills AS, Raju NP, Morin C, Greedan E (1999) Chem Mater
11:193628. Goodenough JB (1963) Magnetism and the chemical bond.
Wiley, New York29. Julien C, Ziolkiewicz S, Lemal M, Massot M (2001) J Mater
Chem 11:183730. Goodenough JB, Manthiram A, James ACWP, Strobel P (1989)
Mater Res Soc Symp Proc 135:39131. Jang Y, Chou FC, Huang B, Sadoway DR, Chiang Y-M (2000)
J Appl Phys 87:738232. Oohara Y, Sugiyama J, Kontani M (1999) J Phys Soc Jpn
68:24233. Sugiyama J, Atsumi T, Koiwai A, Sasaki T, Hioki T, Noda S,
Kamegashira N (1997) J Phys Condens Matter 9:172934. Manthiram A, Goodenough JB (1987) J Solid State Chem
71:34935. Padhi AK, Nanjundaswamy KS, Goodenough JB (1997)
J Electrochem Soc 144:118836. Bykov AB, Chirkin AP, Demyanets LN, Doronin SN, Genkina
EA, Ivanov-Shits AK, Kondratyuk IP, Maksimov BA,Melnikov OK, Muradyan LN, Simonov VI, Timofeeva VA(1990) Solid State Ionics 38:31
37. Santoro RP, Newnham RE (1967) Acta Crystallogr 22:34438. Mays JM (1963) Phys Rev 131:3839. Ait-Salah A, Zaghib K, Mauger A, Gendron F, Julien CM
(2006) Phys Status Solidi (a) 203:R140. Tucker MC, Doeff MM, Richardson TJ, Finones R, Cairns EJ,
Reimer JA (2002) J Am Chem Soc 124:383241. Morgan D, Ceder G, Saidi MY, Barker J, Swoyer J, Huang H,
Adamson G (2002) Chem Mater 14:4684
32