macroeconomic policies and poverty reduction · gafta great arab free trade area gcc gulf...
TRANSCRIPT


i
Macroeconomic Policies
for Growth, Employment
and Poverty Reduction
in Yemen
Copyright 2006By the Sub-Regional Resource Facility for Arab States (SURF-AS)United Nations Development Programme (UNDP)UN House, Riad El-Solh SquareP.O.Box: 11-3216 Beirut, Lebanon
All rights reserved. No part of this publication may be reproduced, stored in a retreival sys-tem, or transmitted in any form or by any means, electronical, mechanical, photocopying,recording or otherwise, without prior permission of UNDP/SURF-AS
Design, Color Separation and Printing by Virgin GraphicsEmail: [email protected]
ii

Advisory GroupFlavia Pansieri (Resident Representative,UNDP Yemen) Yahya Al Mutawakel (Vice Minister andHead of the Poverty Reduction StrategyFollow-up and Monitoring Unit, Ministry ofPlanning and International Cooperation.) Moin Karim, (Former Deputy ResidentRepresentative, UNDP Yemen) Mohammad Pournik, (Senior CountryEconomist, UNDP Yemen)
Core TeamMassoud Karshenas (Team Leader andPrincipal Investigator, Professor ofEconomics, SOAS, London) Khalid Abu-Ismail (Macroeconomics andPoverty Reduction Policy Advisor, UNDP,SURF-AS, Beirut)Terry McKinley (Director, UNDP,International Poverty Center, Brasilia)
UNDP Yemen Country OfficeTeamRanda Abou-El Hosn (Former AssistantResident Representative)Abdo Seif (MDG Focal Point)
UNDP SURF-AS TeamGhada Khoury (Research Assistant) Mona Naguib (Publication Specialist)Nora Khalaf (Office Manager)Peter Stalker (Chief Editor)Rehab Farouk (Layout Specialist)Sonya Knox (Editor)
Contributing Authors: (Authors of background papers)Ahmad Ghoneim: Trade Ahmad Kamaly: Fiscal Policy Anis Chowdhury: Monetary Policy Antoine Heuty: Fiscal Policy Farhad Mehran: Employment Frederick Nixson: Trade and Industry Haroon Akram-Lodhi: AgricultureHeba Nassar: Macroeconomics Hyun Son: Poverty Ibrahim Saif: Industry John Roberts: Macroeconomics Karima Korayem: Agriculture and Poverty Khalid Abu-Ismail: Macroeconomics andPoverty Matias Vernengo: MacroeconomicsNanaak Kakwani: Poverty Niek De Jong: Poverty Rathin Roy: Fiscal Policy Saif Al Asaly: Fiscal Policy Terry McKinley: Macroeconomics andEmployment Walid Mehalaine: Trade
Readers:Ali Abdel Gader (Arab Planning Institute)Gouda Abdel Khalek (Cairo University)
iii
Case Study Team
The analysis and policy recommendations of this Report do not necessarily reflect the views of the United Nations
Development Programme, its Executive Board or its Member States. The Report is the work of an independent team
of authors sponsored in part by the Thematic Trust Fund (Bureau of Development Policy).

iv
About the UNDP and SURF-AS
UNDP is the UN's global development network, advocating for change and con-necting countries to knowledge, experience and resources to help people build abetter life. We are on the ground in 166 countries, working with them to strength-en their capacities and create their own solutions to global and national developmentchallenges. 40 years of development experience Programmes in 166 countries 135 offices around the world
The Sub-Regional Resource Facility for Arab States is a key player in UNDP's glob-al development network, advocating for change and connecting countries to knowl-edge, experience and resources to help build a better life. Our focus is helping coun-tries in the Arab region build and share solutions to the challenges of democratic gov-ernance, macroeconomic policies and poverty reduction, energy and environmentand gender within the overarching framework of the Millennium DevelopmentGoals.

BDS Business Development Support
CACB Cooperative Agricultural Credit Bank
CBS Central Bureau of Statistics
CBY Central Bank of Yemen
CD Certificate of Deposit
CPI Consumer Price Index
CSO Central Statistical Office
DRDI Domestic Resources for Development and Investment
EFARP Economic, Financial and Administrative Reform Programme
EU European Union
FAO Food and Agriculture Organization
FDI Foreign Direct Investment
GAFTA Great Arab Free Trade Area
GCC Gulf Cooperation Countries
GDP Gross Domestic Product
GNI Gross National Income
GoY Government of Yemen
GST General Sales Tax
HACCP Hazard Analysis Critical Control Points
HBS Household Budget Survey
HDR Human Development Report
IFS International Financial Statistics
ILO International Labour Organization
IMF International Monetary Fund
I-PRSP Interim Poverty Reduction Strategy Paper
LDCs Least Developed Countries
MDGs Millennium Development Goals
MEGTWG Macroeconomic & Employment Generation Thematic Working Group
MENA Middle East and North Africa
MSMEs Medium, Small and Medium Enterprises
NABARD National Bank for Agriculture and Rural Development
NBY National Bank of Yemen
NFD Net Foreign Demand
NGO Non-Governmental Organisation
NPS National Poverty Survey
NSIC National Small Industries Development Corporation
ODA Official Development Assistance
PCFs People’s Credit Funds
PPP Purchasing Power Parity
PRSP Poverty Reduction Strategy Paper
RBI Reserve Bank of India
REER Real Effective Rate
SEDU Small Enterprises Development Unit
SEFM Strengthening Economic and Financial Managementv
Abbreviations and Acronyms

SFCs State Financial Corporations
SIDBI Small Industries Development Bank of India
SMEs Small and Medium Enterprises
TB Treasury Bills
TIFA Trade and Investment Framework Agreement
UNDP United Nations Development Programme
VBARD Viet Nam Bank for Agriculture and Rural Development
VBP Viet Nam Bank of the Poor
VTCs Vocational Training Centres
WDI World Development Indicators
YBRD Yemen Bank for Reconstruction and Development
YCR Yemen Country Report
YR Yemeni Rials
vi

ACKNOWLEDGMENTS xv
PREFACE xvii
CHAPTER 1. METHODOLOGY AND SCOPE 1
CHAPTER 2. GENERALIZED POVERTY IN YEMEN AND ITSMACROECONOMIC IMPLICATIONS2.1 The Nature of Poverty in Yemen 112.2 Domestic Resources Development and Investment under Generalized
Poverty 132.3 Initial Conditions and Economic Reform 16
CHAPTER 3. GROWTH, INVESTMENT AND ODA REQUIRMENTS FOR HALVING INCOME POVERTY BY 20153.1 Growth and Investment Requirements 19
3.1.1 Estimating the growth elasticity of poverty reduction 193.1.2 Estimating the required per capita growth rate 203.1.3 Estimating the required investments 223.1.4 Estimating the requirements for per capita foreign aid 23 3.1.5 The Effect of a More Favourable Savings Path 25
3.2 Aid Efficiency 26
CHAPTER 4. EXPANDING FISCAL SPACE4.1 Macro-Fiscal Trends 33
4.1.1 Overview 334.1.2 Trends in Government Spending 374.1.3 Institutional and Strategic Initiatives: Fiscal Components 42
4.2 Yemen’s Fiscal Challenge: The IMF View 434.3 A Review of Fiscal Challenges and Recommendations 45
4.3.1 Revenue Challenges 454.3.2 Reducing Expenditures 47
4.4 Concluding Remarks 49
CHAPTER 5. FINANCIAL-SECTOR DEVELOPMENT, GROWTH AND POVERTY REDUCTION5.1 Structure of the Financial Sector 535.2 Financial Sector Reforms 545.3 Financial Intermediation and Poverty Reduction 565.4 Conclusions and Policy Recommendations 61
vii
Table of Contents

CHAPTER 6: MACROECONOMIC POLICY, INFLATION ANDGROWTH: INTERLINKAGE BETWEEN FISCAL, MONETARYANDEXCHANGE-RATE POLICIES6.1 Introduction 656.2 Monetary Policy: Reforms and Regulations 656.3 Exchange Rate Regime and Reforms 676.4 Monetary, Fiscal and Exchange-Rate Policies and the Inflationary Process 68
6.4.1 The Inflationary Impact of Fiscal Policy 706.4.2 The Monetary Causes of Inflation 726.4.3 Supply Side Factors 756.4.4 Macroeconomic Policy, Savings, Investment and Pro-Poor Growth 80
6.5 Policy Recommendations 86
CHAPTER 7: STRENGHTENING THE EMPLOYMENT NEXUSBETWEEN GROWTH AND POVERTY REDUCTION7.1 Introduction 897.2 Trends in the Labour Force 897.3 The Structure of Employment 917.4 Trends in Unemployment 927.5 The Demand for Labour 93
7.5.1 Micro and Small Enterprises 977.5.2 Expected Jobs Gains 98
7.6 Trends in Hours and Wages 987.7 Policy Recommendations 101
CHAPTER 8: AGRICULTURE AND LIVELIHOODS IN RURALYEMEN8.1 Introduction 1038.2 Agriculture 104
8.2.1 The Role of Agriculture in the Economy 1048.2.2 Aggregate Supply: Crop Area, Volumes and Shares 1068.2.3 Aggregate Demand: External and Internal Drivers of Change? 1108.2.4 Decomposing Supply: The Productivity Record 1138.2.5 Decomposing Supply: Land and Labour 1158.2.6 Decomposing Supply: Water 1208.2.7 Conclusion: The Agrarian Constraint 122
8.3 Agrarian Constraints and Pro-Poor Policy Considerations 1248.4 Conclusion: the Political Economy of Rural Relations and Policy Reform 131
viii

CHAPTER 9: TRADE AND INDUSTRY9.1 Introduction 1339.2 Trade Sector 133
9.2.1 Implications of WTO Accession 1389.2.2 Policy Recommendations 1389.2.3 Trade Liberalization and Human Development 140
9.3 The Manufacturing Sector 1419.3.1 Policies Affecting the Manufacturing Sector 1449.3.2 Manufactured Exports Performance 1469.3.3 Challenges to Promoting the Manufacturing Sector 147
9.4 Conclusions 148
CHAPTER 10 SUMMARY POLICY CONSIDERATIONS10.1 Providing Fiscal Space for Development 15110.2 Financial Sector Development 15310.3 Monetary and Exchange-Rate Policies 15410.4 Policies to Promote Savings, Investment and Growth 15510.5 The Employment Nexus between Growth and Poverty Reduction 15610.6 Trade and Industrial Development 15710.7 Agricultural Development and Rural Livelihoods 160
REFERENCES 163
ANNEXESAnnex 1: Notes on the Comparison of the Household Budget Survey
(1998) and National Poverty Survey (1999) 167Annex 2: Methodology for Estimating Growth and Investment
Requirements for Halving Income Poverty by 2015 171Annex 3: Data sources and issues in IMF statistics 175Annex 4: Financial Sector Development, Economic Growth and
Poverty Reduction: A Review of Theories and Evidence 179Annex 5: Recommended Steps and Procedures 191
ix

x

Table 2.1: Headcount Poverty, 1998 11
Table 3.1: Elasticity of Poverty Reduction with Respect to Growth of
1% under Alternative Growth Scenarios: Headcount and
Poverty Gap Ratios 20
Table 3.2: Per Capita Growth Rates Required to Achieve MDG1:
Headcount and Poverty Gap Ratios, under Alternative Growth
Scenarios, 1999-2015 21
Table 3.3: Head Count Ratio Target : Average Investment Requirement
and Gap between Savings and Investment as Percentage of
GDP, 2005-2015 22
Table 3.4: Poverty Gap Ratio Target: Average Investment
Requirement and Gap between Savings and Investment
as Percentage of GDP, 2005-2015 23
Table 3.5: Headcount Ratio Target: Per Capita GDP in 2002 US$ and
ODA Required under Alternative Growth Scenarios, 2005-2015 24
Table 3.6: Poverty Gap Target: Per Capita GDP in 2002 US$ and ODA
Required under Alternative Growth Scenarios, 2005-2015 24
Table 3.7: Adjusted ODA required to achieve the MDG1 headcount
and poverty gap ratios, 2005-2015 26
Table 3.8: Aid per capita and total aid, for the Arab Region,
1999-2003, $ 28
Table 4.1: Macro-Fiscal Statistics 1990-2003 (% of GDP, Unless
Otherwise stated) 35
Table 4.2: Evolution of Yemen’s Revenue Composition 1994-2003
(% of GDP) 36
Table 4.3: Evolution of the Shares of Revenue Items and Expenditure
Categories ( %) 39
Table 4.4: Key Macro-Fiscal Forecasts for 2006-2009 under a Non
Adjustment Scenario (% of Non Oil GDP) 44
Table 4.5: Key Macro-Fiscal Forecasts for 2006-2009 under an
Adjustment Scenario (% of GDP) 44
Box 4.1: IMF Recommendations for Fiscal Reforms in Yemen 45
Box 4.2: How to Create Fiscal Space? 46
Box 4.3: Some Features of the Budgeting Process in Yemen 49
Table 5.1: Sectoral Share of Commercial Bank Loans (%) 60
Box 5.1: Financing Agricultural Activities and SMEs in Vietnam 62
Box 5.2: Financing agricultural activities and SMEs in India 63
Box 5.3: Directed credit schemes and financial-sector liberalization –
findings from Ecuador 64xi
List of Tables and Boxes

Table 6.1: Interest Rates of Commercial Banks 67
Table 6.2: Sources of Income of the Poor, the Middle Class
and the Rich (%) 82
Box 6.1: Financial Sector Reform and Financial Crisis 85
Table 7.1: Labour Force Participation, 1994-1999 (%) 90
Table 7.2: Sectoral Structure of Employment (%) 91
Table 7.3: Gains and Losses in Paid Jobs by Economic Sector 94
Table 7.4: Gains and Losses in Paid Jobs by Establishment Size 95
Box 7.1: Main Results and Recommendations of the Labour Demand
Survey, 2003 95
Table 8.1: Poverty and Human Development in Rural Yemen 103
Table 8.2: Agriculture in the Yemeni Economy 104
Table 8.3: The Spatial Distribution of Farming 105
Table 8.4: The Allocation of Cultivated Land, 2004 106
Table 8.5: Non-Labour Agricultural Inputs, 1985-2000 115
Table 8.6: Distribution of Landholding and Landholding Area, 1991-2001 117
Table 8.7: Land Availability and Food Insecurity 117
Box 8.1: Water Scarcity Constraints to Agricultural Growth in Yemen 123
Table 9.1: Gross Output and Value-Added in the Manufacturing Sector
2000, YR Millions 141
Table 9.2: Number of Manufacturing Establishments by Size and Activity
2000 142
xii

Figure 2.1: Child Malnutrition 12Figure 2.1(a): Malnutrition Prevalence, Weight for Age
(% of Children Under 5) 12Figure 2.1(b): Malnutrition Prevalence, Height for Age
(% of Children Under 5) 12Figure 2.2: Domestic Resources Available for Development
and Investment (DRDI): 1990-2003 13Figure 2.3: Per Capita Household Consumption Expenditure in Yemen,
1990-2002 14Figure 2.4: Per Capita Household Consumption Expenditure in Yemen
and Other Developing Countries, 1990-2002 14Figure 2.5: Domestic Resources Available for Development and
Investment, 1990, 2003 16Figure 3.1: Average Annual ODA required for Yemen and selected
African LDCs, 2005-2015 25Figure 3.2: Projected rate of domestic savings under different growth
scenarios. 2005-15 25Figure 3.3: Major recipients of aid in the Arab Region
(% of total aid to the region), 1999 and 2003 29Figure 3.4: Volatility of aid flows to LDCs (percentage change
from previous year) 29Figure 4.1: Composition of Government Spending, 1995-2003 37Figure 4.2: Government’s Productive Budgetary Spending (% of Total
Spending, 1995-2003) 40Figure 5.1: Ratio of money supply (M2) to GDP (%), 1990-2003 58Figure 5.2: Ratio of broad money to reserve money (%), 1990-2003 58Figure 5.3: Credit to the private sector, % of GDP, 1990-2003 59Figure 5.4: Claims on the private sector, % of deposits, 1990-2003 59Figure 6.1: Budget Balance, Money-Supply Growth, Currency
Depreciation and Inflation, 1990-2003 69Figure 6.2: Non-Oil Budget Deficits, Growth of Government
Expenditure (% of GDP) and Inflation, 1997, 2003 70Figure 6.3: Relationship between Inflation and Non-Oil Budget Deficits 71Figure 6.4: Money Supply and its Components (million YRs) 73Figure 6.5: Change in Money Supply and its Components (million YRs) 73Figure 6.6: Relationship between Inflation and Growth of Bank Credits
to the Private Sector, 1997-2003 74Figure 6.7: Inflation Rates in the Food and Non-Food Components of
CPI, 2002-2005 76Figure 6.8: World and Yemeni Food Price Indices, 1997-2003 (in YRs) 77Figure 6.9: Currency Depreciation and Inflation, 1997-2003 77
xiii
List of Figures

Figure 6.10: Real Exchange Rate, Real Wages, and Investment Rate, 1999-2003 79
Figure 6.11: Non-Oil GDP per Person of Working-Age, 1998-2003, $Constant 2000 80
Figure 6.12: Private and Public Gross Fixed Capital Formation as a share of National Disposable Income, 1995-2003 81
Figure 6.13: Calorie Intake per Adult (15+ age group, 1995=100) 82Figure 6.14: Government, Private, and National Savings as % of
National Disposable Income, 1995-2003 83Figure 6.15: Savings and Investment as% of National Disposable Income,
1995-2003 84Figure 8.1: Cereal Supply, 1961-2002 107Figure 8.2: Area under Cultivation, 1994-2003 107Figure 8.3: Agriculture, Fish and Meat Production 108Figure 8.4: Distribution of Shares of total Value of Agricultural Crops 109Figure 8.5: Food Exports as a Share of Non-Oil Exports 111Figure 8.6: Relative Agricultural Prices in Sana’a 112Figure 8.7: Inflation Rates in the Food and Non-Food Components
of CPI 113Figure 8.8: Constant Agricultural value-added (1995 US$) 114Figure 8.9: Agricultural Input Growth 115Figure 8.10: Trends in Farm Water Supply, 1975-2000 121Figure 9.1: Balance of Trade, and Services, Current Account and
Overall Balance ($ m) 134Figure 9.2: Composition of Non-Oil Exports, 1993-2001 134Figure 9.3: Composition of Imports (1993-2001) 135Figure 9.4: Basic Indicators of Small, Medium and Large Enterprises in
Manufacturing, 2000-2003 143
xiv

The core team for this report comprised Massoud Karsheans (Professor of Economicsat the Institute of Social Studies), who was the Team Leader and Principal Investigatorand Khalid Abu-Ismail (UNDP Regional Adviser on Macroeconomics and Poverty,Sub-Regional Resource Facility for Arab States). The latter acted as the task coordi-nator for this report in close collaboration with Terry McKinley, UNDP (HQ)Macroeconomics Policy Adviser.
From the UNDP Yemen Country Office, all discussions held with the YemeniGovernment and other stakeholders, in the process of formulating this report, were ledby Flavia Pansieri, Resident Representative and Moin Karim, Former DeputyResident Representative. Abdo Seif, Team Leader, Poverty Alleviation Team, MDGFocal Point and Randa Aboul-Hosn, Former Assistant Resident Representative werethe principal Country Office focal points for this study. Although he came late into theprocess, the core team gratefully acknowledges feedback and inputs by MohammadPournik, UNDP CO Senior Economist.
The UNDP SURF-AS team comprised of Ghada Khoury (Researcher), Mona Naguib(Publication Specialist), Nora Khalaf (Office Manager), Peter Stalker (Chief Editor),Sonya Knox and Rhonda Brown (Editor).
For the Government of the Yemen, the report was written under the general guidanceof Dr. Yahya Al Mutawakel, Vice Minister and Head of the Poverty ReductionStrategy Follow-up and Monitoring Unit, Ministry of Planning and InternationalCooperation. Further discussions were held with Dr. Mutahar Al-Abassi, DeputyMinister, head of the Millennium Project Unit, Ministry of Planning and InternationalCooperation, as Yemen was selected as a pilot for the UN Millennium project toundertake a MDGs Needs Assessment.
Initial results from the study, and its methodology, were presented in several work-shops at the Ministry of Planning and International Cooperation, which were attend-ed by Yemeni intellectuals, key line ministry officials and donor community in Sana’a.
The background studies for the preparation and publication of this report was finan-cially supported by the Government of the Republic of Yemen, UNDP YemenCountry Office and UNDP Poverty Thematic Trust Fund.
Finally, it is with great sadness that we report the loss of John Roberts, who had a sig-nificant contribution to the sections on macroeconomics and poverty. He will be trulymissed.
xv
Acknowledgments

xvi

xvii
This report on the Macroeconomics of Poverty Reduction in Yemen is part of a glob-al UNDP-supported project that started in 2001 and has grown to encompass policy-oriented research, advisory services and capacity development in 25 developing coun-tries. Among the Arab States, UNDP has supported similar studies in Morocco, Sudanand Syria.
The primary audience is national policymakers and the report aims to present themwith practical policy options and alternatives and to broaden the national dialogue onsuch choices. The policy analysis within the report delineates the major ‘stylized facts’of the economy and explores its responsiveness to the macroeconomic framework – soas to permit informed judgments on the most suitable alternative policies. Thus theoverriding objective of is to offer policymakers a choice of feasible options for pro-poor and pro-growth economic policies and begin a process of strengthening nationalcapacity to accelerate progress towards the MDGs –particularly the first goal on pover-ty reduction.
Thus far policy choices have been constrained by the conditionalities attached to bal-ance-of-payments or structural adjustment loans – which have presented a uniform setof recommendations on economic policies. At the same time that governments werebeing subjected to such conditionalities, they were encouraged – usually by the samelenders – to formulate ‘nationally owned’ Poverty Reduction Strategies. Clearly, thereis a contradiction between imposing conditionalities and promoting ‘national owner-ship’. UNDP, on the other hand, has mounted a major effort in recent years to pro-vide governments with a broader menu of policy options.
This report follows in this broad tradition and, similar to other reports, it focuses onfostering growth with equity. It also gives high priority to reducing unemploymentand underemployment. As UNDP-supported reports in other countries have found,this focus is critical: growth cannot be translated effectively into poverty reductionwithout creating broad-based employment.
One of the major policy lessons is that the state will have to play an active role in theeconomy. This will mainly be through public investment and allocating credit to stim-ulate growth and employment – taking care to concentrate resources as far as possibleon reducing poverty. Indeed, given the focus on achieving the MDGs, much of thegrowth in Yemen is likely to originate with public investment which, if it is designedto raise the productivity of capital and labour, will boost private investment.
This calls therefore for ‘investment-led’ growth. Many of the other UNDP-supportedreports have advocated a similar approach. They have not made the standard neo-lib-eral assumption that increasing public investment will ‘crowd out’ private investment.In fact they have pointed out that in many developing countries, overall tax revenuesare not, as is often assumed, too high, but too low. For financing public investmentthe state will therefore need to mobilize more revenue.
Preface

xviii
The Yemen report shares many of the positions taken in other UNDP-supported stud-ies. It calls for more expansionary, public investment-focused macroeconomic policiesand an increase in tax revenue, while mobilizing domestic resources in order to financethis fiscal expansion. It also advocates that public policies focus on employment gen-eration and that industrial policies should be used to strengthen the economic sectorsthat are potential sources of growth and job creation. Taken together, the report’spackage of policy recommendations should help set Yemen on a sustainable path ofgrowth, employment and poverty reduction.

Yemen is a ‘Least Developed Country’ (LDC) and has many of the features commonto such economies, such as a very low per capita income, a high degree of vulnerabil-ity to external and internal shocks, and a high prevalence of extreme poverty.
It has, however, been taking steps to strengthen the economy. Thus since the mid-1990s the government has embarked on a remarkably rapid and effective macroeco-nomic stabilization and adjustment programme. It has pursued a prudent fiscal policyand particularly a tight monetary policy – helped by rising oil export revenues whichhave reduced large budget deficits and created substantial surpluses in the balance ofpayments leading to a large build-up of foreign exchange reserves. At the same time itbrought price inflation under control – though recently inflation has risen back to dou-ble-digit levels).
The Government has also been liberalizing trade. It has effectively dismantled quanti-tative trade restrictions, simplified and substantially reduced import tariffs and imple-mented current account and capital account convertibility. As a result, according tostandard indicators, compared with other developing countries Yemen now has one ofthe most open economies. It has also taken long strides towards price reform – remov-ing food subsidies, for example, and gradually phasing out fuel subsidies. Since 1995the real (official) exchange rate has fallen by close to 100%, though in recent years therehas also been a relatively more stable unified exchange rate. At the same time, realinterest rates have been increased to well over 5%.
In other are as the results have been more disappointing – particularly in private sec-tor growth, export growth, and poverty reduction. During the past five years per capi-ta GDP growth has fluctuated between 0.4% and 1.8% per annum. And since 1997private sector investment as a share of national disposable income has declined by over10 percentage points. Over the same period non-oil exports have remained stagnantand both underemployment and unemployment remain high. In a country where alarge part of the population already lives below the poverty line a continuation of suchtrends would undoubtedly undermine sustainable growth and poverty reduction.
This report is part of a much larger UNDP-supported global project that started in2001, and now has grown to encompass policy-oriented research, advisory services andcapacity development in 25 developing countries. Among the Arab States, UNDP hassupported similar reports in Morocco, Sudan and Syria.
It provides an alternative to the uniform set of recommendations that typically arisefrom the conditionalities accompanying balance-of-payments or structural adjustmentloans. Several influential studies have shown that these ‘good economic policies’, asdefined by the World Bank and the IMF, have no statistically significant benefits for
1
Chapter One
Methodology and Scope
Chapter One: Methodology and Scope

poverty reduction.1 Indeed in recent years many more people have been questioningthe positive association between liberal economic policies and growth.2
For developing countries, Easterly (2003) established that the proposition is based onthe assumption that countries are starting with extremely bad policies – implying thatcountries starting from moderate values for the policy indicators are not likely to seeany improvements.3 Moreover, Abdel Gader A. (2004), using the Easterly specifica-tion among others, shows for a sample of 8 reforming Arab countries over the period1960-2000 that conventional policy variables either had no effect on the growth rateof real per capita GDP or that they actually reduced growth. The situation is differenthowever, for the ‘investment rate’, defined as the ratio of investment to GDP. A num-ber of researchers have found this to be a statistically significant determinant of thegrowth rate.4 Thus, if governments want to use growth as a channel for poverty reduc-tion they would do better to focus on investment, including public investment.
Another consideration is inequality – as measured by the Gini coefficient. Evidencefrom the World Bank and the IMF, shows that inequality is not reduced by conven-tional macroeconomic policies while it is reduced by ‘public policies’, in the form of‘social transfers’ and ‘public employment’5. The entry point for discussion of policyoptions for poverty reduction should therefore be public policy, rather than conven-tional macroeconomic policies
This report calls for more expansionary, public-investment focused macroeconomicpolicies. It argues for using economic policies for ‘solving’ as much as possible of thepoverty problem while using complementary social policies.
This case study follows the general analytical framework that has been used in manyother studies on Economic Policies and Poverty Reduction supported by the UnitedNations Development Programme – though it also focuses more on issue that are ofparticular national interest.
2
Chapter One: Methodology and Scope
1 See, for example, P-R. Agenor (1998), “Stabilization Policies, Poverty and the Labour Market”, IMF,Washington D.C.; Ali, A.A.G., (2002), “Macroeconomic Policies and Poverty Reduction”, AERC, Nairobi;Demery, L., and L. Squire, (1996), “Macroeconomic Adjustment and Poverty in Africa: An Emerging Picture”,World Bank Research Observer, vol. 11, no. 1; and Christiaensen, L., Demery, L., and S. Paternostro, (2003),“Macro and Micro Perspectives of Growth and Poverty in Africa”, World Bank Economic Review, vol. 7, no. 3;and Dollar, D., and A. Kraay, (Growth is Good for the Poor, Journal of Economic Growth, vol. 7, no. 1).2 Acemoglu, D., Johnson, S., Robinson, J., and Y. Thaicharoen, (2003), “Institutional Causes, MacroeconomicSymptoms: Volatility, Crises and Growth”, Journal of Monetary Economics, vol. 50, no. 1; Easterly, W., and R.Levine, (2003), “Tropics, Germs and Crops: How Endowments Influence Economic Development”, Journal ofMonetary Economics, vol. 50, n0. 1; Rodrik, D., Subramanian, A., and F.Trebbi, (2004), “Institutions Rule: ThePrimacy of Institutions over Geography and Integration in Economic Development”, Journal of Economic Growth,vol. 9, no. 2. 3 Easterly, W., (2003), National Policies and Economic Growth: A Reappraisal”, Working Paper no. 27, Centerfor Global Development, www.cgdev.org. The range for moderate values used by Easterly are as follows: inflationrate and black market premium in the closed interval [-.05, 0.35]; budget deficit as a ratio of GDP [-0.12, 0.02];overvaluation index [-0.4, 0.65] with index above zero indicating overvaluation; and trade (exports plus imports) asa ratio of GDP less than 1.2.4 For such results see, among others, Ali, A.A.G., (2004), “Do Macroeconomic Policies Affect the Growth Ratesof Developing Countries”; Experts Group Meetings’ Series, no. 10, Arab Planning Institute, Kuwait (in Arabic). 5 See, for example, Bulir, A., (2001), “Income Inequality: Does Inflation Matter?”, IMF Staff Papers, vol. 48, no.1.

The taskforce missions that preceded the study identified some key issues and concerns.
Low government expenditure – Compared with the needs in a country that has poor infra-structure and high levels of poverty, development expenditure is low. It is constrainedby the low tax rates: while other low-income countries have tax rates close to 15% ofGDP, the proportion in Yemen is no more than 7%. Some of the mission memberspointed out however that the difference is much smaller if tax rates are considered asshare of the non-oil GDP so the potential for raising taxes may not be that great – andthat raising taxes could harm the poor or those living close to the poverty line. Somedonors also raised the issue of fiscal transparency, as well as the political constraints onfiscal policy.
Tight monetary policy – Financial markets in Yemen are very thin and some peoplebelieve that the Central Bank of Yemen’s tight monetary policy has hampered privateinvestment and that over time high interest rates will have an impact on governmentfinances. Other missions raised the issue of coordination between fiscal policy andmonetary policy – arguing that the lack of such coordination has weakened private sec-tor activities. Possible symptoms of this phenomenon are stagnant private investmentand the rapid build-up of foreign reserves which could hinder proper adjustment toexternal shocks.
Rapid liberalization – During a period of rapid economic liberalization the governmenthas paid insufficient attention to the sequencing of different aspects of economicreform. It has also neglected institutional reform and capacity building indeed to ensurea commensurate response from private sector investment. Indeed some believed thatthe speed of economic liberalization has made institutional reform and capacity build-ing more difficult.
Low absorptive capacity – A number of donors were concerned about low absorptivecapacity in the economy – though most ministries and national institutions said thatthe main constraint on private and public investment for export promotion was thelack of finance – for modernizing the fisheries industries, for example, and investing ininfrastructure to induce foreign investment in mining.
Low productivity – There is a general feeling that poverty reduction will remain elusive,unless attention is paid to policies that can remove the constraints on productivitygrowth in agriculture, as well as policies for productive employment generation in theeconomy at large.
Based on this general analytical and methodological framework, this report examinestwo major issues: first, how to make macroeconomic policies more pro-poor – theentry point and focus; second, how to enhance the impact of these macro-level poli-cies by ‘augmenting the entitlements’ of the poor – the complementary theme.
‘Macroeconomics’ in this context is defined broadly to include short-term policies formacroeconomic stabilization, long-term macroeconomic policies to stimulate growthand policies of structural adjustment that alter the functioning of the market economy
3
Chapter One: Methodology and Scope

and its relationship to the public sector. In examining entitlements, the report empha-sizes the need to improve the ‘supply-side conditions’ of the poor – their access to eco-nomic opportunities, such as assets, productive inputs, technology and employment,and their ability to save and invest.
A major impediment to poverty reduction is inequality – which not only excludes thepoor from the benefits of growth but can also lower growth itself. These policiesshould help to reduce poverty through faster growth and greater equity as well as theinteraction between the two. Nevertheless, there are certain trade-offs betweengrowth and greater equity, especially with regard to the utilization of scarce publicresources. The policies recommended in this report imply relative losses for some socialgroups and relative gains for others; the objective is to maximize the gains for the poorwhile striving to benefit everyone.
The main question, however, is: how can policy makers promote complementaritiesbetween growth and redistribution? This would involve not only generating aninequality-reducing pattern of growth but also undertaking a growth-enhancing pat-tern of redistribution. At the same time policymakers should aim to minimize thetrade-offs between current growth-focused policies and redistributive measures.
The governing assumption is that measures for redistribution should be treated not asan entirely separate policy sphere but integrated, as much as feasible, with policies forpromoting growth. The desired outcome is a pattern of growth that will deliver‘absolute’ benefits to both poor and non-poor while also allowing the poor to makerelatively greater gains. This will require pro-poor macroeconomic and adjustmentpolicies. But these will not be sufficient; it will also be necessary to carry out redistrib-utive measures that alter the basic functioning of the land, capital and labour marketsso as to effectively ‘integrate’ the poor into the growth process.
Our approach to ‘pro-poor growth’ strategies stems from UNDP’s 2002 Policy Note:“The Role of Economic Policies in Poverty Reduction” (UNDP 2002:www.undp.org/poverty/propoor.htm). This concentrates on how growth is generated andwhether this process is equitable – focusing on the economic opportunities of the poor– their access to the assets, resources and employment that can enable them to securea decent standard of living and thereby significantly widen their options for humandevelopment. It maintains that if countries are to reach the MDG target of halvingextreme income poverty by 2015 they will certainly need rapid growth, but that theywill stand a much greater chance of reaching the target if the growth is also more equi-table – so that the incomes of the poor grow faster than average.
If it is to significantly improve the absolute condition of the poor, growth will thusneed to be rapid. But it also needs to be sufficiently equitable to improve their relativeposition. This can be achieved at the start of the growth process – through universal-izing coverage of education and health services, for example. Or it can be achievedover time: for example, by boosting employment among low-skilled workers andincreasing their wages.
4
Chapter One: Methodology and Scope

Equity-based growth can be achieved through a variety of strategies. The choicedepends in part on each country’s initial conditions. In general, if the growth is toreduce poverty immediately it should be such as to direct resources disproportionate-ly to the sectors in which the poor work, such as small-scale agriculture, the areas inwhich they live, such as underdeveloped regions, or the factors of production that theypossess, such as unskilled labour or land.
This strategy would reach the poor where they are to be found. It would decidedlyimprove the relative position of poor households and generate employment, even ifthe rise of real incomes might be slower than optimal.
The longer-term objective of all development, of course, is to allow workers to moveout of low-productivity sectors, poorly resourced regions and low-skilled employ-ment. Generally this would mean leaving agriculture for industry and more modernservices. Some growth strategies emphasize this objective in the medium term, andtend to downplay equity until growth accelerates.
This alternative approach assumes that rapid and broad industrial growth will reducepoverty by pulling poor workers into higher-productivity, higher-paid jobs. In thepast, some countries have achieved this through import-substitution strategies.Nowadays, some countries have successfully emphasized the exports of manufactures– though this is unlikely to reduce inequality in the short term and may even increaseit. If inequality is indeed reduced, it is more likely to be due to initial prosperity inagriculture or an initially equitable distribution of endowments, such as land or humancapital.
This report argues for expansionary, investment-focused fiscal policies and for appro-priate monetary policies that do not target very low inflation rates. Instead of theorthodox focus on allocative efficiency and price stabilization it puts a premium onboosting domestic savings and investment. It also advocates using public investment asa stimulus to private investment.
This implies a more active policy role for the state – and often the need for a largerrevenue base to finance capital expenditures that can be directed to poverty-reduction.In Yemen, however, where public investment has been inefficient and aggregate sav-ings have outweighed aggregate investment, this would imply reforming the publicsector so it could invest more productively – as well as restructuring financial institu-tions so that they could lend more for private investment.
While financial liberalization is often necessary, it does not always lead to the desiredresults. Commercial banks are often reluctant to lend for long-term private investment– leading, for example, to a high spread between their deposit and lending rates.Moreover, banks are also often reluctant to lend in rural areas, particularly for agricul-tural activities, and are rarely interested in lending to poor households.
Greater trade openness can certainly boost growth and help reduce poverty. But notnecessarily. Indeed it can exacerbate inequality and cause any growth that occurs to
5
Chapter One: Methodology and Scope

bypass the poor, especially the rural poor. Trade liberalization needs to be comple-mented with other more pro-active, poverty-focused measures – such as building ruralinfrastructure, financing agricultural development and providing adequate credit tosmall and medium enterprises,. To be most effective, liberalization of trade should thusbe designed carefully and often combined with some import substitution policies andpro-active industrial strategy.
Linking growth to poverty reduction involves generating widespread employment atdecent wages. This cannot, however, be based simply on self-employment and micro-enterprises; these may raise incomes but cannot on their own guarantee secure andremunerative employment. Instead the emphasis has to shift to small and mediumenterprises, and to large enterprises that are both employment-intensive and skillenhancing.
The Major Entry Points
This case study encompasses six major entry points, organized in two clusters. The firstcluster is macroeconomic policies, which include:
• Monetary policy
• Fiscal policy
• Exchange rate policies
As the chief basis for stimulating investment and growth, standard monetary policy isconcerned primarily with maintaining price stability, expressed as a low inflation rate.And under standard policies of macroeconomic stabilization, fiscal policy is concernedprimarily with maintaining fiscal balance. This approach assumes that when fiscal bal-ance is not achieved, the financing of the consequent deficit can have a crucial impacton either the interest rate or the inflation rate or both – depending on whether deficitsare financed by debt or money creation.
Aiming to maintain macro balances, many countries, fearing a rise of inflation, havemaintained excessively restrictive policies of macroeconomic stabilization. As a result,they have been deprived of resources for financing the investment needed to spurgrowth. This report on the other hand is concerned with how macroeconomic poli-cies can become more expansionary – reducing poverty by generating higher rates ofgrowth and employment. Macro balances, such as the current-account and the fiscalbalances are evaluated chiefly as constraints rather than goals of policy.
Macroeconomic policies have impacts on both the demand and supply sides. Thereport investigates therefore how the constraints of macroeconomic balances can bemet without depressing demand and therefore investment. And on the supply side, itinvestigates how fiscal policy can be used not to restrict supply but augment it. Pro-poor growth helps this in two ways: limiting damaging impacts on the income of thepoor helps to maintain aggregate demand; and actively augmenting the capabilities ofthe poor strengthens the supply response.
6
Chapter One: Methodology and Scope

Seeking policies that are complementary to macroeconomic and adjustment policies,this report examines fiscal policies comprehensively, including both expenditures andtaxes. Specifically, it evaluates whether the public budget is allocating resources in apro-poor manner and whether the government is mobilizing public revenue in anequitable fashion.
Thus, the main macroeconomic policy question is: are there a feasible set of fiscal,monetary and exchange-rate policies that can reduce poverty while maintaining macrobalances within sustainable, manageable limits?
The second major cluster of policies concern adjustment:
• Financial liberalization
• Trade liberalization
• Deregulation
The main question is: what impact has each of these structural policies had on pover-ty? And if the impact has been adverse, or substantially less positive than expected,what alternative methods and forms of restructuring can foster greater growth andequity?
To answer these questions the report analyses the major structural features of the econ-omy, its initial conditions and the major characteristics of the poor. Although it advo-cates macroeconomic policies that are less restrictive and for adjustment policies that aremore investment oriented, it recognizes that the success of these reforms hinge on alter-ing some of the structural features of the economy or the characteristics of the poor.
This study does not rely solely on modelling or simulation exercises but on a richcountry-specific narrative that reflects changes in the macroeconomic framework. Theprimary audience is national policymakers – offering them a choice of feasible pro-poor and pro-growth economic policies that can strengthen national capacity to accel-erate progress towards the MDGs
Sectoral Policies
This report focuses primarily on macro-level policies but also encompasses a broaderrange of complementary policies that can reinforce poverty impacts or reduce con-straints. These, which may also be preconditions for successful macroeconomic andadjustment policies, include other economic policies, other structural reforms, socialpolicies, redistributive measures and poverty-focused initiatives.
Successful macro-level policies will depend also on ‘microeconomic’ reforms, such asimproving the capabilities of the poor and their access to productive assets andresources. In elaborating policy recommendations, the report necessarily touches on anumber of other complementary policies:
7
Chapter One: Methodology and Scope

Budgetary re-allocations – How can the government budget –on both the expenditureand revenue sides – be used to reduce poverty? How does access to public resourcesand assets, especially access to physical infrastructure and economic services, helpreduce poverty? How can the taxation system be made more pro-poor? The reportaddresses these and other issues concerning the ‘composition’ of fiscal policies.
Sectoral or regional policies – To what extent can sectoral policies, such as stimulating agri-culture, contribute to reducing poverty –by lowering inter-sectoral inequality, forexample? What role can the re-allocation of resources to poor regions play? How canpolicies of restructuring, including trade and financial sector policies, be used to sup-port pro-poor growth?
Redistribution of assets – How can assets, such as land and housing, be redistributed soas to reduce poverty?
Employment generation – What labour market policies are needed to convert growthinto productive and remunerative employment, particularly for the working poor?
Developing human capabilities – How can social policies, such as those on health, educa-tion and nutrition, enhance the ability of the poor to access economic opportunities?
The Descriptive Narrative
The report describes trends in economic variables, inequality and poverty so as to bet-ter evaluate macroeconomic and adjustment policies. It examines the institutionalarrangements that determine access to assets, resources and employment and tries toidentify the trends in domestic and external resources:
Macro developments
The report includes a thumbnail sketch of macroeconomic developments and policyinitiatives or responses over the past two decades. This is organized around summarymacro statistics that where possible are disaggregated by economic sector and region.In addition it describes episodes of instability, crisis and stabilization along with long-term trends in income, exports, employment and other key economic factors.
Poverty and inequality
The report summarizes levels and trends in inequality, income poverty and humanpoverty. Because it focuses on economic policies it measures poverty in the firstinstance, in income terms, but it also compares and contrasts these with estimates ofhuman poverty. The report covers the following areas:
• Poverty – Changes in the incidence and depth of income poverty based onfixed poverty lines – both extreme and overall poverty – including the basisfor setting the poverty line. Especially important are changes in incomepoverty by economic sector, employment category, region, rural/urban andgender.
8
Chapter One: Methodology and Scope

• Inequality – Levels and changes in inequality with a focus on the lower end of thedistribution and magnitude of resources required to achieve poverty reduction.
• Other key economic characteristics – Such as whether people are in the agricul-tural sub-sector or informal or formal sector, tradable or non-tradable sectors,as well as food security and access to infrastructure, such as roads, transporta-tion, irrigation and electricity.
Markets and other institutions
The report also describes key markets and other institutional arrangements in produc-tion and distribution:
• Land – In agriculture and related activities, arrangements for access to landand commons, and the terms of this access.
• Credit – Modes of access to credit and the nature of credit market institutions.
• Employment – The nature of labour market institutions and the extent ofunemployment and underemployment – along with income sharing andother informal non-governmental forms of income security. Also wage differ-entials and discrimination; job tenure and insecurity.
The mobilization and allocation of resources
How can domestic and foreign resources be mobilized and effectively allocated? Thefocus is on finding ways to loosen the tight fiscal constraints under which many coun-tries like Yemen are forced to operate. We call this expanding ‘fiscal space’. Thus, theanalysis focuses on both the level and growth of national resources, especially throughthe mobilization of national savings. The study also makes an effort to go beyond thestandard kind of poverty analysis, which focuses on spending for the social sectors (orbasic social services), and seeks to identify the allocation of resources for economicservices, such as for agriculture, industry or services. It also describes the incidence ofmajor forms of taxation and the general prospects for mobilizing additional domesticresources for development. This involves determining whether levels of national sav-ings and tax revenue, in conjunction with the supply of external resources, are ade-quate for stimulating investment-led growth.
The study is structured as follows:
Chapter Two – This reviews the poverty situation based on two sources; the HouseholdBudget Survey (1998) and the National Poverty Survey (1999). It also appraises twodecades of programmes for economic growth and poverty reduction.
Chapter Three – The Government of Yemen aims to reduce the proportion of the pop-ulation with incomes below the national poverty line from the 43% level at the timeof the 1998 Household Budget Survey to 21% in 2015. This chapter estimates the eco-nomic growth and investment needed to achieve this and the shortfall that would needto be filled by overseas development assistance.9
Chapter One: Methodology and Scope

Chapter Four – This reviews Yemen’s macro-fiscal record, presenting the challengearising from the anticipated future decline in oil revenues.
Chapter Five – This discusses the limited contribution of financial sector to growth andpoverty reduction.Chapter Six – This reviews the reforms in the monetary and exchange rate regulationsand highlights the decline in private-sector savings and investment – along withemployment and productivity issues.
Chapter Seven – In order to provide widespread remunerative employment, Yemenneeds to increase both public and private investment. This chapter concludes thatfinancing for such investment will have to come from various current sources: oil rev-enue, increased tax revenue on non-oil incomes, reduced international reserves, debtrelief and from substantially increased ODA.
Chapter Eight – Yemen is a predominantly rural society. This chapter addresses agricul-ture and rural livelihoods and provides a set of policy proposals for improving foodsecurity and reducing poverty. The chapter also analyses demand and supply side con-straints to increasing agricultural production and agrarian transformation.
Chapter Nine – Despite liberalization, Yemen’s integration in the world economy hasbeen relatively modest. This chapter presents the main features of Yemen’s trade andindustry sectors and gives policy recommendations for a more diversified export struc-ture and production base.
Chapter Ten – This summarizes the report’s main policy recommendations.
10
Chapter One: Methodology and Scope

2.1 The nature of poverty in Yemen
Yemen suffers from generalized or mass poverty. According to the 1998 HouseholdBudget Survey (HBS 98), 41.8% of the population in that year lived under conditionsof extreme poverty, i.e., below the World Bank’s ‘lower’ poverty line.6 At the officialexchange rate in 1998 this line is equivalent to 78 cents a day and at the 1985 PPP rateit is just over 1 dollar a day (Table 2.1).
Table 2.1 – Headcount poverty, 1998
Lower poverty line Upper poverty line
Poverty Line:
Rials a day 105.53 155.18
$ a day, PPP 1985* 1.03 1.51
$ a day, official exchange rate 1998 0.78 1.14
Head Count Poverty:
National 41.8 66.9
Rural 45.0 69.6
Urban 30.8 57.8
Notes: The 1998 poverty lines are rebased to 1993 using the consumer price index. The ppp rate is
calculated at 1993 GDP ppp rates and normalized by the 1.08 factor to be comparable to the World
Bank's definition of $1 a day poverty line at 1985 ppp rates.
Sources: World Bank 2002 for poverty lines, and WDI 2004, World Bank for ppp rates.
A more normal ‘upper’ poverty line is defined as the value of the basket of goods andservices that is actually consumed by the households whose food and energy intake isequal to the minimum requirement of 2,200 calories per person per day.7 At the offi-cial exchange rate this poverty line translates into about $1.1 per day, and at the 1985PPP rate it is about $1.5 a day (Table 2.1).8 On this basis the headcount poverty rateis 66.9% – the majority of the population – 69.6% in rural areas, and 57.8% in urbanareas. In addition, many other people live marginally above the poverty line and are
11
Chapter TwoGeneralized poverty in Yemen and its macroeconomic implications
Chapter Two: Generalized poverty in Yemen and its macroeconomic implications
6 The lower poverty line is defined as the value of the basket of goods and services which is equal to the cost of thefood bundle that can afford the minimum energy intake of 2,200 calories per person per day, plus a minimumallowance for non-food expenditure which is equal to the average spending on such items by households whosetotal expenditure is no more than the value of the minimum food requirements.7 We have referred to this as the ‘normal’ definition of poverty line, because in countries such as India this formsthe basis of defining absolute poverty lines. In the case of India though, the minimum calorie intake in the ruralareas is taken as 2,400 calories and in the urban areas as 2,100 calories per person per day. Given that the majorityof the population in Yemen lives in the rural areas, the application of Indian norms will lead to even higher head-count poverty measures than reported.8 It should be noted that the PPP exchange rates in Table 2.1 are based on GDP PPP exchange rates and not theconsumption exchange rates. This may lead to an under-estimate of poverty as reported in Table 2.1. This is becausea relatively large proportion of essential consumer goods in Yemen, particularly the basic necessities such as foodand medicine are traded goods, while the domestic component of other GDP expenditure

vulnerable to minor economic fluctuations. Clearly in Yemen the vast majority of thepopulation are poor.9
Figure 2.1 – Child malnutrition
Notes: Average refers to a simple average for 64 low-income countries as defined by the World Bank.
For countries other than Yemen, values refer to the average for 1995-2000.
Source: World Bank WDI 2004.
Income poverty is, however, a one-dimensional measure, so it could be argued thatgeneralized poverty in Yemen is just a statistical artefact susceptible to the choice ofthe poverty line. This picture of generalized poverty is, however, confirmed by otherdirect and indirect measures. According to the National Poverty Survey 1999 (NPS99), for example, more than 58% of the population belonged to households who con-sidered themselves as either poor or extremely poor. Health and education indicatorssupport this: for example, over 80% of the adult population in 1998 were either illit-erate or did not complete primary schooling.
Poverty can be considered as generalized poverty given that the difference between thepoorest fraction and the rest of the population is relatively small. Other indicators ofpoverty such as those on nutrition and health also point to mass poverty. As can beseen from Figure 2.1, for example, child malnutrition is more extensive in Yemen thansome of the poorest countries in sub-Saharan Africa.
Where the poor constitute a relatively small section of the population the main instru-ments of anti-poverty policy are social safety nets and redistributive social welfareschemes. But in circumstances of mass poverty these are inadequate. Furthermore,generalized poverty poses serious new challenges to policy makers as it can affect thebehaviour of economic agents and the way in which institutions respond to policystimuli at the micro level, as well as severely limiting the range and effectiveness ofpolicies available to the government at the macroeconomic level.
12
Chapter Two: Generalized poverty in Yemen and its macroeconomic implications
(% of children under 5)
0
10
20
30
40
50
(% of children under 5)
0
10
20
30
40
50
60
Yem
en 1
997
Ave
rage
*
Mal
i
Suda
n
Uga
nda
Yem
en 1
997
Ave
rage
*
Mal
i
Rw
anda
Uga
nda
Figure 2.1(a), Malnutrition prevalence, weight for age Figure 2.1(b), Malnutrition prevalence, height for age
9 According to the World Bank (2002) simulations, for example, an additional 7 to 24 per cent of the populationin 1998 were in the vicinity of the lower poverty line – the vulnerability depending on the size of the economicshock varying respectively between 10 to 30 per cent of per capita consumption. This becomes particularly signif-icant when one considers the high volatility of per capita private consumption in Yemen (see, e.g., Figure 2.3below). s such as investment (mainly construction work) and government consumption is likely to be relatively high.

Generalized poverty is also usually associated with other broader economic conditionsFor example, the majority of the population live in rural areas – 74% in Yemen – sur-viving on low-productivity, subsistence agriculture and related activities. Levels ofhuman capital are very low and population growth is rapid, 3% in Yemen, which mul-tiplies the number of unskilled workers. Meanwhile the accumulation strategies for therich are based on eating into the natural capital stock.
Such economies are often caught in a vicious circle of population growth, environ-mental degradation and natural resource depletion that ultimately can destabilize thesocial and political order (UNCTAD 2002). In Yemen, however, the discovery andproduction of oil in the 1980s, and the considerable increase in oil revenues in the1990s, provided a short window of opportunity to break out of this vicious circle.
2.2 Domestic resources for development and investment undergeneralized poverty
A good starting point for the discussion of the potential contribution of the oil sectoris to examine the magnitude and trends in ‘domestic resources for development andinvestment’ (DRDI). This is defined as gross national income minus private consump-tion expenditure – which is equal to resources available for domestic investment, pro-vision of public services, or investment abroad. In very low-income countries DRDIis a useful indicator of the possibilities for resource mobilization consistent with pover-ty reduction, and the nature of resource constraints over time. It also serves as an indi-cator of the magnitude and locus of the fiscal base and as a basis for calculating theavailable ‘fiscal space’.
Figure 2.2 shows the trends in non-oil DRDI for Yemen as a share of non-oil GDP,comparing this with the average value of DRDI for other (non-LDC) developingcountries.
Figure 2.2 – Domestic resources available for development and investment(DRDI), 1990-2003
13
Chapter Two: Generalized poverty in Yemen and its macroeconomic implications
Per
cent

Given the quality of the national accounts data, some care is needed in interpretingFigure 2.2. Nevertheless, the orders of magnitude are large enough for a clear pictureto emerge: in much of the period since the early1990s non-oil GDP has barely beensufficient to cater for private consumption expenditure. And since the latter half of the1990s, the gap between the non-oil DRDI in Yemen and the average DRDI for otherdeveloping countries has been large and widening – currently equivalent to over 35%of non-oil GDP10.
Figure 2.3: Per capita household consumption expenditure, 1990-2002
Source: WDI 2003, the World Bank.
Figure 2.4: Per capita household consumption expenditure in Yemen andother developing countries, 1990-2002
Notes: Other developing countries chart is the simple average for 108 non-LDC developing countries.
Source: WDI 2003, the World Bank.
This may suggest that Yemen’s rising oil income has been fuelling private consumptionand hence squeezing non-oil DRDI rates. This view however is not entirely correct.As can be seen in Figure 2.3, real per capita private consumption in Yemen since the
14
Chapter Two: Generalized poverty in Yemen and its macroeconomic implications
6000
6500
7000
7500
8000
8500
9000
9500
10000
1990 1991 1992 1993 1994 1995 1996 1997 1998 1999 2000 2001 2002
Con
stant
199
0 Pr
ices
0
200
400
600
800
1000
1200
1400
1600
1800
1990 1991 1992 1993 1994 1995 1996 1997 1998 1999 2000 2001 2002
Other Developing Yeman
1995
US
$
10 The higher DRDI rate in the first half of the 1990s is likely to be due to large government implicit subsidieswhich led to an undervaluation of private consumption in national accounts.

early 1990s, if anything, appears to have been declining. In fact, it the peak year for percapita private consumption in the post-economic-reform period was 1998 – the year forwhich the conditions of generalized poverty were discussed in the previous section.
Figure 2.4 compares Yemen with other developing countries. This shows that Yemen’sper capita private consumption levels of $200 at 1995 prices is only around 10% of thedeveloping country average. With per capita consumption at this low level, attempts toraise the domestic non-oil DRDI rate by eating into it by an appreciable amount is like-ly to worsen poverty. This is not of course to deny the possibility of taxing the richergroups: in 1999, according to the National Poverty Survey, the top 20% of householdsaccounted for more than 51% of expenditure.11 However, given the sized of the DRDIgap it is clear that without substantial improvements in labour productivity the domes-tic non-oil economy will be unable to furnish the required resources without pushingwages and consumption well below minimum subsistence levels.
Essentially what is happening is that while private consumption has been growing intotal this has been offset by the population growth. At present, even to maintain percapita consumption levels, total private consumption has had to grow by the relative-ly high rate of 3.5% a year. Population growth also puts an increasing burden on pub-lic services such as health and education – again at the expense of investment in eco-nomically productive activities.
In these circumstances it is unlikely that per capita private consumption levels couldhave been maintained without the contribution of the oil sector and other externalsources of finance. If oil revenues are included in the definition of DRDI, this indica-tor is now measured as gross national income minus private consumption expenditure.Figure 2.5 plots this as share of GNI along with non-oil DRDI, showing that oilincome has made a considerable contribution to the DRDI. This has been partly dueto the large increases in the dollar value of oil exports. But economic reforms have alsoenhanced the contribution of the oil sector to DRDI. During the pre-reform periodwhen oil income was by and large valued at the overvalued official exchange rate, andpartly used for subsidizing the prices of basic consumer goods, the overall DRDI wasnot substantially above the non-oil DRDI (Figure 2.5). In this way, a large part of thegovernment’s oil revenue was transferred to the private sector. Economic reforms,however, then ended consumer price subsidies and unified the exchange rate. This ledto a substantial increase in the domestic currency value of government oil revenues andentailed a large shift of resources from the private sector to the government – partlyfrom the household sector and partly from the private businesses that had benefitedfrom rents generated by quantitative restrictions. So unlike the first half of the 1990sthe government was able to mobilize substantially more resources.
After oil the other major contribution has been migrant remittances. Taking these intoaccount the DRDI rate, as a share of national disposable income, in the post- econom-ic-reform period rises to, or even surpasses, the average levels in other non-LDCdeveloping countries (Figure 2.5). This is a considerable achievement – though built
15
Chapter Two: Generalized poverty in Yemen and its macroeconomic implications
11 Household Budget Survey of 1998 (HBS98) though shows more equal distribution of expenditure with the top30 per cent consuming over 54 per cent of total (see, World Bank 2002).

on two sources of income that are not derived from the reproducible wealth of thedomestic economy. Oil is a depletable resource and exports are projected to tail offwithin the next ten years and remittances from Yemeni workers abroad are not a reli-able source of revenue and are unlikely to grow in the future.12
Figure 2.5: Domestic resources available for development and investment,1990-2003
Sources: IFS, IMF March 2005, World Bank WDI 2005, and CSO Statistical Yearbook, various issues.
It is therefore important to see how the resources made available for financing invest-ment and public services were used in this period and how effective they have been inraising the productive capacities in the economy and in creating productive employ-ment for the poor. A general answer to this question is already implicit in Figure 2.5,in the shape of the non-oil DRDI which meandered close to zero and moved intonegative territory in 2003. Subsequent chapters of this report consider this issue ingreater detail.
2.3 Initial conditions and economic reform
After almost a decade since the inception of the economic reform programme, itshould now be possible to assess its impact. In the immediate aftermath of unificationin 1990, the country faced the formidable task of unifying two countries with differ-ent economic systems, two separate, bloated and inefficient administrative systems, andtwo different legal systems. Moreover, both countries had unsustainable debt burdens.Even under normal circumstances or in more developed economies, these problemswould have been sufficient to knock any government off-balance. But the task wasmade even more difficult by another series of setbacks: the return of tens of thousandsof Yemeni migrant workers following the first Gulf war, two years of severe drought;the cessation of foreign aid, and constant political strife culminating in the civil war of1994. All these events contributed to a backlog of vital investments.
16
Chapter Two: Generalized poverty in Yemen and its macroeconomic implications
-10
0
10
20
30
40
50
DRDI (% of GNI)Non-Oil DRDI (% Non-Oil GDP)DRDI (% National Disposable Income, including net transfers)
20032002200120001999199819971996199519941993199219911990
Per
cen
t
12 Yemen has always had a substantial number of migrant workers which in the 1980s were estimated at overone-third of the labour force, working mainly in the Gulf countries. Following the Gulf crisis of 1990-91 a largenumber of Yemeni workers returned. It is not clear, however, how much of the net current transfers in the bal-ance of payments – which fluctuate between 11 to 18 per cent of national disposable income – consist of regularremittance income by Yemeni workers abroad and how much is ‘hot money’ flowing in to take advantage ofhigh interest rates and relatively stable dollar exchange rate in the country.

Since Yemen did not have access to international capital markets it had to rely substan-tially on oil incomes. However, this can be extremely volatile and led to fluctuationsin government expenditure increasing economic instability. One solution is to estab-lish oil stabilization fund to smooth out the effect of these fluctuations. But this is dif-ficult in such a poor country which needs urgently needs investment. A more appro-priate solution is for the country to have access to a special category of stabilization aidand grants. In years when revenues are greater than planned expenditures, they can beused to reduce foreign debt or increase investment abroad. This avoids the cost ofholding large stocks of stabilization funds and transmits oil revenue fluctuations to aidflows rather than to the domestic economy.
It is also important to consider this from a long-term perspective. One view is that thepath of government expenditure should be determined by ‘permanent income’ fromoil revenues (see, e.g., Enders et al, 2002, Barnett and Ossowski, 2002, and Fisher andEasterly, 1990). Permanent income in this context is defined as that part of oil revenuesthat can be spent without reducing the net wealth of the country – which could beconsidered to be the income from investing the oil revenues in domestic and foreignfinancial assets.
However, there are a number of problems with this proposal. First, the domestic finan-cial markets are incapable of absorbing the funds. Since 2000, Yemen has built up sur-plus oil funds of over 200 billion YRs and mainly kept these as government depositsat the central bank. These sums, together with other foreign exchange reserves thathave accumulated in the central bank, currently standing at well over 1000 billionYRs, and at present earn a rate of return of well below 2% a year.
Furthermore, the permanent income will itself depend on how oil revenues aredeployed in the domestic economy and the type of externalities that such deploymentcan give rise to. It may, for example, be essential to use current oil income for essen-tial public investments that can create positive externalities and make such investmentssustainable in the long run. Investing in reforming the administrative structures andbuilding up the infrastructure can facilitate considerable private investment, bothdomestic and foreign.
What matters for future budget solvency in this case is not only, or even primarily, therate of return on these new investments, but rather the total amount of investment andthe resulting taxable income that they generate in future periods. These are importantconsiderations when examining the post-reform fiscal policy.
17
Chapter Two: Generalized poverty in Yemen and its macroeconomic implications

3.1 Growth and investment requirements
The Government of Yemen aims to reduce the proportion of the population withincomes below the national poverty line from 43% at the time of the first householdbudget survey undertaken in 1998 to 21% in 2015.
How much economic growth will be needed to achieve this? If the distribution ofincome remains unchanged, we estimate that the elasticity of the headcount povertyrate with respect to per capita income, although likely to vary from year to year, willaverage 1.7. Given an average rate of population growth over the period 1999-2015,which is projected at 2.9% per annum, the per capita income would need to rise by1.68% per annum, which implies that over this period national income must increaseby an average of 4.58% per annum. If, however, income distribution improves andgrowth is pro-poor the required growth rate falls to 4.15% per annum On the otherhand, if it is anti-poor, the growth requirement rises to 5.5% per annum.
How much investment would be needed to generate this growth? By analogy withother countries the capital-output ratio over the next decade is likely to hover between3.0 and 3.5. If growth is distribution-neutral, this implies that investment would needto average 22.6% of GDP. If growth is anti-poor it would need to be higher, 25.6%;if growth is pro-poor it could be lower, 21%.
This investment is unlikely to be financed from domestic savings. Over the 1990-2004period the average savings rate for Yemen was approximately 12% of GDP – far belowwhat is needed. And the situation is likely to deteriorate. Dwindling oil revenues couldcause domestic savings to decline significantly over the coming decade. Financing theMDG poverty-reduction targets will also therefore need greater ODA – around dou-ble the current levels. The investment requirements will of course be less if growth isas pro-poor as possible.
3.1.1 Estimating the growth elasticity of poverty reduction
The methodology adopted here to estimate the growth elasticity of poverty reductionis based on that developed by Kakwani and Son (2005). They focused only on theheadcount ratio, but their procedure can easily be applied to other measures such asthe poverty gap ratio which is the preferred measure of extreme poverty.
We used Yemen’s only reliable household expenditure survey, which was conductedin 1998, and adopted the poverty line developed by the World Bank. These elastici-ties will of course depend on the pattern of income distribution. We chose three alter-native growth scenarios: pro-poor, neutral or anti-poor. Table 3.1 summarised theresults (see annex 2 for details).
19
Chapter ThreeGrowth, investment and ODA requirements for halving income poverty by 2015
Chapter Three: Growth, investment and ODA requirements for halving income poverty by 2015

Table 3.1 – Elasticity of poverty reduction with respect to growth of 1%under alternative growth scenarios: headcount and poverty gap ratios
Anti-poor growth Neutral growth Pro-poor growth
Headcount Poverty Headcount Poverty Headcount Poverty
Gap Gap Gap
1999 1.18 0.91 1.62 1.94 1.86 2.97
2000 1.44 0.88 1.71 1.95 2.09 3.02
2001 1.34 0.85 1.65 1.96 1.87 3.08
2002 1.17 0.82 1.47 1.97 1.70 3.15
2003 1.25 0.79 1.42 1.99 2.35 3.22
2004 0.86 0.76 2.01 2.00 1.75 3.28
2005 1.48 0.74 1.21 2.01 2.20 3.36
2006 1.30 0.70 1.57 2.02 1.95 3.42
2007 0.88 0.67 1.85 2.03 1.85 3.52
2008 1.35 0.64 1.44 2.04 2.36 3.61
2009 0.94 0.61 1.26 2.07 2.64 3.67
2010 1.33 0.57 1.53 2.09 2.75 3.75
2011 1.05 0.54 2.23 2.10 2.83 3.81
2012 0.64 0.51 1.74 2.10 2.36 3.89
2013 0.94 0.48 1.96 2.11 2.33 3.99
2014 0.97 0.45 2.09 2.11 2.69 4.09
2015 0.91 0.42 1.74 2.11 2.54 4.18
Average 1.12 0.67 1.68 2.03 2.24 3.53
Sources: Estimates based on data from the 1998 HBS.
The headcount ratio gives equal weight to every poor person while the poverty gapratio assigns a weight to a poor household proportional to its degree of deprivation.This table shows that the elasticities are higher for the poverty gap ratio than for theheadcount ratio. This means that pro-poor growth benefits the ultra-poor more thanit benefits the poor as a whole. Another important feature of pro-poor or distribution-neutral growth is that the poverty gap elasticity increases in a linear fashion over time– so the investment required to meet MDG target will also decline in the same fash-ion. In the case of anti-poor growth, however, the poverty elasticities decrease overtime. This means the investment required to meet the MDG goal will increase overtime.13
3.1.2 Estimating the required per capita growth rate
Meeting the first MDG would mean reducing poverty 2.73% annually from the firstsurvey period to 2015. Based on the elasticities above, the growth rates required arepresented in Table 3.2. If the growth pattern is anti-poor, the per capita growthrequired jumps from 0.78% to 2.57%. For the poverty gap ratio, the difference
20
Chapter Three: Growth, investment and ODA requirements for halving income poverty by 2015
13 On the other hand, the elasticity of the headcount measure does not follow a monotonic path. This is becausewhen income increases, people are moving out of poverty. Therefore, the elasticity will depend on where themajority of the poor are located in the distribution (i.e. on the density function at the poverty line), which canfluctuate significantly.

between required rates of growth in the pro-poor and anti-poor scenarios is even morestriking – 4.32% versus 0.78%.
Assuming Yemen’s population grows by 2.9% annually between 1999 and 2015, thenfor the anti-, distribution-neutral and pro-poor scenarios, the economy must grow at5.47%, 4.58% and 4.15% annually over the same period to achieve the required result.For the poverty gap the required average annual growth rates are 7.22%, 4.25% and3.68% respectively. However, due to the decline in population growth rates thegrowth rate is not uniform: for the period from 1999 to 2004, the required averagerate of economic growth is 5.6, 5.0 and 4.7 for the three scenarios, respectively.
Table 3.2: Per capita growth rates required to achieve MDG1: headcountand poverty gap ratios, under alternative growth scenarios, 1999-2015
Anti-poor growth Neutral growth Pro-poor growth
Headcount Poverty Headcount Poverty Headcount Poverty
Gap Gap Gap
1999 3.30% 2.31 3.00 1.68 1.41 1.47 0.92
2000 3.25% 1.90 3.10 1.60 1.40 1.31 0.90
2001 3.20% 2.04 3.22 1.65 1.40 1.46 0.89
2002 3.15% 2.34 3.34 1.86 1.39 1.61 0.87
2003 3.10% 2.19 3.46 1.93 1.38 1.16 0.85
2004 3.05% 3.19 3.58 1.36 1.37 1.56 0.83
2005 3.00% 1.85 3.72 2.25 1.36 1.25 0.81
2006 2.95% 2.11 3.91 1.74 1.35 1.40 0.80
2007 2.90% 3.10 4.10 1.48 1.35 1.48 0.78
2008 2.85% 2.02 4.28 1.90 1.34 1.16 0.76
2009 2.80% 2.92 4.50 2.18 1.32 1.04 0.74
2010 2.75% 2.06 4.77 1.79 1.31 0.99 0.73
2011 2.70% 2.61 5.08 1.23 1.30 0.97 0.72
2012 2.65% 4.27 5.34 1.57 1.30 1.16 0.70
2013 2.60% 2.90 5.65 1.40 1.30 1.17 0.69
2014 2.55% 2.81 6.02 1.31 1.30 1.02 0.67
2015 2.50% 3.01 6.47 1.57 1.30 1.08 0.65
Average 2.90% 2.57 4.32 1.68 1.35 1.25 0.78
Source: ibid
Using these elasticities, it is also possible to speculate on the effects of economic growthon poverty since 1999. To achieve the poverty headcount goal, Yemen’s GDP wouldneed to have grown annually by 5%. In fact GDP per capita grew only by 1.0% perannum and real GDP grew by only 4.1%. If the poverty-income elasticity is 1.5 theneconomic growth should have reduced the headcount poverty rate by 3.87 percentagepoints – i.e. from 43% to 39.13%. This implies that Yemen could be off track toachieve the MDG1 goal. Moreover, if distribution had worsened over that period,then poverty would have dropped by only 3 percentage points. Conversely, if incomedistribution had improved, poverty decline since 1998 may have reached 5.16%. Evenso, this rate of growth is still below what is required to halve poverty by 2015. The
21
Chapter Three: Growth, investment and ODA requirements for halving income poverty by 2015

implication is that if it is to achieve the poverty reduction goal Yemen needs toincrease its rate of economic growth significantly over the coming decade.
3.1.3 Estimating the required investment
Given the required per capita annual growth rates, we can estimate the required grossinvestment as a percentage of GDP. In their study on 15 African countries, Kakwaniand Son (2005) assumed a capital-output ratio of 3 and an annual rate of depreciationof 3.1%. Our calculations, based on national accounts data supplied by the StatisticalBureau confirm that both assumptions are relevant for Yemen.14
The results indicate that the required investment needs differ depending on the patternof growth. It is evident that, all things being equal, the average required gross invest-ment increases sharply if growth is accompanied by worsening inequality.15 In the pro-poor growth scenario, the average required investment for the headcount ratio isaround 21% of GDP, which is lower than the rates of 25.6% and 22.6% required underthe anti-poor and distribution-neutral scenarios, respectively. For the poverty gapratio, the discrepancy is larger. Thus, the average required investment-to-GDP ratioswere 32.2%, 21.5% and 19.7% for the anti-poor, distribution neutral and pro-poor sce-narios, respectively. (Table 3.3-3.4)
Table 3.3: Headcount ratio target: average investment requirement andgap between savings and investment, as a percentage of GDP, 2005-2015
Anti-poor growth Neutral growth Pro-poor growth
Investment Investment Investment Investment Investment Investment
-savings gaps -savings gaps -savings gaps
2005 23.9 8.9 25.1 10.1 22.0 7.0
2006 24.5 11.5 23.4 9.9 22.4 8.4
2007 27.3 16.3 22.4 10.4 22.4 9.4
2008 23.9 14.9 23.5 13.0 21.3 9.3
2009 26.5 19.5 24.2 15.2 20.8 9.8
2010 23.7 18.7 22.9 15.4 20.5 10.5
2011 25.2 22.2 21.1 15.1 20.3 11.3
2012 30.1 29.1 22.0 17.5 20.7 12.7
2013 25.8 26.8 21.3 18.3 20.6 13.6
2014 25.4 28.4 20.9 19.4 20.0 14.0
2015 25.8 30.8 21.5 21.5 20.0 15.0
Average 25.6 20.6 22.6 15.1 21.0 11.0
Source: ibid
22
Chapter Three: Growth, investment and ODA requirements for halving income poverty by 2015
14 Kakwani and Son (2005) estimated the rate of depreciation for the Middle East and North Africa (MENA) to bearound 3.1 using the formula given in Footnote 2. 15 See Kakwani et. al. (2005).

Table 3.4: Poverty gap ratio target: average investment requirement andgap between savings and investment, as a percentage of GDP, 2005-2015
Anti-poor growth Neutral growth Pro-poor growth
Investment Investment Investment Investment Investment Investment
-savings gaps -savings gaps -savings gaps
2005 29.5 14.5 22.4 7.4 20.7 5.7
2006 29.9 16.9 22.2 8.7 20.5 6.5
2007 30.3 19.3 22.0 10.0 20.3 7.3
2008 30.7 21.7 21.9 11.4 20.1 8.1
2009 31.2 24.2 21.7 12.7 19.9 8.9
2010 31.9 26.9 21.5 14.0 19.7 9.7
2011 32.6 29.6 21.3 15.3 19.6 10.6
2012 33.3 32.3 21.2 16.7 19.4 11.4
2013 34.1 35.1 21.0 18.0 19.2 12.2
2014 35.0 38.0 20.8 19.3 19.0 13.0
2015 36.2 41.2 20.7 20.7 18.8 13.8
Average 32.2 27.2 21.5 14.0 19.7 9.7
Source: ibid
Unlike the Kakwani and Son study, however, this report has not used a fixed rate ofdomestic savings, because oil revenues, which constitute the bulk of the current pub-lic revenue-base, are expected to decline significantly. Nor does it make sense toassume that this decline in domestic savings will take place independent of the growthand income distribution scenario. Since the anti-poor scenario will require highergrowth, this would put more pressure on the fiscal and external trade gaps. To take thisinto account, we assumed three different savings-to-GDP scenarios from 2005 to 2015.The assumption instead is that for the anti-poor, distribution-neutral and pro-poorgrowth scenarios savings would average 5%, 8%, and 10% respectively. Tables 3.3-3.4indicate the required investments.
For the headcount ratio the average investment-saving gap is 11% when growth is pro-poor, but increases to 20.6% when growth is anti-poor. For the poverty gap ratio, inthe pro-poor scenario the resource gap is only 9.7% but rises to 27.2% when growthis anti-poor. (Table 3.4)
3.1.4 Estimating the requirements for per capita foreign aid
The investment-savings gap can be filled by numerous alternative sources: officialdevelopment assistance (ODA), private capital inflows, and borrowing. If we assumethat the gap is to be filled by ODA, then using IMF estimates of per capita GDP andrequired per capita growth rates obtained in Section 3.2.2, we calculated the averageGDP and financing gap per capita, in 2002 US dollars, over the 2005-2015 period.The results are shown below in Tables 3.5 and 3.6.
23
Chapter Three: Growth, investment and ODA requirements for halving income poverty by 2015

Table 3.5: Headcount ratio target: per capita GDP in 2002 US$ and ODArequired under alternative growth scenarios, 2005-2015
Anti-poor growth Neutral growth Pro-poor growth
GDP pc ODA GDP pc ODA GDP pc ODA
2005 577 51.1 567 57.1 559 39.3
2006 589 67.5 577 57.0 566 47.3
2007 607 98.9 586 61.1 575 54.2
2008 619 92.4 597 77.8 581 54.2
2009 638 124.1 610 92.9 587 57.7
2010 651 121.9 621 95.7 593 62.5
2011 668 148.5 628 94.7 599 67.7
2012 696 202.4 638 111.5 606 77.1
2013 716 192.1 647 118.3 613 83.5
2014 737 209.1 656 127.0 619 86.7
2015 759 233.8 666 143.3 626 94.1
Average 636 140 602 94 583 66
Source: ibid
Reaching the MDG headcount target would require annual ODA of $66 per capitaunder the pro-poor growth scenario, but $140 under the anti-poor growth scenario.For the poverty gap ratio, the figure is $216 under the anti-poor growth scenario butonly $56 when growth is pro-poor. Greater GDP per capita will also be required ifgrowth is not pro-poor – an additional $74 and $160 per person to meet the head-count and poverty gap targets respectively. Finally, Figure 3.1 shows that the ODArequirements for the headcount estimated here are significantly higher than those esti-mated for other LDCs in the study by Kakwani and Son (2005).
Table 3.6: Poverty gap target: per capita GDP in 2002 US$ and ODArequired under alternative growth scenarios, 2005-2015
Anti-poor growth Neutral growth Pro-poor growth
GDP pc ODA GDP pc ODA GDP pc ODA
2005 597 86.3 559 41.3 551 31.6
2006 620 104.8 567 49.4 555 36.3
2007 646 124.5 575 57.7 559 41.0
2008 673 146.0 582 66.2 563 45.8
2009 704 170.2 590 74.7 568 50.7
2010 737 197.9 598 83.5 572 55.7
2011 774 229.5 605 92.7 576 60.8
2012 816 263.3 613 102.2 580 65.9
2013 862 302.1 621 111.8 584 71.0
2014 914 347.3 629 121.7 588 76.2
2015 973 400.9 638 131.9 592 81.4
Average 713 216 586 85 565 56
Source: ibid
24
Chapter Three: Growth, investment and ODA requirements for halving income poverty by 2015

Figure 3.1: Average Annual ODA required for Yemen and selected AfricanLDCs, 2005-2015
Source: ibid
Notes: Cote d’Ivoire and Cameroon were excluded from this sample as their estimated required rates
in the anti-poor scenario were significant outliers.
3.1.5 The effect of a more favourable savings path
A decline in savings can significantly affect the prospects for poverty reduction. But thisdecline is not inevitable. As argued later in this report, Yemen has the potential todiversify its economic base and hence reduce its dependence on oil revenues and theresulting growth in service and non-oil commodity exports would reduce the balanceof payments constraint on growth. Hence, as shown in Figure 3.2, it is envisaged thatby 2010 savings could have rebounded from the oil shock and, if growth is distribu-tion-neutral or pro-poor, could by 2015 even exceed the initial savings rate. Asrevealed in Table 3.7, this would dramatically lower the cost of poverty reduction. Andif growth were pro-poor this would reduce the ODA requirement for financingpoverty reduction by 100%.
Figure 3.2: Projected rate of domestic savings under different growth sce-narios. 2005-15
Source: ibid
25
Chapter Three: Growth, investment and ODA requirements for halving income poverty by 2015
-200
20406080
100120140160180
Pro-poor Distribution Neutral
(2002 US$)
Bru
ndi
Faso
Bur
kina
Eth
iopi
a
Gha
na
Gui
nea
Gam
bia
Ken
ya
Mad
agas
car
Moz
ambi
que
Mal
awi
Nig
eria
Uga
nda
Zam
bia
Ave
rage
Yem
en
Anti-poor
5.0%
7.0%
9.0%
11.0%
13.0%
15.0%
17.0%
19.0%
21.0%
2005 2006 2007 2008 2009 2010 2011 2012 2013 2014 2015
Anti-poor Distribution NeutralPro-poor

Table 3.7: Adjusted ODA required to achieve the MDG1 headcount andpoverty gap ratios, 2005-2015
Anti-poor growth Neutral growth Pro-poor growth
HC PG HC PG HC PG
2005 51.1 86.3 57.1 41.3 39.3 31.6
2006 67.5 104.8 57.0 49.4 47.3 36.3
2007 98.9 124.5 61.1 57.7 54.2 41.0
2008 92.4 146.0 77.8 66.2 54.2 45.8
2009 124.1 170.2 92.9 74.7 57.7 50.7
2010 102.3 175.8 78.6 67.1 47.6 41.4
2011 108.5 183.0 60.2 59.4 37.7 32.0
2012 139.7 189.9 58.9 51.6 31.6 22.4
2013 106.1 198.7 47.1 43.4 22.2 12.6
2014 98.6 210.2 36.9 35.2 9.3 2.7
2015 97.2 225.7 33.4 26.7 0.2 -7.3
Average 99 165 60 52 36 28
Effect of Higher -41 -51 -34 -33 -30 -28
Savings
Source: ibid
3.2 Aid efficiency
It is important, however, to note some of the shortcomings of this methodology. Theuse of poverty elasticities vis-à-vis economic growth and fixed incremental capital-out-put ratios (ICORs) is a crude approximation because such elasticities and ICORschange across time and space – reflecting differences in country contexts, in endow-ments, in economic and social histories, and in development trajectories.(Vandemoortele and Roy, 2004). Hence, there is a danger in attaching too much beliefto this exercise.
These estimates should not therefore be considered as precise financial requirementsbut as indications of the order of magnitude of the required resources, given very spe-cific macroeconomic and distributional assumptions. They can also pave the way forthe discussion of absorptive capacity in this section and on fiscal space in Chapter 4.
Interestingly, however, the estimates here are in line with those of the GoY. With thecooperation of the UN specialized agencies and the World Bank, the GoY has pre-pared a Needs Assessment Report to identify a set of ‘integrated interventions’ thatwould enable Yemen to meet the MDGs. The report also identifies the necessary infra-structure, and human and financial resources. It suggests that over the next 10 yearsmeeting the MDGs would cost $49 billion. Of this, around 35% of the total, amount-ing to $1.8 billion a year, would need to come from external finance. Given thatYemen gets relatively little aid, $350 million a year, the report identifies a financinggap of almost $1.5 billion per year. This is in line with the estimates presented here forthe pro-poor scenario if savings decline, and for the distribution neutral scenario if sav-ings recover.
26
Chapter Three: Growth, investment and ODA requirements for halving income poverty by 2015

The MDGs are achievable, but as the 2003 Human Development Report outlined,with entrenched poverty what is urgently, needed is follow-through on internationalcommitments. And Yemen in particular requires consolidated international assistanceto help the Government overcome the medium- and long-term problems of falling oilrevenues.16
At present ODA is provided directly to the Government of Yemen and its agenciesand partly in the form of general or sectoral budget support. It can thus help financethe continuance of pro-poor expenditures that are endangered by falling domestic oilrevenues. ODA inflows could thus help sustain the momentum of growth in thedomestic economy while contributing to the achievement of MDG1.
ODA is provided either as grants or as concessional loans that would not need repay-ing for some time. Assuming continuous economic growth, higher concessional ODAinflows would therefore be unlikely to aggravate Yemen’s debt service burden whichin 2003 amounted to 40% of gross national income.
Over the long term however, Yemen would need to finance a significantly higher pro-portion of its currently aid-financed public expenditures from domestic resources. Thiswould require an increase in gross national savings, which could be mobilized throughdomestic borrowing. Leaving distributional considerations aside, domestic borrowingadds to gross investment and to growth if it does not substitute for resources availablefor private investment and if the returns from public investment are high enough tojustify the borrowing costs17.
The problem for Yemen and most other LDCs is that there is no guarantee that donorswill increase or honour their pledged ODA. Although in recent years total aid to theArab region has increased, over half of this in 2003 went to three middle-incomecountries: Egypt, Jordan, and Iraq, with an increasing proportion going to Iraq to sup-port post-conflict reconstruction. The highest aid per capita in 2003 went to Palestine,Djibouti, Jordan and Iraq (Table 3.7).
On the positive side, as Table 3.7 shows, over the period 1999 to 2003 the average aidper capita for Arab countries rose from $19.4 to $27.8. However, the average aid percapita received by the regions LDCs in 2003 was only $20.8 and with the exceptionof 2002, LDC countries have consistently received less than the region’s average in aidper capita. Yemen, in particular, experienced a sharp decline from $26.9 in 1999 to$12.7in 2003.
And although they constitute 22% of the total Arab population in 2003 the LDCsreceived only 16% of the total ODA ($8.3 billion). Aid is also allocated unevenlyamong the LDCs themselves: for example, in 2002, per capita Djibouti received tentimes more than Sudan and Mauritania five times more than Somalia (Figure 3.4).
27
Chapter Three: Growth, investment and ODA requirements for halving income poverty by 2015
16 And of falling oil sector Gross National Income, most of which takes the form of royalties and the Government’sshare of oil output. 17 Note that in poor countries increases in domestic public debt can have negative distributional implications,which have to be set against the benefits of increased domestic resource mobilization. For details see Roy (1994).

Table 3.8: Aid per capita and total aid, for the Arab Region, 1999-2003, $
1999 2000 2001 2002 2003
Aid per Total Aid per Total Aid per Total Aid per Total Aid per Total
Capita Aid Capita Aid Capita Aid Capita Aid Capita Aid
Algeria 4.6 138.1 6.6 201.1 7.3 223.6 10.5 328.6 7.3 232.4
Bahrain 6.1 4.0 73.3 49.1 26.1 17.9 101.1 70.6 52.7 37.5
Egypt, Arab Rep. 25.21,582.4 20.81,328.1 19.31,256.6 18.71,238.5 13.2 893.8
Iraq 3.3 75.9 4.3 100.8 5.2 122.4 4.8 115.8 91.72,265.2
Jordan 91.2 432.0 113.1 552.5 86.0 432.5 100.5 519.9 232.51,234.3
Kuwait 3.4 7.2 1.3 2.8 1.6 3.6 2.0 4.6 1.8 4.4
Lebanon 45.4 194.0 46.1 199.7 55.4 242.8 101.9 452.7 50.8 228.3
Libya 1.4 7.3 2.9 15.4 1.9 10.0 1.9 10.4 1.8 10.0
Morocco 24.0 678.8 14.6 419.4 17.8 518.6 16.4 487.0 17.4 522.8
Oman 17.0 39.9 18.9 45.6 0.7 1.6 16.1 40.8 17.1 44.5
Qatar 8.7 4.9 0.8 0.5 1.7 1.0 3.6 2.2 3.2 2.0
Saudi Arabia 1.4 28.9 1.5 30.9 1.3 27.0 1.2 26.9 1.0 21.9
Syrian Arab
Republic 14.5 228.5 9.8 158.5 9.4 155.3 4.8 81.0 9.2 160.3
Tunisia 26.7 252.7 23.3 222.7 39.0 377.7 27.1 264.9 30.9 305.5
United Arab
Emirates 1.4 4.2 1.2 4.0 0.9 3.0 1.1 4.2 1.3 5.3
Palestine 181.6 516.2 214.9 637.3 280.9 869.5 500.31,616.5 288.6 971.6
LDCS
Comoros 39.4 21.4 33.6 18.7 48.1 27.5 55.4 32.5 40.8 24.5
Djibouti 115.4 75.1 107.2 71.4 84.7 57.6 112.2 77.8 110.3 77.8
Mauritania 85.2 218.8 80.1 211.9 98.5 267.6 124.0 345.3 85.2 242.7
Yemen, Rep. 26.9 458.3 15.1 264.9 25.5 460.9 31.4 583.7 12.7 243.1
Somalia 13.6 114.6 11.9 103.9 16.6 149.7 20.8 193.7 18.2 175.1
Sudan 7.9 243.0 7.2 225.4 5.8 185.5 10.7 350.9 18.5 621.3
Total LDCs 18.8 1,131 14.5 896 18.2 1148 24.4 1,583 20.8 1,384
Total 19.4 5,326 17.3 4864 18.9 5411 23.4 6,848 27.8 8,324
Source World Bank Development Indicators (Development Assistance Committee of the Organisation
for Economic Co-operation and Development, and World Bank population estimates)
Another problem facing LDCs is the volatility of aid flows. This is particularly difficultfor in low-income countries where aid flows are large relative to government revenuesand budgets. Aid flows were supposed to become more stable and predictable followingthe introduction in 1999 of the Poverty Reduction Strategy Papers which were intend-ed to provide a framework for support based on national plans. As figure 3.5 shows, thosehopes have not been realized – and here too Yemen seems to have suffered most.
In addition, as UNDP’s Human Development Report (2005) notes, aid still comes with abewildering array of strings attached. Donors see country ownership as a requirement forefficient use of aid, but also use conditionality for leveraging policy change. In many casesthese objectives pull in opposite directions: with conditionality undermining country own-ership making flows even more unpredictable. This is the certainly the case for Yemen.
28
Chapter Three: Growth, investment and ODA requirements for halving income poverty by 2015

Figure 3.3: Major recipients of aid in the Arab Region (% of total aid tothe region), 1999 and 2003
Source World Bank Development Indicators, online database
Figure 3.4: Volatility of aid flows to LDCs (percentage change from previ-ous year)
Source World Bank Development Indicators, online database
Unfortunately, there seems no likelihood that these trends will be reversed. The richcountries may have adopted noble goals for human development at world summits andinternational conferences, but in fact in the 1990s their aid declined by one third. Itremains to be seen whether the adoption of the MDGs and the Monterrey Consensuswill make any difference. Early indications are not encouraging, as several donor coun-tries have seen their fiscal positions worsened since they made these promises. Also, aswe move closer to 2015, foreign aid will increasingly compete with the rising costs ofpublic health care and state pensions for the ageing populations in Europe, Japan andNorth America. Hence, the sooner we see a major increase in aid, the better it will befor both rich and poor countries – for keeping the promises in the former and forreaching the MDGs in the latter.
29
Chapter Three: Growth, investment and ODA requirements for halving income poverty by 2015
30%
1%
8%
13%
5%
10% 9%11%
27%
15%
6%7%
12%
3%
0%
5%
10%
15%
20%
25%
30%
35%
Egypt,ArabRep.
Iraq Jordan Morocco Sudan West BankBank and
Gaza
Yemen,Rep.
19992003
-1.5
-1.3
-1.1
-0.9
-0.7
-0.5
-0.3
-0.1
0.1
0.3
0.5
Djibouti Mauritania Yemen, Rep. Somalia Sudan Total LDCs
2000 2001 2002 2003

As ODA has fallen, made more people are expressing concerns about its effectiveness.Greater scrutiny regarding aid’s effectiveness is a welcome development and there have beensome improvements, include the untying of aid, directing it more to activities that are like-ly to benefit the poor, and pooling donor resources. And donors are now more willing tosimplify and harmonize their rules, procedures and policies so as to lower the transaction costfor the recipient country. Nonetheless, improvements in the area of ‘money changing hands’is no substitute for ‘ideas changing minds’. (Vandemoortele, 2003)
Many studies claim that aid is most effective when allocated to countries with ‘goodpolicies’. Collier & Dollar (1999), for instance, argue that a diversion of aid to coun-tries where the poverty problem is soluble, due to ‘good policies’, could lift 82 millionpeople out of poverty each year – as against 30 million with the present pattern of aidallocation. A document to the Development Committee of the World Bank and IMF(2003a) uses the concept of ‘good policies’ to identify 18 priority countries for addi-tional aid allocations. (Vandemoortele, 2003).
These conclusions are open to considerable question. Not only do they stretch the reli-ability of the data and are often based on faulty estimates, they also tend to mask theextent of judgment and subjectivity. The definition of ‘good policies’ is frequentlybased on the so-called CPIA index (Country Policy & Institutional Assessment), forwhich the study team assigns a value of, between 1 and 6, for 20 different aspects ofthe economy. A country that wants to be considered to have ‘good policies’ needs anaverage score of at least 3 (Vandemoortele, 2003).
But several of these dimensions cannot be quantified or assessed objectively. For exam-ple, values are given as to whether the country has a distortionary minimum wage,excessive labour market regulations or too many public sector workers. It also askswhether the state is able to protect ‘most of the citizens most of the time’. Calculatingthe CPIA index is, unsurprisingly, more an art than a science; the results of which arelikely to be influenced as much by beliefs and dogmas as by facts and figures. Usingdifferent methods, different indicators or different levels of aggregation, several otherstudies have concluded that aid is effective irrespective of whether the policies are‘good’ or not. A UNDP report on development effectiveness (2003) points out thatwhile a good policy environment is important for development results, no single pol-icy set can guarantee desired development outcomes and concludes: “aid seems toimprove social indicators regardless of the type of policy environment”.
The truth is that ‘good policies’ cannot readily be measured, and certainly not objec-tively and scientifically. As with beauty, they are in the eye of the beholder. On whatbasis would one argue, for instance, that Canada has better policies than Germany?Even if it were possible to rank countries objectively according to one policy, howcould one pretend to be able to do so at the aggregate level, stating that a country’spolicies are generally ‘better’ than those of another country? This daring endeavour ismeeting surprisingly little objection or raising any alarm. (Vandemoortele, 2003).
The concern about aid effectiveness – though welcome – has also in the 1990s led sev-eral donor countries to become less generous. Indeed, foreign-aid sceptics have eager-
30
Chapter Three: Growth, investment and ODA requirements for halving income poverty by 2015

ly used the research findings on ‘good policies’ as a justification for cutting ODA. Thisis unlikely to have helped any poor person, anywhere.
Many people have also expressed concern about ‘absorptive capacity’. This too is dif-ficult to pin down and can vary considerably according to circumstances. The cam-paigns against hunger in Brazil, for example, and in favour of universal primary edu-cation in Kenya clearly exemplify that even in the short-term capacities are not fixed.Inefficiencies and insufficiencies in public spending are interdependent – and absorp-tive capacity can be increased by increased investment. For example, when 98% of thebudget for primary education is needed to pay teacher salaries – a basic expense – thereis little scope for improving the quality without spending more. In such cases, extraresources will be a prerequisite for enhancing the efficiency of public spending, not theother way round. (Vandemoortele, 2003).
In short, scepticism is needed when assessing arguments about aid efficiency andabsorptive capacity, or the merits of liberalization, privatization or any pro-poor poli-cy reforms. They must always be interpreted with caution or may end up hurting thepoor rather than helping them.
In this regard, it is also important to consider the role of the richer Arab countries ofthe Gulf Cooperation Council (GCC) in offering aid to Yemen. For example, from2000 to 2003, GCC countries provided a total of $13.7 billion in development aid.Saudi Arabia, the largest donor, contributed 58% of the total. In 2003, Saudi Arabiaalone donated $2.8 billion (1.3% of GDP) of the total $3.1 billion contributed in thatyear. Kuwait and the UAE contributed $82 million and $130 million respectively.Hence, this report makes a plea to the GCC for doubling the ODA to Yemen overthe next decade. This pledge can be covered easily from the recent increase in oilprices. (AMDGR, 2006)
31
Chapter Three: Growth, investment and ODA requirements for halving income poverty by 2015

4.1 Macro-fiscal trendsThis chapter is divided into three sections. The first reviews Yemen’s macro-fiscalrecord and major institutional and strategic initiatives. The second reviews the fiscalchallenges, using the IMF’s scenarios as an initial basis for discussion. The final sectionundertakes a deeper analysis of the key fiscal challenges to Yemen’s development andoffers policy recommendations that will improve its long-term MDG-based invest-ment planning.
4.1.1 Overview
Yemen’s macro-fiscal development during the 1990s can be divided into three phases:(a) 1990-93 (b) the 1994 civil war and (c) 1995-2003 (with the exception of 1998,when a drop in oil production had an adverse impact on Yemen’s public finances).Table 4.1 presents data spanning the period from 1990 onwards.
The first phase of Yemen’s development was marked by a new administration’s effortsto take control of fiscal operations following the unification of the Yemen ArabRepublic and the People’s Democratic Republic of Yemen into the Republic ofYemen in May 199018. A combination of three factors plunged Yemen into a severepublic finance crisis:
■ During 1990-1991 a massive drought, the return of Yemeni workers to theircountry, and the drop in international aid as a result of Yemen’s support to Iraq;
■ The high cost of meeting unification commitments.
■ Structural weaknesses in the Yemeni economy – e.g., its low level of productiv-ity, its high population growth rate (averaging over 3%) and low level of domes-tic investment – which further undermined the country’s fiscal base.
Between 1990 and 1993, the total revenue-GDP ratio (including grants) fell from19.8% to 14.9% (Table 4.1). This decline concealed significant trends within the over-all revenue structure: while oil revenues decreased from 7.5% to 4.2% of GDP, tax rev-enues increased slightly, from 8.2% to 8.5%. Another contributing factor was the dropin grants, from 1.1% to 0.1% of GDP.
Despite these revenue losses, the GoY maintained its level of public expenditures,which, between 1990 and 1993, only declined slightly, from 32.3% to 29.5% of GDP.In fact, current expenditures rose: from 73% to 88% of the total. Although currentexpenditures and interest obligations remained stable at an average of 25.3% and 2.5%of GDP respectively, development expenditures plummeted from 8.7% to 3.5%.
33
Chapter Four
Expanding fiscal space
Chapter Four: Expanding fiscal space
18 IMF (2001) Page 8

Following the unification of the country, the share of wages in total expendituresincreased from 28.5% in 1990 to 36.3% in 1993. Also, defence spending, which was26% of total expenditure in 1990, rose to 28.1% in 1993.
As a result of these trends, Yemen’s fiscal deficit over this period increased from 12.5%to 14.6% of GDP. These statistics emphasize the government’s attempt to ease theeffects of shocks and structural weaknesses through preserving current expenditure lev-els despite declines in total revenues.
The outbreak of a civil war in 1994, however, represented a structural break forYemen’s fiscal stance. Between 1993 and 1994, total revenues decreased from 14.9%to 12.8% of GDP. This reflected a fall both in oil proceeds, which decreased from 4.2%to 3.7% of GDP, and tax revenues, which declined from 8.5% to 6.9%.
As a result, between 1993 and 1994 total expenditure decreased slightly from 29.5% to29% of GDP. Moreover, a higher proportion of this was current expenditure whichincreased from 88% to 91% of the total, while development expenditure correspond-ingly fell from 12% to 9%. The combination of reduced revenues and a constant levelof spending resulted in an increase in the budget deficit, which in 1994 reached 16.2%of GDP.
A new phase started in early 1995 when the GoY adopted a macroeconomic and struc-tural adjustment programme based on agreements with the World Bank and the IMF.This was called the Economic, Financial and Administrative Reform Programme(EFARP). In order to reduce aggregate demand and curb inflation the programme rec-ommended tight monetary and contractionary fiscal policies which were buttressed bythe liberalization of most interest rates and the adoption of a floating exchange rateregime.19
Total revenues depended significantly on oil revenues. Thus between 1995 and 2003they increased dramatically from 19.5% to 33.1% of GDP, as oil revenues increasedfrom 9.3% to 23.6% of GDP20 (Table 4.1). However, the collapse of oil prices in 1998led to a sizeable decline in oil revenues (from 21.4% to 14.8% of GDP) and total rev-enues (from 31.3% to 28.1% of GDP). This shock illustrates Yemen’s fiscal vulnerabil-ity to oil price volatility. Indeed, the correlation coefficient between oil revenues andtotal revenues has been 0.99. The low level of non-oil revenues represents a majorproblem for Yemen’s public finances.
There is also limited tax income. Although the end of the civil war had led to a recov-ery in tax collection which between 1994 and 1995 increased from 6.9% to 8.0% ofGDP, the average tax revenue remained low – between 1995 and 2003 reaching only7.8%, which was lower than the 8.7% average over the period 1990-93. Thus taxreforms of 1995 and 1996 clearly had a limited impact.
34
Chapter Four: Expanding fiscal space
19 IMF (2001). Page 52-5520 The reason for the decline in the oil revenue/GDP ratio from 25.3 percent to 23.6 percent between 2001 and2003 – which appears counter-intuitive in the context of higher oil prices – was not due to a decline in produc-tion (which remained stable) but to a faster increase in GDP than oil proceeds.

35
Chapter Four: Expanding fiscal space
Tab
le 4
.1:
Mac
ro-f
isca
l st
atis
tics
199
0-20
03 (
as a
per
centa
ge o
f G
DP,
unle
ss o
ther
wis
e st
ated
)
Item
1990
1991
1992
1993
1994
1995
1996
1997
1998
1999
2000
2001
2002
2003
1. T
ota
l re
venues
and g
rants
19.8
23.1
16.1
14.9
12.8
19.5
35.9
31.8
28.5
30.7
39.2
35.3
33.6
33.1
1.1.
Tota
l re
venue
18.7
22.0
15.8
14.7
12.6
19.2
35.6
31.3
28.1
29.8
37.9
35.0
32.0
32.6
1.1.
1. O
il a
nd g
as r
even
ue
7.5
9.4
4.7
4.2
3.7
9.3
25.1
21.4
14.8
19.1
24.4
25.3
22.3
23.6
1.1.
1.1.
Cru
de
oil e
xport
s4.
93.
71.
61.
53.
16.
514
.114
.79.
212
.215
.717
.215
.215
.5
1.1.
1.2.
Dom
estic
oil a
nd
gas
reve
nues
2.6
5.7
3.1
2.7
0.5
2.9
11.0
6.6
5.6
6.9
8.8
8.1
7.1
8.0
1.1.
2. N
on o
il r
even
ue
11.2
12.6
11.1
10.5
8.9
9.8
10.5
9.8
13.2
10.7
13.5
9.8
9.7
9.1
1.1.
2.1
Tax
rev
enue
8.2
9.2
8.8
8.5
6.9
8.0
8.4
7.9
9.9
7.7
7.2
7.1
7.5
7.1
1.1.
2.2.
Non t
ax r
even
ue
3.0
3.5
2.3
2.0
1.9
1.9
2.1
1.9
3.3
2.9
6.3
2.7
2.2
1.9
1.1.
3. G
rants
1.1
1.0
0.3
0.1
0.3
0.3
0.3
0.5
0.4
0.9
1.3
0.3
1.6
0.4
2. T
ota
l ex
pen
diture
32.3
30.1
28.9
29.5
29.0
25.6
39.8
33.7
35.3
30.9
31.2
32.8
34.8
38.2
2.1
Curr
ent
expen
diture
23.6
26.1
25.5
26.0
26.4
22.5
33.2
27.1
28.7
25.5
25.8
25.2
27.7
28.6
2.1.
1. C
ivil a
dm
inis
trat
ion w
ages
9.2
10.2
1010
.79.
77.
36.
86.
08.
17.
16.
46.
97.
77.
0
2.1.
2. D
efen
ce8.
48.
98.
98.
39.
76.
75.
65.
86.
65.
65.
05.
77.
47.
3
2.1.
3. M
ater
ials a
nd s
ervi
ces
1.9
2.0
2.4
1.7
1.8
1.5
2.3
2.8
3.2
3.0
2.2
2.5
2.6
2.5
2.2.
Inte
rest
obliga
tions
2.4
2.9
1.9
2.6
2.9
1.5
3.3
2.3
4.0
4.0
2.3
2.1
2.0
1.9
2.3.
Exp
lici
t su
bsi
die
s0
00
00
3.4
13.0
7.5
3.2
2.4
5.7
3.8
3.2
5.2
2.3.
1. P
etro
leum
subsi
die
s0
00
00
1.0
5.3
2.8
0.0
2.0
5.7
3.8
3.0
5.0
2.4.
Curr
ent
tran
sfer
s1.
72.
22.
42.
72.
31.
51.
61.
52.
42.
63.
03.
44.
03.
5
2.5.
Dev
elopm
ent
expen
diture
8.7
4.0
3.4
3.5
2.6
3.1
6.6
6.6
6.6
5.4
5.4
7.5
7.1
9.7
3. O
vera
ll fisc
al b
alan
ce-1
2.5
-7.0
-12.
8-1
4.6
-16.
2-6
.1-3
.9-1
.9-6
.8-0
.28.
02.
6-1
.2-5
.2
Sour
ce:
IMF
Stat
istic
s

The evolution of the tax structure led to a decline in customs revenues, which between1996 and 2003 decreased from 3.7% to 2.1% of GDP (Table 4.2). Non-tax revenuesincreased from 1.9% to a peak of 6.3 of GDP between 1994 and 2000, but subsequent-ly declined to 1.9% of GDP in 2003.
Table 4.2: Evolution of Yemen’s Revenue Composition 1994-2003 (% ofGDP)
Item 1994 1995 1996 1997 1998 1999 2000 2001 2002 2003
1. Total Revenue* 12.5 19.2 35.6 31.3 28.1 29.8 37.9 35.0 32.0 32.6
2. Oil Revenue 3.7 9.3 25.1 21.4 14.8 19.1 24.4 25.3 22.3 23.6
3. Non oil revenue 8.9 9.8 10.5 9.8 13.2 10.7 13.5 9.8 9.7 9.1
3.1. Tax revenue 6.9 8.0 8.4 7.9 9.9 7.7 7.2 7.1 7.5 7.1
3.1.1. Custom duties 2.5 3.4 3.7 2.9 3.0 2.3 1.9 2.1 2.1 2.1
3.1.2. Tax on goods and
services 1.5 2.0 2.2 2.4 3. 2.2 2.4 1.7 1.7 1.6
3.1.3. Taxes on income 1.3 1.1 1.2 1.2 1.6 1.5 1.4 2.9 2.0 1.8
3.1.4. Corporate profit tax 1.1 0.9 0.8 0.9 1.7 1.3 1.2 … 1.3 1.3
3.2 Non-tax revenue 1.9 1.9 2.1 1.9 3.3 2.9 6.3 2.7 2.2 1.9
IMF Statistics. Note: * excludes grants
On the expenditure side, the Economic, Financial and Administrative ReformProgramme (EFARP), implemented during the initial phase, 1995-98, served toreduce expenditure. And of this the proportion represented by current expendituresdeclined progressively between 1995 and 2003 from 87.9% to 74.7% (Table 4.3).
A significant proportion of public expenditure is wages in civil administration. TheGoY commenced civil service reform in 199821, which led to an initial increase in thewage bill. This was reflected in a rise in the share of wages from 17.7% percent to 23%of total expenditures between 1997 and 1999. But the wage bill was contained by highinflation22.
There were also changes in the patter of subsidies on wheat, flour and petroleum prod-ucts. Changes in the exchange rate regime led to the replacement of implicit subsidies– created by below-market foreign exchange rates – with explicit cash subsidies23.After reaching a peak of 13% of GDP in 1996 these expenditures gradually declinedbetween 1998 and 2003, following the introduction of explicit subsidies, to an aver-age of 3.8% of GDP. Wheat and flour subsidies were entirely eliminated in 199924,though those on petroleum subsidies were not substantially reduced until mid-2005.
Balancing the budget has depended primarily, however, on changes in oil prices. Thisis indicated in Table 4.1.In 1998, a collapse in prices saw the deficit rise to 6.8% ofGDP, while in 2000, swelling oil prices led to a fiscal surplus of 8%. Even so, after
36
Chapter Four: Expanding fiscal space
21 IMF (2001) Page 68-6922 IMF (2001) Page 6823 IMF (2001) Page 6224 IMF (2001) Page 64, Box 1

2002, Yemen’s fiscal balance turned negative despite rising oil revenues (Figure 4.1) –largely the result of a rise in government expenditures from 35% to 38% of GDP.
Although in order to maintain fiscal discipline the government needed to control therise in petroleum subsidies – from 3% to 5% of GDP between 2002 and 2003 – it didmanage to increase development expenditure from 7.1% to 9.7% of GDP.
Overall, judging by the evolution of Yemen’s fiscal stance between 1995 and 2003, theadjustment programme had a limited impact. Oil revenues continued to have a majoreffect on total revenues while tax reforms did not trigger a significant rise in non-oilrevenue.
4.1.2 Trends in government spending
Figure 4.1 provides a breakdown of government spending. It reveals that between1995 and 2003 a significant part was for military purposes. In 2003 military expendi-tures were equivalent to 75% of total current expenditures on civilian services. In fact,if military expenditures were excluded, government current expenditure on publicservices, which includes public administration, law enforcement, health, education andother government services, would fall well below 10% of GDP.
Figure 4.1: Composition of government spending, 1995-2003
Sources: IMF, IFS, May 2005, and IMF, 2004.
As a result, development expenditure is relatively low. The combined share of invest-ment and current expenditures on non-military services, which are the only compo-nents of government spending with direct developmental effects, was still less than 20%of GDP; indeed, throughout the post-reform period up to 2002 it was no more than15% (Table 4.3).
37
Chapter Four: Expanding fiscal space
0
5
10
15
20
25
30
35
40
45Actual Surplus
1995 1996 1997 1998 1999 2000 2001 2002 2003
% G
DP
Explicit subsidies Interest obligations Current transfers Fixed Investment
Defense (wage and nonwage) Materials and services Civilian wages and salaries

This is of extreme concern in a country with a very limited private sector and wherethe government has to play a critical developmental role. As shown in Figure 4.2,throughout the post-reform period (until 2003), ‘productive’ spending – currentspending on non-military public services plus fixed investment – has been below 50%of total government spending. This phenomenon has been due not only to relativelyhigh levels of military spending but also to the absorption of resources by other kindsof government spending.
38
Chapter Four: Expanding fiscal space

39
Chapter Four: Expanding fiscal space
Tab
le 4
.3:
Evo
lution o
f th
e sh
ares
of
reve
nue
item
s an
d e
xpen
diture
cat
egori
es (
%)
Item
1990
1991
1992
1993
1994
1995
1996
1997
1998
1999
2000
2001
2002
2003
1. T
ota
l re
venues
and g
rants
100%
100%
100%
100%
100%
100%
100%
100%
100%
100%
100%
100%
100%
100%
1.1.
Tota
l re
venue
94.4
%95
.2%
98.1
%98
.7%
98.4
%98
.5%
99.2
%98
.3%
98.5
%97
.1%
96.7
%99
.1%
95.2
%98
.8%
1.1.
1. O
il a
nd g
as r
even
ue
37.9
%40
.7%
29.2
%28
.2%
28.9
%47
.7%
69.9
%67
.4%
52.1
%62
.3%
62.3
%71
.5%
66.4
%71
.4%
1.1.
2. N
on o
il r
even
ue
56.6
%54
.5%
68.9
%70
.5%
69.5
%50
.3%
29.2
%30
.9%
46.4
%34
.8%
34.4
%27
.7%
28.8
%27
.4%
1.1.
2.1
Tax
rev
enue
41.4
%39
.8%
54.7
%57
.0%
53.9
%41
.0%
23.4
%24
.9%
34.9
%25
.3%
18.4
%20
.0%
22.3
%21
.6%
2. T
ota
l ex
pen
diture
100%
100%
100%
100%
100%
100%
100%
100%
100%
100%
100%
100%
100%
100%
2.1
Curr
ent
expen
diture
73.1
%86
.7%
88.2
%88
.1%
91.0
%87
.9%
83.4
%80
.5%
81.2
%82
.5%
82.8
%77
.0%
79.6
%74
.7%
2.1.
1. C
ivil a
dm
inis
trat
ion w
ages
28.5
%33
.9%
34.6
%36
.3%
33.4
%28
.5%
17.1
%17
.7%
23.0
%23
.0%
20.4
%21
.1%
22.1
%18
.4%
2.1.
2. D
efen
ce26
.0%
29.6
%30
.8%
28.1
%33
.4%
26.2
%14
.1%
17.3
%18
.7%
18.1
%15
.9%
17.3
%21
.2%
19.0
%
2.2.
Inte
rest
obliga
tions
7.4%
9.6%
6.6%
8.8%
10.0
%5.
9%8.
3%6.
8%11
.3%
12.8
%7.
4%6.
5%5.
7%4.
9%
2.3.
Exp
lici
t su
bsi
die
s0.
0%0.
0%0.
0%0.
0%0.
0%13
.3%
32.7
%22
.1%
9.2%
7.7%
18.4
%11
.5%
9.3%
13.7
%
2.4.
Curr
ent
tran
sfer
s5.
3%7.
3%8.
3%9.
2%7.
9%5.
9%4.
0%4.
6%6.
7%8.
3%9.
6%10
.5%
11.4
%9.
0%
2.5.
Dev
elopm
ent
expen
diture
26.9
%13
.3%
11.8
%11
.9%
9.0%
12.1
%16
.6%
19.5
%18
.8%
17.5
%17
.2%
23.0
%20
.4%
25.3
%

Figure 4.2: Government’s productive budgetary spending (% of totalspending, 1995-2003)
Notes: Productive spending is defined as the sum of government expenditure on non-military public
services plus fixed investment.
Explicit subsidies
In the years immediately after the start of the reform programme, there was a rapid risein explicit subsidies. This happened during a period of large increases in governmentrevenues as the official exchange rate was devalued and the government’s oil revenueswere valued at the market rate. By 1996, explicit subsidies had risen to 13% of GDP(Table 4.1), though they were rapidly reduced in the following three years when thegovernment removed food subsidies and substantially reduced energy subsidies.
By 1999, explicit subsidies had fallen to 2.4% of GDP. This constituted a substantialredistribution of income from the private sector to the government. In subsequentyears, however, the government was reluctant to adjust domestic prices to internation-al oil prices particularly for diesel, As a result, explicit subsidies started to increase andby 2003 had reached 5% of GDP.
Some might argue that this is beneficial because it puts resources into the hands of theprivate sector – which might make better use of them than the government which hasa poor record in using revenues to provide effective public services or invest in infra-structure. There are, however, flaws in this argument. One concerns the form thatexplicit subsidies have taken. Until recently they were, by and large, on oil derivatives,and particularly on diesel oil, which has led to unsustainable farming practices and inef-ficient use of water in agriculture, as well as other inefficiencies in the economy, suchas the use of diesel fuel for private electricity generation. Furthermore, with decliningoil revenues, the payment of such subsidies had become increasingly impractical.
The same funds could be used better for investment in the agricultural sector – name-ly, in improving the efficiency of water use in irrigation and in improving the produc-tivity of rain-fed agriculture. This would also help relax budget constraints, since theresulting productivity improvements could increase future tax revenue.
40
Chapter Four: Expanding fiscal space
30
40
50
60
1995 1996 1997 1998 1999 2000 2001 2002 2003

Current transfers
In the post-reform period current transfers have been steadily growing and have nowreached 3%-4% of GDP (Table 4.1). A growing proportion of these are to households,particularly to safety net programmes such as the social welfare fund, which was set upin 1997 to protect the poor from the adverse effects of the adjustment programme.
This fund has had a growing number of beneficiaries – from 39,000 people in 1997 to350,000 in 1999, and then to 650,000 in 2004. It provides cash assistance per familythat ranges from YR 1,000 per month for a one-member household to a maximum ofYR 2,000 for households with five or more members. Converting the value of thecash transfers to 1998 prices, a beneficiary could receive a transfer varying between amaximum value of YR 21 a day for a one-member household and YR 8 a day for afive-member household. Total disbursements by the social welfare fund have beenincreasing rapidly, and currently stand at over 1% of GDP. Nevertheless, given the1998 lower poverty line of YR 105 the payments are clearly inadequate.
A better use of 1% of GDP would have been to earmark it at the outset of the reformprogramme to a national campaign for reducing fertility rates, possibly combined witha national pension scheme as an incentive for young poor couples to keep their fertil-ity rates low. If this had brought down the population growth rates by one percentagepoint it could have had an enormous cumulative effect on reducing poverty andimproving the growth potential of the economy. Such a campaign in Iran, for exam-ple, brought down the population growth rate from 3.5% per year to below 2% in lessthan a decade. This is only one example of what could be achieved if social policy wereconceived as an integral part of a reform package oriented towards long-term develop-ment goals.
Interest payments
As shown in Figure 4.1, the government’s interest obligations rose rapidly during thefirst few years of the economic reform programme, reaching 4% of GDP in 1998 and1999. This was due mainly to the steep interest-rate increases on domestic loans intro-duced as part of the reform programme. In subsequent years, following the rapidreduction in the government’s indebtedness to the banking system, and the loweringof nominal interest rates by the central bank, domestic interest obligations declined.Nevertheless, by 2003 interest payments still constituted 1.8% of GDP.
The increase in interest rates was the centrepiece of the reform’s monetary and finan-cial policies. The assumption was that the government’s access to cheap credit from thebanking sector was crowding-out bank credits to the private sector. The aim was toallocate capital more efficiently by bringing interest charges closer to the opportunitycost of capital. Government indebtedness to the banking sector has indeed beenreduced. Since 2000, the government has utilized its growing oil revenues to build upa hefty credit position at the central bank, and has shifted its portfolio of domestic loansto treasury bills or loans from commercial banks at market rates of interest.
41
Chapter Four: Expanding fiscal space

4.1.3 Institutional and strategic initiatives: fiscal components
The Economic, Financial and Administrative Reform Programme
The Economic, Financial and Administrative Reform Programme (EFARP) waslaunched in 1995, with the support of the World Bank and the IMF, in order to stim-ulate economic growth and improve the standard of living of the population.25 Thisstrategy emphasized fiscal and monetary discipline and the need to reduce dependen-cy on the oil sector. In the design of EFARP, the government paid special heed to fourcentral challenges:
■ The potential adverse fiscal effects on vulnerable groups;■ The expansion of the role of the private sector in the areas of investment, pro-
duction and employment;■ Raising productivity; and■ Building capacity for implementing the programme.
Growth certainly increased following the reforms – from 4% to an average of 6.1%between 1995 and 2000. But this stemmed not from the reforms but from the oilbonanza. Similarly, the reduction of the budget deficit, from 16.2% to 6.1% between1994 and 1995 was due mainly to increases in oil revenues rather than enhanced taxrevenues or expenditure cutbacks. This analysis was confirmed by the sharp reversal ofthe positive trends when oil prices collapsed in 1998.
Strengthening Economic and Financial Management
The reform programme was complemented by a technical assistance project:Strengthening Economic and Financial Management (SEFM), supported by UNDP,UNCTAD, IMF and DFID. In its first phase this sought to improve the government’seconomic and financial management capacity through improvements in tax and cus-toms administration, budget management, bank accounting, and the prudential super-vision and production of national accounts statistics. The second phase, which startedin 1997, provided significant additional resources to strengthen and broaden the initialreforms. After a positive evaluation of the first two phases, a third stage started in 2002.However, the IMF gradually withdrew from this initiative and, without its technicalassistance, the project ended in 2004.
The Poverty Reduction Strategy Paper, 2003-05
The government started the preparation of the PRSP by developing the InterimPoverty Reduction Strategy Paper (I-PRSP). It used this document as a basis for dis-cussions, held at the governorates level during June-October 2000, of its StrategicVision 2025 and its framework for the Second Five Year Plan. By 2003 it was readyto implement the full PRSP – which stressed three major sets of problems:
42
Chapter Four: Expanding fiscal space
25 For a detailed exposition of the elements and the sequencing of reforms, see IMF (2001).

■ The limited nature and extent of economic growth■ High population growth and the poor development of human resources and
infrastructure■ Weak levels of social protection
The PRSP targeted a reduction of poverty by about 13 percentage points during theperiod 2003-05 so that the poverty incidence would fall to 36% in 2005. This objec-tive required 4.7% annual real GDP growth – including 5.7% growth for the non-oilsector. The strategy also set a number of sectoral objectives and mapped out four mainpillars for interventions:
■ Achieving economic growth■ Human resources development■ Improving infrastructure■ Ensuring social protection
The progress report on the Interim PRSP underlined that Yemen had been broadlyoff-track both in terms of macroeconomic management and poverty reduction. Itpointed out that non-oil growth was only 4.6% – lower than the 5.7% target — thatinflation was running at 14%, that the balance of payments surplus was only $336 mil-lion and that in 2003 current expenditures has surged by 20%. The PRSP estimatedthat local resources and current external assistance would not suffice to achieve theMillennium Development Goals by 2015.
The GoY has nevertheless repeatedly expressed its commitment to the MDGs and hasaligned its poverty reduction strategy with the goals in a single framework. In August2004, it initiated an MDG needs assessment that will be a major input into currentpreparations for the new Five Year Plan.
4.2 Yemen’s fiscal challenge: the IMF view
A convenient reference point for discussing Yemen’s fiscal challenges is the recentcountry report prepared under Article IV of the IMF’s Articles of Agreement. It assess-es Yemen’s macroeconomic outlook and presents two scenarios for the medium-termeconomic outlook until 2009:
1. A non-adjustment scenario that illustrates the unsustainable nature of Yemen’scurrent fiscal stance.
2. An adjustment scenario based on a series of fiscal measures aimed at raising taxrevenue, reducing expenditures and strengthening tax administration.
The main underlying assumptions of the macroeconomic forecast are:
■ Oil production declines at an annual rate of 5% and reserves are depleted overthe next 12 to 14 years
■ The debt-to-GDP ratio is maintained at 50% ■ Grants are limited to about 1% of GDP
43
Chapter Four: Expanding fiscal space

The IMF analysis concludes that “a cumulative adjustment of about 22.5% of GDP inthe non-oil primary budget deficit is needed by 2016 (when oil will be virtually deplet-ed) to bring Yemen closer to a sustainable long-term path”26. The main implicationsof these two forecasts through to 2009 are presented in Tables 4.4 and 4.5.
Table 4.4: Key macro-fiscal forecasts for 2006-2009 under a non-adjust-ment scenario (% of non oil GDP)
Item 2006 2007 2008 2009
Total non-oil revenue 13.8 14.2 14.1 14.5
Tax revenue 10.8 11.3 11.3 11.6
Non-tax revenue 3.0 2.9 2.8 2.8
Current expenditure 32.3 29.3 28.6 28.2
Development expenditure 10.8 10.3 9.9 9.7
Current surplus1 -5.0 -9.1 -11.6 -13.4
Overall deficit (per cent of Total GDP) -12.0 -16.0 -18.9 -21.9
Source: IMF, 2005
Table 4.5: Key macro-fiscal forecasts for 2006-2009 under an adjustmentscenario (% of GDP)
Item 2006 2007 2008 2009
Government revenue, excluding grants 26.5 23.9 22.1 21.2
Government expenditure, net lending 34.1 33.1 33.3 33.5
Current surplus -4.2 -7.3 -9.3 -10.6
Overall deficit -6.8 -8.4 -10.5 -11.6
Source: IMF, 2005
If the recommended adjustment package is implemented, the macro fiscal projectionfor 2009 is as follows:
■ Total revenue declines from 30% of GDP to 21% of GDP between 2005 and2009 – i.e. a loss of 9 percentage points of GDP
■ This decline is caused by the fall of oil revenues by 11.5 percentage points ofGDP
■ Non-oil revenues are projected to rise by 3% of GDP, as a consequence of theIMF recommended adjustment measures.
44
Chapter Four: Expanding fiscal space
26 IMF, 2005.” Republic of Yemen: 2004 Article IV Consultation – Staff report; Public Information Notice onthe Executive Board Discussion; and statement by the Executive Director for the Republic of Yemen”. Page 9,paragraph 13.

Source: IMF, 2005
Given the assumptions of the IMF adjustment scenario, the fiscal deficit would increasefrom 4.7% to 11.6% of GDP between 2005 and 2009.
4.3. A Review of fiscal challenges and recommendations
4.3.1 Revenue challenges
Our assessment of Yemen’s fiscal prospects is more optimistic than that provided bythe IMF although not markedly so. We are more optimistic about the prospects forexpanding fiscal space ( Box 4.2). We also project that Yemen should be able to mobi-lize at least 15% of GDP in non-oil revenue. This is consistent with the revenue pro-jections in Box 2.1 that improvements in tax policy and administration could garnerincreased revenue of 6%-9% of GDP. In 2003, the ratio of non-oil revenue to GDPwas 9% – a historically low level. In 1998 and 2000, this ratio reached about 13%. So,in historical perspective, assuming that Yemen can achieve a ratio of 15% is not unre-alistic.
Many poor countries rely on tariffs, excise taxes and seignorage in order to raise pub-lic revenue. Although Yemen has dramatically opened its economy, the governmentcould still modestly boost tariff revenue (by 1%-1.5% of GDP) through strengtheningcustoms administration, combating smuggling and reducing exemptions. Also, as theIMF has recommended, an excise tax on petroleum could raise 1.5%-2% of GDP inadditional revenue.
45
Chapter Four: Expanding fiscal space
Box 4.1: IMF recommendations for fiscal reforms in Yemen
In order to raise tax revenues – which represent about 10% of non-oil GDP – and move to a post-
oil economy within 15 years, the IMF recommends the following reforms for tax policy admin-
istration and public expenditure management:
Tax policy and administration
• Introducing a 10% General Sales Tax (GST) is supposed to generate between 3% and 5% of GDP
• Eliminating customs exemptions and fighting smuggling could potentially increase customs rev-
enue by at least 1%
• Applying an excise tax on petroleum – after the elimination of petroleum subsidy- of 5% by
2007 could generate 1.5% to 2% of GDP in additional revenue
• Strengthening the tax and customs administrations could provide about 0.5% to 1% of GDP over
the long term
Public expenditure management:
• Eliminating petroleum subsidies would save the budget 6% of GDP, which could be used to
mitigate the adverse effect of the removal on the poor, and to finance social spending

Box 4.2: How to create fiscal space
A country can mobilize resources in the following major ways:
■ By increasing tax and non-tax revenues. This source of revenue is the most preferable from the
government’s perspective, since it generates no future fiscal liabilities. However, taxation can
have a variety of macroeconomic and sectoral effects on the spending and investment decisions
of economic agents, which can have implications for equity, efficiency and growth.
■ By borrowing from the domestic private sector. This source of revenue is attractive since it represents
a transfer from the domestic private sector to the domestic public sector and so does not direct-
ly increase the country’s liabilities to the rest of the world. It could also increase the propensi-
ty to save to the extent that the borrowing reduces domestic consumption. It could however,
under some circumstances, crowd out private investment and have adverse distributional impli-
cations depending on the precise nature of the borrowing. It could also have inflationary con-
sequences if domestic absorption increases significantly before public investment generates
increased output. Finally, borrowing for government consumption usually has negative impli-
cations for growth since it can reduce national saving to the extent that the borrowing is
financed out of private saving.
■ By borrowing internationally. This type of borrowing results in an increase in international debt
and creates liabilities for the country. It represents a temporary increase in domestic resources
that can be amortized only if the payback from the investment of these resources results in an
increase in GDP greater than the net present value of the loan. The greater the degree of con-
cessionality in such borrowing (zero, in the limit when the international transfer is a full grant),
the lower the net present value of the debt.
The GoY also needs to address indirect taxation. Even though the economy grew overthe period 1995-2003 indirect taxes – on goods and services – fell from 2.0% to 1.6%of GDP. This is why a General Sales Tax (GST), or a similar broad-based consump-tion tax, now makes sense . A 10% GST could raise as much as 5% of GDP in newrevenue. But the government would need to consider the distributional consequencesof such a tax which could be regressive. It should also consider increasing the level oftaxation of qat.
Income tax offers more limited scope. With such a small formal sector, a realisticobjective would be to garner an additional 1% of GDP from taxes on personal incomeand corporate profit, though this would need to be accompanied by a strengthening oftax administration. Some people have advocated dramatically lowering top tax rates onpersonal or corporate income. The Government should decline these standard recom-mendations. Such efforts are frequently ineffectual in raising more total revenue andalso weaken the vertical equity of a tax system. In any case, as the formal economygrows, revenue from such direct taxes is bound to rise. Instead greater vertical equityas well as more revenue could be gained through such measures as a land tax on largefarm holdings, which are more common nowadays, and a tax on urban real estate. Thiswould give the tax system a slightly more progressive structure.
Since much economic activity for many poor countries occurs in the ‘informal’ sectoran important source of revenue is often an inflation tax. For such countries, 10-15%of their revenue comes from ‘seignorage’ which is the difference between the face
46
Chapter Four: Expanding fiscal space

value of money and the cost of manufacturing. Governments can thus get more rev-enue by printing more money, though at the cost of inflation it.27 Trying to squeezeinflation out of such countries has a cost in terms of lost revenue. Drastically reducingthe inflation tax and dramatically lowering tariffs (another important source of revenue)would drive down the revenue of these countries without providing alternativessources that could adequately compensate for the loss. Tariffs account for 18% ofYemen’s revenue, for example. Partly because of small formal sectors, low-incomecountries can make up for only 30% of the revenue lost from trade liberalization.28
All of the above measures should be part of a coherent Tax Policy Master Plan, whichhas the long-term objective of substantially raising non-oil revenue, and doing so in anequitable way.
Yemen also has another important potential source of revenue: their foreign-exchangereserve which currently averages 14-15 months-worth of imports. The standard rec-ommendation is to hold, for precautionary purposes, an amount worth six months ofimports – or an amount equal to total short-term external debt. By holding muchhigher reserves, Yemenis paying a high opportunity cost since at least half of thisamount could be devoted to financing domestic investment. It is also paying an addi-tional cost when it has to sterilize the monetary impact of its reserves by selling gov-ernment securities at an interest rate that is higher than it receives from the reservesthemselves. Further, it runs a risk of incurring losses from exchange-rate movements,such as depreciation of the US dollar.
Instead the government could deposit six-months-worth of these reserves in an invest-ment fund devoted to expanding badly needed economic and social infrastructure.This would be an additional means of expanding fiscal space.
Like the IMF, we also project a decline in oil revenue. However, the dynamics ofglobal oil supply and demand have changed since the IMF made its calculations. Therise in oil prices should buoy Yemen’s prospects for maintaining moderate levels of oilrevenue through 2010 and beyond. If we assume conservatively that oil revenue canbe maintained at 5% of GDP, then the underlying revenue base should be at least 20%of GDP. If oil prices continue to rise and the government is more assertive in mobi-lizing non-oil revenue, the revenue base could reach 25% of GDP.
4.3.2 Reducing expenditures
Even such optimistic projections do not imply that the government will be able toavoid fiscal deficits – whose size will depend on its ability to cut non-essential expen-ditures. In 2003, the fiscal deficit stood at 5.2% of GDP and is projected to be about5% in 2005.
47
Chapter Four: Expanding fiscal space
27 Roger Gordon and Wei Li. 2005. “Tax Structures in Developing Countries: Many Puzzles and a PossibleExplanation”. March. Draft research paper, University of California-San Diego.28 Thomas Baunsgaard and Michael Keen. 2004. “Tax Revenue and (Or?) Trade Liberalization.” Fiscal AffairsDepartment, International Monetary Fund, September 20 Draft.

In 2003, current expenditures were about 28% of GDP and capital expenditures wereanother 10%. Current expenditures have to be reduced by at least 10 percentagepoints. Five to six percentage points can be achieved through eliminating petroleumsubsidies. In this regard, the government has already taken a big step in 2005 by rais-ing energy prices – increasing gasoline prices by 90% and more than doubling dieselprices. The best option is to earmark the resultant funds for investment in agriculturewhich would not only be more equitable but also more productive. This would effec-tively compensate any short-run effect on people’s welfare and generate=future taxrevenues.
Another three percentage points of GDP could be achieved through lowering militaryexpenditures from7% to 4% of GDP. Lowering transfers, by having a better focusedsocial welfare fund, and lowering debt repayment, by reducing interest rates, could alsooffer about two percentage points.
Fortunately, development expenditures have been on the rise: between 1995 and 2003they increased from 12% to over 25% of total expenditure – or almost 10% of GDP.This trend should be reinforced, not only because it will stimulate more growth butalso because such growth will generate more public revenue. Capital expendituresshould be maintained at 10% of GDP. This level should be regarded as a bellwetherfor Yemen’s ability to lay the foundations for sustainable economic growth and devel-opment.
How can more funds be directed to essential public investment? Any increases indomestic revenue beyond 20% of GDP should be prioritized for public investment.Other funds could be reallocated – for example, from the Social Welfare Fund tosmall-scale community infrastructure.
But there would also need to be an increase in official development assistance. In 2003ODA was only 3.5% of GDP. This amounted to only $12.7 per person – the lowestlevel among the Least Developed Countries in the Arab Region. Djibouti, for exam-ple, received $110 per person in ODA. In fact, doubling ODA would only bring theper capita level back to that in 1999, $26.9.
ODA would be needed to cover deficits that could approach 8% of GDP. DoublingODA could contain deficits at under 5% of GDP. This assumes that current expendi-tures can be contained at about 18% and capital expenditures will be maintained atabout 10%. Thus, ODA will be mobilized primarily to finance public investment.
48
Chapter Four: Expanding fiscal space

Source: Al Asaly (2005)
4.4 Concluding Remarks
The current boon of increased oil revenues in Yemen needs to be harnessed to financeextensive public investment and build a financial system to adequately fund privateinvestment. This will help accumulate permanent productive wealth to compensate forany future decline in oil production.
Such productive wealth will generate increased and sustainable flows of income, whichcan provide a level of tax revenue that can eventually replace depleted oil revenue. TheGoY is currently able to mobilize relatively low non-oil revenues. But it has to planfor long-term development based on predictable flows of ‘permanent income’ –income that can be utilized without reducing the country’s net wealth.
This strategy will nevertheless be sustainable only if it increases Yemen’s productivebase and raises domestic resource mobilization to cover recurrent expenditures. Officialdevelopment assistance can play a useful role in compensating for the decline of oil rev-enues and thereby making the flow of government revenue more predictable. SuchODA support could help reduce the need to hold large pools of investible resources ina surplus oil fund and pile up a large stock of foreign exchange reserves. In the longterm, ODA-financed scaling-up of development resources to achieve the MDGs willbe sustainable only if it enhances the size and structure of Yemen’s productive base soas to foster higher domestic resource mobilization. The key variable in this context isthe ratio of gross national savings to GDP. Reforms in the financial system, which are
49
Chapter Four: Expanding fiscal space
Box 4.3: Some features of the budgeting process in Yemen
The process begins with a discussion between line ministries and officials of budget department
on proposed budget by the former. The discussion is essentially a bargaining process since the pro-
posed budgets rarely contain any detailed information on the nature of spending programmes.
Thus, the budgeting process is likely to suffer from allocative inefficiency. The absence of detailed
information on planned expenditures and the lack of transparency make it very difficult to set up
the appropriate public objectives as the exercise becomes driven, primarily, by political rather than
social or economic rationales. This constitutes a serious distortion in the allocation of public funds.
Once the Budget Department has prepared a draft of the proposed budget, this draft is sent to the
High Economic Committee, which often approves it. This approved draft is forwarded to the
Council of Ministers, which also approves it once it ensures that the proposed budget does not
exceed a ceiling agreed with the representatives of the International Monetary Fund. For that rea-
son, the MoF negotiates with the team of IMF while it is preparing the draft of proposed budg-
ets.
Other features that characterize the budgeting process are:
• Deficits are financed by reducing capital expenditure. However, the opposite is not true. That
means that in the case of surplus, the capital expenditure will not increase.
• Many ministries and public units prefer to finance some of their activities through extra budg-
etary mechanisms so as to have direct control of these funds.

covered in Chapter 5 of this report, are thus absolutely critical to augmenting domes-tic savings, as well as boosting private investment.
This chapter takes a cautiously optimistic view of the prospects for Yemen’s develop-ment. While it shares the conventional assumptions about the depletion of Yemen’s oilreserves, it proposes feasible options not only to raise more non-oil revenue but alsoto reduce non-essential public expenditures, so that government deficits are maintainedwithin manageable levels. If ODA were to double, then a significant proportion ofsuch deficits could be used to finance essential public investment in economic andsocial infrastructure and build up a viable, resource-mobilizing domestic financial sys-tem. Reducing subsidies has thus far allowed the fiscal authority to meet increases inpublic expenditure without running a deficit. However, there is not much room toreduce subsidies further since the government has abolished most of them. Therefore,in the absence of ODA any future increase in public expenditure means a higherdeficit. But there is also need for implementing a wide range of other measures toincrease the transparency of the budgetary process, such as:
■ Ensuring the compatibility between budget goals and the medium-term eco-nomic framework.
■ Reviewing budget goals with employment generation and pro-poor growth pri-marily in mind.
■ Opening channels for discussing medium-term economic and budget goals withdifferent social and interest groups.
■ Developing more objective criteria for public expenditure allocation■ Implementing effective methods to collect and analyse data■ Designing appropriate criteria for evaluation■ Delegating budget implementation to the line ministries.■ Enforcing budget monitoring.
Taken together with the analysis of the trends in Domestic Resources forDevelopment and Investment in Chapter 2 and the resource gap in Chapter 3, theimpact of declining savings for financing public investment and fostering human devel-opment represents a major challenge for enhancing fiscal space.
The next chapter of this report addresses this issue when it examines financial sectorreforms. Without major revamping of its financial system, Yemen will not be able tomobilize adequate domestic savings in order to finance productive investment,whether public or private. A well functioning and transparent financial system is alsoessential for mobilizing public revenue since collecting taxes often relies on the banks’record keeping systems to verify income.
Finally, although not part of the discussion in this Chapter, it is important not to over-look the role of traditional financing arrangements. As noted by Van de Walle(2002),29 64% of total transfers to the poorest 40% of the population are accounted forby these traditional arrangements – including transfers from relatives abroad and Zakat.
50
Chapter Four: Expanding fiscal space
29 Van de Walle, D., (2002), “Poverty and Transfers in Yemen”; Working Paper no. 30, MENA Region, WorldBank.

This raises a number of issues. Should there be a major overhaul to modernize andinstitutionalized the social safety net system? What are the budget implications of suchreforms? How would this affect the government’s fiscal operations?
Another important result in Van de Walle’s study is that “these transfers are rather welltargeted. The poorest households (first decile) received 42% of total transfers in 1998.Furthermore, transfers account for 38% of total expenditures of those in the poorestdecile; this rises to 56% for those in urban areas and drops slightly to 35% for those inrural areas.”30 For the richest decile, transfers account for 2.2% of total expenditure atthe national level – 2.7% for urban and 1.6% for rural areas. These are attractive, pro-gressive features of the current transfers system. One issue for decision makers is there-fore how to integrate these positive features into the formal public finance and socialsafety net systems.
51
Chapter Four: Expanding fiscal space
30 See World Bank, (2003), Yemen Economic Update; Spring Issue, www.worldbank.org.

5.1 Structure of the financial Sector
The formal financial sector of Yemen is composed of 11 commercial banks, two spe-cialized state-owned development banks and four Islamic banks. Among the commer-cial banks, five are private and domestically owned (of which two have foreign sharesof 22% and 25%), four are fully foreign owned and two are state owned, one fully andone partially. The largest bank, accounting for more than 20% of commercial bankassets, is the Yemen Bank for Reconstruction and Development in which the govern-ment has a 51% share holding. It has 37 branches, mainly in the northern part of thecountry. The other state-controlled bank, in this case fully government owned is theNational Bank of Yemen which accounts for about 13% of commercial banks assetsand operates mainly in the south, with 31 branches. The two state-controlled bankshold about one-third of the commercial banks’ assets and their geographical presencestill bears the legacy of the past.
The four private foreign owned banks are mainly branches of banks with headquartersin France, Pakistan, Jordan or Iraq, though the branch of the Iraqi bank has ceasedoperations since the second Gulf war. The branches of these banks are limited to thecapital city, Sana’a and three other big cities, Taiz, Hodeidah and Aden.
The four Islamic Banks came into existence after 1995, and are joint ventures withIslamic foreign banks in Qatar, UAE and Jordan. Most have branches in the maincities. The largest is Tadamon, with a paid-in capital of YR 2,250 million and 13branches.
The two state-owned specialized banks are the Housing Credit Bank and theCooperative Agricultural Credit Bank. The Cooperative Agricultural Credit Bank has34 branches and the Housing Credit Bank has only 2 branches. They have no branch-es outside Sana’a. There was one other specialized bank – the Industrial DevelopmentBank of Yemen – but this was burdened by a large portfolio of non-performing loans,and was later liquidated.
Following the unification of the financial and banking systems of the north and southin 1994, the banking sector grew significantly. Between 1994 and 2003 the total assetsof commercial banks rose from YR70.7 billion (about 23% of GDP) to YR563 billion(about 27% of GDP). However, the commercial banks only have about one quarterof’ assets as credit to the private sector; the rest of their investment is in the form offoreign assets (28%), Treasury Bills, repurchase operations and certificates of deposit(27%) and deposits with the central bank (15%) (CBY, Annual Report, 2003, p. 44).
The banking sector is subject to very limited competition. Almost 70% of both depositsand loans are with the top four banks (IMF, 2001, p. 82). And in the retail market onlythe Tadamon Islamic Bank is in a position to offer some competition to the two state-owned banks. The foreign banks cater mainly to the corporate sector and operate onlyin the main cities. 53
Chapter FiveFinancial-sector development, growth and poverty reduction
Chapter Five: Financial-sector development, growth and poverty reduction

Overall the banking system is weak, as reflected in the very high proportion of non-performing loans – about 19% of the total in 2003 – significant provisioning shortfallsand low capitalization, with a ‘Cooke ratio’31 of 5.2% (IMF, 2001, p. 82).
Outside the formal banking sector, there are 170 registered moneychangers. Theyoperate all over the country but since they are not part of the banking system, theirbalance sheets are not included in the monetary survey. They do have to register withthe Central Bank of Yemen (CBY), although some of them operate outside CBY con-trol especially in small cities.
Yemenis working in various Gulf States predominantly use moneychangers for theirremittance transfers. The CBY also uses them when it wants to intervene in the for-eign exchange market.
Beyond the formal system there is a large informal financial sector. Many unregisteredmoneychangers have significant amounts of capital and are engaged in informal deposittaking and in short-term lending, primarily to finance consumption. They offer short-term credits to farmers, for example, during the off season for repayment when cropshave been sold. Shop owners too often provide credit to low-paid employees to tidethem over until salaries are paid at the end of the month. These short-term consump-tion loans usually attract very high interest rates – up to 15 percentage points above thecommercial banks’ lending rates (IMF, 2001, p. 54).
5.2 Financial sector reforms
In 1995 Yemen embarked on financial sector reforms. It has not, however, aimed at acompletely laissez-faire financial sector but rather at minimizing economic regulationsand strengthening prudential regulations.
In an effort to minimize economic regulations, for example, all concessional loan rateshave been abolished and commercial banks are allowed to charge their own lendingrates. The specialised banks, too, are allowed to charge market-interest rates. At thesame time, the Agricultural Credit Bank is now allowed to take current deposits.However, the CBY retained some controls on deposit rates and established minimumbenchmark commercial bank savings deposit rates. These were at high levels with aview to attracting new deposits, and although they were later adjusted downwards withthe decline of inflation, the real deposit rates remained positive. This interest ratereform may have contributed to the significant rise in the non-government sectordeposits with the commercial banks from YR28,255.5 million in 1990 toYR474,351.3 million by the end of 2003 – a nearly 17 fold increase in 12 years. A fur-ther sign of banking sector development is the decline in the ratio of currency in cir-culation to Rial broad money from 60% in 2000 to 51% by the end of 2003.
54
Chapter Five: Financial-sector development, growth and poverty reduction
31 Cooke ratio is the ratio between a bank’s capital and its risk-weighted assets which includes both the on-bal-ance-sheet and specific off-balance-sheet items. Capital, as defined by the Cooke ratio, is broader than equity cap-ital. It includes core capital, supplementary capital (hybrid capital instrument such as perpetual preferred shares)and short-term subordinated debt with an original maturity of at least two years. According to the BIS standard,banks are required to maintain a capital amount equal to at least 8% of their total risk-weighted assets.

With a view to improving allocative performance, the reform measures addressed theproblem of the concentration of credit to a small number of companies and groups ofcompanies and the high prevalence of overdraft facilities. A circular was issued limit-ing total credit to such entities to 15% (and under certain circumstances to 25%) of abank’s total paid in capital and reserves. In addition, if the CBY determines that theinterests of two or more groups of persons (or companies) are so intermingled that theyshould be regarded as a single entity then their liabilities should be combined into one.Almost 90% of the private sector credits are used for overdraft facilities. To fix theseproblems, CBY limited the total loans to any single company: these should not exceed15% of a bank’s total paid-in capital and reserves. The CBY can also, if necessary,change the interest rate on overdrafts. Because overdraft facilities also raise the risks theCBY introduced a new category of classification of exposures, called ‘special attention’.
In order to protect the integrity of the banking sector, the reform measures alsoaddressed the issue of insider lending. The CBY issued a circular that prevents lendingto any insider except the following: (a) a member of the board of directors who is notinvolved in management, and for an aggregate amount that does not exceed one-halfof 1% of the bank’s total paid-in capital and reserves; (b) a shareholder owning 5% ormore of the common stock or voting power, and for an aggregate amount less than15% of the bank’s total paid-in capital and reserves, (c) a senior employee for anyamount that exceed that person’s total annual wage and salary.
Further protective measures were introduced with regard to risk management. During1996-97, the CBY issued a number of circulars dealing with risk management, loanclassification and provisioning, foreign exchange exposure and external auditing. Fromearly 1996, banks were required to report foreign currency positions. By the end of1997, the minimum capital requirement was doubled to YR500 million which wasthen raised to YR1 billion in 1999. The commercial banks are required to maintain aminimum capital adequacy ratio of 25% of total amounts. Provisioning requirementsfor classified loans were set as follows: 15% for substandard loans (90 days past due),45% for doubtful loans (180 days past due) and 100% for bad loans (more than 365 dayspast due). The CBY also introduced a notification system under which banks are noti-fied on whether loan applicants are delinquent to other banks.
As part of prudential regulations, in 1995, the CBY required all commercial banks tohave reserves of 10% of time deposits, with a maturity of 9 months or more, and 40%of more liquid assets at CBY. The CBY issued a directive to specify the requirementsof documentation and reporting to improve commercial bank transparency. All com-mercial banks are required to hire an independent accountant for bank auditing. Thenew banking law of 1998 contained licensing standards similar to the Basle CorePrinciples. The law also stipulates severe punishment for those banks which do not ful-fil the new requirements.
The main theme of financial reform was thus prudential regulations aimed at strength-ening the supervision of commercial and specialized banks by the CBY. To performits supervisory role the CBY was given more independence and it has launched anambitious staff training programme.
55
Chapter Five: Financial-sector development, growth and poverty reduction

With a view to revitalizing the banking sector and improving financial intermediation,the CBY collected all the bad debts of public enterprises to the commercial banks. Thebad loans of the Cooperative and Agricultural Credit bank stand at YR4 billion. Thetotal bad loans of the Yemen Bank for Reconstruction and Development (YBRD) wereYR11 billion, and that of the National Bank of Yemen (NBY) was YR7 billion. Thegovernment recapitalized the YBRD and NBY for their bad loans. In order to relievethe commercial banks from the burden of loss-making public enterprises, the CBY alsoasked all public enterprises to move their accounts from commercial banks to the CBY.The government and CBY also plan to privatize two state-owned commercial banks,starting with the National Bank of Yemen, but the process has yet to start.
The CBY also called in the commercial banks to discuss their losses and they agreedto create reserve funds with a maximum of 8% of their total capital to meet bad loans.
Nevertheless implementation and enforcement of many of the reforms has been weak.A World Bank assessment of compliance with the Basle Core Principles methodolo-gy, for example, revealed that banks were either compliant or largely compliant withonly 10 of 24 principles (IMF, 2001, p. 82). Most banks are still undercapitalized andtheir capital has yet to reach the YR 1 billion required by the law. Nor are banksobserving the requirement of a loan ratio of 15% of capital and reserves.
Supervision is compromised, since the auditing practices are still inadequate the report-ing of commercial banks to the CBY is incomplete or sporadic. And there is still wide-spread insider lending. According to the recent World Bank report (World Bank,2002), most Yemeni banks are owned by a few large businesses who are not only oftenthe main borrowers from their respective banks but directly involved in their opera-tions. They are also largely responsible for the high level of non-performing loans.
The World Bank report summarises the problems of the banking sector as follows:“Weakness in the legal and judicial framework, lack of proper accounting and audit-ing standards and disclosure practices, and a scarcity of banking and financial skillsremain significant impediments. In particular, there is a pressing need to improve thefunctioning of commercial courts and the judicial processes for recovery of bank andother debts.” (World Bank, 2002, p. 69).
To some extent, these weaknesses may be the result the financial sector reform meas-ures, especially interest rate liberalization. High deposit rates aimed at attractingdeposits forced the banks to raise their lending rates. This reduced the scope for prof-itable investment, and invites risky investors. In the absence of a sound judicial system,the banks can minimize the problem of adverse selection by resorting to relationship-based lending which in this case means insider lending. Ironically, insider lending is themain cause of a high prevalence of non-performing loans with which the banking sec-tor has been saddled.
5.3 Financial intermediation and poverty reductionFinancial sector reform should have positive effects on savings, financial deepening andthe efficiency of financial intermediation. Contrary expectations, however, it seems
56
Chapter Five: Financial-sector development, growth and poverty reduction

that the high bench-mark deposit rates and real positive interest rates have failed toincrease private savings – an experience common in many other countries. In factbetween 1998 and 2003 the private savings rate as a proportion of national disposableincome declined from 27% to 13%. This may be because tight monetary policy aimedat keeping down inflation may have hardened the liquidity constraint – forcing peopleto reduce savings to meet their consumption needs (IMF, 2001, p. 129). When ratesrise in the official market, they also rise in the informal market where most poor bor-row.
Financial sector liberalization was expected to bring other benefits but these have yetto be fulfilled. It has not, for example, boosted the intermediation role of the financialsector which is still very shallow. Yemen’s ratio of M2 to GDP, which is an indicatorof financial deepening is the lowest in the Arab countries. Most people still use cash asthe medium of exchange, as reflected by a low ratio of M1 to currency in circulation.These indicators have not increased since the launching of financial reforms; indeedsince 1995 the ratio of M2 to GDP has declined (Figure 5.1).
In line with a very shallow financial sector, the money multiplier – the ratio of broadmoney to reserve money – is also very low, less than half that in Jordan, for example,a country of comparable size (Figure 5.2). Between 1990 and 2000 the money multi-plier did increase somewhat, indicating a slight improvement in the efficiency of thebanking system, but since then progress seems to have stalled and the ratio betweenbroad and reserve money has remain around 2. In addition, in 2003 the domesticmoney multiplier – the ratio between Rial money and Rial component of reserves –was only 1.2.
The inadequacy of financial intermediation is also reflected in the low ratio of private-sector credit to GDP which is lower in the Yemen than in any other Arab country.(Figure 5.3). Yemeni commercial banks find it more profitable to keep their assetsabroad rather than lend to the private sector. In 2003, they kept 28% of their assets asdeposits with banks abroad compared to 24% in the form of advances to the privatesector.
57
Chapter Five: Financial-sector development, growth and poverty reduction

Figure 5.1: Ratio of money supply (M2) to GDP (%), 1990-2003
Source: IFS, IMF, April 2005.
Figure 5.2: Ratio of broad money to reserve money (%), 1990-2003
Source: IFS, IMF, April 2005.
This is partly because they receive a high proportion of their deposits as dollars – 50%in 2003 (CBY, Annual Report 2003, p. 47)32. In the absence of demand for credits indollar terms for domestic activities, one way the commercial banks can afford to payinterest on dollar deposits is by investing abroad, which means capital flight.
A further sign of inefficiency in financial intermediation is the low ratio of loans todeposits in Yemeni Rial – at the end of 2003 only 31%, the lowest of comparable Arabcountries (Figure 5.4). Indeed, between in the early 1990s and the end of 2001 thisratio declined, from 60% to 37%. However, we should also note that between 1994and 2003 credit to the private sector, as a proportion of non-oil GDP, increased fromaround 5.4% to close to 10%. And in real terms, when deflated by the non-oil GDPdeflator, between 1994 and 2003 private-sector credit grew by around 12%.
58
Chapter Five: Financial-sector development, growth and poverty reduction
0
50
100
150
Per
cent
Yemen Egypt Saudi ArabiaJordanOman
1990 1991 1992 1993 1994 1995 1996 1997 1998 1999 2000 2001 2002 2003
0
100
200
300
400
500
600
Per
cent
Yemen Egypt Saudi ArabiaJordanOman
1990 1991 1992 1993 1994 1995 1996 1997 1998 1999 2000 2001 2002 2003
32 CBY Annual Report, 2003 also puts this figure at 51.2% (p. 6).

Figure 5.3: Credit to the private sector, % of GDP, 1990-2003
Source: IFS, IMF, April 2005.
Figure 5.4: Claims on the private sector, % of deposits, 1990-2003
Source: IFS, IMF, April 2005.
These macro-level indicators are consistent with the findings of a 2001 World Banksurvey of the private sector. This found, for example, that 53% of firms did not havea bank account. This survey also examined where firms got their short-term andinvestment financing: less than 3% came from commercial bank credit while 73% camefrom resources from within the firms; the rest was from suppliers, around 19%, andfamily and friends, around 5%. One-third of respondents identified lack of access tocredit as one of the obstacles for their business. Micro, small and medium enterprises(MSMEs) are particularly affected by the lack of access to credit. In a survey by theILO), MSMEs ranked access to credit fourth among the top ten problems (ILO, 2002).It is difficult to assess however how access to institutional credit has been affected bythe closure of the Yemen Industrial Bank.
59
Chapter Five: Financial-sector development, growth and poverty reduction
0
20
40
60
80
100
1990 1991 1992 1993 1994 1995 1996 1997 1998 1999 2000 2001 2002 2003
Per
cen
t
Yemen Egypt Saudi ArabiaJordanOman
0
20
40
60
80
100
120
140
160
180
1990 1991 1992 1993 1994 1995 1996 1997 1998 1999 2000 2001 2002 2003
Per
cen
t
Yemen Egypt Saudi ArabiaJordanOman

The situation described above largely refers private and mainly urban-based activities,but is similar in the rural sector. Farmers are very unlikely to borrow from the formalsector whose loans represent less than 1% of agricultural output – far lower than in sim-ilar countries (World Bank, 1993) and round 80% of farmers have no outstandingloans. According to one World Bank study the main informal sources of credit in ruralareas were:
■ Input suppliers/traders: 27%■ Other farmers: 13%■ Friends and relatives: 60%
Interest rates in the informal sector are up to 200% per annum – and loan from friendsand family would have become very difficult following the first Gulf War since theseoften rely on remittances from Yemenis working abroad.
At Yemen’s current level of development one might expect most long-term finance tocome from the banking sector. But it is clear that currently it contributes relatively lit-tle to the growth of the economy or to poverty reduction. Instead the banks concen-trate on trade finance or on short-term lending, which in 2003 accounted for about 37%of total loans; only 4% of their lending was for medium or long-term loans.
Nor do the commercial banks have much to do with poverty reduction; they have fewoperations in the rural areas where around 80% of the poor live. Their neglect of therural and agricultural sectors is clear from the distribution of their credits (Table 5.1).Between 2000 and 2003 the proportion of their lending going to agriculture declinedfrom 3% to around 0.6%, while over the same period the proportion going to tradefinance increased by 7 percentage points and to the construction sector by 3 percentagepoints.
Unfortunately the decline in commercial bank credit to the agricultural sector has notbeen offset by the specialized institution, the Cooperative Agricultural Credit Bank(CACB). Between 1998 and 2003 its loans increased only from YR3,384 million toYR4,430 million. At the same time CACB invested YR6,160 million in treasury billsand bank deposits – funds that it could have used to finance agricultural activities.However, one can understand why the CACB to lend to the private sector; it is onthe verge of bankruptcy and has around YR4 billions-worth of bad loans which thegovernment have refused to buy.
Table 5.1: Sectoral share of commercial bank loans (%)
Agriculture Industry Construction Trade
1999 0.59 15.11 5.02 43.02
2000 2.87 17.16 4.80 40.87
2001 2.84 16.18 3.80 44.97
2002 1.35 20.72 6.82 48.04
2003 0.64 19.28 7.99 47.71
Source: CBY, Annual Report (various issues)
Note: Excludes classified loans and advances which account for around 22%.
If classified loans are included in the total, the share of agriculture drops to 1% in 2002 to 0.5% in 2003.60
Chapter Five: Financial-sector development, growth and poverty reduction

5.4 Conclusions and policy recommendations
Privatization and prudential regulation are important for revitalizing the financial sec-tor. But they will not be enough to stimulate the rapid and equitable growth neededfor poverty reduction – especially since the banking sector is largely urban-based andconcentrates on trade finance.
This implies an important role for the government – which will need to providedirected and concessional credits for rural and agricultural activities and financial assis-tance to employment-intensive small and medium-sized enterprises (SMEs). The poorperformance of the recently liquidated Yemen Industrial Bank might not providemuch encouragement for such a policy. But this does not mean such operations arenecessarily doomed to failure. Rather, the government should identify the sources ofproblems, address them and ensure that specialized credit facilities for priority sectorsfunction properly. If it does not, the private sector, especially SMEs, will continue tofind access to credit a major impediment.
The government also needs to have regulations requiring commercial banks to diver-sify their lending and extend their operations to rural areas. In this regard, Yemen candraw on the experience of India, where all banks, public and private, are required tolend at least 40% of their net credit to the ‘priority sector’ – or as a penalty must lendmoney to specified government agencies at a very low rate of interest. Studies byBanerjee and Duflo (2004) found that most banks complied with the regulations andcontributed significantly to the expansion of agriculture and small-scale industries.
Alternatively, the CBY can consider carrot-and-stick measures. It could, for example,combine the Indian penalty-based system with incentive-based measures such as asset-based reserve requirements, support for pooling and underwriting small loans, and uti-lizing the discount window in support of employment-generating investments (seePollin, 1993, 1995, 1998). As Epstein (2002)
Asset-based reserve requirements are an effective tool for creating incentives for banksto invest in socially productive assets. The CBY could, for example, use the findingsof specialized investment funding agencies as the basis for a set of employment gener-ating and commercially viable investments. Banks that invested in these activitieswould benefit from reserve requirements lower than for deposits invested in specula-tion or TBs or CDs.
The CBY can also create liquidity and risk-sharing institutions for loans to commer-cially viable and employment-generating small businesses which do not have adequateaccess to the credit market. In this regard, banks can take advantage of the experienceof the Islamic Banks such as Mudaraba, Musharaka, Muzar’ah and Musaqat – emulat-ing some of their deposit-taking and lending practices. The CBY can promote this byproviding financial and administrative support for asset-backed securities – created bybundling loans to small businesses and other employment-intensive activities – and sellthem as securities on the open market. Finally, the CBY can open a special discountwindow facility to offer credit, guarantees or discount facilities to institutions that are
61
Chapter Five: Financial-sector development, growth and poverty reduction

on-lending to firms and co-operatives engaged in commercially viable employment-intensive activities. For these purposes the CBY can use some of its accumulated for-eign exchange surplus.
Commercial banks are often reluctant to lend because of the lack of legal certainty andenforceability of contracts. Although there has been some progress in legal reforms, theperformance of the commercial courts is still weak. They are also attracted away fromprivate-sector lending by the high interest rates on Treasury Bills (TBs). In these cir-cumstances, even the specialized Agricultural Bank finds it safer and more profitable toinvest in TBs.
It is essential that the government establish specialized micro-finance institutions tocater to the needs of the poor who lack the assets that can serve as collateral. At pres-ent they have almost no access to commercial credit from the commercial banks andthus little chance of expanding their businesses beyond mere subsistence.
Box 5.1: Financing agricultural activities and SMEs in Vietnam
Vietnam, with a population of 82 million, is one of the fastest-growing developing economies,
and making impressive advances in poverty reduction. Between 1993 and 2002 it reduced the
poverty rate from 58% to 29%. In addition to job creation, the government used financial serv-
ices for the poor as powerful instrument in poverty alleviation, particularly in the rural areas –
providing loans to poor households through state-owned banks.
The financial sector reforms in the late 1980s led to the collapse of the traditional credit cooper-
atives and a public loss of faith in the financial system. This prompted the government to estab-
lish in 1993 a new People’s Credit Funds (PCFs) to mobilize domestic savings, and then in 1995
the not-for-profit Vietnam Bank of the Poor (VBP) and in 1998, the Vietnam Bank for
Agriculture and Rural Development (VBARD) – which became the major providers of finan-
cial services to low-income people.
VBARD utilises three different credit methodologies. First, it provides individual loans to rural
farmers and entrepreneur, using a land-use certificate as collateral. Second, it lends to individu-
als through joint liability groups, requiring repayment of group loans before a new round of loans
can be initiated. Third, for borrowers unable to provide collateral, VBARD channels loans
through guarantee groups composed of leaders of mass organisations.
VBARD has adopted innovative ways to reach people. In 1998, it initiated a mobile-banking
programme to extend credits and deposits to rural mass. Following a schedule matched to week-
ly market days, VBARD vehicles carry loan officers to process loan applications, disburse money,
collect repayments and mobilize savings.
At the beginning, VBARD offered the poor lending rates 30% lower than the market rates, but
under the mobile banking programme, it began to charge a rate that would recover the cost of
running vehicles and other operational costs, and thus charged rural borrowers is 12% compared
to 8.4% for urban borrowers. The loan repayment rate is 97%.
62
Chapter Five: Financial-sector development, growth and poverty reduction

According to the Vietnam Living Standards Survey, in 2002, VBP was the leading micro credit
provider to poor households in rural areas with 58% of the market, followed by VBARD with
24%. By 2003, VBARD, VBP and PCFs reached approximately 7 million households, among
them 3 million rural households, representing over 90% of the outreach of rural financial servic-
es in Vietnam. The mobile banking programme has proved relatively cost effective by providing
financial services to 315,000 poor households - about 6% of VBARD’s clients.
References:
BWTP Asia Resource Centre for Microfinance (2005), Vietnam Country Profile
Hanoi National Economic University, Microfinance Resource Centre (2002), Socio-Economic
Impact Assessment of Rural Finance Project (Hanoi, Vietnam), http://www.cgap.org,
World Bank, (1999), “Lao Cia: A Participatory Assessment” (Hanoi, Vietnam: World Bank and
UK Department for International Development).
World Bank, (1999), Vietnam Development Report, 2000: Attacking Poverty (Washington).
Box 5.2: Financing agricultural activities and SMEs in India
India has recognized that commercial banks often fail to reach the rural and small-scale sectors
and to address this has several state-run initiatives including the Small Industries Development
Bank of India (SIDBI), the State Financial Corporations (SFCs), the National Small Industries
Development Corporation (NSIC) and the National Bank for Agriculture and Rural
Development (NABARD).
The SIDBI, established in 1990, is the principal financing institution for the small scale sector.
SFCs were set up to finance small and medium-scale units and operate in various states as
Regional Development Banks. They provide financial assistance to industrial units by way of
term loans, direct subscription to equity, guarantees etc. SFCs get into memoranda of under-
standing with the public sector banks to participate in joint lending in which both term loans and
working capital are provided jointly.
NSIC was set up to finance the working capital of well managed small scale industries. For exam-
ple, it provides finance for export development and assists SSIs in procuring industrial equipment.
NABARD was established in 1982, to act as the apex organisation concerning policy and plan-
ning operations in the field of credit for agriculture and other economic activities in rural areas
in India.
The Reserve Bank of India has also taken steps to improve the credit flow to small-scale indus-
tries. The Government raised the investment limit for SSIs from Rs 600 thousand to Rs 30 mil-
lion and for smaller units from Rs 500 thousand to Rs 2.5 million. The Reserve Bank of India
(RBI) has issued instructions that out of the funds available to the SSI sector, 40% is to be given
to units with investments in plant and machinery up to Rs 500,000; 20% for units with invest-
ment between Rs 500,000 and Rs 2.5 million and the remaining 40% for other units. Credit to
SSIs is monitored periodically by the RBI, the Department of Small-Scale Industries &
Agricultural Rural Industries, the National Advisory Committee of SIDBI, the State Level
Bankers Committee and the District Level Coordination Committees of the Bank.
Sources: http://www.ifciltd.com/; http://www.nabard.org
63
Chapter Five: Financial-sector development, growth and poverty reduction

Box 5.3: Directed credit schemes and financial-sector liberalization – findings from
Ecuador
Evaluating directed credit programmes is a complex task. First, the distortions and inefficiencies
they cause must be compared with the imperfections in the capital market. Second, government
interventions in promoting the supply of long-term resources often have multiple objectives like
redressing regional disparities or income inequalities. One recent study of Ecuador found that
directed credit programmes accounted for approximately 50% of the total credit in the economy
in 1984 and thus substantially compensated for the inability of the financial system to generate
funds for investment. This explains why total credit in the economy rose during the 1970s and
early 1980s, and peaked (reaching 23% of GDP) in 1983 despite financial constraints.
Beginning in 1984, as part of its financial sector liberalization programmes, Ecuador eliminated
or scaled down directed credit programmes and removed administrative controls on interest rates.
The study found that the supply of credit subsequently declined drastically with the contraction
of government-provided loanable funds, falling to 9% of GDP in 1990.
Firm-level debt structure data show that, together with the decline in total credit, the share of
long- term loans fell from 12% in the early 1980s to 8% in 1992. And for most years, the growth
rate of real long-term credit was negative. Firm-level data also show that the percentage of direct-
ed credit was much higher for longer-term maturities prior to liberalization. This declined from
59.3% in 1985 to 35.9% in 1990. The percentage of directed short-term credit declined from
31.1% in 1985 to 3.3% in 1992. The decline in the access to long-term credit negatively affect-
ed firms’ performance, especially in terms of productivity. In particular, the lack of access to long-
term credit adversely affected firms’ ability to acquire improved technology.
Reference:
Jaramillo, F. and Schiantarelli, F. (1996), “Access to Long Term debt and Effects on Firms’
Performance: Lessons from Ecuador”, paper presented to the conference “Term Finance: Theory
and Evidence”, Policy Research Department, the World Bank, Washington, DC, June 14, 1996.
64
Chapter Five: Financial-sector development, growth and poverty reduction

6.1 IntroductionIn underdeveloped economies with very shallow financial markets, there are closeinterconnections between fiscal, monetary and exchange-rate policies. These connec-tions are further strengthened in an oil economy like Yemen’s where the major partof export earnings falls into the hands of the government.
Take for example exchange rate and fiscal policies. When the government devalues theexchange rate the immediate and most pronounced effect is to increase the domesticcurrency value of its oil-export revenues, but the ultimate effect of such devaluationscritically depends on the fiscal stance of the government. Similarly, when the govern-ment spends oil revenues in the domestic economy, in addition to its direct effects, thisalso has important monetary implications, even when the overall budget is balanced.
Many of these effects depend on the economy’s absorptive capacity. This is determinedby the tightness of the labour market and the ability of the economy to adopt andassimilate new technologies that enhance the productivity of the domestic factors ofproduction, as well as the pattern of utilization of oil revenues by the government.These interconnections are critically mediated and shaped by the country’s monetaryand exchange-rate regulations. This chapter therefore begins with a review of themonetary and exchange-rate regulations and reforms since the inception of the stabi-lization and adjustment programme.
6.2 Monetary policy: reforms and regulations
Historically, Yemen did not have an independent monetary policy. The money sup-ply simply responded to fiscal needs and to developments in the balance of paymentsresulting from the fixed exchange-rate regime. This ‘fiscal dominance’ became moreprominent immediately after the unification of the North and the South. In theabsence of non-bank financing sources the costs of unification caused large budgetdeficits and a rapid expansion in the monetary base. During 1990-94, the correlationbetween the fiscal deficit and broad money was found to be 0.85 (IMF, 2001, p. 111).
Yemen’s fiscal balance improved markedly after 1995. Between 1994 and 1997 the fis-cal deficit, as a proportion of GDP, declined from over 16% to less than 2%. This waspartly due to the IMF/World Bank adjustment programme but also to the increase inoil revenue. This eased pressure on monetary policy considerably.
In 2000 the GoY introduced a new law giving the central bank more independenceto perform its supervisory and prudential regulation roles. The law also allows the cen-tral bank to resist the open-ended financing of fiscal deficit. The conduct of monetarypolicy has also been more flexible following the unification and floating of theexchange rate.
65
Chapter SixMacroeconomic policy, inflation and growth:interlinkages between fiscal, monetary andexchange-rate policies
Chapter Six: Macroeconomic policy, inflation and growth: interlinkages between fiscal, monetary and exchange-rate policies

In 1995, in order to develop sources of non-inflationary financing of fiscal deficits, theG0Y introduced a market for treasury bills (TBs), and to channel resources to the TBmarket the central bank subsequently closed its term deposit facility for banks and pen-sion funds. By the end of 1999, as the fiscal balance improved, fewer TBs were beingissued, by which time their total value was YR119.8 billion. Some of the newer ones,however, were the result of converting public sector debts to the banking system intoTBs. Most of these were used to meet additional bills required by banks for their ownliquidity management through repurchase operations introduced in November 1999.By the end of 2003, the outstanding balance of TBs was YR185.2 billion. Althoughthe central bank offers clearing and settlement facilities, secondary trading of TBs hasnot yet developed.
Due to the inadequacy of TBs in original and re-purchase operations, as well as thenon-issuance of TBs, the CBY started to issues certificates of deposit (CDs). This wasnecessary to absorb surplus liquidity due to a record increase in foreign exchangereserves – to $3,568 million, an amount sufficient to cover 15 months of imports. Bythe end of 2001, the CBY had issues issued CDs world about YR 40 billion, 75% ofwhich were acquired by banks, and 24% by retirement funds (CBY, Annual Report,2001, p. 34). This amount increased to YR47 billion at the end of 2002. The CBYpays interest on these CDs: the minimum benchmark rate of interest plus one percent-age point. This represents a heavy burden on the resources of CB: in 2002 interest pay-ments were YR5 billion.
The central bank also streamlined the use of statutory reserves as an instrument ofmonetary policy. For example, in 1995 it unified the reserve requirement at 25% –without any interest for all Rial deposits. It subsequently lowered the reserve require-ment in states and since December 1997 it has remained at 10%. In December 1996for Rial deposits it introduced a 5% interest rate and in the following year raised thisto the benchmark deposit rate. In December 1997 it lowered the reserve requirementon foreign currency (dollar) deposits from 25% to 15%, and in July 2000 to 10% –though raised it again to 15% in February 2003. The interest rate paid on reserves fordollar deposits is 1.5% at the end of each month on the lowest balance during thatmonth. It treats dollar deposits differently, both in terms of statutory reserves and inter-est rates in order to stem the increasing dollarization of the economy and make Rialdeposits more attractive. This has had some success: the rate of growth of dollardeposits fell from 23% in 2002 to 20% in 2003, and the share of dollar deposits in thetotal fell from 51% to 50%.
The dollarization of the economy limits the monetary authority’s ability to influenceeconomic activity is. As noted earlier, this also has implications for capital flight andreduces government income from seignorage. That domestic resident choose to holda foreign currency indicates the economy’s lack of financial depth.
One of the main instruments of monetary policy is the control of benchmark interestrates for deposits at the commercial banks – to which are linked to the interest ratespaid on certificates of deposit. The central bank charges the commercial banks andpublic corporations interest rates on credits according to the loan interest rates prevail-
66
Chapter Six: Macroeconomic policy, inflation and growth: interlinkages between fiscal, monetary and exchange-rate policies

ing in the market. It charges the government two percentage points higher than theaverage interest rates on deposits with the banks.
In 1995, the CBY determined benchmark interest rates for various deposits as follows:three months, 20%; six months, 21%; nine months, 21.5%; one year and more, 22%;and savings deposits, 20%. In 1996, the rates were raised to 25% (on 3-months), 26%(on 6-months), 26.5% (on 9-months), 27% (on 1 year or more) and 25% (on savingsdeposits). In May 1997, the minimum saving deposits rate was lowered to 14% andother rates were freed, provided they did not fall below the benchmark rate. The low-est benchmark rate that the central bank fixed was 10% in February 1998, but it wasraised to 15% in October 1998. It was further raised to 20% in June 1999. The bench-mark rate on savings deposits was lowered to 13% in 2000 and it has remained at thatlevel. The CBY uses the TB rates to fix the minimum rate for savings deposits.
Table 6.1 shows that the central bank has not changed the benchmark interest rates forthe purpose of monetary policy since 2000. Although commercial banks have been freeto set interest rates on term deposits since 1997, they chose to have them at the CBY-set minimum rate for savings deposits. However, the commercial banks maintained awide spread between the deposit and lending rates, reflecting the lack of competitionfrom within the banking sector and the non-existence of a non-bank financial system.
Table 6.1: Interest rates of commercial banks
End of Period Interest Interest on Deposit
on Loans 3 months 6 months 9 months 12 months Savings
1997 15-21 11 11 11 11 11
1998 14-20 15 15 15 15 15
1999 22-28 18 18 18 18 18
2000 15-20 13 13 13 13 13
2001 15-20 13 13 13 13 13
2002 15-20 13 13 13 13 13
2003 15-21 13 13 13 13 13
Source: CBY Annual Report 2003, Appendix Table 6, p. 80.
6.3 Exchange rate regime and reforms
Other aspects of the reform programme with significant implications for the conductof monetary policy, were related to the foreign exchange regime. In 1990, at the timeof unification, Yemen had a dual exchange-rate regime – official and parallel. The offi-cial regime was comprised of multiple rates. A rate of $1 = YR4.5 was applied to gov-ernment external transactions and covered crude oil and petroleum products, officialreceipts and payments and external debt service payments. A lower rate of $1 = YR12was applied when allocating foreign exchange to the private sector for importing food-stuffs (wheat, flour and rice) and for special purposes such as officially approved med-ical treatment or study abroad. All other external transactions used the parallel marketrate of $1 = YR13. The parallel market was operated by unregulated moneychangers.
67
Chapter Six: Macroeconomic policy, inflation and growth: interlinkages between fiscal, monetary and exchange-rate policies
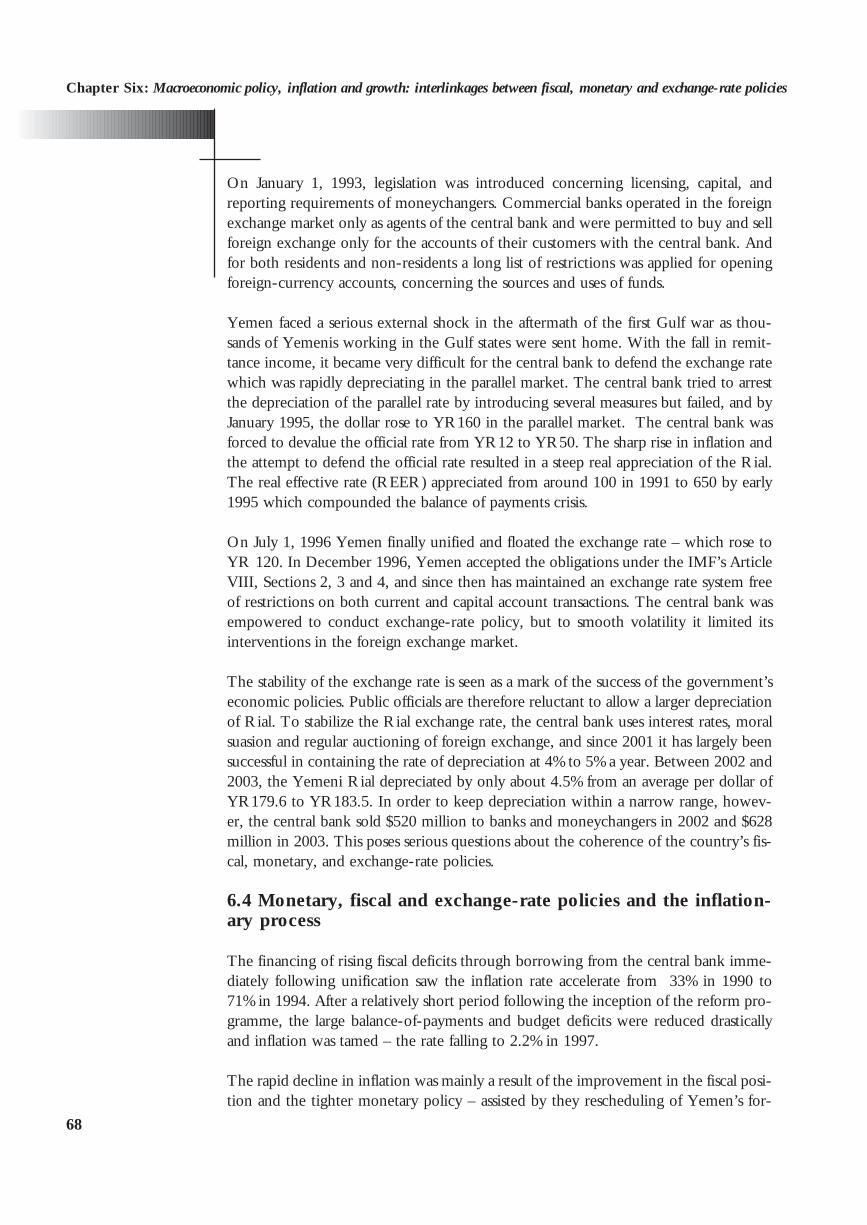
On January 1, 1993, legislation was introduced concerning licensing, capital, andreporting requirements of moneychangers. Commercial banks operated in the foreignexchange market only as agents of the central bank and were permitted to buy and sellforeign exchange only for the accounts of their customers with the central bank. Andfor both residents and non-residents a long list of restrictions was applied for openingforeign-currency accounts, concerning the sources and uses of funds.
Yemen faced a serious external shock in the aftermath of the first Gulf war as thou-sands of Yemenis working in the Gulf states were sent home. With the fall in remit-tance income, it became very difficult for the central bank to defend the exchange ratewhich was rapidly depreciating in the parallel market. The central bank tried to arrestthe depreciation of the parallel rate by introducing several measures but failed, and byJanuary 1995, the dollar rose to YR160 in the parallel market. The central bank wasforced to devalue the official rate from YR12 to YR50. The sharp rise in inflation andthe attempt to defend the official rate resulted in a steep real appreciation of the Rial.The real effective rate (REER) appreciated from around 100 in 1991 to 650 by early1995 which compounded the balance of payments crisis.
On July 1, 1996 Yemen finally unified and floated the exchange rate – which rose toYR 120. In December 1996, Yemen accepted the obligations under the IMF’s ArticleVIII, Sections 2, 3 and 4, and since then has maintained an exchange rate system freeof restrictions on both current and capital account transactions. The central bank wasempowered to conduct exchange-rate policy, but to smooth volatility it limited itsinterventions in the foreign exchange market.
The stability of the exchange rate is seen as a mark of the success of the government’seconomic policies. Public officials are therefore reluctant to allow a larger depreciationof Rial. To stabilize the Rial exchange rate, the central bank uses interest rates, moralsuasion and regular auctioning of foreign exchange, and since 2001 it has largely beensuccessful in containing the rate of depreciation at 4% to 5% a year. Between 2002 and2003, the Yemeni Rial depreciated by only about 4.5% from an average per dollar ofYR179.6 to YR183.5. In order to keep depreciation within a narrow range, howev-er, the central bank sold $520 million to banks and moneychangers in 2002 and $628million in 2003. This poses serious questions about the coherence of the country’s fis-cal, monetary, and exchange-rate policies.
6.4 Monetary, fiscal and exchange-rate policies and the inflation-ary process
The financing of rising fiscal deficits through borrowing from the central bank imme-diately following unification saw the inflation rate accelerate from 33% in 1990 to71% in 1994. After a relatively short period following the inception of the reform pro-gramme, the large balance-of-payments and budget deficits were reduced drasticallyand inflation was tamed – the rate falling to 2.2% in 1997.
The rapid decline in inflation was mainly a result of the improvement in the fiscal posi-tion and the tighter monetary policy – assisted by they rescheduling of Yemen’s for-
68
Chapter Six: Macroeconomic policy, inflation and growth: interlinkages between fiscal, monetary and exchange-rate policies

eign debt, the resumption of foreign aid, and rising oil revenues. The GoY was ableto reduce its budget deficits because of large increases in the domestic currency valueof its oil revenues following the removal of implicit subsidies and the sharp devalua-tion of the official exchange rate early in the reform programme. It also restrained itsspending: between 1994 and 1997 general government consumption expenditure fellby almost 20% in real terms, and it did not attain its pre-1999 level. In addition, dur-ing the same period there was a sharp reduction in the value of explicit price subsidieswhich further reduced government spending (between 1996 and 1999 explicit pricesubsidies fell from over 12% of GDP to about 2%).
Government spending was further restrained by increases in interest rates, whichpushed the government’s domestic interest obligations to almost 3% of GDP in 1999,as well as by its commitment to finance its deficits by issuing treasury bills. It was alsoincreasingly able to use its oil revenues to reduce its debt to the banking sector. Therestrained fiscal policy, combined with the credit crunch following interest-rate hikes,also reduced balance of payments deficits; in later years these turned to large surpluseswhich led to a rapid build up of foreign exchange reserves at the central bank. This hashelped the central bank in supporting a relatively stable exchange rate, which under aliberalized trade regime, has been instrumental in taming inflation (see, Figure 6.1).
Figure 6.1: Budget balance, money-supply growth, currency depreciationand inflation, 1990-2003
Source: IMF, IFS, April 2005
The Yemeni economy is not prone to high inflationary spirals of the Latin Americantype – as is evident from the 1990-95 period, and particularly the stabilization periodof 1995-99 when large consumer subsidies were removed and the official exchangerate was unified. This is because the economy is underdeveloped and because wageearners and agricultural producers and other economic agents lack economic power.Under these conditions the main preoccupation of macroeconomic policy making forpoverty reduction should not be inflation but growth and employment creation.
Since 2000, the inflation rate has had moderate increases, averaging 12%. and for 2005with the increase in fuel prices and associated price increases the rate exceeded 20%.
69
Chapter Six: Macroeconomic policy, inflation and growth: interlinkages between fiscal, monetary and exchange-rate policies
-20
-10
0
10
20
30
40
50
60
Budget Balance %GDP Inflation rateMoney Supply %change Currency Depreciation %
1991 1992 1993 1994 1995 1996 1997 1998 1999 2000 2001 2002 2003

However, the central bank aims to bring inflation down to single digits. For this rea-son it is necessary to make a more careful study of the inflationary process in Yemensince 2000. A better understanding of the inflationary process in Yemen in this peri-od, requires us to distinguish demand-side inflationary forces – factors resulting, forexample, from monetary and fiscal expansion – from supply-side factors.
6.4.1 The inflationary impact of fiscal policy
Since Yemen is an oil economy, where a major share of government income from isforeign exchange revenues from oil exports, the fiscal stance of the government canplay a key role in demand expansion. However, unlike other economies where thereare concerns about the overall budget deficit, in Yemen the same expansionary resultscan be caused by the government’s foreign-exchange earnings from the oil sector.
One measure of net injection of funds by the government into the domestic economyis the non-oil budget deficit, which is here defined as the budget deficit plus the for-eign exchange component of the government’s oil revenues.33 The trends in non-oilbudget deficits, inflation rate, and the growth of government expenditure as a percent-age of GDP are shown in Figure 6.2.
Figure 6.2: Non-oil budget deficits, growth of government expenditure,percentage of GDP, and inflation, 1997-2003
Notes: Non-oil deficit is budget deficit minus foreign exchange component of government.
Source: IFS, IMF April 2005, IMF 2004.
The increase in the inflation rate since 2000 appears to be associated with a moreexpansionary fiscal stance – as depicted by both the growth of government expendi-ture and the increase in non-oil budget deficits. For example during 1997-99 the rateof change in government expenditure, as a share of GDP, was on average about minus8% a year, which increased to on average plus 6% during 2000-03. In the 2000-2001period, non-oil deficits increased by the staggering figure of over 110%. This jerky
70
Chapter Six: Macroeconomic policy, inflation and growth: interlinkages between fiscal, monetary and exchange-rate policies
-16-12
-8-4048
12162024
1997 1998 1999 2000 2001 2002 2003
Inflation rate (cpi) non-oil deficit %change in Gov Expenditure (% GDP)
Per
cen
t
33 The non-oil budget deficit as defined here is different from the broader concept of non-oil deficits which alsoincluded the domestic oil revenues of the government. This latter concept is more relevant for considering the long-term sustainability of budget deficits, while the definition used here is the relevant one for considering the expan-sionary impact of non-oil budget deficits.

behaviour is a reflection of the liquidity constraints imposed by the adjustment pro-gramme which were removed as soon as oil revenues started to increase in 2000. Thisis clearly inefficient and destabilizing. As we shall argue below, preventing such out-comes will require closer coordination between fiscal and monetary policies, and moreaccommodating financing from international aid agencies to allow long-term fiscalplanning and to smooth non-oil revenue fluctuations.
The question that arises, however, is why such massive increases in non-oil budgetdeficits and government expenditures have not been more inflationary. There is, forexample, only a weak relationship between the level and the rate of change in non-oilbudget deficits and the rate of inflation. The correlation coefficient is only 0.25 for thelevel relationship, and 0.39 for the relationship between the change in non-oil deficitsand inflation. In fact, once one omits extreme outlier years the correlations fall to zero(see, Figure 6.3). In other words, for a wide range of variations in the level and changeit seems that inflation is independent of non-oil budget deficits.
Figure 6.3: Relationship between inflation and non-oil budget deficits
Source: IMF, IFS, April 2005
There are a number of explanations for this. The principal reason is that the govern-ment’s oil revenues can also be used for a simultaneous expansion of aggregate supplythrough imports which help sterilize the potential monetary impact of non-oil budg-et deficits. Given that Yemen is a highly open economy, importing a large part of thedomestic supplies of manufactures, raw materials, and even food, the availability of for-eign exchange plays an important part in diffusing inflationary pressures in the domes-tic economy. This of course then raises the issue of imported inflation, and the signif-icance of the exchange rate in the inflationary process, to which we return below.
The second important reason has been Yemen’s very lax labour market – with highand increasing levels of unemployment and labour force growing by close to 4% a year.The Second Labour Force Survey of 1999 found an overall unemployment rate of11.5%. The General Directorate of Human Development Planning, estimated thenational rate at 14.7% in 1999 and predicted that it would rise beyond 2004. Aboutone-third of the unemployed are long term – unemployed for more than 12 months.According to the World Bank (2002), the underemployment rate in 2002 was 25%.Unemployed workers emerged from all sectors of the economy, the highest being inconstruction (20%) followed by transport (9.6%), industry (8.8%), trade (8.4%) andagriculture (6.6%).
71
Chapter Six: Macroeconomic policy, inflation and growth: interlinkages between fiscal, monetary and exchange-rate policies
Inflation against the change non-oil Budget deficits
0
5
10
15
-50 0 50 100 150
2001
0
5
10
15
5 10 15 20 25
2000
Infla
tion
Infla
tion
y = 0.0073x + 7.4197R2 = 0.0034y = -0.17x + 11.299
R2 = 0.0132
Inflation against non-oil Budget deficits
non-Oil Budget Deficits (% GDP) % change in non-Oil Budget Deficits

In an economy near to full employment, small changes in the net injection of fundsvia the non-oil budget deficits would inevitably lead to wage increases and generateinflationary pressures by increasing the demand for non-traded goods for which thesupply is inelastic – sometimes referred to as the Dutch Disease – with an accompany-ing shift of resources from the traded to non-traded sectors. However, in Yemen, thelax labour market has accommodated a large net injection of funds via the governmentbudget without overheating.
There are of course always specific skills shortages, and bottlenecks in the economy,which can lead to inflationary pressures, particularly in the face of sudden increases innon-oil budget deficits. Such sudden and extreme increases in non-oil budget deficits,as in 2001, should be avoided. However, mild bouts of inflation themselves play animportant role in signalling the need for a shift of resources to the bottleneck areas, andhence are important preconditions of economic growth. If instead the overridingobjective of government policy is to control inflation this can stifle growth by reduc-ing the flexibility and effectiveness of the price system in reallocating resourcesbetween sectors and activities.
This also has important implications for the large inflow of funds under the MDG proj-ect proposals. These can easily be accommodated if they are supported by regular andfirmly committed long-term flow of foreign grants, and are phased in along with thedeclining oil revenues in a manner that prevents extreme fluctuations. In addition, ifsuch investments also contribute to improving productive capacities and removingbottlenecks, such as the shortages of skilled labour, through proper training and edu-cational programmes, they can also help reduce inflationary pressures. This has not,however, happened in the past and reaping these advantages of external sources offinance will require complementary policy changes to which we turn below.
The rate of inflation does not however depend on the government’s fiscal stance, or atleast not in a straightforward manner. For example, as shown in Figure 4.2, during1997-99, rapidly falling non-oil budget deficits and the rapid decline in the share ofgovernment expenditure in GDP, coincided with accelerating inflation. Other deter-minants also need to be taken into account, including the monetary and exchange ratepolicies of the central bank, and supply-side effects.
6.4.2 The monetary causes of inflation
To what extent is the recent rise in inflation a monetary phenomenon? This is animportant question given the large swings in capital flows and transfers and the changesin oil revenues and non-oil budget deficits – for with only shallow financial marketsthe central bank may not be able to cope with such monetary shocks.
The rise in inflation in 1998 and 1999 coincided with the rise in money supply result-ing from large government borrowing from the central bank. This can give the impres-sion that inflation in Yemen is a monetary phenomenon, driven by government budg-et deficits.
72
Chapter Six: Macroeconomic policy, inflation and growth: interlinkages between fiscal, monetary and exchange-rate policies

The money supply rose sharply in 1998 and 1999 when oil revenues shrank dramati-cally and the government increased it borrowing from the central bank to 3% of GDP.This was reversed in 2000 when crude-oil prices rose, but nevertheless the money sup-ply showed its sharpest increase in that year. Since 2000, the main cause of changes inmoney supply has been the accumulation of foreign assets (Figures 6.4 and 6.5).
Figure 6.4: Money supply and its components (million YRs)
Figure 6.5: Change in money supply and its components (million YRs)
This shows Yemen’s double vulnerability to oil-price fluctuations, which can not onlybe transmitted to the domestic economy via increased government expenditure, butcan also have an expansionary impact through the monetary and credit mechanism.Despite the fact that a considerable part of increased oil revenues since 2000 have takenthe form of accumulated net government deposits in the central bank – YR 200 bil-lion – these sums have been by far surpassed by the accumulation of foreign reservesin the central bank, leading to fast increases in the money supply.
Therefore, to the extent that inflation is a monetary phenomenon, its source, at leastin recent times, lies in developments in the balance of payments. The close associationbetween money supply and net foreign assets shows that the central bank has not beenfully successful in its attempt to sterilize the impact of foreign exchange reserves onmoney supply by buying and selling certificates of deposit. Its holding of foreign assetsstood at YR924 billion (about $5 billion) which is about 14-15 months of imports –nearly 5 times what is generally regarded as safe. This level of foreign asset accumula-
73
Chapter Six: Macroeconomic policy, inflation and growth: interlinkages between fiscal, monetary and exchange-rate policies
-200000
0
200000
400000
600000
800000
1000000
1200000
1996 1997 1998 1999 2000 2001 2002 2003 2004
Foreign Assets (Net) Claims on Government (Net) Claims on Private Sector Broad Money
-200000
-100000
0
100000
200000
300000
400000
1996 1997 1998 1999 2000 2001 2002 2003 2004
Foreign Assets (Net) Claims on Government (Net)Claims on Private Sector Broad Money

tion can not only cause inflation it also has high opportunity costs – since a dollar heldas reserve is essentially a dollar of foregone investment.34
However, the transmission mechanisms between money-supply growth and theexpansion of aggregate demand and inflation may not function as expected in theYemeni economy. One reason is that the demand for money does not seem to be sta-ble. The evidence suggests a volatile and declining velocity of money, with the impli-cation that increases in money supply will not necessarily lead to a proportionate risein the price level. Between 1994 and 2003, the velocity of money (GDP/M1) declinedfrom 7.8 to 6.0 and for non-oil GDP fell from 7.3 to 4.1. A similar declining trend isalso observable for M2 velocity. Additionally, both M1 and M2 velocities, in terms oftotal as well as non-oil GDP, displayed significant volatility in their year-to-yeargrowth; over the period 1994-2003 the standard deviation of M1 velocity growth was29. Thus in Yemen the strict quantity theory prediction based on a constant velocitylinking money-supply growth to inflation does not appear to hold.
Secondly, having fixed the deposit rates at a high level, the central bank has effective-ly blunted the possible transmission mechanisms between monetary expansion andaggregate demand via interest rate changes.
Thirdly, as noted in the previous chapter, much of the credit afforded by the bankingsector to the non-financial private sector is short-term credit and predominantly usedfor trading activities rather than investment. Under these circumstances the directionof causation can be from inflation to demand-for-money, with an accommodatingmoney-supply process. The excess liquidity in the banking system, increasingly find-ing its way into deposits in central bank and overseas banks, makes this direction ofcausation more credible.
Figure 6.6: Relationship between inflation and the growth of bank creditsto the private sector, 1997-2003
Notes: Including year 2000 in the regression reduces R2 to .49, but the relationship remains signifi-
cant.
Source: Based on data from IFS, IMF, and April 2005.
74
Chapter Six: Macroeconomic policy, inflation and growth: interlinkages between fiscal, monetary and exchange-rate policies
34 According to Baker and Walentin (2001), the estimated opportunity cost of increased holdings of foreignexchange reserves for developing countries ranges between 1% and 2% of GDP. The opportunity cost depends onthe rate of returns on investment in physical and human development, which is found to be higher in developingcountries.
y = -0.276x + 17.359R2 = 0.8623
0
2
4
6
8
10
12
14
16
0 10 20 30 40 50 60
2000, excluded from the regression
CPI
infla
tion
%
% change in credit to private sector

The view that inflation in recent years may not have been caused by the expansion ofthe money supply is further supported by the relationship between the growth of cred-its extended to the private sector by commercial banks and the rate of inflation, shownin Figure 6.6. There seems to be a robust and negative relationship between the rateof growth of credit extended to the private sector and the rate of inflation. This rela-tionship is more consistent with inflation emanating from supply shocks rather thanfrom the expansionary impact of monetary policy. For example, shocks in the agricul-tural sector can lead to inflation and at the same time reduce the supply of credit as aresult of higher perceived credit risks by the banks. Similarly, adverse supply shocksemanating from oil-price fluctuations, under the current foreign exchange regime inYemen can result in capital flight and exchange rate depreciation leading to the build-ing up of inflationary pressures by increasing import prices. Increased uncertainty inthis case can again cause the banks to curtail the growth of credit extended to the pri-vate sector. In both these examples, the banks may prefer to invest their excess liquid-ity in central bank CDs, treasury bills, or deposits abroad, which is more or less whathas been happening in recent years. This indicates the need for greater attention tosupply-side factors.
6.4.3 Supply-side factors
Inflation in Yemen is also caused by supply-side factors, which may not be related tomoney-supply growth. These include the upward adjustment of administered prices.For example, according to the estimates of the IMF (2001, p. 114), in 1996 the CPIinflation would have been much lower than 33% had not the diesel price, in order torepair the budget, been raised by 100%, the wheat and flour prices by 150% and theelectricity tariff by 161%. The IMF report notes that administrative price increases con-tributed to inflation – and inflation excluding administered price increases was about7-15% lower than overall CPI (IMF, 2001, p. 114). It also notes, “Other importantfactors driving inflation were fluctuations in the prices of vegetables and qat. Bothproducts exhibit strong seasonality, with prices affected by rain/drought and seasonaldemand (around holidays for qat) and on trend these prices have been rising faster thanthe overall index.” (IMF, 2001, p. 116). According to the IMF estimates, CPI infla-tion has always been lower by at least 10%-25% when both products are excluded fromthe measure (IMF, 2001, p. 116).
75
Chapter Six: Macroeconomic policy, inflation and growth: interlinkages between fiscal, monetary and exchange-rate policies

Figure 6.7: Inflation rates in the food and non-food components of theCPI, 2002-05
Hence, because of the importance of food items (vegetables, fruit and meat) and qat,which have negligible import components and are largely dependent on weather con-ditions, a significant element of inflation in Yemen can be supply determined or of a‘cost-push’ type. Dependence on weather conditions is less marked for cereals, where80% of demand is met by imports. This is clearly shown in Figure 6.7, which depictsthe movements of the food and non-food components of the CPI. The figure high-lights a number of important facts. Firstly, inflation in the imported food and non-foodcomponents of the CPI since 2002 has been relatively stable and more or less in linewith the rate of depreciation of the currency, thus confirming the argument made ear-lier that due to lax labour market conditions inflation has not been predominantly dueto wage increases. The second observation is that non-imported food price inflationappears to be accelerating. Since food is the dominant component of the CPI, the maindriving force of inflation in recent years has been rising prices of mostly domesticallyproduced food.
Both the upward trend in food-price inflation and its volatility may appear paradoxi-cal. Since the end of food subsidies in 1999 and with an apparently liberalized traderegime and the availability of foreign exchange one would expect long-term trends infood prices to be closely linked to international food prices rather than to the vicissi-tudes of domestic food production. A disaggregated view clarifies the situation, as theinflation rate for food items, where imports are substantial, notably cereals, has beenmuch lower and within the range of inflation for non-traded services, while the infla-tion rates for largely locally produced agricultural products, notably vegetables, fruit,meats and qat, have been higher than the overall inflation rate.
The relationship between domestic food price index and the world food price index(converted to Rials) is shown in Figure 4.8. As expected, during the 1997-99 perioddomestic food prices increased much faster than international prices, as this was a peri-od during which food-price subsidies were being removed. The 1999-2000 periodwitnessed a remarkable co-movement between the two indices. However, since 2000food prices have been growing faster than international prices measured in the samecurrency. This divergence appears to be due largely to faster price increases for itemswhere imports are not significant. As the country did not face foreign exchange con-straints, the prices of cereals only rose at the same rate as international prices plus thefactor by which the Rial was devalued compared to the US dollar.
76
Chapter Six: Macroeconomic policy, inflation and growth: interlinkages between fiscal, monetary and exchange-rate policies
0
5
10
15
20
25
30
2002 2003 2004 2005
Non-imported food Non-traded servicesTraded non-food Food with imports
Perc
enta
ge p
rice
in
crea
se

Figure 6.8 shows a composite international food price which reflects the variations inboth the international food prices in dollar terms and the depreciation of the Rial.Considering that imports in Yemen are over 35% of GDP, currency depreciations canhave an important inflationary impact. Under the current exchange rate regime inYemen supply shocks emanating from oil price fluctuations and expectations regard-ing the future sustainability of oil exports can exert important influences on theexchange rate, thus creating another potential supply-side inflationary pressure point.
Figure 6.8: World and Yemeni food price indices, 1997-2003 (in YRs)
Notes: Both indices are Yemeni Rials.
Sources: IFS, IMF, April 2005 for exchange rate and the World Index, and IMF, 2004 for Yemen
CPI.
Figure 6.9: Currency depreciation and inflation, 1997-2003
Sources: ibid
Figure 6.9 shows the relationship between currency depreciation and inflation. Twodistinct sub-periods can be distinguished. During the first, 1977-2000, there is a closeassociation between currency depreciation and inflation. In this period the centralbank’s interventions in the currency market were limited.35 Following the negative oilprice shocks of 1998-99, the rate of depreciation of the Rial increased sharply, but fol-lowing the rapid increase in oil prices from the last quarter of 1999, it declined to 4%in 2000. These fluctuations indicate Yemen’s vulnerability to oil-price shocks under a
77
Chapter Six: Macroeconomic policy, inflation and growth: interlinkages between fiscal, monetary and exchange-rate policies
80
90
100
110
120
130
140
150
160
1997 1998 1999 2000 2001 2002 2003
Yemen Food CPI
1999
= 1
00
World Food Price Index
0
4
8
12
16
1997 1998 1999 2000 2001 2002 2003
Inflation rate (cpi) Currency Depreciation
Perc
enta
ge c
hang
e
35 The increase in benchmark interest rates from 11 per cent in 1997 to 18 per cent in 1999 may have been anattempt by the central bank to reign in exchange rate depreciations. This policy, however, had a dramatic and neg-ative effect on private investment without reducing the pressure on the exchange rate and inflation. It was not beforethe oil price increases of late 1999 and 2000 that exchange rate depreciation was moderated.

free-floating exchange rate regime. As discussed above, price inflation during the1997-99 period was driven mainly by the removal of subsidies and the severe droughtin 1999. The sharp decline in international food prices in this period helped to damp-en inflationary pressures.36 With the end of the drought in 2000, and the slowdownin the rate of depreciation of the Rial, the inflation rate fell.
During the second sub-period, since 2000, there have been some dramatic changes.The central bank has managed to keep the rate of currency depreciation at around 4%to 5% a year, while annual inflation has hovered at around 10% – leading to a realappreciation of the exchange rate. This may convey the impression that the economyhas been suffering from the Dutch Disease, but this is not supported by the evidence,for it does not tally with the rising unemployment and underemployment of labour inthis period. Though data on private-sector wages are not available, the trends in pub-lic-sector real wages and salaries and investment trends shown in Figure 6.10 do notsupport the booming-sector syndrome.37 Furthermore, the revaluation of the realexchange rate in this period was not the result of the free interplay of market forcesbut due to heavy interventions by the central bank in the currency markets, with sub-stantial foreign-exchange reserve losses. The explanation for the divergent paths ofinflation and currency depreciation in this period is more nuanced than the DutchDisease story would have it.
As noted above, the main source of price inflation in the economy since 2000 has beenaccelerating inflation in food prices, excluding cereals. The increase in cereals priceswas in line with the increase in international prices, where wheat prices increased byover 30% between 2000 and 2003 in major international markets. Given that about80% of cereals consumption in Yemen is imported, this was bound to dominatedomestic price inflation. The price of imported wheat in the main cities such as Sana’aand Aden increased by over 40% over this period, which is in line with what can beexpected given the depreciation of around 10% in the value of the Rial. With the endof food price subsidies, domestic prices of those food items where imports are signifi-cant, notably cereals, have become closely linked to the international prices and theRial’s exchange rate movements. But the really high rates of inflation affect commodi-ties where the main source of supply is domestic production, thus reflecting the impor-tance of supply constraints resulting from low investment in the agricultural sector andthe continued sensitivity of the sector to climatic conditions.
78
Chapter Six: Macroeconomic policy, inflation and growth: interlinkages between fiscal, monetary and exchange-rate policies
36 Between 1996 and 2000 the international food price index (denominated in dollars) fell by about 28 per cent).Average prices of wheat and sugar, the main food import items in Yemen, fell by 42% and 32% respectively in theinternational market during the same period.37 There is plenty of other evidence against the Dutch Disease hypothesis. For example, the rate of increase in theGDP deflator in the construction sector, which has a high domestic wage component, was only 14% between 2000and 2003. Similarly, the increase in the price index of ‘services for maintenance and repairs’ component of CPIincreased by no more than 12% over the same period. These compare with much higher price increases for the trad-ed goods sectors.

Figure 6.10: Real exchange rate, real wages, and investment rate, 1999-2003
Notes: Real Exchange rate is the currency rate deflated by CPI. Increase means appreciation. Real
wages refer to average wage and salary rates of public sector employees.
Source: IFS, IMF, April 2005, and CSO.
Under these circumstances, the apparent overvaluation of the currency vis-à-vispotentially exportable goods cannot be easily remedied by a devaluation of the nomi-nal exchange rate. In a country with generalized poverty large depreciations of thenominal exchange rate, in a situation of rising international food prices, would havebecome intolerable. The root of this problem is the extremely low levels of labour pro-ductivity in both the food producing sectors and the potentially exportable sectors. Asa consequence, at even low wages bordering on poverty wages, the tradable goods sec-tors remain uncompetitive because of the low productivity of labour – of course withthe exception of natural resource-based export enclaves such as oil. In other words,under the current conditions of extremely low labour productivity and rising interna-tional food prices, there may be no real exchange rate that can maintain the competi-tiveness of the non-oil, traded goods sectors without pushing real wages way belowpoverty wages and intensifying mass poverty. As can be seen from Figure 6.11, thetrends in non-oil value-added per person of working age indicate that in terms of pro-ductivity growth the economy is moving in the right direction.
Since 2000 this seems to have posed a dilemma for policy makers who have been try-ing to avoid a gradual overvaluation of the currency while keeping inflation at bay.The CBY’s half-hearted solution appears to have been to keep the rate of deprecia-tion of Rial at moderate levels of about 4% to 5% a year. This is a costly policy. It doesnot serve the cause of low inflation – given supply constraint induced by substantialprice rises for food items where imports are insignificant, such as vegetables and fruits.Nor does it address the issue of the gradual overvaluation of the exchange rate. In addi-tion it has cost valuable foreign exchange reserves. As noted above, during the 2002-03 period alone the CBY sold over $1.1 billion to banks and moneychangers in tryingto support the exchange rate. There are a number of more efficient and sensible solu-tions to this policy dilemma in the short to medium term, though the long-term solu-tion is certainly to lift investment and productivity growth.
79
Chapter Six: Macroeconomic policy, inflation and growth: interlinkages between fiscal, monetary and exchange-rate policies
60
70
80
90
100
110
1999 2000 2001 2002 2003
Real Exchange Rate Investment Rate Real Wages
1998=
100

Figure 6.11: Non-oil GDP per person of working-age, 1998-2003, $ con-stant 2000
Notes: Non-oil GDP measures the sum of agriculture, manufacturing and services only. Working age
only. Working age population is population aged 15 to 65
Source: WDI, World Bank 2005, and IFS, IMF April 2005.
One solution in the short term is for the government to use part of its oil windfalls tobuild up buffer stocks of imported food and essential items to stabilize prices. Foodsubsidies of this type, which should be kept to the narrow range of food grains main-ly consumed by the workers, can free the central bank to pursue more flexibleexchange rate management without being concerned about the inflationary effects ofdevaluations on the poor.
Another solution would be to introduce food subsidies in the form of food stampswhich can shield the poor from price increases. The food-stamp solution is adminis-tratively more cumbersome, but it has the advantage over the price-stabilization solu-tion in that it prevents domestic relative prices from diverging from internationalprices. On the other hand the food-stamp solution does not solve the problem of theprice instability facing domestic producers, which can be particularly damaging toinvestment in the agricultural sector. These short- to medium-term measures, howev-er, cannot be relied upon. The only lasting solution is capital accumulation andimproved productivity of land and labour.
6.4.4 Macroeconomic policy, savings, investment and pro-poor growth
Under these circumstances using monetary policy for price stability through demandmanagement will result in a larger decline in investment and employment and hence willworsen poverty. This is reflected in interest rates which are higher in Yemen than inmost Arab countries even when inflation rates are taken into account, though the realrates of interest were reduced substantially in 2005 in the face of rising inflation. This hascertainly adversely affected businesses. Private investment plummeted from its peak ofover 22% of gross disposable income in 1998 to below 7% in 2000 following a 7 per-centage point rise in the lending rate during the 1998-99 period (Figure 6.12). Of par-ticular concern is that private investment rates have continued their downward trend andif investment by foreign oil companies is excluded the decline would be even sharper.
80
Chapter Six: Macroeconomic policy, inflation and growth: interlinkages between fiscal, monetary and exchange-rate policies
580
590
600
610
2000 2001 2002 2003

Figure 6.12: Private and public gross fixed capital formation as a share ofnational disposable income, 1995-2003
Notes: Private investment includes foreign oil company investment.
Sources: Based on IFS, IMF, April 2005, and IMF 2004.
The higher interest rates are the result of tighter monetary policy as part of the adjust-ment package which, amongst other things, is aimed at reducing inflation. While infla-tion certainly needed to be brought down, insisting on reducing it to less than the cur-rent moderate levels for imported food and non-food inflation is damaging for the realsectors of the economy, causing a stabilization trap. Though food inflation, which isharmful to the poor, certainly needs to be brought down, monetary policy aimed atcontaining demand is not the appropriate policy. To the contrary, the way forward inthe long run is greater investment aimed at breaking the food-supply bottleneck. TheWorld Bank (2002, p 37) also reports that one factor contributing to the sluggishgrowth of the manufacturing sector during the period 1995-2000 was the tight growthof money and credit associated with the stabilization programme.
The employment impact of the stabilization programme has important implications forpoverty reduction. The National Poverty Survey (CSO, 1999) shows that employmentis a major source of the poor’s income, nationally accounting for 35% of the total (see,Table 6.2). The figure is 47% in urban and 31% in rural areas. For the middle class,employment generates nearly 30% of their income as opposed to only 22% for the rich.For the middle class in the rural areas, the share of employment income is 43%. Fromthe point of view of poverty reduction the stabilization programme should strike a bal-ance between price and output stabilization. As noted earlier, attempts to attain pricestability through a high interest-rate policy has adversely affected private investment.Those who lost jobs during the phase of stabilization may have joined the ranks of thelong-term unemployed and increased structural poverty.
Monetary policy designed to handle overall inflation is not the best way of dealing withinflation of specific items that are used by the poor. One may argue that if overallinflation falls even when prices of some items in the CPI rise, people should be betteroff, since they can save on those items whose prices are falling. However, the net effectof this depends on the relative shares of these items in total expenditure, and their priceelasticity.
81
Chapter Six: Macroeconomic policy, inflation and growth: interlinkages between fiscal, monetary and exchange-rate policies
0
5
10
15
20
25
30
1995 1996 1997 1998 1999 2000 2001 2002 2003 2004
Total GFDC Public Sector Private Sector
Per
cen
t

When the poor are spending nearly 64% of their budget on food, for which price elas-ticity is low they are likely to be net losers even when prices of other items fall. Thepoor have thus been negatively affected in two ways; first due to rising food prices; andsecondly as a result of the decline in investment and employment opportunities.
Table 6.2: Sources of income of the poor, the middle class and the rich (%)
URBAN RURAL NATIONAL
Income source Middle Middle Middle
of the householdPoor Class Rich Total Poor Class Rich Total Poor Class Rich Total
Employment 47 43 32 37 31 23 13 21 35 29 22 27
Private Business 32 33 42 38 35 39 43 40 34 37 43 39
Interests of Bank
Deposits 0 2 2 2 0 0 0 0 0 1 1 1
Remittances 13 10 10 11 11 10 14 11 11 10 12 11
Other Sources 8 14 16 15 24 28 30 28 20 23 23 23
Total 100 100 100 100 100 100 100 100 100 100 100 100
Notes: Poor = bottom 40%, Middle Class = middle 40%, Rich = top 20%
Source: National Poverty Survey, CSO 1999
This is consistent with estimates which suggest that the headcount measure of extremepoverty, defined as those with inadequate food, increased from 17% to 27% between2001 and 2004 (A-Shami 2004). Another indicator is the trend in calorie intake peradult shown in Figure 6.13 which, combined with the likely deterioration in incomedistribution over this period, suggests increases in the extent and intensity of incomepoverty since 1998.
Another mechanism through which high interest rates were meant to stimulate theeconomy was through generating higher savings rates. Theoretically, the effect ofhigher interest rates on savings is ambiguous, as the income effect of higher interestincome can be neutralized by its substitution effect, though in countries with general-ized poverty the income effect is likely to be dominant. There is also little empiricalevidence of a positive relationship between interest rates and savings. In the case ofYemen too, clearly the high benchmark savings interest rate – a key monetary policyinstrument – has failed to encourage households to save more.
Figure 6.13: Calorie intake per adult (15+ age group, 1995 = 100)
Sources: FAOSTAT, FAO 2005, and WDI, World Bank 2005.
82
Chapter Six: Macroeconomic policy, inflation and growth: interlinkages between fiscal, monetary and exchange-rate policies
86
88
90
92
94
96
98
100
102
1995 1996 1997 1998 1999 2000 2001 2002

As shown in Figure 6.14, though there has been a greater savings effort by the govern-ment since 1995, there was a precipitous decline in private savings after 1999. Caremust, however, be taken when interpreting the private savings rates shown in Figure6.14, as these are measured as the residual between government savings and totalnational savings, with the latter itself measured as a residual in national accounts. Theoverall trends however are unmistakable.
Figure 6.14: Government, private, and national savings as a percentage ofnational disposable income, 1995-2003
Notes: National disposable income includes current transfers (mainly remittance income) from abroad.
The data are two-year moving averages.
Sources: Based on IMF, IFS April 2005 and IMF 2004.
The decline in the savings rate in a moderately growing economy highlights the dom-inance of current income and liquidity constraint in consumption decisions, notuncommon in countries suffering from mass or generalized poverty. That is, anyincrease in current income goes to consumption and debt repayments. This results ina higher marginal propensity to consume and makes consumption expenditure pro-cyclical. As a result, the effects of any exogenous shock on employment and povertyare exacerbated in the absence of active demand management policies.
The decline in the savings rates, however, has not been the cause of declining invest-ment in Yemen. The rate of decline in domestic investment has by far outpaced thefall in national savings rates since 1999. As shown in Figure 6.15, the precipitousdecline in the rate of investment since 1999 has resulted in rapid build up of netnational savings surpluses. As noted earlier, this has partly taken the form of a hugebuild up of foreign exchange reserves in the central bank, and increasingly the form ofinvestments by commercial banks abroad.
Net foreign assets of commercial banks in 2002-03 stood at around 8 per cent of GDP.Figure 6.15 provides a part of the answer to the question posed in Chapter 1 regard-ing the utilization of the domestic resources available for development and investment(DRDI) during the post economic reform period. Since 1998, a large part of theDRDI has been used to finance investments in other countries. It is rather curious that
83
Chapter Six: Macroeconomic policy, inflation and growth: interlinkages between fiscal, monetary and exchange-rate policies
-10
0
10
20
30
1994 1995 1996 1997 1998 1999 2000 2001 2002 2003 2004
Government Private National Savings
Per
cen
t

a country where unemployment is rising, underemployment of labour is prevalent, andthe number of the poor is increasing, has been financing capital accumulation in othercountries.
Figure 6.15: Savings and investment as a percentage of national disposableincome, 1995-2003
National disposable income includes current transfers (mainly remittance income) from abroad
Source: IFS, April 2005, IMF and IMF 2004
To sum up, though the stabilization programme has been successful in bringing downinflation, particularly in imported food and non-food items, it seems that lower infla-tion has not yielded dividends of higher savings and investment to propel the econo-my into a phase of rapid growth. As a result, the unemployment rate is projected toincrease from 11.5% in 1999 to about 17 % in 2006. Among the young (15 to 24 yearsold) more than 29% are unemployed (ILO, 2004, p. 34).
Among the factors that inhibit the private sector and employment creation are highinterest rates or cost of finance. Thus, insisting on reducing non-food inflation furtherwill be counter-productive. Under these circumstances monetary policy should sup-port well-coordinated specialized credit programmes to enhance investment in pro-ductivity- and employment-enhancing growth that would have a significant impact onpoverty reduction. Given that the main component of inflation in the CPI is food-price inflation, largely resulting from domestic supply constraints, this type of invest-ment-enhancing credit expansion, if well directed, can help reduce inflationary pres-sures.
However, under the current foreign exchange regime, the CBY may feel constrainedin lowering the interest rates and facilitating the expansion of credit to private investorsfor fear of capital flight and exchange-rate instability. This assessment may have beenreinforced by the reality of net capital flows. Therefore, capital-account opening seemsto have removed the monetary authority’s flexibility to pursue an independent mone-tary policy that a flexible exchange rate regime was supposed to provide. At the sametime, capital account opening has failed to attract large quantities of portfolio invest-ment, despite Yemen having higher interest rates than other Arab countries.
84
Chapter Six: Macroeconomic policy, inflation and growth: interlinkages between fiscal, monetary and exchange-rate policies
10
15
20
25
30
35
40
1995 1996 1997 1998 1999 2000 2001 2002 2003 2004
Investment National Savings
Per
cent

85
Chapter Six: Macroeconomic policy, inflation and growth: interlinkages between fiscal, monetary and exchange-rate policies
Under these circumstances policy advisors may be tempted to advocate further increas-es in interest rates in order to stem the tide of capital flight and reduce pressure on theexchange rate. For a number of reasons, however, this type of policy will be damag-ing and is unlikely to reduce pressures on the exchange rate and turn the tide of capi-tal flights. The experience of Yemen indicates that such interest rate increases are like-ly to have a more vigorous effect in reducing investment, and business activity in gen-
Box 6.1: Financial sector reform and financial crisis
Many developing countries have experienced financial crises following the introduction of financial
reform programmes in the mid-1970s (see World Bank, 1989; Capiro and Kliengebiel, 1996 and
Lindgren et al,1996). Thus, there seems to have been a close relationship between financial liberal-
ization and financial crisis. Financial liberalization reform may increase the degree of fragility of
financial and non-financial firms and set the stage for a financial crisis through the following chan-
nels:
■ Financial liberalization reform may lead to excessive risk-taking by financial institutions by increas-
ing freedom of entry into the financial sector and freedom to bid for funds through both interest
rates and new financial instruments – unless such a freedom is tempered with regulation and pru-
dential supervision. The lack of effective prudential regulation and supervision is often one major
cause of financial crisis.
■ An implicit or explicit guarantee of government bailout of deposits and bankers may also encour-
age unsound lending patterns and trigger excessive risk-taking by financial institutions following
financial deregulation.
■ The liberalized structure may lead to a concentration of market power through interlocking own-
ership and lending patterns. Such a financial structure may create market failures because of moral
hazard, adverse risk selection and oligopolistic pricing.
■ Interest rate deregulation results in an excessive rise in interest rates, especially when euphoric
expectations generate an artificial demand for credit. This may have a number of adverse effects.
First, it raises the prospect of market failure as high interest rates attract risky borrowers. Second, it
may affect banks and other financial institutions if they have large exposures to long-term assets at
fixed interest rates funded by short-term liabilities. Third, it may lead to distress borrowing by firms
with high debt-equity ratios.
■ If interest rates above certain levels are considered risky due to adverse selection then financial
institutions may want hold interest rates down and ration credit. Credit rationing can cause bank-
ruptcies of firms which in turn may affect banks.
■ The monetary authority may either lack adequate and effective instruments of monetary control
to influence the interest rates or follow a hands-off policy in the belief that domestic interest rates
will automatically converge to foreign interest rates through arbitrage.
■ If the capital account is liberalized at the same time, the high domestic interest rates may attract
short-term foreign capital which increases the risk of sudden reverse flows and financial crisis.
■ An open economy with a fixed exchange rate system and a liberalized capital account faces the
‘impossible trinity’. That is, it cannot simultaneously control money supply, maintain a fixed
exchange rate and at the same time encourage capital flows. It generates expectations of devaluation
and hence speculative attacks on domestic currency.

eral, than in attracting portfolio investment from abroad. Furthermore, under the cur-rent projections about the exhaustion of oil reserves, adverse expectations regarding thesustainability of the exchange rate at its current levels are too strong to be neutralizedby moderate interest-rate increases. When high interest rates are sustained not on thebasis of return on investment in real assets, but rather on the basis of lending to thegovernment or buying central bank CDs or investing abroad, this type of policy in theface of declining oil revenues will not be credible.
The central bank has so far wisely resisted further interest-rate hikes, but its attemptsto restrain exchange-rate devaluations under the current foreign exchange regime havebeen at the expense of rapidly losing valuable foreign exchange reserves to speculators.Under these circumstances the appropriate option is to impose restrictions on capital-account convertibility and particularly to restrict commercial banks from investingabroad. This is an important requirement for improving the effectiveness of fiscal andmonetary policies in bringing about high investment and growth in the domestic econ-omy, and at the same time reducing cost-push inflationary pressure. Arguments are alsopresented in Annex IV, with strong theoretical and historical evidence against capital-account liberalization.
6.5 Policy recommendations
Current fiscal, monetary and exchange-rate policies are in urgent need of rethinkingand reform. The urgency arises from the secular decline in private-sector savings andinvestment, rising unemployment and underemployment of labour, and stagnantlabour productivity. In recent years these trends, combined with high rates of food-price inflation have increased the number of the poor and the intensity of incomepoverty.
Low investment rates reflect inadequate economic, and particularly macro-economic,policies, for it is clear that the economy could absorb large amounts of new investmentwithout causing runaway inflation. The high interest-rate policy of the central bankhas failed to stimulate savings and has contributed to the dramatic decline in privateinvestment.
Instead, a two-pronged approach is needed. In the short run the government shouldadopt a food price stabilization programme to temporarily de-link food price inflationfrom international prices. This will free the central bank to adopt a more flexibleapproach to exchange-rate management.
The long run solution, however, is to adopt measures to increase investment in phys-ical and human capital, enhance productive capacities and raise the productivity oflabour in the economy, and particularly in the agricultural sector. For this purpose thecentral bank should use its foreign-exchange reserves to set up specialized investmentfunding agencies to help increase private-sector investment in productive activities.The boost in private investment and employment, and improved productivity wouldalso help reduce income poverty.
86
Chapter Six: Macroeconomic policy, inflation and growth: interlinkages between fiscal, monetary and exchange-rate policies

87
Chapter Six: Macroeconomic policy, inflation and growth: interlinkages between fiscal, monetary and exchange-rate policies
However, under the current foreign-exchange regime, the central bank may feel con-strained in lowering the interest rates and facilitating expansion of credit to privateinvestors for fear of capital flights and exchange rate instability. Under these circum-stances the appropriate option is to impose restrictions on capital-account convertibil-ity and particularly to restrict commercial banks from investing abroad.
It will also be important for both for economic stability and growth to ensure coordi-nation between fiscal and monetary policies. Thus the government should take a sta-ble and long-term fiscal stand that is based on the five year plans and is not dominat-ed by the fluctuations in oil revenues. This will entail a more accommodating mone-tary policy that does not exacerbate liquidity constraints when the oil prices are low.This also requires a similar long-term perspective on the part of the international donoragencies.
Most important of all, the government will need to implement the fiscal reforms dis-cussed in chapter 2, and make a greater effort to encourage savings and investment.The recent acceleration in the rate of inflation in the aftermath of oil price hikes since1995 indicates that the problem of a lack of coordination between fiscal and monetarypolicies has yet to be resolved.

7.1 Introduction
Over the period 1995 to 2003 the rate of economic growth was moderate – about 5%per year (Roberts 2004). But because of rapid population growth the rate of growthof income per person has been much lower – 1.5%. Much of this growth has beenpowered by the increase in oil production, which now accounts for about one-thirdof GDP, though the growth has not been broad-based.
One result of narrowly-based growth is the lack of employment creation. Yemen iscaught in a vice – between slow economic growth and rapid growth in the populationand especially of the labour force. New workers find few opportunities for remunera-tive employment so remain unemployed or displace older workers. And if they can-not find formal-sector jobs, public or private, they opt for low paying and irregularinformal-sector employment. Compounding the problem is the fact that to counteractdeclines in real household income many more women have been joining the labourforce.
In the past, the public sector has accounted for much formal-sector employment butcan no longer provide enough decent-paying jobs for a rapidly growing labour force.Many more jobs will thus need to be created in the private sector. Nevertheless thepublic sector still has to finance the public investment to provide essential social andeconomic services, without which the private sector would languish. The public sec-tor can also help by inducing the banking sector to provide more loans to stimulateproductive private investment.
While Yemen is similar in many ways to other countries in the region, it also has dis-tinct problems. These stem from its low level of development. Yemen is a least devel-oped country, with very low levels of income and human development. Its economyis also undiversified and under-developed – heavily dependent on agriculture, and onoil with a very small manufacturing sector. Yemen must therefore diversify its econo-my and find new sources of growth, not only within manufacturing but also withinagriculture and services. The economy will only be able to generate widespreademployment at decent wages if it can increase output in sectors with higher labour pro-ductivity.
7.2 Trends in the labour force
Yemen’s rapid rate of population growth is exerting tremendous pressure on the labourmarket. At about 3.5% the rate of growth is one of the highest in the world. Between1990 and 2000 the population increased from 12.8 to 18.4 million and the age group15 years of age or younger now accounts for almost half of the population. TheYemeni population will remain disproportionately young for a long time: by 2020 themedian age is projected to increase only to 16.6 years.
89
Chapter SevenStrengthening the employment nexus between growth and poverty reduction
Chapter Seven: Strengthening the employment nexus between growth and poverty reduction

By 2000 the ratio of dependants to workers was approaching an unsustainably highlevel – five to one – which intensifies the need for each person of working age tosecure decent-paying employment.
The employment problem has been compounded by slackening demand for Yemeniworkers in other countries in the region: partly as a result of slower economic growthin these countries, especially in construction; and partly due to competition either fromnationals or from cheaper workers from South Asia. Nevertheless, the number ofYemenis working abroad remains high – estimated at over one million workers in1998 – around about one-quarter of the total Yemeni labour force. They also sendsubstantial remittances, which although falling since the early 1990s, still add up toalmost one-fifth of GDP and are essential to the livelihoods of many households – aswell as for the country’s current-account balance. The fact that these workers have towork abroad is a further indication of the lack of opportunities at home.
Although the economy grew by 5% per annum between 1995 and 2003, labour forceparticipation rates and employment stagnated. If the labour force participation isdefined for the 1999 Labour Force Survey in the same way that it is defined for the1994 Population Census, the rate declines from 45.8% to 44.3% (Table 7.1). This isexplained by the decline in the participation rate of men of working age – from 74.1%to 67.8%. Conversely, the participation rate of women rises from almost 17% to almost21%, largely because of increased participation in rural areas; in urban areas, their par-ticipation rate is still only 10.4%.
These statistics suggest that the average annual growth rate of the labour force is 3.8%– 5.3% for women and 3.3% for men – so it appears that while many women havebeen joining the labour force some men have been dropping out. The trends forlabour-force participation are mirrored by those for employment: between 1994 and1999, the ratio of the employed to the working age population edged down from 42%to 40.6% (Table 7.1). Since population censuses tend to underestimate employment,the drop during these years was probably sharper.
Table 7.1: Labour force participation, 1994-99 (%)
Labour force participation Rate Population census Labour force survey
1994 1999
Total 45.8 44.3
Male 74.1 67.8
Female 16.9 20.9
Employment-population ratio
Total 42.0 40.6
Male 67.2 61.2
Female 16.2 20.0
Sources: Mehran 2004c, based on the 1994 Population Census and 1999 Labour Force Survey
So while the economy was growing, this growth was not being translated into decent-paying employment, and certainly not for male workers. The employment-population
90
Chapter Seven: Strengthening the employment nexus between growth and poverty reduction

ratio for men dropped from 67.2% to 61.2% while that for women rose from 16.2%to 20.0%. Women were finding jobs, but doing so primarily to offset the loss ofincome due to male unemployment or underemployment; and they usually securedlow paying or unpaid jobs, typically in agriculture.
The only males for whom the employment-population ratio rose between 1994 and1999 were those 15 and 19 years of age (Mehran 2001). For those aged 45 years andolder, however, the decline was severe – particularly for those aged 55-59 and worsestill for those aged 60-64. As job creation stagnated, older workers found themselvesat a distinct disadvantage in the labour market. Among women too the younger work-ers did better, the employment-population ratio increased most dramatically amongthose aged 25-49 years and particularly among those 35-49 years; for women 50 yearsof age or older, the ratio stagnated or declined.
Between 1994 and 1999, the proportion of the employed earning wages or salariesstayed about the same, at about 41.5% (Mehran 2004c). However, the proportion ofworkers in self-employment declined from 39% to 33% while that for workers inunpaid activities rose from 19% to 25%. Employment opportunities have been expand-ing mainly in small family enterprises, most of which have been in agriculture.
7.3 The structure of employment
The main problem with creating more jobs is the structure of employment. In 1999agriculture still accounted for about 54% of all employment (Table 7.2). Industry isparticularly weak: it accounted for less than 5%, lower even than that for constructionat 6.6%.
More important was transport, accounting for almost 18% and trade, which providedover 12%. The remaining jobs came from other services. Moreover, during 2001-03labour productivity basically stagnated in manufacturing so the economy as a wholefound it difficult to raise productivity and real wages. While value-added per workerwas 210,000 Rials in 2001, for example, it remained the same in 2002 and hadincreased to only 220,000 Rials in 2003.
Table 7.2: Sectoral structure of employment (%)
Sector Total Male Female
Agriculture 54.1 43.1 87.8
Industry 4.6 5.1 2.8
Construction 6.6 8.7 0.2
Trade 12.1 15.5 1.4
Transport 17.7 21.2 7.0
Other Services 19.3 23.1 7.7
Source: Labour Force Survey 1999.
As in many other countries in the Middle East and North Africa, around three-quartersof jobs are held by men. Men are also more likely to be paid: half of the male workers
91
Chapter Seven: Strengthening the employment nexus between growth and poverty reduction

have paid employment compared with only 14% of female workers. Around 43% ofmale workers are still employed in agriculture whereas only about 5% are employed inindustry (Table 7.2). However, almost 88% of female workers are in agriculture.
Part of the explanation for these gender trends is the lack of dynamism in both indus-try and service. Between 1994 and 1999 the proportion of workers employed in thepublic sectors dropped from over 13% to a little under 10%, chiefly affecting men(Mehran 2004c) while the private sector could not create sufficient jobs to compensate.Over this period, the share of employment in services dwindled, from 36.5% to 34.8%,while that in industry stayed virtually the same, at about 11.2%, so agriculture had totake up the slack, boosting its share from 52.2% to 54.1%, often taking in more women.
7.4 Trends in unemployment
The unemployment rate gives limited information on the labour market, particularly forpoor workers, who cannot usually afford to be unemployed for long. It also does notreveal how many discouraged workers have simply dropped out of the labour force. Itdoes, however, provide useful information on employment for more skilled or educat-ed workers, who can usually afford to wait for a job commensurate with their abilities.
Despite a decline in the employment-population ratio between 1994 and 1999, openunemployment remained at about 8.4%. This signifies that many workers were simplydropping out of the formal sector, and thus were not showing up on the employmentrolls. While male unemployment stood at 9.7% in 1999, female unemployment wasmuch lower, at 4.2%.
If, however, the statistics uses a broader definition of unemployment – including peo-ple who are available for work but are not seeking it– then the unemployment rate in1999 rises to 11.5%, with male unemployment rising to 12.5% and female to 8.2%.Unfortunately, these statistics are not comparable to those from the 1994 census andprobably overemphasize unemployment at the expense of underemployment – whichfor poor workers is the more likely situation.
Despite the stability in the overall unemployment rate, the youth unemployment ratedeclined significantly – for workers of 15-24 years falling from 17.9% in 1994 to 12.7%in 1999. This is a hopeful sign and is consistent with the rise in the proportion of theemployed who are educated – with a secondary school education or above – whichrose from 10.6% in 1994 to 15.7% in 1999. Younger workers securing jobs tend to bemore educated than older workers.
If the broader definition of unemployment is used, then the youth unemployment raterises to 18.7%. At the same time, the unemployment rate among educated youth remainshigh, at about 23%. Also, when a somewhat different definition of unemployment isused, the percentage of youth who are inactive – neither in the labour force nor in school– is about one-third. But this is due mainly to an ‘inactivity’ rate of 60% among youngwomen, many of whom are engaged in unrecorded household work. Hence, despitesome improvements, overall employment generation in Yemen remains lacklustre.
92
Chapter Seven: Strengthening the employment nexus between growth and poverty reduction

Projections based on data from the 1999 Labour Force Survey suggest that while,according to a broad definition, the unemployment rate was 11.5% in 1999, and itcould rise to 17.1% in 2006. Civilian employment could reach about 4.4 million work-ers, but with a labour force of 5.3 million (Mehran 2004a) there would be a shortfallof 908,000 jobs. At the same time, while youth unemployment was 18.7% in 1999,under these projections it could balloon to 34%.
If the labour force continues to grow at 3.8% a year – faster than the population – thenjust keeping unemployment steady will mean creating 188,000 jobs every year,121,000 for men and 67,000 for women. (Mehran 2004a based on statistics from theMinistry of Planning).
From another perspective, in order to reduce the unemployment rate by one percent-age point each year between 2004 and 2006, then 22,000 more jobs would need to becreated annually. Added to the 188,000 jobs needed every year to keep unemploymentconstant, this would require 210,000 new jobs every year – far beyond the currentcapacity of the Yemeni economy.
7.5 The demand for labour
Based on 2002-03 trends, labour demand is currently increasing by about 117,000 paidjobs per year – 2.8% – implying an excess supply of labour of 71,000 every year(Mehran 2004a). Since the public sector has only a modest capacity to create new jobsthese will have to come from the private sector.
The Labour Demand Survey of 2002-03 gives us an initial picture of the private sec-tor’s capacity. It indicates that establishments account for only about 18% of total civil-ian employment, while government employment accounts roughly for another 20%,and agriculture 50%. Most other workers are self-employed or in casual employmentin non-agricultural activities.
Much of the employment in establishments is also self-employment or unpaid work –only 37% of the total. Also, establishments account, as a whole, for a modest share oftotal employment.
Moreover, the birth rate of such establishments is low. Only about 4% of all establish-ments are new each year (Mehran 2004a) and they are invariably micro enterprises,providing employment mostly for owner-managers and secondarily for unpaid mem-bers of the manager’s household. For every 100 new establishments there are only 2.5new paid employees. Despite donor romanticism about micro enterprises, they do notby themselves offer a viable employment solution.
During the period of coverage of the Labour Demand Survey (April 2002 – May2003), the private sector created 19,379 paid jobs. However, half of these werereplacement jobs and 37,272 paid jobs were eliminated – so in fact there was a netdecline of 17,893 – 5.7%.
93
Chapter Seven: Strengthening the employment nexus between growth and poverty reduction

The largest losses were in trade (-12,836), manufacturing (-1,907) and hotels andrestaurants (-513) (Table 7.3). Manufacturing and trade are the largest sources of paidemployment, so if paid employment is to expand manufacturing and trade have toflourish.
The only sectors showing net gains in paid employment were education (+448), farm-ing (+256) and mining (+129).
Table 7.3: Gains and losses in paid jobs by economic sector
Sector Paid employees Net change Percentage
of jobs Change
Farming 5,786 +256 4.4
Mining 10,348 +129 1.2
Manufacturing 96,385 -1,907 -2.0
Trade 69,359 -12,863 -18.5
Hotels/Restaurants 25,786 -513 -2.0
Transport 7,767 -110 -1.4
Education 9,637 +448 4.6
Health 11,119 -110 -1.0
Personal Services 9,192 -201 -2.2
Source: Mehran 2004a based on the Labour Demand Survey 2002-2003 (CSO and LMIS). Note: Only
sectors with more than 5,000 paid employees are included in this table.
If the data on employment trends from the Labour Demand Survey are accurate, thenthe widespread belief that micro-enterprises (defined as employing 1-4 workers) andsmall enterprises (5-9 workers) are the primary engines of job creation in Yemen isfalse. During the survey period, both micro- and small enterprises recorded net joblosses whereas medium-sized enterprises (10-19 workers) and large enterprises (20+workers) both recorded net gains (Table 7.4).
Micro-enterprises do account for a substantial number of paid employees – over88,000 – but they experienced the largest net job losses of -17,379 (Table 7.4). At theother end of the scale, large enterprises account for the biggest number of paid employ-ees, almost 108,000, and scored the biggest net job gains, 2,832. In micro- enterprisespaid employment plummeted by almost 20% and in small enterprises by 2.5%. By con-trast, in medium-sized enterprises, employment rose by over 4%.
Such data, limited and superficial though they are, suggest that medium-sized and largeenterprises are likely to have the most potential to generate employment. In additionthey are likely to offer decent pay. Micro- and small enterprises, on the other hand,are much more likely to provide ‘poverty-reproducing’ wages. As one indication,around two-thirds of educated employees (with a university degree or specializedvocational training) are employed by large firms, and their wages are 20% above theaverage for all educated employees. In small and medium enterprises, educated work-ers receive wages that are two-thirds of the average, while in micro-enterprises theyreceive wages that are 56% of the average.
94
Chapter Seven: Strengthening the employment nexus between growth and poverty reduction

Table 7.4: Gains and losses in paid jobs by establishment size
Size of firm Paid employees Net change Percentage
change
1-4 workers 88,384 -17,379 -19.7
5-9 workers 38,913 -981 -2.5
10-19 workers 22,813 927 4.1
20+ workers 107,798 2,832 2.6
Total 257,908 -14,601 -5.7
Source: Mehran (2004) based on the Labour Demand Survey 2002-2003 (CSO and LMIS).
Box 7.1: Main results and recommendations of the Labour Demand Survey, 2003
Overall, the results of the Labour Demand Survey seem to indicate that job creation in existing
establishments is not likely to make a major dent in satisfying the 188,000 new jobs required per
year to meet the annual net increase of the labour force from 2004 to 2006. An implication of this
result is that the employment problem in Yemen should be addressed not only in terms of job
growth in existing establishments, but also in terms of employment generation through enterprise
creation and this on a massive scale. The survey results also point to a need to widen and strength-
en not only the vocational training programmes and specialized university education, but also the
development of managerial and administrative skills through special training programmes, as these
are among the areas of skill shortages and skill gaps most reported by establishments, and perceived
as sources of mismatch between education and occupation by graduate employees.
The major factor of production of an economy is its supply of labour. On the demand side, the
determining factors are the number of jobs, the average number of hours paid per job, and the
level of real output per hour. Estimates show that in Yemen the labour force has been growing
faster (3.8%) than labour demand (2.8%) in the past few years. The fast growth of the work force
reflects mainly the effect of past high birth rates, the return of migrants from neighbouring coun-
tries after the first Gulf war, and the increasing readiness in recent years of Yemeni women to
enter the labour market. The relatively slow growth of labour demand, on the other hand,
reflects the limited job opportunities in the private sector and the saturation of the government
as an employer of last resort.
If no major efforts in job creation and job improvement are made and current trends continue,
the unemployment rate is projected to increase from 11.5% in 1999 to about 17 % in 2006, and
more than 29% among the young (15 to 24 years old).The challenge ahead is thus enormous: not
only are jobs required to meet the new entrants in the labour market every year, but also to
decrease unemployment, many of them young graduates, and increasingly women. There is in
addition the need to improve the nature of the existing jobs, particularly, in terms of their wages
and productivity. Estimates show that:
■ 188,000 new jobs are required per year to meet the annual net increase in labour force from
2004 to 2006;
■ 22,000 jobs are required to decrease the current unemployment rate by 1percentage point per
year during the same period; and
■ 43,000 existing jobs need to be improved annually in terms of wages and productivity to
decrease the number of low pay workers by 1 percentage point per year.
95
Chapter Seven: Strengthening the employment nexus between growth and poverty reduction

Total employment in Yemen may be broadly divided into four sectors: subsistence and small-
holding agriculture (about 50%), government including public administration, public education
and health (about 20%), establishments sector, both private and public (about 18%), and the
remaining non-establishment employment (12%) including casual workers in construction, and
taxi-drivers and other self-employed workers in transport and allied activities.
The Labour Demand Survey of establishments shows that job performance in 2002-2003 in this
sector has been bleak. While little is known about closure of establishments, the data show that
creation of new establishments has been minimal. In existing establishments, paid employment
has actually decreased by about 18,000, representing a net job loss of about 5.7%. Most of the
losses were in trade and manufacturing. Branches of economic activity that recorded relative
employment gains were education, farming, fishing, mining, electricity, gas and water, financial
and real estate services, and, generally, the medium and larger establishments.
Fortunately, future job prospects in 2004-06 appear to be brighter. The expected number of net
new hiring is about 14,800 per year, representing an annual growth rate of 5.4% in labour
demand in the establishment sector, significantly higher than the estimated growth rate of 2.8%
for the economy as a whole. Nevertheless, this optimistic view of the establishment sector would
fall short of satisfying job requirements in the next three years. The establishment sector can at
best satisfy 10% of the excess of supply of labour in 200406. The bulk of reported new hiring is
in trade and manufacturing, education, health and personal services.
In terms of recruitment of women, only 4.4% of establishment reported priority to female employ-
ment. The high unemployment rate among educated women and the cultural situation regarding
female employment in Yemen confirm the survey results, indicating that the branches of econom-
ic activity with better prospects for promoting female employment are not only the traditional edu-
cation and health sectors, but also the large financial, real estate, and communications firms, where
educated women may be employed in culturally acceptable occupations involving minimum direct
public contact.
A large fraction of the establishments (93%) reported difficulties in filling their vacancies. The main
obstacle was skill shortages, i.e., the unavailability of skilled labour to fill the vacancies (85%). Other
obstacles were the limited funds of establishments for hiring new labour or the refusal of the terms
of contract by the worker, for example, when the establishment wanted to hire for a part-time job,
but the worker wanted a full-time job. The specific skill difficulties in hiring new employees were
“lack of leadership” or “management skills” followed by “insufficiency in foreign languages”, “lack
of computer skills” and “ignorance of use of equipment”. In addition to skill shortages, establish-
ments reported skill gaps, i.e., the inadequate skill level of existing employees. The total number of
workers in need of training was reported to be 42,000, representing about 16.4% of total employ-
ment covered by the survey. The training needs differed from one occupation to another, and a list
has been drawn up in this report on the main types of training needs in each occupational catego-
ry involving more than 10% of the workers.
Another aspect of skill gap is the mismatch between education and occupation as perceived by
the employees. About 17.7% of the graduate employees, men and women, believed that their
qualification and specialization did not correspond to the job requirements of their current occu-
96
Chapter Seven: Strengthening the employment nexus between growth and poverty reduction

pation, and another 18.7% thought it had only a mild connection. Graduate employees with spe-
cialization in targeted fields such as navigation sciences, medicine and pharmacy, commerce,
engineering and applied sciences and vocational training, reported relatively low levels of mis-
match while those specialised in human and social sciences or theoretical sciences such as pure
physics and biology indicated higher rates of mismatch with respect to their occupation.
Source: An Analysis of the Results of the Labour Demand Survey of Establishments in Yemen, 2002-
2003, Report by F. Mehran, Statistical Development and Analysis, Policy Integration Department, ILO
7.5.1 Micro- and small enterprises
Although various surveys have investigated micro-, small and medium-sized enterpris-es (MSMEs), their results are difficult to compare because they utilize different defini-tions of establishment size. These surveys invariably find that micro- and small enter-prises employ most labour. But most of this is self-employment (i.e., owner-workers).Within micro-enterprises employing 1-4 workers, 61% employ only one worker andanother 20% employ only two. Moreover, within small enterprises employing 5-9workers, 44% of the jobs are in firms with 5 workers and another 25% are in firms with6 workers. If micro- and small firms are lumped together, those employing only oneworker account for 59% of all jobs and those employing only two workers account foranother 19%. So firms in Yemen are on average very small.
While micro-, small and medium enterprises account for much of the employment inYemen, their aggregate contribution to GDP is small. One estimate ascribes to themabout 7% of GDP (ILO 2004 based on the MSE Baseline Survey). Since the contribu-tion of MSMEs is far lower than their contribution to employment, their level oflabour productivity is pitifully small. Most workers in such firms are uneducated andunskilled. Hence, while more vibrant growth among these enterprises might help toreduce poverty, the overall effect is not likely to be pronounced since incomes in suchenterprises tend to be low.
The exception is likely to be medium-sized firms, which public policy often neglects.Government policies are often biased towards large enterprises while poverty reduc-tion strategies often focus on micro- and small enterprises. In order to correct thesebiases, the government should develop a more comprehensive economic strategy thatcan integrate the contributions of micro-, small, medium-sized and large enterprises.
The GoY can do more to create a conducive business environment that can allowmicro- and small enterprises to flourish. But if its medium-term objective is to gener-ate widespread employment at poverty-reducing wages, then it must also find ways toencourage growth among medium-sized and large enterprises. In manufacturing,medium-sized enterprises tend to be concentrated among such sub- sectors as paperand printing, and machines and equipment. Large firms are concentrated in such sub-sectors as chemicals and plastics, and oil refining. While medium-sized firms accountfor 7% of total manufacturing employment, large firms account for 36% (ILO 2004,pp. 38-39).
97
Chapter Seven: Strengthening the employment nexus between growth and poverty reduction

Some of the main problems confronting micro-, small and medium-sized enterprisesare: stagnation of their product markets; lack of reliable electricity and other econom-ic services; and lack of financial resources (ILO 2004, pp. 47-49). Stagnation is due toa lack of economic growth. The government can contribute to generating moregrowth by reducing excessive regulations and making business taxes more equitable,but it can also play a more direct, pro-active role in providing the public investmentto expand access to economic and social services, such as electricity, water, health andeducation. In addition it can help in expanding access of businesses to financial servic-es or in providing training facilities for developing management skills and supplyingtechnical advice for starting up businesses.
7.5.2 Expected job gains
In addition to determining the scale of net job losses or gains for the period 2002-2003,the Labour Demand Survey also inquired about prospects for losses or gains over 2004-06. Since the results reflect the expectations of establishments, they are obviously lessreliable than their reports on past results. Nonetheless, the results are interesting.
While the establishments report an aggregate net job loss of 5.7% during 2002-03, theyproject a net gain of 5.4% for 2004-06. The biggest absolute gains are expected in trade(18,307) and manufacturing (9,289). Together, these two sectors account for about62% of the total projected increase. The biggest percentage increases are in health(12.4%), personal services (12.0%) and education (8.2%). These three sectors accountfor about one-quarter of the total projected absolute increase in paid employment. Thehotel and restaurant sector and the mining sector projected growth at only a 1-2% rate.
Micro-enterprises are the most optimistic about increases in paid employment: theyproject an increase in net labour demand of 7.3% (about 21,000 jobs). But the mostoptimistic are medium-sized enterprises, which project a net job increase of almost10% (about 7,500 jobs). Large enterprises project a bigger absolute increase in jobs(about 9,400) but a much smaller percentage increase, less than 3%.
In total, establishments project a net increase of 44,468 jobs over the three years 2004-06. This translates into 14,800 new jobs a year. Even if these optimistic projections areconfirmed, the net yearly increase in labour demand of 14,800 would still be muchlower than the net yearly increase of 71,000 that is needed. Unless more dynamicsources of growth and employment generation are identified and then actively pro-moted, unemployment is sure to rise, as is underemployment.
7.6 Trends in hours and wages
One indication of the low-paid nature of much of the employment in Yemen is thatmany workers have to labour in excess of 40 hours a week to obtain subsistence-levelincomes. This is particularly true for male workers. The average for employed malesin their primary jobs is 40 hours a week but over one third of them have to work 48hours or more. – as do 15% of women. Thus, almost 30% of all workers labour 48hours or more38.
98
Chapter Seven: Strengthening the employment nexus between growth and poverty reduction
38 There is under-reporting of secondary employment in the 1999 Labour Force Survey. Were the hours workedin jobs other than the primary one included, these averages would likely be significantly higher.

Another reflection of the same problem is that many workers cannot secure enoughhours of work. About 40% of all the employed work fewer than 35 hours a week, with8.5% of them working fewer than 15 hours. While men tend to work excessive hours,women have problems securing enough hours of work: almost 55% of female work-ers work fewer than 35 hours a week, with almost 12% of them working fewer than15 hours.
A major reason for this pattern is that women are concentrated in sectors, such as serv-ices and agriculture, which provide irregular employment: 55% of women in paidemployment are in services, where their average weekly hours are 31, and another 36%are in agriculture, where their average weekly hours are 32. By contrast, men are moreconcentrated in industry and trade, where average hours tend to be higher: 45 inindustry and 50 in trade.
This bimodal distribution of hours of work, reflecting to some degree gender differ-ences, implies that jobs offering a reasonable number of hours are scarce. Only about28% of all employed workers have jobs providing between 35 and 47 hours of workper week. Growth in micro- and small enterprises is not likely, by itself, to resolve thisproblem. Employment in such enterprises is often self-, casual or unpaid employment.Over the long term, the expansion of paid employment in medium-sized and largeenterprises is more likely to ‘regularize’ hours of work, i.e., stabilize them within a rea-sonable range that can provide decent levels of income.
Despite economic growth in the late 1990s, real wages declined. Part of the reason wasthe removal of subsidies on energy, transport and food, which raised prices and theoverall cost of living for workers. Nominal wages increased in the 1990s in both thepublic and private sectors, but these increases were far outstripped by price increases.While the nominal minimum wage rate had risen, for example, to about $40 permonth in 1998, the real value of this wage was only 30% of its 1990 level (ILO 2004).
One measure of the extent of the working poor is that about 13% of paid employees in1999 earned wages that were lower than the Food Poverty Line (as defined by the FamilyBudget Survey). About 39% of paid employees earned wages that were lower than theoverall Poverty Line. Assuming that the methodology for establishing these poverty linesis sound, such a measure of working poverty would be more useful than unemployment.Employment outcomes should be judged, for example, by whether they decrease thepercentage of workers who earn wages lower than the overall poverty line.
Among paid employees, there are significant wage differentials by sector. For example,the differential in average wages between the public sector and the private sector haswidened. Whereas public-sector wages used to be comparable to private- and mixed-sector wages, now they have fallen to about one-third of the private-sector level.
Part of the differential in total weekly wages is due to differences in the number ofhours worked. Monthly averages earnings in agriculture are low, for example, becausenot only are hours per week below average (39 hours) but also (and more important-ly) hourly earnings are very low (YR 65 per hour) (Table 7.5). In services, hourly
99
Chapter Seven: Strengthening the employment nexus between growth and poverty reduction

earnings are near average (YR 73 per hour) but hours worked per week (37 hours) arethe lowest of any sector. In trade, however, hourly earnings are low (YR 66 per hour)but monthly earnings are boosted by above-average hours worked per week (50hours).
On an hourly basis, average earnings for all sectors are YR 76 (Table 7.5). Earnings inthe construction sector are the highest, at YR 106 per hour. Earnings in transport arealso relatively high, at YR 95 per hour. By contrast, earnings are lowest in agriculture(YR 65 per hour) and trade (YR 66 per hour). Earnings in industry and services arecloser to the average.
Table 7.5: Hours and earnings by sector
Economic Number of paid Average Average monthly Average hourly
Sector employees weekly hours earnings (YR) earnings (YR)
Total 1,507,500 40 13,000 76
Agriculture 310,000 39 10,800 65
Industry 105,900 45 13,700 71
Construction 214,000 41 18,600 106
Trade 151,000 50 14,100 66
Transport 52,200 41 16,600 95
Other Services 764,600 37 11,500 73
Source: Mehran 2001 based on the 1999 Labour Force Survey.
In most sectors, women who are paid employees have average hourly earnings that arehigher than those for men. This is the case, for example, in industry, construction,trade and services. The one sector in which women’s hourly earnings (YR64 per hour)are lower than men’s is agriculture. The major problem is that in all sectors women area minority of paid employees. In addition, even when they are able to secure paidemployment, in all sectors they work far fewer hours than men. While on an hourlybasis, the earnings of women (YR 76) are slightly higher than those of men (YR75);on a monthly basis, women earn only YR 10,400s compared to the YR13,299 formen. This is due to fewer work hours.
Wage inequality is a problem. But it is not necessarily due to inequality in education-al attainment. The highest paid 5% of employees earn YR 50,000 per month. Thelowest paid 5% earn YR 5,000. Thus, the ratio of earnings of the top 5% to the bot-tom 5% is 10 to 1. Workers with higher education are more concentrated among thosewho earn YR 50,000 or more, and illiterate workers are more concentrated amongthose who earn less than YR 5,000.
But the relationship between education and earnings is not monotonic. Workers withhigher education are heavily concentrated in the YR 10,000 to YR 20,000 per monthrange, which covers bout half of government employees. Also, illiterate workers aremore concentrated in the range of YR 20,000 to YR 50,000, while workers withhigher education are only slightly more concentrated in this range.
100
Chapter Seven: Strengthening the employment nexus between growth and poverty reduction

7.7 Policy recommendations
In order to provide widespread remunerative employment, Yemen’s economy needsto grow at a much more rapid rate and spread the benefits of growth more broadlyamong the population. This will necessitate a dramatic scaling-up of both public andprivate investment. Financing for such investment will have to come from varioussources: oil revenue, increased tax revenue on non-oil incomes, reduced internationalreserves, debt relief and substantially increased ODA in support of a national develop-ment strategy that can reach the MDG targets.
Gross investment remains relatively low. In 2002 it was 17% of GDP (World Bank2004). This is partly explained by a lack of stimulus from public investment. But it isalso explained by a poorly functioning financial system, which lacks the ability tomobilize domestic savings and channel these into productive private investment. Netnational savings were less than 15% of gross national income in 2002 and domesticcredit to the private sector was only about 6% of GDP (World Bank 2004).
The GoY can pursue a four-part strategy to begin generating more rapid, employ-ment-intensive growth. First, it needs to implement more growth-oriented economicpolicies. Other chapters of this report have detailed recommendations for fiscal, mon-etary and exchange-rate policies.
While the government enjoys the boon of increased oil revenues, it should re-orientfiscal policies in order to channel these revenues concertedly into financing widespreadpublic investment in basic economic and social infrastructure. Such investment will notonly advance human development, such as for greater health and education, but it willalso give a boost to economic activity – through the provision of basic infrastructuresuch as electricity, gas, water and roads.
Monetary policies also need to be overhauled in order to target employment creationas well as maintain moderate rates of inflation – 10%-15% per year (see Chapter 6).This will imply more pro-active sectoral credit policies, especially for those sectors thathave both growth and employment potential. Such sectors can be found across thespectrum of agricultural, manufacturing and service activities. In order to maintain theinternational competitiveness of non-oil exports, the Government should also move tofurther depreciate the exchange rate. Such a measure should be combined, however,with restrictions on capital mobility, particularly within the context of more expan-sionary fiscal and monetary policies.
The second prong of the government’s employment-creation strategy should be poli-cies geared to diversifying the economy and supporting sectors with growth andemployment potential. Targeted credit policies, such as differential reserve require-ments for banks, could be considered part of this prong but other policies, such as theallocation of public investment to priority sectors, could also be utilized.
Boosting manufacturing is a crucial component of such initiatives since it has superiorpotential to create productive and decent-paying employment, relying principally on
101
Chapter Seven: Strengthening the employment nexus between growth and poverty reduction

the growth of medium and large enterprises. But diversification is needed in agricul-ture as well. This could involve the substitution of qat with other agricultural com-modities, such as coffee, fruits and vegetables, which have strong export potential.Fishing is a example of an agricultural sub-sector with proven growth potential.Boosting tourism within the services sector is also an obvious priority, as is exploitingYemen’s potential in providing port facilities for shipping.
The third prong of Yemen’s employment-creation strategy involves small-scale inter-ventions that have a greater poverty-reduction focus. This could involve the focusingof public resources on small-scale, labour-intensive public works, such as for ruralroads, wells or irrigation works, which can be directed to poorer regions of the coun-try. Such initiatives could also include micro-credit, which should become an integralcomponent of the regular financial services of banks, particularly in rural areas. Butcommercial banks will have to be given incentives to expand coverage of their finan-cial services to poorer regions or social groups; profit-seeking will not motivate themto do so.
The fourth prong of Yemen’s strategy involves the promotion of a more conducivebusiness environment. Simplifying licensing fees and taxes are part of this effort.Reducing cumbersome administrative procedures, official harassment and corruptionis another important part. Micro- and small enterprises often bear the brunt of suchpractices, so reforms in this area will serve to impart a stimulus to economic growth‘from below’, among the self-employed micro-entrepreneurs and small enterprises thatare struggling to expand and grow. Enabling small enterprises, which are oftendeprived of resources and public support, to grow rapidly into medium-sized firms –with a potential to provide decent-paying jobs – is a key component of this effort.
A comprehensive growth, employment and poverty-reduction strategy needs toimplement all four prongs. These are not designed for a poverty-reduction strategyalone. They are geared, first and foremost, to generating more rapid growth andemployment, and leveraging this momentum into focused public efforts to reducepoverty. All four prongs are needed for a more ambitious MDG-based national devel-opment strategy that strives to reach the 2015 targets. At the heart of such a strategyare recommendations to promote broad-based employment generation that is centredin growth sectors that have the potential to pay poverty-reducing – not poverty-repro-ducing – incomes.
102
Chapter Seven: Strengthening the employment nexus between growth and poverty reduction

8.1 Introduction
Yemen is a predominantly rural society, with widespread poverty, food insecurity, andinadequate human development. These trends are illustrated in Table 8.1, which showsthat real per capita gross domestic product (GDP) is currently very low. In this light,it is not surprising that some 48% of the population are food insecure. In part, this isbecause of disappointing macroeconomic performance. Thus, in the decade followingYemen’s unification in 1990 constant per capita GDP grew in real terms by only 28%.It should also be noted that this growth has been quite erratic, and is in any event dis-torted by revenues accruing within the oil sector.
Table 8.1: Poverty and human development in rural Yemen
1991 1995 2000 2001 2002
Constant per capita GDP, US$ 246 279 316 316
Average annual rate of growth of per capita GDP -9.7 8.6 1.5 0.0
Rural population, % of total 75
Rural population below poverty line, % 45
Food insecurity, % 48
Inequality 5.6
Female literacy rate, % 28.5
Male literacy rate, % 69.5
Female life expectancy 60.9
Male life expectancy 58.7
Under 5 infant mortality rate 113
Notes: Inequality is the ratio of the per capita consumption of the richest 20% of the population to
the per capita consumption of the poorest 20%; (*) is for 1998; (**) is for 2003.
Source: World Bank 2004; Food and Agriculture Organization (FAO) 2004.
The impact of low incomes is felt particularly in rural Yemen, where 75% of the pop-ulation live. Here 45% of the population live below the $1-a-day poverty line.
Food insecurity and poverty processes may also be deepening; a poverty assessment ofYemen in the 1990s found that the number of households living in poverty increasedfrom 9% in 1992 to 27% in 1999 (Lofgren and Richards 2003), and between 2001 and2004 the proportion in extreme poverty, defined as those with inadequate food,increased from 17% to 27% (A-Shami 2004). In addition, recent research into foodinsecurity indicates that this too is getting worse (FAO 2004).
Widespread rural poverty and food insecurity are in turn reinforced by pervasiveinequality. According to the World Bank, in 1998 the per capita consumption of therichest 20% was 5.6 times that of the poorest 20%. Persistent poverty and inequalityare also reflected in human development indicators, which show, in particular, poor
103
Chapter EightAgriculture and livelihoods in rural Yemen
Chapter Eight: Agriculture and livelihoods in rural Yemen
*
**
*
**

levels of literacy and inadequate outcomes for child-health. These indicators are evenworse in rural Yemen: for example, according to a recent estimate, only 49% of farm-ers are literate (Yemen Country Report (YCR) 2005: 16). Notably too, women’s lit-eracy is far lower than men’s.
8.2 Agriculture
8.2.1 The role of agriculture in the economy
Approximately 1.5 million households earn their livelihoods in Yemen’s rural econo-my. Of these, 79% have farming or livestock as their principal livelihood activity (FAO2005a). The role of the agricultural sector is demonstrated in Table 8.2, which showsthat agriculture generated some 15% of total value-added in 2003. Although the shareof agriculture in total value-added declined over the decade 1993-2003, much of thisdecline was attributable to the increasing proportion of value-added generated by min-eral extraction and thus the rural economy continues to be one of the most importantcomponents of non-oil value-added. This importance is reflected in the average annu-al rate of growth of agricultural value-added, which between 1990 and 2002 was animpressive 5.6% (World Bank 2004). Indeed, between 1991 and 2000 agriculture con-tributed 19.3% of the growth in GDP per annum (World Bank 2002a: 7). Overall, in2004 agricultural value-added per agricultural household was $1,260 (YCR 2005: 14).
Table 8.2: Agriculture in the Yemeni economy
1993 2003
Agricultural value-added (% of GDP) 21.4 15.0
Rate of growth of agricultural value-added (%) 4.4 5.9
Economically active in agriculture (% of total economically active) (**) 60.1 50.4
of which: women (%) (**) 39.9 42.9
men (%) (**) 60.1 57.1
Notes: (*) is 2001; (**) are for 1990 and 2000, respectively.
Source: World Bank World Development Indicators 2004; FAO 2005a.
The importance of agriculture is further reflected in employment. The sector contin-ues to employ more than half the economically active population, although there hasalso been a slight gender shift as the sector is becoming – somewhat – more ‘femi-nized’. As a consequence, agriculture provides some part of the livelihoods of morethan two-thirds of the population (FAO 2005a: 2).
Agriculture is undertaken on some 1.08 million hectares of arable land, in four distinctagro-ecological zones described in Table 8.3. The Highland zone which surroundsSana’a is the principal farming area, with intensive and extensive mixed rain-fed culti-vation on terraces and in streambeds, called wadis that only flow during the rainy peri-od. Agriculture in the Highlands is dominated by cereal and legume cropping, with
104
Chapter Eight: Agriculture and livelihoods in rural Yemen
39 According to a different source, 60% of the agricultural labour force is female (YCR 2005: 16).
*
39

qat40, coffee, fruit and olives being cropped on terraces, together with vines. However,high levels of investment are needed in terraces – to sustain careful levelling and catch-ment systems. Despite this, yields can be unreliable because of erratic rainfall.
Table 8.3: The spatial distribution of farming
% of cultivated area % of farms
The Highlands 44 61
The Eastern Plateau 26 19
The Tihâma 26 10
The Coast 4 10
Source: FAO 2005a.
Another important farming area is the Tihâma. Nested within a rain-fed water man-agement system, aquifers fed from the highland wadis allow intensive agricultural activ-ity in what is, in essence, largely a coastal plain along the Red Sea. Qat, grain, fruit andvegetables are cropped, although yields of grain, which is largely rain-fed, can, at times,be modest. The cropping pattern has historically been adapted to water availability,which has in the past been more limited, and which in turn has often led to specula-tive planting after flooding or unusual rain run-off. In the past 15 years, however, cap-ital-intensive, mechanized-lift-pump, irrigated agriculture has been widely introducedalong the wadis of the Tihâma, which has brought greater stability to the outcomes ofproduction decisions; the Tihâma is now Yemen’s most productive agricultural area.However this benefit has been bought at a substantial cost, in terms of sustainable watermanagement.
Also an important farming area is the Eastern Plateau, within the Hadhramaut, wherea number of valleys provide arable land that is largely rain-fed and which principallyproduces grain. Yields can however be variable, and are in any event low by technicalor comparative standards (Barrès 2001). The eastern two-thirds of southern Yemen isall but uninhabitable.
The process of agricultural production in rural Yemen is thus shaped by water andland. Yemen is water-poor. Average annual rainfall is 500 to 800 mm in the Highlandsand 50 to 100 mm in the Tihâma (World Bank 2002a: 18). Overall, the per capitashare of recoverable water resources is 137 m3, compared to a water poverty line of1,000 m3 (World Bank 2002a: 18). Further, because of its impact on productivity andwealth, access to water has, historically shaped forms of rural land tenure, and thusaccess to land. Crudely, in the Highlands and in the Tihâma greater relative land fer-tility encouraged the accrual of land amongst a group of larger landholders, and theestablishment of sharecropping. Mundy (1995) suggests that in this region half the pop-ulation live, at least in part, under a set of landlord-tenant relations that could betermed ‘peasant’.41 By way of contrast, in the Eastern Plateau and elsewhere the agri-cultural system is shaped by aridity, with a preponderance of smallholder agriculture
105
Chapter Eight: Agriculture and livelihoods in rural Yemen
40 Qat is a mild narcotic-like substance that is chewed daily by most Yemeni adults. It is discussed in more detailbelow.41 In Arabic, ra‘ãyã.

that possesses some characteristics of a typically ‘peasant’ society, most notably the par-tial integration of rural producers into market relationships (Ellis 1993: 13). There ishowever some residual sharecropping.
8.2.2. Aggregate supply: crop area, volumes and shares
Table 8.4 describes the total area allocated to the main cultivated crops – half for cere-als; 11% for qat and fodder; and 16% for fruit and vegetables. Livestock and fishing alsoprovide importance sources of rural incomes: 91% of all households involved in agri-culture hold some kind of livestock, whether it is cattle, sheep, goats, camels or chick-ens. Between 2000 and 2003 the average rate of growth of the volume of livestockproducts – mostly red and white meat, milk and eggs – was 5% per annum (FAO2005a), making it amongst the most dynamic sub-sectors of the rural economy.
Table 8.4: The allocation of cultivated land, 2004
Total area, % 100
Cereals, % 50
Of which: sorghum/millet 35
Wheat 8
Cash crops, % 18
Of which: qat 11
Coffee 3
Fodder, % 11
Fruit, % 9
Vegetables, % 7
Pulses, % 5
Source: FAO 2005a
Figures 8.1, 8.2 and 8.3 present trends in food production and food security – and indi-cate important structural shifts. Figure 8.1 demonstrates that per-capita cereal availabil-ity has been static for more than 40 years – and at 159 kilos in 2001 was well belowthat needed to sustain sufficient nutritional levels (YCR 2005: 14). At the same timeFigure 8.1 demonstrates that since 1985 there has been a decline – by an average of2.4% per annum – dominated by drops in production of sorghum of 3.5% per year andin that of maize, of 2.3% per year. Wheat, on the other hand, has grown by 0.9% perannum since 1988 (YCR 2005: 15), and this is significant because the bulk of cerealconsumption is now wheat, which accounts for 72% of total consumption.
106
Chapter Eight: Agriculture and livelihoods in rural Yemen

Figure 8.1: Cereal supply, 1961-2002
Source: FAO 2005b.
However cereal expenditure currently comprises only 36.4% of total food expenditure(Central Statistical Organization, 1999). So evaluating food security also requires look-ing at trends in aggregate agricultural production. This is done in Figures 8.2 and 8.3.
However, one final point can be made regarding Figure 8.1. Over this 40-year periodthe share of cereal imports has steadily risen, particularly during the 1980s whendomestic cereal production fell. This was because internal and external householdremittances, in particular from labour migration, generated the cash to purchase lower-cost government-subsidized imported grain. This suggests that there may have beensome shifts in the pattern of rural production.
Of greater significance here, however, is the role of imports in sustaining food securi-ty. Currently, of course, oil balances cushion the macroeconomic impact of theseimports. Figure 8.2 shows trends in the cropped area – showing a dramatic decline inthe area allocated to cereals, and a corresponding increase in the area allocated to fruit,vegetables and qat.
Figure 8.2: Area under cultivation, 1994-2003
Source: FAO 2005b; CSO various issues.
107
Chapter Eight: Agriculture and livelihoods in rural Yemen
0
20
40
60
80
100
120
140
160
180
200
1961 1966 1971 1976 1981 1986 1991 1996 2001
Per capita availability Per capita imports
Kilo
s
70
80
90
100
110
120
130
1994 1995 1996 1997 1998 1999 2000 2001 2002 2003
Cereals Vegetables Fruit Qat
1997
= 1
00

Figure 8.3 shows trends in the volume of production for cereals, vegetables, and fruit,as well as fish and meat. As expected, this shows a decline in the volume of cereals pro-duction – partly attributable to imports, partly due to the reduced availability of fertil-izers and pesticides following the structural adjustment programme in the 1990s, aswell as the drought between 2001 and 2003.42 It is also interesting to note that cere-als production started to decline in 1998; from the mid-1990s onwards food subsidieswere reduced as part of the adjustment programme, and they ceased entirely in 1999.Figure 8.3 also shows moderate increases for vegetables and qat, significant increasesfor fruit and meat, and a dramatic rise for fish.
Figure 8.3 thus reinforces the findings of Figures 8.1 and 8.2. Indeed, it is widelyacknowledged that Yemen is now self-sufficient in higher-value food products such asfruit and vegetables (World Bank 2002a). Clearly, the rural economy can supply adiverse portfolio of foods. But will this meet nutritional requirements? These can beassessed simplistically on the basis of caloric intake per day – for which the benchmarkindicator is 2,100 calories. Between 1993 and 1997 per capita consumption per daywas only around 2,050 calories (Lofgren and Richards 2003)43.
Figure 8.3: Agriculture, fish and meat production
Source: FAO 2005b; CSO various issues.
In 2001 that figure had declined to 2,022 (FAO 2005a: 4). This, along with per capi-ta cereal availability displayed in Figure 8.1, shows that the caloric intake benchmarkis still not being fulfilled. This suggests two possible, interrelated points. First, that thereis significant variation in individual access to food. Second, that the distribution ofaccess to food may be a key reason why many Yemenis have questionable food secu-rity status. This is reinforced by survey data, which indicate that 22% of rural Yemenisfail to have an evening meal at least once a week (CSO 1999).
Figure 8.4 displays shares of the total value of cereals, vegetables, fruit and qat.Curiously, despite the decline in the area and volume of cereals production the shareof total agricultural output attributable to cereals remained relatively static. This sug-gests that falling volumes may have been offset by rising prices, which in part were afunction of rising wheat prices in world markets at the end of the 1990s and which
108
Chapter Eight: Agriculture and livelihoods in rural Yemen
42 This decline is illustrated in Figure 8 above. 43. It is worth noting, though, that Al-Ghory (2004) suggests that per capita calorie intake in Yemen in the late1990s was only 1700 per day.
50
70
90
110
130
150
170
190
210
1994 1995 1996 1997 1998 1999 2000 2001 2002 2003
Cereals Vegetables Fruit Qat Fish Meat
1997
= 1
00

were also in part a function of the termination of food subsidies, both of which werein turn were transmitted into local wheat markets.
Figure 8.4: Distribution of shares of total value of agricultural crops
Source: CSO various issues.
Rising prices did not, however, facilitate a supply response in wheat. Also, despite therising area and volume attributable to vegetables their share of total agricultural outputhas remained static. This suggests that increasing volumes have been offset by fallingprices. In addition, despite the rising area and moderately increasing volume attribut-able to qat its share of total agricultural output has, contrary to popular perception,apparently fallen. Again, this suggests that increasing volumes have been more than off-set by falling prices. Finally, Figure 8.4 suggests that fruit is the only important agricul-tural product where rising area and volumes have been accompanied by an increasingshare in total agricultural output. Thus, aggregate citrus production increased 20% peryear between 1991 and 2003, while banana production grew by 5% per year over thesame period (YCR 2005: 15).
Because of its importance in Yemeni culture and agricultural production, it is worthconsidering qat. By some estimates, qat produced 28.7% of agricultural value-added in2001, employed 24% of the agricultural labour force, produced one-tenth of totalhousehold income, and consumed 30% of all irrigation water (World Bank 2002a: 18;YCR 2005: 16). The growth of qat production in the 1990s can be explained bydemand and supply factors. On the demand side, qat was, in the 1990s, possibly thebiggest component of household cash expenditure (Al-Ghory 2004: Table 4.31) sohouseholds who grew their own could reallocate scarce household cash to other com-modities.
On the supply side, qat is lucrative – and generates cash income that allows producinghouseholds to purchase commodities that are not produced on the farm itself. Granted,most qat production is intensive in the use of purchased inputs, particularly water, fer-tilizer and pesticide.44 However, it appears to have both a lower labour demand thanalternative crops and is, moreover, drought resistant. Coupled to this, qat offers greateroutput stability – and thus potential income stability – because yields are less variable
109
Chapter Eight: Agriculture and livelihoods in rural Yemen
44. Some strains of qat, and, in particular, some that are farmed in the Highlands, are less water-intensive.
0
5
10
15
20
25
30
35
40
45
1997 1998 1999 2000 2001 2002
Cereals Vegetables Fruit Qat
Per
cent

than those of fruit (Mundy 1995). In this light, it is not surprising that crop budget datafrom field surveys suggest that qat is far more profitable than competing crops, evenwhen the opportunity cost of the family labour used in qat production is taken intoaccount (Al-Ghory 2004: Table 4.30a). In part, this may be because of ongoing traderestrictions on qat, which help sustain inefficient marketing systems that result, in someareas, in more than half of the final retail price going to the farmer (Al-Ghory 2004:Table 4.25).
In some areas qat brings in as much as external remittances. So as remittance incomesfell in the early 1990s many people grew more qat to sustain their incomes. In short,for many farmers qat is the most economically logical crop choice, demonstrating, interalia, the rationality of rural Yemeni production decisions and moreover the responsive-ness of farmers to market signals. Indeed qat, as the most important cash crop for thedomestic market, plays an important role in sustaining demand in the rural economy.
Qat also has non-economic impacts. First, on gender. Qat is a ‘male’ crop – associat-ed with male labour and male-controlled incomes (Mundy 1995). In the 1990s thissocial relationship was reinforced, as less lucrative crops became increasingly associatedwith female labour while qat production expanded – heightening gender-differentiat-ed access to cash flows. Second, qat profits to an extent protected households from thefull impact of rural restructuring in the 1990s.
8.2.3 Aggregate demand: external and internal drivers of change?
Figures 8.2, 8.3 and 8.4 indicate that important shifts are underway in Yemeni agricul-ture. On the demand side an important issue is the extent to which rural producersrespond actively to market signals. This in turn has two components: the external mar-ket; and the internal market.
On the external component, it should be noted that in the 1990s Yemen lifted importrestrictions that had produced protected domestic prices (World Bank 2002a). Tradeliberalization has, of course, expanded the use of food market and market signals. It has,however, favoured bigger farmers (YCR 2005) while smallholders have seen foodimports, undercut their production – with the exception of qat, for which importrestrictions remain.
Figure 8.5 shows that food exports have had a fairly static share of non-oil exports,though they would have declined had it not been for dynamic fish exports. The staticshare of food exports can be attributed to three principal causes. First because a signif-icant share of Yemeni agriculture is for subsistence – 76% of agricultural holdings haveself-consumption as their primary purpose of production; only 24% of farm holdingsare principally engaged in production for rural product markets. This is not to say thatYemeni farmers are not integrated into markets, or that they do not respond to mar-ket signals; as demonstrated by the case of qat, and the impact of trade liberalizationNevertheless they are often subsistence producers.
110
Chapter Eight: Agriculture and livelihoods in rural Yemen

The second cause is underdeveloped market infrastructure, which results both in sig-nificant post-harvest losses. Poor harvesting techniques, poor storage facilities, andpoor transport infrastructure all result in a lack of adequate quality-control mechanisms(FAO 2005a). Underdeveloped market infrastructure also acts as a barrier to entry intrading activities. The third reason, which is related to the second, is that regional mar-kets are extremely competitive and will reject poor quality exports.
Figure 8.5: Food Exports as a share of non-oil exports
Source: FAO 2005b; CSO various issues.
The structural transformation in the rural economy in the 1990s was thus not drivenby external demand. Has internal demand changed? Probably not. For a start, only 24%of farm households are principally engaged in production for rural product marketsand, of these, only 4% produce exclusively for the market. Market-oriented produc-tion is still not the norm. Secondly, there has been an intrasectoral relative price shift.This is illustrated in Figure 8.6. The data are only for Sana’a, but results from othercities around the country generate similar results. The result is dramatic: a seculardecline in the relative price ratio indicating that wheat was becoming more expensiverelative to higher value agricultural products such as dates, fish and coffee, whichwould be expected to be produced for sale on the market.
This is partly a result of the dismantling of food subsidies which began in the latter partof the 1990s, terminating in 1999. Increased international wheat prices at the end ofthe 1990s will also have had a major impact. It should, however, be noted that since2000 food prices in Yemen have been growing faster than international prices whenmeasured in the same currency, indicating that food price increases are being drivenby domestic factors. The ongoing increase in the relative price of wheat since thencould also be due to the monopoly practices of wholesale food import merchants, whohave seen their economic position strengthened since the start of the adjustment pro-gramme in the 1990s. These cumulative effects – rising international prices, the elim-ination of food subsidies, and the continuing power of food importers – have increasedthe cost of essential food purchases and contributed to a reduction in food security inrural Yemen.
111
Chapter Eight: Agriculture and livelihoods in rural Yemen
0102030405060708090
100
1994 1995 1996 1997 1998 1999 2000 2001 2002 2003
Per
cent

Figure 8.6: Relative agricultural prices in Sana’a
Source: CSO various issues.
Nevertheless these relative changes in prices have not prompted increases in the pro-duction of cereals or fruit.45 This is partly because production is often for subsistence,but also because of shifts in the intersectoral terms of trade against agriculture, partic-ularly as a result of successive devaluations that have increased the prices of importedgoods (World Bank 1999). Whether there has been a shift in the terms of trade againstagriculture is, however, contentious. A widely cited European Union study (WorldBank 1999) offered unambiguous evidence, suggesting that that a form of ‘urban bias’may have reinforced subsistence production. This will, it is argued, have combinedwith asymmetrical information between farmers and traders and poor market infra-structure to restrict the degree of integration of rural markets.
However, some observers question whether there has in fact been a shift in the inter-sectoral terms of trade. Figure 8.7 shows movements of the food and non-food com-ponents of the consumer price index, which could be used as a crude approximationof the relative purchasing power of the agricultural and non-agricultural sectors. Since2000 the non-food component of the consumer price index has been relatively stable,but food prices have been volatile, which indicates that weather-related supply shocksmay play an important part in food price inflation. Finally, and most importantly, thisfigure shows that food price inflation appears to be accelerating. Rising food prices rel-ative to stable non-food prices thus appear not only to be the main force underpinninginflation and they suggest that there may have been a shift in the intersectoral terms oftrade, to the benefit of the rural economy.
Nevertheless, there are still good reasons to believe that the structural transformationin Yemeni agriculture have been driven by internal demand (World Bank 1999). Inthe wake of internal and external remittance flows in the 1980s the rural economy isnow heavily monetized. Cropping decisions therefore now reflect the need to producefor subsistence and the need to generate maximum profit per unit of land for market-ed crops.
112
Chapter Eight: Agriculture and livelihoods in rural Yemen
0.4
0.5
0.6
0.7
0.8
0.9
1
1.1
1.2
1.3
1996 1997 1998 1999 2000 2001 2002 2003
Fresh fish/local wheat Dates/Local wheat Local coffee/Local Wheat
Inde
xed
pric
e ra
tio
45. It is admitted that a possible explanation for this is that the categories used in Figures 2 and 3 do not correspondto the categories used in Figure 6, and thus Figure 6 has no bearing on Figures 2 and 3.

Indeed, as a result of widespread food insecurity, farmers need to maximize cash prof-its per unit of land from marketed crops so that they can enter food markets from astronger position. This, together with the status of the crop in Yemeni culture, explainsthe increase in the production of qat which generates the highest profit per unit of land(Al-Ghory 2004). The rapid rise of fruit and vegetable production is also based uponits relative profitability per unit of land which can, in some circumstances, approachthat of qat. Thus, the orientation of cropping patterns of marketed crops towards prof-it per unit of land, in the context of declines in internal and external remittances, foodinsecurity, and the need for cash in the rural economy, clearly suggests that Yemenifarmers are supply-responsive.
In this light, the lack of a response to the increase in the relative price of wheat indi-cates a lack of not of internal demand but of market integration – which, in turn, is afunction of incomplete markets predicated upon asymmetrical information, underde-veloped marketing systems, barriers to entry that reinforce monopoly rents in the dis-tributive services sector, and poor infrastructure. Policies to support these institutionaldeficiencies in the Yemeni rural economy might foster a supply response.
A caveat to this argument is however in order. Rural Yemeni production of highervalue crops like qat, fruit and vegetables may be demand-driven; but the state of foodsecurity suggests that the market for higher value crops may be segmented by income,with poorer, more food-insecure households being far less likely to be able to purchasehigher value crops. Indeed richer households are likely to spend a larger proportion oftheir income on qat and on meat than poorer households (CSO 1999). Thus, as pre-viously suggested, there is an inequitable distribution of food entitlements.
Figure 8.7: Inflation rates in the food and non-food components of theCPI
Notes: Both Indices exclude qat and tobacco. The qat and tobacco price index increased by 90% dur-
ing 2000-2003, showing the highest increase in all CPI components. Source: CSO, electronic file.
8.2.4 Decomposing supply: the productivity record
If the preceding argument is correct, it is clear that farm decision-making in responseto domestic demand is a function of productive capabilities. Therefore, it is necessaryto look at changes on the supply side. A starting point is the overall productivity recordof Yemeni agriculture as illustrated in figure 8.8. The series only runs between 1990
113
Chapter Eight: Agriculture and livelihoods in rural Yemen
0
2
4
6
8
10
12
14
16
18
1998 1999 2000 2001 2002 2003
Food CPI Non-food CPI
Per
cent

and 1999, when agricultural growth was solid, but nonetheless allows two trends to beestablished. The first is that there was only a moderate increase in constant value-addedper rural worker. Granted, cereals, which are more labour-intensive, had yield increas-es of 1.5% per annum between 1985 and 2003 (YCR 2005: 15). However, these varyconsiderably by crop and for some, including wheat, are low when compared to theirpotential to those in other, similar economies (Barrès 2001). Fruit, meat and fish areimportant sources of rural growth but are not labour intensive. As a result, the ruraleconomy is not providing employment opportunities for an expanding population,suggesting that there may be significant unemployment and underemployment in ruralYemen.
Figure 8.8: Constant agricultural value-added (1995 $)
Source: World Bank 2004.
This is reinforced by household surveys, which suggest that 16% of rural householdheads are economically inactive or unemployed and that 37% are engaged in only tem-porary, seasonal or casual work (CSO 1999). Granted, internal and external migrationhave increased rural wages, reduced the rural male labour force, and encouraged thefeminization of agriculture. But in the last 15 years the opportunities for migrationhave been dramatically curtailed. Clearly, there are significant problems of labourabsorption in the rural economy, and these are reflected in rural productivity.
The second trend indicated in Figure 8.8 is the significant increase in productivity perhectare – a clear reflection of changes in the crop mix. It also suggests, however, that,given the limited increase in labour productivity and water constraints, there may havebeen increases in higher-yielding non-labour farm inputs, and thus a relative intensifi-cation of agricultural production. In order to assess this, Table 8.5 illustrates some ofthe dimensions of non-labour agricultural inputs.
114
Chapter Eight: Agriculture and livelihoods in rural Yemen
80
90
100
110
120
130
140
150
160
170
1990 1991 1992 1993 1994 1995 1996 1997 1998 1999
per arable hectare per agricultural worker
1990
= 1
00

Table 8.5: Non-labour agricultural inputs, 1985-2000
1985 1990 1995 2000
Arable land per person, hectares 0.14 0.13 0.11 0.09
Irrigated land, % of cropland 21 21 28 30
Fertilizer consumption, metric tons 18,700 22,459 13,100 18,800
Number of farm tractors 5,600 5,937 5,800 n/a
Note: n/a is not available
Source: World Bank 2004
Table 8.5 shows that over 15 years there was a marked decline in arable land per capi-ta, an increase in the proportion of irrigated land, and at best a minimal change in theuse of fertilizer and farm machinery. The increase in rural productivity per unit of landmay reflect rural population increase which requires farm households to work theirmore intensively. However, it is likely that a more significant factor is the increase inirrigated area. This suggestion is reinforced by Figure 8.9 which shows that tractor usewas broadly static and that fertilizer use declined, but that the amount of land irrigatedgrew, particularly between 1990 and 1994. In response, the crop mix changed in favourof more water-intensive higher value crops such as fruit and certain strains of qat.
There are thus three strategic issues of central importance in understanding agricultur-al production and performance: the conditions under which the limited land that isavailable is acquired and used; the conditions under which labour is allocated to house-hold, farm and non-farm activities; and the conditions under which water is acquiredand used.
Figure 8.9: Agricultural input growth
Source: World Bank 2004.
8.2.5 Decomposing supply: land and labour
As late as the early 1970s agricultural production in Yemen used age-old tools includ-ing the hoe, scratch ploughs, limited draft power, and household labour, with certaintasks, such as harvesting and threshing being done entirely by hand (Mundy 1995).Household production was principally for subsistence. Drought-resistant grains werethe predominant crop, providing food, fibre, fuel and fodder, while limited quantitiesof cash crops were grown for highly localized markets.
115
Chapter Eight: Agriculture and livelihoods in rural Yemen
20
40
60
80
100
120
140
1990 1991 1992 1993 1994 1995 1996 1997 1998 1999
1990
= 1
00
Tractors per 100 hectares of arable land
Irrigated land, hectaresFertilizer consumption, 100 grams per hectare of arable land

In the late 1980s and through the 1990s, however, modern machinery and equipmentbegan to be introduced, particularly in the form of lift-pump irrigation and tractors,along with chemical fertilizers and pesticides which on some farms contributed to ashift towards less labour-intensive production.
A key difference between poorer and richer rural households is that the former aremore likely to rely upon seasonal or casual employment. Currently, there are 2.5 per-manent agricultural workers per hectare (YCR 2005: 16). During peak periods thislabour force may be supplemented by short-term wage labour, which is now morewidespread than it was in the 1970s, and which is supplied by underemployed farmhouseholds or rural non-farm households. Thus on some farms there are more com-plex divisions of labour (Mundy 1995). Finally, farmers became, to a larger degree thanis generally recognized, further integrated into markets, particular with regard to theproduction of qat.
Another issue is land distribution. This is detailed in table 8.6. Landholding is definedas land that is owned or accessed through a non-ownership tenure arrangement suchas sharecropping or rental; many farms in rural Yemen combine ownership and non-ownership tenure arrangements. The number of very small holders of land hasincreased significantly. But there have also been more complex shifts: landholdersholding less than 2 hectares or more than 20 hectares saw their area of holding increas-ing, while those holding between 2 and 20 hectares saw their holding decrease. Inorder to clarify this complexity, the final column in Table 6.6 presents the elasticity oflandholding area with respect to the number of landholders. Given the nature of thecalculation, the sign is less important than the absolute value. The findings are quitedramatic. Amongst those households holding less than 5 hectares, there have beensmall changes in the elasticity, but amongst those holdings of 20 or more hectares,while the number of landholders declined, the landholding area increased, and quitedramatically. Landholding per farm is clearly becoming more unequal.
This is reinforced by data on land ownership. According the Friedrich Ebert Stiftung(2002), households that owned less than 2 hectares of land owned 20% of all ownedland, households that owned between 2 and 5 hectares of land owned 24%, and house-holds that owned 5 hectares or more owned 56%.
This suggests that there has been a reallocation of land amongst farm households whichare using, perhaps to a greater extent than is commonly acknowledged, a land market,whether it be for purchase or for some kind of lease. In this light, it can be noted thatoperational holdings consist, on average, of 3.6 parcels per farm – a degree of fragmen-tation can facilitate processes of redistribution as access to assets becomes more strati-fied.
According to Abdel Gader (2005), distribution of land holdings has become muchmore unequal: the Gini coefficient increased from about 63% in 1991 to 71% in 2001;an annual increase of the Gini at a rate of 1.1%. This inequality is intimately connect-ed with rural poverty and food insecurity. In large part, this is because the holding ofland is a good indicator of a household’s wealth (FAO 2004: 33). Thus, as is demon-
116
Chapter Eight: Agriculture and livelihoods in rural Yemen
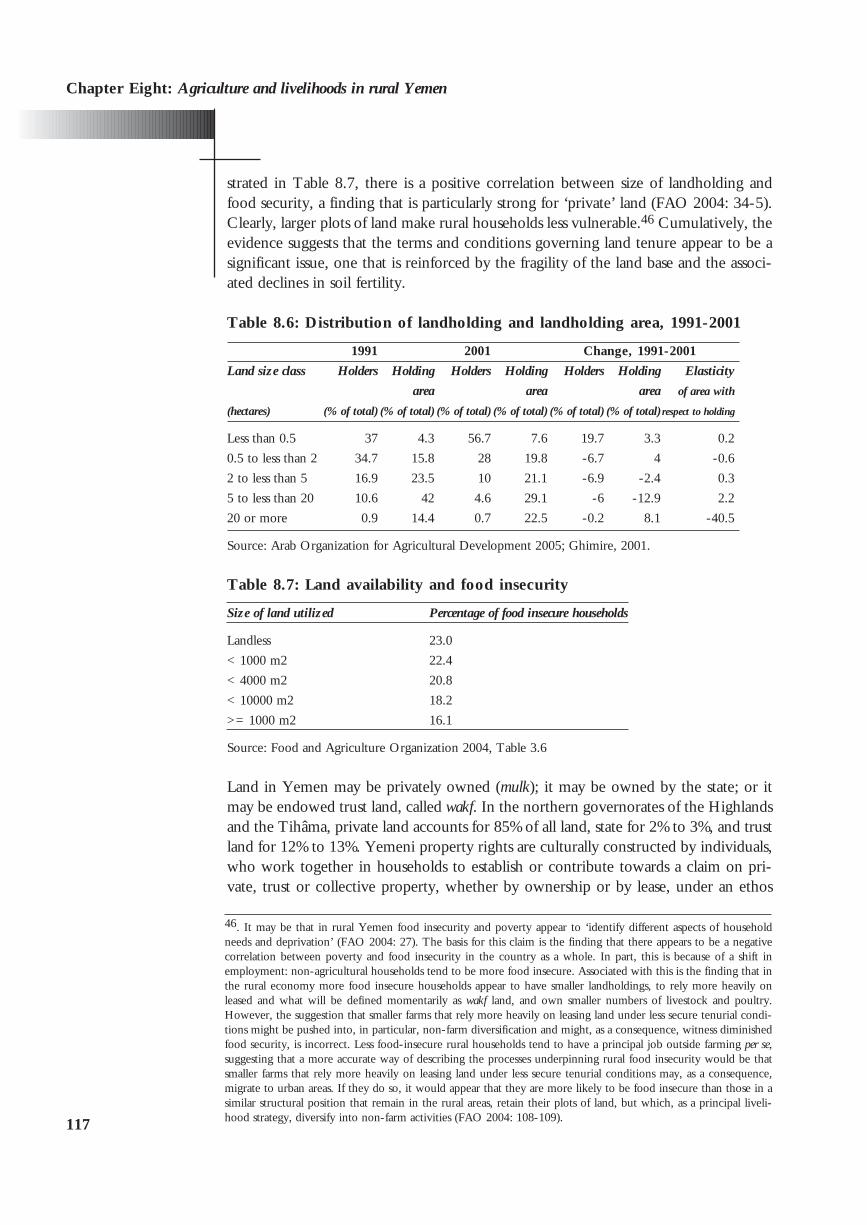
strated in Table 8.7, there is a positive correlation between size of landholding andfood security, a finding that is particularly strong for ‘private’ land (FAO 2004: 34-5).Clearly, larger plots of land make rural households less vulnerable.46 Cumulatively, theevidence suggests that the terms and conditions governing land tenure appear to be asignificant issue, one that is reinforced by the fragility of the land base and the associ-ated declines in soil fertility.
Table 8.6: Distribution of landholding and landholding area, 1991-2001
1991 2001 Change, 1991-2001
Land size class Holders Holding Holders Holding Holders Holding Elasticity
area area area of area with
(hectares) (% of total) (% of total) (% of total) (% of total) (% of total) (% of total) respect to holding
Less than 0.5 37 4.3 56.7 7.6 19.7 3.3 0.2
0.5 to less than 2 34.7 15.8 28 19.8 -6.7 4 -0.6
2 to less than 5 16.9 23.5 10 21.1 -6.9 -2.4 0.3
5 to less than 20 10.6 42 4.6 29.1 -6 -12.9 2.2
20 or more 0.9 14.4 0.7 22.5 -0.2 8.1 -40.5
Source: Arab Organization for Agricultural Development 2005; Ghimire, 2001.
Table 8.7: Land availability and food insecurity
Size of land utilized Percentage of food insecure households
Landless 23.0
< 1000 m2 22.4
< 4000 m2 20.8
< 10000 m2 18.2
>= 1000 m2 16.1
Source: Food and Agriculture Organization 2004, Table 3.6
Land in Yemen may be privately owned (mulk); it may be owned by the state; or itmay be endowed trust land, called wakf. In the northern governorates of the Highlandsand the Tihâma, private land accounts for 85% of all land, state for 2% to 3%, and trustland for 12% to 13%. Yemeni property rights are culturally constructed by individuals,who work together in households to establish or contribute towards a claim on pri-vate, trust or collective property, whether by ownership or by lease, under an ethos
117
Chapter Eight: Agriculture and livelihoods in rural Yemen
46. It may be that in rural Yemen food insecurity and poverty appear to ‘identify different aspects of householdneeds and deprivation’ (FAO 2004: 27). The basis for this claim is the finding that there appears to be a negativecorrelation between poverty and food insecurity in the country as a whole. In part, this is because of a shift inemployment: non-agricultural households tend to be more food insecure. Associated with this is the finding that inthe rural economy more food insecure households appear to have smaller landholdings, to rely more heavily onleased and what will be defined momentarily as wakf land, and own smaller numbers of livestock and poultry.However, the suggestion that smaller farms that rely more heavily on leasing land under less secure tenurial condi-tions might be pushed into, in particular, non-farm diversification and might, as a consequence, witness diminishedfood security, is incorrect. Less food-insecure rural households tend to have a principal job outside farming per se,suggesting that a more accurate way of describing the processes underpinning rural food insecurity would be thatsmaller farms that rely more heavily on leasing land under less secure tenurial conditions may, as a consequence,migrate to urban areas. If they do so, it would appear that they are more likely to be food insecure than those in asimilar structural position that remain in the rural areas, retain their plots of land, but which, as a principal liveli-hood strategy, diversify into non-farm activities (FAO 2004: 108-109).

that is egalitarian yet competitive. Households that are capable of making a claim toland, and as a consequence a claim to water, form the boundaries of a rural communi-ty, while those who are unable to make such a claim to land fall outside the commu-nity (Mundy 1995). For this reason, while farmers will do their utmost to avoid losingclaims to land, if they do indeed lose that claim they become more likely to exit farm-ing altogether because they become removed from the rural community.
Following the return of collectivized land in the former South Yemen to its formerowners, the dominant form of land tenure is now, owner operated holdings, whichaccount for some 75% of the total arable area. However, titles to privately-owned landare commonly not written, there has been no cadastre, and thus legal titles are enforcedthrough social institutions operating within the Islamic legal framework, fiqh. There is,however, a registry of state-owned land, while waqf trust land is administered througha government ministry. In the Highlands and in the Tihâma, access to rain-fed or irri-gated land meant that its fertility was higher than in other parts of the country, whichin turn encouraged the accumulation of private land amongst bigger landholders. Inupper Yemen which is more arid the norm is smallholder owner-operated agriculture.
There is also widespread land rental. The principal reasons for this is the fragmentationof holdings, and the resulting diseconomies of scale that result, and migration, whichon some farms can generate labour shortages (Al-Ghory 2004). Flat-rate cash-basedland rental remains comparatively rare (Mundy 1995). As a consequence, sharecrop-ping accounts for around 12% of the total arable area.47 The terms of sharecroppingcontracts are complex. Many mid-sized and larger farms use sharecropping contracts toexpand their cultivable area and reduce the diseconomies of fragmentation, but theterms and conditions differ depending on the size of landholdings. There are also dif-ferences in contracts, depending on whether the land is rain-fed or irrigated, which inturn means that there are pronounced regional differences.
Sharecropping is particularly found in irrigated areas, and thus is widespread in theTihâma, and is also not uncommon in the Highlands. It is however also found in upperYemen, where land that was restored to former owners in the early 1990s led to areturn of a residual degree of sharecropping. For those who have relatively larger land-holdings, sharecropping contracts are predicated on the proposition that the sharecrop-per has some capital, which is used as a down payment, is used to improve the land,or is used to bear working capital costs. This means that sharecroppers are unlikely tobe small owner-operators; rather, the sharecropper is more likely to be a mid-size orlarge owner-operator with a long-term contract (Mundy 1995: 68). In the rain-fedareas of the Highlands the tenant retains 50% of the yield of the land net of the costsof production, plus any fodder crops and crop residues.
In the Tihâma, on the other hand, where sharecropping remains widespread, thesharecropper can still get a contract. – though the terms can be quite onerous. Whenthe landlord provides water the share accruing to the tenant is 33% of the yield of theland net of zakat, a religious tithe on annual production. If the landlord obtains the
118
Chapter Eight: Agriculture and livelihoods in rural Yemen
47. Anthropological evidence and field observations strongly suggest that this may be an understatement.

water from a third party, the latter gets between 33% and 50% of the yield net of zakat.The sharecropper often bears the non-water production costs so will commonly retainonly one-fifth of the return on irrigated land (Mundy 1995: 69).
As the preceding makes clear, a land market in rural Yemen is active, especially withregard to sharecropping leases because farmers will do the most they can to avoid sell-ing their principal non-labour asset, their land. However, despite extensive land trans-actions since unification there has been little state intervention in land markets and theregulatory framework is largely absent. As a consequence, as with privately ownedland, there are no formal mechanisms to enforce claims on leased land, although leas-ing, gifting and the inheritance of land are regulated through fiqh.
The land market has been important, for two reasons. First, because with lower remit-tances household are cultivating land that they had formerly leased out which theywere permitted to do under sharecropping contracts. Secondly, with the expansion ofmechanization in the 1990s, and particularly lift-pump irrigation, those farmers soughtto expand their use of sharecropping to irrigate a larger catchment area, and thus obtaineconomies of scale. They did so because water rights follow land rights, so wealthierrural households who wanted increased access to water needed more land and got thisby entering into sharecropping contracts with mid-sized and small owner-operators(Mundy 1995). In this way, the size of landholdings changed as those with capital tookadvantage of technology to switch to higher value crops such as qat, fruit and vegeta-bles. Richer rural households are thus more than twice as likely to grow qat, coffee,fruit, and vegetables as poorer households, who are more likely to grow sorghum,maize, and clover (CSO 1999).
Changing access to land in the 1990s thus affected rural food security, poverty andinequality – and small leaseholders, farms in low rainfall areas, and farms with smallnumbers of livestock are more likely to be food insecure (FAO 2005a). As a resultincome differentials have been rising.
Finally, small landholders rely more for their livelihoods on seasonal and casual labour.The irregularity of this employment, along with the high proportion of subsistenceproducers, suggests that changes in land distribution have contributed to rural pover-ty. In this light, the three key characteristics of Yemeni agriculture that need to eval-uated from a policy perspective are the preponderance of small landholdings, the pos-sible disincentives arising out of sharecropping for those who lack capital, and theirregularity of rural employment for those that rely upon it as a key component of theirlivelihood portfolio. These factors are, of course, interrelated, in that they may restrictproductivity increases amongst small landholders, and in so doing contribute to foodinsecurity and poverty.
Moreover, the obverse can partially explain the increase in constant value-added perunit of land, a redistribution of land in favour of a smaller number of large landhold-ers, the ability for those who have capital to increase their access to land through theuse of sharecropping, and the availability of labour to hire as and when needed on rel-atively larger landholdings. However, this is not the complete explanation, for it doesnot include productivity increases due to the provision of water.
119
Chapter Eight: Agriculture and livelihoods in rural Yemen

8.2.6 Decomposing supply: water
In the rural economy the most binding constraint is water is. Average annual rainfallis, at best, very low, and the per capita share of water resources is considerably belowthe water poverty line estimated by the World Bank (2002a). Moreover, water is anoverwhelmingly rural issue, in that 90% of the water used in the Yemeni economy isused in the rural sector (World Bank 1999).
As in clear in Figure 8.10 since the mid-1970s there has been a decline in the impor-tance of rain-fed water supply. However, it is still the largest source of water to agri-cultural land and a significant proportion of agricultural land relies on flooding, whichis, of course, indirectly rain-fed. Thus, rain is the principal source of water for around56% of Yemeni farmers. Moreover, reliance upon the rains is correlated with povertyand food insecurity, in that small landholders in the rain-fed areas of the Highlands inparticular face wide variability in rainfall and thus frequent climatic shocks, in the formof drought. It is for this reason that Yemeni agriculture has used terraces, land level-ling, and indigenous water-harvesting systems (Varisco 1991).
Nonetheless the rain-fed agricultural sub-sector has, in general, been neglected. In par-ticular, the government’s policy of importing grain for distribution at heavily subsidisedprices has undercut grain production in the rain-fed areas and thus contributed to thedegradation of terraces, deforestation and a lack of attention to sustaining traditionalwater-harvesting systems. The result is that long-standing systems of water manage-ment have eroded – with negative effects on land cultivation and rural productivity,particularly in the Highlands.48
Figure 8.9 demonstrates the rapid increase in the use of groundwater irrigation; thearea irrigated by lift-pump wells increased from 37,000 hectares in 1970 to 368,000 in1996 (Lofgren and Richards 2003: 21). Figure 8.10 indicates that 32% of the farmedarea is groundwater irrigated. This land produces two thirds of agricultural output byvalue. The increase in lift-pump irrigation also contributed to the monetization of theeconomy, in that pump irrigation, when it is not owned by the farmer, must be paidfor in cash.
120
Chapter Eight: Agriculture and livelihoods in rural Yemen
48. The water regime in a given watershed has historically been a balance between the control of land and water inthe upper catchment area and the resulting flow of water in the major wadi systems descending to the productivecoastal plain (Varisco 1991). The use of terraces arrayed in clusters facilitated a gravity-flow sequence that irrigatedthe system as a whole through a common set of channels that carried the excess flow. The erosion of terraces thusresults not only in direct loss of the terrace but also threatens irrigated land in the upper and middle reaches of majorcoastal wadis.

Figure 8.10: Trends in farm water supply, 1975-2000
Source: Al-Ghory 2004.
The government strongly supported the expansion of the irrigated area, particularly inthe 1990s when oil revenues came on stream. It used five mechanisms.
1. Rural borrowers received interest-rate subsidies on investments in irrigationwells. However, the terms and conditions governing access to credit to financethe purchase of mechanical lift-pumps required collateral, which favoured thosewho already had a source of capital. In other words, groundwater irrigation sub-sides directed through the credit system favoured wealthier rural households. Asa consequence, the benefits of government groundwater irrigation subsidies weredirected towards rural sheikhs, large landowners, and business and military lead-ers.
2. Those who obtained lift-pumps could operate them at low cost. In addition toproviding what were in effect subsidized prices for pumps the diesel fuel neces-sary to operate the water pumps was priced at around $0.02 per litre until 1995,which was between one-seventh and one-tenth of the international price ofdiesel fuel (Ward 2000). Electricity was also subsidized for those farmers whoused electric pumps (World Bank 2002a: 18).
3. Government trade controls in water-intensive high valued-added sub-sectorssuch as fruit, vegetables and qat magnified the profitability of introducing lift-pumps to foster alterations in the crop mix. (Ward 2000).
4. The absence of any government regulation on the development or extraction ofgroundwater permitted unsustainable water ‘mining’.
5. Public investment in surface or spate irrigation, combined with a lack of ade-quate access and a regulatory framework and the rapid expansion of irrigatedhigher value crops, has served to further encourage water mining.
As a result, water prices only covered between one-fifth and one-third the cost ofextraction (Lofgren and Richards 2003) – leading to considerable water waste, in acountry far below the water poverty line. In two-thirds of cases losses from the well to
121
Chapter Eight: Agriculture and livelihoods in rural Yemen
0
10
20
30
40
50
60
70
80
90
1975 1983 1990 1995 2000
Rain-fed Flood-fed Spring-fed Groundwater irrigated
Per
cen
t

the field exceeded 30% (World Bank 2002a: 19). As a consequence, water tables havefallen, often dramatically (Liechtenthaeler and Turton 1999). At the present rate ofconsumption groundwater in Sana’a will be depleted in 10 years and the fresh waterin the country will be depleted in this century. In addition, there is widespread pollu-tion and salinization. As a consequence of these interventions water withdrawal nowfar exceeds annual groundwater recharge This suggests, in turn, that the growth ofYemeni agriculture is, in its current form, ecologically unsustainable.
The water management system has clearly been inefficient, and generated returns wellbelow potential. Moreover, the distribution of water is inequitable. In 1999 only 4%of the poorest 10% of the rural population had access to land that was by and large irri-gated, compared to 20% for the richest 10% (World Bank 2002b: 59). In some areaspowerful individuals are using modern drilling and pumping equipment to capture thebulk of available water resources. Indeed the allocation of subsidized lift-pump creditmay have exacerbated land-holding inequalities. If a farmer wants to gain maximumbenefit from the provision of irrigation subsidies, it would be logical to get more land.In this way, access to credit, access to water and the land market all interlock.
8.2.7 Conclusion: the agrarian constraint
The following points are clear. First, that domestic demand is an important driver ofagrarian transformation, but there is an inequitable distribution of food entitlements.Second, changes in the technical coefficients of production can be differentiated, par-ticularly on the basis of relative wealth and landholding. Third, this differentiation wasthe result of a redistribution of land in favour of large landholders during facilitated inpart by the ability of those who had capital to increase their access to land through theuse of long term sharecropping contracts. Fourth, as redistribution proceeded, govern-ment intervention in the provision of mechanical lift-pump irrigation served to con-centrate access to water. Fifth, expansion of the control of land and water amongstthose with relatively larger holdings allowed an expansion of production amongst moreremunerative higher value crops such as qat, fruit and vegetables. Sixth, the expansionof higher value-added production amongst relatively larger landholdings contributedto rising income inequality in rural Yemen. Seventh, the redistribution of land throughthe land market increased the availability of labour for hire, as and when needed, onrelatively larger landholdings. Eighth, the redistribution of land through the land mar-ket served to increase the reliance of small landholders on seasonal and casual wagelabour as part of their livelihood strategies. Finally, however, this reliance served toenmesh many rural households within deepening cycles of vulnerability to poverty.
The expansion of qat in the 1990s in many ways encapsulates these processes. Qat isthe most logical crop because of its profitability. However, production for most qat iswater-intensive and, encourages unsustainable water use. Thus for qat, factors of pro-duction may be efficiently allocated at the private level, but they are clearly inefficient-ly allocated at the social level. A central rural development challenge facing Yemen istherefore to find a crop which is superior in terms of its relative profitability per unitof land, which is predicated upon sustainable water resource management techniques,and which can be widely adopted amongst poorer farm households.
122
Chapter Eight: Agriculture and livelihoods in rural Yemen

Box 8.1: Water scarcity constraints to agricultural growth in Yemen
Yemen is among the poorest countries in the world with respect to water resources. Agriculture is
the leading economic activity for income generation and employment creation, despite being the
major water consumer. Agriculture consumes 90% of the water use in the Yemeni economy. The
tightness of the water constraint can be seen clearly if we compare water availability in Yemen with
other places. The per capita share of the available water resources amounts to 137 m3, as compared
to 1,250 m3 for the MENA region, and 7,500 m3 world wide. The per capita share of water
resources in Yemen is considerably below the water poverty line estimated at 1,000 m3 (World
Bank, 2002a).
Despite the scarcity of water, its use is not well managed. Some of the policies applied encourage
the intensive use of water resources, which aggravates the water problem in the country. Over two
decades, government policy actively promoted groundwater irrigation through credit and diesel
price subsidies and a ban on fruit, vegetables and qat imports. The absence of any regulation on
development or extraction of groundwater added to the abuse of water. Effectively, anybody with
the financial resources to drill could appropriate groundwater (World Bank, 1999). The result was
a large increase in irrigated agriculture over time. Between 1970 and 2000, irrigated agriculture had
tripled from 21,000 ha to 630,000 ha (World Bank, 2002a).
Water resources in Yemen are subject to overuse, to salination, and pollution. The most serious
problem is the rapid depletion of groundwater resources as withdrawal exceeds the annual ground-
water recharge. The gap between available water resources (2.5 billion m3) and the current water
used (estimated at 3.4 billion m3) increased from 400 million m3 in 1990 to 900 million m3 in
2000, and is predicted to reach 10 billion m3 by 2010, assuming the increase in water use efficien-
cy. With this trend, it is expected that 12 billion m3 of the estimated 20 billion m3 of groundwa-
ter reserves will be depleted by 2010 (World Bank, 2002a). At the present rate of consumption, it
is estimated hat the groundwater in Sana’a will be depleted in a 10-year period, and the fresh water
in the country will be depleted in a period of 50-100 years. Besides the fast rate of depletion of the
groundwater resources, the quality of water is threatened due to salination by the overuse of the
groundwater stock, and due to pollution by the extreme use of fertilizers and pesticides in the rural
areas and the waste thrown in it in the urban areas (World Bank, 2001; and World Bank, 2002b).
The subsidized pricing of electricity and diesel in the past, as well as the concessional prices provided
for pumps makes groundwater available to farmers at very low cost. The result is considerable waste
in the water used for irrigation. It is estimated that water losses between the well and the fields ranged
between 9%-78%, and in more than two-thirds of cases, the losses exceeded 30% (World Bank,
2002a). Besides the price subsidy for the means of water pumping, the Yemeni government has also
encouraged and supported groundwater irrigation through other policies, like providing credits and
conducting research directed mainly towards the groundwater irrigated areas, banning the import of
fruits, vegetables, and qat and encouraging its cultivation through irrigated systems. However, the
Yemeni government became aware in the recent years about the threat of the sharp decline in the
water table. Accordingly, the National Water Resources Authority (NWRA) was created in 1996 to
develop a framework to regulate and plan the use of water resources efficiently, and adjust the distort-
ed management of those resources (World Bank, 1999).
123
Chapter Eight: Agriculture and livelihoods in rural Yemen

However, this is not the only rural development dilemma. A lack of public investmentin physical infrastructure has facilitated the degradation of terraces and increased post-harvest losses. There is a need to encourage rural diversification, particularly in off-farmactivities, but this in turn requires skills and social investment by the government, par-ticularly with regard to access to schools and medical facilities. Finally wage labouringin rural Yemen has a very low status. As Mundy (1995) stresses, land secures brother-hood, while landlessness socially excludes people from the community. This meansthat underemployed farmers and those that are economically inactive in non-house-hold productive work are less likely to resort to wage labour. This culturally construct-ed agrarian constraint serves to reduce the scope of non-farm rural policy possibilitiesin Yemen.
8.3 Agrarian constraints and pro-poor policy considerations
The purpose of economic policy interventions is to alter the environment that con-sumers and producers face and in so doing enable them to increase their welfare. Inrural Yemen, this has three clear implications: the need to improve food security; theneed to reduce inequality; and the need to reduce poverty. This suggests, in turn, thateconomic policy interventions should be pro-poor – with the per capita income of thebottom 40% growing faster than that of the top 60%. Agriculture-led developmentstrategy can be pro-poor (World Bank, 1999, 2002a) but several issues have to beaddressed.
The first issue is that ‘yields are below technical potential and actual farmer’s yield incomparable countries’ (World Bank 2002a: 17). According to the Bank, a key reasonfor this is that Yemen does not have a revealed comparative advantage in many tradi-tional farm products. This suggests that international trade should, as it has in the past,remain a cornerstone of food security strategy. But this is not the same as saying thatthere should be wholehearted trade liberalization. During the 1990s trade liberalizationfavoured richer farmers producing higher value crops while undercutting smallholderswith imports – with the exception, of course, of qat.
This suggests the need to encourage on-farm diversification – either market led, orfacilitated by public goods directed towards the poor and near poor. Thus far, market-led diversification has reinforced food insecurity, inequality and poverty processesbecause poorer farmers lack the resources to take advantage of it. Therefore, there is acore need for financial transfers, to facilitate a pro-poor pattern of public goods provi-sion. Indeed, given the pattern of growth in the rural economy in the 1990s, it wouldappear that redistributive public support is a necessary if not sufficient condition of asustainable agriculture-led, pro-poor, growth-oriented development strategy.
However, government spending on agriculture has been very low, both in relative andabsolute terms. It constitutes only about 2.8% of government budgetary spending in2002; the figure was only 1.6% the previous year (A-Shami 2004: Table GS-1). Thegovernment clearly needs to recognize its potential role in facilitating increased agricul-tural productivity and rural incomes. Some of the issues are being addressed in the sec-ond National Plan, the Aden Agenda, and the National Water Strategy (FAO 2005a).
124
Chapter Eight: Agriculture and livelihoods in rural Yemen

Specifically, there is a need to support off-farm diversification, by those poorer smalllandholder farms that may be able to consider entry into new livelihood security strate-gies;
1. the marketing and extension services needed to encourage a shift to a more high-er value sustainable resource management system within the rural economy ingeneral;
2. the infrastructure necessary to facilitate the encouragement of more sustainableresource-management systems within the rural economy in general;
3. the financial resources needed to undertake shifts to a more sustainable resource-management system amongst relatively poorer small landholder farms;
4. in particular, capacity building in democratic decentralized governance thataddresses the current core issue of the asymmetrical access of poorer small land-holder farms and off-farm micro enterprises to local government institutions;
5. in particular, the transitional costs of shifts in the cropping pattern amongst poor-er small landholder farms towards higher value output that may take several sea-sons to produce a return;
6. in particular, reforms to the water-management system, directed towards bene-fiting relatively poorer small landholder farms, through redistributive water-access reform;
7. in particular, reforms to the land-tenure system, directed towards benefitingpoorer small landholder farms, through redistributive land and tenancy reform.
This list makes clear the critical role of government support in facilitating renewedgrowth in agriculture. Each of these will be examined in turn, in ascending order ofimportance.
I. Off-farm diversification
Currently, there are very weak linkages between agricultural activity and agro-indus-trial activity. There has therefore been extensive discussion on ways of encouraging theestablishment of micro- and small-scale enterprises in agro-processing, as well as insmall-scale mercantile and manufacturing activity, as a possible avenue out of poverty(World Bank 1999; FAO 2005a; YCR 2005). Currently, those micro-enterprises thatdo exist have been on the basis of individual initiative or the initiative of families.However, those enterprises are the exception to the norm, in large part because, asnoted, a fundamental constraint on the ability to facilitate micro-enterprise develop-ment is the low social status accorded to non-land- based economic activity in thecountryside, and thus the lack of an entrepreneurial culture in rural Yemen.
In this light it is foolish to place excessive demands upon the possible employment-cre-ating potential of micro enterprise; the route out of poverty is not the creation of aclass of rural entrepreneurs. Nonetheless, for some rural households that are preparedto fundamentally reconfigure their livelihood strategies, this may be an option, andthey should be able to draw upon public support.
125
Chapter Eight: Agriculture and livelihoods in rural Yemen

The most important factor that could encourage off-farm diversification would be sus-tained growth in agricultural productivity. The elimination of barriers to businessestablishment, and indeed positive incentives to the establishment of businesses, would,in these circumstances, facilitate the creation of micro-enterprises. This would nothowever be sufficient. There is also a need to create business-oriented technical advi-sory services that could facilitate the development of micro-enterprises. In addition theabsence of accessible credit constrains business start-ups. These are also constrained bya lack of information on consumer requirements.
II. Marketing and extension services
Poorer landholding households need better extension services – to provide advice oncropping patterns, resource allocation, and resource management, as well as marketingservices to locate niche markets for higher value, more resource efficient, productswhile improving packaging, storage, and transport, and also offer timely informationon prices and markets. Currently, post harvest losses stand at 20% for cereals, 38% forbananas, 45% for tomatoes and 60% for papaya (World Bank 2002a: 17).
Public support, principally through the construction of storage facilities and theimprovement of transport networks, could be pro-poor if the social implications wereincluded in the calculation of the economic rate of return, and if differential priceschemes benefited the poor more than the rich. These services would in particularallow the faster identification and exploitation of niche products. Rural producerscould exploit these but would need appropriate support through the provision of pub-lic goods specifically designed to disproportionately benefit the less well off.
III. Enhanced infrastructure
This should of course include better storage facilities and transport networks but thereis a need to undertake major investment in social infrastructure. The Yemeni govern-ment, it should be noted, is well aware of this set of issues and, along with majordonors, is actively engaged in trying to develop infrastructural capacity to enhance ruraldevelopment. The issue here, however, is the need to design and implement this insuch a way that disproportionately benefits the poor and near poor in rural Yemen.
One of the main priorities should be maintenance of terraces in the Highlands. In ruralYemen, terraces are public goods par excellence, and there is the need to undertake sub-stantial investment so that the dryland terraces and seasonal flood irrigation practicescan be modernized in a sustainable manner. One important by-product of this workwould be the provision of additional employment opportunities. An important ele-ment would substantive democratic decentralisation so as to address the needs of thosevulnerable to food insecurity and poverty.
IV. Rural finance
Currently, there is a dearth of rural credit. In 2003 only 2,230 farmers got formal cred-it from the Agricultural and Cooperative Credit Bank. Available agricultural credit
126
Chapter Eight: Agriculture and livelihoods in rural Yemen

stands at $30 per hectare, which is very low compared to other countries in the region.Moreover, the formal rural-credit system has been, to a large extent, ‘captured’ by therural landholding elite – though poorer households actually borrow more frequentlyfrom non-formal lenders and are more likely to be in debt (CSO 1999).
There are four main issues:1. The overwhelming use of debt in rural Yemen for consumption (CSO 1999).
This is true of both richer and poorer rural households. 2. The need to establish an appropriate institutional framework, which would of
necessity factor in the current prevalence of consumption-based borrowing.Here, valuable lessons can be learnt from small-scale experiences in the use ofmicrofinance in Yemen, which have demonstrated some of the same advantagesin the countryside that have been well documented in other contexts. Indeed,some financial organizations could be community based, with rotating savingsand credit clubs amongst smaller landholding farmers, and petty entrepreneursdeveloping funds to invest in improved land and water management, facilitatethe purchase of processing and packaging equipment, or cultivation or harvest-ing equipment, all of which could be owned communally, as well as providingloans for consumption shortfalls.
3. The lessons of other experiences in microfinance are important, in that it is nec-essary to ensure that a greatly expanded system is not captured by the elite, butrather delivers tangible financial resources to the poor. However, the establish-ment of a large-scale rural financial system that adopted some of the best prac-tices of microfinance would require substantial public resources. It is well estab-lished that many microfinance institutions must be heavily subsidized. This sub-sidy is paid by governments and by donors because of the pro-poor public goodcharacter of the subsidy. The issue of the extent of the subsidy necessary toexpand pro-poor access to finance is one for Yemeni policy makers to decide.
4. There is a need to increase dramatically the amount of credit that is availablethrough the rural financial system. Some have suggested $50 million (YCR2005), but whatever the amount it has to extends deep into the countryside andreach into the livelihoods of the poor and the near-poor.
V. Decentralized democratic governance
There is now a broad consensus among multilateral agencies, bilateral donors andnational governments that community-driven development, which is defined as givingcontrol of decisions and resources to community groups and local governments, canpromote local empowerment, participatory governance, demand responsiveness,administrative autonomy, greater downward accountability, and enhanced local capac-ity. To that end, donors and governments have sought to strengthen and financeaccountable and inclusive community-based organizations as well as attempting toforge functional links between these and formal institutions. Community-based organ-izations have been prioritized because donors and government believe that they cancomplement the activities of the market and the state by assisting in the building ofinfrastructure, improving access to education, organizing the delivery of microfinance,managing natural resources, and permitting the scaling up of pro-poor programmes. Inso doing, community-based organizations can improve the efficiency and effectivenessof rural development policies and enhance sustainability.127
Chapter Eight: Agriculture and livelihoods in rural Yemen

However, while decentralized governance can appear attractive, it is not the develop-ment solution that many of its proponents make it out to be. The reason is straightfor-ward: decision-making processes and public resources can be captured by elites andinterest groups at the local level even more readily than at the national level.
Moreover, inequalities and power relations in a community can infiltrate community-based organizations and affect how they work. These possibilities are all the moreapparent in rural Yemen, where patron-client relations remain very strong, particular-ly in the Highlands and in the Tihâma. If therefore decentralized governance is to beintroduced there is a vital need to build extensive capacity on the part of the poorersmall landholding farmers and petty entrepreneurs to be able to express their voice inlocal institutional settings.
VI. Shifts in the cropping pattern and the costs of transition
The World Bank has done extensive analytical work on the potential of Yemeni agri-culture, and much of it is remarkably optimistic given the state of water poverty .Recent World Bank analysis (YCR 2005: 18) suggests that rain-fed cereals could growat 12% per annum if the quality of indigenous seeds were improved and if better crophusbandry practices were introduced. It suggests the need for public support for agri-cultural extension services, because of their inherent character as a pro-poor publicgood. The Bank also suggests that fruit and vegetable production could grow at 16%per annum if, again, extension services were improved and if water management tech-niques were enhanced in a sustainable fashion. Finally, the Bank has also suggested thatthe growth of livestock could also be increased if husbandry practices improved, ifattention was paid to the need to encourage cross breeding, and if the management ofrange lands was made more effective.
The argument that Yemeni agriculture has good growth potential was further rein-forced by earlier World Bank (1999: Annex I) estimates of the domestic resource costsfor a range of crops. These suggested that cotton, dates, papaya, oranges, coffee, grapes,and tomatoes are highly efficient in their use of resources, while qat, onions, sesame,sorghum, millet, alfalfa and potatoes are relatively efficient.
Clearly, agriculture could grow. Indeed, it has been suggested that Yemen couldquadruple its agricultural output in 5 to 10 years (A-Shami 2004). This would requirebetter extension services directed towards the poor. However, policymakers face twoadditional challenges. The first is to ensure that the benefits of policy changes are notcaptured by rural elites. The second is to encourage poor farmers to switch to highervalue, more resource efficient crops. Here, a key issue is the costs of the transition. Forpoorer rural households, switching to a higher value output could threatens their liveli-hood security – especially for perennial crops, the return from which can take severalseasons to come on stream, and during which time the household must sustain its con-sumption. This implies income support that could be financed by a hypothecated taxon oil revenues – again so constructed that it is not captured by rural elites.
128
Chapter Eight: Agriculture and livelihoods in rural Yemen

A similar argument can be made with regard to qat. Ethiopian qat is cheaper, and inany event the government is committed to seeking to reduce the role of qat in Yemeniculture and society (World Bank 1999). However, even if one such strategy in doingthis was to liberalize the import of qat, in an effort to force farmers to alter their crop-ping patterns, this would still cause an income shock during the transition period.
VII. Sustainable water management and redistributive water-access reform
Clearly, policy must be introduced to deal with the water crisis. Multilateral agencies,bilateral donors and the government have all prioritized this, with measures bringingthe price of groundwater closer to its economic cost, establishing decentralized watermanagement associations, and encouraging the re-establishment of traditional water-conservation mechanisms in rain-fed areas. However, cost recovery, decentralisationand the renewal of long-standing systems of water management can only slow the rateof resource depletion; they are unlikely to solve the water crisis.
This is because of the lack of equitable access to water resources. Powerful landhold-ing individuals have been able to capture the bulk of investment in modern drilling andpumping equipment. The alternative is renewed support for traditional water controlsystems particularly in the rain-fed areas of the Highlands – accompanied bye decen-tralized democratic governance reforms. This would need substantial public investmentin water saving technologies and drought-resistant higher value crops such as fruittrees. It would also need investment in renewing terraces and land levelling so that dry,rain-fed terraces and seasonal flood irrigation practices can be resurrected. It would, inaddition, require the provision of income support for the transition period.
There is, moreover, an argument for redistributive water-access reform in the lift-pump irrigated areas. Again with decentralized democratic governance reforms, thiscould involve vesting control of rights in communities. Mechanisms would howeverhave to be put in place that encouraged water conservation – perhaps through watertaxes at the head of the watercourse which could also recover some subsidies.Improved extension services could also encourage a switch in cropping patterns,
VIII. Land tenure and redistributive land reform
Some might argue that the introduction of technologies to conserve soil and waterresources would be better with larger landholdings – to accrue efficiency gains in scaleand scope. That argument is not supported here. The agrarian transformation since theearly 1990s has indeed led to a reorganization of holdings and in part to a rise in foodinsecurity, inequality and in poverty in rural Yemen. Sustainable human developmentcannot be fostered by land-tenure arguments that privilege economic efficiency oversocial equity. Another approach is necessary and four issues stand out
1. A prerequisite of any rural land-tenure reform is the need to undertake a cadas-tre in rural Yemen. The government is committed to this necessary, but not suf-ficient attempt, to formalize the land-registration process.
2. With a successful cadastre, there should be a serious debate amongst policymak-
129
Chapter Eight: Agriculture and livelihoods in rural Yemen

ers and civil society on redistributive land reform. The costs and benefits of sucha proposal need to be seriously assessed, in financial and social terms. For themultilateral agencies and bilateral donors, the land reform that is on the agendais a ‘market-led’ process, though this is unlikely to be pro-poor (Borras 2004).At the same time, evidence on the utility of redistributive reform in meeting theaspirations of the poor remains strong. Land reform is a powerful, emotive issue,cutting across cultural, social, political and economic interests; but it is one thatshould be investigated.
3. Even in the absence of a debate about land reform it is apparent that farmers con-tinue to hold onto their fragmented holdings without any rationalization or con-solidation. The government should encourage a pro-poor consolidation of frag-mented holdings so as to increase the share of landholdings held by the smallest60% of landholders. As part of this process, the government’s plans to redistrib-ute 50,000 hectares should proceed, though the quality of this land will be poor.
4. Even without redistributive reform there can be tenancy reform. Although manysharecroppers are large landholders, for those sharecroppers without access toassets the security of their position can be tenuous. A process of formally regis-tering sharecropper contracts and establishing the security of tenure of those withformally registered contracts would give a powerful boost to pro-poor growth inrural Yemen. There is international evidence – principally, Operation Barga inWest Bengal, India – that demonstrates the impact that tenancy reform can haveon the poor, on agricultural growth, and on human development.
IX. What potential for pro-poor growth?
As this policy framework makes clear, there is potential for pro-poor rural growth.This will require more effective resource management, whether it is through landreform, improved water management systems, or infrastructural investment. It will alsoneed a rural financial system directed at the poor.
However, the most direct and immediate policy intervention should be in the crop-ping pattern. Poverty reduction in the Highlands will need intensification of produc-tion or, more likely, crop diversification towards higher value output – with incomesupport during the transitional period. In addition some authors suggest that somehousehold may have to exit from farming (Dixon and Gulliver with Gibbon 2001)though this does not take into account the range of pro-poor policy interventions pro-posed here. By way of contrast, according to the same authors there is significant scopefor agricultural growth and poverty reduction in the Tihâma through intensification,coupled with crop diversification and terrace restoration. Again, this analysis mayunderstate the potential of the Tihâma because it does not take into account the rangeof pro-poor policy interventions that are proposed here. In any event, smallholderfarmers will need income support during the transition period. Thus pro-poor policypossibilities cannot be left to markets; there is a need for significant public interventionin the provision of public goods, and public support.
130
Chapter Eight: Agriculture and livelihoods in rural Yemen

8.4. Conclusion: the political economy of rural relations and pol-icy reform
The following points are clear. 1. Domestic demand is an important engine of agrarian change, but there appears
to be an inequitable distribution of food entitlements in Yemen in general andrural Yemen in particular.
2. Changes in the technical coefficients of production during the 1990s were notuniform across Yemeni farms, but could be differentiated, particularly on thebasis of relative wealth, which in the first instance is predicated upon the size oflandholding.
3. The basis of this differentiation was a redistribution of land in favour of a small-er number of large landholders during the 1990s – facilitated in part by the abil-ity of those who had capital to increase their access to land through the use oflong-term sharecropping contracts.
4. As redistribution took place government intervention in the provision ofmechanical lift-pump irrigation served to concentrate control of access to wateramongst richer farm households
5. Expansion of the control of land and water by the richer farmers facilitated anexpansion of production amongst higher value market-oriented crops such asqat, fruit and vegetables.
6. The expansion of higher value production amongst relatively larger landholdingscontributed to rising income inequality.
7. The redistribution of land increased the availability of labour for hire.8. Redistribution of land increased the reliance of small landholders on seasonal and
casual wage labour as part of their livelihood strategies. 9. This reliance served to enmesh many rural households within deepening cycles
of vulnerability to poverty.
As a consequence of this analysis, the policy options appear reasonably clear. Simplyput, government must substantially increase its public spending on the rural economy.
This public support, some of which is already being developed by the government,albeit in a more piecemeal fashion than is suggested here, cannot be seen as an isolat-ed list of suggestions, but rather as an interrelated set of policies that both have strongcomplementarities and which have strong forward and backward linkages.
However, there are political constraints. In the key agricultural areas of the Highlandsand the Tihâma ‘traditional’ power structures remain strong. In Yemen prior to theagrarian transformation of the 1990s the sheikh stood for the community, both beforeand outside the government (Mundy 1995). During the 1990s, this changed as thegovernment actively sought to draw the sheikhs into a set of economic engagementsthat were predicated upon the possibility of individual and household advancementrather than the advancement of a tribal community. In particular, the effective ‘enclo-sure’ of what had been common irrigation water eroded political relationships at thecommunity level and led to conflicts between those who owned pumps upstream andthose that relied upon common water. This served to weaken the role of the commu-nity in favour of the private.
131
Chapter Eight: Agriculture and livelihoods in rural Yemen

At the same time, in Yemeni culture the community is defined by those who are land-holders while labouring has a comparatively low social status. Yet government policyin the 1990s, in promoting the economic interests of the sheikhs, has facilitated theemergence of big landlords in the Highland and the Tihâma. In so doing, the govern-ment has created a constituency with a vested interest in supporting the activities ofthe government, rather than the community.
These political and social arrangements are a powerful constraint. Only by addressingthese and resolving the inherent contradictions in economic policy can the govern-ment develop a pro-poor policy regime.
132
Chapter Eight: Agriculture and livelihoods in rural Yemen

9.1 Introduction
Since initiating a programme of radical economic reforms in 1995, Yemen has becomeone of the most open and trade liberalized economies in the MENA region. Economicliberalization has yet, however, to be translated into tangible economic benefits for themajority of the population. Most non-oil exports remain primary, low value-addedproducts and along with the dominance of oil exports, the economy is vulnerable toprice and demand fluctuations in global markets.
The manufacturing sector at present plays a minor role in the economy. It accounts forapproximately 10% of GDP, is growing relatively slowly and has yet to realize itspotential to improve its export performance. The sector is dominated by small andmedium size enterprises (SMEs), with limited technological capabilities, few inter-industry linkages, and constrained by inadequate infrastructural facilities, skill shortagesand inadequate institutions.
Yemen has a culture of trade rather than production, and there is as yet little evidenceof the emergence of a dynamic private sector. Privatization has so far had a limitedimpact and there is only limited direct foreign investment (DFI). The Yemeni econo-my is one of the least competitive in the world.
The achievement of the Millennium Development Goals will require employmentcreation on a large scale in the manufacturing and service sectors. The question is notwhether to industrialize but how. Given the Yemen’s limited domestic market, anyindustrialization strategy needs to be export-led – exploiting existing comparativeadvantages and developing new, dynamic competitive advantages. Yemen must learnfrom the experience of the East and South East Asian economies, and the GoY mustbe willing and able to fulfil the functions of a developmental state, especially withrespect to creating the institutions necessary to overcome pervasive market failures.
9.2 The trade sector
In recent years the Yemeni economy has become more open: between 1991 and 2003as a percentage of GDP trade in goods rose from 39% to 66%, and trade in servicesfrom 10% to 11%. This however its not based on increased real value of trade; it ismainly due to the exchange rate reform and revaluation of the oil revenues at the mar-ket exchange rate. Radical policies undertaken by the GoY to liberalize and reformtrade have thus not translated into significant changes.
133
Chapter NineTrade and industry
Chapter Nine: Trade and Industry

Over the period 1990-2003 as a result of volatile export prices the trade balance expe-rienced significant fluctuations – in deficit between 1990 and 1998 and in surplusthereafter. The services balance49 on the other hand has been in deficit for the wholeperiod for which data are available. This is illustrated in Figure 9.1.
Figure 9.1: Balances of trade and services, current Account and Overall Balance ($m)
Source: Ministry of Planning and International Cooperation, Central Statistical Organization (2003),
Statistical Yearbook, August 2003.
Oil accounts for approximately 95% of total exports, with fish in second place. Thecomposition of non-oil exports is shown in Figure 9.2. With respect to imports, thelargest items were manufactured goods and machinery and equipment, followed byfoodstuffs. Figure 9.3 shows the composition of imports.
Figure 9.2: Composition of non-oil exports, 1993-2001
Source: CSO, Statistical Yearbook, various issues.
134
Chapter Nine: Trade and Industry
-1500
-1000
-500
0
500
1000
1500
2000
1990 1991 1992 1993 1994 1995 1996 1997 1998 1999 2000 2001 2002 2003
Trade Balance Service Balance Current Account Overall Balance
0%
10%
20%
30%
40%
50%
60%
70%
80%
90%
100%
Food and Beverages Raw materials Chemicals Manufactured Products
1993 1994 1995 1996 1997 1998 1999 2000 2001
49 There is no clear definition in the Statistical Yearbook for what services mean and hence we adopt the defini-tion of the IMF and UNCTAD: Services are the economic output of intangible commodities that may be pro-duced, transferred, and consumed at the same time. They include 11 major categories, namely transport, travel,communication, construction, insurance, financial services, computer and information services, royalties andlicense fees, other business services, personal and cultural and recreational services, and government services.

Figure 9.3: Composition of imports (1993-2001)
Source: Statistical Yearbook 2004
Yemen’s export performance over the period 1995-2000 was not impressive. Ananalysis based on revealed comparative advantage indicates that Yemen has failed tomove into product lines that are growing faster than world trade as a whole. Indeedthe opposite appears to be the case – Yemen is increasing its exports in commodity cat-egories that are experiencing below-average growth in global commodity markets.
In general, Yemen’s export performance is a cause for concern. Exports are concentrat-ed in a narrow range of primary products. Oil is a finite resource and reserves are like-ly to be exhausted in the near future. And non-oil exports are concentrated in slow-growing sectors of global trade in which Yemen will face stiff competition from otherlow-income economies. Yemen has a high export similarity with other Arab countries,especially the Gulf economies and there is no evidence that Yemen will be in a posi-tion in the near future easily to develop an export-led industrialization strategy.
Yemen’s trade is highly concentrated geographically. Most exports are directed to ahandful of non-Arab Asian countries accounting for more than 75% of its total exports.The Arab countries absorb on average 10% of Yemen’s total exports. On the importsside, the Arab countries and especially the Gulf Cooperation Council (GCC) countriessupply around 40% of its imports, followed by non-Arab Asian countries whichaccount for around 23%.
The most important export markets include India, Thailand, the Republic of Korea,China, and Singapore, each accounting on average for more than 10% of Yemen’s totalexports. Among the most important Arab importers are Saudi Arabia (about 2%), fol-lowed by Kuwait, Egypt and the United Arab Emirates. Total exports to the Arab coun-tries are less than the exports of one of the top non-Arab Asian countries. Furthermore,since 1995 there have been changes in major export destinations, with a number ofEuropean economies, including Germany, France and Austria becoming less significant.
On the imports side, the major exporters to Yemen are Saudi Arabia and United ArabEmirates, each accounting for more than 10% of Yemen’s total imports. They are fol-lowed by Kuwait, China, USA, and India.
135
Chapter Nine: Trade and Industry
0%
10%
20%
30%
40%
50%
60%
70%
80%
90%
100%
1993 1994 1995 1996 1997 1998 1999 2000 2001
6-9 Manufactured Products4- Animal & vegetable oils & fats 5- Chemicals
3- Mineral fuel & lub. Oil1- Beverages & tobacco0- Food & live animals

Yemen is unusual among Arab countries in having a high export concentration withnon-Arab Asian countries. The Arab countries in general have either a high geograph-ical trade concentration with the European Union, or the USA. Yemen’s unique tradepattern might be related to historical ties between Yemen and the handful of non-ArabAsian countries to which Yemeni nationals have migrated. The exports of fish andmeat products support this hypothesis.
Yemen is a member of relatively few formal regional trade agreements (RTAs). Forexample, it has recently joined the Pan Arab Free Trade Area (PAFTA) Agreement asa least developed member country, but the conditions for least developed countries arestill not very clear. Yemen has a preferential trade agreements with Saudi Arabia whichentered into force in 2000. It also has one with Iraq, ratified in 2002, but due to thesituation in Iraq, this agreement has not come into force.
In the case of Saudi Arabia, the agreement allows reciprocal preferential treatment ineach other’s market. However, with the full implementation of the PAFTA in 2005,this agreement is likely to be obsolete (unless extensions are given to least-developedmembers). The GoY has been pursuing membership of the Gulf Cooperation Council(GCC), and in 2002 Yemen joined the GCC bodies related to sport, labour, educa-tion, and health. A new project is underway to establish a free trade area betweenYemen, Sudan, and Ethiopia50, though this has not yet been implemented and nego-tiations are taking place slowly.
Yemen also has agreements with 56 other countries. These, however, do not extendbeyond signing a protocol on trade promotion or investment promotion, and are rel-atively diverse in terms of their nature, content and geographical distribution. In real-ity such agreements remain on paper without actual implementation. Finally, the USAsigned a Trade and Investment Framework Agreement (TIFA) with Yemen in 200351.
Yemen by most measures has a liberal, open, market economy. It started its tradereform programme in 1995 with the assistance of the World Bank and the IMF, aim-ing to liberalize and integrate into the global economy. The maximum tariff wasreduced from 200% in 1996 with 15 bands, to 25% in 1997 with 4 bands. The weight-ed average tariff rate is 10.5% – lower than that in the majority of Arab non-GCCmembers – and 51% of items lie in the 5%-10% band.
Tariff revenue accounts for about 29% of Yemen’s tax revenues and around 5% of totalgovernment revenue. The average tax collection rate is around 8%, which is relative-ly low, largely as a result of various forms of exemption.
Yemen does not follow any specific policy regarding targeting promising export sec-tors and promoting them through subsidies or any other means of assistance. It doesnot impose any export taxes. Its Customs Law (Law No. 14/1990) allows for dutydrawbacks for exporters on imported components used in the manufacture of an
136
Chapter Nine: Trade and Industry
50 Draft Agreement of setting up a free trade area between the three countries in 2004.51 TIFA agreements have been signed by the USA with a large number of countries around the world. They areconsidered to be the first step in the creation of free trade areas.

exported good. As noted above, the GoY has adopted trade policy reforms that haveliberalized and opened up the economy, following an orthodox neo-classical policyagenda. However, tariff escalation remains an important issue, and the effective rate ofprotection is relatively high in some sectors such as the plastics and leather industries52.
Yemen has no quota systems, and does not apply discriminatory non-tariff barriers. Itdoes have Sanitary and Phytosanitary measures, consistent with the principles of theWTO.
The efficient functioning of a liberal open economy depends on appropriate organiza-tions and institutions that can ensure positive outcomes of market processes. However,Yemen largely lacks such organizations and institutions. It has, for example, neither anantidumping authority nor a competition authority.
Most Yemeni trade-related organizations are not able to carry out their functionsowing to a combination of limited human capital and weak enforcement mechanisms.The customs authority is weak despite its adoption of the Automated System forCustoms Data (ASYCUDA), which contributes to a high incidence of cross-bordersmuggling.
With respect to standards, the Yemen Standards, Metrology and Quality ControlOrganization (YSMQCO) is responsible both for formulating technical regulations andstandards of products and processes and for assessing and enforcing conformity ofimporters, exporters and manufacturers with these regulations and standards. In 2002however, UNIDO reported that YSMQCO was not up to international standards.The WTO administers the implementation of a set of agreements that include theAgreement on Technical Barriers to Trade (TBT) and the Agreement on theApplication of Sanitary and Phytosanitary Measures (SPS). Governments have increas-ingly imposed mandatory technical regulations on products for reasons of security,health or the environment and have introduced non-mandatory standards for productsin order to facilitate their trade and utilization. Member countries of the WTO mayapply trade-restrictive measures for the protection of human life or health or of plantand animal life and health.
The enforcement of such standards in the domestic market extremely difficult becauseof large-scale smuggling. It is difficult for Yemeni enterprises that meet approved stan-dards to compete with smuggled goods. With respect to exports, SPSs in particular areincreasingly being used to protect human and animal health, and Yemeni exporterswill need proper certification before they can be guaranteed access to key overseasmarkets. The YSMQCO has a vital role to play in this respect and any shortcomingsin its ability to enforce standards will damage Yemen’s future export performance.Further international assistance might well be necessary to ensure that Yemeni accred-itation procedures meet international standards.
137
Chapter Nine: Trade and Industry
52 See Ministry of Planning and International Cooperation (2002) unpublished mimeo.

9.2.1 Implications of WTO accession
Accession to the WTO was formally applied for in July 2002, and Yemen submittedits Memorandum on the Foreign Trade Regime (MFTR). Since then, the GoY hasreceived a number of questions from WTO members, especially the USA and the EU,enquiring about different regulatory issues with the questions mainly related toIntellectual Property Rights (IPR).
There are several legal implications of Yemen accession to the WTO that involve theenacting of certain laws and regulations to be in line with WTO requirements, or theenforcement of certain regulations that exist in theory but are not implemented in real-ity. Among the first group of laws and regulations is that on IPR. The second groupincludes some not required for accession but important for Yemen’s development, forexample, competition law, anti-dumping and countervailing measures.
Among the major accession problems is the lack of people who can master WTO issuesand handle negotiations. The establishment of a WTO Accession Unit under the aus-pices of the Ministry of Industry and Trade is a step in the right direction. However,there is a lack of awareness of WTO issues among the whole of Yemeni society,whether government or private sector.
The efforts so far undertaken by the GoY to ensure successful accession are far fromcomplete. But accession is not the whole story. As Yemen moves to a market econo-my, it will have to address issues of market failure – through such institutions as appro-priate and enforceable regulatory frameworks, financial institutions, educational andtraining institutions and the encouragement of research and development. Only whenthese are in place, along with an appropriate macroeconomic framework, will Yemenhave any chance of pursuing export-led development.
Least developed countries have several advantages in the WTO that in principle shouldbenefit Yemen’s development efforts. Such provisions include longer transitional peri-ods, increased technical and financial assistance, and allowance to provide subsidies forexporting. However, before becoming a member, it is likely that Yemen will be requiredto accept several binding obligations that may restrict its benefits after accession.
9.2.2 Policy recommendations
The challenges facing Yemen include achieving higher economic growth that willtranslate into poverty reduction, developing human resources, improving infrastructurefacilities and strengthening social protection for vulnerable groups. Yemen has under-gone significant trade liberalization but has yet to realize the potential benefits of sucha strategy.
1. An Export Promotion Council. The main constraints are largely on the supply,rather than the demand, side. However effective institutions, such as an ExportPromotion Council, are needed to promote existing and non-traditional exports.As Yemen becomes more fully integrated into the world economy it needs to
138
Chapter Nine: Trade and Industry

identify and target new products and markets (leather products, handicrafts) andupgrade existing exports (natural honey and coffee, for example). For this it willneed to acquire more sophisticated marketing skills.
2. Investment options. Yemen should seek non-conventional options for enhancingtrade and investment, for example, offset agreements where the purchase ofweapons from a developed country is complemented by direct foreign investmentin civil industries. Moreover, Yemen should try to promote the service sectorswhere it enjoys a potential comparative advantage – for example, in tourism andsea transport. The infrastructure for both services remains weak, however.
3. Free Trade Zones. Yemen’s main free trade zone is Aden. This has suffered froma number of problems, ranging from idle, undeveloped land to the overlappingof jurisdictions with respect to different zone activities. On the other hand,Yemen does not suffer from land titling or property rights problems so it coulddevelop additional free trade zones while alleviating the problems in the estab-lished zone.
4. Choosing partners. In the new global economy Yemen should choose its tradeand investment partners strategically . With increasing raw material prices, tradebetween Africa and Asia is bound to expand and Yemen is in a unique positionto take advantage as a trade hub. China in particular is very keen to invest inports to create a hub in Aden for raw material exports from Africa to China.Such large-scale foreign investments are critical for the future of Yemen.
5. Fisheries. The most important non-oil, export sector is fisheries – and the exportpotential is huge, although it has been mismanaged in the past. The YemeniMinistry of Fish Wealth is still responsible for several carriers as well as for somefisheries marketing and production agencies. Recent reforms in this sector canhelp to boost exports while increasing the revenue accruing to the GoY. Thereis an urgent need to upgrade the infrastructure dealing with fish-transport, han-dling, storing, and conformity assessment issues (testing, certification, accredita-tion, etc.)53. Membership of the WTO should ensure that Yemen has bettermarket access for its fish product exports in the future, though the standards ofthe importing countries will have to be met as per the SPS Agreement. The keyis to combine improved management of fishery resources, which is currentlyunderway, with the development of better infrastructure for exporting. From adevelopmental perspective, it is better to increase the domestic value-added byprocessing fish rather than exporting them raw. However, processing facilitieswill require capital investment that is not forthcoming at present. Other studieshave recommended a review of licensing procedures54 (which has already hastaken place) and suggested new fish farming methods.55 These should be
139
Chapter Nine: Trade and Industry
53 For a review of all the required steps needed to enhance competitiveness in this field, see UNIDO (2002)“Sustaining Competitiveness in Global Markets: Preparing Yemen for WTO Accession”, draft format.54 For a review of the licensing procedures see World Bank (2003), “Poverty Reduction Strategy” draft format.55 See for example World Bank (2002), “Economic Growth in the Republic of Yemen: Sources, Constraints,and Potentials”, Washington D.C.: World Bank.

encouraged by both the GoY and international donors to assist Yemen in rais-ing value-added and perhaps developing new markets for Yemen’s fish products.
6. Foreign Direct Investment. Private investment in Yemen fell to around 10% of GDPfrom 2000 onwards (Statistical Yearbook, 2003), and on a number of occasionssince 1994 outflows of capital have exceeded inflows. For FDI Yemen is one ofthe least attractive countries. The latest World Investment Report (2003) ranksYemen as second from bottom in terms of FDI net inflows – $89 million. Thisis a significant fall from $136 million in 2001 and an annual average of $203 mil-lion over the period 1992-9756. This is mainly the result of a poor investmentclimate, the absence of efficient institutions, and the lack of security with respectto property rights related to land titling, coupled with a weak judiciary. Toattract FDI, the GoY should start by solving the land titling problem andimproving the judicial system.
7. Regional Linkages. Given the limited industrial base and the scarce human andfinancial resources required to develop such a base, Yemen should seek to enterregional value chains and specialize more in areas where it has competitiveadvantages. Natural honey, coffee and fish and fish products have already beenmentioned. Participation in such value chains may help overcome Yemen’sfinancial, human and technical constraints and assist the export promotionefforts.
9.2.3 Trade liberalization and human development
Many low-income economies pursuing structural adjustment and liberalization pro-grammes have embarked on trade liberalization. However trade theories do not saymuch about how trade can contribute to human development, nor is there strongempirical evidence that trade openness automatically produces higher economicgrowth and subsequently enables the achievement of poverty-reduction and human-development goals. While acknowledging the above, a recent UNDP report (2003)has underlined a two-way relationship between trade and human development.
Trade can contribute to human development mainly through employment-ledgrowth. By creating new employment opportunities, it generates more income thatcan be used by households or individuals to improve nutrition and invest in children’seducation or skills development, and thus enhance human capabilities. Growth can alsogenerate additional government revenue that can be used to reduce inequalities andimprove health and education. In addition to these direct growth effects, “trade canenlarge people’s choices by expanding markets for goods and services and by provid-ing stable incomes for households” (UNDP, 2003, p. 27).
Finally, trade can contribute to human development when its benefits are used toincrease equity among different groups, including between men and women, andwhen it improves women’s socio-economic conditions – more employment opportu-
140
Chapter Nine: Trade and Industry
56 See UNCTAD (2004), World Investment Report: The Shift Towards Services, New York and Geneva: UnitedNations.

nities, higher wages and more secure jobs. However the experience of many develop-ing countries in the last two decades suggests that greater integration with the globaleconomy can also make these economies and societies more vulnerable to externalshocks, “threatening the security of livelihoods and incomes” (UNDP, 2003, p.27).
Conversely “better human development outcomes, in the form of improved capabili-ties as the result of a healthier, better educated and more skilled workforce contributeto higher economic growth and better trade outcomes” (UNDP, 2003, p.27). Fromthis perspective, countries poorly endowed with human resources and infrastructuremay be unable to benefit substantially from trade.
9.3 The manufacturing sector
In Yemen the manufacturing sector plays a minor role. Between 1990 and 2003, themanufacturing sector contributed on average 9.7% of GDP (excluding oil) and employed12% of the labour force. In the 1990s manufacturing value-added grew on average by7.8% annually – lower than the 10% growth envisaged in the Second Five Year Plan(SFYP) (World Bank, 2002, p.15). Performance was very volatile but since 1995 has sta-bilized at a lower real growth over the period 1995-2003 of 5.4% per annum.
From 1970 to 1990 the GoY aimed to modernize the Yemeni economy throughindustrial growth, import substitution and employment generation. This has largelyrelied on the public sector, especially in South Yemen. The private industrial sectorhas been very limited, especially in the North.
In the past the manufacturing sector expanded as a result of growth in domestic con-sumer demand – fuelled by economic growth and Yemeni expatriates in the Gulf. Thegovernment offered some incentives to local manufacturers by providing tariff protec-tion, and quantitative restrictions – classic import-substitution policies.
Table 9.1: Gross output and value-added in the manufacturing sector 2000,YR millions
Firms No. of Gross Value- No. of Owners/ Paid Labour Paid Value-(by size) Enterp. Output added Emp. Unpaid Emp. Prod- Workers added
Emp. uctivity Prod- peructivity Emp.
Large Enterp. 377 304,542 67,946 49,817 428 40,421 6 7,534 1,663
% of total 1% 87% 73% 41% 1% 63%
Medium Enterp. 1,316 6,551 3,792 8,101 3,147 4,531 0.808 1.446 0.494
% of total 4% 2% 4% 7% 7% 7%
Small Enterp. 33,832 351,178 20,829 63,509 42,547 18,805 0.631 2 0.339
% of total 95% 11% 23% 52% 92% 30%
Total 33,832 351,178 92,567 121,427 46,122 63,757 2.892 5.508 0.842
Source: Industrial Survey 2000, p. 21; Central Statistical Organization.
Enterp. denotes enterprises.
The industrial sector is a relatively new area of economic activity. Most industries wereestablished between the second half of the 1970s and the 1980s and have been concen-141
Chapter Nine: Trade and Industry

trated in food- and beverage-processing plants – which require low capital investment andoperating costs, with high returns. In 2003, the food and beverage industry represented25% of the sector’s value-added, followed by the structural and non-metallic productsindustry with 13%, and the tobacco industry, with 11.6%. Over the last five years the con-tributions and ranking of the leading sectors have not witnessed major changes.
Most industrial sectors have a significant regional presence, but most businesses arelocated in cities, with the largest concentration of establishments in the capital, Sana’a,with 18.6%, followed by Taiz (11.2%), and Ebb (10.8%) and Hadhramout governorate(9.5%, Hodeidah (8.1%), and Aden (5%). Most small governorates and towns areunable to attract investment.
The sector is dominated by small establishments employing fewer than four peoplewhich in 2000, represented 95% of operating establishments; medium size enterprisesrepresented 4% and large firms only 1% (Table 9.1)
This pattern is clear across all sectors. Small firms face relatively minimal difficulties inentering a market, though face significant obstacles to growth in value-added and spe-cialization.57 The available data suggest that most small firms are run by one or twoindividuals with little interaction with intermediaries.
Table 9.2: Number of manufacturing establishments by size and activity2000
ISIC Activity Large Medium Small Total
15 Food Processing 74 336 15289 15699
16 Tobacco Products 3 17 123 143
17 Manufacture of Textiles 14 47 943 1004
18 Dressmaking and Fur dyeing 7 54 2,768 2,829
19 Bags, Shoes and Hide tanning 11 8 215 234
20 Wood Products 14 96 2,002 2,112
21 Paper and Paper Products 12 - - 12
22 Printing and Publishing 18 36 29 83
23 Refined Petroleum Products 2 - - 2
24 Chemical Products 13 1 - 14
25 Plastic Products 21 4 - 25
26 Structural Non-Metallic 34 271 2,748 3,053
28 Worker Metal Products 44 191 3,238 3473
29 Machinery and Equipment 2 3 6 11
31 Electrical Equipment and Apparatus 2 - - 2
35 Other Transport Equipment 2 18 21 41
36 Furniture 11 16 1,559 1,586
40 Electrical Supplies 29 38 933 1,000
41 Water Purification and Distribution 29 52 1,852 1,933
Total 377 1,316 32,139 33,832
Source: Industrial Survey 2000, pp. 29-31.
142
Chapter Nine: Trade and Industry

In terms of total employees in manufacturing, however, the large firms make a signif-icant contribution. According to the Industrial Census in 2000, large establishments,which constituted 1% of total establishments, employed 49,817 employees, represent-ing 41% of total employment in the sector. Medium-sized enterprises, which repre-sented 4% of establishments, employed 8,101 employees, equivalent to 7% of the sec-tor’s total employment, while small establishments employed 63,509 employees, rep-resenting 52% of employees.
The number of the employees in the manufacturing sector in 2000 reached 121,427 –comprising 63,757 permanently paid employees, 11,548 temporary employees and46,122 owners and non-paid employees. The number of employees declined by 1.4%in the year 2002 to 119,625. The main reason for this fall was the closing down ofsome small firms that could not longer operate in the market. The drop in employ-ment and the number of establishments was associated with a decline in the value-added of small establishments, which fell by 5.8% at current prices between 2000 and2002. Medium-sized establishments managed to increase their value-added by 6.8%over the same period. Medium-sized enterprises seem to be more resilient and havemanaged to adapt more quickly to changes in market conditions. Figure 9.4 shows themain features of the manufacturing sector in Yemen over the period 2000-03.
Figure 9.4: Basic indicators of small, medium and large enterprises inmanufacturing, 2000-2003
Source: Based on Industrial Survey 2000, p. 21; Central Statistical Organization.
There are significant variations in levels of labour productivity across sub-sectors andsize classes. The larger firms in general have higher levels of productivity (tobacco andcigarettes, chemicals and chemical products, paper and paper products, for example).
Sub-sectors that are more labour intensive (wood and structural non-metallic products)tend to have lower levels of labour productivity, making them less competitive. Inactivities such as furniture-making and textiles and garments, where Yemen mighthave a comparative advantage, immediate action is needed to enhance productivity andcompetitiveness.
143
Chapter Nine: Trade and Industry
57 Economic Growth in the Republic of Yemen: Sources, Constraints and Prospects, World Bank (2002), Washington,USA.
0.95
0.23
0.52
0.02
0.04
0.07
0.01
0.73
0.41
0.76
0%
20%
40%
60%
80%
100%
Size Value Added Employment Wages
Small Medium Large
0.04
0.04

The UNIDO 2002 58 benchmark factors that greatly influence competitive industrial per-formance (CIP) are skills, technological efforts, inward FDI, technological licensing andmodern infrastructure. Yemen ranks 90 among 93 countries included in the analysis.
In developed economies, SMEs are often found in modern manufacturing and servic-es sub-sectors – often in the field of cutting-edge technology – with strong entrepre-neurial bases, vibrant exports and a large base of educated technical manpower. In themajority of low income, developing economies, however, SMEs are generally concen-trated in labour-intensive, low-technology and traditional activities, with low levels ofproductivity and poor quality products. There is little or no technological dynamismin this sector, and few enterprises graduate into larger enterprises. SMEs are unlikelyto be part of an integrated manufacturing sector and this is the situation in the Yemen.Large enterprises are virtually isolated from medium and small-scale enterprises – main-ly because of weak infrastructure, information shortages and weak contractual -enforcement mechanisms.59
SMEs in Yemen suffer from well documented problems – limited managerial expert-ise, imperfect capital markets, limited or non-existent technical and financial assistance,imperfect markets for the purchase of inputs and perhaps for the sale of output. SMEsare very vulnerable to greater competition from imports and have limited potential forgrowth. And although ease of entry and exit may well be good for competition, acombination of market failures and policy-induced distortions may well prevent theemergence of a dynamic, enterprising and innovative SME sector.
In addition to the internal dynamics of enterprise performance, productivity has beeninfluenced by the incentive structure, at the heart of which is the trade regime. Thedevelopment of the manufacturing sector, with its low productivity and poor growthperformance, has been affected by trade liberalization and the economic, financial andadministrative reform programme. The policy of protecting local production has beengradually relaxed, the role of the public industrial sector has been reduced, and a num-ber of public enterprises have either been privatized or are awaiting the government’sdecision regarding their future.
9.3.1 Policies affecting the manufacturing sector
Yemen has thus far focused on the mining and petroleum sectors, but had no coher-ent strategy to develop the manufacturing sector. It has certainly had declared goals butthey but has not backed these with implementation mechanisms or the necessary fund-ing – nor, apart from policies on trade or non-tariff barriers, has it paid sufficient atten-tion to investment laws or labour market regulations or had a proper infrastructure tolaunch the sector and attract more resources. Policies and incentives on their own arenot sufficient. Faced with market failures, the GoY needs to create the necessary insti-tutions for successful industrialization (Lall, 1991).
144
Chapter Nine: Trade and Industry
58 Industrial Development Report 2004, UNIDO Vienna. 59 For substantiation of this claim about the overall business environment, see the recent World Bank publicationon doing business in Yemen.

Investment policies
In 1991 the government introduced a new investment law that provided incentives forinvestors. It created the General Authority for Investment (GAI) to operate as a one-stop shop for investors – implementing the law and managing the process in terms oflegislation, facilitation and promotion. From time to time, the promotion section issuesa list of investment projects that appear to be feasible.
Although investment policies and the investment environment have improved, thereare still many difficulties: a lack of financial incentives and support; the lack of admin-istrative services; and the inappropriate and inefficient judicial system. Many privatesector investors complain about the procedures and long delays in court cases and theincomplete implementation of regulations. Local and foreign investors have to dealwith corruption, land disputes, uncertain property rights and inefficient judicial andfinancial systems.
In 1998, the Foreign Investment Advisory Service (FIAS) reviewed the investment lawand said that foreign investors saw it as “generally acceptable for an average develop-ing country,” but with certain major weaknesses. In June 2002 the Parliament replaced it with a new law which changed the treatmentof ‘protected’ sectors, replaced licensing with simplified registration procedures andreduced the GIA’s regulatory functions.
Taxation
There have been some important improvements in tax administration, such as theintroduction of a new taxpayer identification system and computerized taxpayer regis-tration, and the adoption of self-assessment procedures. But since most SMEs do notkeep accounting records the government imposes taxes arbitrarily. SMEs feel that taxesare not proportionate to their profits, and that tax administration officials apply assess-ment criteria inconsistently. This has discouraged new businesses and tempted formalones practice informal operations or underground activities in order to evade increasedtax assessments. The small business sector is one of the most important sources ofemployment but has received little support from the state – partly because it is seen astax dodging and anti-modern.
Land
Here the problem is the absence of an effective means of identifying, securing anddefending titles to land. A range of land-ownership systems coexist with one another,including private land owned under modern and customary titles.
In most low income countries, the main source of collateral for credit is property. ButBanks are seldom engaged in mortgage lending because land titles are hard to establishand enforce and because courts are very reluctant to order eviction of defaulters. Smallentrepreneurs without collateral have to use their own savings or borrow from thefamily.
145
Chapter Nine: Trade and Industry

9.3.2 Manufactured exports performance
The manufacturing sector’s contribution to exports has been marginal – less than 1%of merchandise exports and 26% of non-oil merchandise exports. In 2003, theyamounted to just $41 million. Over the period 1998-2003 non-oil exports, includingagricultural, fisheries and manufacturing products, averaged 8% of total exports.
A 2002 survey covering 263 manufacturing firms involved in export provides severalconclusions regarding export performance.60 A majority of small and medium-sizedenterprises said that a significant obstacle to exporting was weak or inadequate infra-structure, though large firms do not consider this a major constraint. The smaller enter-prises, unlike the larger ones were also concerned about the high cost of raw materi-als. This difference arises because large firms are more likely to be vertically integratedand able to set up their own logistics.
Large firms can secure funding while small and medium scale firms regard this as amajor obstacle. This is consistent with the earlier description of commercial bank lend-ing policies, which favour prominent and well-established entrepreneurs.
The size of the firms, both respect to with employment and capital, seems to be ofimportance. Strong performers in the export market are concentrated in firms thatemploy 50 persons or more. Firms which employ 11-20 are the least involved inexporting. SMEs, which dominate the manufacturing sector, make very little contri-bution to exports. Many medium-scale manufacturers expressed a desire to engage inexporting but they did not know how to access government technical and logisticalsupport. In addition, they appear to have no associations through which they couldcollectively pursue their objectives.
Weak and medium performers saw the business environment and investment regula-tions as a major constraints, though strong performers did not perceive this as a majorproblem. This is because large firms are able to bypass cumbersome official proceduresby resorting to informal networks, while small and medium-scale manufacturers unableto break the bureaucratic cycle. Obstacles might not be embedded in the enacted reg-ulations, but arise as a result of the application of law. In general, unlike the low andmedium performers the strong export performers do not have problems accessingexport finance.
Exporting firms thus seem to suffer more from domestic obstacles than from externalconstraints. This is because most Yemeni exports are primary commodities based moreon comparative advantage than on dynamic competitive advantage. The same prob-lems that burden the manufacturing sector limit the potential to boost exports.Therefore, dealing with the manufacturing sector’s problems will to some extentremove the obstacles that hamper penetration of export markets.
146
Chapter Nine: Trade and Industry
60 Abdullah Sanafi, 2002, “Export Performance in Productive Enterprise in Yemen” (Arabic), the Economic Journal ofEconomics and Business College (Sana’a University), Sept. 2002 – March 2003, pp. 346-392.

9.3.3 Challenges to promoting the manufacturing sector
Development of the manufacturing sector requires an environment that encourages theexploitation of new competitive advantages. It is essential therefore to establish appro-priate linkages with the rapidly changing global environment.
It will also be important to establish linkages between SMEs and large firms – to fur-ther integrate SMEs into the economy while allowing the large firms to reduce unitcosts and hence become more competitive. This could be achieved by creating insti-tutions through which the two groups can interact, and by creating a data bank toidentify potential areas for mutual cooperation.
Among the constraints to competitiveness as identified by UNIDO 2004, are the lowavailability of business development support (BDS) services – such as operationalindustrial labour market information systems, and local competitive capacities in theareas of marketing, maintenance and quality control – as well as the limited availabili-ty of industrial parks.
Lall et al. (2004) argue that enterprises do not build capacities in isolation. They inter-act constantly with other enterprises, equipment manufacturers, technology and R&Dinstitutions and international sources of knowledge. Thus, capacity building is a col-lective process, both within and outside the enterprise. It is therefore important forYemen to create this web of networks.
Moreover, the bedrock of industrial success is formed by domestic enterprises anddomestic capabilities. It is vital therefore to build strong domestic capabilities. FDI canprovide additional resources and/or missing factors but it cannot substitute for a weakand inefficient productive base. Nowadays, multinational corporations have becomemore selective and want to invest in higher quality activities – in countries that havestrong suppliers, active technology institutions, capable workers and managers andwell-managed infrastructure.
Yemen has devoted little attention to quality and standards. For example, there are fewproper quality-control assurance procedures and a large number of substandard import-ed goods are finding their way into the country, either through direct trade or smug-gling. Some manufacturers argue that adhering to domestic quality standards is some-times costly – and constitutes a waste of resources as the market is flooded with low-quality goods. This discourages many manufacturers from adhering to high standards –with adverse implications for exports.
Among the other issues that affect manufacturing-sector performance is the source offinancing. Many small entrepreneurs that are unable to provide collateral have to cre-ate small plants that require minimal capital and rely on family members and relatives.Though this dynamic is useful, theoretically, in generating employment and competi-tive sectors, it means that the character of new business is dictated not by market needsbut rather by capital constraints.
147
Chapter Nine: Trade and Industry

According to the IMF (2003), the main private clients of the banking system are the largefamily-owned enterprises that dominate the formal business sector. Often they are alsothe main bank shareholders. Banks are reluctant to lend outside of this limited group ofcompanies because of the difficulties they face in ensuring repayment or exercising rightsover collateral. Lenders see little point in taking defaulters to court because borrowersunwilling to pay can defer judgment almost indefinitely, or avoid enforcement.
In order to overcome the lack of financing, the government has created several spe-cialized credit institutions. These often base their lending decisions less on sound eco-nomic analysis and more on social and informal networks. Socio-political factors haveplayed an important role in the allocation of resources, which may partly explain thecollapse of the industrial development bank founded in the early 1990s to promoteSMEs.
9.4 Conclusions
Yemen needs to build a sound macroeconomic base, supplemented by more targetedmicro-policies for promoting technical and entrepreneurial skills, technological com-petence and home-grown competitive capacity, as well as appropriate incentivesdesigned to attain sustained productivity growth, export diversification and the devel-opment of the manufacturing industry.Most of the technical assistance should go to small enterprises while for medium-sizedenterprises the priority should be to build linkages to facilitate the dissemination of rel-evant knowledge and provide a channel through which enterprises might communi-cate their concerns.
If there is to be an increase in export growth Yemen needs an Export DevelopmentBank and a Loan Guarantee Agency. It should also stimulate the existing ExportPromotion Council. Yemen should also create competitiveness within its own indus-tries in order to foster an enabling and equal footing environment for all investors. Thegovernment might consider establishing competitiveness councils.
In order to overcome the skilled labour problem, the government will need to encour-age management and business training based on intensive consultation with the privatesector.
Finally, the GoY needs to give enterprises incentive targets, based say on the level ofexports or the number of jobs created. But do so the state must also enhance its owncapabilities, and commit itself to the achievement of its development and poverty alle-viation objectives.
148
Chapter Nine: Trade and Industry

This report presents a consistent set of recommendations for economic policies thatwill promote long-term development, enhance growth and reduce poverty.
The report concludes that the major macroeconomic constraint to economic develop-ment in Yemen is poor investment performance. It also points out that although devel-opment requires macroeconomic stability this point has been overemphasized. Therereport argues therefore that macroeconomic policy in general should be directed topromoting economic growth, while maintaining reasonable macroeconomic stability.
It proposes an active economic role for the state. In order to achieve the MDGs goalson poverty reduction the state should aim to stimulate growth and employment –mainly through public investment and allocating credit. Public investment, financedthrough tax revenues and mobilizing domestic resources can raise the productivity ofcapital and labour, while also boosting private investment and enhancing growth.However, the report also emphasizes that a stable flow of ODA will also be essentialfor achieving the MDG poverty goal.
To boost domestic savings and private investment the reports points to the need todevelop the financial sector. And to compensate for oil exhaustion it recommendsmacroeconomic policies to promote investment in the non-oil sector.
It recommends the adoption of more flexible monetary policies, which can specificallylower real rates of interest and it recommends regulating the capital account in order tostem capital flight and redirect the financial assets of commercial banks towards domesticinvestment. Measures can then be taken to render the exchange rate more competitive.
To mitigate the inflationary impact of expansionary fiscal and monetary policies, it will,however, be necessary to carry out fundamental reforms in the banking sector and theoperations of the Ministry of Finance as well as in the macroeconomic policy mix. Thiswill mean, for example, moving resources to productive sectors, particularly those withthe greatest employment-generation and import-substitution potential.
Finally, growth in Yemen will be more equitable and more pro-poor if it is directedtowards rural areas. The report offers a comprehensive set of inter-related policy rec-ommendations that can stimulate agricultural prosperity and augment rural livelihoods.
10.1 Providing fiscal space for development
Increasing tax and non-tax revenues and building a system of public finance based on domesticnon-oil revenue:
The Government of Yemen has to plan for long-term development based on pre-dictable flows of ‘permanent income’. At present, however most income comes fromoil. It will therefore have to use oil revenues to accumulate permanent productive151
Chapter TenSummary of policy considerations
Chapter Ten: Summary of policy considerations

wealth – financing extensive public investment and build a financial system that willadequately fund private investment. Later this will compensate for any future declinein oil production.
Such productive wealth can provide a level of tax income that could eventually replacedepleted oil revenues. In this connection, it is essential to draw a coherent Tax PolicyLong term Master Plan to raise non-oil revenues in an equitable way. The plan shouldstart by instituting a General Sales Tax (GST) that would raise as much as 5% of GDPin new revenues. There is a similar need for introducing an excise tax on petroleum,as well as eliminating many customs exemptions and increasing the level of taxation ofqat. A land tax on large farm holdings, as well as a tax on urban real estate and petro-leum should also be considered.
Improvements in tax policy and administration could increase revenues by 6%-9% ofGDP. Moreover, the government could still modestly increase tariff revenues, by 1%-1.5% of GDP, through strengthening customs administration, combating smugglingand reducing exemptions.
Borrowing from domestic sources
Sustaining Yemen’s development means financing a significantly higher proportion ofpublic expenditures through domestic resources. Distributional considerations aside,domestic borrowing adds to gross investment and to growth, if it does not substitutefor resources available for private investment and if the returns from public investmentare high enough to justify the borrowing costs.
Creating Fiscal Space
This can be achieved through expenditure-reduction and expenditure-switching poli-cies. For example:■ Reduce military expenditures from over 7% of GDP to less than 4%. ■ Gradually phase out explicit subsidies and earmark the resulting funds for invest-
ment to improve agricultural productivity. ■ Reinforce the rise in development expenditures, financed from ODA, to stimu-
late growth and generate more public revenues. ■ Maintain a rough balance between expenditures and revenues at 20%-25% of
GDP by combining expenditure-reduction policies with more aggressive effortsto raise non-oil revenue and keeping deficits at under 10% of GDP.
Budget reform
The government should ensure that in the short and middle term budget goals andeconomic policies are compatible. This will mean reviewing budget goals, developingmore objective criteria for public expenditure allocation, implementing effectivemethods to collect data and analysis, designing appropriate criteria for evaluation,implementing existing laws, delegating budget implementation to the line ministriesand enforcing budget monitoring and evaluation.
152
Chapter Ten: Summary of policy considerations

Official development assistance
Official development assistance (ODA) can play a useful role in compensating for thedecline in oil revenues and, thereby, making the flow of government revenue morepredictable. But it should be used to enhance the size and structure of Yemen’s pro-ductive base – financing essential public investment in economic and social infrastruc-ture and building up a viable, resource-mobilizing domestic financial system.
An ODA-based stabilization fund can also eliminate the need to hold large pools ofresources in a surplus oil fund. ODA could smooth out the inevitable fluctuations inoil prices to make government revenues more predictable.
To reach the goal of halving income poverty by 2015 Yemen will require an annualODA flow of approximately $75 per capita. As Yemen receives an average of $15-$20per capita in ODA annually, this implies that ODA to Yemen should increase dramat-ically – significantly above the 2003 level of 3.5% of GDP.
10.2 Financial sector development
Monetary policy should concentrate in providing liquidity, and relatively low rates ofinterest, both to the private and public sectors. Hence the government should play amore pro-active role in encouraging lending that will promote long-term economicgrowth, employment generation and poverty reduction – to enable commercial banksto play a healthy intermediary role in mobilizing domestic savings and channellingthem to productive private investment.
This implies that the government will have to provide various incentives in order to:
■ Induce commercial banks to provide more long-term loans ■ Direct more credit to poor households and provide broad access to credit from
banks, especially in rural areas, where the great majority of low-income house-holds are located.
■ Mandate loans to priority sectors. This helps direct more credit to agriculture,and to industrial or service sectors that are employment intensive, in particularmedium-sized and small industries.
■ Rely on incentive-based measures instead of specifying differential asset-basedreserve requirements, in which banks could hold lower reserves for providingloans to priority sectors.
■ Provide support to banks to pool and underwrite small loans in order to reducerisk. The Central Bank could draw on part of its large stock of foreign exchangereserves to open a special discount window for banks that agree to lend to pri-ority sectors.
The government also needs to require commercial banks to diversify a certain percent-age of their lending, and extend their operations to rural areas – failing which theywould have to lend money to specific government agencies at very low interest. TheCentral Bank of Yemen (CBY) would list a set of employment-generating and com-
153
Chapter Ten: Summary of policy considerations

mercially viable investments for which there would be reserve requirement lower thanfor the deposits invested in speculation, or treasury bills, and certificates of deposits.
The CBY can also take steps to create liquidity- and risk-sharing institutions for loansto small businesses that are commercially viable and committed to generating employ-ment, but do not have adequate access to the credit market. This can be promoted byproviding financial and administrative support for asset-backed securities, which wouldgive loans to small businesses and other employment-intensive activities. The CBY canbundle these investments and sell them as securities on the open market. The CBY canopen a special discount window facility to offer credit, guarantee or discount facilitiesto institutions that are on-lending to firms and co-operatives engaged in commercial-ly viable employment-intensive activities. In addition, the CBY can use some of itsaccumulated foreign exchange surplus for various directed credit programmes.
Finally, the government needs to improve the legal certainty and enforceability of con-tracts.
10.3 Monetary and exchange-rate policies
Exchange rates should not be used exclusively as instruments for inflation targeting.Appreciated exchange rates might be an important instrument in the combat againstinflation, but they are more relevant as instruments to promote export competitivenessand import substitution. It is not advisable therefore to completely deregulate foreignexchange markets. Instead, in order to promote import substitution and export com-petitiveness, the government should consider capital controls and other measures thatallow multiple exchange rates. Overall, monetary and exchange policies should boostinvestment and employment – and not exacerbate food-price inflation. This can beaccomplished by the following approaches:
A more flexible approach to exchange-rate management and a special fund for human capitaldevelopment
To resolve the problem of food-price inflation and the gradual overvaluation of thecurrency, the government should take a two-pronged approach. In the short run, thegovernment needs to adopt a food-price stabilization programmes – to temporarily de-link food prices from international prices. This will free the CBY to adopt a more flex-ible approach to exchange rate management, to prevent overvaluation of the exchangerate, without fear of food-price inflation. However, the long-term solution is toincrease investment in physical and human capital, enhance productive capacities andraise the productivity of labour particularly in the agricultural sector. For this purpose,the Central Bank should use its foreign exchange reserves to set up specialized invest-ment funding agencies to help increase private-sector investment in human capital.
Flexible monetary policy
Monetary policy should become more flexible, geared not just to price stability but alsoto growth and employment goals. Adopting a tight monetary policy and reducing
154
Chapter Ten: Summary of policy considerations

inflation below 5% is likely to draw the economy into a ‘stabilization trap’. Instead thegovernment should aim for lower interest rates to stimulate greater investment, in par-ticular in the agricultural sector to help break the food-supply bottleneck.
The main causes of cost-push inflation in Yemen have been supply-side factors, suchas droughts, and oil price fluctuations. At present the economy can absorb large injec-tions of funds without overheating – given widespread unemployment and underem-ployment. It is also important to lower the benchmark interest rates, whose currenthigh levels deter private investment, and reduce the spread between the deposit andlending rates of commercial banks.
Regulating the capital account
The CBY should regulate the capital account in order to dampen capital flight. Suchregulations should focus on discouraging commercial banks from investing their finan-cial assets abroad. At present savings have been used, in effect, to finance investmentin other countries. The appropriate option is to impose restrictions on capital accountconvertibility and restrict commercial bank investment abroad.
10.4 Policies to promote savings, investment and growth
Injecting new resources into the Yemeni economy
Food-stabilization programmes can combat inflation in the short run. But in the longrun, the surest means of containing inflation is to scale up investment in public infra-structure, physical capital and human skills. This will strengthen the economy’s‘absorptive capacity’. Meanwhile for the private sector to grow, it has to enjoy realaccess to essential infrastructure, such as electricity, roads and ports, credit, and an ade-quate supply of educated, trained workers. Direct assistance which would ensure pri-vate sector’s access to international markets based on a competitive exchange rate mustalso be available. Larger aid flows should also be phased-in to finance productiveinvestment, especially in the tradable goods sector.
Creating an investment fund and adopting expansionary investment-focused fiscal policies
The Central Bank could redirect some of its foreign exchange reserves to an invest-ment fund that would offer higher returns than foreign government securities. It couldalso discourage commercial banks from investing abroad and, instead, encourage themto lend for domestic investment. Banks could also be redirected towards lending forprivate investment by lowering interest rates on government securities. Monetary poli-cies, in general, have to be more accommodating towards expansionary, investment-focused fiscal policies.
Fiscal policy also should be geared towards spending on infrastructure and social safe-ty nets. Redistribution of the gains from the oil boom might have additional positiveeffects on economic growth. Capital expenditure is vital in transforming the economyfrom a pure rentier economy to a productive one that relies on non-rental revenues.
155
Chapter Ten: Summary of policy considerations

Taxes should increase to reduce inflationary pressure and stabilize the economy. Thiscan also generate the funds needed for expenditure on infrastructure and human capi-tal. When oil revenues dwindle, however, taxes will have to fall to offset the effect onoutput and income. But over time, this accumulated capital expenditure will generateenough income to compensate for the fall in oil revenue and provide a sustainable basefor conventional revenue sources.
10.5 The employment nexus between growth and poverty reduc-tion
In order to provide widespread remunerative employment, Yemen’s economy needsto grow more rapidly and spread the benefits more broadly. This will mean scaling-upboth public and private investment and diversifying the financing for such investmentfrom various sources: oil revenues, increased tax revenues on non-oil incomes, reducedinternational reserves, debt relief and substantially increased ODA. This report recom-mends a four-part strategy:
1. Growth-oriented economic policies
Yemen needs to channel oil revenues into widespread public investment in basic eco-nomic and social infrastructure. Meanwhile monetary policies need to target employ-ment creation as well as keep inflation down to say 10%-15% per year. In order tomaintain the international competitiveness of non-oil exports, the Government shouldalso seek to depreciate the exchange rate further. Such a measure should be combinedwith restrictions on capital mobility, particularly within the context of more expan-sionary fiscal and monetary policies.
2. Diversifying the economy
Yemen is caught in an unemployment vice because of modest economic growth andrapid growth of its labour force. This will imply more pro-active sectoral credit poli-cies, especially for employment intensive activities whether in agriculture, manufactur-ing or services.
In agriculture, diversification based on rising productivity and sound water manage-ment should include substitution of qat by other agricultural commodities, such as cof-fee, fruits and vegetables, which have strong export potential. And for fisheries it willbe important to upgrade infrastructure for fish handling, storage and transport to ensureadequate testing, certification and accreditation. Improvements are also needed in fishfarming methods. Domestic processing of fish could generate substantial additionalincome but awaits the commitment of investment resources.
Though currently small, the manufacturing sector could create productive and decent-paying employment principally through medium-sized and large enterprises. Pro-poorgrowth will mean encouraging investment, changing the nature of industrial activities,and alleviating the scarcity of skilled workers. It would also be useful to adopt animport substitution policy in food and beverages.
156
Chapter Ten: Summary of policy considerations

The manufacturing sector which is still small will need immediate technical assistanceand the medium-sized enterprises need to build stronger linkages with the rest of theeconomy. The service sector could also provide much more employment particularlyfor tourism and port services. Sectors that employ significant numbers of paid employ-ees, namely, manufacturing, trade, hotels and restaurants, will have to grow more rap-idly.
3. Making small-scale interventions with a poverty-reduction focus
This could involve labour-intensive public works, such as for rural roads, wells or irri-gation works, which can be directed to poorer regions of the country. Commercialbanks will have to be given incentives to expand coverage of their financial services topoorer regions or social groups. This should become an integral component of the reg-ular financial services of banks, particularly in rural areas.
4. Promoting of a more conducive business environment
Simplifying licensing, fees and taxes are part of this effort. Reducing administrativeprocedures, official harassment and corruption is another important requirement.Economic growth can be stimulated from below by enabling small enterprises toexpand and provide more decent-paying jobs.
10.6 Trade and industrial development
Yemen requires active and strong government involvement in trade and industry, asfollows:
Capacity building in trade negotiations and trade policy formulation
Human and institutional capacity building is needed to enable Yemen to benefit fromthe Great Arab Free Trade Area (GAFTA) and from special and preferential treatmentfor least developed countries. Without adequate technically qualified and experiencedpersonnel, Yemen may not reach the best outcomes when negotiating such agree-ments. The establishment of a WTO Accession Unit under the auspices of the Ministryof Industry and Trade is a step in this direction.
Since there is a general lack of awareness of WTO issues, the GoY will have to estab-lish a number of enquiry points to deal with questions regarding services, standards, andIPR. It will also probably need a permanent mission in Geneva.
All such new entities will require additional funds and new institutional mechanismsto take decisions at the political level. Meanwhile the systems of reporting, monitor-ing and evaluation have to be developed.
Concerted export- promotion
A concerted promotion programme is needed to stimulate demand for non-oil com-
157
Chapter Ten: Summary of policy considerations

modity exports, while diversifying the basket of such exports. This will require a soundmacroeconomic base for competitiveness supplemented by policies for promotingtechnical and entrepreneurial skills, technological competence and home-grown com-petitive capacity – as well as appropriate incentives designed to attain sustained produc-tivity growth, export diversification and the development of the manufacturing indus-try.
Yemen also needs to create an export development bank and a loan guarantee agency,and to stimulate its existing Export Promotion Council. While trade liberalization is aforgone conclusion, Yemen needs to encourage competitiveness within its own indus-tries—for example, through competitiveness councils. Finally, to disperse the benefitsof growth the government needs to set incentive targets, such as the level of exportsor the number of jobs created and their location. Needless to say, this cannot beaccomplished in the absence of appropriate infrastructure.
Upgrading institutions to join the GCC
The Gulf Cooperation Council is a major trading partner, especially on the importside. Pursuing a free trade area with GCC members will be of benefit to Yemen, andthere could be gains from increased foreign direct investment coming from residentsof the GCC or from Yemenis abroad. Yemen may also be able to act as a sea hub forgoods entering the GCC.
Improving the potential of service exports
These include transport, tourism, and other services that have not been fully utilized.The GoY should continue its efforts to negotiate better terms with internationalinvestors in tourism while upgrading the domestic capacity to provide more value-added.
Non-conventional options for enhancing trade and investment
Yemen should, for example, opt for offset-agreements where the purchase of weaponsfrom a developed country is complemented by direct foreign investment in civil indus-tries.
Production of export-oriented goods and services
There are a number of promising sources of export-orientated production, such astourism, fisheries and manufacturing, and commercial service activities located in duty-free zones. But these are hampered by poor infrastructure and institutional deficiencies.Yemen should intensify its efforts to improve the investment climate, to implementvigorous strategies of investment promotion and to meet investors’ reasonable require-ments in terms of infrastructure.
158
Chapter Ten: Summary of policy considerations

Upgrading free trade zones
In the short to medium term, it may be difficult to promote investment and trade inYemen without establishing well functioning free trade zones. Hence, it is recom-mended that consideration be given to the development of additional zones and alle-viating the problems in the established zone.
Participation in regional value chains
Yemen will have to target specific products and markets (such as leather products andhandicrafts) and focus on upgrading certain exports (such as natural honey and coffee).This will require more sophisticated marketing skills. For example, since all exportersof animal and vegetable products have to meet the sanitary standards of industrial coun-tries, the Government should attach high priority to upgrading its conformity assess-ment procedures – including testing, certification and accreditation.
Industrial policy and management
International competitiveness in the manufacturing sector will be determined by theability to apply modern industrial management practices to production and organiza-tion. There is also a need to establish linkages between SMEs and large firms. Thiscould be achieved by creating linkage institutions by establishing a data bank to iden-tify potential areas for mutual cooperation between the two groups.
Enterprises also need better access to business development support services – such asoperational Industrial Labour Market Information Systems, and those related to mar-keting, maintenance, and quality control – because it is often too expensive for indi-vidual plants to establish such services within their own enterprises.
An industrial development policy should be related to the promotion of standards andquality assurance to achieve competitiveness of industrial products in international andlocal markets.
It is also important to change the structure of incentives to encourage investment inproductive sectors and develop the formal economy. A clear and coherent industrialdevelopment strategy, formulated in consultation with the domestic private sector,would create a more predictable and enabling environment.
Financing industrial development
In order to overcome the lack of financing, the Yemeni government has created sev-eral specialized credit institutions. However, decisions concerning lending within theseinstitutions are not always based on sound economic analysis but rather on social andinformal networks. Yemen needs a sustainable system for financing industrial develop-ment.
159
Chapter Ten: Summary of policy considerations

Reforms in education and training
More management and business training is needed to overcome the skilled labourproblem. In order for this to succeed, there should be intensive consultation with theprivate sector. Enterprises should also be encouraged to invest in in-house training.
Supply-side policies
The main constraints on export performance are on the supply side. As the Yemenbecomes more fully integrated into the world economy it will need to identify and tar-get new products and markets such as leather products and handicrafts, while upgrad-ing others such as natural honey and coffee. This will require more sophisticated mar-keting skills, in addition to testing, certification and accreditation. Improving exportswill also depend on focusing resources on the Aden free trade zone in order to ensureits success as a prototype for other zones. Greater regional economic cooperation,based on developing common or shared infrastructural facilities, could be of notablebenefit. In this regard, the country should fully exploit the opportunities provided byits strategically located port facilities.
Enhance business support services
Much of the success in trade and industrial development will depend on concentratedpublic investment in infrastructure, human capital and business support services.Market forces alone are unlikely to foster the necessary structural transformation, so thestate will have to play a crucial role.
Institutions and regulatory framework
Yemen will need an appropriate and enforceable regulatory frameworks, along withviable financial institutions, educational and training institutions, and publicly support-ed research and development.
10.7 Agricultural development and rural livelihoods
These policy options are based upon a need for redistributive public support, in theform of financial transfers, to facilitate a pro-poor pattern of public-goods provision.The Yemeni government must substantially increase its public spending on the ruraleconomy, as follows:
Ensure greater public investment in rural areas
More sustainable resource management systems within the rural economy will needgreater investment in a range of public goods, such as storage facilities, transportationnetworks, and water preservation technologies.
160
Chapter Ten: Summary of policy considerations

Build an extensive rural financial system
Of equal importance is an extensive rural financial system. This will need small-scaleinitiatives, such as rotating savings and credit clubs and microfinance. More important,however, are financial institutions that can mobilize substantial savings and allocatethem effectively towards productive investment. The poorer small landholding farm-ers need financial resources if they are to shift to more sustainable resource manage-ment systems.
Provide better extension services
Boosting agricultural productivity will require better extension services, such asimproving cropping patterns and the management of natural resources,. Of specialimportance are marketing services so that farmers can move into higher value crops,identify the best markets and be able to store and transport their crops. But it they areto do so, the government will have to provide them with some form of income sup-port during the difficult period of transition.
Stimulate agro-industrial activities
Agricultural prosperity should provide the foundation for a more vibrant non-farmeconomy that will allow poorer farmers to diversify their livelihoods. In order to facil-itate this transition, the Government can help provide business-oriented advisory serv-ices and eliminate bureaucratic barriers to forming micro- and small enterprises.
Provide better access to land and water
Providing broader access to water, especially for small farmers will mean reinstatingsome traditional water-control systems as well as vesting in communities the rights overwater use in irrigated areas. At the same time the government could also invest inwater-saving technologies. And they could also promote conservation by removingsubsidies to rich farmers and instituting water taxes. In the long run, however, moreefficient use of scarce water resources will mean diversifying away from agriculture.
Finally the government needs to address land rights. The first step is registering bothland and sharecropping contracts. Then institutional means, such as cooperatives, canbe identified to begin consolidating fragmented holdings into larger productive units.Capacity building will also be needed to give poorer small farmers greater access tolocal government institutions.
161
Chapter Ten: Summary of policy considerations

Abdullah Sanafi, 2002, “Export Performance in Productive Enterprise in Yemen” (Arabic), TheEconomic Journal of Economics and Business College (Sana’a University), Sept. 2002 –March 2003, pp. 346-392.
Abdel Gadir A. (2002), “Macroeconomic Policies and Poverty Reduction”Acemoglu, D., Johnson, S., Robinson, J., and Y. Thaicharoen, (2003), “Institutional Causes,
Macroeconomic Symptoms: Volatility, Crises and Growth”, Journal of MonetaryEconomics, vol. 50, no. 1
Agenor P-R. (1998), “Stabilization Policies, Poverty and the Labour Market”, IMF,Washington D.C.
Al-Ghory, Abdulhadi Abulhak (2004). ‘Socio-geographical situation analysis of resourcemanagement for Al-Mahawasit District/Yemen: Qat-based farming system case’,Unpublished inaugural dissertation for the Degree of Doctor of Natural Sciences, FreieUniversitaet Berlin.
AMDGR, 2006 ESCWAArab Organization for Agricultural Development (2005).
http://www.aoad.org/AAS/land.asp, accessed on 25 June.A-Shami, H (2004) ‘The poverty reduction strategy and food security in Yemen (current
and perspectives): as the key components of the socio-economic development plans’.Sana’a: Food and Agriculture Organization
Baker and Walentin (2001), Money for Nothing: The Increasing Cost of Foreign ReserveHoldings to Developing Nations
Banerjee and Duflo (2004), Addressing AbsenceBarnett, Steven, and Rolando Ossowski, 2002, “Operational Aspects of Fiscal Policy in Oil-
Producing Countries,” IMF Working Paper 02/177 (Washington: InternationalMonetary Fund).
Barrès, J-F (2001). ‘Sources of growth in agriculture and fisheries’. Sana’a: The World Bank.Baunsgaard Thomas and Michael Keen. 2004. “Tax Revenue and (Or?) Trade
Liberalization.” Fiscal Affairs Department, International Monetary Fund, September 20Draft.
Borras, S Jr (2004). Rethinking Redistributive Land Reform: Struggles For Land And Powerin the Philippines. Unpublished PhD thesis, Institute of Social Studies, The Hague.
Boyce, J K (1987). Agrarian Impasse in Bengal: Institutional Constraints To TechnologicalChange. Oxford: Oxford University Press.
Bulir, A., (2001), “Income Inequality: Does Inflation Matter?”, IMF Staff Papers, vol. 48,no. 1.
Central Statistical Organization (CSO) (1999) National Poverty Survey 1999. Sana’a:Ministry of Planning and International Cooperation.
Central Statistical Organization (CSO) (various issues). Statistical Yearbook. Sana’a: Ministryof Planning and International Cooperation.
Christiaensen, L., Demery, L., and S. Paternostro, (2003), “Macro and Micro Perspectives ofGrowth and Poverty in Africa”, World Bank Economic Review, vol. 7, no. 3
Collier P. and D. Dollar, 1999, Aid allocation and poverty reduction. Policy ResearchWorking Paper No. 2041, Washington D.C.: The World Bank.
Demery, L., and L. Squire, (1996), “Macroeconomic Adjustment and Poverty in Africa: An163
References

Emerging Picture”, World Bank Research Observer, vol. 11, no. 1Dixon, J and Gulliver A with Gibbon D (2001) Farming Systems and Poverty: Improving
Farmers’ Livelihoods in a Changing World. Rome and Washington: Food andAgriculture Organization and the World Bank.
Easterly, W., and R. Levine, (2003), “Tropics, Germs and Crops: How EndowmentsInfluence Economic Development”, Journal of Monetary Economics, vol. 50, n0. 1
Easterly, W. and S. Fisher, (1990), ‘The Economics of the Government Budget Constraint’,The World Bank Research Observer, Vol.5, July, No.2, pp.127-142.
Easterly, W., (2003), National Policies and Economic Growth: A Reappraisal”, WorkingPaper no. 27, Center for Global Development,
Ellis, F (2003). Peasant Economics: Farm Households and Agrarian Development (SecondEdition). Cambridge: Cambridge University Press.
Emran, S. and Stiglitz, J. (2002). “On Selective Indirect Tax Reform in DevelopingCountries”, mimeographed. Available at: www.econwpa.wustl.edu
Enders, K. S Williams, N. Choueiri, Y. Sobolev, and J. Walliser, (2002), Yemen in the 1990s:From Unification to Economic Reform, International Monetary Fund, and Washington D.C.
Food and Agriculture Organization (FAO) (2004). Food Insecurity in Yemen: Results of the2003 FIVIMS Survey – Volume I: Main Report. Sana’a: Central Statistical Organizationand Department of Statistics of the Ministry of Agriculture.
Food and Agriculture Organization (FAO) (2005a). A Mid-Term Sustainable DevelopmentPlan for Agriculture, Food Security and Poverty Reduction Based on the MDGs, 2006-2010. Revised final draft in mimeo, available from the author.
Food and Agriculture Organization (FAO) (2005b). FAOSTAT. http: www.fao.org,accessed April.
Frederich Ebert Stiftung (2002). ‘Analytical overview of Yemen agriculture’. Sana’a:Frederich Ebert Stiftung.
Ghimire, K (2001). Whose Land? Civil Society Perspectives on Land Reform and RuralPoverty Reduction – Regional Experiences from Africa, Asia and Latin America. Romeand Geneva: The Popular Coalition to Eradicate Hunger and Poverty and the UnitedNations Research Institute for Social Development.
Gordon Roger and Wei Li. 2005. “Tax Structures in Developing Countries: Many Puzzlesand a Possible Explanation”. March. Draft research paper, University of California-SanDiego.
ILO (2004): A National Employment Agenda for Yemen: Towards an Employment StrategyFramework
International Monetary Fund (IMF), 2001. Republic of Yemen: Selected issues- April 2001IMF, 2003. Republic of Yemen: Statistical Appendix- December 2, 2003IMF, 2003a, Role of the Fund in low-income member countries over the medium term –
Issues paper for discussion. Policy development and Review Department, WashingtonD.C.: IMF.
IMF, 2005.” Republic of Yemen: 2004 Article IV Consultation – Staff report; PublicInformation Notice on the Executive Board Discussion; and statement by the ExecutiveDirector for the Republic of Yemen”.
IMF, 2005. Republic of Yemen: Statistical Appendix- February 28, 2005Kraay A., (Growth is Good for the Poor, Journal of Economic Growth, vol. 7, no. 1).Lall et al (2004), China’s Competitive Performance Threat to east Asian Manufactured
Exports Liechtenthaeler, G. and A.R. Turton, 1999. Water Demand Management, Natural Resource164

Reconstruction and Traditional Value Systems: A Case Study from Yemen. OccasionalPaper No. 14, Water Issues Study Group, School of Oriental and African Studies,University of London.
Lofgren, H and Richards, A (2003). ‘Food security, poverty and economic policy in theMiddle East and North Africa’. International Food Policy Research Institute Trade andMacroeconomics Division Working Paper number 111.
Mehran, Farhad, ILO Bureau of Statistics (2001). “Report on a Mission to Yemen toAnalyze the 1999 Labour Force Survey”. Draft, October 7.
Mehran, Farhad, Statistical Development and Analysis, Policy Integration Department, ILO(2004a). “An Analysis of the Results of the Labour Demand Survey of Establishments inYemen, 2002-2003.” Draft, August 10.
Mehran, Farhad, Statistical Development and Analysis, Policy Integration Department, ILO(2004b). “Comparing the Measurement of Employment and Unemployment in ThreeRecent Large Scale Household Surveys in Yemen.” Draft prepared for the UNDPRegional Programme me in the Arab States on the Macroeconomics of PovertyReduction, September.
Mehran, Farhad, Statistical Development and Analysis, Policy Integration Department, ILO(2004c). “Key Labour Market Indicators in Yemen.” Draft prepared for the UNDPRegional Programme in the Arab States on the Macroeconomics of Poverty Reduction,October.
Mundy, M (1995) Domestic Government: Kinship, Community and Polity in NorthYemen. London: IB Tauris Publishers.
N. Kakwani (2005) How Costly is it to Achieve Millennium Goal of Halving Povertybetween 1990 and 2015, International Poverty Center, UNDP, and Brasilia.
OECD DAC Journal, 2004: Development Cooperation 2003 ReportRodrik, D., Subramanian, A., and F. Trebbi, (2004), “Institutions Rule: The Primacy of
Institutions over Geography and Integration in Economic Development”, Journal ofEconomic Growth, vol. 9, no. 2.
Torvik, R. 2001. “ Learning by doing and the Dutch disease” European Economic ReviewVol 45 pp285-306
UNCTAD (2004), World Investment Report: The Shift Towards Services, NY and GenevaUN
United Nations Development Programme (2005) Human Development ReportUNDP (2003), Development Effectiveness Report 2003. Partnership for results. Evaluation
Office, New York: UNDP.UNDP (2002), The role of Economic Policies in Poverty ReductionVandemoortele, Jan (2003) ‘MDGs and Pro-Poor Policies: Can External Parties Make a
Difference?’ New York: UNDP.Varisco, Daniel M (1991) ‘The future of terrace farming in Yemen: a development dilemma’
in Agriculture and Human Values vol 8 no 1 & 2 pp. 166-172.Ward, C. (2000). ‘The Political Economy of Irrigation Water Pricing in Yemen’, in Dinar,
A. (Ed.), The Political Economy of Water Pricing Reform. Washington, DC: TheWorld Bank.
World Bank (1999). Republic of Yemen Agricultural Strategy Note. Washington: TheWorld Bank.
World Bank (2002a). The Republic of Yemen – Economic Growth: Sources, Constraintsand Potentials. Washington: The World Bank.
World Bank (2002b). Republic of Yemen Poverty Update—Volume 1: Main Report.165

Washington: The World Bank. World Bank (2004). World Development Indicators 2004. Washington: The World Bank.Yemen Country Report (YCR) (2005). Millennium Development Goals Needs Assessment:
Yemen Country Report. Unedited final draft, mimeo available from the authors.
166

Notes on the Comparison of the Household Budget Survey(1998) and National Poverty Survey (1999)
In this report we have attempted to combine the information in the Household BudgetSurvey (HBS) 1998 and the National Poverty Survey (NPS) 1999 to examine thepoverty situation in Yemen. Both surveys were conducted by the Central StatisticalOrganization, Ministry of Planning and Development, Republic of Yemen. The HBS98 has been the main source of data for poverty measurement and analysis. The rea-son is that NPS 99, despite its much larger sample size and more detailed questionnaire,does not take into account the seasonality element in household expenditure. If theinterest is in measuring absolute poverty in relation to a particular poverty line – ameasure which is sensitive to the accuracy of measurement of consumption levels – theexclusion of seasonal elements in the NPS 99 data can lead to serious errors. Hence thepreference for the use of the HBS 98 for poverty analysis by both the Government ofYemen (GoY) and the World Bank (see, e.g., GoY 2002 and World Bank 2002).
Nevertheless, given the much larger sample size of NPS 99, which implies a substan-tial reduction in sampling error, particularly with regard to disaggregated regionalpoverty profiles, and the richness of its questionnaire, this practice has meant a consid-erable loss of valuable information contained in NPS 99. In this appendix we have triedto utilize the information in NPS 99 to examine the poverty situation in Yemen, byattempting a mapping between the poor as measured in the NIES 98 survey and thelow income strata in NPS 99.
On the basis of the HBS 98 data, and the regional poverty lines defined by the gov-ernment of Yemen, it is estimated that about 41.8% of the population fall below thepoverty line (World Bank 2002).61 It may be therefore plausible to assume that thebottom 40% of expenditure groups in NPS 99 should represent the poor fairly accu-rately. This, however, is only true under certain assumptions which need to be spelledout explicitly. First, it assumes that the seasonal element of consumption expendituredoes not substantially alter the consumption ranking of the individuals between thetwo surveys, at least relative to the poverty line.62 It also assumes that there has notoccurred a substantial change in the status of the poor between the two surveys, whichis plausible given the closeness of the timing of the two surveys.
167
Annex 1
61 Throughout this appendix NIES 98 poverty estimates refer to poverty as estimated with reference to what theWorld Bank (2000) refers to as the lower poverty line, as distinct from the food poverty line and the upper pover-ty line.62 It should be noted that despite the large differences in income distribution between the two surveys, as for exam-ple indicated by the gini coefficient of consumption expenditure, the average per capita consumption of the 4th
decile of NPS 99 is remarkably close to the same figure for NIES 98, about 3000 Rials per month as compared to2896 Rials respectively.

A more problematic issue relates to the variations in poverty lines across regions, whichimplies that the 41.8% headcount poverty estimated on the basis of the HBS 98, doesnot necessarily refer to the bottom 41.8% consumption groups ranked in nominalterms. The coefficient of variation of the regional poverty lines used for the measure-ment of poverty in Yemen is about 7% for the urban areas and 8% for the rural areas(based on, World Bank 2002, page 10). Hence, a person that may be counted as poor,say in Sana’a city, may have a higher average consumption in nominal terms as com-pared to a person who is just above the poverty line but lives in a less expensive region.To get round this problem it would be necessary to make a mapping between the twosurveys on a region by region basis. However, given the possibly large sampling errorsin regional estimates arising from the small size of the HBS 98, it is not clear whethersuch extra effort would improve the accuracy of the estimates. The possible gains inaccuracy resulting from accounting for regional variations in poverty lines may bemore than neutralized by the potentially large sampling errors in regional poverty esti-mates based on the NIES 98 survey.
With these caveats in mind, one may proceed to investigate the profile of the bottom40% consumption groups in the NPS 99 survey as a plausible characterization of theconditions of the poor in Yemen. As the last point in the above paragraph indicates,this procedure can imply the exclusion of some of the households that are marginallybelow the poverty line in areas where the cost of living is above average, such as theSana’a city, and the inclusion of some cases in relatively lower cost areas that are mar-ginally above the line. However, given the large population of the poor, this shouldnot significantly alter the average characteristics of the poor as measured by the bot-tom 40% in the NPS 99 survey at the national level. In fact, it is our contention thatgiven the small sample size of the NIES 98 survey, sampling error poses much moreserious problems at a disaggregated regional level, than the neglect of the variations inregional poverty lines involved in the method adopted here. This is in fact a testableproposition which can be verified on the basis of the data.
To verify this proposition we have estimated regional headcount poverty levels on thebasis of NPS 99 by selecting the bottom 40% of the population on the basis of theirconsumption levels and by counting the number of the poor in each region in this sub-population. If the main source of error in this procedure as compared to existingpoverty measures based on NIES 98 is the neglect of the variations in the regionalpoverty lines, then we should be able to observe a close and negative relationshipbetween the NPS/NIES ratio of regional poverty estimates and the regional povertylines. In other words, the NPS 99 headcount measures, as estimated here, shouldunderestimate poverty in regions with relatively higher poverty lines. On the otherhand, if the main difference between the two estimates is the sampling errors resultingfrom small regional sample sizes in NIES 98, we should observe wide variations in theregional headcount NPS/NIES ratios without any discernable trends vis a vis theregional poverty lines.63
168
63 There are of course other non-sampling sources of discrepancy between the two surveys, e.g. those resultingfrom definitional differences in the two surveys, differences in recall periods, and the neglect of the seasonal ele-ment in the NPS 99 survey. However, there is no reason why such non-sampling sources of discrepancy betweenthe two surveys should lead to such large region specific variations in poverty measurement.

The results of this exercise are reported in Figure A.1, panels (a) and (b) for the urbanand rural areas respectively. As can be seen, there are wide variations in regional pover-ty estimates between the two surveys, without any discernible relationship betweensuch variations and the regional poverty lines. Given that the sample size of the NPS99 is almost four times higher than the NIES 98 survey, it may be plausible to assumethat such variations can be more due to sampling errors in NIES 98.
Figure A.1: Regional Poverty Estimates (NPS 99 / NIES 98), againstRegional Poverty Lines
Notes: Regional poverty lines are normalized by setting their mean equal to 1.
Sources: World Bank (2002) for NIES 98 measures, and our calculations for NPS 99 as described in the
text.
Figure A.2: Regional Poverty Estimates, HIES 98 and NPS 99 Against FAO2003 Estimates
Notes: FAO Estimates are based on the proportion of food vulnerable people living in each region.
Sources:HIES 98 headcount poverty estimates based on World Bank 2002, NPS 99 estimates as dis-
cussed in the text. FAO Estimates are based on FAO 2004, Table 5.2.
169
(a) Urban Areas
0
0.5
1.5
2
2.5
3
Regional Poverty Lines (normalized)
NPS
99
/ N
IES
98 p
over
tyes
tiam
tes
(b) Rural Areas
00.5
1.52
2.53
3.5
Regional Poverty Lines (normalized)N
PS 9
9 /
NIE
S 98
pov
erty
estia
mte
s
1
4
1
(b) NPS 99 against FAO 2003
y = 1.0082x - 0.0547
R2 = 0.87
0
10
20
0.0 2.0 4.0 6.0 8.0 10.0 12.0 14.0 16.0
FAO Estimates
NPS
99
Est
imat
es
(a) HIES 98 against FAO 2003
y = 1.0133x - 0.0888
R2 = 0.67
0
10
20
0 2 4 6 8 10 12 14 16
FAO Estimates
HIE
S 98
Est
imat
es

To further substantiate this proposition we have compared the regional poverty esti-mates from the two surveys with the FAO estimates of the regional distribution of thepopulation which was vulnerable to food insecurity in 2003. The FAO estimates arebased on a large sample size of more than 116000 households (as compared to about50000 in NPS 99, about 13000 NIES 98). AS can be seen from Figure A.2, the NPS99 regional estimates, based on the bottom 40% income groups, appear to have a muchbetter fit to the FAO results, as compared to the NIES 98 regional poverty estimates.It appears that, at least at the regional level, the NPS 99 survey provides a more rep-resentative sample than the NIES 98 survey. This also lends further support to the ideaof using the characteristics of the 40% bottom consumption groups in NPS 99 for pro-filing the conditions of the poor at a disaggregated level.
This of course does not mean that the NIES 98 survey is incompatible with the NPS99 survey at a more aggregate level. In fact, as shown in Table A.1, once we set theaggregate poverty in the NPS 99 41.8%, the same as the HBS 98 measure, the aggre-gate poverty measures for the rural and urban areas become very close.
Table 1, Poverty Indicators in Yemen, HIES 98 and NPS 99 Compared
Total Rural UrbanSample Size
Poverty Line (Y R, per capita, per month) 3210 3215 3195 ..
Headcount Poverty, HIES 98 41.8 45.0 30.8 13641
Headcount Poverty, NPS 99 41.8* 45.2 32.0 54000
Notes: *Total for NPS 99 is set equal to NIES measure, but the rural and urban components are meas-
ured freely.
The conditions of the poor, and particularly the dynamics of poverty, are not of courseindependent of the conditions of the non-poor, e.g., their location, income levels, sav-ings potential and investment behaviour, etc. The use of the NPS 99 survey, with itsrelatively large sample size, allows a comparison of the conditions of the poor in con-junction with the characteristics of different strata of non-poor, without unduly reduc-ing the precision of the indicators. In the attached tables we have referred to the bot-tom 40% of consumption groups in NPS 99 as the poor. In addition we have distin-guish two additional strata of non-poor, namely the second 40% of income groups –referred to as the middle income groups – and the top 20% deciles referred to as therich.
170

Methodology for Estimating Growth and InvestmentRequirements for Halving Income Poverty by 2015
With economic growth the mean consumption changes in conjunction with changesin inequality. This means that the growth elasticity of poverty does not remain fixed.Following Kakwani and Son (2005), the methodology presented here takes account ofchanges in the growth elasticity of poverty over time by focusing on two measures:
■ Head-count ratio■ Poverty gap ratio
Since these two measures capture different aspects of poverty, they are not necessarilymonotonic functions of each other. Accordingly, there will be different investmentrequirements.
Suppose r is the annual growth rate of per capita mean consumption. If everyonereceived exactly the same proportional benefits, the inequality of per capita consump-tion would not change over time. In practice, everyone may not receive the same pro-portional benefits from economic growth. Some will receive proportionally greater (orsmaller) benefits than others. Economic growth may be called pro-poor (anti-poor), ifit is accompanied by a decrease (increase) in inequality. If growth is pro-poor, then theinvestment required to achieve a given reduction in poverty will be less than that willbe if growth is not pro-poor. Suppose 1 % growth rate is accompanied by a change inthe Gini index of k %. Growth is defined as pro-poor if k is negative and, anti-poor ifk takes a positive value. Growth may be called distribution neutral if k is equal to 0,implying that there is no change in inequality.
The per capita consumption of each household will change over time because ofgrowth rate r and change in the Gini index k that accompanies the growth process.Suppose xit is the per capita consumption of the ith household in year t and is theper capita mean consumption of all households, we have the relationship:
(1) Where:
(2)
Applying Kakwani’s (1980) theorem 8.4 page 174, it can be easily shown that kr in (1)is equal to percentage change in the Gini index.
Suppose zi is the per capita poverty line for the ith household, which is fixed overtime,the headcount measure of poverty (the percentage of poor population) in year t willthen be given by:
171
Annex 2

To estimate Ht from the household survey, we define:
Then an estimate of Ht is given by:
(3)
Where Wi is the population weight attached to the ith sample household. The poverty gap measure in year t can similarly be obtained as:
(4)
Ht and gapt will depend on the growth rate in the economy r and the pattern ofgrowth as measured by k. Thus, we can calculate poverty measures each year for anyvalue of r and k. Given the values of poverty measures each year, we can easily calcu-late the poverty elasticity in any year for any measure and for any value of k by substi-tuting r = 0.01 in (1).
Assuming that the head-count and poverty gap ratios decline at uniform rate of m%per annum between 1990 and 2015, then we have an exponential relationship:
P2015
= P1990
(1+m)25
(5)
which gives m = 0.0275. In other words, in order to meet the MDG poverty reduc-tion target, the headcount and poverty gap ratios should decline at the annual rate of2.75%. Dividing 2.75 by the estimated poverty elasticity will immediately give us thegrowth rates of per capita consumption that would be needed to reduce poverty byhalf between 1990 and 2015.
Taking a step further, our ultimate objective is to estimate investment required toachieve the MDG of halving poverty by 2015. As such, we need to establish the rela-tionship between the projected growth rate of per capita consumption and the invest-ment rate. Since there exists no direct relationship between growth rate of householdconsumption and investment rate, we assume that per capita household consumptionwill on average grow at the same rate as growth of per capita GDP. This assumptionwill allow us to estimate investment requirements using the growth models of capitalaccumulation.
Growth depends on human and physical capital. Here we use a simple growth model,which emphasizes only physical capital.64 This model assumes that the output-capitalratio is constant. In low-income countries such as Yemen, the ratio generally takes avalue of around 1/3. Given this assumption, it is obvious that the growth rate of percapita GDP will be equal to the growth rate of capital per person. The growth rate of
172
64 See Romer (2001) and “A Global Plan to Achieve the Millennium Development Goals” by the UN MillenniumProject (2004).

capital per person depends positively on the gross investment rate as a share of GDP(denoted as i) and negatively on the rate of population growth. Then, with a littlemathematics, we obtain the relationship:
i = 3(g + n +d) (6)
where g is the growth rate of per capita consumption, n is the growth rate of popula-tion and d is the rate of depreciation.65
Substituting g (the required growth rate of per capita household consumption toachieve the MDG poverty reduction target) in equation (6) and with estimated ratesof population growth and rate of depreciation given, the required estimates of invest-ment as a share of GDP (i) can readily be obtained.
173
65 The rate of depreciation can be estimated from d = i/3 – c where c is the annual growth rate of fixed capitalformation.

174

Data sources and issues in IMF statistics
The data used in this chapter uses the latest available information, which comes fromthree publications from the IMF:
■ For the period 1990-1996: IMF (2001). Republic of Yemen: Selected issues-April 2001
■ For 1997: IMF (2003). Republic of Yemen: Statistical Appendix- December 2,2003
■ For the period 1998-2003 IMF (2005) Republic of Yemen: Statistical Appendix-February 28, 2005
However we found a series of errors and some discrepancies in the statistics used bythe IMF. The first table presents the latest data available from IMF Statistics. The sec-ond table presents UNDP calculations based on this data.
Table A.2: Republic of Yemen: Summary of central government Finance1997-2001 (in millions of Yemeni Rials)
Item 1997 1998 1999 2000 2001
1. Total Revenue 274,659 222,620 328,394 583,715 563,401
2. Oil Revenue 188,415 117,772 210,598 376,033 406,167
3. Non oil revenue 86,243 104,848 117,796 207,682 157,234
3.1. Tax revenue 69,570 78,852 85,419 110,990 113,700
3.1.1. Custom duties 25,814 24,121 25,703 29,843 33,789
3.1.2. Tax on goods and services 21,226 24,974 24,419 36,944 27,918
3.1.3. Taxes on income 10,685 13,093 16,389 22,246 46,864
3.1.4. Corporate profit tax 8,318 13,156 14,498 18,444 …
3.2 Non tax revenue 16,673 25,996 32,377 96,692 43,534
GDP at market prices 878,884 793,586 1,102,426 1,539,386 1,608,065
Source IMF Statistical Appendixes 2003 and 2005
175
Annex 3

Table A.3: Republic of Yemen: Summary of central government Finance1997-2001 9inpercentage of GDP)
Item 1997 1998 1999 2000 2001
1. Total Revenue 31.3% 28.1% 29.8% 37.9% 35.0%
2. Oil Revenue 21.4% 14.8% 19.1% 24.4% 25.3%
3. Non oil revenue 9.8% 13.2% 10.7% 13.5% 9.8%
3.1. Tax revenue 7.9% 9.9% 7.7% 7.2% 7.1%
3.1.1. Custom duties 2.9% 3.0% 2.3% 1.9% 2.1%
3.1.2. Tax on goods and services 2.4% 3.1% 2.2% 2.4% 1.7%
3.1.3. Taxes on income 1.2% 1.6% 1.5% 1.4% 2.9%
3.1.4. Corporate profit tax 0.9% 1.7% 1.3% 1.2% …
3.2 Non tax revenue 1.9% 3.3% 2.9% 6.3% 2.7%
Source IMF Statistical Appendixes 2003 and 2005
The figures presented in the second table, which draw on the same original figures,differ from the calculations presented in the IMF Statistical appendixes i.e. the rev-enue-GDP ratios presented in these appendices are different from those we have cal-culated. It would be highly unlikely that the ratios presented in the IMF appendiceshave not been calculated from the data in Table A.2. If this is the case then we assumethat the revenue GDP ratios presented by the IMF are wrong because they have beenmiscalculated.
The details are as follows:
■ For 1997 (data from IMF Statistical Appendix 2003), the figures presented forgovernment revenues as% of GDP in tables 18 and 19 do not correspond. Itappears that the figures reported in table 19 for 1997 have not been calculatedcorrectly. For instance table 19 calculates total revenue as 32.2% of GDP, whilethe correct figure presented in table 18 is 31.3% of GDP. A comparison of thefigures presented in table 18 and 19 reveals that all the percentages presented inthe latter have been miscalculated. There is however no inconsistency on theexpenditure side.
■ For 1998 (data from IMF Statistical Appendix 2005), the figures presented forgovernment revenues as% of GDP in tables 18 and 19 are both erroneous. In1998 IMF calculations report total revenues of 26% of GDP and non oil revenueof 12.2% GDP, while UNDP calculations –based on the same original data-demonstrate that the actual figures are 28.1% and 13.2% of GDP. The compar-ison of UNDP and IMF figures actually show that all the percentage figures forYemen revenue in 1998 have not been calculated accurately in table 18 and 19of IMF Statistical Appendix 2005. The figures presented for Yemen’s expendi-ture are correct.
■ For 1999 and 2001 (data from IMF Statistical Appendix 2005), Yemen’s rev-enues figures as% of GDP presented in tables 18 and 19 do not match. The fig-ures reported in table 19 for 1999 are incorrect. In 1999 oil revenue represents19.1% of GDP (table 18 and UNDP calculations), not 19.8% of GDP as stated176

in table 19. In 2001 table 19 calculates tax revenue of 7.7% of GDP, while thecorrect figure (presented in table 18 and UNDP table above) is 7.1% of GDP.The analysis of the calculations presented in table 19 shows that all revenue fig-ures as percentage of GDP are inaccurate for 1999 and 2001.
■ For 2000, a different problem arises in the composition of Yemen’s revenue.Indeed, while total revenue is 37.9% of GDP in both Yemen StatisticalAppendix 2003 and 2005, crude oil exports and non tax revenue reach respec-tively 19.2% and 2.8% of GDP according to IMF Statistical 2003, they attainrespectively 15.7% and 6.3% of GDP in IMF Statistical Appendix 2005. Theother categories remain unchanged. The figure of 6.3% of GDP reported for nontax revenue in IMF Statistical Appendix 2005 represents an outlier compared toYemen’s average non tax revenue, which averaged 2.3% of GDP between 1994and 2003 (if 2000 is eliminated). It is however difficult to determine which fig-ures are correct. On the basis of using the latest information available, we select-ed the figures presented in IMF Statistical Appendix 2005.
177

178

Financial Sector Development, Economic Growth and PovertyReduction: A Review of Theories and Evidence
The central role of the financial sector in an economy has been succinctly summarisedby Stiglitz (1994, p. 23) in the following words:
“Financial markets … can be thought of as the “brain” of the entire economic system,the central locus of decision-making: if they fail, not only will the sector’s profit belower than would otherwise have been, but the performance of the entire economicsystem may be impaired.”
The validity of this statement is borne out by Asia’s financial crisis and the resultanteconomic crisis in the later half of the 1990s. The early development economists sawunderdevelopment as primarily a result of market failure. The conventional wisdomwas that left to itself, the financial market will not generate sufficient savings needed tolift economic growth rate, nor will it direct investible funds to socially desired sectors.Since underdeveloped countries are capital scarce, it was argued that if left to the mar-ket, the interest rate would be exorbitantly high which would deter potential investors.Thus, the policy prescription was to impose economic regulation on the financial mar-ket in the form of interest rate ceilings and to ration (direct) credit to socially desirablesectors or projects.
While this was the demand-side story of the financial sector, the supply-side had anumber of arguments. To begin with, the link between savings and interest rates wassuspect due to opposing income and substitution effects. For example, a low interestrate policy should result in low savings due to the substitution effect, but high savingsdue to the income effect. Thus, the effect of interest rate ceiling on the supply ofinvestible fund is ambiguous. It was argued that the supply of savings could beincreased by a process called “forced saving”. The main instrument of this process isgovernment budget deficit financed by money creation (Kalecki, 1976). The processof forced saving can work through a number of channels. First, expansionary fiscal-monetary policy increases income via the familiar Keynesian multiplier, which in turninduces savings to rise. Second, the expansionary fiscal-monetary policy will generateinflation. Inflation lowers real return on financial investment (especially when interestrates are administratively controlled), and thereby induces wealth-holders to changetheir portfolio by investing in physical capital. The resultant rise in capital intensityincreases output and hence savings (Tobin, 1965). Inflation also changes income dis-tribution in favour of profit earners with a higher propensity to save (Kaldor, 1955-56). Finally, inflation imposes a tax on real money balances. That is, people hold moremoney to maintain the real value of their money and thereby transfers resources to thegovernment (Friedman, 1971), which can be used for financing investment.
Thus two dominant features of early policy stance were (a) interest rate ceiling and (b)inflation. The combination of both produced either very low or negative real interest179
Annex 4

rates in most developing countries. However, this policy stance came under severe crit-icisms with the publication of two seminal works by Mckinnon (1973) and Shaw(1973). Financial repression, meaning very low or negative real interest rate, was singledout as a root cause of low savings rate and the underdevelopment of financial sector indeveloping economies. It has been argued that a repressed financial sector has a num-ber of growth-inhibiting impacts. First, it encourages people to hold their savings inunproductive assets such as real estate, gold and other precious metals. This hampers thegrowth of the financial sector (the brain of the economic system) due to inadequatedemand for financial assets. The “shallow” financial sector itself adversely affects savingsrate due to a lack of alternative financial assets and hence reduces financial resources forinvestment. Second, the low and negative real interest rate encourages potentialinvestors to be indulgent. This results in inefficient investment profile and capital-inten-sive industrial structure which is out of line with developing countries’ factor endow-ment. Third, the non-market allocation of investible funds encourages rent-seeking anddirectly unproductive activities when government tries to pick “winners” or priorityactivities. This, thus sows the seeds of “crony capitalism”. Other symptoms of financial-ly repressed economies include segmentation of the financial system into regulated andunregulated segments (a black market characterised by high interest rates).
The Shaw-McKinnon contributions generated a new orthodoxy which argued thatfinancial “deepening” or development is an essential ingredient of the process of cap-ital accumulation as reflected in savings and investment ratios and their productivity.This in turn contributes to economic growth. Financial deepening is best facilitated bya competitive financial system in which interest rates are market determined and inwhich there is an absence (or at least insignificance) of administratively-driven selec-tive credit allocation. The policy package that follows from this paradigm has becomea corner stone of the international financial institutions’ (the IMF and the World Bank)adjustment programmes.66 The financial liberalization paradigm also received consid-erable boost from the experience of the East Asian economies until doubts began toemerge after the 1997-98 economic crisis.
Critiques of Financial Liberalization Paradigm
The enthusiasm that greeted the financial liberalization hypothesis has turned out to beoverly optimistic and somewhat naive. To begin with the empirical foundation of theShaw-McKinnon paradigm appears less robust than was anticipated - for example, theevidence on the interest rate-savings link is quite ambivalent (see Hossain andChowdhury, 1996, 1998). Study by Bandiera et al (1998: 21) concluded, ‘it would beunwise to rely on an increase in savings as the channel through which financial liber-alization can be expected to increase growth’.
Critics have also pointed out that financial sector liberalization in a pre-dominantlyrural and agricultural economy may adversely affect economic growth and exacerbaterural-urban inequality. A market-based financial sector generally displays a bias towards
180
66 The hypothesis of financial liberalization appeared to exert quite a considerable influence on policy develop-ments in industrialising nations. As Hanna (1994: 1) notes:Theories of the link between financial performance and economic growth, particularly as advanced by McKinnon(1973) and Shaw (1973), have been the basis for a series of financial reforms around the world, most prominentlyin the Southern Cone of Latin America , but also in Turkey, parts of Africa and East Asia.

the urban and commercial sectors due to perceived higher rates of return in these sec-tors. This is evident from the experience of countries that have liberalised their finan-cial sector and allowed private sector banking operations. Most countries have seen theclosure of rural branches of privatised banks and the cessation of their specialised cred-it facilities for agriculture and small-scale operations.67 The problem of access to cred-it for the rural and agricultural sector can be exacerbated by the dismantling of gov-ernment’s credit facility programmes through specialised banks. As a result, the growthof agricultural and small-scale sectors may suffer which adversely affect the poor whodepend predominantly on these sectors. Thus, financial liberalization may in factincrease poverty both through its growth inhabiting and inequality enhancing effects.68
The naive version of the financial liberalization hypothesis generally abstracts fromproblems of market failure that could afflict financial systems. One now has a clearerunderstanding of the implications of market failure. Such failure stems from a numberof sources, such as externalities, the exercise of monopoly power by dominant banksand information asymmetries between borrowers and lenders (Kay and Vickers, 1988).Examples of externalities include the risk of systematic failure (that is, the notion thatbank failures may be correlated, with actual or threatened failure in one case raising therisk of failure of another) and the so-called ‘infection effect’ (lowering of product andprice standards through excessive competition). Concern has also been expressed thatfinancial liberalization could unleash dominant firms that could exercise monopolypower (through excessive price-cost margins and erection of entry barriers) to thedetriment of dynamic and static efficiency - see Vittas (1992) for a fuller exposition ofthese ideas.
Stiglitz (1989) has emphasised the central role that information asymmetries play in themarket failure of financial systems. In essence, the argument is that banks do not haveperfect information about the credit worthiness of borrowers. In such a context moralhazard and adverse selection problems could emerge: borrowers have an incentive toassume more risky projects when the cost of credit increases; the banks’ reliable clientsmay be replaced by less solvent debtors because the former are indistinguishable fromthe latter. In such a context, interest rate ‘overshooting’ could occur (that is, rising toexcessive levels to cover default risk), thus crowding out low-risk projects with high,ex-ante social rates of return. It is plausible that in the early stages of developmentinformation asymmetries are more acute, partly because of the lack of institutions thatcollect and disseminate credit information. The concerns for the possibility of interestrate over-shooting and moral hazard associated with risky behaviour of banks,(Hellmann, Murdock and Stiglitz, 2000) have suggested some control over interest ratewhich they call “financial restraint”.69
181
67 This experience is not unique in developing countries. Many industrialised countries, such as Australia, experi-enced an exodus of banks from the rural areas following deregulation of the banking sector.68 See Chowdhury (2000) for an evaluation of financial sector reforms in Bangladesh which finds an urban bias.69 Financial liberalization may encourage perverse behaviour on the part of financial institutions, and thus enhancethe risk of banking and financial crisis even in an otherwise well-functioning economy. As deposit interest rates risefollowing liberalization, banks have to raise their lending rates. This adversely affects the cash-flow situation offorms and increases the risk of defaults. Furthermore, higher lending rates cause the problem of adverse selection asthey attracts risky borrowers. Additionally, the risk of banking crises is much more in countries where the institu-tional and regulatory framework is weak and corruption is widespread. The study by Demirguc-Kunt andDetragiache, (1998) shows that banking crises are more likely to occur in liberalised financial systems.

The disastrous results of financial reform in the 1970s in the Southern Cone countriesand the 1997-98 financial crisis in Southeast Asia has made it clear that too much atten-tion was given to the allocative aspects of the financial system. An issue of central sig-nificance related to market failures that characterise financial systems is prudential,organisational and protective regulation (Stiglitz and Weiss, 1981; Stiglitz, 1989), whichwas ignored in the haste of financial liberalization. The events in Southeast Asia andfinancial crises in liberalising countries have exposed the limitations of both the naiveview of financial liberalization (or its nuanced version that emphasises sequencing ofreforms). In particular, they indicate that financial liberalization increases the fragility ofthe banking sector. The problem becomes more acute in the absence of a proper pru-dential regulatory framework. The problem is compounded by increased capital flows.
Assessing the financial liberalization paradigm in the wake of Asian crisis, Cole andSlade (1999, p. 108) conclude:
“Painful as it may seem for those of us who have advocated this model, [the] recentcrises compel us to reconsider whether it is possible to create in a few years the essen-tial preconditions for a safe and sound, privately-owned financial system, operating ina free-wheeling globalized world, especially in developing countries that are still in theearly stages of establishing effective, democratic political and legal systems.”
At the very least, [the Asian] crisis should provoke a searching re-examination of therisks inherent in the pursuit of the strategy of liberalization and globalization, as wellas exploring alternative approaches that might produce better results over the longerrun for countries in different stages of the economic and political development process.
Can Financial Repression Be Good For Growth?
A number of authors have questioned the analytical foundations of the financial liber-alization hypothesis by arguing that what is apparently perceived to be financial repres-sion is really a case of efficient internal capital markets (Lee, 1992). Variants of thisargument can be found in Wade (1988) and Amsden (1989). The Korean experienceof the 1970s and that of Japan in the early phase of its industrialisation are often mar-shalled as evidence in favour of this intriguing view. It is argued that the empirical evi-dence in favour of financial liberalization is dominated by large repressions and hencedoes not invalidate the hypothesis that mild repression is enhances economic growth.70
In developing this argument, it would be useful to start with the distinction thatZysman (1983) makes between a capital market-based and credit-based financial sys-tem. In a capital market-based financial system, securities (stocks and bonds) are themain sources of long-term business finance. Borrowers can choose from a broad spec-trum of capital and money market instruments offered competitively through a largenumber of specialised financial institutions.
182
70 Incidentally, this is view is supported by the World Bank study of the East Asian economies (World Bank1993) which finds that financial repression in the high performing Asian economies (HPAEs) has been mild asopposed to many other developing economies.

In a credit-based system, the capital market is weak and firms rely heavily on credit tofinance investment. This makes them heavily dependent on banks - to the extent thatbanks are the main suppliers of credit. However, if banks are themselves dependent onthe government, then firms become heavily dependent on the government. One thushas a case of a state-controlled, credit-based financial system. In such an institutionalenvironment, financial repression (in the form control of credit allocation by the gov-ernment) becomes the norm, and firms exhibit high debt-equity ratios.
Wade (1988) and Wade and Veneroso (1998) maintain that Korea and Taiwan can becharacterised as exhibiting the classic features of government-dominated credit-basedsystems. During the 1970s, debt-equity ratios were 300-400% in Korea and 100-200%in Taiwan. The corresponding figures in such Latin American countries as Brazil andMexico were 100-120%. In the industrialised countries, the figures were below 100%.Wade (1988) attributes this feature to much higher domestic savings ratios (30-40% ofGDP) in Asia as opposed to 15-20% in industrialised countries. Households who pre-fer less risky bank deposits to equities largely do these savings. While households andgovernments are not significant net borrowers, the bank loans are biased to the corpo-rate sector. Furthermore, in Taiwan, virtually the entire banking system has, until veryrecently, been government-owned. In Korea the same was true until 1980-83 andeven after the financial deregulation of the mid-1980s, the government has exercisedde facto control of the banking system through personnel policies, appointment of sen-ior managers, range of services and the like.71
There are, according to the advocates of this view, distinct advantages that flow fromthe operation of a state-dominated, credit-based system. Wade (1988: 134), for exam-ple, identifies the following alleged advantages. First, ‘...a credit-based system permitsfaster investment in developing country conditions than would be possible if invest-ment depended on the growth of firms’ own profits or on the inevitably slow devel-opment of securities market’. More importantly, productive investment is less affectedby speculative stock market booms and busts.
Second, a credit-based system tends to avoid the bias towards short-term profitabilitythat often appears to be associated with a stock market system. This stems from theargument that lenders of long-term finance are interested in the ability of borrowers torepay the loans over the long-term. Hence, long-term performance becomes the dom-inant consideration entailing a focus on such issues as the ability of organisations todevelop new products, cost competitiveness and so on. These therefore become thecriteria that managers are concerned with rather than short-run performance in thestock market.
According to Wade and Veneroso (1998), such a financial structure requires co-oper-ation between banks and firms and considerable support from the government. For thedurability of the system the government must be ready to buffer firms’ cash flow andsupply of capital against ‘systemic shocks’, while not protecting firms from the conse-
183
71 Assessing the financial sector reforms of the 1980s in Korea, Park (1994, p. 57) concluded, ‘[a]lmost everyfinancial activity in Korea, including access to the banking sector, the determination of interest rates, and the allo-cation of credit, has been heavily regulated by the government’

quences of bad judgement. In Korea, for example, inefficient companies were oftenpenalised, either by being required to undertake managerial or financial restructuring,or by allowing them to go into bankruptcy (Chang, 1998). A state-dominated finan-cial system provides the government with the necessary political clout to implementits industrial strategy. As Wade (1988:134) puts it: ‘firms are dissuaded from opposingthe government by knowledge that opponents may find credit difficult to obtain.’
The notion that a credit-based financial system can be seen as a political device to assistgovernments in the implementation of industrial strategy is the crux of Amsden’s(1989; 1991) argument that financial repression is an essential feature of ‘late industri-alisation’ (of which Korea and Taiwan are classic examples). In her model of late indus-trialisation, governments deliberately use selective credit allocation in order to speedup the process of industrialisation. However, industrialising nations run the risk thatcosts of financial repression can outweigh its alleged benefits in the sense that it canprovoke a subsidy mentality and induce wasteful rent-seeking behaviour. Yet, govern-ments in late industrialisation can circumvent this difficulty by ensuring that abuse ofpreferential credit allocation is minimised through the imposition of strict performancestandards. If such standards are based on good approximations of ex-ante social rates ofreturn, then politically determined credit allocation will lead to socially profitableinvestments in “desirable” industries and sectors. Hence, financial repression will leadto rapid growth.
A more sophisticated argument in favour of financial repression stems from transactionscost economics which in turn relies heavily on the notion of information asymmetries.This view is closely associated with the work of Lee (1992) and can be characterisedas the “internal capital market hypothesis”.
As noted at a previous juncture, when information asymmetries between borrowersand lenders are high and pervasive, they can be a potent source of market failure.Under such circumstances, reliance on the “internal capital market” (reliance onfinance generated through retained earnings or out of depreciation charges) can resolvemarket failure by reducing or eliminating the incidence of information asymmetries.
Lee (1992) has tried to adapt this argument to the East Asian case by suggesting that astate-dominated credit-based system operates as a de facto internal capital market. Thestate cultivates a long-term and close relationship with borrowing firms. The atmos-phere of trust and co-operation created as a result of this close relationship allows“lender monitoring” to be carried out effectively and efficiently. The outcome is thatinformation asymmetries (and transactions costs) are minimised. Hence, what is appar-ently considered a phenomenon of financial repression is in effect a de facto internalcapital market that is more efficient than private capital markets - an interpretation thatis endorsed by Dalla and Khatkhate (1995) in their evaluation of Korean financialreforms in the 1980s and 1990s.
The pace and nature of financial liberalization in East and Southeast Asia in the 1990smarked a significant departure from the “Asian development model” as implied by thegrowth-promoting financial repression view (Brownbridge and Kirkpatrick, 1998).
184

There are at least two areas where the departure has been quite crucial: control overexternal borrowing and state guidance of investment. For example, in Korea, deregu-lation of the financial sector in the early 1990s included the removal of restrictions oncorporate debt financing and cross-border flows. Local companies and banks wereallowed to raise money overseas without the traditional supervision and control.Likewise, the Thai government relaxed foreign exchange controls, granted offshorebanking licenses, eased the rules governing non-bank financial institutions (NBFIs),and allowed finance companies to fund equity purchases on the margin. With theremoval of interest rate controls or ceilings, the scope for investment guidance alsodiminished as market determined interest rates were increasingly relied upon for allo-cation of investible funds. Thus, it is argued that the financial crisis is not a result of thelong-term close government-business-main bank relationship (a salient feature of theAsian development model) which has come to be known as “crony capitalism”, ratherit is the departure from the model which precipitated the crisis. In support of this argu-ment, observers (e.g., Stiglitz, 1998a) also point to the bank failures in the 1990s incountries such as USA and Sweden that are fully transparent unlike the Asian cronyeconomies.
While the above arguments are suggestive and interesting, one can construct cogentcounter-arguments. First, one should be careful not to confuse a credit-based systemwith a state-controlled credit-based system. Financial repression is a necessary feature ofthe latter, not the former. More importantly, the major advantages of a credit-basedsystem as identified by Wade do not require the existence of state control (and hencefinancial repression). The only way in which financial repression can contribute to eco-nomic growth in this framework is to presuppose that a strong-willed government hasthe capacity to overcome the inadequacies of private capital markets without the cor-responding risk of government failure.
The hypothesis of the superiority of “lender monitoring” in a state-controlled finan-cial system is also questionable when one takes account of the interactions between for-mal and informal credit markets. This point can be developed using an argumentexpounded by Cole and Patrick (1986). When formal financial institutions are regulat-ed, informal credit markets expand. Such markets provide funds to those who cannotobtain credit from formal sources. In addition, privileged borrowers in regulated mar-kets have an incentive to re-lend to users in unregulated markets (and hence profitfrom arbitrage). The net outcome is that informal credit markets act as a channel fordiverting official (regulated) credit to more profitable investment opportunities, thusinvalidating the notion that the state can effectively monitor the behaviour of borrow-ers. Some evidence can be offered to substantiate these arguments by focusing on theKorean experience. Thus, in 1972, approximately 50% of commercial firms in Koreafinanced their investment needs through the informal credit market. In addition, cred-it diversion was quite extensive (Cole and Patrick, 1986).
Relationship Vs. Arm’s-Length Financial Systems
Rajan and Zingales (1998) have attempted to synthesise both “financial liberalizationand “financial repression” views and provided a theoretical rationale for a relationship-
185
based financial system at an early stage of development and the need for a market-basedsystem at a later stage. Their starting point is the dual primary roles of a financial sys-tem: (a) resource allocation and (b) return to financier. In an underdeveloped econo-my with a poor legal structure, a relationship based system which limits competitionensures a return to the financier by granting some control over the firm being financed.Without such assurances, funds would not flow in sufficient quantity to productiveinvestment. Financiers attempts to secure their return on investment by retaining somekind of monopoly over the firms they finance. The “opacity” or lack of transparencyact as a barrier to entry required for the maintenance of monopoly power.
A relationship-based system, which restricts competition, does not always yield sub-optimal results. It allows financiers (banks) to take a longer perspective in investmentdecisions, as they can use their monopoly power to charge above market rates in nor-mal circumstances in return for an implicit agreement to provide financing at belowmarket rates when the firms face short-term cash-flow difficulties. That is, the relation-ship-based system allows banks and firms to “internalise joint surplus” by trading offshort-run losses for longer-run gains. This factor is borne out by examples such asSumitomo Bank’s guaranteeing of Mazda’s debts during its trouble after the first oil-price shock and the rescue effort by exhorting employees within its “keirestsu” to buyMazda cars.
However, when with economic growth the supply of capital increases and the num-ber of profitable projects declines, price signals become essential in the selection ofprojects. And the price signal or a market-based system cannot work well unless thereexists well developed institutions for enforcement of property and contractual laws andstrong disclosure legislation as a guarantee of protection. Thus, which system worksbetter depends on two factors: (a) the ratio of available capital to profitable investmentopportunities and (b) the degree to which institutional development facilitates con-tracting. Table A.5 summarises outcomes of the two systems. As can be seen fromTable A.5, both systems can work well when the available capital-investment oppor-tunities ratio is low, but there is a strong legal system. The neither system works whenthe availability-opportunity ratio is high, but the legal system is very weak.
Table A.5: Conditions for Efficiency of Relationship-based and Arm’sLength Financial Systems
Contractability Capital: Opportunity Ratio
(Quality of the legal system) Low High
Low Relationship based Neither
High Both Market based
This explains why the relationship-based system was congenial in the early stage of EastAsian development, and why the very system failed at a later stage. When capital wasscarce compared with profitable investment during the initial phase of development, itwas not very difficult to determine projects with positive net present value without awell-functioning price signal. A relationship-based system did reasonably well in select-ing profitable projects. It allowed firms to expand without being too sensitive to theiroperating cash flow and reap economies of scale and scope. Furthermore, since the186

relationship-based system allows cross-subsidisation, banks could finance younger firmsat below rates being compensated for above market rates for mature firms.
However, the institutional development lagged behind the extent of financial deepen-ing with economic growth72 and the pace at which the financial system movedtowards a market-based system. As a result, the situation in Southeast Asia in the 1990scan be described by the lower right-hand corner – the co-existence of high capitalavailability-opportunity ratio and low contractability. The problem was compoundedby the rapid inflow of foreign capital in huge quantities. To begin with, the foreignlenders (especially of short-term capital) do not have a long-term relationship with thelocal borrowers. Furthermore, their ability to effectively monitor loans was impededbecause of a lack of transparency in the published account as Banks and NBFIs inIndonesia, Korea and Thailand did not apply international accounting standards incompiling audited accounts.
Managing the Financial System During the Process of Development: Towards An AppropriateRegulatory Framework
The preceding discussions have shown that both the naive version of the financial lib-eralization hypothesis and strident advocates of (East Asian-style) financial repression payinsufficient attention to the fact that the resolution of market failure that afflicts finan-cial systems need an appropriate regulatory framework. An internal capital market - ormore generally financial repression - can, in theory, resolve the problem of market fail-ure, but the emerging conventional wisdom is that prudential and other regulations areessential for a stable, efficient and fair financial system and hence for economic growth.It is now generally agreed that inappropriate regulations and supervisory standards in acountry not only retard its long-run economic growth but also increase the likelihoodof a financial crisis that could spread beyond the country’s own border.
Table A.6 - which draws heavily on Vittas (1992) - provides a simple framework thatallows one to locate the importance of prudential and related regulations in the effi-cient management of financial systems. Table A.6 makes it clear that the liberalization/repression debate has focused primarily on the allocative aspects of the financial system.This in turn reflects the stylised fact that in developing countries prudential, organisa-tional and protective regulations were hardly considered, largely because informationproblems were given insufficient attention.
Although Table A.6 has set up the different types of financial regulation as seeminglymutually exclusive categories, in reality different regulations have effects that cut acrosstheir designated domain. Thus, global credit controls that stem from macroeconomicobjectives also fulfil a prudential function to the extent that they restrain banks fromimprudent expansion of credit. Furthermore, as Barth et al (1998) point out there is
187
72 As Patrick (1966) noted, economic growth creates demands for financial services (so-called 'demand-following'expansion of the financial system); economic growth is also preceded by financial development (so-called 'supply-leading' evolution of the financial system). Disentangling this two-way causality is not an easy task, althoughJung's (1986) analyses of fifty-six countries (which includes some of the Asia-Pacific economies) suggests thatcausality changes over the course of economic development. In other words, in the initial stages of development,supply-leading forces are dominant, while in later stages demand following forces are at work.

relatively little empirical evidence to support any advice regarding specific and com-prehensive regulatory and supervisory reforms. This is because detailed cross-countrycomparisons of financial regulatory and supervisory systems for developing countriesdo not yet exist.
Table A.6: Types of Financial Regulation - Objectives and Key PolicyInstruments
Sources and Notes: Adapted from Vittas (1992: 63)
However, based on their preliminary study of 50 countries and other studies, Barth etal (1998: 6) suggest the following initial steps that could be taken to reduce significant-ly the likelihood of banking crises:
■ Develop and improve legal systems and information disclosure.■ Impose rate ceilings on bank deposits.■ Establish limits either on the rate at which banks can expand credit or on the rate
of increase in their exposure to certain sectors, such as real estate.■ Require greater diversification of bank portfolios.
188
Type of Regulation
Macroeconomic
Allocative
Structural
Prudential
Organisational
Protective
Objectives
Maintain control over aggregateeconomic activity - maintainexternal and internal balance
Influence the allocation of finan-cial resources in favour of priorityactivities
Control the possible abuse ofmonopoly power by dominantfirms
Preserve the safety and soundnessof individual financial institutionsand sustain public confidence insystemic stability
Ensure smooth functioning andintegrity of financial markets andinformation exchanges
Provide protection to users offinancial services, esp. consumersand non-professional investors
Examples of Key PolicyInstruments
• Reserve requirements• Direct credit and deposit ceil-
ings• Interest rate controls• Restrictions on foreign capital
• Selective credit allocation• Compulsory investment
requirements• Preferential interest rates
• Entry and merger controls• Geographic and functional
restrictions
• Authorisation criteria• Minimum capital requirements• Limits on the concentration of
risks• Reporting requirements
• Disclosure of market informa-tion
• Minimum technical standards• Rule of market-making and
participation
• Information disclosure to con-sumers
• Compensation funds• Ombudsmen to investigate and
resolve disputes

■ Reduce the restrictions on the range of activities in which banks can engage.
Barth et al maintain that it is not possible to determine apriori which combinations aremost appropriate for individual countries that are at different stages of development.Despite this caveat, it would be fair to maintain that the central purpose of prudentialand organisational regulation is to deal with market failure associated with moral haz-ard, while protective regulation focuses on the need to design a ‘fair’ financial systemthat protects the interests of users of financial services.
189

190

Recommended Steps and Procedures
I-Macroeconomic Policies: Enhance investment and employmentgeneration through Pro-Poor expansionary policies
I-1-Fiscal Policy
Objective Expenditure reduction and switching policies
Impact Aggressive revenue generation efforts (12%-18% of GDP)
Increase of non oil revenues to accumulate permanent
productive wealth.
Negative effects Reduces consumption but might crowd out private
investment and can lead to inflationary consequences
Practical steps and procedures Sequence
Introducing a 10% General Sales Tax GST(3-5%of GDP) Short term
Eliminating custom exemption and fighting smuggling(1% of GDP Short term
Applying an excise tax on petroleum, real estate and large landholdings
(1.5%-2%of GDP). Short term
Strengthening the tax customs administration(0.5%-1%of GDP) Short term
Additional tax on personal and corporate profit income(1% of GDP) Short term
Eliminating petroleum subsidies (6% of GDP). Short term
(completed)
Containing defence spending to 3%-4% of GDP (1-2% of GDP). Short term
Keeping deficit under 10% of GDP
Maintaining a balance between expenditures and revenues at 20-25% of GDP Short and
medium term
Adopting budget reform measures such as:
-Implementing effective methods to collect data and analysis, design appropriate Short and
criteria for evaluation, implementing existing laws, -delegate budget medium term
implementation to the line ministries and enforce budget monitoring.
The establishment of an ODA-based stabilization fund to overcome the medium Short and
and long term problems of falling oil revenues and increase international medium procedure
borrowing
Reducing civil wage bill (1-2% of GDP) Mid term
Increase in development expenditure and maintain capital expenditure Medium and
at 10% of GDP to build infrastructure in poor areas Long term
Borrowing from the domestic private sector to raise increase the national savings. Long term
191
Annex 5

I-B-Monetary Policy
Objective Reduce the benchmark interest rate and expand money
supply through a gradual decrease in required reserve ratios.
Impact Make credit cheaper and more readily available to the private
sector.
Practical steps and procedures Sequencing
Discriminatory interest rates to target employment creation as well as maintain
moderate rates of inflation (such as 10-15% per year) Short term
Targeted credit policies for priority sectors to mandate loans to priority sectors
which are employment intensive in agriculture and manufacturing and to poor
households especially in rural areas. Short term
Implementing Incentive based measures:
• Banks would hold lower reserves for backing up loans to priority sectors
(such as differential reserve requirements for banks).
• Central Bank would draw on part of its large stock of foreign exchange reserves
to open a special discount window for banks that agree to lend to priority sectors.
• Lower reserve requirements for the reserves invested in such activities rather
than for deposits invested in speculation
I-C Foreign Exchange Policies
Objective Fostering Industrialization and Trade
Impact Expansionary effect
Practical steps and procedures Sequencing
Depreciate the exchange rate. Short term
Restrictions on capital mobility by imposing restrictions on capital account
on convertibility and restrict commercial banks from investment abroad.
Increase foreign reserves for six months Medium
and Long term
192

II-Adjustment Policies
II-1-Financial Reform Policies
Objective Improve financial intermediation and adopt pro-active sectoral
credit policies
Impact: Higher savings mobilization and credit provision
Practical steps and procedures Sequencing
Increase the supply for small business lending through creating liquidity and Short term
risk sharing institutions for loans for commercially viable small business,
provide financial and administrative support for asset backed securities, which
would give loans to small business and open a special discount window facility
to offer credit guarantee or discount facilities to institutions that are on lending
to firms engaged in commercially viable employment intensive activities.
Creation of several specialized credit institutions (microfinance institutions)
to provide needed funding. Enhancing the several projects enhancing lending
to small establishments such as the:
• Local Community Development Programme
• Micro Start Programme
• Micro and Small Enterprises Development Programme
• Small Enterprises Development Unit (SEDU).
Stipulate regulations requiring commercial banks to diversify Short and
a certain percentage of their lending operations to rural areas and priority medium term
sectors to increase soft loans to sectors of priority.
Lower interest Rates Short
and medium term
CBY sets lower reserve requirements for the deposits invested in employment Short
generating activities. and medium term
Shift in investment from TBs & CDs to commercially viable small business. Short
and medium term
193

II-2-Trade Liberalization
Overall objective Increase competitiveness of Yemeni products and increased non
oil exports and improve trade balance
Impact Expand productive employment
Practical steps and procedures Sequencing
Build an investment fund and a special fund for human development
New innovation to apply new technologies in the production process, industrial
processing and management.
Adoption of operational Industrial Labour Market Information Systems, and Medium term
local competitive capacities in the areas of Marketing, Maintenance and Quality
Control – as well as the availability of industrial parks.
Implementing fiscal and other incentives as well as a better enforcement of
regulations (on trade/anti-dumping, and competition), a clear and coherent
industrial development strategy formulated in consultation with the domestic
private sector would create a more predictable and enabling environment for
domestic investment in productive sectors
Improving the links between the educational and training system in Yemen.
Improve the quality of the different vocational training centres (VTCs). Improve
the incentives for enterprises to promote investment in ongoing and in-house
training to make it a demand oriented system.
Adopting more sophisticated marketing skills to target specific products and
markets (such as leather products and handicrafts) and focus on upgrading certain
exports (such as natural honey and coffee)..
Upgrade the conformity and assessment procedures (which include testing,
certification and accreditation) since all exporters of animal and vegetable products
have to meet the sanitary and phytosanitary standards of industrial countries
Improving Yemen’s free trade zone, which suffered from idle undeveloped land Short and
to the overlapping of jurisdictions with respect to different zone activities? Medium term
Solving titling and property rights problems.
Build adequate technically qualified and experienced personnel able to master Mid and
WTO issues and handle negotiations. long term
Raise awareness among the whole society, regarding WTO issues, such as
enquiry that deal with services, standards, and IPR.
Upgrading the manufacturing base to reach a more diversified basket of non oil
merchandise exports.
Implementing of non conventional options for enhancing trade and investment Mid and
such as offset-agreements, where the purchase of weapons from a developed long term
country is complemented by direct foreign investment in civil industries.
Establish appropriate linkages with the rapidly changing global environment.
The application of new management techniques and promotion of standards and
quality assurance are necessary condition for entering international markets. The
HACCP (Hazard Analysis Critical Control Points) system is a necessary
qualification for winning contracts from the European Union and other
developed countries.
Upgrading institutions to make them consistent with the relatively more
advanced ones in the GCC countries.
Participation in regional value chains and specialization in areas where Yemen
has competitive Long term194

III-Complementary Policies
III-A-Structural Reforms
Objective Remove constraints in the way of the effective participation of
the poor in economic activities
Impact Increased incomes of the poor
Practical steps and procedures Sequencing
Boost economic activity (through provision of basic infrastructure such as Short and
electricity, gas, water and roads) medium
Promotion of a more conducive business environment, improve the legal Medium term
certainty and enforce ability of contract, simplifying licensing, fees and taxes
and reducing cumbersome administrative procedures, official harassment and
corruption Elimination of barriers to business establishment and establishing of
technical advisory services that could facilitate the development of micro
enterprises.
Implementing economic growth ‘from below’, among the self-employed,
micro-entrepreneurs and small enterprises and enabling small enterprises, which
are often deprived of resources and public support, to grow rapidly into
medium-sized firms with a potential to provide decent-paying jobs.
Diversify the economy and supporting sectors with growth and employment Medium and
potential. Boosting manufacturing to create productive and decent-paying long term
employment, relying principally on the growth of medium-sized and large
enterprises.
Substitution of qat with other agricultural commodities, such as coffee, fruits
and vegetables, which have strong export potential.
Fishing is a sub sector with proven growth potential. Boosting tourism is
exploiting Yemen’s potential in providing port facilities for shipping.
III-B-Social policies
Objective Investment in human capital
Impact Raise the productivity of the poor
Practical steps and procedures Sequencing
Enhance productive capacities and advance human development (such as for Medium and
greater health and education) and in particular for the poor in agricultural long term
sector by making the Central Bank use its foreign exchange reserves to set up
a specialized investment funding agencies to help increase private sector
investment in human capital.
Social welfare fund better focused to increase the amount allotted to poor areas Long term
procedure
195

III-C-Redistributive polices
Objective Support the poorer rural households living under the
compulsion of food insecurity
Impact Lead to sustained growth in agricultural productivity and create
positive preconditions for relatively poorer rural households to
sustain further income growth by diversifying their incomes and
supporting start ups
Practical steps and procedures Sequencing
Reallocate expenditure from the social welfare fund to small scale community Increase of physical
infrastructure investment
Re-orient fiscal policies in order to channel the revenues and provide financial
transfers to finance widespread public investment in basic economic and social
infrastructure.
Reduce the role of qat and force farmers to alter their cropping patterns Short term
(a transition period is still needed to liberalize the import of qat) This procedure
should be financed by a hypothecated tax on oil revenues and may be applied
also to qat.
Redirect government spending on the agricultural sector, and enhance the role Short and
of the government in facilitating increased agricultural productivity and rural medium term
incomes.
Land tenure and redistributive land reform through formalization the land Long run
registration process and formally registering sharecropper contracts and establish
the security of tenure of those with formally registered contracts. Enhance
debate around redistributive land reform in Yemen as market-led reform in
redistribution of land could be in favour of rural landed elites. Policies to
encourage a pro-poor consolidation of fragmented holdings, in the sense that
the overall share of landholdings held by the smallest 60% of landholders
increases relative to that held by the largest 40% of landholders, would be
encouraged. government. A successful cadastre is a necessary precondition
of tenancy reform.
196

III-D-Poverty focused activities
Objective Lead to sustained growth in agricultural productivity and create
positive preconditions for relatively poorer rural households to
sustain further income growth by diversifying their incomes and
supporting start ups. More small-scale interventions that have a greater
poverty reduction focus.
Impact Lead to sustained growth in agricultural productivity and create
positive preconditions for relatively poorer rural households to
sustain further income growth by diversifying their incomes and
supporting start ups.
Practical steps and procedures Sequencing
Adopting system of income support to farmers that are actively engaged in
switching to higher value more resource efficient crops.
Implement a food price stabilization programme and de-link the food price
inflation from international prices and eliminating poverty enhancing food price
inflation to free the CBY to adapt a more flexible approach to exchange rate
management to prevent overvaluation of the exchange rate Short term
Better extension services, to provide advice on cropping patterns, resource
allocation, and resource management, as well as marketing services.. These
services would in particular allow the faster identification and exploitation of
markets for niche products both within and outside Yemen..- Short term
Assist farmers in locating niche markets for higher value, more resource
efficient, products, improve packaging, storage, and transport, as well as
providing timely information on prices and markets, public support through
the construction of storage facilities and the improvement of transport networks
to allow crops to reach wider markets.
Diversification of farm diversification amongst relatively poorer small landholder
farms, in both rain-fed and groundwater irrigated regions of Yemen to eliminate
the effects of the market-led diversification of agriculture, which has enforced
food insecurity, inequality and poverty processes and will increase the lack of
resources at the disposal of relatively poorer small landholder farms.
Calculation of the economic rate of return and implementation of differential
price schemes that would benefit the relatively less well off to a greater degree
than the relatively well off. Short term
Focusing of public resources on small-scale, labour-intensive public works, such Short and
as rural roads, wells or irrigation wells. medium term
Public support towards publicly provided agricultural extension services practices Short and
to quadruple the agricultural output in between 5 to 10 years through: medium term
Provide extension advice on cropping patterns, resource allocation, and resource
management, as well as marketing services that can assist farmers in locating
niche markets for higher value, more resource efficient products.
Improvement in fruit and vegetable production by 16% per annum. Livestock
could be increased, if husbandry will be improved. Cotton, dates, papaya,
oranges, coffee, grapes, and tomatoes are highly efficient in their use of
resources, while qat, onions, sesame, sorghum, millet, alfalfa and potatoes are
197

relatively efficient uses of resources.
Encouraging community driven development to complement the activities of Midterm
the market and the state to assist in the building of infrastructure, improving
access to education, organizing the delivery of microfinance, managing natural
resources and permitting the scaling up of pro-poor programmes through:
Promote local empowerment, participatory governance, demand-responsiveness,
administrative autonomy, greater downward accountability, and enhanced local
capacity.
Finance accountable and inclusive community-based organizations as well as
attempting to forge functional links between community-based organizations
and formal institutions Facilitate the purchase of processing and packaging
equipment, or cultivation or harvesting equipment, all of which could be
owned communally, as well as providing loans for consumption shortfalls.
Enhance water management systems by Long term
Bringing the price of groundwater closer to its economic cost, establishing
decentralized water management associations.
Prioritize access to those who have inadequate water supplies.
Encouraging the re-establishment of traditional water conservation mechanisms
in rain-fed areas, as a policy priority.
Substantial public investment in water saving technologies and the introduction
of drought resistant higher value crops such as fruit trees, and investment in
renewing terraces and land levelling so that dry rain-fed terraces and seasonal
flood irrigation practices can be resurrected and modernization of the dryland
terraces and seasonal flood irrigation practices
Decentralized democratic governance reforms to be able to assist in the
reiteration of the rights of communities to water.
Water taxes as a means of recovering some of the subsidies that were paid to
the rural elite and encouraging the more efficient use of water in the irrigated
areas.
198