macroeconomic impact of capital flows in sub-saharan
TRANSCRIPT

1
MACROECONOMIC IMPACT OF CAPITAL FLIGHT IN SUB-SAHARAN AFRICA*
September 2014
John Weeks†
Professor Emeritus
School of Oriental & African Studies
University of London
Abstract
This paper assesses the impact of capital flight on growth in thirty-one sub-Saharan African
countries. It first considers the “macro fundamentals” hypothesis that capital flight would be
lower in a country whose government adhered to “sound” macroeconomic policies. Analytical
considerations fail to support this hypothesis. Second, it develops a growth estimating equation
derived from the Harrod-Domar framework. The growth estimations support the conclusion that
capital flight had a major impact on growth over the last three decades, 1980–2010. The negative
impact was greatest for the petroleum-exporting countries and those affected by internal conflict,
but it was also substantial for the other countries, with a few exceptions.
Key Words: Capital flight; Africa; sub-Saharan Africa; macroeconomic impact; growth
JEL Classifications: G11; O11; O55; E66
* This paper is forthcoming in Ajayi, S. I. and L. Ndikumana (Eds.) (2014) Capital Flight from Africa: Causes,
Effects and Policy Issues. Oxford: Oxford University Press. The book contains thematic chapters from a project of
the African Economic Research Consortium on “Capital Flight and Tax Havens in Africa” supported by generous
funding from the Norwegian Agency for Development Cooperation (NORAD). † The author thanks Ibi Ajayi, discussant at the project meetings in Kigali and Arusha, as well as an anonymous peer
reviewer for constructive comments and suggestions.

2
1. Introduction
The financial crisis of the late 2000s generated a global recession that brought declines
in cross-country private capital flows, including those from developed to
underdeveloped countries. As a result of the fiscal stress in developed countries,
reductions in official development assistance accompanied the declines in private flows.
These changes in the tempo and pattern of capital flows have significant implications for
growth in the sub-Saharan region. They also move the issue of capital account
management to the top of the policy agenda.
In mainstream (“neoclassical”) economic analysis, an international regime of
unregulated currency movements facilitates capital inflow, which, it concludes, can
contribute to funding investment and faster growth. In practice, the absence of
regulation also allows for the unrequited outflow of foreign exchange. With private and
official flows in decline, capital flight takes on great importance. The focus of this paper
is the probable impact of the various financial flows, especially capital flight, on the
macroeconomic performance of sub-Saharan African countries over the several decades
leading up to the global financial crisis.
I examine thirty-one sub-Saharan African countries,1 using the database constructed by
Boyce and Ndikumana (2010).2 I exclude the North African countries and South Africa
1 These are 1) Angola, Chad, Gabon, Republic of Congo, Cameroon, Nigeria, Sudan (petroleum
exporters); 2) Burkina Faso, Central African Republic, Cote d'Ivoire, Guinea, Guinea Bissau,
Togo (CFA, not petroleum exporters); 3) Botswana, Ghana, Kenya, Lesotho, Madagascar,
Malawi, Mauritania, Mozambique, Swaziland, Tanzania, Uganda, Zambia (national currency,
not petroleum exporter); and 4) Burundi, Democratic Republic of Congo, Ethiopia, Rwanda,
Sierra Leone, Zimbabwe (conflict affected, not petroleum exporter).
3
because their higher level of development gives them distinct characteristics, most
notably in the financial sector. In this paper, capital flight is a negative flow, consistent
with the treatment of the other financial variables. The statistics suggest that in the
absence of effective regulation of the external account, as is the case in most of the sub-
Saharan African countries, capital flight is quite substantial, both in absolute terms and
compared to other types of resource flows.
The evidence also suggests that the loss of foreign exchange through debt service and
capital flight may in part explain the relatively weak growth of the sub-Saharan region.
In the mid-2000s the outflows from debt service declined for most countries as a
consequence of long-delayed debt relief. This decline contributed to improved growth
performances in the years before the global financial crisis. National measures to limit
capital flight discussed in the final section would result in further improvement in
economic performance.
This study focuses on the macroeconomic effects of capital flight,3 with only brief
reference to its causes. I do not consider the important issue of how to recapture funds
illegally expatriated from Africa, a topic requiring skills far beyond those of economic
analysis (Basel Institute on Governance, 2009;Heggstad and Fjeldstad, 2010).4Section 2
discusses conceptual issues and approaches. Section 3 describes the analytical
2 Henry (2012) provides a more recent set of estimates, but these are not as inclusive as the
Boyce and Ndikumana database. 3 A review of the empirical work on the causes of capital flight is found in Ndikumana and
Boyce (2003)). 4Heggstad and Fjeldstadwrite (2010, vi), “Our general conclusion is that more knowledge is
needed on how banks assist political elites and their close associates, companies, individuals and
organized crime to channel capital out of African countries.” The topic of stolen asset recovery
and repatriation is discussed by Melvin Ayogu and Julius Agbor in this volume.
4
framework. Section 4 presents the results of the analysis of the impact of capital flows
on growth. Section 5 suggests areas for more research and includes general comments
on measures to reduce capital flight. Detailed treatment of this issue can be found in
other contributions to this book. Finally, an annex provides country-level statistics used
in this paper, 1980–2010.
2. Conceptual Issues and Approaches
2.1 Concept and Definition
Most economic variables have a generally accepted definition, though disputes may
persist over appropriate measures. The concept of “capital stock” provides a clear
example. No economist, orthodox or heterodox, would dispute the existence of a stock
of productive assets that generates a flow of products and services. However, agreement
on the definition has not prevented disputes about its measurement for at least sixty
years (discussed in Weeks 2012a, Chapter 10).
“Capital flight” represents an exception to the general agreement on concepts.
Neoclassical economists tend to treat it as part of financial transfers in general among
countries. Collier et al. (2001, 2004) offer a clear example of this approach, in which
they lump capital flight and migration by skilled people (“brain drain”) together as part
of the same “portfolio decision.” Variables commonly appearing in orthodox analysis—
exchange rate duality, public sector indebtedness, and political instability—allegedly
determine the composition of this “portfolio”(Dooley, 1988).
5
By focusing on individual maximizing behavior, one of the many limitations of the
orthodox approach is its inability to capture the dysfunctionality of capital flight at the
societal level as a whole. Eighty years ago Keynes recognized the anti-social nature of
unregulated capital flows, arguing that “advisable domestic policies might be easier to
compass if the phenomenon known as the ‘flight of capital’ could be ruled out” (Keynes,
1933, p. 757).5 At the end of The General Theory he supports interest rate management
to keep bond yields low, and capital account controls to block financial outflows by
speculators in response to public policies they oppose.
While the rather narrow orthodox approach may prove useful for certain purposes, it
does not treat what heterodox analysts take as the sine qua non of capital flight, its semi-
legal or illegal nature. The Africa Economic Outlook for 2013 criticizes the orthodox
view, arguing that it “misses an important component . . . financial outflows resulting
from the illicit appropriation of resources through theft, plundering of public resources,
corruption, and trade mispricing” (AfDB, OECD, UNDP, and UNECA 2013).6 Were
capital flight a simple portfolio adjustment its regulation would be equally simple.
The anxieties about illegality have led to the creation of several inter-governmental task
forces and organizations to control and bring transparency to international capital flows
5 Keynes was quite explicit in his skepticism about international capital flows. “I sympathize,
therefore, with those who would minimize, rather than with those who would maximize
economic entanglement among nations. Ideas, knowledge, science, hospitality, travel—these are
the things which should of their nature be international. But let goods be homespun whenever it
is reasonably and conveniently possible, and, above all, let finance be primarily national”
(Keynes 1933, p. 761, emphasis added). See also Crotty (1983). 6 Little dispute exists about the criminal nature of most undisclosed capital flight.“ By far the
vast majority of unrecorded transnational financial flows are illicit because they are violating the
national criminal and civil codes, tax laws, customs regulations, VAT assessments, exchange
control requirements, and banking regulations of the countries from which unrecorded/illicit
flows occur” (Lazzeri, 2013).

6
(Development Today, 2009; Henry, 2012). In 1999 representatives from seven
governments launched the Eastern and Southern Africa Anti-Laundering Group in
Arusha, which now has fifteen members. In 2010 it joined the inter-governmental
Financial Action Task Force, which has a global membership (Gallagher et al., 2002).
The focus on the illicit nature of international capital flows appears clearly in a recent
article by Ndikumana and Boyce (2011: 38):
Measurement of capital flight poses daunting challenges . . . Funds that are acquired
illegally, or funneled abroad illegally, or both, are not entered into the official accounts
of African countries. At the same time, the perpetrators of capital flight benefit from the
complicity of bankers and other operators who assist in the placement of the funds in
foreign havens.
In this paper I use the Ndikumana and Boyce definition of capital flight, both
analytically and as the relevant measurement category. The emphasis on illegality allows
broadening the concept beyond private response to public behavior (see Boyce and
Ndikumana 2005).7 For example, in the introduction to a collection of essays on capital
flight, Epstein writes,
People probably have the idea that money runs away for any of a number of reasons: to
avoid taxation; to avoid confiscation; in search of better treatment or of higher returns
somewhere else. In any event, people have a sense that capital flight is in someway illicit
and in someway bad for the home country . . . These commonsense ideas are also
7Christian (2009) places strong emphasis on public sector corruption as the source of capital
flight.

7
roughly what we mean by capital flight. It turns out, however, that it is quite difficult to
transform this commonsense meaning into rigorous, economic definitions, data, and
analysis(Epstein, 2005, p. 3).
To understand the macroeconomic impact of capital flight, it is essential to identify it,
first and foremost, as an illegal or semi-legal activity that governments must take action
to prevent, not as financial reallocation in reaction to government macroeconomic
policies. A frequently encountered assertion is that irresponsible macro policies cause
capital flight, implying that this outflow would end were public policy “sound” rather
than “populist.” This argument is a cornerstone of the ideology of “free markets” and
deregulation. However, capital flight frequently occurs prior to, or independently of,
specific national government macro policies.
The analysis that follows explicitly rejects that ideology. The empirical analysis in this
book shows that most capital flight results from anti-social activities recognized to be
illegal in all but a few countries. As a result, its control requires interventions
specifically designed for the regulation of cross-border financial flows. The difference
between reducing capital flight and regulating capital flow is strictly analogous to the
difference between enforcing trading laws that prevent fraud and regulating normal
market transactions.
With this perspective, we turn to the analysis of the macroeconomic impact of capital
flight. Compared to issues of the criminality and control of capital flight, there is little
rigorous analysis of its macroeconomic impact. The most important work to date is that
of Fofack and Ndikumana (2009), which uses an earlier version of the Boyce and

8
Ndikumana database to estimate macroeconomic effects on economic growth within a
Solow growth model. Building on previous treatment of the interaction of public debts
and capital flight (Ndikumana and Boyce, 2003; Boyce 1992), they find a substantial
impact of capital flight on investment across sub-Saharan African countries.8
In section 3, we turn to the analytical framework, which employs a special case of the
Solow model (Harrod-Domar), with a fixed capital-output ratio and investment rate.
Important as it is, the relationship between domestic investment and capital flight
represents only the first step in a thorough macroeconomic analysis. Equally essential to
a macroeconomic analysis is the interaction of capital flight with public debt, the
balance of payments, inflationary pressures, monetary policy, and fiscal balances,9
discussed further in section 6. Along with growth itself, these are all aspects of
economic stability, which I define as growth above population increase accompanied by
a sustainable balance of payments and without excessive inflation. “Excessive inflation”
means above the maximum rate consistent with growth and a sustainable balance of
payments.
A main analytical focus of neoclassical macroeconomics is full employment, a concept
that implies that an economy adjusts through individual optimization in response to
changes in relative prices. In the absence of full employment, resources are not scarce in
the economic sense and, therefore, prices are not parametric. Idle resources also imply
that the choices made by individuals are not necessarily realized (the sum of individual
8“The analysis in the paper demonstrates quantitatively that the gains from repatriation are large
and dominate the expected benefits from other sources such as debt relief” (Fofack and
Ndikumana, 2009). For the regression results, see pp.14–15. 9 Ndikumana and Boyce (2003) treat most of these in their analysis of the causes of capital
flight.

9
choices and the aggregate outcome are not equal). The existence of unutilized resources
implies that an economy adjusts through changes in quantities.
In a quantity-adjusting economy, relative prices, including the real exchange rate and
real interest rate, derive from domestic and international real variables, not the reverse.
Therefore, the impact of capital flight comes through changes in quantities. This does
not imply a fixed price model. On the contrary, quantity adjustment drives price
changes, which cannot be ignored.
Formulating the impact of capital flight on real variables and nominal prices presents a
huge agenda. I shall limit my analysis to the process that links capital flight to domestic
investment and growth, and its implications for further theoretical work.
2.2 The “Macro-fundamentals” hypothesis
The portfolio approach to capital flight explicitly claims that public sector economic
policies overwhelmingly determine the movement of all financial flows, including those
across borders. The term “macro fundamentals” is thus at the center of this assertion,
which should be viewed as a hypothesis that first requires clear analytical specification,
followed by its empirical application.
Empirical testing proves elusive, however, because of ambiguities in the meaning of
both financial movements and “macro fundamentals. ”We first consider the specification
of cross border financial flows. The capital account consists of a variety of financial
categories whose common aspect, that they can all be measured in units of money,
should not obscure their important differences. Several categories of private money

10
flows apply to sub-Saharan African countries. In the order of increasing short- term
volatility, they are direct foreign investment, remittances, equity purchases, transactions
in non-equity financial paper, and a general “other” category.
Setting aside circumstances of extreme outcomes for inflation and output due to civil
strife, no one could seriously argue that all people and businesses transferring funds
would have the same response or sensitivity to a given policy measure or outcome. An
obvious example is exchange rate movements. One presumes that those holding highly
liquid assets such as domestic currency or quickly negotiable domestic bonds prefer
appreciating and stable nominal and real exchange rates. This especially would be the
case for those asset holders planning a quick turn-around of their funds. The preferences
of companies considering direct investments would be quite different, as in the obvious
case of a company planning a new investment that would involve the export of a natural
resource whose international price is specified in a hard currency (e.g., the US dollar).
We would not expect any substantial influence of short-term exchange rate movement,
nominal or real.
In the case of a company planning investment in agriculture or manufacturing, the view
of the exchange rate turns on several considerations: whether the output would be
exported, the share of inputs imported, and the currencies in which the company plans to
hold its local debt. One possibility is a company that produces for the domestic market
using a high proportion of imported inputs and that borrowed on the international
market. In this situation, exchange rate devaluation has a negative impact on profits. For
an exporter holding its debt in national currency and using domestic inputs, devaluation
or depreciation would tend to increase profits.

11
Similar diversity arises with attitudes towards deficits and inflation. For direct investors,
preference again depends on the destination of the output and the currency structure of
company debt. It is unlikely that any generalizations can be made as to how remittances
by citizens abroad respond to macroeconomic performance without specifying the
intended purpose for the remittances. For example, we cannot predict the effect of
exchange rates, deficits, and inflation on the construction of housing, a common
motivation for remittances.
The concept of “macro fundamentals” may or may not be useful for some analytical
purposes. But for cross-border money flows it has no explanatory value because to each
form of money flow corresponds a different “fundamental.” In the absence of a
consensus on what is “sound policy” and even of the process by which such a consensus
might be reached, no alternative exists to discarding the concept as irrelevant for money
flows. To put it differently, the stability and predictability of future policy is not in itself
a positive inducement for investors and speculators if the policy is not specified.
A further problem exists that undermines the macro fundamentals hypothesis even in the
improbable case of a consensus among speculators, investors, and those sending
remittances. The problem is simple and straightforward. Governments do not control or
dictate macroeconomic outcomes; they seek to influence them within circumstances
beyond their control. Even the true believer in rational expectations recognizes that
random influences on the implementation of a policy can lead to an unintended and
unpredictable outcome. For the sub-Saharan African countries, whose national
production depends heavily on rain-fed agriculture, the link between policy measures
and outcomes is especially uncertain.

12
Figure 1 demonstrates the intractable problem of random effects or “shocks” at the
macro level. I assume that in a hypothetical sub-Saharan country, those who plan
adjustments of their financial flows reach a consensus that the “trigger value” of the
overall public sector balance is minus three percent of GDP. Should the deficit increase
beyond this, a substantial outflow of capital would occur, while a smaller deficit would
induce speculators and investors to maintain or increase their hoards of money in the
country. It may be that the consensus arises from IMF conditionality on the release of
tranches of budget support, in which case the instability “trigger” becomes self-
fulfilling. In this hypothetical case I assume that the IMF balance condition is consistent
with sustainable growth above population increase. I also assume that the government
requires a greater than fifty percent likelihood that it will not fall below the perilous
minus three percent and thus be punished by the IMF by the non-release of funds.
The government has what rational expectations theory calls the “true model” of its
economy, meaning that on average, when correctly implemented, the policy instruments
will generate the predicted outcome as the mean outcome. Let the purely random
volatility of the economy generate a standard deviation of the deficit of two percentage
points of GDP over a normal distribution of outcomes. If the government sets the IMF-
specified three percent deficit as its target, it faces a fifty percent probability that the
actual deficit will exceed the trigger value. It is possible, but unlikely, that the IMF,
speculators, and investors would accept the rational expectations explanation for not
achieving the deficit target. That would require all parties to agree ex ante and ex post
that the government had the correct model of the economy and appropriately
implemented its policies. This is unlikely because there is no method to distinguish

13
between undesirable outcomes that result from random shocks, the wrong model of the
economy, or bad policy (Weeks 2012a, Chapter 9).
To reduce the likelihood of missing the target, the government must aim for a smaller
deficit or even a surplus, depending on how large a risk it is willing to take. As Figure 1
is drawn, reducing the probability of an excessive deficit to about twenty percent would
require targeting close to a balanced budget. Doing so would reduce aggregate demand
and slow down the growth of the economy. It is not unreasonable to assume that this, in
turn, would discourage domestic investment and reduce long-run growth. The
dysfunctionality of trying to satisfy relatively inflexible “fundamentals” increases with
the underdevelopment of institutional capacity.
Corruption and macroeconomic “populism” are not required to account for governments
failing to satisfy the hopes and allay the fears of investors and speculators when
economies suffer from random shocks due to the nature of their production structures. In
such circumstances a rational government has little choice but to introduce regulatory
measures that limit the damage to expectations that those shocks can generate.
Figure1 goes about here
3. Analytical Framework
With few exceptions, investment goods are not produced in sub-Saharan African
countries and must be imported. Therefore, through the impact on aggregate investment
rates, foreign exchange flows from all sources represent an essential element in growth
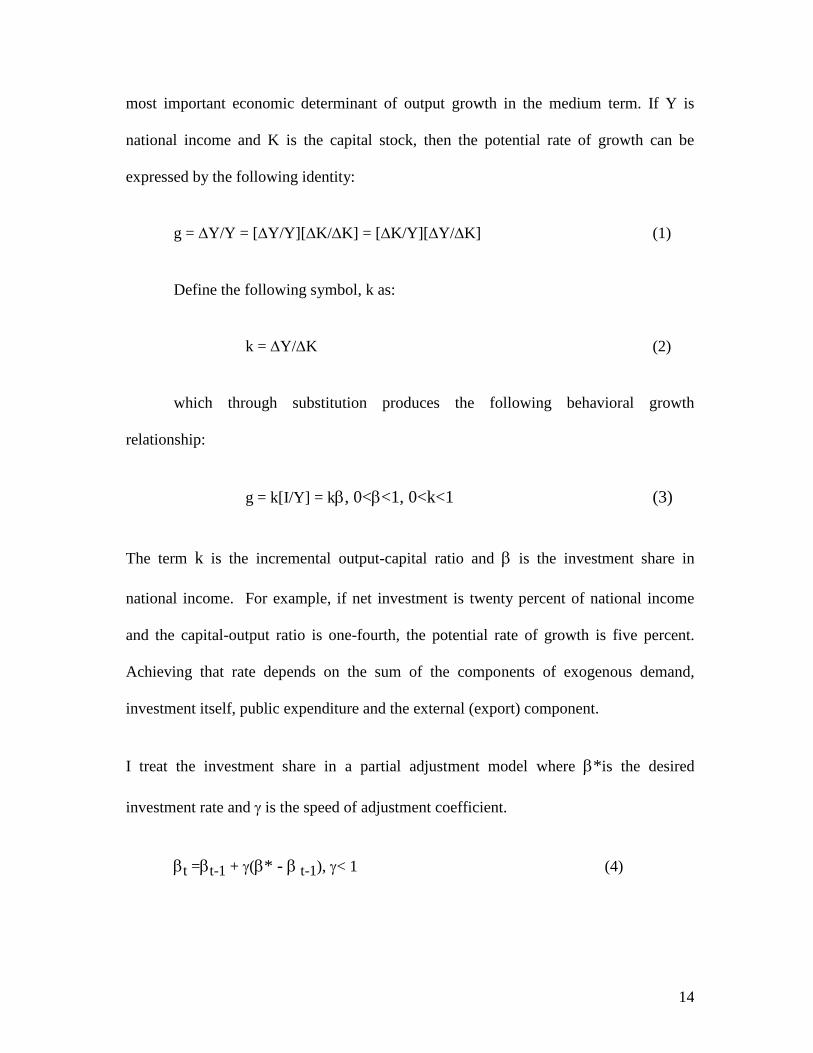
performance. Following the Harrod-Domar tradition, we treat the investment rate as the
14
most important economic determinant of output growth in the medium term. If Y is
national income and K is the capital stock, then the potential rate of growth can be
expressed by the following identity:
g = Y/Y = [Y/Y][K/K] = [K/Y][Y/K] (1)
Define the following symbol, k as:
k = Y/K (2)
which through substitution produces the following behavioral growth
relationship:
g = k[I/Y] = k, 0<<1, 0<k<1 (3)
The term k is the incremental output-capital ratio and is the investment share in
national income. For example, if net investment is twenty percent of national income
and the capital-output ratio is one-fourth, the potential rate of growth is five percent.
Achieving that rate depends on the sum of the components of exogenous demand,
investment itself, public expenditure and the external (export) component.
I treat the investment share in a partial adjustment model where *is the desired
investment rate and is the speed of adjustment coefficient.
t =t-1 + (* - t-1), < 1 (4)

15
The desired investment share is determined by the capacity to import. For ease in
formulating the estimating equation, I assume that the variables enter with exponential
coefficients.
* = (z*) (5)
The letter z* is the capacity to import that is consistent with *. For simplicity,
z* = zt-1 (6)
t =t-1 + (z*) - ( t-1)] (7)
= ( t-1)z* 8)
The ex post or actual growth rate is,
gt = k(t-1 k(zt-1) 9)
If adjustment is complete in every time period (= 1),the growth rate is determined by
the capital-output ratio times the desired investment share, which itself is determined by
the capacity to import.
The capacity to import equals the sum of export revenue and net financial inflows as
share of GDP. As shown below, in many sub-Saharan African countries the most
important components of financial flows are official development assistance and direct
foreign investment on the positive side, and debt service and capital flight on the

16
negative. There are a few exceptions to this generalization, an obvious one being the
large but declining workers’ remittances into Swaziland. Because of the poor quality of
the data for a majority of the countries in this study, remittances are not included as a
separate item. For the thirty-one countries in Ndikumana and Boyce (2011, pp. 42–5,
52–3) the capital flight variable includes unreported remittances.
As noted at the outset, South Africa is excluded from the analysis because of its special
characteristics compared to other sub-Saharan African countries. The most important for
current purposes is the country’s large and sophisticated financial sector, which cannot
help but affect financial flows differently than in the other countries.
Each major component of the capacity to import has its own behavioral characteristics.
In a model with quantity adjustment, external demand determines exports even for
“small countries.”10 Development assistance reflects an administrative decision strongly
influenced by the political interests of donors and lenders. For the current period,
commercial and official loans granted in previous years determine debt service
obligations. Foreign direct investment in the region is overwhelmingly focused on
natural resource extraction, especially petroleum. It would seem reasonable to treat all of
these as exogenous with respect to the recipient country.
In principle all revenue from exports could be used to import. However, part of direct
investment is replacement and maintenance, though estimating this is not possible in this
paper and perhaps not even in principle. The balance of payments flow associated with
direct investment consists overwhelmingly of imports used in those investments. After
10 In mainstream international trade theory a “small country” is one whose import demand and
export supply have no impact on world prices.

17
adjusting for depreciation, the entire flow should contribute to capacity expansion, but
very little of it is non-committed foreign exchange. Direct investment is, in effect, the
private sector equivalent of “tied aid” (Fortanier, 2009). It should be entirely growth
enhancing if the investments prove profitable and complement, rather than substitute, for
investments by nationals. The main FDI impetus to growth comes from its direct
contribution to increasing capacity and possible spread effects from the transfer of
technology and skills.
Development assistance contains components of current and capital expenditure, with
the latter intended to enhance productive capacity directly. The proportion of
development assistance that can serve as uncommitted foreign exchange for
discretionary investment by the public or private sector can be astoundingly low
(UNCTAD 2000, Chapter 6). This is a result of the explicit tying of aid, the share
budgeted for technical assistance, and the projects and programs that are not
investments.
The asymmetry between the two major inflows and outflows are extremely important.
For national growth and development, capital flight and debt service are dead-weight
losses. They are unrequited transfers with no benefit, direct or indirect, on consumption
or investment. In contrast, most of foreign direct investment in sub-Saharan African
countries enhances growth in the primary sector, which has few spread effects. When in
other sectors, FDI may substitute for domestic investment, reducing its net capacity-
creating effect. We ignore the substitutability between foreign and domestic investment
in this study, though it should be treated in subsequent research. Development assistance

18
may fund essential goods and services, though its net balance of payments contribution
may be low, except when explicitly designed otherwise.
In post-conflict circumstances, development assistance carries a large component of
uncommitted foreign exchange, in order to fund basic imports until the war-affected
export economy revives. Sierra Leone in the 2000s provides a clear example, with a
trade deficit of over fifteen percent of GDP during 2001–2003, and an even larger fiscal
deficit. During these years development assistance was larger than the sum of the two
deficits, covering import requirements and public expenditure until the economy began
to recover. A substantial portion of this development assistance may have funded
capital flight, which accounted for an additional annual outflow of twenty percent of
GDP in these years.11 This type of country–level effect should receive high priority on
the research agenda.
In the sub-Saharan region governments of the resource-rich countries owed part of their
foreign debt to private institutions. In the 1990s and 2000s this was almost all converted
to official debt to governments, Bretton Woods institutions, and regional development
banks.12 For this reason government debt service payments could be combined with
official development assistance to yield “net official flows.” This category is especially
appropriate because a portion of development assistance involved recycling funds to
official donors and lenders to cover debt payments.
11 For an analytical discussion of capital flight and development assistance, see Ndikumana and
Boyce (2011, pp. 66-7). On Sierra Leone, see Weeks (2009). 12 The Zambian public debt is an example of this conversion (Weeks et al., 2006, chs. 2 and 6).

19
In the 1990s and into the 2000s, prior to general debt relief, this recycling amounted to
de facto debt rescheduling when lenders, most notably the IMF and the World Bank,
formally refused to reschedule or reduce government debt. The de facto recycling of
“assistance” into debt service involved the international financial institutions in a
process analogous to private banks replenishing reserves in face of non-performing
loans. The governments of several countries, including ones with absolutely large debts
such as Zambia, found themselves on the verge of default. First, the international
financial institutions facilitated the conversion of private debts to multilateral ones, then
postponed default by funding debt service with development assistance. This recycling
ended with the long, drawn-out Highly Indebted Poor Countries (HIPC) scheme and
generalized debt forgiveness just before the financial crisis.
The calculation of net private flows measures the extent to which capital flight
quantitatively offsets foreign direct investment, while the calculation of net public flows
measures the extent to which debt service offsets development assistance. These
calculations area step towards assessing the contribution of external flows to
development. The flow categories are summarized as follows:
net private flow (NPF) = [(FDI) + (CpF)] (10)
net official flow (NOF) = [(DbSr] + (ODA)] (11)
In section 4 we examine the available statistics to assess the impact of the four
categories of financial flows, namely, development assistance, direct investment, debt
service, and capital flight.

20
4. Macroeconomic Performance and Financial Flows
4.1 Categorizing Countries
The Boyce and Ndikumana database covers both North and sub-Saharan Africa. The
statistics in this paper include 31 sub-Saharan African countries, which represent a group
that is too large for useful generalizations. It is also analytically cumbersome, either
requiring a country-by-country analysis or abandoning country specifics altogether.
Whether or not a country exports petroleum provides the most obvious analytical sub-
division. Seven countries are placed into the oil-exporting category: Angola, Cameroon,
Chad, Republic of Congo, Gabon, Nigeria, and Sudan.
In a previous version of this study, the remaining twenty-four countries were divided
between those suffering from or recovering from civil strife and all the rest (Weeks,
2012b, 2012c). This division provided limited insights. Almost all countries with periods
of conflicts had longer periods of non-conflict during the three decades covered, creating
unavoidable subjectivity in classification. This version of the study adopted geography
as the appropriate division. After separating out the petroleum exporters, the rest were
divided into two groups: (1) West and West Central America and (2) East, Central, and
Southern Africa.
Subsequent analysis made it clear that underlying the geographic division were distinct
economic characteristics. The most important of these appears to be the currency
regime. Therefore, this paper uses four groups: petroleum exporters, conflict countries,
the Communauté Financière Africaine countries of West Africa and associated countries
in central Africa, and the remaining countries that have a national currency.
21
4.2 Patterns of Capital Flight by Country
The appendix provides the data sources for the variables used in the regression analysis.
Among the time series are foreign direct investment, official development assistance,
debt service, and capital flight. This section focuses on capital flight, whose impact on
growth is the central issue.
Table 1 and Figure 2 report capital flows by country in descending order of the average
annual flows. Table 1 covers all years for each country, with the time period in the
second column and number of years in the third. The same statistics appear in Figure 2.
Of the four countries with average annual flows in excess of -15 percent of GDP, three
are affected by conflict (Angola, Burundi, and Zimbabwe). All conflict countries appear
among the first fifteen in the table.
Table 2 uses binary variables to test the hypothesis that levels of capital flight, measured
as shares of GDP, do not differ among the country groups. Two statistics are used,
whether the coefficients on the binary categories are significantly different from zero,
and whether pair-wise they are significantly different from each other (a significance of
means test). In interpreting the results, recall that capital outflow is measured as
negative. The constant term corresponds to the mean capital flow for the national
currency countries that do not export petroleum and did not suffer from conflict (the
omitted country group).13 The export of petroleum was associated with 4.5 percentage
points more of capital flight, membership in the CFA currency group an additional 7.4,
13 The regression using only binary variables for the groups is a simple method of calculating the
group means and whether the differences among those means are statistically significant. With
the introduction of any other variable the constant is no longer the mean for the omitted
category.

22
and conflict a further 13.5 percentage points. The standard errors appear in parenthesis,
which show that the differences among the coefficients (or means) for the three groups
are statistically significant. However, the difference in means between the petroleum
and the national currency group (the constant) is not statistically significant.
Tables 1 and 2 and Figure 2 go about here
The explanation for the substantial and significant difference for conflict countries is
obvious. First, extreme political instability prompts households and businesses to hoard
their wealth abroad for greater security. Perhaps more important, conflict creates the
conditions for criminal activities, enabling profits to flow abroad. Such activities include
the looting of natural resources, including the infamous “blood diamonds”, drug
trafficking, and illicit trade in weapons.
For the petroleum countries the mean is not significantly different from that of the
national currency group. This absence of a significant difference suggests that petroleum
exporting as such does not create a qualitative change in the process of capital flight
(Saad-Fiho and Weeks, 2013). Capital flight in the context of petroleum production
offers an obvious subject for further research.
Important research issues are also raised by the significant and substantially larger
outflows for the common currency countries (Ndiaye, 2011). A possible explanation is
that the common currency and its fixed rate to the French franc may facilitate
transferring funds, though the exact mechanism requires investigation. This may work
through branches of French banks in the CFA countries. Alternatively, it may be that
the limited role of national central banks in the context of a common currency

23
substantially reduces the power to regulate capital flow. Pursuing this important issue is
beyond the scope of this paper.
4.3 Growth Impact of Financial Flows by Country Group
In Section 3 the Harrod-Domar model was used to derive a simple growth
equation. The essential feature of the equation is the determination of the growth rate by
the net availability of foreign exchange, financial flows plus export revenue. In
summary form that relationship is as follows, using the same notation as in the analytical
discussion above. The variable gt is the GDP growth rate for the current period, t-1 is
the investment-GDP ratio for the previous period, and zt-1 is the capacity to import. The
parameter is the adjustment coefficient, which indicates the extent to which in the
current period the investment-GDP ratio adjusts to its desired or target rate. If = 1,
adjustment is complete. The coefficients on the independent variables incorporate the
marginal output-capital ratio k.
gt = k(t-1 k(zt-1) 13)
While statistical tests support the division of the countries into four categories, it does
not follow that it is appropriate to estimate the growth equation separately for the four
groups. Differences in the structure of the economies of sub-Saharan African countries
imply the use of two groups, namely, countries that export petroleum and those that do
not. For all seven of the petroleum-exporting countries, oil production and export
revenue determine the level of output. Equally important, fluctuations in the

24
international price of petroleum are the overwhelming influence on the stability of
aggregate output. These characteristics have the practical statistical implication that the
estimating equations show relatively high correlation coefficients almost independently
of the specific estimating model as long as that model includes a variable closely linked
to export revenue.
By contrast, all countries that do not export petroleum have a substantial agricultural
sector that is almost entirely rain-fed. In these economies, weather has a major impact on
aggregate output that cannot be captured in time series variables. As a result, the overall
explanatory power of the estimating equations is almost always low, even though the
independent variables may show strong statistical significance.
The two parts of Table 3 report the statistical results from a separate estimation for the
seven petroleum exporters (part 3a) and the other twenty-four countries (part 3b).14 The
estimation for the seven petroleum countries produces a negative capital formation
coefficient that is both significantly different from zero and significantly negative. In the
analytical specification of the estimating equation, the lagged capital formation variable
represents the extent to which the adjustment to the desired investment ratio is partial.
Thus, a negative value for the coefficient indicates over-adjustment. That is, it indicates
investment in excess of the optimal medium-term level. Given the substantial instability
of global petroleum prices and demand, over-adjustment is a credible statistical result, as
producers invest at a level consistent with maximum rather than typical demand.
Tables 3a and 3b go about here
14The statistical results include tests for serial correlation. All variables pass the test of stability.

25
The export and foreign direct investment coefficients are what would be expected, since
petroleum economies are foreign-exchange driven and investment is mainly from
international corporations. The large coefficient for debt service derives from the high
indebtedness of all petroleum exporters, which results from the perception by global
finance institutions that lending to such countries is comparably safe (following usual
practice, the debt service variable is positive even though it is an outflow, which implies
the negative coefficient).
Capital flight takes center stage for petroleum exporters, with a statistically significant
coefficient at less than one percent probability. The value of the coefficient implies that
a ten percent decline in capital flight as a share of GDP would increase growth rates by
almost a percentage point. This exceeds the marginal impact of the export share variable.
Finally, the binary variable for membership in the CFA currency zone is both
statistically significant and substantial, associated with lower growth of five percentage
points.
Table 3b presents the results for the other twenty-four countries, where the degrees of
freedom increase to 559. The overall explanatory power is far lower, with an R-squared
of about 0.11 compared to 0.49 for the petroleum exporters. The coefficients of all the
variables are significantly different from zero, though the list of variables is slightly
different from that for the petroleum exporters. The estimating equation for petroleum
exporters included debt service and excluded official development assistance. This was
because of the relative unimportance of development assistance, and, more importantly,
of the fact that ODA appears to be a proxy for conflict for the oil exporters.

26
For the other 24 countries development assistance is much larger relative to GDP, for
both conflict and non-conflict countries. However, the interaction of variables indicates
that it is correlated with debt service, so that inclusion of the two reduces both to
statistical insignificance. As previously discussed the specific form of the interaction is
documented. It involves the use of bilateral and multilateral development assistance to
service private debt or convert it to multilateral debt (Weeks, et. al., 2006).
A review of the coefficients shows that they are consistent with analytical predictions.
The capital formation variable has a positive and significant coefficient, indicating
almost complete adjustment during the lag period, with a zero coefficient indicating
complete adjustment as explained above. Foreign direct investment significantly
contributes to growth, though far less than for the petroleum exporters. Contrary to some
other studies (Easterly, 2003), development assistance significantly increases growth as
found in a study by Minoiu and Reddy (2007). For example, an increase in the ODA to
GDP ratio of ten percent increases the growth rate by one percent.
Capital flight has again a negative and statistically significant impact, though
considerably less than for the petroleum countries. The coefficient suggests a negative
impact for the 24 countries that would be less than half that for the petroleum exporters.
The weaker impact is consistent with structural characteristics that result in a large
stochastic element in the growth rate.
Table 4 uses the statistics in Table 3 to calculate the effect on growth of capital flight for
each country. First, we used the general cross-country equation to estimate each
country’s growth rate with the observations specific to that country. Second, we omitted

27
the capital flight variable, and subtracted the latter from the former, as shown in the final
column. This is the estimated country-specific growth change when capital flight is
zero. For all countries, the average growth rate was 3.0 percent per annum and the
capital flight effect a negative 0.5 percentage points.15 Thus, had capital flight been zero,
the statistical results indicate that the average growth rate across the thirty-one countries
would have been almost 3.5 percent per annum, not 3.0.
Table 4 goes about here
As expected, the largest average impact is for the petroleum exporters, a negative 1.2
percentage points compared to actual growth of 3.2. For both the CFA and national
currency countries the average impact was a negative 0.2. If Togo, the only country with
a substantial positive capital flight effect, were excluded, the CFA average would be a
negative 0.3. The only other country with a positive capital flight effect is Botswana,
though it is a tiny 0.01 percentage points.
The statistical results indicate that for many countries the capital flight effect was
substantial, one-half of a percentage point or more in twelve of the 31 cases. This
empirical evidence, combined with the earlier rejection of the “macro fundamentals”
hypothesis, provides a strong argument for exchange rate management, in part through
capital account regulations. The higher capital flight and lower growth for the CFA
countries strengthens this conclusion, because the common monetary system may
facilitate unregulated capital flows of all types (Ndiaye, 2011).
15For all countries the average for the actual growth rate and the estimated rate are by definition
the same.

28
5. Conclusion and Research Priorities
Reduction of capital flight represents an important way to increase the resources
available in sub-Saharan African countries for both consumption and investment, public
and private (Fofack and Ndikumana, 2009). Reducing capital flight became all the more
important after the long-delayed debt cancellation relieved the burden of debt servicing.
With development assistance apparently in decline as a share of recipient national
income, stemming capital flight may be the most important growth-generating policy
available to governments of sub-Saharan African countries.
As noted at the beginning, other chapters in Ajayi and Ndikumana (2014) focus on the
analysis of measures undertaken by the governments of advanced and sub-Saharan
African countries to reduce capital flight. While we do not treat those issues, we stress
one general point. Experience suggests that the governments of advanced countries do
not behave in a manner that furthers the interests of the governments or populations of
sub-Saharan African countries with regard to financial flows. Therefore, the
governments of the sub-Saharan region should implement effective measures on
financial flows regardless of the action or inaction of the governments of advanced
countries. Policy practice in several Latin American countries and elsewhere indicates
that appropriately designed policies are effective in reducing capital flight (Bastourre et
al., 2012; Epstein and Schor, 1992; Epstein et al., 2003, 2008; Gallagher et al., 2002).
The analysis and empirical evidence in this paper suggest several topics for future
research on capital flight from sub-Saharan African countries, some of which were
already mentioned. Interactions among the major vehicles of foreign exchange flows

29
require further analytical and empirical work. The work by Boyce and Ndikumana to
construct the capital flight data base represents a major step in this process (Ndikumana
and Boyce 2010, 2011; Ndikumana et al. 2014). At the macro level the interaction
between capital flight and changes in the terms of trade needs close scrutiny. This
interaction could be linked to the more obvious effects of debt service and ODA on
capital flight.
Research should move beyond the narrow orthodox view of macro stability as low
inflation and balance of payments sustainability. Inflation can have a negative effect on
development, and current account deficits may constrain a range of policy goals.
However, low inflation and a sustainable external account do not in themselves generate
growth, employment, and structural change. This implies that the study of financial
flows and growth should address effects on the composition of growth and especially on
the diversification of production. We should link financial flows and their impact on
stability to a government’s ability to implement sectoral development policies (so-called
industrial policy).
A central analytical issue to pursue in future research is the extent to which capital flight
or the fear of capital flight reduces domestic policy options, what is sometimes called
“policy space.” Investigating this question involves reversing the orthodox narrative that
capital flight results from unsound macro policies. On the contrary, capital flight may
force governments into policies that work against the interests of the majority of the
population. This would especially be the case in the absence of capital account
management.

30
One aspect of the narrow mainstream definition of economic stability retains importance
even in a broader development approach to policy: exchange rate volatility. In many of
the sub-Saharan African countries nominal exchange rate volatility represents a major
source of inflation. Achieving a manageable inflation rate consistent with strong growth
and sectoral differentiation implies effective exchange rate management. The
importance of exchange rate management increases for the smaller countries, whose
external accounts can be overwhelmed by financial flows that would have marginal
impact in larger countries. Research on the interaction of capital flight and the nominal
exchange rate would lead to investigation of current account instability. Especially
important is to identify whether governments and central banks can effectively manage
flexible exchange rate regimes.
Finally, as pointed out several times, the statistics indicate substantially different
outcomes and trends for the CFA group of countries compared to the national currency
countries. Research is needed to see if these differences are no more than results of the
country sample and period of coverage or indicate differences in structural
characteristics, the monetary regime being the most obvious candidate.
Overall, the growing quantitative information on capital flight broadens the approach to
macroeconomic analysis in sub-Saharan African countries. Analysis of capital flight
may cast light on many of the puzzling empirical questions about growth and macro
instability. Among these are the typically low explanatory power of statistical
estimations of growth rates at the country level, the low investment rates compared to
countries in other regions, and structural inflation.

31
Data and Statistical Annex
1. Capital flight
Capital flight statistics are the estimates from Ndikumana and Boyce (2011,
Table 2.1; on deflation for constant prices, see page 45) and recent additions. The
method of estimation is explained in detail in Ndikumana and Boyce (2010) and Boyce
and Ndikumana (2001).
2. External Debt Service
Debt service is the sum of the principal and interest on external debt. This is also
a balance of payments flow measure. The source is the World Bank’s World
Development Indicators database (online).
3. Foreign Direct Investment (net)
To quote from the World Bank’s web-based data bank, “Foreign direct
investment is net inflows of investment to acquire a lasting management interest (10
percent or more of voting stock) in an enterprise operating in an economy other than that
of the investor.” The measure does not distinguish between investment in new capacity
(so-called green-field investment) and acquisitions. Among the countries covered in this
study, the latter are minor except in South Africa. This is a balance of payments flow
measure. Source is World Development Indicators. It was not possible to separate the
recurrent cost component (e.g., repair and maintenance).
4. Official Development Assistance
Official development assistance is the net disbursement of funds that qualify
under the definition of ODA specified by the Organization of Economic Cooperation
and Development. This is a balance of payments flow measure. Source is World
Development Indicators. It was not possible to estimate the portion of assistance
representing actual foreign exchange inflow to the recipient country.
5. Gross Domestic Product, gross investment, and exports
Gross domestic product is measured in constant dollars, converted at official
exchange rates. This is a national accounts category. Source is World Development
Indicators. Private and public expenditure that is capacity increasing: plant and

32
equipment, improvement of land, and infrastructure. This is a national accounts
category. Exports refer to goods and services. Source is World Development Indicators.
References
African Development Bank, United Nations Commission for Africa, United Nations
Development Program and Development Centre of the Organization of
Economic Cooperation and Development. (2013). African Economic Outlook.
Paris: OECD.
Ajayi, S. I., & Ndikumana, L. (Eds.). (2014). Capital Flight from Africa: Causes, Effects
and Policy Issues. Oxford: Oxford University Press.
Basel Institute on Governance. (2009). Tracing Stolen Assets. A Practitioner’s
Handbook. Basel: International Centre for Asset Recovery.
Bastourre, D., Carrera, J., and Ibarlucia, J. (2012). Common Drivers in Emerging Market
Spreads and Commodity Prices. Working Paper 2012/57. Buenos Aires: Banco
Central de la Republica Argentina.
Boyce, J.K. (1992). The Revolving Door? External Debt and Capital Flight: a Philippine
Case Study. World Development, 20(3), 335–49.
Boyce, J.K., and Ndikumana, L. (2001). Is Africa a Net Creditor? New Estimates of
Capital Flight from Severely Indebted sub-Saharan African Countries, 1970–
1996. Journal of Development Studies, 38(2), 27–56.
Boyce, J.K., and Ndikumana, (2005). Africa's Debt: Who Owes Whom? In G.A. Epstein
(Ed.), Capital Flight and Capital Controls in Developing Countries.
Northampton and Aldershot: Edward Elgar, 334-40.
Christian, J. (2009). Africa’s Bane: Tax Havens, Capital Flight, and the Corruption
Interface. Working Paper 1/2009. Madrid: Real Instituto Elcano.
Collier, P., Hoeffler, A., and Pattillo, C. (2001). Flight Capital as a Portfolio Choice.
World Bank Economic Review, 15(1), 55-80.
Collier, P., Hoeffler, A., and Pattillo, C. (2004). Africa's Exodus: Capital Flight and the
Brain Drain as Portfolio Decisions. Journal of African Economies13 (Supp 2),
15–54.
Crotty, J. (1983). On Keynes and Capital Flight. Journal of Economic Literature, 21(1),
56–65.
Development Today. (2009). Sweden Imposes Ban on Use of Tax Havens for
Channeling Aid. July 22.
Dooley, M. (1988). Capital Flight: A Response to Differences in Financial Risks. IMF
Staff Papers, 35(3), 422–436.
Easterly, W. (2003). Can Foreign Aid Buy Growth? Journal of Economic Perspectives,
17, 23–48.
Epstein, G. (Ed.). (2005). Capital Flight and Capital Controls in Developing Countries:
An Introduction. Northampton: Edward Elgar.
Epstein, G., and Schor, J. (1992). Structural Determinants and Economic Effects of
Capital Controls in the OECD. In T. Banuri and J. B. Schor (Eds.), Financial
Openness and National Autonomy. Oxford: Clarendon Press, 136–161

33
Epstein, G., Grabel, I., and Jomo, K.S. (2003). Capital Management Techniques in
Developing Countries. In A Buira (Ed.), Challenges to the World Bank and The
IMF: Developing Country Perspectives (ch. 6). London: Anthem Press.
Epstein, G., Grabel, I., and Jomo, K.S. (2008). Capital Management Techniques in
Developing Countries: Managing Capital Flows in Malaysia, India, and China. In
J. Stiglitz and J.A. Ocampo (Eds.), Capital Market Liberalization and
Development. New York: Oxford University Press.
Fofack, H., and Ndikumana, L. (2009). Potential Gains from Capital Flight Repatriation
for Sub-Saharan African Countries. Policy Report Working Paper 5024.
Washington: World Bank.
Fortanier, F. (2007). Direct Foreign Investment and Host Country Growth: Does the
Investor’s Country of Origin Play a Role? Transnational Corporations, 16(2),
41–76.
Gallagher, K.P., Griffith-Jones, S., and Ocampo, J.A. (Eds.). (2002). Regulating Global
Capital Flows for Long-Run Development. Pardee Center Task Force Report,
Boston: Boston University.
Henry, J.S. (2012). The Price of Off-shore Revisited. London: Tax Justice Network.
Heggstad, K., and Fjeldstad, O-H. (2010). How Banks Assist Capital Flight from Africa:
A Literature Review. Bergen: Chr Michelsen Institue.
Keynes, J.M. (1933). National Self-Sufficiency. The Yale Review, 22(4), 755–69.
Lazzeri, T. (2013). Capital Flight and its impact on Africa. Africa Europe Faith and
Justice Network (AEFJN). Available at http://www.aefjn.org/
Minoiu, C., and Reddy, S.G. (2007). Development Aid and Economic Growth: A
Positive Long Run Relation. IMF Working Paper 09/118.
Ndiaye, A.S. (2011). Capital Flight and its Determinants in the Franc Zone. AERC
Research Paper 215. Nairobi: AERC.
Ndikumana, L., and Boyce, J.K. (2003). Public Debts and Private Assets: Explaining
Capital Flight from Sub-Saharan African Countries. World Development, 31(1),
107–30.
Ndikumana, L., and Boyce, J.K. (2010). Measurement of Capital Flight: Methodology
and Results for Sub-Saharan African Countries. African Development Review,
22(4), 471–81.
Ndikumana, L., and Boyce, J.K. (2011). Africa's Odious Debts: How Foreign Loans and
Capital Flight Bled a Continent. London and New York: Zed Books.
Ndikumana, L., Boyce, J. K. and Ndiaye, A. S. (2014). Capital Flight from Africa:
Measurement and Drivers. In S. I. Ajayi and L. Ndikumana (Eds.), Capital
Flight from Africa: Causes, Effects and Policy Issues. Oxford: Oxford University
Press, Forthcoming.
Saad-Filho, A., and Weeks, J. (2013). Curses, Diseases and other Resource Confusions.
The Third World Quarterly, 34(1), 1–21.
United Nations Conference on Trade and Development. (2000). The Least Developed
Countries Report 2000: Aid, Private Capital flows, and External Debt, The
Challenge of Financing Development in the LDCs. Geneva: UNCTAD.
Weeks, J. (2009). Impact of the Global Financial Crisis on the Economy of Sierra
Leone. A Report for UNDP Freetown and the Ministry of Finance and Economic
Development, Republic of Sierra Leone, Country Study. Brasilia: International
Policy Centre for Inclusive Growth.
34
Weeks, J. (2012a). The Irreconcilable Inconsistencies of Neoclassical Macroeconomics:
A False Paradigm. Oxford: Routledge.
Weeks, J. (2012b). Economic Impact of Capital Flows in Sub-Saharan African
Countries, 1980–2008. PERI Working Paper 290. Amherst, Massachusetts.
Weeks, J. (2012c). Economic Impact of Capital Flows in Sub-Saharan African countries,
1980–2008. ACAS Bulletin, 87.
Weeks, J., Chisala, V., Geda, A., Dagdeviren, H., Filho, A.S., and Oya, C. (2006).
Economic Policies for Growth, Employment and Poverty Reduction: Case Study
of Zambia. Lusaka: United Nations Development Program.

35
Table 1: Capital Flight as Share of GDP, country averages for all years
Country Average Time period
Number
of years
Guinea Bissau -23.8 1982–2010 29
Angola -20.5 1989–2010 22
Burundi -20.2 1985–2010 26
Zimbabwe -16.1 1977–2010 34
Mozambique -13.7 1985–2010 26
Cote d'Ivoire -13.2 1970–2010 41
Gabon -12.2 1980–2010 31
Sierra Leone -12.2 1970–2010 41
Zambia -9.0 1970–2010 41
Congo Rep -8.8 1972–2008 37
Nigeria -8.3 1972–2010 39
Madagascar -7.2 1970–2008 39
Congo DR -7.1 1970–2010 41
Cen African
Rep -6.4 1970–2010 41
Rwanda -4.9 1970–2010 41
Ethiopia -4.9 1981–2010 30
Cameroon -4.1 1972–2010 39
Ghana -3.9 1970–2010 41
Guinea -3.8 1986–2010 25
Lesotho -3.7 1975–2010 36
Mauritania -3.7 1973–2010 38
Sudan -3.2 1972–2010 39
Chad -2.3 1979–2010 32
Burkina Faso -2.3 1970–2010 41
Uganda -2.0 1982–2010 29
Swaziland -1.5 1974–2010 37
Malawi -1.3 1980–2010 31
Kenya -1.2 1970–2010 41
Tanzania -1.0 1988–2010 23
Botswana 2.7 1974–2010 37
Togo 6.9 1974–2010 37
Source: Boyce and Ndikumana database (2010)

36
Table 2: Capital Flight as Share of GDP, regression-based
calculation
of differences among groups, 1980–2010
Variable Coefficient Significant @
Constant -.033 (.012) .01
1. Petroleum -.045 (.019) .02
2. Conflict -.135 (.020) .00
3. CFA -.074 (.017) .00
Adjusted R2 = .066, F =
19.23
DF = 776
The three variables are binary. The coefficients show greater
capital flight because capital outflow is treated as negative.
Table 3a: Estimation of GDP growth, 7 petroleum exporters, 1980–
2010
Dependent variable: GDP growth rate, 3 year moving average
(natural log, OLS estimation)
Variable Coefficient Significant @
Constant .053 .00
1. GCF/GDP (t-1) -.018 .01
2. Exports/GDP (t-1) .020 .00
3. FDI/GDP (t-1) .400 .00
4. DbtSr/GDP (t-1) -.259 .00
5. CapF/GDP (t-1) .080 .00
6. Conflict -.010 nsgn
7. CFA -.053 .00
Adjusted R2 = .474, F =
22.79
DF = 162
Note: The seven petroleum exporters are Angola, Cameroon, Chad, Congo Republic,
Gabon, Nigeria and Sudan.

37
Table 3b: Estimation of GDP growth, 25 non-petroleum exporters, 1980–2010
Dependent variable: GDP growth rate, 3 year moving average
(natural log, OLS estimation)
Variable Coefficient Significant @
Constant -.005 no
1. GCF/GDP (t-1) .011 .01
2. FDI/GDP (t-1) .008 .00
3. ODA/GDP (t-1) .109 .00
4. CapF/GDP (t-1) .029 .02
5. CFAnp -.010 .02
6. Conflict -.021 .00
Adjusted R2 = .107, F =
12.29
DF = 559
Note: The sample includes: Burundi, Congo DR, Ethiopia, Rwanda,
Sierra Leone, Zimbabwe (conflict); Burkina Faso, Central African
Republic, Cote d'Ivoire, Guinea, Guinea Bissau, Mauritania, Togo
(CFA, not petroleum exporters); Botswana, Ghana, Kenya, Lesotho,
Madagascar, Malawi, Mozambique, Swaziland, Tanzania, Uganda,
Zambia (national currency and not petroleum exporters or conflict
affected).
Abbreviations:
GCF/GDP = gross capital formation, share of GDP
FDI/GDP = Foreign direct investment, share of GDP
ODA/GDP = Official development assistance, share of GDP
CapF/GDP =capital flight, share of GDP, outflow is negative
CFAnp = common currency countries of West and West Central Africa
Conflict = conflict affected countries
The numerical variables are three-year moving averages.

38
Table 4: Actual growth and Capital Flight Effect, 1980–2010
Country Actual rate
Growth
effect
Petroleum
(7)
Angola 4.6 -3.7
Gabon 1.5 -1.1
Congo, Rep 2.0 -1.9
Cameroon 1.7 -0.7
Sudan 4.5 -0.5
Chad 4.8 -0.2
Nigeria* 4.4 -0.7
average 3.2 -1.2
CFA (6)
Guinea
Bissau 1.1 -0.9
Côte d'Ivoire 1.4 -0.6
Central
African Rep. 0.9 -0.3
Guinea 3.3 -0.2
Burkina
Faso 4.6 -0.1
Togo 2.1 0.5
average 2.4 -0.2
National currency (12)
Mozambique 5.9 -0.6
Zambia 2.3 -0.4
Madagascar 2.2 -0.3
Ghana 4.7 -0.1
Lesotho 3.6 -0.2
Mauritania 3.3 -0.1
Uganda 5.6 -0.1
Swaziland 2.6 -0.1
Malawi 3.3 -0.1
Kenya 3.3 0.0
Tanzania 5.3 0.0
Botswana 6.1 0.0
average 4.0 -0.2
Conflict (6)
Zimbabwe -1.4 -0.9
Sierra Leone 1.1 -0.4
Congo,
Dem. Rep. -0.6 -0.2
Burundi 0.6 -0.7
Rwanda 0.9 -0.1
Ethiopia 6.4 -0.1

39
average 1.2 -0.4
AVERAGE 3.0 -0.5
Source: The data on capital flight are from Boyce and Ndikumana database (2010).
Notes: Actual growth and capital flight effect refer to years
with data; i.e., the growth rates in this table are necessarily
different from those in Table 2. Capital flight effect
estimated from statistics in Table 3.

40
Figure 2: Hypothetical mean and standard deviation of planned deficit outcome
Deficit/GDP ratio on horizontal axis, frequency of possible outcomes on vertical,
centered around target outcome.

41
Figure 2: Capital Flight as share of GDP, average all years, by country
Source: Boyce and Ndikumana database (2010)