maban refugee camp, south sudan 9 … out by cmn and international medical corps in genderassa, a...
TRANSCRIPT

MABAN REFUGEE CAMP, SOUTH SUDAN 9-20/8/2013 MELAKU BEGASHAW

2
ACKNOWLEDGEMENTS
We would like to thank UNHCR and the Government of the Republic of South Sudan, who gave authorizations for the coverage survey (SQUEAC) implementation and showed keen interest in the assessment. We would like to extend our gratitude to Golam Azam’s and Patricia McLaughlin, South Sudan International Medical Corps’s Country and Deputy Country Director , who were key in facilitating the entire visa process and associated administrative support for CMN. Samuel Mbuto and Thomas Ndambu, Nutritionists in Juba and Maban, were key persons in organizing all stages of the SQUEAC survey on behalf of the International Medical Corps South Sudan team. The teams from WFP Maban, Medair Juba, Samaritan Purse Maban, MoH Maban and IMC Maban also, played a significant role by participating and ensuring successful learning and implementation of the survey all levels.
Last but not least, the carers, community leaders and community based volunteers work is acknowledged in this report as they were the major respondents of the SQUEAC study. Their participation and time are much appreciated.
It is important to acknowledge with gratitude the technical inputs and leadership by Dr Jose Luis Alvarez, the Coverage Monitoring Network Coordinator and Caroline Abla, Director, Nutrition and Food Security Department at International Medical Corps who was responsible in organizing the process and reviewing this document.

3
EXECUTIVE SUMMARY
Between August 9th and 20th, a Semi-Quantitative Evaluation of Access & Coverage (SQUEAC) was carried out by CMN and International Medical Corps in Genderassa, a sub Camp of Maban refugee Camp in the Upper Nile State of South Sudan. The SQUEAC design was defined to provide an estimate of Sub Camp wide coverage of the Targeted Supplementary Feeding Program (TSFP) for treatment of Moderate Acute Malnutrition program (MAM) component of International Medical Corps’s (IMC) Community Management of Acute Malnutrition (CMAM) program, as well as identify key barriers/boosters to access affecting programme quality and coverage. The evaluation used the standard, 3-stage, Bayesian beta-to-binomial conjugate analysis. MAM coverage in Genderassa using SQUEAC was estimated at ). Coverage was consistently high throughout Genderassa. The investigation recommended; 1) Strengthen data recording specifically as the registers were not being properly filled. 2) The program performance indicators fall short of standards for cures and default rate. Specifically, the overall default rate is very high at 30%. The program should reform its operation to retain all children in the program for the entire treatment period. This is true for Block 36 and 17, while Central clinic is meeting all standards. 3) Even though TSFP is available in all facilities of the camp, OTP is available only in central clinic. Increase geographic coverage of OTP availability by targeting Block 36 and 17 facilities. 4) The community in the camp is heavily reliant on traditional doctors. IMC should consider engaging traditional healers in the detection, referral and possibly treatment of acutely malnourished children. 5) Train TSFP staff on how to calculate length of stay, Z-score weight gain and on correct discharge criteria 6) Ensure CMAM supplies are available at all time; and 7) The program should continue operations .

4
Contents 1. INTRODUCTION ......................................................................................................................................................... 6
2. OBJECTIVES ............................................................................................................................................................... 7
3. METHODOLOGY ........................................................................................................................................................ 7
a. STAGE 1: BUILDING THE PRIOR ..................................................................................................................... 8
b. STAGE 2: HYPOTHESIS TESTING (SMALL AREA SURVEY AREA) .............................................................. 9
4. RESULTS .................................................................................................................................................................... 11
4.1. STAGE 1 ......................................................................................................................................................... 11
4.1.1. PROGRAM ADMISSIONS (WITH AND WITHOUT SMOOTHING) .................................................. 11
4.1.2. ADMISSIONS BY SERVICE DELIVERY UNIT ..................................................................................... 12
4.1.3. SPATIAL COVERAGE OF ADMISSIONS .............................................................................................. 13
4.1.4. ANALYSIS OF OUTREACH ACTIVITIES ............................................................................................. 14
4.1.5. MUAC AT ADMISSION .......................................................................................................................... 15
4.1.6. PROGRAM PERFORMANCE INDICATORS (PROGRAM EXITS)...................................................... 16
4.1.7. ANALYSIS OF DEFAULT OVERTIME .................................................................................................. 18
4.1.8. LENGTH OF STAY (CURED CASES ONLY) ......................................................................................... 19
4.1.9. RESULTS FOR QUALITATIVE INVESTIGATION ............................................................................... 19
4.1.10. AREAS OF HIGH AND LOW COVERAGE ................................................................................................ 21
4.2. STAGE TWO .................................................................................................................................................. 21
4.3. DEVELOPING A PRIOR ..................................................................................................................................... 23
4.4 STAGE THREE ......................................................................................................................................................... 25
4.4.1. LIKELIHOOD (WIDE AREA COVERAGE RESULT) ............................................................................................. 25
5. CONCLUSIONS AND RECCOMENDATIONS ....................................................................................................... 27
ANNEX 1: GEDDRASSA MAP, MABAN REGUGEE CAMP, UPPER NILE STATE, SOUTH SUDAN ........................ 28
ANNEX 2: TABLE OF ADMISSIONS BY VILLAGE ...................................................................................................... 29
ANNEX 3: ANALYSIS OF OUTREACH ....................................................................................................................... 30
ANNEX 4: GRAPHS COMPARING DISCHARGE OVERTIME .................................................................................... 31
ANNEX 5: SAMPLING FRAME FOR FIRST STAGE SAMPLING OF VILLAGES ....................................................... 32
ANNEX 6: LIST OF PARTICIPANTS IN THE SQUEAC INVESTIGATION .............................................................. 33

5
ACRONYMS
ATFP Ambulatory Therapeutic Feeding Program CHVs Community Based volunteers CMAM Community Management of Acute Malnutrition EPI Expanded Program of Immunization IMC International Medical Corps ITFP Intensive Therapeutic Feeding Program MAM Moderate Acute Malnutrition MUAC Mid Upper Arm Circumference OTP Outpatient Therapeutic Feeding Program SC Stabilization Centre TSFP Targeted Supplementary Feeding Program

6
1. INTRODUCTION Conflict between the Sudan Armed Forces (SAF) and the forces of the Sudan People’s Liberation Movement/Army-North (SPLM-N) in the Kordofan and Blue Nile States of Sudan have forced an estimated 110,000 people to flee into neighbouring South Sudan. International Medical Corps deployed an emergency response team (ERT) in late May 2012 to conduct a rapid assessment within priority areas in Maban. The initial assessment was conducted through key informant interviews with stakeholders (refugees, local authorities, UN and NGOs), and direct observation of refugee conditions in Hofra, KM18, Batil, and Jamam camp.
The context reflects the largest refugee influx recorded in Upper Nile State. Between May to July 2012 alone, over 60,000 refugees arrived to Maban. The majority of the refugees arrived in poor physical condition after walking for two to three weeks to reach the border.1
In June 2012, some 30,000 refugees were stranded at the Hofra/Km 18 transit site with limited access to shelter, food, water, sanitation facilities, and basic health and nutrition services. With capacity to relocate 2,000 refugees a day, UNHCR moved refugees from transit sites to Batil camp. With a large influx to Batil within a two-week period, capacity to provide services was quickly overwhelmed. International Medical Corps rapidly mobilized emergency surge support health services to augment health coverage in Batil camp, per UNHCR’s request.
In early July 2012, the Jamam camp flooded, rendering sections of Jamam 1 uninhabitable and prompting evacuation to the newly established Gendrassa camp. Gendrassa has the capacity to absorb up to 20,000 individuals (stated to be the evacuees from Jamam) as well as any new arrivals from the border. Ramping up relocation to Gendrassa, UNHCR requested International Medical Corps to shift emergency response activities (primary health care, nutrition, and WASH) from Batil to Gendrassa.
Baseline mortality data from Jamam in July 2012 indicated a crude mortality rate (CMR) of 1.8 per 10,000 per day, above the SPHERE standard (1 death/10,000/day). The under-five mortality rate (U5MR) in Jamam was 2.8 per 10,000 per day; also above emergency threshold (2 deaths/10,000/day) indicating a critical situation requiring immediate intervention.2
Available nutritional mass screening data from Jamam and Gendrassa for children 6-59 months and pregnant and lactating women also suggested alarming malnutrition levels above the 15% emergency threshold with MSF-Holland reporting over 600 admissions into its ambulatory therapeutic feeding programme (ATFP)3 including 22 cases into the intensive therapeutic feeding programme (ITFP)4 as of July 2012. Approximately 1,900 children under five years and 800 pregnant and lactating women were also screened upon arrival in Gendrassa using MUAC and (as International Medical Corps scaled up) weight for height by the International Medical Corps nutrition team. The screening indicated above emergency malnutrition levels with an estimated 23% of children (6-59) screened with acute malnutrition; 15% were moderately malnourished and 8% were severely malnourished. 34% of pregnant and lactating women were malnourished, 26% moderately and 8% severely malnourished.
International Medical Corps is currently implementing a comprehensive program in Maban integrating complementary health, nutrition and WASH interventions. The response is focused on the emerging needs of refugees. International Medical Corps runs a comprehensive PHC clinic and two 1 Dehydration Deaths: Refugees in S. Sudan Need Water. Associated Press. June 18, 2012.
2 MSF-Holland Jamam Prospective Mortality Survey-July 2012. 3 Outpatient Therapeutic Program (OTP)
4 Stabilization Center

7
decentralized health and nutrition posts. Services include outpatient department, routine nutrition screening and EPI services, TSFP and Blanket Supplementary Feeding Programme (BSFP) activities and community outreach interventions. The PHCC is linked to a growing network of community health and hygiene promoters.
2. OBJECTIVES The overall objective of this investigation was to strengthen routine program monitoring and increase program coverage of IMC SFP program in Genderassa sub-camp of Maban Refugee camp. More specifically, the coverage exercise aimed to:
1. Develop specific recommendations based on survey/investigation outcomes to improve acceptance and coverage of the nutrition program;
2. Enhance capacities of key IMC, partners and MoH technical staff in Maban and South Sudan to undertake a coverage survey using the SQUEAC methodology;
3. Identify barriers to access to the SFP and OTP services using data gathered from those cases found with moderate acute malnutrition and not admitted in the program at the time of the survey;
4. Estimating the overall coverage of SFP program in Genderassa sub camp CMAM program 5. Give recommendations to the Maban program based on the survey/investigation findings to
improve access to the CMAM services and increase program coverage in the project areas; 6. Estimating the overall coverage of the IMC supported SFP program in Genderassa.
3. METHODOLOGY SQEAC is a semi-quantitative method that uses the Bayesian method and Bayesian probability theories, rather than the usual frequency method to generate coverage value. A Bayesian approach is ‘the explicit use of external evidence in the design, monitoring, analysis, interpretation and reporting of a scientific investigation’. A Bayesian approach is:
more flexible in adapting to each unique situation more efficient in using all available evidence more useful in providing relevant quantitative summaries than traditional methods
The SQUEAC investigation is based on the principle of triangulation. This means that data need to be collected and validated by different sources and different methods. The exercise ends when there is redundancy; i.e. no new information is gained from further investigation using different sources or methods. SQUEAC achieves its efficiency by using a three stages approach: the development of the Prior, the development of the Likelihood and the generation of the Posterior. The first two stages aim to identify potential barriers and provide two individual estimations of coverage.
During the Prior building process, existing routine data which have previously been collected and compiled are combined with qualitative data to produce a coverage “picture”. Building the Prior provides a projection of coverage levels for both the entire target area and also specific areas suspected of relatively high or low coverage within the program’s target zone. The Likelihood is built with data collected during a wide area field survey in randomly selected villages. The selection of cases during wide area survey uses a complete tent-to-tent enumeration of all households and screening all 6-59 month children.

8
The last stage, the generation of the Posterior, combines the two initial stages and provides the overall coverage estimation, including Credibility Intervals (C.I), by taking into account the “strength” of each component of the equation. The Posterior is calculated using the Bayesian calculator.
a. STAGE 1: BUILDING THE PRIOR The “Prior” can be defined as an expression of our beliefs about the results of the investigation. Triangulation, Iteration and redundancy principles guide the data collection. The prior building process begins with routine program data analysis and collection of qualitative data which is used to generate a coverage estimate (prior belief). To do this, various data was collected including:
1. Program data Analysis of admission data over time MUAC at admission Discharge Outcomes Length of stay
2. Qualitative Data Outreach Follow up Standard of service Barriers Community structure
The main methods of qualitative data collection used were:
The Informal Discussion Group The case history The Semi-structured interview Simple-structured interview
Mind Map During the qualitative data phase, which lasted for some days and saw the survey teams visiting several villages across the entire sub-camp, a MindMap approach was used to review, discuss and analyze the results gathered. A MindMap is a tool designed to facilitate the presentation and analysis of quantitative and/or qualitative data and the relationships between them. Potential barriers to access, as well as information suggesting high or low coverage are grouped thematically. It was thus possible to challenge correct, verify and refine the team’s preconceptions regarding the causes of low or high coverage on a rolling basis allowing the subjects covered during qualitative data collection to be adapted to confirm the new understandings gained. During this investigation, the report was compiled
by the participants of the investigation process. The ability to produce the investigation report using the
Xmind software was part of the training activities.
Score Ranking Attributes appearing in the MindMap are likely to push the coverage “up” or “down”. The various elements don’t have the same impact on coverage and a “weight” is given to each one. The exercise starts by listing all positive and all negative elements affecting the coverage. Later on ranking scores

9
were given for each attribute, generally 5 points for the higher score and 1 point for the lower score. The sum was done for each column.
The Prior The Prior is the expression of beliefs about coverage based on qualitative data (or quantitative data transformed into qualitative data) provided by the MindMap exercise. Positives or boosters were added to 0 (the minimum coverage) and negatives or barriers are subtracted from 100 (the maximum possible coverage). The mode is calculated as the mid-point between the “built-up” and “built-down” results.
b. STAGE 2: HYPOTHESIS TESTING (SMALL AREA SURVEY AREA) The small area survey focuses on potentially high and low coverage areas. A number of villages are purposely selected to test the hypothesis developed in Stage 1. The villages selected are distributed between the survey teams. Each team used a Tent-to-Tent a case-finding methodology to identify cases (as per the case definition) that are either covered or not by the program.
The steps for testing a hypothesis/making a classification using SQUEAC small area survey data are:
(a) Set the standard (p): The standard (p) is set according to SPHERE minimum standards for therapeutic programs in refugee camps (minimum 90% for camps)
(b) Carry out the small area survey
(c) Use the total number of cases found (n) and the standard (p) to calculate the decision rule. For example, if n = 9 and p = 90% then: d = ⌊ n ×p /100 ⌋ = ⌊ 9 × 90 /100 ⌋ = ⌊ 8.1 ⌋ = 8
(d) Apply decision rule: if the number of cases in the program is > d then the coverage is classified as HIGH (otherwise it is classified as LOW).
Generally speaking this stage confirms the location of areas of high and low coverage and the reasons for coverage failure identified in stage one (above) using small-area surveys.
c. STAGE 3: WIDE AREA SURVEY AND CONGUGATE ANALYSIS In order to improve and make the Prior value stronger more data are added. Quantitative data as well as additional qualitative data are collected during a wide area survey. Villages (Shieks) in the different facility catchment areas are randomly selected to undertake an exhaustive tent-to-tent screening.
Sampling Method A two stage sampling was applied. At first stage a Spatial method was used. This was done by listing all the villages (Shieks) in Genderassa catchment areas and by drawing sample of Sheiks using systematic random sampling of the lists.

10
Sample Size Calculation The first step to calculate sample size is to determine the minimum number of children to sample to achieve the desired confidence (+/- 10%):
(
)
n= Sample size of minimum number of children needed Prior= A picture of our beliefs of what coverage would be based on available data and
qualitative investigations Precision= taken to be +/-10% α and β= Values from our priori (The Bayes SQEAC calculator generates it)
Therefore:
(
)
In order to achieve a confidence (+/-10%), and based on our prior we needed to identify a minimum of 14 current and recovering cases. To determine the minimum number of villages to sample and achieve 14 cases, we used the following formula:
⌈
⌉
n= Minimum number of cases required (minimum sample size) Average village population= It was calculated to be 126 households per village (Shiek) Under five proportion=20% MAM prevalence=8%5
⌈
⌉
The sampling design was two stage stratified sampling. Sample size conclusion: During wide area survey teams will visit 7 villages in order to get 14 cases that meet the program case definition criteria. Stage 2 of Sampling: Systematic sampling at every 4th villages was used to select the villages to be visited from the composed list of villages by facility where CMAM program operates. A total of 7 villages were identified for visits (see Annex 5).
5 Maban nutrition and mortality survey result was used for estimating MAM prevalence. Similarly, population estimates were taken
from UNHCR.

11
Data collection and analysis The teams used door to door (tent to tent screening of all under five to find children who meets the case definition of the survey ( children who are Moderately malnourished, children who are moderately malnourished and are in the program and past moderate cases who are recovered but still in TSFP program) in the 20 selected villages to estimate the coverage and confirm the prior. MUAC of the SAM cases were taken and semi structured questionnaire-annexed to this report-was administered on non-covered cases. Specific local definitions of SAM and etiologies were used to ask to be shown children who had SAM and then categorize them into SAM cases who were in the program, SAM cases who were not in the program, and recovering cases. GENERATION OF THE POSTERIOR A SQUEAC Bayesian Calculator6 used to estimate overall coverage of SFP programs was recently developed. The software enables the creation of graphs for the Prior, the Likelihood and the Posterior. The Posterior, representing the coverage estimate, is automatically generated by the Calculator indicating a point estimate and 95% credibility interval from the resulting Posterior.
FIGURE: 1. STAGES IN SQEAC
4. RESULTS 4.1. STAGE 1
The objective of Stage One was to identify areas of low and high coverage and the reasons for coverage failure using routine program data or easy-to-collect quantitative and qualitative data.
4.1.1. PROGRAM ADMISSIONS (WITH AND WITHOUT SMOOTHING) Admissions into TSFP program from January to July 2013 were plotted and analyzed (blue line Figure 2)7. M3 and M3A38 are results of the admission data after smoothing it for median and averages of median for three consecutive periods respectively.
6 The calculator can be freely downloaded from www.brixtonhealth.com
7 Data of admissions before January 2013 were not properly recorded. Because of this the analysis depended entirely on 2013 admission data.
8 M3 is a median of three consecutive months’ admission data. A second smoothing was done on the Medians (M3A3). M3A3 data are smoothed by taking the medians of sets of three successive data points (M3).Smoothing is done to hide the random ‘noise’ component and help reveal the seasonal and trend components of the time-series.
Semi-Quantitative
Assessment (Stage 1)
Small area survey (Stage 2)
Wide area survey (Stage 3)
Understanding of barriers/boosters
to coverage
+
Coverage estimation (%)
(SQEAC)

12
As this is a refugee camp which entirely depend on food assistance for their livelihood, seasonal calendars cannot explain the variation in admission overtime.
4.1.2. ADMISSIONS BY SERVICE DELIVERY UNIT In order to spot potential low and high coverage areas, admissions were analysed by service delivery unit (i.e. health facility – Figure 3). The three facilities included are called Central, Block 37 and Block 17. The admissions per each facility is directly proportional to the number of children in each facility’s catchment area. In terms of population size Central covers more than half of the total.
Figure 4 shows a plot of admissions by facility over time. Admissions into central primary health care unit remain high in all months, while admissions into Block 36 and 17 overlap. Block 17 has the lowest population size amongst the three. Smoothing of random fluctuations show admissions increase up to May and decrease afterwards in all three facilities, following a similar overall trend. Further qualitative investigations detail the reasons of these fluctuations.
0
50
100
150
200
250
300
350
400
January February March April May June July
Nu
mb
er
of
ne
w a
dm
issi
on
s
Figure 2: PLOT OF GENDERASSA SUB CAMP, MABAN REFUFGEE CAMP ADMISSION OVER TIME FOR TSFP (Jan-July 2013)
Admissions
M3
M3A3
0
50
100
150
200
250
300
350
Block 17 Central Block 36
FIGURE 3: ADMISSIONS INTO GANDARASSA TSFP BY FACILITY (January-July 2013)
Number of new admissions

13
4.1.3. SPATIAL COVERAGE OF ADMISSIONS Mapping of beneficiary home locations and outreach activities were done to identify potential problems with the spatial reach of a program. Section 4.1.2 and 4.2.2 investigated temporal coverage of the program while this section using mapping investigates problems with spatial coverage of the program. To this effect data on program site catchment areas were collected from program registers and mapped on Gandarasa map9. Circles/spherical points on the map on Figure 5 show number of admissions for each section for Central, Block 36 and Block 17. Colours of the circle represent the catchment area where the admissions were from and the size of the circle corresponds to the number of admissions from each village. The larger the circle, the larger the number of admission from that facility .
9 A Map of scale 1:12748 was obtained from WFP.
0
10
20
30
40
50
60
70
80
January February March April May June July
AD
MIS
SIO
NS
FIGURE 4:ADMISSIONS OVERTIME BY HEALTH FACILITY, GENDERASSA (January-July 2013)
Block 17
Central
Block 36

14
Figure 5: SPATIAL DISTRIBUTION of HOME LOCATIONS of TSFP CASES (Jan-July 2013)10
As can be seen from the admission mapping in Figure 5, admissions come from all quarters of Gandarassa. Communities in Gandarassa are basically organized based on their original villages. The big spherical dots correspond to bigger communities and the small one to smaller communities.
Locations of admission were compared with the complete list of all villages. It was found out that admissions are coming from all locations of Gandarassa sub camp. Some of the name of the villages registered on the register did not match with the master file of listed of villages. The reason was poor location recording of admissions on the register. However, this was observed for those locations with a very low admission level. Therfore, this doesn’t affect the overall finding.
As described above the basic objective of this investigation is to see whether admissions were coming to the program, irrespective of clan or locations. Findings conclusively show that admissions are really coming from all locations and social groups. In fact, the names of the villages or centres presented in Annex 2 are clan names and names of origin. Small-area surveys were done to validate these findings at stage 2. This finding was considered to coin the hypothesis on stage 2. The hypothesis based on this finding will be: coverage will be high wherever we look. Further, qualitative work was done to feed in this available data and arrive at a conclusion and belief about coverage for stage 1.
4.1.4. ANALYSIS OF OUTREACH ACTIVITIES In addition to mapping the locations of admissions, outreach activities were evaluated. Maps of location of admissions allow simple spatial analysis (Figure 5). Analysis of outreach activity and coverage allow more complicated analyses and give an in depth understanding about spatial coverage. This helps to identify bad coverage areas, the time of year that affects attendance, and evaluate the performance of outreach teams.
From Annex 3 it can be seen both the average and median household per Community Health Volunteer (CHV) is 77. One village does not have any volunteer and for one other the numbers of
10 Exact number of admissions from each centre is summarized on annex 2.

15
households are above 200. Therefore, the average volunteer to household ratio is reasonable. Moreover, document review of outreach visits for the past two months shown a continuous weekly house to house screening in all the villages, including the one with no permanent volunteer i.e. Mohamud village in Soda centre. This strengthen our earlier assumptions that this program has good spatial and temporal coverage of outreach activities.
4.1.5. MUAC AT ADMISSION To identify whether the program detects moderate and severe acute malnutrition in the community or not, MUAC data at admission were analysed for each facility as well as for the entire Gandarassa program.
Late admissions are children who were malnourished but not in the program for considerable period of time. Availability of late admission means more children in outpatient and inpatient care, longer treatment period, and elevated number of deaths (poor program performance or efficacy). This will result in bad image for the programs’ ability to treat children, which may lead to more late presentations and admissions and a cycle of negative feedback. According to the UNHCR CMAM protocol, admissions into the program uses two criteria. Screening conducted at the community level using MUAC. If the child’s MUAC is <11.5cm the child will be referred by CHWs into the OTP program; if the child’s MUAC is , the child will be referred into TSFP program. When individuals arrive at facility (referred or otherwise), program staff assess each individual for malnutrition; this includes taking anthropometric measurements, recent history, and a full medical examination. Based on this double screening result, the health worker will determine the appropriate course of treatment depending on whether the individual is moderately or severely malnourished.
If a child does not meet one criterion, WFH or MUAC, he will be admitted into the program using the other criterion. Similarly oedema is used to screen children for SAM. Annex 5 summarizes the triage process for screening children for acute malnutrition. To assess early/late detection MUAC at admission was compiled and presented (Figure 6). The observed distribution of MUAC at admission is consistent with timely case-finding and recruitment by the program and / or timely recognition of MAM and timely treatment seeking by carers. The observed distribution of MUAC at admission is consistent with a high temporal coverage (i.e. frequent screening) of case-finding activities. Some of the cases where admitted in Z-score and others on MUAC.

16
Figure 6 shows most admission were close to program admission criteria, rapid decrease in numbers of admission with lower MUACs, short tail of lower MUAC admissions (114-110mm and 109-100mm) and few critical low MUACs (<89mm). The Median MUAC at admission lies in the interval 129-120cm. Similarly, most admissions happened at 129-120 MUAC interval (74%). These is an attribute of a high coverage program as most admissions occur close to the program admission criteria (12.5), with very few admission at lower MUAC levels.
4.1.6. PROGRAM PERFORMANCE INDICATORS (PROGRAM EXITS) Quantitative data were collected on the outcome of all activities in the TSFP program, and standard indicators for nutritional interventions were calculated. This enables the effectiveness of program activities to be monitored and related to coverage. Trends in outcomes/exits were monitored to identify any changes in the number of deaths, defaults or non-cured cases and to indicate areas that require further investigation. Table 1 below summarizes program outcomes from January to July 201311.
Table 1: PROGRAM PERFORMANCE INDICATORS, GENDARASSA, JANUARY 2013 TO JULY 2013 Indicator Number Percentage SPHERE
Recovered 356 63% >75% Death 0 0% <5% Defaulter 171 30% <15% Non recovered 42 7% <10%
As indicated in Table 1 above, program performance of recovered and defaulted falls short of SPHERE minimum standards.
11
Program data before January 2013 was not used for this analysis as record keeping was very poor.

17
Figure 7: PERFORMANCE INDICATORS, TSFP, GENDERASSA SUB CAMP, MABAN (Jan-July, 2013)
However, a separate analysis by each health delivery unit shows that the Central clinic where 38% of the discharges and 45% of the admissions in the analysis period (Jan-July, 2013) are from, exceeds all standards set by SPHERE,. On the other hand, clinics in Block 36 and Block 17 fall short of the standards (see Figure 8 below). The black double arrow on Figure 8 indicates the gaps in the percentage of the indicator across the x axis for each facility. For recovery rate Central clinic exceeds SPHERE minimum standard, while for Block 36 and 17 it falls short (i.e. <75%); for defaulter rate Central clinic falls below SPHERE, where for the other facilities it is above the maximum tolerable limit of default. Death rate was zero across facilities, exceeding standards. Non recovery rate was above the maximum limit for Block 36 and 17, while it was zero for Central12. This is the first indication that quality of services varies amongst the facilities in Genderassa sub-camp. Subsequent qualitative and stage 2 will further identify the source of this disparity and potential low and high coverage areas.
12
Central is the main clinic where IMC provides TSFP and OTP services with other primary health care and immunization services.

18
4.1.7. ANALYSIS OF DEFAULT OVERTIME As indicated in section 4.1.6 above, a significant portion of the TSFP beneficiaries defaulted. The Sphere standard for defaulting is that the defaulters should not exceed 15% of program exit. Figure 7 and 8 revealed that Central clinic’s default rate was below 15%, while for Block 36 and 17 it was significantly above the 15% threshold, 38% and 17% respectively. Overall default for the entire Genderassa sub camp TSFP program was 30% (twice the SPHERE threshold value of 15%). Therefore, the overall program as well as Block 36 and 17 performances fall below the SPHERE standard. The main reason for poor performance of indicators is default. Defaulters are children that should be in the program but are not in the program. This means that high defaulting rates are associated with low program coverage. Standard program indicator graphs should show a consistently low rate of defaulting, which this program fails to do. Figure 9 shows a standard program indicator of default for each facility for the past 7 month of the program’s life.
Default from Central Clinic and Block 36 mainly started in June, while the defaults of Block 17 were increasing across time for the better part of the analysis period. For both Block 36 and Central Clinics default is truncated only for the last two months of the program’s life.
Correlation analysis of default overtime and overall program exit overtime show that 8%, 14%, 43% and 33% of overall exits from the program occurred in April, May, June and July, respectively. This shows that between January and March only 2% of the total children exited the program. A smooth discharge time is consistent with quality program delivery. However, this program does not show these smooth discharges across time. In like manner, 85% of the overall default occurred between June and July, and 98% of defaults were between April and July. This indicates a problem in the way the program discharges children. Qualitative investigations in subsequent sections shed light on this issue and is graphically depicted in Annex 413.
13
Due to poor program data recording, SQUEAC team was not able to analyze late and early defaults.
0
10
20
30
40
50
60
Jan Feb Mar Apr May Jun Jul
Nu
mb
er
of
de
fau
lte
rs
Figure 9: PLOT OF NUMBER OF DEFAULTERS OVERTIME BY FACILITY, GENDERASSA, MABAN, January-July, 2013
Central
Block 36
Block 17

19
4.1.8. LENGTH OF STAY (CURED CASES ONLY) Programs with long treatment episodes tend to be unpopular with beneficiaries and suffer from late treatment seeking and high levels of defaulting (both of which are failures of coverage). The duration of treatment episode was investigated using a tally plot of each facility as well as for the entire 3 facilities (Figure 10). To understand the program’s current status, discharges of the last four months (April-July, 2013) were summarized. The length of stay in supplementary feeding programs according to UNHCR for camps is 12 weeks.
The median length of stay is 7 weeks (black arrow on Figure 10). The median is the value that divides the distribution into two equally sized parts. Higher coverage programs tend to have a median duration of treatment episodes of less than or equal to 8 weeks. This program’s median is 7 weeks. Therefore, discharges of cured children from the TSFP program are timely. Separate analysis of length of stay by facility showed that this is true across all facilities. However, it looks like the program discharges some cases after a considerable period of time (more than twice the median value). This should get due attention not to hold children for long and create negative feedback for the long term sustainability.
4.1.9. RESULTS FOR QUALITATIVE INVESTIGATION Stage one comprises of both quantitative and qualitative investigations. For qualitative investigations the principles employed to ensure reliability of finding were triangulation by source and method and redundancy of a barrier in many places. The main themes or areas the qualitative data collected included: Outreach; Follow up; Standard of service; Barriers; Community structure; Defaulter tracing. The main data sources were lay people; village chiefs; traditional healers; volunteers; beneficiaries; OTP staff; and mothers of defaulted children. The methods of qualitative data used included informal group discussions, case history, and key informant interviews.

20
DEFAULTER TRACING Thirty per cent (30%) of discharges in the past seven months were defaults. To identify the causes of default and the means to get them back, defaulters were traced. This was done by taking the names of defaulters from the register and locating them in their village (Shieks). However, this process did not manage to locate sufficient number of defaulters due to two challenges: the names of the Sheik from where households can easily be located was not registered in the registry book and teams failed to locate defaulted households as the settlement is big and mother’s name was not registered on the registry (which may have helped locate them). Due to the fact that beneficiary registration is done poorly and the mother’s name and exact location was not specified, only four defaulted children were identified. Their reason for default was:
Mother travelled to a place called Rank (near the border between South and North Sudan) and therefore stopped attending the services;
Child’s mother died and he is currently with grandparents who did not continue bringing him to the program at that time;
Mother was sick and travelled far. When other younger children took the child to continue treatment, they were turned back since the staff at the facility did not think they could trust these young children with the treatment of the malnourished child.
Mother moved to another camp All defaulters have been readmitted into the program (either in BSFP, TSFP or OTP)
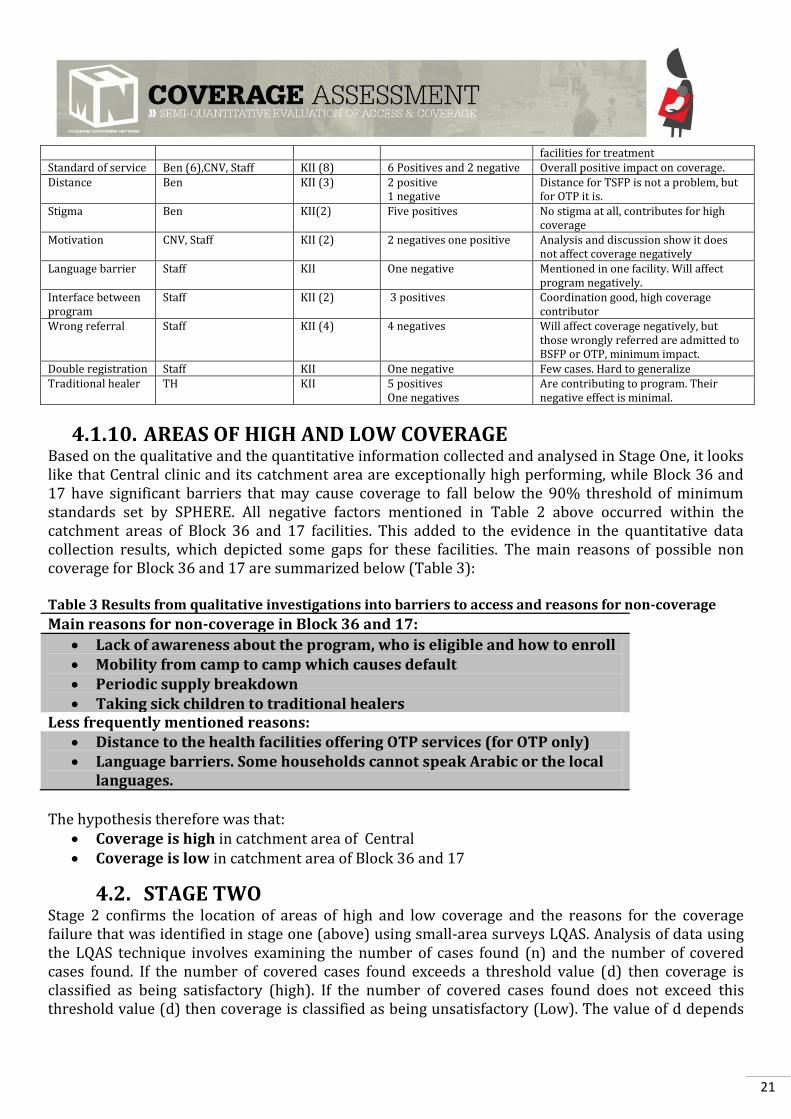
4.1.9.1. SUMMARY OF QUALITATIVE INVESTIGATION The results from qualitative data collection were largely similar across areas and health delivery units, therefore the results from focus group discussions and key informant interviews are combined for all sites. A list of key informants used in qualitative data collection is presented in Annex 5. The most common barriers to coverage and reasons for non-coverage are presented in Table 2.
Table 2: Summary of results from qualitative investigations boosters and barriers to access, and reasons for non-coverage.
Factors Source14 Method15 Impact on Coverage Conclusion Knowledge about CMAM
CL, Mother, Mother, Staff, TH
Interview, FGD,FGD,KII
4 pluses, one minus High program awareness
CM CL, Ben, BEN,CNV,OTP staff interview
6 KII 10 pluses Community mobilization very strong, regular screening, CNVs well regarded, community leaders contacted regularly with program staff
Awareness about malnutrition
CL, mothers, Ben (5),staff, traditional healer
KII (5),FGD (2)
10 pluses,2 minuses Knowledge about malnutrition and treatments very high (Signs of mAM and SAM well understood, SAM and MAM considered as treatable)
Community perception about CMAM
CL, mothers (2),CNV, Ben, Staff, TH
KII (5),FGD, CS
9 pluses One minus
Program accepted, well regarded and universally known
Mobility Defaulter Tracing Questionnaire 1 negative Movements between camps cause default (migrating children not covered)
Supply breakdown CL, CNV ,Ben KII (3) 6 negative Negative effect on coverage Health seeking behaviour
Mother (2), Ben (3) FGD (2), KII(3)
6 positives 2 negatives
Even though there is a traditional alternative treatment, community go to
14
Key to sources and methods of data collection: CL=Community Leader, TH=Traditional Healer, Staff=OTP and TSFP staff, CNV=Community Based Volunteer, Ben=Beneficiary, Mother= FGD with mothers, CS=Case History, FGD=Focus Group discussion, KII=Knowledge in depth interview. 15 Number in bracket are frequency of answers for topic under column one.
21
facilities for treatment Standard of service Ben (6),CNV, Staff KII (8) 6 Positives and 2 negative Overall positive impact on coverage. Distance Ben KII (3) 2 positive
1 negative Distance for TSFP is not a problem, but for OTP it is.
Stigma Ben KII(2) Five positives No stigma at all, contributes for high coverage
Motivation CNV, Staff KII (2) 2 negatives one positive Analysis and discussion show it does not affect coverage negatively
Language barrier Staff KII One negative Mentioned in one facility. Will affect program negatively.
Interface between program
Staff KII (2) 3 positives Coordination good, high coverage contributor
Wrong referral Staff KII (4) 4 negatives Will affect coverage negatively, but those wrongly referred are admitted to BSFP or OTP, minimum impact.
Double registration Staff KII One negative Few cases. Hard to generalize Traditional healer TH KII 5 positives
One negatives Are contributing to program. Their negative effect is minimal.
4.1.10. AREAS OF HIGH AND LOW COVERAGE Based on the qualitative and the quantitative information collected and analysed in Stage One, it looks like that Central clinic and its catchment area are exceptionally high performing, while Block 36 and 17 have significant barriers that may cause coverage to fall below the 90% threshold of minimum standards set by SPHERE. All negative factors mentioned in Table 2 above occurred within the catchment areas of Block 36 and 17 facilities. This added to the evidence in the quantitative data collection results, which depicted some gaps for these facilities. The main reasons of possible non coverage for Block 36 and 17 are summarized below (Table 3): Table 3 Results from qualitative investigations into barriers to access and reasons for non-coverage
Main reasons for non-coverage in Block 36 and 17:
Lack of awareness about the program, who is eligible and how to enroll Mobility from camp to camp which causes default Periodic supply breakdown Taking sick children to traditional healers
Less frequently mentioned reasons: Distance to the health facilities offering OTP services (for OTP only) Language barriers. Some households cannot speak Arabic or the local
languages.
The hypothesis therefore was that:
Coverage is high in catchment area of Central Coverage is low in catchment area of Block 36 and 17
4.2. STAGE TWO Stage 2 confirms the location of areas of high and low coverage and the reasons for the coverage failure that was identified in stage one (above) using small-area surveys LQAS. Analysis of data using the LQAS technique involves examining the number of cases found (n) and the number of covered cases found. If the number of covered cases found exceeds a threshold value (d) then coverage is classified as being satisfactory (high). If the number of covered cases found does not exceed this threshold value (d) then coverage is classified as being unsatisfactory (Low). The value of d depends

22
on the
number of cases found (n) and the standard against which coverage is being evaluated. A specific combination of n and d is called a sampling plan.
The SPHERE minimum standard for coverage of Targeted Supplementary feeding programs in Refugee Camp is >90%. The following formula is used to calculate a value of d appropriate for classifying coverage as being above or below a standard of 90% for any sample size (n):
⌊
⌋, for refugee camp with a SPHERE minimum standard of 90%, formula for d will be:
⌊
⌋
n=sample size (number of cases found in a small area survey) p=Threshold value (90%) d=decision value
• If the number of covered cases > d then classify coverage as acceptable (i.e. above the target threshold)
• If the number of covered case≤ D then classify coverage as unacceptable (i.e. below target threshold)
Villages are sampled from each facilities catchment area purposely, especially by varying the distance of the village from the facility. For the second stage sampling, the active and adaptive case-finding method which is very effective for SAM cases has been tested for finding cases of moderate acute malnutrition (MAM) and has been found to perform considerably worse than house-to-house screening and even has been known to fail in urban and camp settings. As this investigation is meant to assess the coverage of TSFP, house-to-house screening was selected as a means of locating children at second stage sampling. Similarly, the survey area is a camp setting with well orderly settlements. These further strengthen the choice of house-to-house screening over active and adaptive case finding methodology of capturing cases. To help the house-to-house screening, the survey used local informants and took a (verbal) household census before asking to measure children. This avoided the problem of sick or sleeping children being missed. The main findings of the small area surveys are summarized in Table 4 below.
Table 4: Small area survey findings
High coverage
area Central Clinic
Total Cases Found 12 Reason for non-coverage (barrier) MAM Cases in the Program 12
MAM Cases not in the program 0 - Low Coverage area
Block 36 and 17
Total MAM Found 24 MAM Cases in the Program 22
MAM Cases not in the Program 2 Child rejected
Child rejected

23
Based on the information collected, coverage was classified against a threshold of 90%16. A decision rule (d) was calculated using the following formula:
d= n x P 100 n = total number of cases found p = coverage standard set for the area
The results of coverage classification are presented in Table 5 Table 5: Small area survey coverage classification
High Coverage Area Gotheye Coverage standard (p) 90% Number of cases covered (12) is > decision rule (10) Coverage is >90%
Decision Rule (d) [n x 90%] [12 x 0.9]
d 10 Cases covered 12
Low Coverage Area Kouli Koira Coverage standard (p) 90% Number of
cases covered (22) > decision rule (5) Coverage is >90%
Decision Rule (d) [n x 90%] [624x 0.9] 21.6
d 21 Cases covered 22
The small area survey result shows that coverage is high and above the SHERE standard across all facilities. This is in contrast to our assumption that coverage may be lower (<90%) in Block 37 and 16. As this finding shows a very high coverage, we revised our prior value based on the finding of stage one and stage 2 to arrive at a prior coverage level that reflect both assessments. Indigenous
4.3. DEVELOPING A PRIOR The information collected in stage 1 and 2 was separated between factors that reflect positively about MAM coverage and factors that reflect poorly. Each factor was ranked using a simple weighed (0-10) point system. All positive factors were added to the minimum possible coverage (0%) while all the negative factors were subtracted from the highest possible coverage (100%). Findings of both stage 1 and 2 were used to arrive at this level of coverage. Here it will be important to illustrate the reason why this coverage investigation exclusively did a MAMJ coverage survey, excluding SAM cases. The program have only 20 children who are SAM at the time of the survey. Further, results of SAM
16
Threshold was set at 90% based on the SPHERE minimum for refugee camps.

24
prevalence (nutrition survey) showed a remarkably very low SAM caseload. This will make sampling of SAM cases impossible. The total calculated caseload of population of SAM in the entire Genderassa camp was less than 100. In sampling theory, it is impossible to employ sampling methodology on a population less than 300; in such populations it is recommended to do exhaustive enumeration of all children17. In this case it is impossible to census all under-fives as this may take months of work which does not serve it purpose. Due to this the teams agreed to survey MAM children and generate a MAM coverage.
Table 6: Prior (Compilation of stage 1 and 2) Positive findings Scores Negative findings
Timely treatment seeking (Admission MUAC) 10 2 Supply breakdown
Length of stay 10 4 Standard of service (High default, and Cure rate below 75%)
Program knowledge 8 4 Lack of formal involvement of traditional healers
Strong community mobilization & sensitization
10
Awareness about malnutrition 10
Positive perception about CMAM 10
Health seeking behavior 7
Interface 10
Small area survey (very few uncovered cases)
10
Sum of positives 85 10
The prior was calculated by taking the median of 85% (what was added to 0, which is the lowest coverage that can be) and 90% (subtractions of negatives from the maximum possible coverage). The median or the prior coverage is 87.5%. Using the BayesSQUEAC calculator, the αPrior and βPrior values were found to be 27.3 and 5, respectively. The prior distribution is shown in Figure 15 below.
Figure11: The Beta (27.3, 5) prior in BayesSQUEAC
17
http://uregina.ca/~morrisev/Sociology/Sampling%20from%20small%20populations.htm

25
4.4 STAGE THREE The objective of Stage 3 was to provide an estimate of overall program coverage using Bayesian techniques. To do this, the evaluation relied on the standards Bayesian beta to binomial conjugate analysis.
4.4.1. LIKELIHOOD (WIDE AREA COVERAGE RESULT) During the SQUEAC, 9 MAM cases as well as 8 recovering children were identified (making a total of 17 cases). Out of the 9 MAM children 7 were in treatment in the program while 2 were not in program. The survey likelihood data was summarized using the numerator and a denominator as shown below to calculate the coverage. The period coverage estimator was used because of reasonably effective case-finding resulting in timely identification and referrals, and acceptable lengths of stay, hence coverage was calculated as:
The numerator and the denominator were obtained from the results for the wide area survey using the formula:
The data was analysed using the BayesSQUEAC calculator (see Figure 12). Wide area survey data of numerator (7+8 = 15) and denominator (15+2 = 17) were entered into the BayesSQUEAC calculator. The MAM coverage is estimated to be 86.3% (95% CI = 75.2%–93.9%). Also both two uncovered children were in the TSFP program and discharged as cured. Both are currently in BSFP program. Therefore, it looks like that the coverage is satisfactory.

26
Figure 12: PRIOR, LIKELIHOOD, AND POSTERIOR DENSITIES FOR THE ANALYSIS PRESENTED IN THIS REPORT
The result confirmed the prior, as there is considerable overlap between the prior (stage 1) and Likelihood (Stage 3). The findings of stage 3 clearly confirmed our stage 1 and stage 2 findings, namely the program is a high coverage program.
Moreover, even if this survey is exclusively TSFP coverage, efforts were made to see OTP and BSFP coverage in parts of the villages. Regarding BSFP four villages were randomly selected and an exhaustive survey of coverage of Blanket Supplementary Feeding Program (BSFP) was done. Impressively, among the four villages BSFP coverage was found to be 100%. That is 200 children were in BSFP. That is 100 success rates. Contrary to this, during stage 2 and 3 a total of three SAM cases

27
with a
MUAC of 11.4, 10.9, and 11.3 were found in TSFP program, when they should be in OTP. Two of these are border cases, but the child with a MUAC of 10.9 is too sick to be missed, showing the challenges in providing OTP services.
5. CONCLUSIONS AND RECCOMENDATIONS
In Genderassa Sub Camp, Maban Refugee Camp, where IMC and partners are implementing CMAM services, the supplementary feeding program coverage was 86.3% (95% CI = 75.2%–93.9%). The investigation also showed that the children who are not enrolled in the program are covered in BSFP program showing that the program performance is acceptable.
The program performance indicators fall short of standards for cure and default rates. Specifically, the overall default rate of 30% is very high. The program should reform its operation to retain all children in the program for the duration of the treatment period. This is true for Block 36 and 17, while Central clinic is meeting all standards.
Mortality rate, early detection of MAM cases (admissions MUAC) and length of stay in program
are above acceptable standards.
There are indications that having the OTP program at Central clinic alone may limit the coverage of OTP services. Consider opening these services in Block 17 and 36 to address concerns of distance.
Even if their impact is not too strong on coverage of TSFP, the availability and wider acceptance of traditional healers is of major concern. Discussions with informants reveal that they treat a wider list of diseases. Therefore, it should be a priority to include them in the provision of CMAM program services by giving them formal training.
Registers are poorly kept and there are untrained staffs who are delivering services. Trainings on filling CMAM forms, as well as calculations of on discharge criteria, length of stay and weight gain should be considered.
The program should continue operation. As this is a refugee communities, they remain vulnerable to malnutrition and the assistance provided by the NGOs to prevent and treat malnutrition cases.

28
ANNEX 1: GEDDRASSA MAP, MABAN
REGUGEE CAMP, UPPER NILE STATE,
SOUTH SUDAN

29
ANNEX 2: TABLE OF ADMISSIONS BY VILLAGE
SN Facility name Centre Number of Admissions (TSFP)
1 Central Kurkur 208 2 Central Lemma 6 3 Central National 28 4 Central Magaga 24 5 Central Malka 15 6 Central Pofi 4 7 Central Beldugu 9 8 Central Jumjum 30 9 Central Topane 9 10 Central Alhamar 4 11 Block 36 Salbel 36 12 Block 36 Magasakor 13 13 Block 36 Baw 125 14 Block 36 National 27 15 Block 36 Ayuok 16 16 Block 36 Ngalbal 10 17 Block 36 Jabaltin 64 18 Block 36 Soda 1 19 Block 36 Fadamia 29 20 Block 36 Kormagaso 2 21 Block 36 Kadaga 1 22 Block 17 Kurkur 180 23 Block 17 Jam 40 24 Block 17 Telfa 1 25 Block 17 Naftinats 8

30
ANNEX 3: ANALYSIS OF OUTREACH S/N Name of the Sheiks Number of
CHV pre Shiek Number of HH per Shiek
Number of HH per CHV
Villages
1 Eid Altom 2 337 169 Kukur
2 Khalifa Bakit 1 253 253 Kukur
3 Ibrahim Selman 2 102 51 Jam
4 Tiffile Sad 1 46 46 Jam
5 Timsa 1 78 78 Kukur
6 Ramadan 1 36 36 Kukur
7 Al haji 1 92 92 Kukur
8 Nimer Selman 1 86 86 Kukur
9 Mohamed Doka 1 87 87 Kukur
10 Sadik Adut 1 84 84 Kukur
11 Humeda 2 215 108 Jebeletin Soda
12 Mahmud 0 82 0 Soda
13 Alfeki Bata 1 72 72 Soda
14 Mator Yasin 1 30 30 Bau
15 Asir Tilian 1 89 89 Bau
16 About Jamun 1 23 23 Bau
17 Bade Altom 1 16 16 Bau
18 Abudalagadi 2 32 16 Bau
19 Bakit Mansun 2 88 44 Fadamiya
20 Sebit Bala 3 120 40 Fadamiya
21 Essen Bagar 4 324 81 Soda
22 Abash Abudalagis 1 80 80 Kukur
23 Bashir 1 59 59 Kukur
24 Abdullah Isa 1 47 47 Magaja
25 Abdullah Osman 1 25 25 Magaja
26 Niemri Almin 1 15 15 Magaja
27 Rajaf 1 68 68 Magaja
28 Aljundi 3 301 100 Kukur
29 Ajaki 1 146 146 Kukur
30 Alhadi Semit 4 314 79 Kukur
31 Adam Abdullah 1 88 88 Zuzum
32 Almansi Mansun 1 85 85 Fadamiya
Totals 46 3520 77

31
ANNEX 4: GRAPHS COMPARING DISCHARGE OVERTIME
-100
-50
0
50
100
150
200
250
300
0 2 4 6 8
Nu
mb
er
of
dis
char
ges
Time
Overall discharges
Defaulter
Linear (Overall discharges)
Linear (Defaulter)
1% 1% 1%
7%
14%
43%
33%
Overall discharges for each month
Jan
Feb
Mar
Apr
May
Jun
Jul

32
ANNEX 5: SAMPLING FRAME FOR FIRST STAGE SAMPLING OF VILLAGES SN SUB-TRIBE IN
GENDERASSA SHEIKHS IN GENDRASSA
TOTAL HOUSEHOLD
Person count
Sampling (Random
interval=4 Random start=3)
1 Bau Abdagadir Karam 37
2 3 Alisir Telyan 111 1st 4 Hessen Bagar 399 1,568 5 Fadeima About Jamum 30 117 6 Almasy Khamis 125 435 7 Bade Altom 20 83 2nd 8 Bakhit Masam 130 439 9 Matar Yasin 35 109 10 Sibit Balla 163 614 11 Jumjum Adam Abdallah 139 506 3rd 12 Kukur Abass Abdallaziz 107 416 13 Alhadi Semen 351 1,509 14 Alhaj Alfadi 104 392 15 Ali Aljudi 301 1,328 4th 16 Azaki Saed 184 735 17 Bashir Hessen 80 295 18 Eid Atom 357 1,371 19 Khalifa Bakhit 286 1,130 5th 20 Mohammed Doka 95 360 21 Nimir Siliman 138 562 22 Ramadan Yacob 48 199 23 Magaja Sidik Aldut 112 417 6th 24 Abdallah Isa 49 224 25 Abdallah Osman 26 98 26 Nimiri Alamin 16 56 27 Rajab Alhaj 78 268 7th 28 Soda North Alfaki Bata 71 293 29 Homeda Ahmed Musa 243 1,022 30 Mohamed Atom 80 292 31 Soda South Ibrahim Silliman 115 454 32 Tifil Sead 51 230 33 Tisar Ali 82 383 34 OTHER - 9 31 35 TOTAL 4,172 16,510

33
ANNEX 6: LIST OF PARTICIPANTS IN THE SQUEAC INVESTIGATION S/N NAME Organization
1 THOMAS K. NDAMBU IMC, Nutrition Manager, Maban
2 MAWA RATIB IMC, Juba, Nutritionist
3 DUOP BAB LOK IMC, Nutrition Field Worker
4 ROSE JELLY IMC, CMAM Nurse
5 LADO MICHEAL LEMI IMC, Nutrition Field Worker
6 OBWOYA JUMA RICHARD IMC, Nutrition Field Worker
7 KENYI KENNEDY SOKIRI WFP Maban
8 MBUTO SAMUEL IMC, Acting Country nutrition Manager, Juba
9 NYOLIJA ALFRED ALEX IMC, Nutrition Field Worker
10 MUSA JAMES ADAM IMC, Nutrition Field Worker
11 PUL PUOK REPE IMC, Nutrition Field Worker
12 TOM RICHARD OLOI Medair Juba
13 DAVID BALLA TANJI IMC, Nutrition Field Worker
14 KHANDI DAVID MOINIKO Medair, Juba
15 MARY NJOKI Samaritan Purse