m7l35
TRANSCRIPT

Module 7: Probability and Statistics
Lecture – 1: Sampling Distribution and Parameter Estimation
1. Introduction
This lecture deals with Sampling distribution and Estimation of parameters. Random sampling and Point estimation, desirable properties of point estimators as well as methods of point estimation are discussed in detail. Interval Estimation of various types of random samples is also discussed. Example problems on the aforementioned topics are presented alongside the theoretical descriptions.
2. Population and Sample
Population is the complete set of all values representing a particular random process. For example, streamflow in a certain stream over infinite timeline represents the population. A sample is any subset of the entire population. For example, streamflow in the stream over the last 30 years is a sample.
2.1 Random sample
As it is impractical and/or uneconomical to observe the entire population, a sample (i.e, a subset) is selected from the population for analysis. A sample is said to be a random sample when it is representative of the population and probability theory can be applied to it to infer results that pertain to the entire population.
2.2 Random sample from finite and infinite population
An observation set nXXXX ...,, 321 selected from a finite population of size N, is said to be
a random sample if its values are such that each Xi of n has the same probability of being selected.
An observation set nXXXX ...,, 321 selected from an infinite population xf , is said to be
a random sample if its values are such that each iX of n have the same distribution xf
and the n random variables are independent.
3. Classical approach to estimation of parameters
The classical approach of parameter estimation is of two types:
Point Estimation - A single parameter value is estimated from the observed dataset.
Interval Estimation - A certain interval is determined from the observed dataset; it can be said with a definite confidence level that the parameter value will lie within that interval.
4. Random sampling and Point Estimation
In real life scenarios, the parameters of the distribution of a population are unknown and it is not feasible to obtain them by studying the entire population, hence a random sample is

generally selected. The parameters of the distribution that are computed based on analysis of the sample values are called the estimators of the parameters. Thus, parameters correspond to the population, while estimators correspond to the sample.
4.1 Desirable Properties of a Point Estimator
The desirable properties of a point estimator are unbiasedness, consistency, efficiency, and sufficiency.
Unbiasedness: Bias of an estimator is equal to the difference between the estimator's expected value and its the true value. For an unbiased estimator of the parameter, expected value = true value.
Consistency: It refers to the asymptotic property whereby the error in the estimator decreases with increase in the sample size n . Thus as n , the estimated value approaches the true value of the parameter.
Efficiency: An estimator with a lesser variance is said to be more efficient compared to that with a greater variance, other conditions remaining same.
Sufficiency: If a point estimator utilizes all the information that is available from the random sample, then it is called a sufficient estimator.
4.2 Methods of Point Estimation of Parameters
The most commonly used methods of point estimation of parameters are:
Method of Moments
Method of Maximum Likelihood
4.2.1 Method of Moments
The method of moments is based on the fact that the moments of a random variable have some relationship with the parameters of the distribution.
If a probability distribution has m number of parameters, then the first m moments of the distribution are equated to the first m sample moments. The resulting m number of equations can then be solved to determine the m number of parameters.
For a sample size n , the sample mean and sample variance are:
2
1
2
1
1;
1
n
ii
n
ii xx
nsx
nx
Thus x and 2s are point estimates of the population mean and population variance respectively and the parameters of the distribution can be determined from these. If needed, other higher order sample moments can also be obtained to calculate all the parameters.

The relation between parameters of some common distributions and the moments are:
In case of normal distribution, parameters and 2 are equal to the mean and variance
2; XVarXE
In case of gamma distribution, the parameters and are relates to the mean and
variance as follows
2; XVarXE
4.2.2 Method of Maximum Likelihood
The method of maximum likelihood can be used to obtain the point estimators of the parameters of a distribution directly.
If the sample values of a RV X with density function ;xf are nxxx ,..., 21 , then the
maximum likelihood method is aimed at finding that value of which maximizes the
likelihood of obtaining the set of observations nxxx ,..., 21 .
The likelihood of obtaining a particular sample value ix is proportional to the function value
of the pdf at ix .
The likelihood function for obtaining the set of observations nxxx ,..., 21 is given by
;...;;;,..., 2121 nn xfxfxfxxxL
Differentiating the likelihood function w.r.t. and equating it to zero, we get the value of which is the maximum likelihood estimator of the parameter
0
;,..., 21
nxxxL
The solution of can also be obtained by maximizing the logarithm of the likelihood function L
0
;,...,log 21
nxxxL
If there are m number of parameters of the distribution, then the likelihood function is
n
i mimn xfxxxL1 212121 ,...,;,...,;,...,
And the maximum likelihood estimators are obtained by solving the following simultaneous equations.

mj
xxxL
j
mn ,...,2,1;0,...,;,..., 2121
4.3 Problem on Point Estimate
Q. The interarrival time of vehicles on a certain stretch of a highway is expressed by an exponential distribution
t
T etf
1
The time between successive arrival of vehicles was observed as 2.2s, 4.0s, 7.3s, 11.1s, 6.2s, .1.8,4.3 ss
Determine the mean inter arrival time by the a) method of moments b) the maximum likelihood method.
Soln.
(a) The first moment about the origin of xf X is
,
,
1
0//
0
/
or
eteor
dtte
tt
t
Therefore, stXi
i 04.67
1 7
1
(b) Assuming random sampling, the likelihood function of the observed values is
7
1
7
7
1721
1exp
exp1
;,...,
ii
i
i
t
ttttL
The estimator can now be obtained by differentiating the likelihood function L with respect to .
Hence,

sor
tor
tor
ttor
ttt
L
ii
ii
ii
ii
ii
ii
ii
04.6,
7
1,
71
,
01
exp1
7,
01
exp1
exp7
7
1
7
1
7
1
7
1
8
2
7
17
1
77
1
8
5. Interval Estimation
In case of a point estimate, chances are very low that the true value of the parameter will exactly coincide with the estimated value.
Hence it is sometimes useful to specify an interval within which the parameter is expected to lie. The interval is associated with a certain confidence level i.e, it can be stated with a certain degree of confidence that the parameter will lie within that interval.
5.1 Confidence interval of Mean with known variance
For a large sample n 30n , if x is the calculated sample mean and 2 is the known
variance of the population, then n
X
/
is a standard normal variate. The confidence
interval of the mean is given by n
zxn
zx
2/2/ where %1001 is the
degree of confidence and 2z is the value of standard normal variate at cumulative
probability level 2/ and 2/1 .
5.2 Confidence interval of Mean with unknown variance
For a small sample n 30n , if x is the calculated sample mean and 2s is the calculated
sample variance, then the random variable nsX // follows t -distribution with
1n degrees of freedom. The confidence interval of the mean is given by
ntx
ntx
2/2/ where %1001 is the degree of confidence and 2t is the
value of standard t-distribution variate at cumulative probability level 2/ and 2/1 . It
can be obtained from the t-distribution table. Though it is assumed that the sample is drawn from a normal population, the expression applies roughly for non-normal populations also.
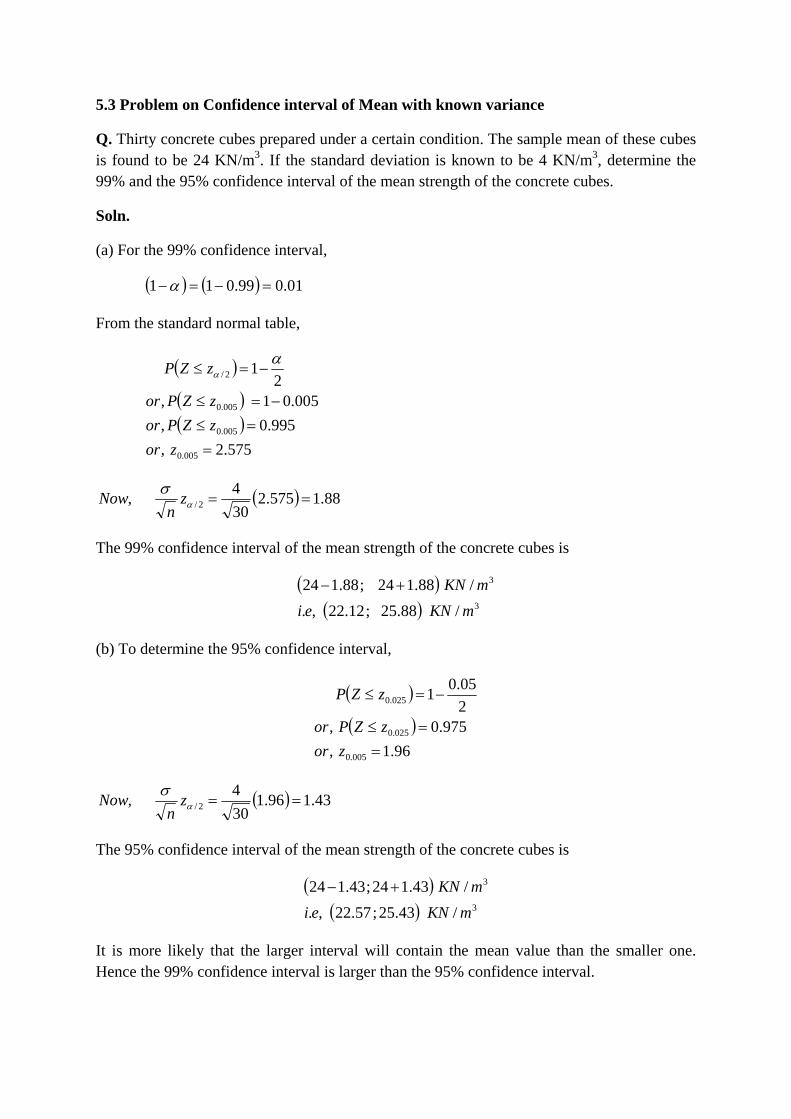
5.3 Problem on Confidence interval of Mean with known variance
Q. Thirty concrete cubes prepared under a certain condition. The sample mean of these cubes is found to be 24 KN/m3. If the standard deviation is known to be 4 KN/m3, determine the 99% and the 95% confidence interval of the mean strength of the concrete cubes.
Soln.
(a) For the 99% confidence interval,
01.099.011
From the standard normal table,
575.2,
995.0,
005.01,2
1
005.0
005.0
005.0
2/
zor
zZPor
zZPor
zZP
88.1575.230
4, 2/
z
nNow
The 99% confidence interval of the mean strength of the concrete cubes is
3
3
/88.25;12.22,.
/88.124;88.124
mKNei
mKN
(b) To determine the 95% confidence interval,
96.1,
975.0,2
05.01
005.0
025.0
025.0
zor
zZPor
zZP
43.196.130
4, 2/
z
nNow
The 95% confidence interval of the mean strength of the concrete cubes is
3
3
/43.25;57.22,.
/43.124;43.124
mKNei
mKN
It is more likely that the larger interval will contain the mean value than the smaller one. Hence the 99% confidence interval is larger than the 95% confidence interval.

5.4 Problem on Confidence interval of Mean with unknown variance
Q. A random sample of 25 concrete cubes were selected from a batch of concrete cubes prepared under a certain process. The sample mean of the 25 concrete cubes is found to be 24 KN/m3 and the sample standard deviation is 4 KN/m3 . Determine the 99% and the 95% confidence interval of the mean strength of the concrete cubes.
Soln.
Here 25n .
So, nS
X
/
has a t -distribution with 241.. nfod degrees of freedom.
For the 99% confidence interval, 005.02/
From the t -distribution table, we get the value of 24,005.0t for 995.0p and 24f ,
797.224,005.0 t
24.2797.225
4, 1,2/ nt
nNow
The 99% confidence interval of the mean strength of the concrete cubes is
3
99.0
3
99.0
/24.26;76.21,.
/24.224;24.224
mKNei
mKN
It may be noted that this interval is larger compared to that where the standard deviation of the population was known. This is expected because uncertainty is greater when the standard deviation is unknown.
6. Concluding Remarks
The basics of sampling distribution and estimation of parameters is discussed in this lecture. Point estimation and interval estimation for various types of samples are also presented here. In the next lecture, one sided confidence interval of mean for known and unknown variance, confidence interval of variance and estimation of proportion are discussed in detail. Hypothesis testing is also introduced in the next lecture.
