m. tomassini e. pestelacci arxiv:1011.1081v1 [physics.soc ... · coordination games are important...
TRANSCRIPT

Evolution of Coordination in Social Networks: ANumerical Study
M. Tomassini∗ E. Pestelacci
Information Systems Department, HECUniversity of Lausanne,Switzerland
June 29, 2018
Abstract
Coordination games are important to explain efficient and desirable social behav-ior. Here we study these games by extensive numerical simulation on networked socialstructures using an evolutionary approach. We show that local network effects maypromote selection of efficient equilibria in both pure and general coordination gamesand may explain social polarization. These results are put into perspective with re-spect to known theoretical results. The main insight we obtain is that clustering, andespecially community structure in social networks has a positive role in promotingsocially efficient outcomes.
1 Introduction
Game theory [1] has proved extremely useful in the study of economic, social, and bio-logical situations for describing interactions between agents having possibly different andoften conflicting objectives. Paradigmatic games such as the Prisoner’s Dilemma [2] havebeen used in order to represent the tension that appears in society when individual objec-tives are in conflict with socially desirable outcomes. Most of the vast research literaturehas focused on conflicting situations in order to uncover the mechanisms that could lead tocooperation instead of socially harmful outcomes (see e.g. [3] for a synthesis). However,there are important situations in society that do not require players to use aggressive strate-gies. In fact, many frequent social and economic activities require individuals to coordinatetheir actions on a common goal since in many cases the best course of action is to conformto the standard behavior. For example, if one is used to drive on the right side of the roadand travels to a country where the norm is reversed, it pays off to follow the local norm.Bargaining and contracts are also of this type because, even though expectancies may bedifferent between a buyer and a seller, still both would rather trade than not, provided thatthe respective prices are not too different. For another example, consider a situation in
∗corresponding author: [email protected]
1
arX
iv:1
011.
1081
v1 [
phys
ics.
soc-
ph]
4 N
ov 2
010

which coordination in working contributions is required in order to produce a good or aservice. In a group it might pay off not to contribute, if this behavior goes unnoticed, butthe total output will be negatively affected. Games that express this extremely commonkind of interactions are called coordination games.
Coordination games confront the players with multiple Nash equilibria and the ensu-ing problem of equilibrium selection. Given that these equilibria are equivalent from thegame-theoretical point of view, how to explain how agents make their decisions? A usefulapproach has been to use evolutionary and learning ideas which offer a dynamical perspec-tive based on the forces of biological and social evolution. In evolutionary game theory(EGT), the concept of a population of players where strategies that score best are morelikely to be selected and reproduced provides a justification for the appearance of stablestates of the dynamics that represent solutions of the game [1, 4].For mathematical convenience, standard EGT is based on infinite mixing populations wherepairs of individuals are drawn uniformly at random at each step and play the game. Correla-tions are absent by definition and the population has an homogeneous structure. However,everyday observation tells us that in animal and human societies, individuals usually tendto interact more often with some specified subset of partners; for instance, teenagers tendto adopt the fashions of their close friends group; closely connected groups usually followthe same religion, and so on. Likewise, in the economic world, a group of firms mightbe directly connected because they share capital, technology, or otherwise interact in someway. In short, social interaction is mediated by networks, in which vertices identify people,firms etc., and edges identify some kind of relation between the concerned vertices such asfriendship, collaboration, economic exchange and so on. Thus, locality of interaction playsan important role. This kind of approach was pioneered in EGT by Nowak and May [5] byusing simple two-dimensional regular grids. Recently, in the wake of a surge of activity innetwork research in many fields [6, 7], the dynamical and evolutionary behavior of gameson networks that are more likely to represent actual social interactions than regular gridshas been investigated (see [8] for a comprehensive recent review). These studies, almost ex-clusively conducted on games of conflict such as the Prisoner’s dilemma or Hawks-Doves,have shown that there are network structures, such as scale-free and actual social networksthat may favor the emergence of cooperation with respect to the fully mixing populationsused in the theory [9, 10].
In this work we extend this kind of approach to games of the coordination type. Weshall use several types of network structures, both networks generated by an algorithm aswell as an actual social network to try to unravel the effect of structure on the popula-tion behavior. In the present paper, we ignore that social networks are actually dynamicalentities that change constantly. Indeed, actors join and leave networks and they may accu-mulate and abandon ties over time. Using static networks is a useful first approximationhowever, especially for the cases where the rate of change of the network structure is slowwith respect to the rate of change of individual’s behaviors which is the approximation thatis made here.1 Comparatively little theoretical work has been done on coordination gameson networks, except for some standard types such as rings or complete networks [11] for
1a companion study on the dynamical network case is in progress.
2
which rigorous results have been obtained thanks to their regular structure. Although we domention some known rigorous results as discussed below, our methodology is essentiallycomputer simulation-based. This is because for most network types, inhomogeneity andcorrelations do not allow standard mean-field methods to be used. Likewise, pair approx-imation methods [12] provide an acceptable approach for random and regular graphs butnot for the other more complex types and thus they are not used here.The paper is organized as follows. In the next section we first present a brief introductionto the subject of coordination games, in order to make the work self-contained. Then, inSect. 3, we enumerate the main theoretical results on coordination games, as well as thenecessary definitions for networks of agents and their dynamics. In Sect. 4 we describe thesimulation methodology and the parameters used and, in Sect. 5 we present and discuss thesimulation results on various network classes first for pure coordination games, and thenfor general coordination ones. Finally, in Sect. 6 we give our conclusions and ideas forfuture work.
2 Coordination Games
2.1 General Coordination Games
General two-person, two strategies coordination games have the normal form of Table 1.With a > d and b > c, (α, α) and (β, β) are both Nash equilibria. Now, if we assume thata > b and (a−d) ≤ (b−c) then (β, β) is the risk-dominant equilibrium, while (α, α) is thePareto-dominant one. This simply means that players get a higher payoff by coordinatingon (α, α) but they risk less by using strategy β instead. There is also a third equilibriumin mixed strategies but it is evolutionarily unstable. A well known example of games of
α β
α a, a c, dβ d, c b, b
Table 1: A general two-person, two strategies coordination game.
this type are the so-called Stag-Hunt games [13]. This class of games has been extensivelystudied analytically in an evolutionary setting [14, 11] and by numerical simulation onseveral model network types [13, 9, 10, 15]. In the following, we shall first deal with theeasier case of pure coordination games which, in spite of their simplicity, already clearlypose the equilibrium selection problem. Then we shall report results on Stag-Hunt games,for which there exist many published studies to compare with, both theoretical and with theuse of simulation.
2.2 Pure Coordination Games
Two-person pure coordination games have the normal form depicted in Table 2, withui, ui > 0, and ui, uj = 0, 0, i 6= j,∀i, j ∈ [1, k], where k is the number of strategies
3

available to each player in the strategy set S = {s1, s2, ..., sk}, and the u’s are payoffs. Soall the Nash equilibria in pure strategies correspond to diagonal elements in the table wherethe two players coordinate on the same strategy, while there is a common lower uniformpayoff for all other strategy pairs which is set to 0 here. A simple coordination game is
s1 s2 . . . sks1 u1,u1 0, 0 . . . 0, 0s2 0, 0 u2,u2 . . . 0, 0. . . . . . . . . . . . . . .sk 0, 0 . . . . . . uk,uk
Table 2: A general payoff bi-matrix of a two-person pure coordination game. Nash equi-libria in pure strategies are marked in bold.
the driving game. In some countries people drive on the right side of the road, while inothers they drive on the left side. This can be represented by the pure coordination gamerepresented in Table 3. There are two Nash equilibria in pure strategies: (right, right) and
right leftright 1,1 0, 0left 0, 0 1,1
Table 3: The driving game.
(left, left) and obviously there is no reason, in principle, to prefer one over the other, i.e. thetwo equilibria are equivalent. However, while some countries have got accustomed to driveon the left such as the UK, Australia, and Japan, others have done the opposite such as mostEuropean countries and the USA. Such norms or conventions have stabilized in time andare often the product of social evolution. There is of course a third equilibrium in mixedstrategies in the driving game which consists in playing left and right with probability 1/2each but it would seem rather risky to play the game in this way on a real road. Anotherwell known example of a pure coordination game is the Battle of the Sexes in which theNash equilibria in pure strategies are those in which players use the same strategy, but thetwo sides in a two person game prefer a different equilibrium [1].
3 Mathematical Setting and Previous Results
In this section, we recall some rigorous results for two-person, two-strategies coordinationgames on some particular network types. Indeed, network topology has an influence on thestable states of the evolutionary dynamics that will be reached, as it will become clear inwhat follows. We also give nomenclature and definitions for the graphs representing thepopulation of agents and for the dynamical decision processes implemented by the agents.
Let’s thus consider the game’s payoff matrix of Table 4 with a ≥ b > 0. When a > b,
4

strategy α is said to be dominant since a player obtains a higher payoff playing α ratherthan β.
α β
α a, a 0, 0β 0, 0 b, b
Table 4: A general two-person, two-strategies pure coordination game.
The network of agents will be represented by an undirected graph G(V,E), where theset of vertices V represents the agents, while the set of edges (or links) E represents theirsymmetric interactions. The population size N is the cardinality of V . A neighbor of anagent i is any other agent j at distance one from i. The set of neighbors of i is called Vi andits cardinality is the degree ki of vertex i ∈ V . The average degree of the network is calledk and p(k) denotes its degree distribution function, i.e. the probability that an arbitrarilychosen node has degree k.
Since we shall adopt an evolutionary approach, we must next define the decision ruleby which individuals will update their strategy during time. An easy and well known adap-tive learning rule is myopic best-response dynamics, which embodies a primitive form ofbounded rationality and for which rigorous results are known [16, 17]. In the local versionof this model, time is discrete i.e. t = 0, 1, 2, . . . and, at each time step, an agent has the op-portunity of revising her current strategy. She does so by considering the current actions ofher neighbors and switching to the action that would maximize her payoff if the neighborswould stick to their current choices. The model is thus completely local and an agent onlyneeds to know her own current strategy, the game payoff matrix, who are her neighbors,and their current strategies. This rule is called myopic because the agents only care aboutimmediate payoff, they cannot see far into the future. Given the network structure of thepopulation, the rule is implemented as follows:
• at each time step a player i revises his strategy with probability p
• player i will choose the action that maximizes his payoff, given that the strategyprofile of his neighbors Vi remains the same as in the previous period
• if there is a tie or i is not given the opportunity of revising his strategy, then i willkeep his current strategy
Using the above kind of stochastic evolutionary process, which can be modeled by aMarkov chain, the following theoretical results have been proved by several researchersand can be found in Chapter 4 of [17], where references to the original works are given.They are valid for general coordination games, and thus also for the special case of the purecoordination game of Table 4.Theorem. A strategy profile in which everyone plays the same action is a Nash equilibriumfor every graph G. If G is complete then these are the only possible equilibria. If G isincomplete, then there may exist polymorphic equilibria as well.
5

The preceding theorem implies that social diversity may emerge at equilibrium depend-ing on the network structure. Given that complete networks are not socially relevant, thisresult leaves open the possibility of equilibrium strategy distributions in the population.A second related result states that, starting from any initial strategy profile, the above de-scribed stochastic process will converge to a Nash equilibrium of the coordination gamewith probability 1. To probe for the stability of equilibria, the concept of mutation is intro-duced. A mutation simply means that a player that is updating its current strategy can makea mistake with some small probability q. These small random effects are meant to capturevarious sources of uncertainty such as deliberate and involuntary decision errors. Deliber-ate errors might play the role of experimentation in the environment, and involuntary onesmight be linked with insufficient familiarity with the game, for example. A state of thisadaptive noisy dynamics is called stochastically stable if in the long term, the probabilityof being in that state does not go to tero as the error probability tends to zero (see [16] fora rigorous definition). This idea allows one to discriminate among the possible equilibriaaccording to their stability properties.
From the above considerations, it may be concluded that the network topology playsan important role on the equilibrium states that the population will reach in the long run.However, the graph types for which analytical results are available are far from the com-plex structures of observed real social networks. Therefore, our aim in the following is tocharacterize the behavior of such complex networks by using numerical simulations andappropriate statistical analysis.
4 Numerical Simulations Methodology
4.1 Network Types Studied
In the last few years a large amount of knowledge has accumulated about the structure ofreal social networks and many model networks, both static and growing have been pro-posed [6, 7, 18]. We are thus in a position that allows us to make use of this recent in-formation in order to study the behavior of coordination games on such realistic networks.In detail, we shall use the following network types: random, Barabasi-Albert scale-freenetworks, a real social network, and model social networks. We shall now briefly describeeach of these network types, directing the reader to the relevant references for more details.
4.1.1 random graphs
For generating random graphs we use one of the classical models proposed by Erdos andRenyi and described in [19]. Given N indistinguishable vertices, each possible edge has anindependent probability p of appearing (0 ≤ p ≤ 1), which gives the G(N, p) ensemble ofrandom graphs. It is worth mentioning that for that type of random graph the average clus-tering coefficient2 C = p = k/N . Thus C at fixed k tends to 0 for increasingN . This is one
2We use the following common definition. The clustering coefficient Ci of a node i is defined as Ci =2Ei/ki(ki − 1), where Ei is the number of edges in the neighborhood of i. Thus Ci measures the amount
6

of the reasons that make these random graphs rather unsuitable as model social networks,although they are useful as a known benchmark to evaluate deviations from randomness.Furthermore, p(k) = e−k kk
k! is Poissonian and thus it allows only small fluctuations aroundk, while actual measured networks usually have long-tailed degree distribution functions.
4.1.2 Scale-Free graphs
Among the several available models for constructing scale-free networks [6], here we usethe classical one by Barabasi–Albert [20]. Barabasi–Albert networks are grown incremen-tally starting with a small clique of m0 nodes. At each successive time step a new node isadded such that its m ≤ m0 edges link it to m nodes already present in the graph. It isassumed that the probability p that a new node will be connected to node i depends on thecurrent degree ki of the latter. This is called the preferential attachment rule. The probabil-ity p(ki) of node i to be chosen is given by p(ki) = ki/
∑j kj , where the sum is over all
nodes already in the graph. The model evolves into a stationary network with power-lawprobability distribution for the vertex degree P (k) ∼ k−γ , with γ ∼ 3. For the simulations,we started with a clique of m0 = 2 nodes and at each time step the new incoming node hasm = 2 links.Scale-free graphs are rather extreme and are infrequent among social networks (see below),even taking finite degree cutoffs into account. As the random graph, they are rather to beconsidered as a model network.
4.1.3 An Actual Social Network
One important reason for introducing true or model social networks is that, as said above,clustering is an important feature in networks of contacts while neither Erdos-Renyi norBarabasi-Albert scale-free graphs show a comparable level of clustering. As a typical ex-ample of a true social network, we use a coauthorship network among researchers in thegenetic programming (GP) community. This network has a connected giant component of1024 scientists and it has recently been analyzed [21]. It has clusters and communities andit should be representative of other similar human acquaintance networks. Its degree distri-bution function p(k), as is usually the case with most measured social networks [22, 6, 18],is not a pure power-law; rather, it can be fitted by an exponentially truncated power-law.
4.1.4 Model Social Networks
Several ways have been proposed for growing artificial networks with properties similarto those of observed social networks. Here we use the model of Toivonen et al. [23],which was conceived to construct a graph with most of the desired features of real-lifesocial networks i.e, assortative, highly clustered, showing community structures, havingan adjustable decay rate of the degree distribution, and a finite cutoff. The network is
of “cliquishness” of the neighborhood of node i and it characterizes the extent to which nodes adjacent tonode i are connected to each other. The clustering coefficient of the graph is the average over all nodes:C = 1
N
∑Ni=1 Ci [6]
7
incrementally grown starting from a seed of m0 randomly connected vertices. At eachsuccessive time step, the following algorithm is applied:
1. On average mr ≥ 1 random vertices are picked to be initial contacts.
2. On average ms ≥ 0 neighbors of the mr initial contacts are chosen to be secondarycontacts.
3. A newly added vertex v is connected to all the initial and secondary contacts deter-mined in the two previous steps.
The above is iterated until the network reaches the desired size. Notice that the processresponsible for the appearance of high clustering, assortativity and community structureis step 2. In the numerical experiments, we used graphs of size N = 1000 with m0 =30 initial nodes. Every time a new node is added, its number of initial contacts mr isdistributed as p(# of initial contacts = 1) = 0.95 and p(# of initial contacts = 2) = 0.05.The number of its secondary contacts ms is uniformly distributed between 0 and 3. Theresulting degree distribution falls below a power-law for high values of k [23].
4.2 Simulations Settings
The network used are of sizeN = 1000 except for the GP network, whose giant componenthas size 1024. The mean degree k of the networks generated was 6, except for the GP casewhich has k ' 5.8.For pure coordination games the non-zero diagonal payoffs a (see sect. 2.2) has been var-ied in the range [0.5, 1] in steps of 0.05 with b = 1− a; the range [0, 0.5] is symmetricallyequivalent. For general coordination games (sect. 2) in which a > d > b > c, we havestudied a portion of the parameters’ space defined by c ∈ [−1, 0] and d ∈ [0, 1], a = 1, andb = 0, as is usually done for the stag-hunt games [9, 15]. The c−d plane has been sampledwith a grid step of 0.05.Each value in the phase space reported in the following figures is the average of 50 inde-pendent runs. Each run has been performed on a fresh realization of the correspondinggraph, except for the GP co-authorship network case which is a unique realization.As already hinted in sect. 3, we have used a fully asynchronous update scheme in which arandomly selected agent is chosen for update with replacement at each discrete time step.To detect steady states3 of the dynamics we first let the system evolve for a transient periodof 5000 × N ' 5 × 10⁶ time steps. After a quasi-equilibrium state is reached past thetransient, averages are calculated during 500×N additional time steps. A steady state hasalways been reached in all simulations performed within the prescribed amount of time, formost of them well before the limit.We have experimented with different proportions of uniformly randomly distributed initialstrategies α belonging to the set {0, 0.05, 0.25, 0.5, 0.75, 0.95, 1} and we have used two
3True equilibrium states in the sense of stochastic stability are not guaranteed to be reached by the simulateddynamics. For this reason we prefer to use the terms steady states or quasi-equilibrium states which are statesthat have little or no fluctuation over an extended period of time.
8

different values for the stochastic noise q in the simulations: q ∈ {0, 0.02}, i.e. either nonoise or a small amount, as prescribed by the most important theoretical stochastic modelsin order to ensure that the evolutionary process is ergodic [14, 11, 16].
5 Simulation Results
5.1 Results on Pure Coordination Games
Figures 1 and 2 show global coordination results for random graphs and scale-free graphsrespectively. The plots report on the x-axis the payoff advantage of strategy α with respectto strategy β, which goes from 0 to 1, and on the y-axis the frequency of α-strategists inthe population. The curves represent average values over 50 runs for each sampled point.By simple inspection, it is clear that results do not differ by a large extent between the ran-dom and the scale-free cases, which means that the degree distribution function has littleeffect on the outcome. The general trend is for all the populations to converge toward thepayoff-dominant Nash equilibrium in pure strategies which is also the case for the stan-dard well-mixed population, as we know from analytical results. Polymorphic populationsdo exist temporarily but they are unstable and the stochastic dynamics always reaches amonomorphic state. It is also quite obvious that without mutations (Figs. 1 and 2 left-handimages), if a strategy is absent at the beginning, it cannot appear later. Instead, with evena small amount of noise (q = 0.02 in the figures), the strategy offering the best payoffwill take over the population thanks to repeated mutations that will create individuals play-ing that strategy (Figs. 1 and 2 right-hand images) even in case the strategy is absent inthe initial population. Furthermore, noise always promotes a quicker transition toward thepayoff-dominant steady state.
0.5 0.6 0.7 0.8 0.9 1
value of a
0
0.2
0.4
0.6
0.8
1
fin
al fr
actio
n o
f a
0.5 0.6 0.7 0.8 0.9 1
value of a
0
0.2
0.4
0.6
0.8
1
fin
al fr
actio
n o
f
0.0
0.05
0.25
0.50
a
0.5 0.6 0.7 0.8 0.9 1
value of a
0
0.2
0.4
0.6
0.8
1
fin
al fr
actio
n o
f
0.0
0.05
0.25
0.50
a
0 0.2 0.4 0.6 0.8 1
payoff difference (a-b)
0
0.2
0.4
0.6
0.8
1
fin
al fr
actio
n o
f a
0.5 0.6 0.7 0.8 0.9 1
value of a
0
0.2
0.4
0.6
0.8
1
fin
al fr
actio
n o
f a
0.5 0.6 0.7 0.8 0.9 1
value of a
0
0.2
0.4
0.6
0.8
1
fin
al fr
actio
n o
f
0.0
0.05
0.25
0.50
a
0.5 0.6 0.7 0.8 0.9 1
value of a
0
0.2
0.4
0.6
0.8
1
fin
al fr
actio
n o
f
0.0
0.05
0.25
0.50
a
0 0.2 0.4 0.6 0.8 1
payoff difference (a-b)
0
0.2
0.4
0.6
0.8
1
fin
al fr
actio
n o
f a
Figure 1: Random network: k = 6. Left image refers to noiseless best response dynamics.The right image is for a noisy dynamics with q = 0.02. Graphics report the frequency ofstrategy α in the population as a function of the payoff difference a − b. Continuous linesare just a guide for the eye.
Figures 3 and 4 depict the same quantities as above in the case of the real social networkand model social networks respectively. Although the general behavior is the same, i.e. the
9

0.5 0.6 0.7 0.8 0.9 1
value of a
0
0.2
0.4
0.6
0.8
1
fin
al fr
actio
n o
f a
0.5 0.6 0.7 0.8 0.9 1
value of a
0
0.2
0.4
0.6
0.8
1
fin
al fr
actio
n o
f
0.0
0.05
0.25
0.50
a
0.5 0.6 0.7 0.8 0.9 1
value of a
0
0.2
0.4
0.6
0.8
1
fin
al fr
actio
n o
f
0.0
0.05
0.25
0.50
a
0 0.2 0.4 0.6 0.8 1
payoff difference (a-b)
0
0.2
0.4
0.6
0.8
1
fin
al fr
actio
n o
f a
0.5 0.6 0.7 0.8 0.9 1
value of a
0
0.2
0.4
0.6
0.8
1
fin
al fr
actio
n o
f a
0.5 0.6 0.7 0.8 0.9 1
value of a
0
0.2
0.4
0.6
0.8
1
fin
al fr
actio
n o
f
0.0
0.05
0.25
0.50
a
0.5 0.6 0.7 0.8 0.9 1
value of a
0
0.2
0.4
0.6
0.8
1
fin
al fr
actio
n o
f
0.0
0.05
0.25
0.50
a
0 0.2 0.4 0.6 0.8 1
payoff difference (a-b)
0
0.2
0.4
0.6
0.8
1
fin
al fr
actio
n o
f a
Figure 2: Scale-free network: Barabasi-Albert Model, k = 6. Left image refers to noiselessbest response dynamics. In the right image the probability of mutation is q = 0.02. On they-axis the frequency of strategy α is plotted against the payoff difference a− b.
Pareto-dominant steady state is reached in most situations, some aspects of the dynamicsdiffer from the case of random and scale-free networks. To begin with, one sees on theleft-hand images that, without noise, the payoff dominated strategy is able to resist in thepopulation when the payoff differences are small. For example, starting with an equal initialshare of strategies α and β, one sees in Figs. 3 and 4 that, up to a difference in payoffs of0.02 the Pareto-dominated strategy is still present in the population with a sizable fraction.This phenomenon can be explained by looking at the clusters present in the social networks.Results will be presented below.
But the main remark is that, in the presence of noise, the payoff-dominant stable stateis reached for smaller differences in payoff (see right-hand images). In other words, asmall a− b advantage is enough to quickly steer the dynamics towards the dominant quasi-equilibrium. The behavior is sufficiently different from the previous one to require at least aqualitative explanation, which is presented next by introducing the concept of communities.
5.2 Social Communities and Game Strategies
Communities or clusters in networks can be loosely defined as being groups of nodes thatare strongly connected between them and poorly connected with the rest of the graph.These structures are extremely important in social networks and may determine to a largeextent the properties of dynamical processes such as diffusion, search, and rumor spread-ing among others. Several methods have been proposed to uncover the clusters present ina network (for a review see, for instance, [24]). In order to study the effect of communitystructure on the distribution of behaviors at steady state, here we have used the divisivemethod of Girvan and Newman [25] which is based on iteratively removing edges with ahigh value of edge betweennes.The presence of communities has a marked effect on the game dynamics. Figure 5 depictsthe community structure of a Barabasi–Albert scale-free graph (a) and of a model socialnetwork built according to Toivonen et al’s model (b). The difference is striking: while
10

0.5 0.6 0.7 0.8 0.9 1
value of a
0
0.2
0.4
0.6
0.8
1
fin
al fr
actio
n o
f a
0.5 0.6 0.7 0.8 0.9 1
value of a
0
0.2
0.4
0.6
0.8
1
fin
al fr
actio
n o
f
0.0
0.05
0.25
0.50
a
0.5 0.6 0.7 0.8 0.9 1
value of a
0
0.2
0.4
0.6
0.8
1
fin
al fr
actio
n o
f
0.0
0.05
0.25
0.50
a
0 0.2 0.4 0.6 0.8 1
payoff difference (a-b)
0
0.2
0.4
0.6
0.8
1
fin
al fr
actio
n o
f a
0.5 0.6 0.7 0.8 0.9 1
value of a
0
0.2
0.4
0.6
0.8
1
fin
al fr
actio
n o
f a
0.5 0.6 0.7 0.8 0.9 1
value of a
0
0.2
0.4
0.6
0.8
1
fin
al fr
actio
n o
f
0.0
0.05
0.25
0.50
a
0.5 0.6 0.7 0.8 0.9 1
value of a
0
0.2
0.4
0.6
0.8
1
fin
al fr
actio
n o
f
0.0
0.05
0.25
0.50
a
0 0.2 0.4 0.6 0.8 1
payoff difference (a-b)
0
0.2
0.4
0.6
0.8
1
fin
al fr
actio
n o
f a
Figure 3: Coauthorship network in the Genetic Programming community. Left image: nonoise. Right image: mutation probability q = 0.02. On the y-axis we report the fraction ofα-strategists in the population as a function of the payoff difference a− b.
0.5 0.6 0.7 0.8 0.9 1
value of a
0
0.2
0.4
0.6
0.8
1
fin
al fr
actio
n o
f a
0.5 0.6 0.7 0.8 0.9 1
value of a
0
0.2
0.4
0.6
0.8
1
fin
al fr
actio
n o
f
0.0
0.05
0.25
0.50
a
0.5 0.6 0.7 0.8 0.9 1
value of a
0
0.2
0.4
0.6
0.8
1
fin
al fr
actio
n o
f
0.0
0.05
0.25
0.50
a
0 0.2 0.4 0.6 0.8 1
payoff difference (a-b)
0
0.2
0.4
0.6
0.8
1
fin
al fr
actio
n o
f a
0.5 0.6 0.7 0.8 0.9 1
value of a
0
0.2
0.4
0.6
0.8
1
fin
al fr
actio
n o
f a
0.5 0.6 0.7 0.8 0.9 1
value of a
0
0.2
0.4
0.6
0.8
1
fin
al fr
actio
n o
f
0.0
0.05
0.25
0.50
a
0.5 0.6 0.7 0.8 0.9 1
value of a
0
0.2
0.4
0.6
0.8
1
fin
al fr
actio
n o
f
0.0
0.05
0.25
0.50
a
0 0.2 0.4 0.6 0.8 1
payoff difference (a-b)
0
0.2
0.4
0.6
0.8
1
fin
al fr
actio
n o
f a
Figure 4: Model social network. Left: mutation probability q = 0; right: q = 0.02. On they-axis we report the fraction of α-strategists in the population as a function of the payoffdifference a− b.
clear-cut clusters exist in (b), almost no recognizable communities can be isolated in (a), afact that is shown by the high number of links between clusters, with a communities graphaverage degree of ∼ 32, while k is about 6.5 for the communities graphs arising from so-cial networks. A common statistical indicator of the presence of a recognizable communitystructure is the modularity Q. According to Newman [26], where quantitative definitionsare given, modularity is proportional to the number of edges falling within clusters minusthe expected number in an equivalent network with edges placed at random. While modu-larity is not without flaws [27], it is still a convenient indicator of the presence of clusters.In general, networks with strong community structure tend to have values of Q in the range0.4− 0.7. Indeed, for the networks in Fig. 5, we have Q ' 0.3 for the scale-free network,while Q ' 0.6 for the model social network. Colors in the figure represent frequency ofstrategies at steady state for a single particular, but representative, run in each case. In theaverage over 50 runs, final proportions of strategies α and β do not depart much from the
11

(a) (b)
Figure 5: Distribution of strategies at steady state in the network communities when bothstrategies share the same payoff: a = b = 0.5. (a) scale-free, frequency of α = 0.568. (b)model social network, fraction of α = 0.585. Each vertex represents a whole communitywith size proportional to the size of the community. Links represent inter-community con-nections and their thickness is proportional to the number of inter-community links. Thecommunities are much less interconnected in the social network and this causes a greaterdifference in concentration from community to community.
initial 50%. However, while in the scale-free case at the steady state the standard deviationis high, meaning that the system converges often to one or the other equilibrium, this isnot the case for the social networks. In the latter, at steady state there is always a mix ofstrategies; in other words, polymorphic equilibria may be stable. This is a remarkable factthat is due to the community structure of social networks, which is almost missing in thescale-free and random network cases. Thanks to this clear-cut cluster structure, as soon asthe nodes of a cluster are colonized by a majority of one of the two strategies by statisticalfluctuation, it becomes difficult for the other strategy to overtake, which explains why thesecluster strategies are robust. The effect of the community structure is even more apparentin Fig. 6 where strategy α has been given a slight initial advantage. At steady state, in boththe co-authorship network (a) as well as the model network (b) strategy β is still present insome clusters. If we were to interpret strategies as social norms or conventions, then thiswould suggest that a realistic social structure may help protect diversity, either political orcultural, for example. The possibility of polymorphic equilibria had been theoretically pre-dicted by Morris [28] for symmetric payoffs in pure coordination games with best responsedynamics in the case of infinite populations and making use of a notion of “cohesion”which refers to the relative frequency of ties among groups compared with non-members.Clearly, although it was expressed in a different language that does not make explicit use of
12

networks, this notion is related to the communities we have here and the simulation resultsnicely confirm the prediction in the case of finite, actual networked systems.
(a) (b)
Figure 6: Strategy distribution in the network communities when α has a small advantageover β: a = 0.55. (a) Genetic Programming co-authorship network, proportion of α =0.839. (b) model social network, proportion of α = 0.833. The cluster structure of thesenetworks allows the preservation of the dominated strategy in some communities.
5.3 Results on the Stag Hunt Games
Figure 7 shows strategy distribution on the game parameter space for the Stag Hunt class ofcoordination games for the scale-free case. Results for random graphs are similar to thosefor scale-free networks and are not shown. The two upper images are for equal initial pro-portions of each strategy, while the bottom figures refer to an initial proportion of strategyα = 5%. The first image in each row is for best response without noise, while the secondimage has noise level q = 0.02.For initially equidistributed strategies, although average values are reported in the figures,almost all simulations attain one or the other absorbing state, i.e. all individuals play α orall play β, and there is almost no difference when noise is present. This is in agreementwith previous results on scale-free graphs published by Roca et al. [29] where update wasby best response without noise, and also with [10] where replicator dynamics instead ofbest response dynamics was used as a strategy update rule.For the more extreme case in which initially the fraction of strategy α is 5% randomlydistributed over the graph vertices (bottom row images), a small amount of random noisedoes not have a large effect: the cooperative strategy emerges in the favorable region of theparameter space, i.e. for low d and high c (upper left corner) in both cases. However, the
13
0.0
0.2
0.4
0.6
0.8
1.0
0.0 0.2 0.4 0.6 0.8 1.0
!1.0
!0.8
!0.6
!0.4
!0.2
0.0
d
c
0.0
0.2
0.4
0.6
0.8
1.0
0.0 0.2 0.4 0.6 0.8 1.0
!1.0
!0.8
!0.6
!0.4
!0.2
0.0
d
c
0.0
0.2
0.4
0.6
0.8
1.0
0.0 0.2 0.4 0.6 0.8 1.0
!1.0
!0.8
!0.6
!0.4
!0.2
0.0
d
c
0.0
0.2
0.4
0.6
0.8
1.0
0.0 0.2 0.4 0.6 0.8 1.0
!1.0
!0.8
!0.6
!0.4
!0.2
0.0
d
c
0.0
0.2
0.4
0.6
0.8
1.0
0.0 0.2 0.4 0.6 0.8 1.0
!1.0
!0.8
!0.6
!0.4
!0.2
0.0
d
c
0.0
0.2
0.4
0.6
0.8
1.0
0.0 0.2 0.4 0.6 0.8 1.0
!1.0
!0.8
!0.6
!0.4
!0.2
0.0
d
ccc
cc
d d
dd
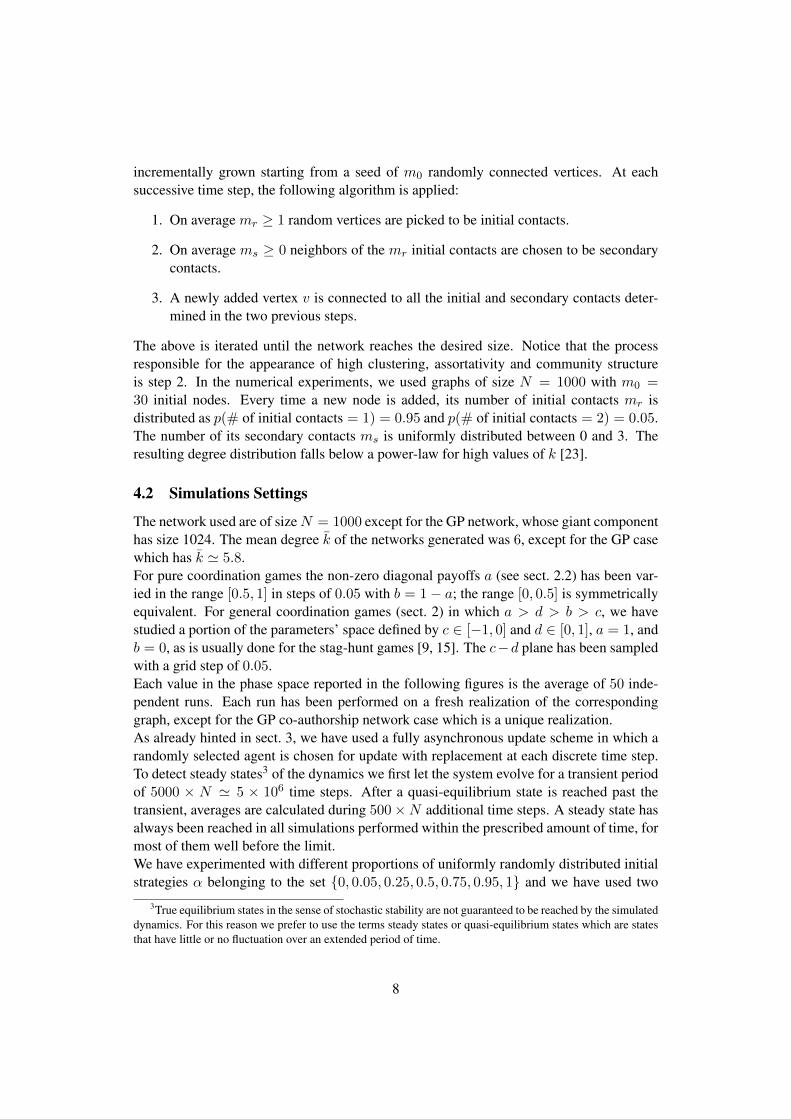
Figure 7: Distribution of strategies proportions at steady state on the d− c plane for scale-free networks. Each sampled point is the average of 50 independent runs. The upper imagesare for equal initial proportions of each strategy. In the lower figures the initial proportionof randomly distributed α-strategists is 5%. Figures on the left column are for best responsedynamics without noise, while those on the right column represent a situation in which theprobability of mutation q = 0.02. Darker colors mean that risk-dominance prevails; lightcolor design the region where payoff-dominance prevails.
presence of noise enhances the efficient coordination region. Indeed, even when strategy αis initially absent, once it is created by mutation, it spreads as in the 5% case. It is to benoted that the same phenomenon happens when the minority strategy is β = 0.05; in thiscase the images are specularly symmetrical, and with colors reversed, with respect to themain diagonal, except for sampling differences (not shown to save space).Figure 8 depicts average results for the model social network case of Toivonen et al. [23].Results for the collaboration network are very close to those of model social networks. Forthis reason, and in order not to clutter the graphics too much, we do not show them. It isimmediately apparent that the case in which strategies are initially randomly distributed inequal amounts seems similar to the scale-free results. However, looking more carefully, theaverage results shown in the figures hide to some extent the fact that now many simulationsdo not end in one of the monomorphic population states, but rather there is a mix of the
14

0.0
0.2
0.4
0.6
0.8
1.0
0.0 0.2 0.4 0.6 0.8 1.0
!1.0
!0.8
!0.6
!0.4
!0.2
0.0
d
c
0.0
0.2
0.4
0.6
0.8
1.0
0.0 0.2 0.4 0.6 0.8 1.0
!1.0
!0.8
!0.6
!0.4
!0.2
0.0
d
c
0.0
0.2
0.4
0.6
0.8
1.0
0.0 0.2 0.4 0.6 0.8 1.0
!1.0
!0.8
!0.6
!0.4
!0.2
0.0
d
c
0.0
0.2
0.4
0.6
0.8
1.0
0.0 0.2 0.4 0.6 0.8 1.0
!1.0
!0.8
!0.6
!0.4
!0.2
0.0
d
c
0.0
0.2
0.4
0.6
0.8
1.0
0.0 0.2 0.4 0.6 0.8 1.0
!1.0
!0.8
!0.6
!0.4
!0.2
0.0
d
c
0.0
0.2
0.4
0.6
0.8
1.0
0.0 0.2 0.4 0.6 0.8 1.0
!1.0
!0.8
!0.6
!0.4
!0.2
0.0
d
ccc
cc
d d
dd
Figure 8: Distribution of strategies proportions at steady state on the d− c plane for modelsocial networks. Each sampled point is the average of 50 independent runs. The upperimages are for equal initial proportions of each strategy. In the lower figures the initialproportion of randomly distributed α-strategists is 5%. Figures on the left column are forbest response dynamics without noise, while those on the right column represent a situationin which the probability of mutation q = 0.02. Darker colors mean that risk-dominanceprevails; light color design the region where payoff-dominance prevails.
two strategies, when noise is absent. This is visible in the upper left figure in the less crispfrontier along the diagonal which is due to a more gradual transition between phase spaceregions. However, when a small amount of noise is present (upper right image) the transi-tion is again sharp and the dynamics usually leads to a monomorphic population in whichone of the two absorbing states is entered. The reason why there can be mixed states in thenoiseless case in social networks is related to their mesoscopic structure. As we have seenin sect. 5.2, model and real social networks can be partitioned into recognizable clusters.Within these clusters strategies may become dominant as in the pure coordination case justby chance. In other words, as soon as a strategy dominates in a given cluster, it is difficultto eradicate it from outside since other communities, being weakly connected, have littleinfluence. This kind of effect in the Stag Hunt game has been observed previously in sim-ulations on grid-structured populations [13, 29]. However, grid structures are not socially
15

realistic; thus, the fact that more likely social structure do support efficient outcomes is anencouraging result. However, when noise is present, there is always the possibility thatthe other strategy appears in the cluster by statistical fluctuations and, from there, it cantakeover the whole community. To end this section, we remark that analogous effects dueto the presence of clusters in social networks have been observed and interpreted in thePrisoner’s Dilemma game in [30, 10].
We now briefly comment on the relationship between our numerical results and wellknown theoretical results on Stag-Hunt games. These theoretical models are based onergodic stochastic processes in large populations and state that, when using best-responsedynamics in random two-person encounters, and in the presence of a little amount of noise,both for well-mixed populations as well as for populations structured as rings, the risk-dominant strategy should take over the population in the long run [14, 11, 16]. From oursimulation results on all kind of networks this is not the case; in other words, at the steadystate there is always either a single strategy, but not necessarily the risk-dominant one, ora mix of both strategies. For scale-free and random graphs, the numerical results of [29]agree with ours. The case of social networks, presented here for the first time, also confirmsthe above and in addition makes explicit the role played by communities. We may alsomention at this point that, for the Stag-Hunt, the presence of a local interaction structureprovided by a network has been shown to increase the region of the phase space in which thePareto-dominant outcome prevails for other strategy update rules, such as imitate the mostsuccessful neighbor or reproduce proportionally to fitness (replicator dynamics) [13, 15].Thus coordination is sensitive to the exact type of underlying dynamics in networks. Thisis indirectly confirmed by the theoretical study of Robson and Vega-Redondo [31] in whicha different matching model is used with respect to Kandori et al [14]. In [31] players areimmediately randomly rematched after each encounter and the result is that the Pareto-dominant equilibrium is selected instead.In summary, it can be said that network effects tend to reinforce cooperation on the Pareto-dominant case, which is a socially appreciable effect. However, these results must be takenwith a grain of salt. We are numerically studying finite, network-structured populationsduring a limited amount of time, while theoretical results have been established for largewell mixed populations in the very long run. The conditions are thus sufficiently different toconclude that numerical results and theoretical predictions based on different assumptionsdo not have to agree necessarily.
6 Summary and Conclusions
In this work we have studied pure and general coordination games on complex networks bynumerical simulation. Situations described by coordination games are common in societyand it is important to understand when and how coordination on socially efficient outcomescan be achieved.In the case of pure coordination games on model networks using deterministic best re-sponse strategy dynamics we have found that network effects are small or non-existent instandard complex networks. On model social networks and a real co-authorship network
16

the behavior is similar, but the transition from one convention to the other is smoother andthe cluster structure of the networks plays an important role in protecting payoff-weakerconventions within communities and this leads to a clear polarization of conventions in thenetwork. When a small amount of noise is added in order to simulate errors and trembles inthe agent’s decisions, the dynamics leads to the payoff-dominant norm for smaller valuesof the payoff difference between strategies. However, in the case of social networks, even atiny amount of payoff advantage is enough to drive a minority of α-strategists to take overthe whole network thanks to the cluster structure and mutations.In the case of general coordination games of the Stug Hunt type where there is a tensionbetween payoff-dominance and risk-dominance, we have confirmed previous simulationresults in the sense that, with deterministic best response dynamics the influence of net-work structure is very limited [13, 29, 15, 10]. On the other hand, when we considermodel and social networks, again their community structure plays an important role whichconsists in allowing the existence at steady state of dimorphic populations in which bothstrategies are present and stable. The payoff-dominant strategy is favored in regions whererisk-dominance should be the only stable strategy and, conversely, it allows risk-dominantplayers to survive in clusters when payoff-dominance should prevail.We have also compared numerical results with theoretical ones when they exist. The lat-ter actually depend on the detailed structure of the stochastic processes generated by theparticular theoretical model. In this sense, numerical results are compatible with theoret-ical predictions when they are applicable, i.e. for well mixed and ring-structured popula-tions [14, 31, 11]. Also, for pure coordination games the predictions of [28] in arbitrarynon-homogeneous structures are qualitatively confirmed. However, finite-size and complexnetwork effects are difficult to describe theoretically and thus our results on complex andsocial networks cannot always be easily compared with theoretical predictions. Our cur-rent and future work is to investigate coordination games in a more realistic co-evolutionaryscenario in which both the agents’ strategies as well as their interactions may vary dynam-ically.
Acknowledgments. We thank Rafael Lalive for stimulating discussions and for readingthe manuscript. We gratefully acknowledge financial support by the Swiss National ScienceFoundation under contract 200020-119719.
References
[1] F. Vega-Redondo, Economics and the Theory of Games, Cambridge University Press,Cambridge, UK, 2003.
[2] R. Axelrod, The Evolution of Cooperation, Basic Books, Inc., New-York, 1984.
[3] M. A. Nowak, Five Rules for the Evolution of Cooperation, Science 314 (5805)(2006) 1560–1563.
[4] J. W. Weibull, Evolutionary Game Theory, MIT Press, Boston, MA, 1995.
17

[5] M. A. Nowak, R. M. May, Evolutionary games and spatial chaos, Nature 359 (1992)826–829.
[6] M. E. J. Newman, The structure and function of complex networks, SIAM Review 45(2003) 167–256.
[7] P. J. Carrington, J. Scott, S. W. Eds., Models and Methods in Social Networks Anal-ysis, Cambridge, N. Y., 2005.
[8] G. Szabo, G. Fath, Evolutionary games on graphs, Physics Reports 446 (2007) 97–216.
[9] F. C. Santos, J. M. Pacheco, T. Lenaerts, Evolutionary dynamics of social dilemmas instructured heterogeneous populations, Proc. Natl. Acad. Sci. USA 103 (2006) 3490–3494.
[10] L. Luthi, E. Pestelacci, M. Tomassini, Cooperation and community structure in socialnetworks, Physica A 387 (2008) 955–966.
[11] G. Ellison, Learning, local interaction, and coordination, Econometrica 61 (1993)1047–1071.
[12] M. van Baalen, Pair approximations for different spatial geometries, in: U. Dieck-mann, R. Law, J. Metz (Eds.), The Geometry of Ecological Interactions: SimplifyingSpatial Complexity, Cambridge University Press, Cambridge, 2000, pp. 359–387.
[13] B. Skyrms, The Stag Hunt and the Evolution of Social Structure, Cambridge Univer-sity Press, Cambridge, UK, 2004.
[14] M. Kandori, G. Mailath, R. Rob, Learning, mutation, and long-run equilibria ingames, Econometrica 61 (1993) 29–56.
[15] C. P. Roca, J. A. Cuesta, A. Sanchez, Evolutionary game theory: temporal and spatialeffects beyond replicator dynamics, Physics of Life Reviews 6 (2009) 208–249.
[16] H. P. Young, Individual Strategy and Social Structure, Princeton University Press,Princeton, 1998.
[17] S. Goyal, Connections: An Introduction to the Economics of Networks, PrincetonUniversity Press, Princeton, 2007.
[18] M. O. Jackson, Social and Economic Networks, Princeton University Press, Prince-ton, NJ, 2008.
[19] B. Bollobas, Modern Graph Theory, Springer,Berlin, Heidelberg, New York, 1998.
[20] R. Albert, A.-L. Barabasi, Statistical mechanics of complex networks, Reviews ofModern Physics 74 (2002) 47–97.
18

[21] M. Tomassini, L. Luthi, M. Giacobini, W. B. Langdon, The structure of the geneticprogramming collaboration network, Genetic Programming and Evolvable Machines8 (2007) 97–103.
[22] L. A. N. Amaral, A. Scala, M. Barthelemy, H. E. Stanley, Classes of small-worldnetworks, Proc. Natl. Acad. Sci. USA 97 (2000) 11149–11152.
[23] R. Toivonen, J. P. Onnela, J. Saramaki, J. Hyvonen, K. Kaski, A model for socialnetworks, Physica A 371 (2006) 851–860.
[24] S. Fortunato, Community detection in graphs, Physics Reports 486 (2010) 75–174.
[25] M. E. J. Newman, M. Girvan, Finding and evaluating community structure in net-works, Phys. Rev. E 69 (2004) 026113.
[26] M. E. J. Newman, Modularity and community structure in networks, Proc. Natl. Acad.Sci. USA 103 (2006) 8577–8582.
[27] R. Guimera, M. Sales-Pardo, L. A. N. Amaral, Modularity from fluctuations in ran-dom graphs and complex networks, Phys. Rev. E 70 (2004) 025101.
[28] S. Morris, Contagion, Review of Economic Studies 67 (2000) 57–78.
[29] C. P. Roca, J. A. Cuesta, A. Sanchez, Promotion of cooperation on networks? Themyopic best response case, European J. Phys. BTo appear.
[30] S. Lozano, A. Arenas, A. Sanchez, Mesoscopic structure conditions the emergence ofcooperation on social networks, Plos one 3 (4) (2008) e1892.
[31] A. J. Robson, F. Vega-Redondo, Efficient equilibrium selection in evolutionary gameswith random matching, J. Econ. Theory 70 (1996) 65–92.
19