m. title - eric. title growth in knowledge: ... hazards of this practice have been described by...
TRANSCRIPT
DOCUMENT RESUME
ED 346 134 TN 018 431
AUTHOR Thorndike, Robert M.; Andrieu-Parker, JacquelineM.
TiTLE Growth in Knowledge: A Two-Year Longitudinal Study ofChanges in Scores on the College Basic AcademicSubjects Examination.
PUB DATE 92NOTE 20p.PUB TYPE Reports - Research/Technical (143)
EMS PRICE NF01/PC01 Plus Postage.DESCRIPTORS *Academic Achievement; *Achievement Gains;
Achievement Tests; *Cognitive Processes; *CollegeOutcomes Assessment; College Students; ComparativeTesting; Higher Education; Knowledge Level;Longitudinal Studies; *Pretests Posttests; *Scores;Skill Development
IDENTIFIERS College Basic Academic Subjects Examination; TestRetest Reliability
ABSTRACTCognitive changes in college students from early in
the freshman year to the end of the sophomore year were assessedusing a pretest-posttest design. In all, 135 university studentscompleted both a pretest and a posttest. The academic achievementmeasure used was the College Basic Academic Subjects ExaminatLm(CHASE), a test intended to assess content knowledge and skilldevelopment at a level with students completing the general educationcomponent of their college experience. The analysis of pretest andposttest scores showed a general average gain of about one-quarter ofa standard deviation, but there were some notable losses, with somestudents losing almost 200 scale points on retesting while othersshowed large gains. Results indicate that the CBASE is a high qualityinstrument with good test-retest reliability, but that it adds littleto information about entering students that is available from othersources. CHASE scores indicated growth in almost all areas. The largelosses demonstrated by some students may be explained by the factthat they did not take the test seriously, attempting only tocomplete the task in the minimum time possible. Eleven tables presentstudy data, and there is a seven-item list of references. (SLD)
******************************t****************************************Reproductions supplied by EDRS are the best that can be made
from the original document.************************************************************************

U.S. DEPARTMENT OP EDUCATIONOthce Edtx...n tgriAl Ratearch and Improvement "PERMISSION TO REPRODUCE THIS
EDUCATIONAL RESOURCES INFORMATION MATERIAL HAS SEEN GRANTED BYCENTER (ER1Ct
Win* document hart been reprOduCedreCened from the person or cagaruzatIon
RoBetr /-1.60tAfinxEor+ginstrng 4
043 1 Minor changes have been made to improvereproduCt+On Cluenty
Fa"1 Points v len Or (Moment' stated +nthls docurriOnt CIO nOt necesserdy represent Otiscrai TO THE EDUCATIONAL RESOURCES
CCOEM 0O34+On or potscy INFORMATION CENTER (ERIC)."
444
GROWTH IN KNOWLEDGE: A TWO-YEAR LONGITUDINAL STUDY OFCHANGES IN SCORES ON THE COLLEGE BASIC ACADEMIC SUBJECTS EXAMINATION
Robert M. ThorndikeJacqueline M. Andrieu-ParkerWestern Washington University
EST ©WV MiniE
Growth in knowledge:
A two-year longitudinal study of changes in scores on the
College Basic Academic Subjects Examination
Robert M. Thorndike and
Jacqueline M. Andrieu-Parker
Western Washington University
The assessment of cognitive changes that occur as a result ofhigher education has beea a growing concern among college anduniversities since Astin (1985) and others brought the issue ofoutcomes assessment to public attention. Banta and Fisher (1987)delineated the issues and problems of assessment, particularly atthe state level.
Three major test publishers have provided standardizedinstruments to measure higher education outcomes. Numerousstudies using these instruments have been conducted, particularlyby Banta, Pike and their associates in Tennessee. A largestatewide study also was conducted in Washington (Council ofPresidents, 1989).
The focus of higher education outcomes assessment is onchanges that can be attributed to the educational treatmentsencountered by students as part of their higher education.However, most of the studies reported to date have either used nopretreatment measure at all or have used a cognitive levelestimated by an academic admissions test (SAT or ACT). Thehazards of this practice have been described by Banta, Lambert,Pike, Schmidhammer, and Schneider (1987), in the Council ofPresidents (1989) report, and in studies by Parscer and Thorndike(1989) and Thorndike, Andrieu-Parker, and Kube (1990).
The present study attacked the problem of changes in testperformance over the first two years of college experiencedirectly by using a pretest-posttest design. Since most concernsabout outcomes assessment have focused on general educationachievement rather than on learning in the major, the objectiveof this study was to assess cognitive changes from early in thefirst term of freshman year to the end of the last term ofsophomoro year, the period during which most students concentrateon general education courses.
Method
Subjects.. Subjects were obtained by drawing a random sampleof 300 from the pool all tirst-term freshmen (about 1500)enrolled in the university in October of 1988. These studentswere invited to participate in the study and were offered $35 for
Naik, doing so. Two hundred one (201) individuals appeared for

testing, and 197 completed the tests. In May of 1990 190 of tt-197 original participants were still enrolled at the universityLetters were sent to all of these students oftering them $50 totake part in the posttest. Of these, 135 responded.
Instrument. The academic achievement measure used was theCollege Basic Academic Subjects Examination (CHASE). "CollegeBASE is intended to assess content knowledge and skilldevelopment at a level commensurate with students completing thegeneral education component of their college experience. At mostinstitutions this will be near the end of the sophomore year."(Osterlind, 19891 p. 1). The instrument tests knowledge in toursubjects (English, Mathematics, Science, and Social Studies),which are further subdivided into nine clusters of 23 skills. Acomposite score representing overall competence and threereasoning competencies are also computed. The objective portionof the test has a three hour time limit, and most students finishwithin the time allowed. Scores are determined using an IRTmodel and are converted to a scale with a mean of 300 and SD of60. Criterion referenced scores in the three reasoningcompetencies (interpretive, strategic, and adaptive) are reportedas high, middle, and low.
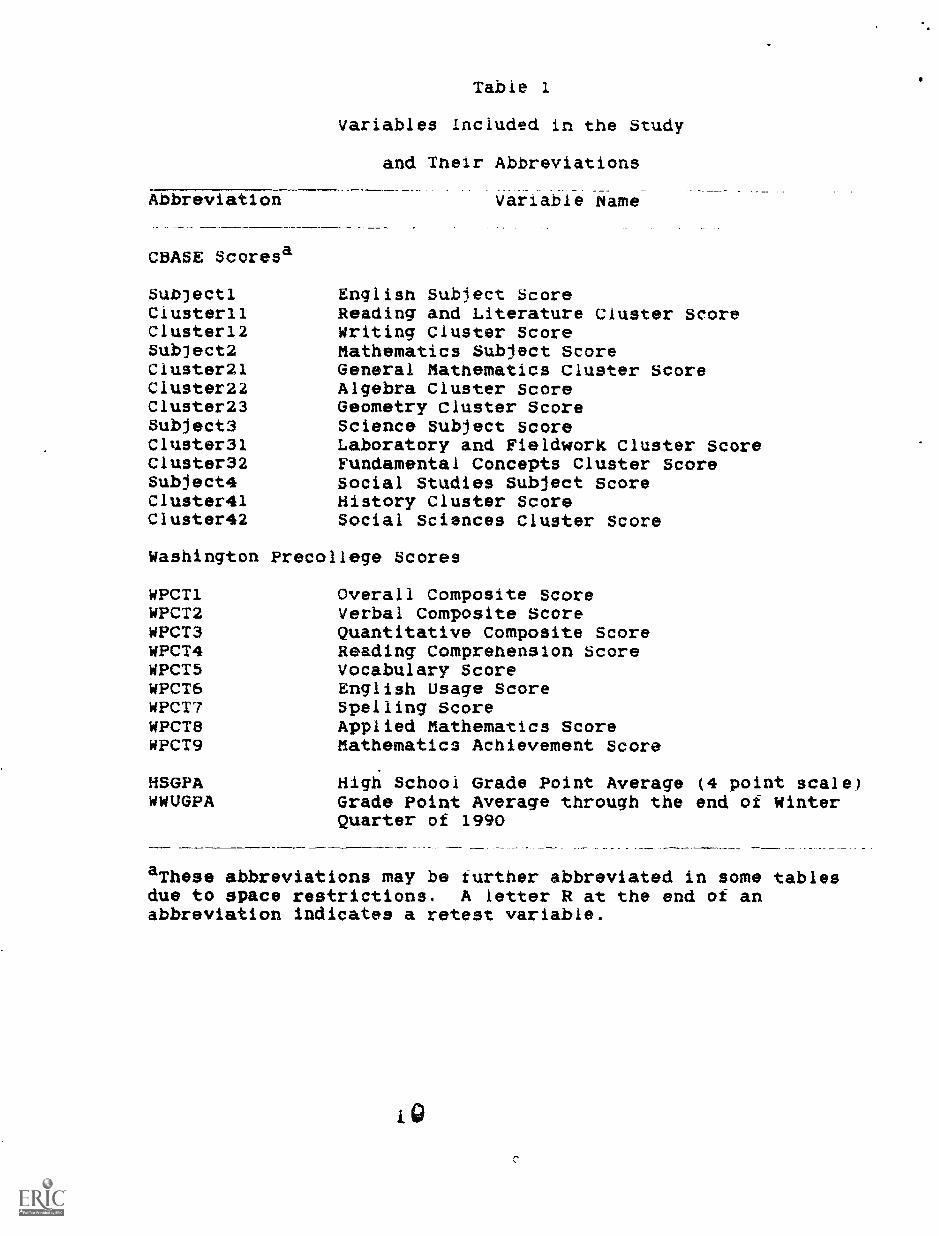
Procedure. At the pretest all subjects took the completeCBASE, including a writing sample. Each subject also filled outa questionnaire on reasons tor attending college, views ofeducation, and living arrangements. In addition, half of thesample completed the Reading and Math sections of the CollegiateAssessment of Academic Proficiency (CAAP) while the other halfcompleted the Writing and Critical Thinking sections of thisinstrument. Testing took six hours. In addition, collegeadmissions test scores on the Washington Precollege Test (WPCT)were obtained from university admissions records. At theposttest each subject again took the CBASE and the two CAAPsubtests that they had taken 18 months earlier. The writingsample and questionnaire were omitted. The posttest took fivehours. Only the portion of the study dealing with the CBASE andits relationship to background and demographic variables isreported here. A list of all variables together with theabbreviations used in the tables is provided in Table 1.
Table 1 about here
Results
The complete pretest group (N=197) received a mean compositescore of 299 with an SD of 49.5. The mean pretest compositescore for the 135 students who also took the posttest was 304with an SD of 48.7, indicating that the returning students wereslightly superior to those who did not return for retesting.Table 2 shows the mean pretest score, mean posttest score, meanraw change and standard deviation of raw change for the foursubject scores and the 9 clusters for the 135 subjects who
4

participated in both testing sessions. All analyses were carriedout on this group.
Table 2 about nere
The pattern shown here is one of general gain averaging about1/4 standard deviation, but with some notable losses. What isstriking about the changes is the size of the standarddeviations. Some subjects lost almost 200 scale points onretesting while others showed relatively iarge gains. There wereno significant differences between ran and women in the amount ofgain, but there were some differences at each test occasion.None of the CHASE variables were significantly related to any ofnonacademic background variables, so these variables will not bementioned further.
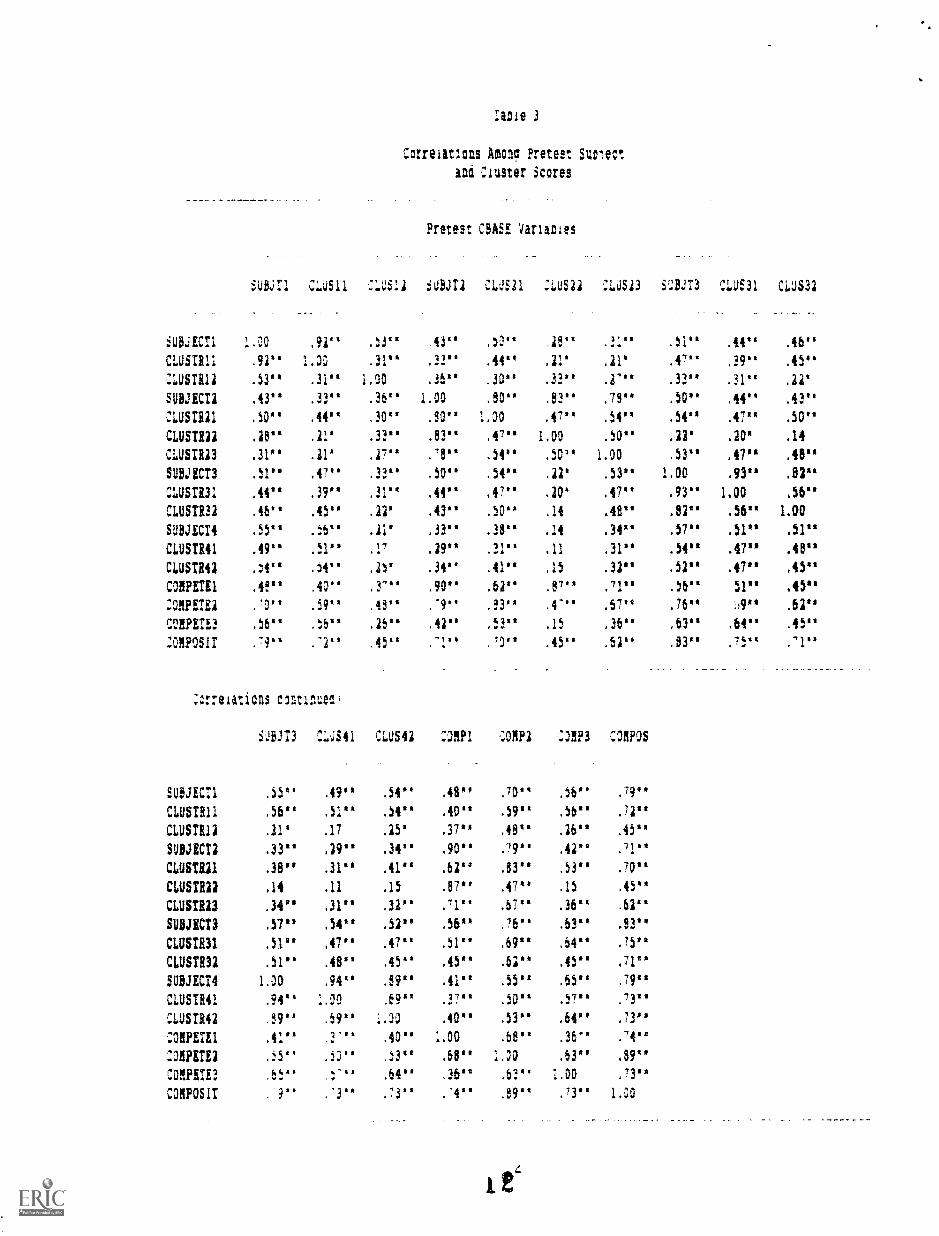
The correlations among the pretest scores for the CHASESubjects and Clusters are presented in Table 3. This table showsthe pattern ot generally high positive correlations that onewould expect to find among measures of academic ability orachievement. The noteworthy feature of this table is thegenerally low correlations of the Writing cluster scores with theSocial Sciences scales and the low correlations of the Algebracluster scores with both the Science and Social Studies scales.
Table 3 about here
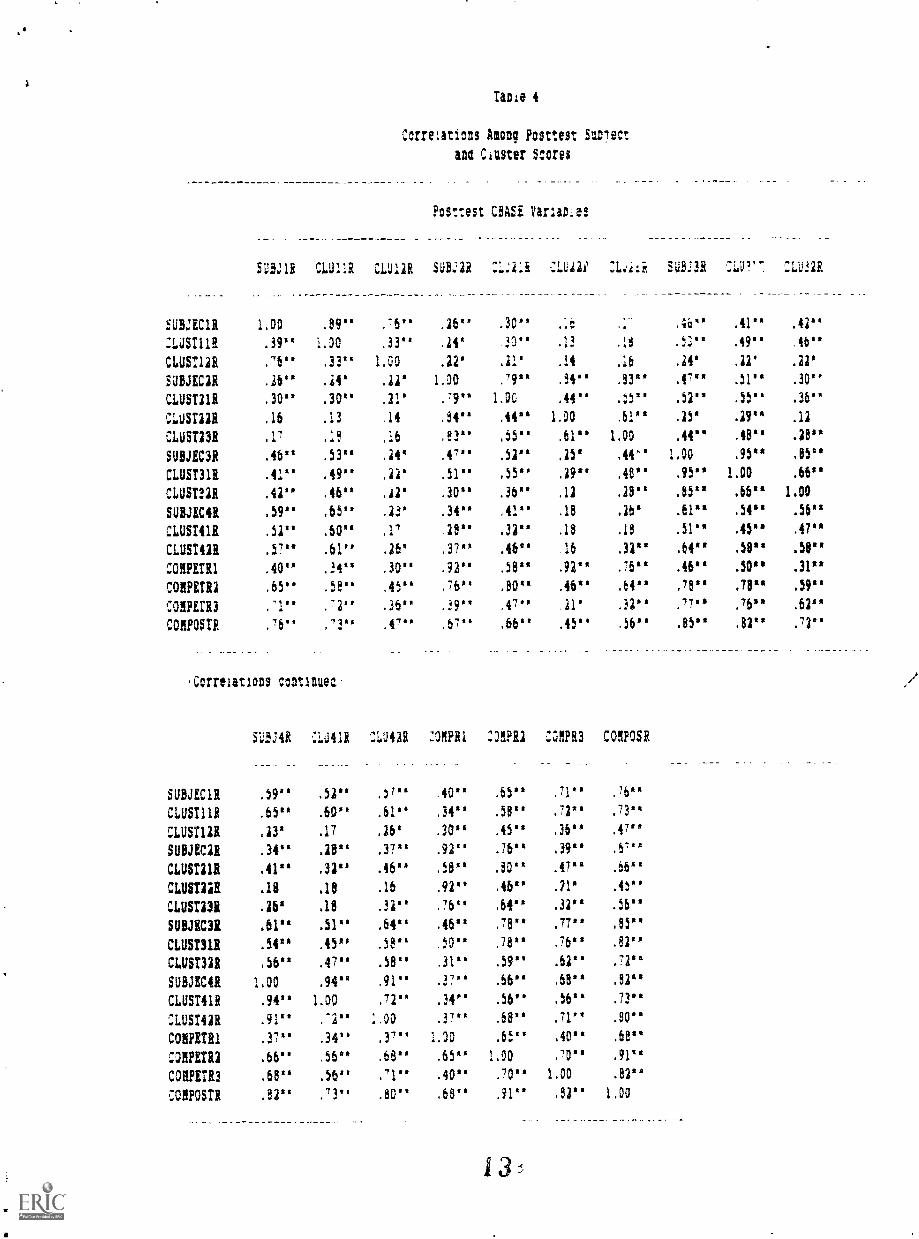
Table 4 presents the correlations among the posttest scoresfor the CHASE scales. These correlations are quite similar tothose in Table 3. In particular, the Algebra cluster continuedits low correlations with Science and Social Studies, but thecorrelations of Writing with the non-English scores dropped. Theimpression continues that scores are determined primarily by ageneral academic ability dimension.
Table 4 about here
The correlations of scores on the pretest with scores fromthe posttest are shown in Table 5. This table is of particularinterest because the diagonal values are the 18-month test-retestreliabilities of the CHASE Subject and Cluster scores. Thevalues run from a high of 0.85 tor the Composite score to a lowof 0.43 for the Algebra cluster score. The lowest subject areareliability is 0.67 for the Science area. Pretest Algebra doesnot correlate highly with the Posttest Science or Social Studiesscales. and posttest algebra does not correlate significantlywith much outside the Mathematics area, but the impressioncontinues to be one of a single broad general academic ability.
5
Table 5 about here
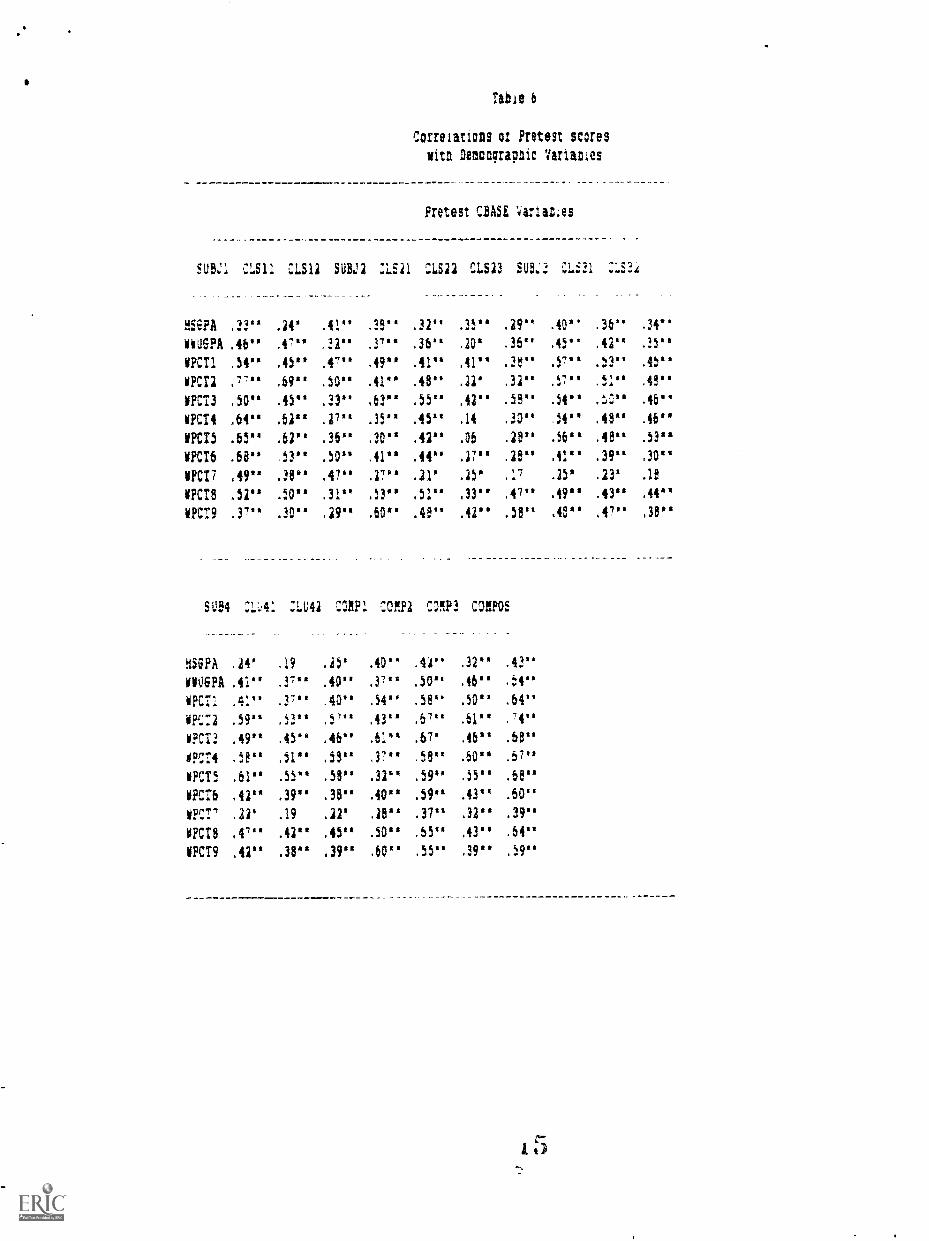
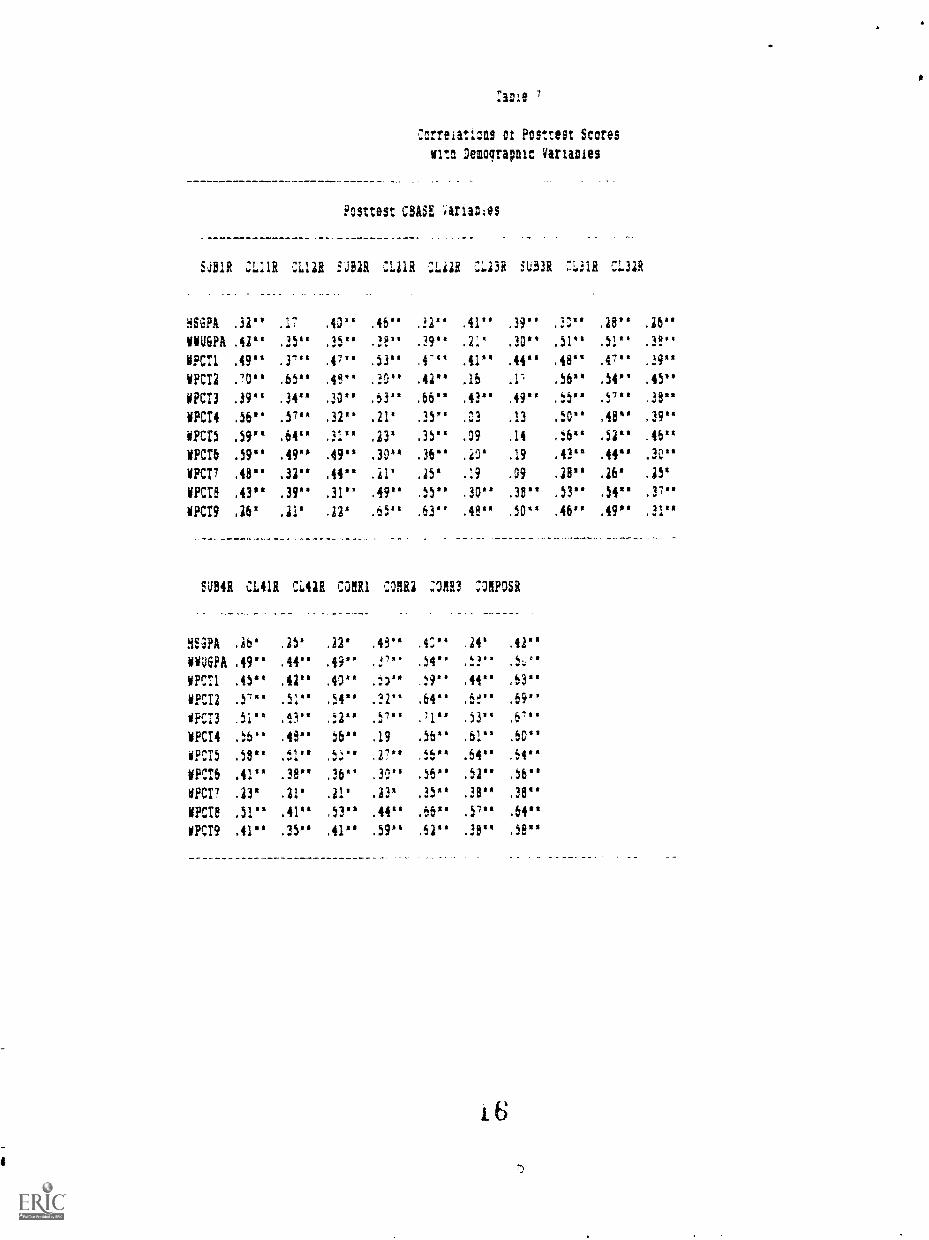
The correlations of Pretest and Posttest CHASE scores withhigh school Grade-Point Average, University Grade-Point Average,and admissions test scores with are presented in Tables 6 and 7.As one would expect, all of the correlations are positive, butmany of them are surprisingly high.
Tables 6 and 7 about here
Two features are quite striking in these tables. First, theWashington Precollege Test scores correlate more highly withCHASE scores than do either high school or college grades. Sincein most cases the Washington Precollege Test was taken at the endof sophomore or beginning of junior year in high school, theaverage interval between these test scores and the CHASE pretestis about two years and the average interval with the posttestCHASE is about 42 months. The intervals between the CHASE andgrades is much shorter. The high correlations of CHASE with WPCTover such a long time interval indicate a substantial equivalencebetween the CHASE and some aspects of the WPCT.
The second striking feature is that, for the VerbE composite(WPCT2) and the Quantitative Composite (WPCT3), the cLcrelationswith the verbal (English) and quantitative (Mathematics) sectionsof the CHASE are about as high as the test-retest correlations,even though the time interval is twice as long.
-
Tables 8 and 9 present the correlations of raw change scoreson the CHASE with the pretest and posttest scores. what thesetables reveal is the expected pattern of negative correlations ofgains with pretest scores and positive correlations of gains withposttest scores. That is, people who start out above averagetend to show less growth than people who start out below average,and people who show larger amounts of growth tend to achievehigher posttest scores than people who show small or negativegrowth. The other noteworthy feature of these tables isspecificity of the relationships. Very few significantcorrelations occur outside a particular subject matter. Forexample, only two of the correlations of English subject orcluster gain scores with gain scores from other areas reach 0.20.Of course, this observation does not hold with the part-wholerelationships with competencies or the composite score.
Tables 8 and 9 about here
To explore the structure and the stability of structure of
4
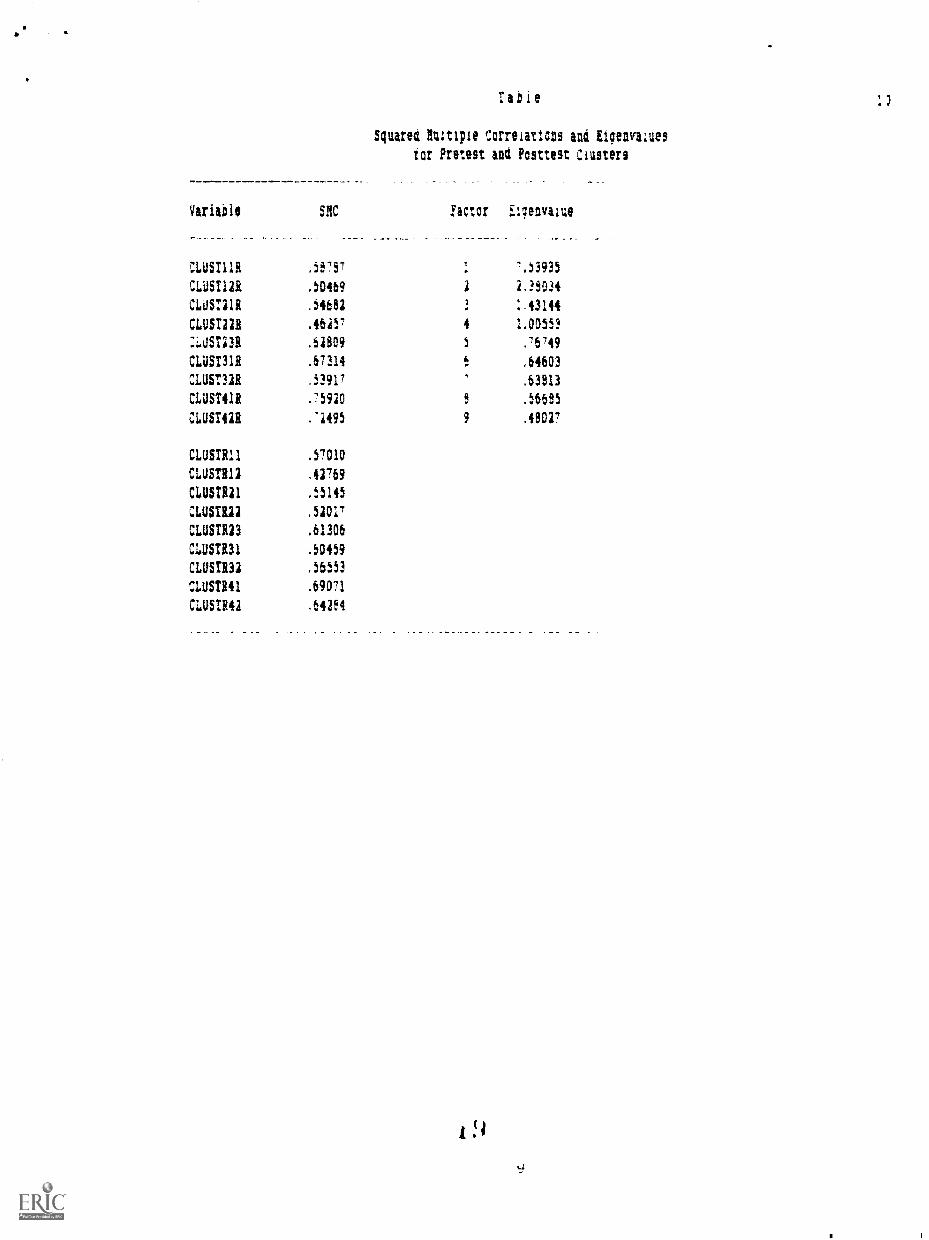
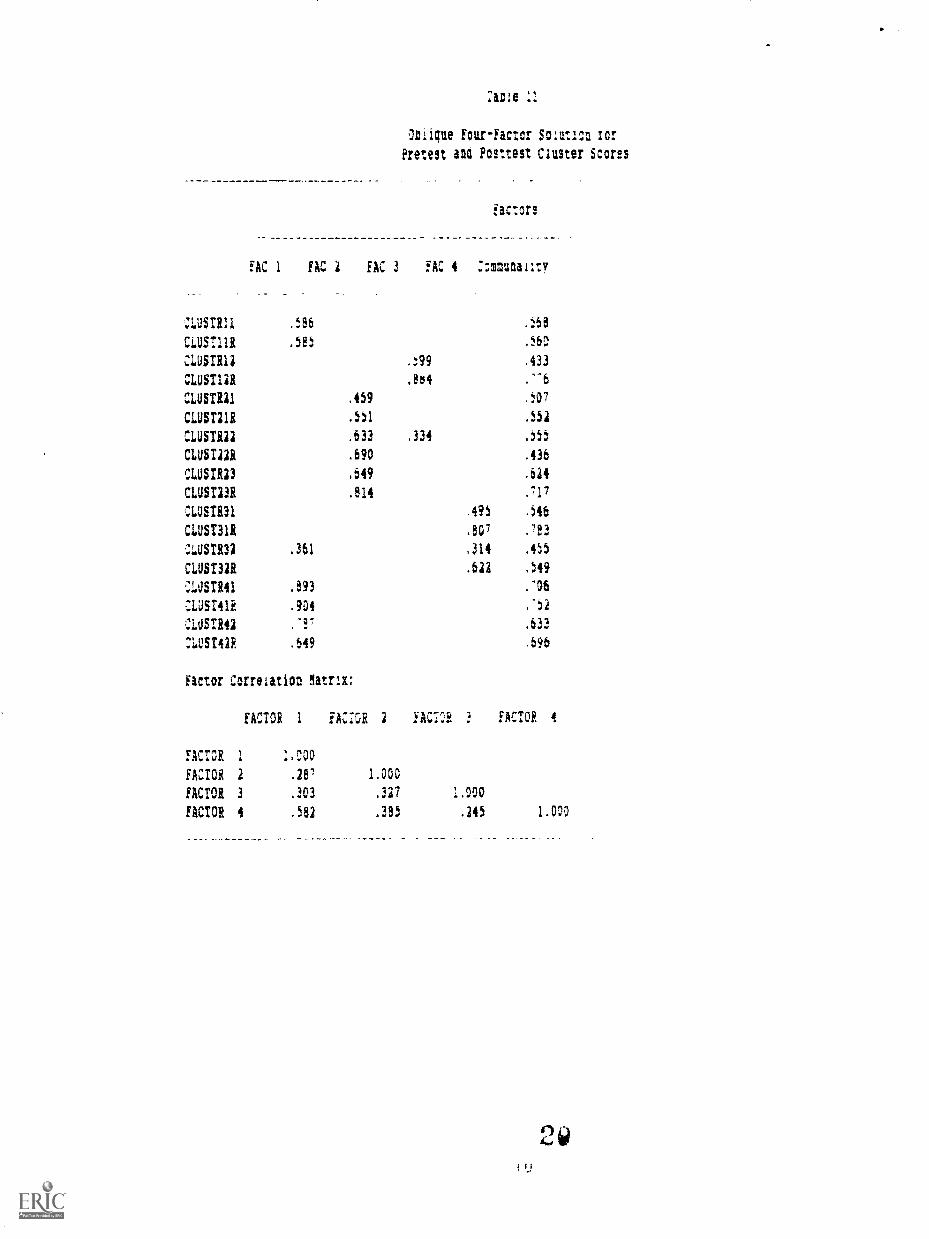
the CEASE. the pretest and posttest clusters were factor analyzedtogether. That is, the nine pretest clusters were combined withthe nine posttest clusters and the resulting 18x18 correlationmatrix was factor analyzed using principal axis extraction withsquared multiple correlations as initial communality estimatesand iterating for the communalities with tour factors. Theresulting factor matrix was rotated by oblimin. The eicrenvaluesand SMCs are presented in Table 10, and the oblique patternmatrix and final communalities are given in Table 11.
Tables 10 and 11 about here
Both the Kaiser/Guttman criterion and the scree test clearlyindicate tour factors; however, both the SMCs and eigenvalues areprobably inflated by virtue ot including pretest and posttestvariables in the same matrix. Because the design of theinstrument also called tor four factors, this was the numberkept.
The pattern revealed in Table 11 shows reasonablecorrespondence with the design ot the instrument and goodstability of the test over time. The only serious problem is thefractionation of the English clusters into a Writing singlet anda Reading and Literature primary loading on the Social Studiesfactor, but these may not be unexpected on content grounds. TheMathematics clusters form one clean factor and the Scienceclusters form another. The correlations among the factors arenot excessive, indicating reasonable separation of the subjectareas.
Discussion
It has been noted elsewhere (Council of Presidents, 1989)that college level assessment measures such as the AcademicProtile, College Outcome Measures Program, and CollegiateAssessment of Academic Proficiency are high quality instrumentswith good reliability but that they add little to informationthat is available from other sources such as college admissionstests and grades. The present results indicate that the sameconclusions apply to the College Basic Academic Subjects Exam.
The 18-month test-retest reliabilities, particularly of thesubject, cluster, competency, and composite scores, are verysatisfactory. In fact, they may be too high for an instrumentthat might be used to measure growth as a result of academicexperience. Stability coefficients in the 70s and 80s over thisperiod indicate highly stable general characteristics ofindividuals, characteristics that are unlikely to be modified toa significant degree by collegiate academic experience. Thisconclusion is also supported by the high correlations with theWashington Precollege Test scores which, although they have asubstantial achievement component, are still primarily academicaptitude measures. The relevant CEASE scores correlate just
about as highly with the WPCT over 36 months as they do withthemselves over 18 months. If general academic aptitude werepartialled out of the CBASE scores, the correlations among themwould be very low, indicating that the test is a reliable measureof little other than what is measured by the WPCT. (It should benoted that the WPCT, which is no longer being published, was moreachievement oriented than the SAT and perhaps more so than theACT.)
Correlations provide interesting and usetul information aboutan instrument, but they do not address the issue ot assessingchange very well. At the program or institution level this ismost directly a matter ot what happens to the mean scores. Inthe present study the CBASE subject scores showed growth in allareas and the cluster scores showed growth in most, the onlyexceptions being a small loss in algebra and a larger loss inwriting. However, it is the standard deviations of the changescores that are most alarming. They indicate, and this isconfirmed by the frequency distributions, that on each scale over40 percent of subjects showed losses. While a few small lossesmight be expected due to regression effects, there were a numberof subjects who lost over 30 points (about one-half standarddeviation).
It is hard to argue that exposure to a college education willresult in a loss of knowledge, particularly on a test explicitlydesigned to assess gains due to that education, so we must lookfor some other explanation. The most obvious reason why studentswould get lower scores on the retest is that they did not takethe task seriously. First-term freshmen are often compliant.when told to do their best on some task. they are likely to putout a reasonable effort. By the time they have been jaded by twoyears of college they are less likely to work hard at a task likethe cBASE unless they have a personal stake in the outcome. Verytew assessment measures are used in such a way that the students'scores will affect them in a meaningful way. Some, perhaps most,will take the task seriously and make an honest effort to get agood score. But our results indicate that a substantial numberwill do only what is necessary to complete the task in theminimum time.
If assessment results were to be used on the local campusonly, and then only for program improvement, the presence of evena moderately large number of inaccurate test results would not bea problem. Unfortunately, when test results are used by externalpolicy makers, particularly when they are used to compareinstitutions to provide a basis for funding, even a small numberof seriously inaccurate test results can have significant adverseeffects. This problem was also noted by Council of Presidents(1989), but the present study extends the demonstration of theproblem to the analysis of growth. Thus, to the traditionalproblems associated with growth scores, negative correlationswith initial status and the inherent unreliability of differencescores, must be added the problem of changes in studentmotivation.

Reterences
Astin. A. W. (1985) Achieving educational exceklence:_ A criticalassessment ot priorities and practices in higher education.San Francisco: Josey-Bass.
Banta, T. W. & Fisher. H. S. (1987). Putting a premium onresults. Educatignal Record, 67, 57-69.
Banta, T. W., Lambert, E. W., PiKS, 0. R., Scnmidhammer, J. L.. &
Schneider, J. A. (1987). EstimatiAlg student gains on the ACTCOMP exam: Valid tool tor institutional assessment? Reviewot Higher Education, 27 195-217.
Council of Presidents and State Board tor Community CollegeEducation. (1989, September). The va.lidity aad usefulness otthree nation standardized tests tor measuring thecommunication, computation, and critiial tin skills ofiasiingtopitate college sophpmores: Technical report.Bellingham, WA: Wesiern Washington University Office ofPublications.
Osterlind, S. J. (1989). College BASE guide to test content.Chicaao: The Riverside Publishing Company.
Parker, J. M. and Thorndike, R. M. (1989). Effects of age andeducation on cognitive development. Annual Meeting of theAmerican Educational Research Association. San Francisco.
Thorndike, R. N.. Andrieu-Parker, J. M. & Kube, B. Impact of liteexperiences on cognitive development. Annual Meeting of theAmerican Educational Research Association. Boston.
Abbreviation
CHASE Scoresa
Subject1CiusterllCluster12Subject2Ciuster21Cluster22Cluster23Subject3Cluster31Cluster32Subject4Cluster41Cluster42
Table 1
Variables Included in the Study
and Tneir Abbreviations
variable Name
English Subject ScoreReading and Literature Cluster Scorewriting Cluster ScoreMathematics Subject ScoreGeneral Mathematics Cluster ScoreAlgebra Cluster ScoreGeometry Cluster ScoreScience Subject ScoreLaboratory and Fieldwork Cluster ScoreFundamental Concepts Cluster ScoreSocial Studies Subject ScoreHistory Cluster ScoreSocial Sciences Cluster Score
Washington Precollege Scores
WPCT1WPCT2WPCT3WPCT4WPCT5WPCT6WPCT7WPCT8WPCT9
HSGPAWWUGPA
Overall Composite ScoreVerbal Composite ScoreQuantitative Composite ScoreReading Comprehension ScoreVocabulary ScoreEnglish Usage ScoreSpelling ScoreApplied Mathematics ScoreMathematics Achievement Score
High School Grade Point Average (4 point scale)Grade Point Average through the end of WinterQuarter of 1990
aThese abbreviations may be further abbreviated in some tablesdue to space restrictions. A letter R at the end of anabbreviation indicates a retest variable.

Table 2
Mean Pretest, Posttest, and Change Scores
and SD of
Tested
Changes tor 135
on Both Occasions
MeanPosttest
Students
MeanChange
SDChangeScore
MeanPretest
English 293.7 306.3 12.7 44.4Reading 289.9 306.2 15.9 53.6Writing 329.2 305.9 -23.3 36.6
Mathematics 324.4 332.6 8.2 43.5Gen math 285.5 305.9 29.4 55.1Algebra 333.5 331.6 -1.9 46.7Geometry 335.1 337.6 2.5 41.2
Science 306.3 323.2 16.7 56.8Lab work 298.4 317.2 18.8 56.9Fundament 316.0 318.8 2.8 55.9
Social Studies 291.6 326.3 34.7 44.6History 292.0 322.8 30.8 40.5Soc Sci 293.0 320.9 27.9 44.0
e__
II
SUBJECTI
CLOST111
CLUSTIll
SUBJECT2
%HIMCLUSTR22
CLUSIR23
SUL=CLUSTR31
CLUSTR32
SUBJECT4
CLUSTR41
CLUSTR42
CONPITE1
CORPETE2
C4IPETS3
:omposir
rule 3
Correlations Among Pretest Suelect
am Cluster Scores
Pretest CMS! Varianies
SULtl C1.US11 S12 V8.111 CI,J$21 CLuSli CLJS23 SUBJ73 CLUS31 CLJ$31
.43" .5" .25" nIl.r. .511* .44" .46"
.92" I.D0 .31" 21lis .44" .21' .21* .47" .29" .45"
.53" .31'1 1,00 .35" .30**32"
.21** .33" .31" .31'
.43" .33" .36" 1.00 .50" .53" .75" .50" .44" .43"
.54" .44" .30" .50" 1.04 .47" .54" .54" .47" .50"
.28" .21' .33" .83** .47" 1.40 .50" .221 .20' .14
.31" .21* .27** .71" .54** .50" 1.00 .53" .47" .48"
.51** .47" .33** .50" .54" .22* .53" 1.04 .93" .82"
.44** .39" .31" .44" .47" .10" .47" .93" 1,04 .56"
.46** .45** .12* .43" .54" .14 .48" .82" .56" 1.00
.55" .55" .11* .33" .38" .14 .34" ,57** .51" .31"
.49" .51" .17 .29" .31- .11 .31** .54" .47" .48"
.54" .14" .25* .34" .41" .15 .32" .52" .47" .45"
.45" .40" .37" .90" .62" .87" .71** .56" 51" .45"
.'0" .59" .45" ."9" .53" .4'" .67" .76" A" .62**
.56" .55" .15" .42" ,53" .15 ,36" ,63" .64" .45"
.79" .'1" .45" .,0" .45" .62" .53" .75** .71"
rrelations contlnuen,
Sa03 CLJS41 CLUS42 C0RP1 C0RP2 :3S123 CMOS
SU8JECT1 .55" .49" .54" .48" .70" .56"
CLUSTR11 .56** .51** .54" .44" .59** .56** .72"
CLUSTR12 .21* .17 .25' .37" .48** .26" .45"
SUBJECT; .33** ,29** .34" .90" .79" .42" .11..
CLUSTR21 .38" .31** .411' .61" .53" .53" .70"
CLUST1112 .14 .11 .15 .87" .47" .15 .45"
CLUSTR13 .34" .31** .32" .71" .67" .36" .61"
SUBJECT3 .57" .54" .51" .56" .76" .63" .83"
CLUSIR31 .51" .47" .47" .51" .69** .64" .75"
CLUSTR31 .51" .48" .45" .45" .62" .45" .71"
SU8JECT4 1.04 .94" .89" .41" .55" .65" .79"
CLUSTR41 .94" 1.00 .69" .37" .50** .57" .73"
CLUSTR42 .59" .59" 1.00 .44" .53" .64" .73"
CORPE7E1 .41" .2"" .40** 1.00 .68" .36" .74"
CO9PETE2 .55** .53** .53" .68" 1.00 .63** .59"
C0IPITE3 .55" .64" .36" .53** 1.40 .73**
COMMIT . 3" .'3" .73" .'4" .59"
7911 tit
t t`
73 t 1.04
Tule 4
Correlatinns Among Posttest Su07ect
IN Caster Scores
Posttest CBASE Varlaolas
5UBJ11 CLU111 CLULIA :Lulu 21,41:i SUB:3R :LP. 1.21.1132R
iU3:EC1R 1.00 .89" .26" .30" .4a" .41** .42"
:1.41STII! .99" 1.30 .33" .142 33" .13 .18 .53" .4912 .46"
CLUSTUR .33" 1.00 .22' .11* .14 .16 .14 .12* .222
SUBJECH .26" .342 .212 1.30 .19" .94" .93°' .41°' .51" .30"
CLUST311 .30" .30" .21' .79" 1.00 .44" .5522 .51" .5522 .36"
CLUST12R .16 .13 .14 .84" .44" 1.00 .61" .252 .29" .12
CLUST13R .1, .13 .16 .83** .5512 .61" 1.00 .4422 .48" .28"
SUBJEC3R .46" .53" .24" .41" .52" .25* .44** 1.00 .95*. 35**
CLUST31R .41" .49" .11' .51" ,552" .29" .4822 .95" 1.00 .66"
CLUSTNR .43" .46" .122 .30" .36" .12 .28" .65" .66" 1.00
SUBJEC4R .59" .65" .23* .34°' ,41" .18 ./6" .61" .54" .56"
CLUST41R .51" .60" .17 18" .3222 .18 .1851" .45" .47"
CLU5T411 .57" .61" 16' .37" .46" 16 .31" .6421 ,58" .5122
C0RPETR1 .40" .34" .30" .92" .58'2 .92" .76" .46" .50" .31"
CONFE112 .65" .58" .45" .76** .80" .46" .84" .78" .78** .59"
CONFET113 .72" .36" .39** .47** .11* .32** .77" .76" .62"
CORPOSTR .76" .13" .47" .67** .66" .45" ,5611" 35" 32" .11"
.CurelatIons contInuem
SUBJ4R ::.t1411 :14U42R :ORPR1 :D1PR2 2211,13 COUCH
SUBJEC1R .59" .51" ,3722 .4022 .65" .71** .76"
CLUSTUR .65" .60" .61" .34" .5022 .72" .73'2
CLUST121 .232 .17 .162 .30" .45" .3622 .47"
SUBJEC31134"
.282' .37" .92" .76" .39" .61"
CLU$T11R .41" .32" .46" .58" .8022 .4712 .66"
CLUIT121 .18 .18 .16 .92" .46" .71' .45"
CLUSTUR .16° .18 .31" .16" .642' .32" .56'2
SUBJEC311 .61" .51" .642* .46" .78" .77" .85°'
CLUST311 .54" .45" .58" .5022 .78" .76'8 .82"
CLUST311 .56" .47" .58" .31" .59" .62" .7222
SUBJEC4R 1.00 .94" .91" .37" .66" .68" .82"
CLUST41R .94" 1.00 .72" .34" .56" .56" .73"
CLUST42R .91" :2'2 1,00 .37" .68" .71" .90"
CORPETR1 .37** .34" .37" 1.00 .65** .40" .68"
CORPETR1 .66" .56" .68" .65" 1.00 .10" .91"
CORPETR3 .68" .56" .402s .70" 1.00 .83"
CORPOSTR .82" .13" .80" .68" .91" .81" 1.00
113:,

0orreatiots of Pretest Scores
into Posttest Scores
Pre2:est :BA!! Varlacies
Posttest
:BASE
iarlaoles SUBJr1 :LUS11 :USN 5aJI1 :Lan :US21 :LUS23 SUBJr3 1"..JS31
SU3JEC11 .6922 .6022 .4222 .402* .41" .1" .2922 .48°' .44** .36"
CLUSTUR .6122 .60" .15 .262 .36" .04 .26' .48" .43" .42"
CLUST11R .52" .38" .:9" .41" 34" .41" .24' .19" .28" .17
5UBJIC2R .19" .122 .25' .72" .56" .54" .56" .48" .48" .3522
CLUST11R .36" .2922 .1" .61" .54" .39" .58" .51" .51" .372*
CLUSTUR .16 .10 .18 .4922 .35" .42" .412* 15' ,2722 .15
CLUSI23R .212 .16 .19 .64" .48-2 .47" .65" .45" .44" .35"
SUBJEC3R .53" .47" .32" .45" .45" .122 .50" .67" .64" .51"
CLUST311 .50" .4322 .31" .442' .45" .21' .50" .64" .63" .46"
CLUST32R .46" .41" .1722 .35" .33" .18 .41" .5422 .49" .46"
SUBJEC4R .60" .63" .20' .212' .34" .14 .35" .53" .43" .5322
CLUSI411 .56" .59" .16 .27" ,1822 .12 .29" .46" .34" .51"
CLUST42R .55" .57" .23' .23" .35" .14 .39" .512' .41" .46"
C0OPEIR1 .32" .25' .20" .54" .40" .52" .55" .442* .4422 .31"
COOPETR1 ,64" .55" .3622 .64" .54" .4422 .54'2 .6722 .652* .51"
C3RPEIR3 .58" .:5" .322* .222' .3!.. .1: .35.457.1 .57" .39"
CCIPOSTI .6822 .63" .29'2 60" .5-'2' .:9" .70" .6522 .58"
.Ccrrefations continua.
SU8J:4 :LJS41 :1..$42 :)NP1 :ORP1 C04P3 MVOS
SUBJEC1R .532" .47" .51" .42" .57" .57" .66'2
CLUSI11RXS' .We .2718 Apo .62..
CLUSTUR .21' .15 .16" .40" 47" .3022 .0"SUBJ1C2R .31" X" .312* .55" .61" .39" .57"
CLUST21R .38" .31" .41" .56" 63" .44" 91'
CLUST221 .16 .15 .14 .46" .36" .23' .34"
CLUST131 .132 .202 .12' .60'2 .51" .30" .48"
SUMER .46" .44" .41" .44" .66" .51" .68"
CLUST31R .41" .38" .36" .43" .64" .49" .64"
CLUST32R .41" .39" 37" .36" .5222 .43" .67"
SUBJEC4R .79" .75" .E22 .39" .51" .54" .712'
CLUST41R .7522 .752* .61" .36" .42" .46" .65"
:LUST42R .70,. .62.. .63. .37.. .64.. .63.. .68..
C01PETR1 .2322 .39" .32" .63" .39" .552*
CORPETR2 .57" .52" .542' .66" .8122 .:922 .8322
COMM .59" .55" .51" .2322 .59" .63" .66"
APOSIR .68" .63" .53" .6122 ."6" ,16" .852'
rata 6
Correlations or Pretest scores
witn Demonirrapnic Varianies
Pretest CBI& lierimes
SUB.:1 CLS11 C1.512 511502 C.1.521 C1.523 508.3 C1.i31 :Lza4
msePA .1r, .242 .41" .3821 .32" .3511 .29" .40" .36" .34"
WEIDA .46" .47" .32" .311 .36" .36°' .452' .42" .35"
wPCT1 .54" .45" .41" .49" .41" .41" .a!" .57" .53" .4522
wPCTi .77" .69" .50" .41" .48" .12* .31" .57" .51'1 A!"WPCT3 .50" .45" .33" .63" ,552* .42" .59" .54" ,ta:21 .45"
WPCT4 .64" .61" .17" .35" .45" .14 .30" .54'1 .48" .46"
WPCT5 .65" .51" .36" .3022 .42'1 .05 .28" .56" .4621 .53"
11PCT5 .58" .53" .50" .41" .44" .17" .28" .41" .39" .30"
WPCI7 ,4922 .38" .47" .27" .21' .15' .17 .15' .131 .18
Imre .5211 .5012 .31" .53" .51'2 .33" ,47" .49" .43" .44"
WPCT9 .37" .30" .29" .60'2 .46" .42" .58" .42" .47" .38"
5034 :LA: :LU42 20191 COM C093 CMOS
h55FA .14' .19 .152 .40" .411" .32" .43"
MEI .41" .3111 .40" .3722 .501' .46" .54"
wpCI1 .41" .37" .40" .54" .58" .10" .64"
WKT2 .5911 .53" .51I2 .4322 .57" .61" ,74"
wPCT! .49" .45" .45" .51" .67' .46" .68"ocr4
wPC.T5
.58"
.51'2
.51..
.55"
.58..
.51"
.378.
.32"
.58.,
.591'
.50..
.55"
.57..
.66"
WPCT6 .42" .39" .38" .40" .59" .43" .60"
WPC:" .22' .19 .22' .26" .37R* .32" .39"
wPCT8 472* .42" .45" .50'2 .8511 .43" .6412
WPC79 .42" .38" .39" .50" .552R .39** .59"
:icle
:orrelitionS or Posttest Scores
win pemograpalc Varlioies
Posttest CBAS! arlmes
SJER 01.118 :1.11R .5,031R CUIR 0L21R :1.138 51.,3311 7.1.31R C1.31R
HSEPA .32" .17 .40" .46" .22** .41" .33s* .30" .18" .16"
wlfill .42" .35" .35" .28" .39** .2;* .30" .51" .51" .3!"
linT1 .49" .31" .47" .53" ,4-" .41" .44" .4922 ,47" .2922
WITT1 .70" .65" .45" .20** .41" .16 .1, .56" .54" .45"
07013 .39" .34" .30" .63" .66" .43'2 .49" .55" .57" .382'
WPCT4 .56" .57'' .32" .212 .35" .03 .13 .50s* ,48" .39"
wpm .59" .64" .31" ,232 .35" .09 .14 .642 .51" .46"
WPCT6 .59" .49" .49" .30** .36** .10' .19 .43'2 .44°' .30"
WPCT7 ,48" .32" .44" .11s ,15* .:9 .09 .18" .16' .15*
WITTO .43" .39" .31" .49" .55" .30" .38" .53" .54" .37"
enT9 .16' .11' .12' .65" .63" .45" .50'' .46" .49" .31"
SH4R CIAIR CL41R cam C0R1 00883 0081,058
H.8011 .15* .25* .12* .45" .4:s' .14' .42"
WeNPA .49" .44" .49" .27" .54" .t2" .5s*
WPCT1 .45" .42'4 .40" .55" .53" 44" .63"
ePCI1 X" .51" .54" .22" .64" .6** .69"opcI3 .51" ,13., .51" .57" .71" .32.
VITT4 .56** .48" 56" .19 .56" .61** .60"
oPC75 ,58" .51" .5S" .27" .58** .64" .54"
WPCT6 .41" .38" .36" ,30" .56" .51" .56"
10017 .23' .21' .11' .13' .35" .38" .38"
WPM .51" .41" .53" .44" .66'2 572' .5422
01)0T9 .41" .35" .41" .59" .61" .38s* .58"

rule 5
:orrelatlons oi Pretest Scores
witn Comes
:once :: 5,1:7ect or :luster 5ccre
501: :LUC 01.11: 502: :1.11: :1.130 5:43: :1.3I: :1,32c
51152ECT1 -.41" -.30" . ,4-.14 -.13 .05 .1 .01
:Larall -.41- -.39" .15 -.14 -.14 -.11 -,05 .03 .36 -.01
,01.D5TRI2 -.15 -.14 -.15 -.14 -.52 -,I6 -.09 .01 .01 .04
S3JECT1 -.05 -.06 .19 -.36" -.13 -.37" -.I! -.33 .01 -.07
:1,11$1121 -.11 -.06 .1: -.31" -.45" -.14 -,56 -.DO -.00 -.16
CLUSTR11 -.31 -.17 .10' -.38" -.:6 -.59" -.02 .01 .01 .03
CLOSI113 -.03 .06 .05 -.16 ,05 -,11 -.39" -.00 .04 -.06
5UBJECT3 -.05 .04 .06 -,01 -.02 .00 -.08 -.35" -.32" -.14'
CLUSTR31 -.00 07 .07 .05 .05 .04 -.11 -.31" -.40" -.06
CLUSTR31 -.13 -.00 .01 -.09 -.11 -.01 -.14 -.33" -.11 -.49"
SULAM -.04 ,07 .07 -.01 .00 .00 -.12 -.10 -.10 -.07
CLUUR41 -.04 .08 .04 -.02 .01 .02 -.12 -.09 -.08 -.08
CLUSTR42 -.03 .04 .10 -.53 .00 -.01 -.11 -.10 -.11 -.07
:01PETE1 -.58 -.11 .17 -.32" -.05 -.44" -.10 -.10 -.08 -.08
c0mITE2 -.17 -.09 .16 -.23' -.19 -.14 -.18 -.08 -.04 -.09
0.519EIE3 -.00 .39 .13 -.33 -.05 .05 -.37 -.11 -.16 -.01
CO8P051I -.17 -.06 .15 -.19 -.14 -.15 -.15 -.11 -.13
504C CL410 C1.42: :DEC :031C :583C 7.111.Ct
5UBJE:71 .12 .0! .07 -.17 .02 .10
.14 .09 -.16 .05 .05 -,17
CLU51111 .01 -.00 .01 -.07 -.09 .11 -.ID
500JEC12 .00 -.02 .01 -,30" -.01 -.04 -.19
CLUSTR21 -.03 -.04 -.52 -.17 -.16 -.09 -,142
CLUSTR22 .03 .03 .00 -.39" .03 -.0) -.14
CLUSTR23 .04 -.04 .11 -.19 .08 .05 -.06
SUL= -.02 -.11 .05 -.13 -.00 .00 -.24'
cusrm -.08 -.19 .04 -.06 .05 .00 -.18
CLU8T132 .06 .03 .03 -.17 -.56 -.Di -,26"
SUB1ECT4 -.26' -.29" -.16 -.0! .14 .01 -.19
CLUS1'141 -.23' -.37" -.03 -.35 .13 .06 -.17
CLUST143 -.24' -.13 -.32" -.08 .13 -.04 -.18
C0NFETE1 .01 -.01 .00 -.41" .08 .02 -.21'
CONFEIF.1 -.01 -.10 .06 -.17 -.11 .05 -.21"
C0RPETE3 -.12 -.15 -.07 .03 .07 -.30" -.12
CORPOSIT -.05 -.12 -.DO -.21' .04 .02 -.251

:101e 9
Correlations oi Posttest Scores
vitt :Dams
SUl: C1,110 :LIE
Ctanqe :n Siect or Cilster score
sun :Lilc :Laic :1.23C 3113C CL31C :Laic
358.31C1R .36" .33" .56" -.18 -.11 -.12 -.13 .00 -.03 .07
CLUSTUR .16" .48" .24' -.01 -.05 .08 -.08 .08 .08 .05
CLUSTUR .19" -.03 .70" -.35' -.13 -.17" -.09 -.03 -.05 ,54
SUBJECH -.04 .03 .05 .37" .24' .21' .23' .01 .04 -.04
CLOST21R -.07 .01 .02 .13' .49" .00 -.02 .04 .06 -.DO
CLUST221 '.00 .04 .01 .46** .10 .46** .15* .00 .02 ...01
CLUST23R '.04 .02 .01 .16" .08 .08 .43** .01 .06 '.05
SUBJEC3R -.10 .08 .01 .01 .08 .00 '-.06 .45" .38" .34*
CLUST31R ...11 .07 ..00 .09 11 .05 .00 .42" .44" .20*
CLUST32R -%05 .08 .03 ..06 .04 -.06 '.13 .41" .20* .53*
SUBJEC4R -.09 .05 .08 .04 .08 .02 -.10 .12 .14 .04
cusr41R -.11 .04 .05 .02 .05 .04 -.12 .08 .13 ..03
CLUST42R -.05 07 .59 .05 .12 .01 -.08 .17 .14 .13
C0RPETR1 .05 .11 .10 .40" .12 .33" .26" .05 .07 .00
C0NPITI2 .06 .05 .201 .11 .19 -.00 .00 .17 .17 .07
CONPETR3 ,V .33' .13 .09 .10 .09 -.04 .28** .24* .23*
CUPOSTR .00 .15 .10* .10 ,11 .05 '.01 .32* .11* .14
SU4C C1.41C CAE COM COEN C013C
FUBJEC1R .10 .05 .09 .02 .20* .11' .15
CLUST11R .11 .04 .11 .07 .24* .11* .19
CLUSIUR .56 .04 .03 -.05 .03 .13 .05
SUBJEC2R .05 -.00 .09 .17" .36** .04 .17
COST21R .07 --.00 .11 .00 .41" .10 .12
CLUST22R .03 .02 .03 .514' .241 .01 .31*
CLUST23R .04 .-.04 .12 .13 .31" .05 .11
SUBJEC31 1 .24' .07 .31" .31** .37** .30"
C11U5T31R .211 .05 .30" .03 .34" .38" .301"
CLUST32R .261 .10 .30" -.05 .21' .29" .1011
SUBJIC4R .30" .24' .331' -.01 .34" .14* .19
CLUST41R .35'i .321' .20" -.02 .30" .18 .14
CLUSr42R .37" .13 .47" --.00 .35" .30" .24*
CORPITR1 .09 .05 .09 .43** .30** .57 .25'
CONPER1 ,17 .54 .22* '-.00 .46" .31' .18
CORPED13 .18 .00 .29" .00 .29" .53" .29"
CORPOSIR ,261 .11 .28" .08 .39" .19" .17"
ranie 13
Squared luitipie Correlations and Elam:lies
for Pretest and Posttest Ciusters
Variable SIC !actor i4enialue
CLUSTI1R .59787 7.53935
CLUSTUR .50469 1 2.39034
CLUSI11R .54682 1 1.43144
CLUST22R .46157 4 1.00553
:i.1.18123R .61809 5 .75749
CLUST31R .67314 6 .54603
CLUST31R .53917 .63813
CLUST411 .75920 8 .55585
CLUST428 .'2495 9 .48027
CLUSTR11 .57010
=URN .42769
CLUSTR11 .55145
CLUST1111 .51017
CLUST1123 .61306
CLUSTR31 .50459
CLUSTR32 .56553
CLUSTR41 .69071
CLUSTR41 .64184
Tule :1
Onlione Four-Factor So:uticn tor
Pretest and Posttest Ciuster Scores
FAC 1 FAC 1 FAC 3
:Lunn .585
CLUSTUR .58!
FAC
:actors
4 C:mmunalm
.5,68
.550
CLUST112. .99 .433
CLOSTUR .064 .'-6
CLUST121 .459 .507
CLUST211 .551 .551
CLUSTR21 .633 .334 .555
CLUST22R .590 .435
CLOUD .649 .514
CLOSTUR .814 .717
CLOSTR31 .495 .545
CLUST311 .807 .783
CLUSTR32 .361 .314 .455
CLOST32R .612 .549
CLaT1141 .a93 .706
CLUST41R .904 .-51
CLOSTR42 '07. . .633
01.05142R .649 .696
Factor Correlation latrix;
FACTOR 1 FACTOR i FACTOR 3 FACTOR 4
FACTOR 1 1.000
FACTOR i .28, 1.000
FACTOR 3 .303 .327 1.000
FACTOR 4 .562 .385 .245 1.000