m eco 19/1 macquaie isa geoysica oseaoy aua eo 19 · macquaie isa geoysica oseaoy aua eo 19 b w...
TRANSCRIPT
BMR RECORD 1986/21
MACQUARIE ISLAND GEOPHYSICAL OBSERVATORY
ANNUAL REPORT, 1984
by
W.D. PROHASKY

CONTENTS
pageSUMMARY
1. INTRODUCTION ^ 1
2. GEOMAGNETISM ^ 2La Cour magnetograph ^ 2La Cour magnetograph tests ^ 2Photoelectric magnetograph system ^ 3Photoelectric magnetograph system tests ^ 4Magnetometers ^ 4F pier differences ^ 4Reference mark azimuths ^ 5Comparisons ^ 5Data reduction and publication ^ 6
3. SEISMOLOGYSeismograph ^ 7Seismograph calibrations and tests ^ 7Seismic data ^ 7Seismicity ^ 8
4. CONTROL EQUIPMENT ^ 9Timing ^ 9Power ^ 9Cables and wiring ^ 10
5. BUILDINGS AND MAINTENANCEPPM hut ^ 11Variometer and absolute huts ^ 11Seismic hut ^ 11Geophysics office ^ 11
6. OTHER DUTIES ^ 12
ACKNOWLEDGEMENTS ^ 12
REFERENCES ^ 12
APPENDICES
1. Geophysical observatory history ^ 132. Magnetic observatory intercomparison instruments ^ 15

TABLES
page
1. Station data for Macquarie^Island ^ 162. Parallax of La Cour magnetometer,^1983/4 ^ 163. Magnetograph parameters,^1983/4 ^ 174. Orientation comparison,^1978-1983 ^ 175. Reference mark azimuths ^ 186. Reference mark round of angle observations ^ 187. Magnetometer comparisons,^1984 ^ 198. Baseline values,^1983/4 ^ 199. Preliminary instrument corrections,^1983/4 ^ 2110. Preliminary monthly mean geomagnetic values and K-indices,^1983/4 2111. Geomagnetic annual^mean valves,^1974-1984 ^ 2212. Seismograph parameters ^ 2213. Attenuation settings^for helicorder amplifier AR311 ^ 2314. Seismograph magnifications,^21 March^1984 ^ 2415. Seismograph magnifications,^28 August^1984 ^ 2416. Macquarie Island earthquakes 1983/4 ^ 25
FIGURES
1. Macquarie Island photoelectric magnetograph system 2 62. Cabling between huts,^Macquarie^Island 273. Macquarie^Island SP-Z calibration curves,^1984 284. PPM hut,^Macquarie^Island 295. Geomagnetic huts,^Macquarie^Island 30

SUMMARY
Geomagnetic and seismological recordings were continued at the MacquarieIsland Geophysical Observatory during 1984. The work described in thisreport was part of the Bureau of Mineral Resources contribution to the 1984Australian National Antarctic Research Expeditions.
The photographic La Cour normal-run magnetograph was operated untilOctober 1984 and then replaced by photoelectric X,Y and Z magnetometers anda Proton Precession Magnetometer with data recorded in both analogue anddigital modes.
The seismograph comprised a short-period Willmore Mk II verticalseismometer and a visual drum recorder. Both were replaced by identicalreconditioned instruments on 24 October 1984. Five earthquakes were feltby expeditioners during the year.
Preliminary magnetic data was forwarded monthly to BMR Canberra.Preliminary seismic data was forwarded weekly to BMR Canberra until June,then weekly to NEIS, Denver, via the Bureau of Meteorology's GlobalTelecommunication System (GTS).
1. INTRODUCTION
The geophysical observatory on Macquarie Island has recorded geomagnetic andseismic activity since 1950. The observatory was operated by a geophysicistfrom the Bureau of Mineral Resources, Division of Geophysics, as part of theAustralian National Antarctic Research Expedition's (ANARE) station on theisland. Logistic support was provided by the Antarctic Division of theDepartment of Science. An outline of the observatory history is given inAppendix 1, and the coordinates of the magnetic and seismic stations arelisted in Table 1.
The author arrived at Macquarie Island on 18 October 1983 on the N.V. NellaDan to replace Peta Kelsey, and departed, also on the Nella Dan, on 26October 1984. The upgraded geomagnetic system and routines were taken overby the 1985 Officer In Charge, Phil Barnaart, with Dave Barret, the UpperAtmosphere Physics (UAP) engineer responsible for equipment maintenance.The upgraded seismic system and routines were handed over to the Bureau ofMeteorology team headed by Arthur Giese, with Kevin Shepherd, theMeteorological Technician, responsible for interpretation, reporting andmaintenance.
1
2. GEOMAGNETISM
The La Cour normal-run magnetograph was operated until 8 October 1984.Photoelectric magnetometers (PEM's) and an MNS 2.2 Proton PrecessionMagnetometer were installed and recording commenced on 24 January 1984for X and Y, 5 October for F, and 24 October for Z.
La Cour magnetograph
The La Cour normal-run (20 mm/hr) magnetograph system on Macquarie Island,described by Kelsey (1985), functioned satisfactorily during 1984 with atotal of 73 hours record loss. This loss occurred during installation ofthe PEM's, a power failure and faulty record changes. The quality of thephotographic records was occasionally reduced by incorrect recorder lidplacement and staining due to the sediment in the rinsing water used inprocessing. These were mainly problems for stand-in operators. Powerspikes produced when the inverter tripped out triggered the TMU2 timingcontrol unit, causing its minute counting system to jump forward, andnecessitating a correction of usually minus one minute. The presence of aCathode Ray Oscilloscope in the variometer hut during PEM installationcaused occasional, short-duration baseline shifts and trace instability.
La Cour magnetograph tests
PARALLAX
Ten parallax tests were performed during the year. The adopted parallax corr-ections are given in table 2; they compare well with Peta Kelsey's 1983 results.
SCALE VALUES
A magnetograph calibrator MC01 was used in conjunction with helmholtz coilsto determine H,D and Z scale values eight times monthly. Calibrationconstants and scale values are listed in Table 3.
TEMPERATURE COEFFICIENTS
Temperature coefficients listed in Table 3 were determined from linearregression analyses.
ORIENTATION
No orientation tests were carried out during 1984. The tests by Peta Kelseyin October 1983 gave acceptable results consistent with values obtained inprevious years (Table 4).
2

Photoelectric magnetograph system
DESCRIPTION
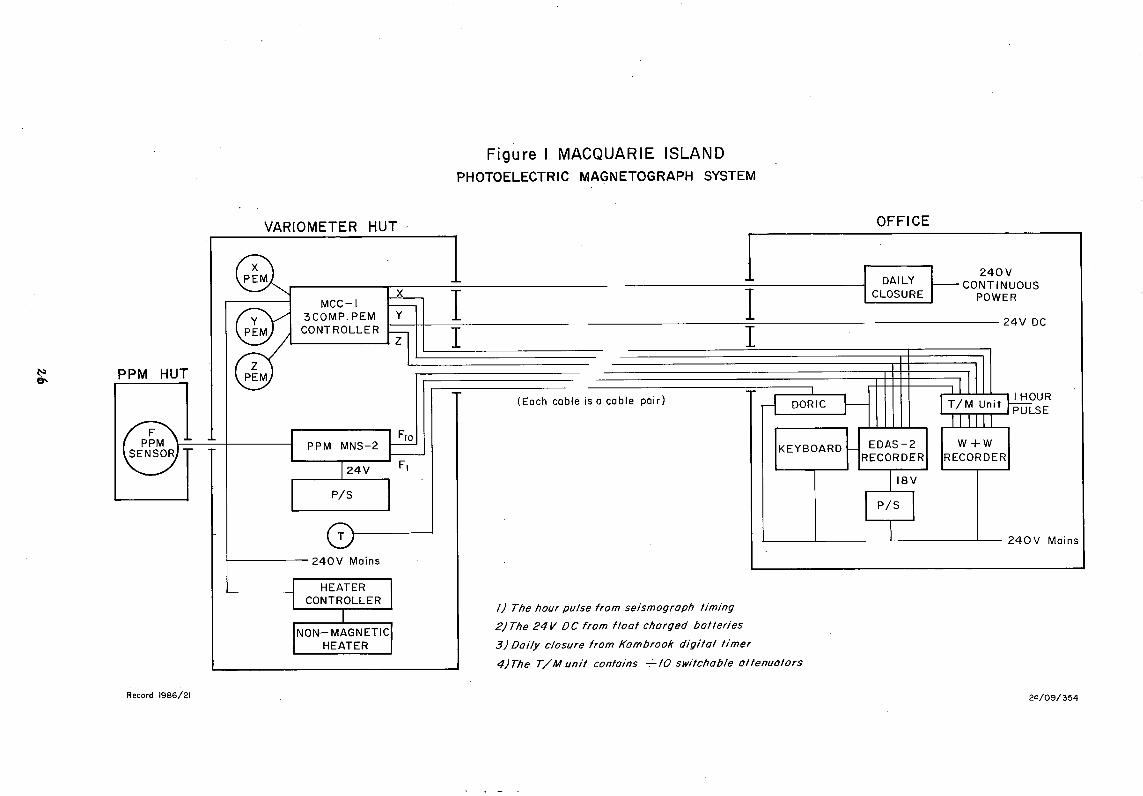
The PEN system consists of four variometers which monitor the geographicnorth (X), geographic east (Y), vertical (Z, positive downwards) and thetotal field (F) components of the geomagnetic field. The magnetographrecords the variations of these four field components in analogue mode at20 mm/hr on a 6 channel W+W chart recorder, and digitally as 1 minuteaverages on an Edas2 data logger with internal analogue to digital conversion.
The total field component was measured with an MNS 2.2 proton precessionmagnetometer previously used for absolute observations. It was recorded astwo components: 0-990 nT and 0-99 nT, due to the magnetometer's outputconfiguration.
Temperature was measured by a Doric with the thermistor near the X variometer.
X, Y, Z, F(0-990), F(0-99), and T were recorded on channels 1-6 respectivelyon both systems.
INSTALLATION
Figure 1 illustrates the layout of the entire PEN system. Of the three piersin the variometer hut, the westernmost pier supports the X variometer, theeasternmost pier supports the Y variometer, and the southernmost pier supportsthe Z variometer. The MNS electronics, its 24 V DC power supply and theMCC-1 3 component PEN controller were installed on the control room bench.
Orientation of the X and Y variometers was determined using the originalorientation marks in the variometer hut, and is accurate to 1/4 degree. Thethree levelling screws of each were secured in position using Polyfilla.
The setup of the X and Y circuit, boards was not without incident due tostatic sensitive integrated circuits and congestion of components near testpoint M5. Trace instability in the X PEM due to a faulty LED was rectifiedby a BMR technical officer, Greg Black, during the 1984/5 changeover. TheZ PEN was also installed at this time. Although a simple task for atechnician, the circuit board setup is a laborious task for an amateur.
Figure 2 shows the cabling between magnetic huts at the author's departure.All cables were installed in conduit buried to about 200 mm.
The Doric thermograph was calibrated using 1% resistors made up to 100K ohms(-I, +V), 1.602K ohms (+I, +V, 100°C, adjust Span), and 25.425K ohms (+I, +V,0°C, adjust Zero). The front panel switches were F,5,4,2,1 - on, 3 - offduring the calibration, and 5,4,2,1 - on, F,3 - off for normal operation.
The Dick Smith NDS-1 clock supplied with the system was unsuitable: the10 minute and I hour timing chips were incapable of delivering sufficientcurrent to drive the relay in the distribution box without malfunctioning,and power spikes continued to confuse the clock even after the addition ofan input filter. The NDS-1 was returned to HQ and 10 second duration hourpulses were taken from UAP's Systron Donner timing system.
3

Photoelectric magnetograph system tests
SCALE VALUES
X and Y scale value pulses of 39.5 mA were initiated through the MCC-1 PEMcontroller daily. Simultaneous temperature and Edas temperature counts werealso monitored daily.
PPM scale values were carried out twice weekly by recording 997-999 nT and0 nT.
Calibration constants and scale values are listed in Table 3.
TEMPERATURE COEFFICIENTS
The temperature coefficients listed in Table 3 were determined from linearregression analyses.
TIME COEFFICIENTS
There is a drift with time of X and Y PEM outputs due to detorsioning ofthe QHM fibres (see also Crosthwaite, 1986). The drift of the X PEM wasquite large at 0.3 nT/day, while the drift of the Y PEM was not significantover the four month period during which baselines were determined.
Magnetometers
Control observations for H,D,Z and F were made eight times monthly using thefollowing magnetometers:
H: QHM 177 (therm. 1083) (standard), 178 (therm. 618), and 179 (therm. 1651)D: Askania declinometer 640506 with circle 640616Z: BMZ 236 with thermometer 671F: PPM MNS 2.2
Observations of H and D were made on pier E; Z and F on pier W. Thereference mark for D was North Mark Inner (NMI).
Both the BMZ and PPM were used for absolute measurements until 10 August1984, when the PPM was installed For continuous operation. Data collectedfrom these observations between 01 November 1983 and 10 August 1984 wereused to determine accurate instrument corrections for the BMZ (Table 7).
F Pier differences
Seven sets of pier difference observations between pier W and pier E,consisting of ten alternating total field measurements, were carried outduring the year. The results consistently indicated the total field strengthat Pier W to be 1 nT greater than at Pier E.
One set of pier difference observations between pier W and pier N, in the
4

PPM hut, consisting of twenty alternating total field measurements carriedout on 8 August 1984, indicated the total field strength at pier W to be 9 nTgreater than at pier N.
Reference mark azimuths
Four sets of reference mark round of angle observations were carried outfrom pier E at regular intervals during the year. The observed angles fromall four observations agreed well with the angles determined in January 1982by surveyors from the Tasmanian Department of Lands (Table 5), (Ferguson,1985).
The PPM hut, built in August 1984, blocks the view from pier E to NMXI, theold auroral camera stand, so GOW, the timber in the centre of the largegeophysics office window, was adopted as a new mark.
A seasonal twisting of the pier of approximately 2 minutes in a west fromnorth direction from summer to winter is clearly indicated by theobservations. November 1983, February, May and August 1984 readings arelisted in Table 6.
Comparisons
During the October 1984 changeover, installation and modification of thePEM's left only one and a half days for comparison observations. Althoughthe magnetic field was very noisy on the first afternoon, one set each ofQHM and declinometer comparisons were completed, and later discarded whenthe results were found to be inconsistent. The field was quieter thefollowing day and the remaining three sets each of QHM and declinometercomparisons were completed.
X and Y baselines from these 3 sets of QHM comparisons are very scatteredwith standard deviations averaging about 30 nT. The PEM scatter seems tohave commenced during the 1984/5 changeover, as the 1985 baselines aresimilarly poor. Magnetic contamination during the confusion of a hecticchangeover may have also contributed to the scatter.
Applying first order linear corrections to the observed values of H gaveerrors almost as large as the instrument differences themselves, so no QHMcomparison results are listed.
Applying first order linear corrections to the observed declination gavemuch more consistent results.
PPM comparisons were not carried out during the changeover as the Geometrics816/1024 was found to be unoperational, and there was insufficient time forrepairs. On return to Australia the Macquarie Island NMS 2.2 was comparedwith the Canberra Observatory MNS 2.3 which had been recently checked andadjusted.
Contiguous BMZ 236 and PPM MNS 2.2 magnetic observations were carried outeight times monthly during the year.
Magnetometer comparison results and instruments are listed in Table 7.
5

Data reduction and publication
LA COUR MAGNETOGRAPH
The observed baseline values for the Macquarie Island La Cour magnetographare listed in Table 8. Most baseline value changes occurred while openingthe magnetometers to replace hydrated silica gel. Other changes were due toan earthquake, PEN installation, and changes in the BMZ instrumentcorrection.
Preliminary monthly mean geomagnetic values were determined from the five toten magnetically quietest days each month (K-index sum less than 18). Thisinformation, along with scaled H, D and K indicies, preliminary mean baselinevalues, and mean scale values for the month, was telexed to BMR Canberra.Preliminary instrument corrections applied to the mean geomagnetic valuesduring 1983/4 are given in Table 9.
The preliminary monthly mean and annual mean geomagnetic values for 1983/4are given in Table 10, and the annual mean geomagentic values for the lastten years in Table 11. Recent trends in secular variation continued with Dbecoming more easterly by 6.7 minutes, H decreasing by 14 nT, and Zdecreasing in magnitude by 32 nT.
PHOTOELECTRIC MAGNETOGRAPH
The observed baseline values for the PEN are listed in Table 8. The baselinevalue changes were caused by system modifications.
The increase in precision expected from the new digital system is only seenin the temperature baselines where the standard deviations are an order ofmagnitude smaller than for the La Cour system.
As the new digital system only records averages, it is not possible to usespot values in the reduction of the absolute observations. The X PEMbaseline determinations have approximately the same spread as the La CourH baselines, while the Y PEM baseline spread is much greater,as reflectedin the post- 5 May scale values. After replacing the LED in the Y PEN duringchangeover the scale value scatter was reduced.
6

3. SEISMOLOGY
Seismograph
Seismic activity was detected using a Willmore Mk II seismometer (freeperiod 1.0s) situated in the seismic vault; the output was amplified by aTeledyne EA310 amplifier then transmitted via underground shielded cable tothe geophysics laboratory where it was recorded using an AR311 amplifier anda Geotech R10 recorder, modified by BMR for visual recording. The seismographparameters are listed in Table 12.
The setting of the EA3I0 pre-amplifier was 24 dB throughout the year. Thesetting of the AR311 helicorder amplifier (Table 13) was generally 24 dBexcept on days with light winds and low wave noise, when the attenuation wasdecreased to 18 dB.
Time marks were supplied to the records by a Systron-Donner clock owned bythe UAP group. The recorder was powered by synchronous 240V 50 Hz AC froman inverter.
Seismograph calibrations and tests
DAILY TESTS
Calibration pulses were applied daily at each end of the seismograms. Thesewere nominally 8 mA until 31 March 1984, then 4 mA for 18 dB attenuation and8 mA for 24 dB attenuation, as the 8 mA pulse at 18 dB was slightly too largefor the siesmogram paper, being 5.5 cm peak to peak.
As a time check, one second time mark pulses from a Labtronics radioreceiver type 21 were recorded daily for one to two minutes except whenprecluded by poor radio reception.
CALIBRATIONS AND TESTS
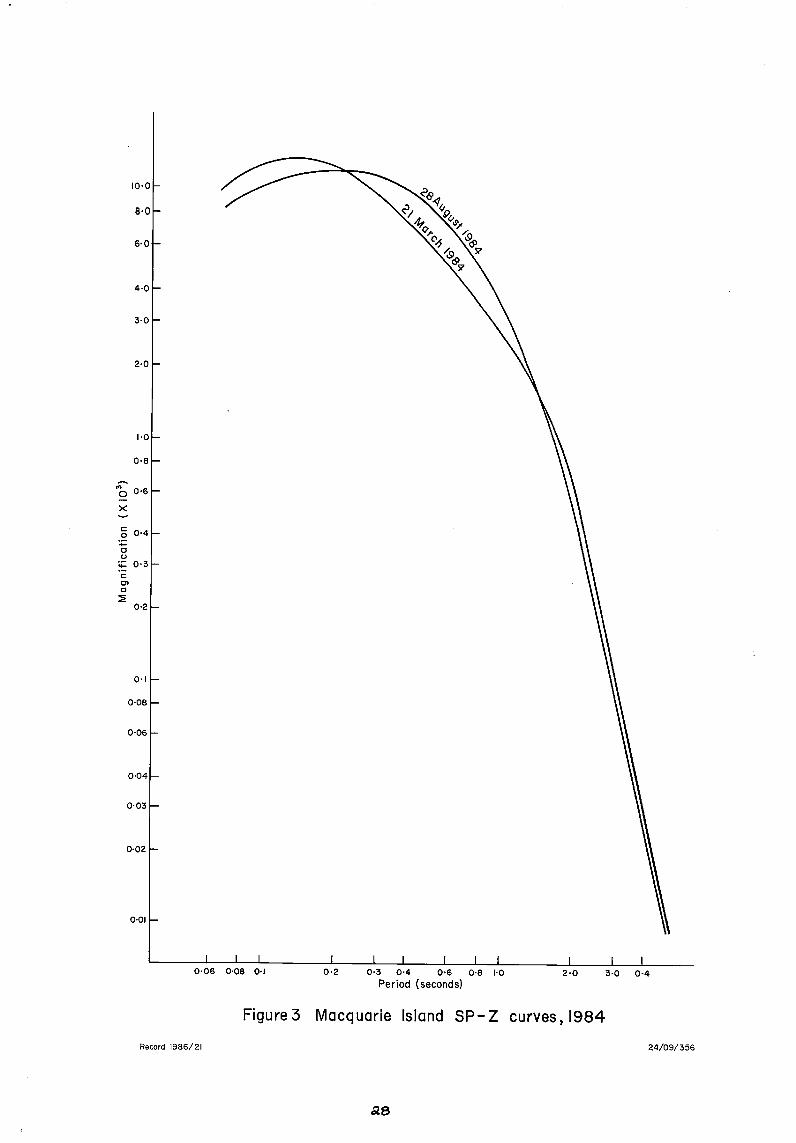
The seismograph was calibrated, and the free period and polarity werechecked, on 2 November 1983 with Peta Kelsey (results are given in Kelsey(1985)), and also on 21 March and 28 August 1984 (Figure 3, Tables 14 and 15).
The free period of the system was consistently 1.0s and the polarity wasmaintained such that an upward ground movement corresponded to the deflectionof the helicorder pen "up" the record.
Seismic data
A total of 19 hours of seismic record was lost during the year. Losses
7

were caused primarily by a power failure and seismic system tests.
Preliminary seismic data were forwarded weekly to BMR Canberra fordistribution internationally until 1 June 1984, then weekly via the Bureau ofMeteorology's Global Telecommmunications System (GTS) direct to the NationalEarthquake Information Service (NEIS), Denver, U.S.A. with BMR receivingmessages automatically. All data messages were also sent to Dumont D'urvilleat their request.
Seismicity
Table 16 lists 39 earthquakes of Richter magnitude ML-2.0 or greater whichoccurred in the vicinity of Macquarie Island from November 1983 to October1984. The largest was on 2 July 1984, and was felt with intensity V on theModified Mercalli intensity scale (MM).
8

4. CONTROL EQUIPMENT
The timing and power controls for the seismograph and magnetograph werelocated in an instrument room off the main Geophysics laboratory. Batteriesand an inverter (Saunders Type 10303) were located in a special battery room,which is shared with the UAP group.
A dark room was also shared with the UAP group until the La Courmagnetograph was removed in October 1984.
Timing
Timing for the MCQ geophysical observatory seismic and La Cour systems wasprovided by UAP's Systron-Donner clock. Hour marks for the PEM analoguerecords were initially provided by a Dick Smith digital clock (NDS-1).However, even after the addition of a high frequency filter, the clock wasvery sensitive to power fluctuations, so on 15 May 1984 it was replaced byhour pulses from the Systron-Donner.
The Systron-Donner timing system was very reliable with a drift of much lessthan 10 ms/day. A time code reader (Model 8230) and a time decorder, both onloan from the UAP group, interface the incoming signal. The time decordersent 1 hour, 1 minute and 10 second pulses direct to the seismic recordingsystem; and sent 1 minute signals to the Time Mark Programme Unit (TMU2)which directed 5 minute, plus first and fifty-ninth minute signals to theLa Cour magnetograph.
The TMU2 functioned reliably except when power spikes passed through themains due to the inverter tripping out, and produced a false trigger at theTMU2, causing its internal clock to step forward one minute.
A GED clock was used during the year to supply a 50 Hz signal to the Saundersinverter, but was not used for timing.
Power
Primary power was provided to the seismograph and the La Cour magnetographby an inverter; secondary power was provided through a Stabilac voltagestabilizer running on station mains. Control was switched between thesesystems by a Power and Timing Control Unit (PPT1). The Stabilac voltagestabilizer and the PPT1 ran reliably during the year; the inventer displayedan intermittent fault.
The Saunders 24/240V inverter was synchronized by a 50 Hz signal from theGED clock and ran from two heavy duty batteries which were trickle chargedfrom the station mains.
The inverter commenced malfunctioning shortly after a station mains
9
overvoltage of 272 volts on 12 December 1983: the inverter's circuit breakerfailed to operate. Extensive efforts were made to fix the inverter, rangingfrom checking and adjusting to replacing circuit board components and finallyto redesigning, making and installing a new circuit board using availablecomponents. All to no avail. On 6 August 1984 an internally synchronized24/240V inverter was borrowed from the Bureau of Meteorology on the island.This ran reliably and was replaced during changeover by an internallysynchronized 24/240V inverter from BMR.
Cables and wiring
To free a 12-core cable for the photoelectric magnetometers, the La Courscale values and orientation tests wiring was moved onto the 12-core powerand timing cable. After installation of the X and Y PEM's the spare cablecarried X, Y and temperature information to the instrument room, and 24V D.C.plus scale value trigger pulses to the PEM controller. With the introductionof the PPM for continuous recording, an extra cable was installed in the conduitbetween the geophysics laboratory and the variometer hut. The 24V D.C.supply was transferred to this 2-core cable, enabling the PPM wiring to beincluded on the 12-core cable. Prior to installation of the Z PEN the La Courmagnetograph was removed from the variometer hut, freeing the original powerand timing cable for the Z PEM wiring.
Separate trenchs were dug between the PPM and variometer huts for the PPMdetector cable and for the station mains. Both cables were installed inconduit.
All loose cables in the geophysics laboratory instrument room and in thevariometer hut were installed in ducting during the year.
10

5. BUILDINGS AND MAINTENANCE
PPM hut
To maintain the continuity of geomagnetic data, recording of the total field(F) was commenced before the La Cour magnetometer was stopped. A separate,permanent variometer hut was erected to house the PPM sensor. This avoidedinterference to the variometers and provided a vibration-free mounting topreclude induction signals in the coil. The new hut is located midwaybetween the two original magnetic huts. A floor plan at the hut is givenin Figure 4, and its location is shown in Figure 5.
Variometer and absolute huts
No maintenance was carried out to the Variometer or Absolute huts.Stainless steel turn buckles and cable were ordered for the western, windwardwalls of both buildings. The plastic Vinclad cladding on both buildings isold and brittle and should be replaced. In the interim extra sheets havebeen ordered to replace/patch the existing panels.
Seismic hut
The seismic hut was reconditioned during 1984. Two coats of hydroseal wereapplied to the roof; the eastern wall of the cold porch was reclad withgalvanized iron; all exterior walls were scraped and repainted; and theexterior door was furnished with door knobs. Disused seismic equipment andwiring were removed from the hut.
Geophysics office
Fibreglass batts and sisilation were installed by the carpenter above theceiling of the science building during 1984. No other maintenance wascarried out to the geophysics office.
11

6. OTHER DUTIES
Saturday duties consisting of station building maintenance, the sorting ofsupplies and stores, repairs to roads and field huts, and fuel farmmodifications were performed during 1983/4. Domestic duties of rosteredslushy duty in the mess, donga and science block areas, garbage runs andoccasional cooking were done. Occasional help was given to the UAP group,and to the Doctor for his Sooty Albatross monitoring program.
7. ACKNOWLEDGEMENTS
The author thanks all members of the Macquarie Island party for theirassistance and companionship during 1983/4. Special thanks are due to IvanTaylor, Malcolm Lambert and Roger Welsh for changing records when the authorwas away from base, and to Roger Welsh and David Rasch for their instructionand assistance with electronic troubleshooting.
8. REFERENCES
CROSTHWAITE, P.G., 1986, Mawson Geophysical Observatory Annual Report, 1984,Bureau of Mineral Resources Australia Record, 1986/12.
FERGUSON, I.J., 1985, Macquarie Island Geophysical Observatory Annual Report,1982, Bureau of Mineral Resources Australia Record, 1985/18.
KELSEY, P.J., 1985, Macquarie Island Geophysical Observatory Annual Report,1983, Bureau of Mineral Resources Australia Record, 1985/19.
12
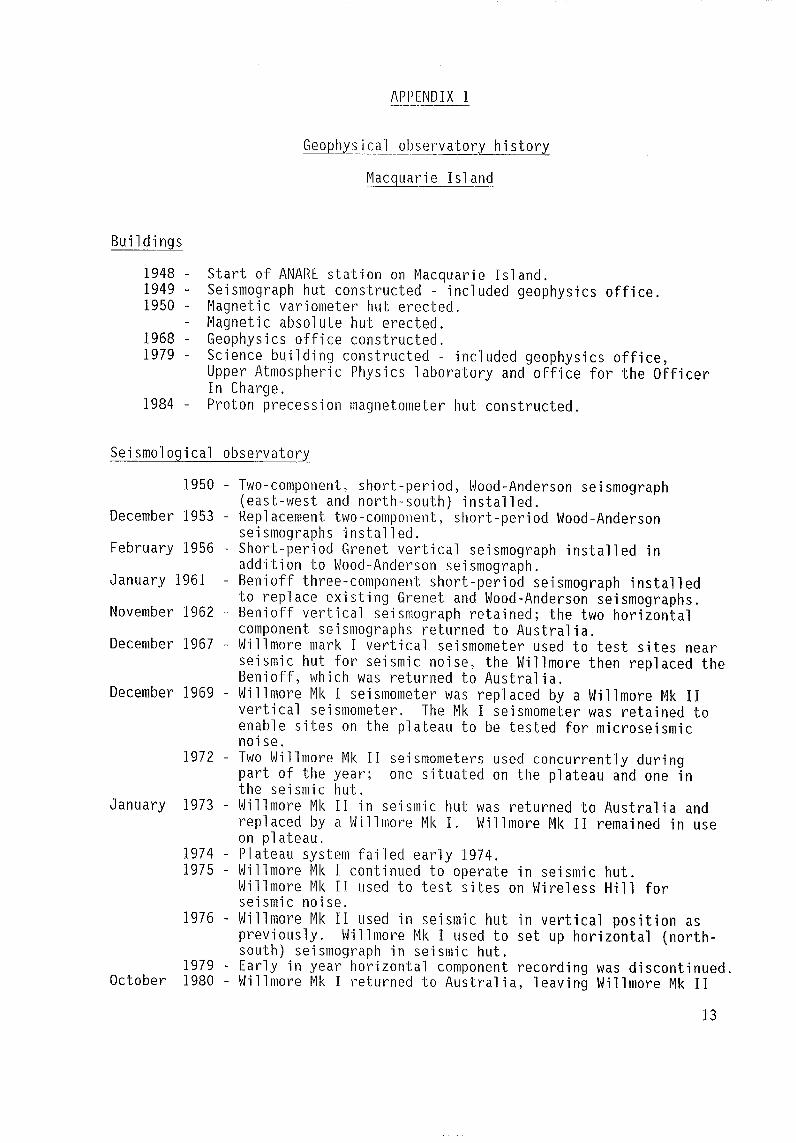
APPENDIX 1
Geophysical observatory history
Macquarie Island
Buildings
1948 - Start of AWARE station on Macquarie Island.1949 - Seismograph hut constructed - included geophysics office.1950 - Magnetic variometer hut erected.
Magnetic absolute hut erected.1968 Geophysics office constructed.1979 - Science building constructed - included geophysics office,
Upper Atmospheric Physics laboratory and office for the OfficerIn Charge.
1984 - Proton precession magnetometer hut constructed.
Seismological observatory
1950 - Two-component, short-period, Wood-Anderson seismograph(east-west and north-south) installed.
December 1953 - Replacement two-component, short-period Wood-Andersonseismographs installed.
February 1956 - Short-period Grenet vertical seismograph installed inaddition to Wood-Anderson seismograph.
January 1961 - Benioff three-component short-period seismograph installedto replace existing Grenet and Wood-Anderson seismographs.
November 1962 - Benioff vertical seismograph retained; the two horizontalcomponent seismographs returned to Australia.
December 1967 - Willmore mark I vertical seismometer used to test sites nearseismic hut for seismic noise, the Willmore then replaced theBenioff, which was returned to Australia.
December 1969 - Willmore Mk I seismometer was replaced by a Willmore Mk IIvertical seismometer. The Mk I seismometer was retained toenable sites on the plateau to be tested for microseismicnoise.
1972 - Two Willmore Mk II seismometers used concurrently duringpart of the year; one situated on the plateau and one inthe seismic hut.
January 1973 - Willmore Mk II in seismic hut was returned to Australia andreplaced by a Willmore Mk I. Willmore Mk II remained in useon plateau.
1974 - Plateau system failed early 1974.1975 - Willmore Mk I continued to operate in seismic hut.
Willmore Mk II used to test sites on Wireless Hill forseismic noise.
1976 - Willmore Mk II used in seismic hut in vertical position aspreviously. Willmore Mk I used to set up horizontal (north-south) seismograph in seismic hut.
1979 - Early in year horizontal component recording was discontinued.October 1980 - Willmore Mk I returned to Australia, leaving Willmore Mk II
13
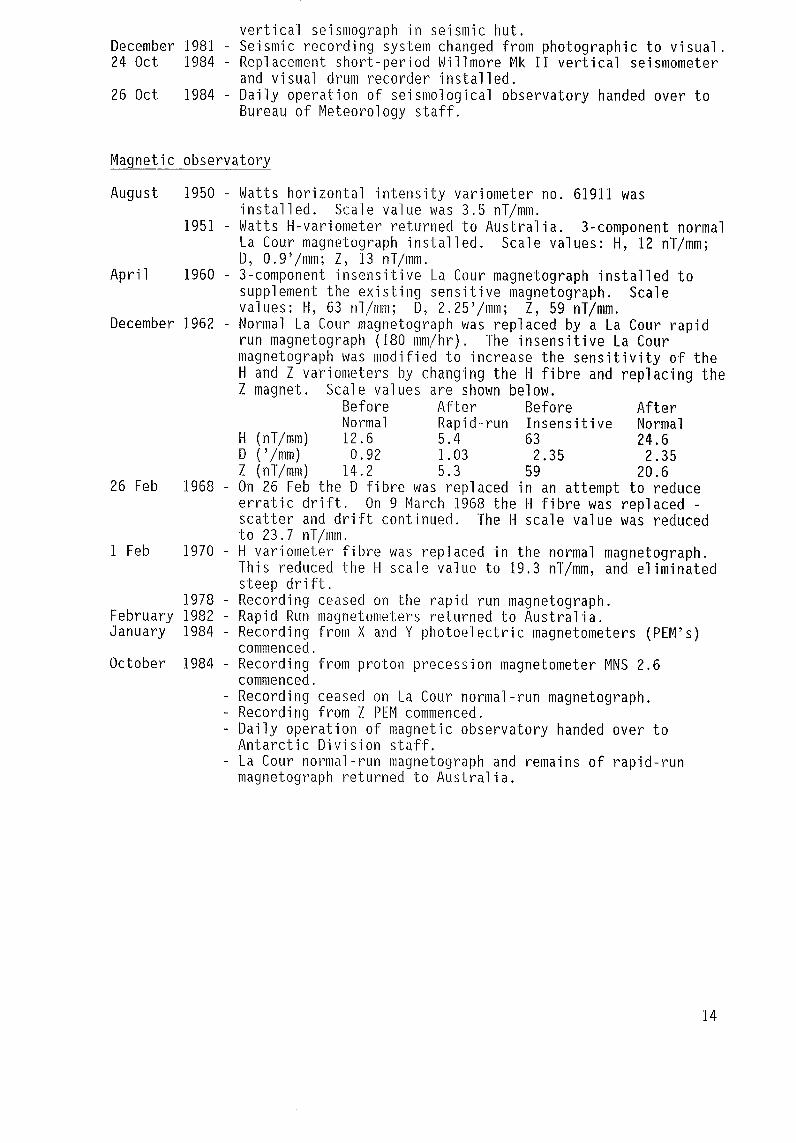
vertical seismograph in seismic hut.December 1981 - Seismic recording system changed from photographic to visual.24 Oct^1984 - Replacement short-period Willmore Mk II vertical seismometer
and visual drum recorder installed.26 Oct^1984 - Daily operation of seismological observatory handed over to
Bureau of Meteorology staff.
Magnetic observatory
August^1950 - Watts horizontal intensity variometer no. 61911 wasinstalled. Scale value was 3.5 nT/mm.
1951 - Watts H-variometer returned to Australia. 3-component normalLa Cour magnetograph installed. Scale values: H, 12 nT/mm;D, 0.9'/mm; Z, 13 nT/mm.
April^1960 - 3-component insensitive La Cour magnetograph installed tosupplement the existing sensitive magnetograph. Scalevalues: H, 63 nT/mm; D, 2.25'/mm; Z, 59 nT/mm.
December 1962^
Normal La Cour magnetograph was replaced by a La Cour rapidrun magnetograph (180 mm/hr). The insensitive La Courmagnetograph was modified to increase the sensitivity of theH and Z variometers by changing the H fibre and replacing theZ magnet. Scale values are shown below.
Before^After^Before^AfterNormal^Rapid-run Insensitive^Normal
H (nT/mm)^12.6^5.4^63^24.6D ('/mm)^0.92^1.03^2.35^2.35Z (nT/mm)^14.2^5.3^59^20.6
26 Feb 1968 - On 26 Feb the D fibre was replaced in an attempt to reduceerratic drift. On 9 March 1968 the H fibre was replaced -scatter and drift continued. The H scale value was reducedto 23.7 nT/mm.
1 Feb^1970 - H variometer fibre was replaced in the normal magnetograph.This reduced the H scale value to 19.3 nT/mm, and eliminatedsteep drift.
1978 - Recording ceased on the rapid run magnetograph.February 1982 - Rapid Run magnetometers returned to Australia.January 1984 - Recording from X and Y photoelectric magnetometers (PEM's)
commenced.October 1984 - Recording from proton precession magnetometer MNS 2.6
commenced.Recording ceased on La Cour normal-run magnetograph.
- Recording from Z PEM commenced.- Daily operation of magnetic observatory handed over toAntarctic Division staff.
- La Cour normal-run magnetograph and remains of rapid-runmagnetograph returned to Australia.
14
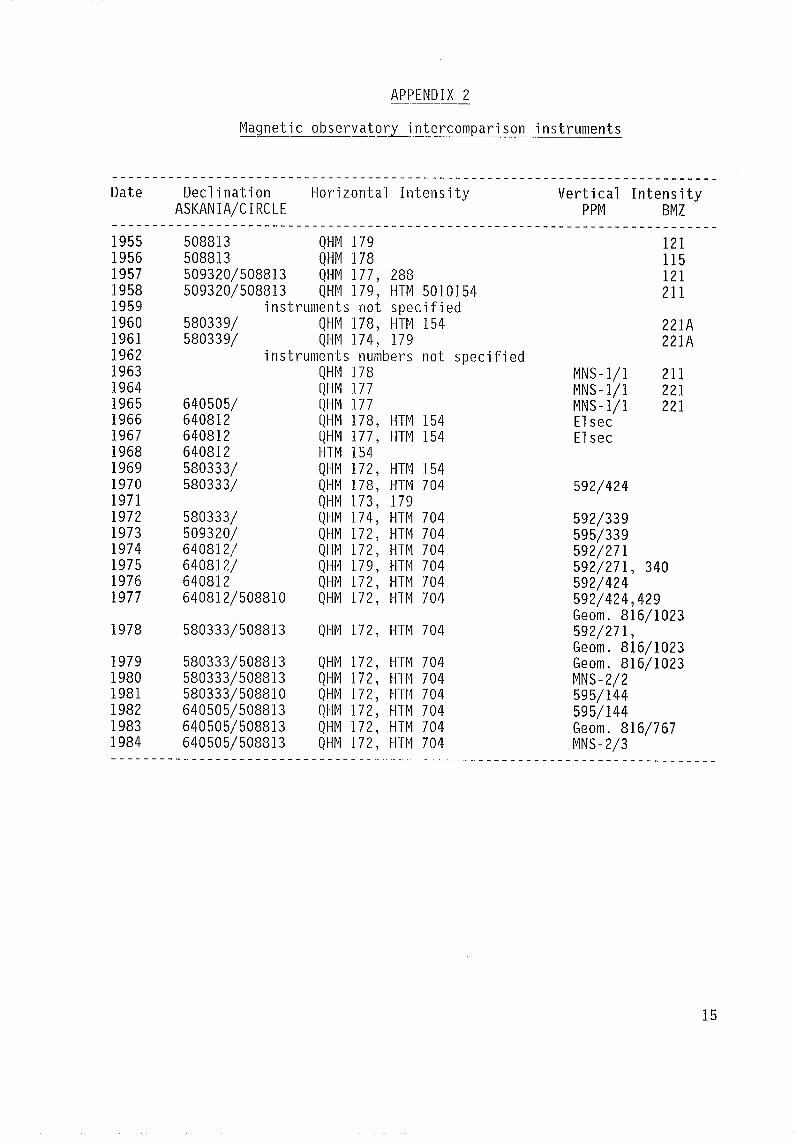
APPENDIX 2
Magnetic observatory intercomparison instruments
Date^Declination^Horizontal Intensity^
Vertical IntensityASKANIA/CIRCLE^
PPM^BMZ
1955^508813^QHM 1791956^508813^QHM 1781957^509320/508813^QHM 177, 2881958^509320/508813^QHM 179, HIM 50101541959^instruments not specified1960^580339/^QHM 178, HIM 1541961^580339/^QHM 174, 1791962^instruments numbers not specified1963^ QHM 1781964^ QHM 1771965^640505/^QHM 1771966^640812^QHM 178, HTM 1541967^640812^QHM 177, HTM 1541968^640812^HIM 1541969^580333/^QHM 172, HTM 1541970^580333/^QHM 178, HIM 7041971^ QHM 173, 1791972^580333/^QHM 174, HIM 7041973^509320/^QHM 172, HIM 7041974^640812/^QHM 172, HIM 7041975^640812/^QHM 179, HIM 7041976^640812^QHM 172, HIM 7041977^640812/508810^QHM 172, HIM 704
1978^580333/508813^QHM 172, HTM 704
1979^
580333/508813^
QHM 172, HIM 7041980^
58033 3/5088 13^
QHM 172, HIM 7041981^
580333/ 5088 10^
QHM 172, HIM 7041982^
640505/508813^
QHM 172, HIM 7041983^
640505/508813^
QHM 172, HIM 7041984^
640505/508813^
QHM 172, HIM 704
121115121211
221A221A
MNS-1/1^
211MNS-1/1
^221
MNS-1/1^
221ElsecElsec
592/424
592/339595/339592/271592/271, 340592/424592/424,429Geom. 816/1023592/271,Geom. 816/1023Geom. 816/1023MNS-2/2595/144595/144Geom. 816/767MNS-2/3
15
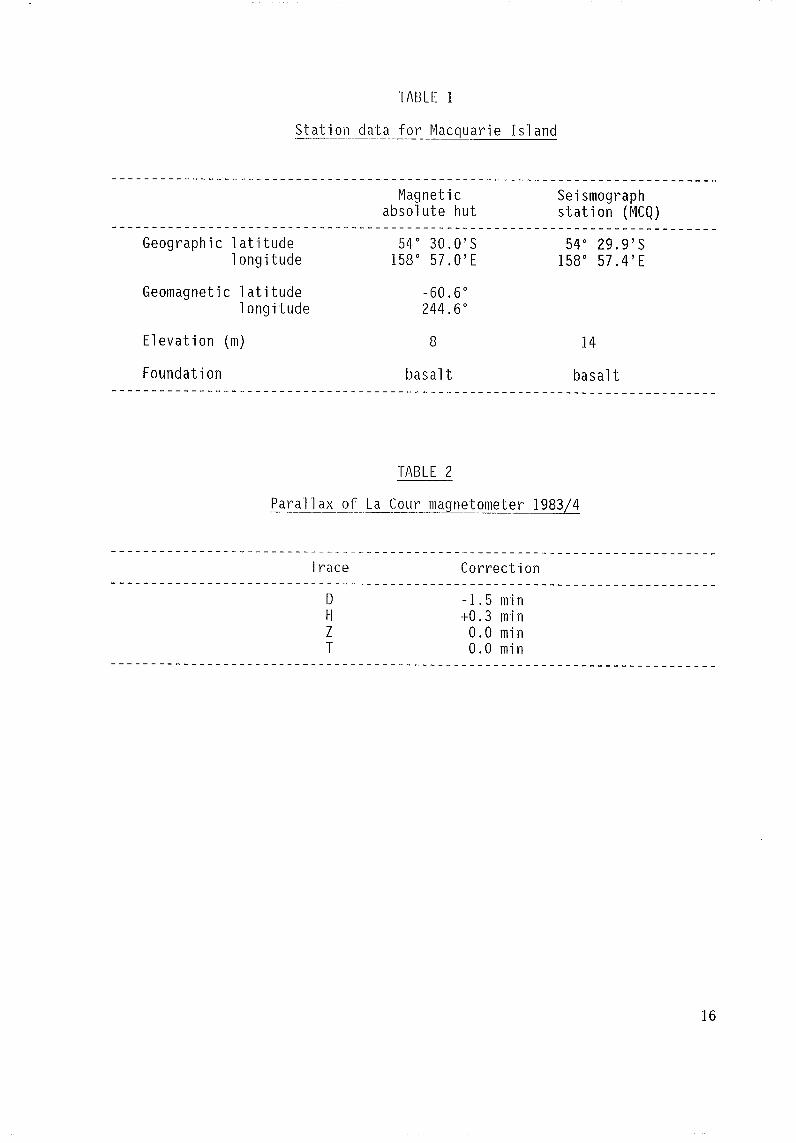
TABLE 1
Station data for Macquarie Island
Magneticabsolute hut
Seismographstation^(MCQ)
Geographic latitude 54° 30.0'S 54° 29.9'Slongitude 158 0 57.0'E 158° 57.4'E
Geomagnetic latitude -60.6°longitude 244.6°
Elevation (m)^
8^ 14
Foundation^
basalt^basalt
TABLE 2
Parallax of La Cour magnetometer 1983/4
Trace^Correction
-1.5 min+0.3 min0.0 min0.0 min
16
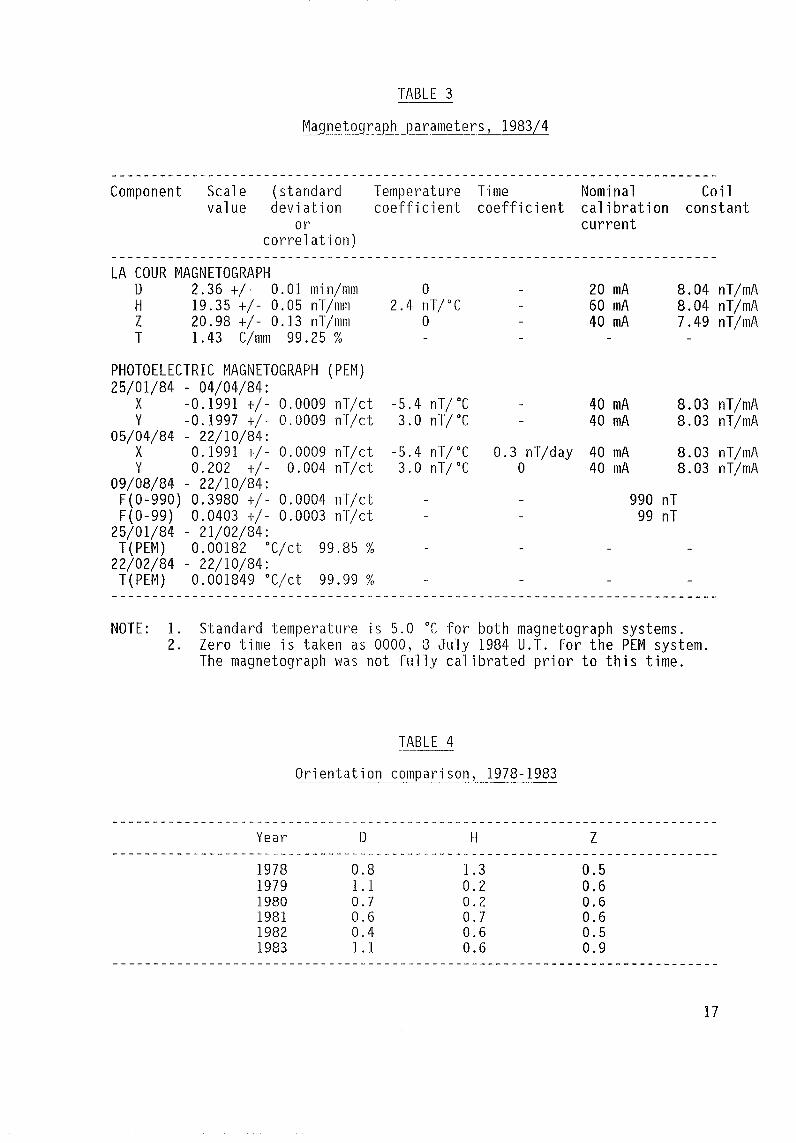
TABLE 3
Magnetograph parameters, 1983/4
Component^Scale^(standard^Temperature Time^Nominal^Coilvalue^deviation^coefficient coefficient calibration constant
or^ currentcorrelation)
LA COUR MAGNETOGRAPHD^2.36 +/- 0.01 min/mm^0^ 20 mA^8.04 nT/mAH^19.35 +/- 0.05 nT/mm^2.4 nT/°C^-^60 mA^8.04 nT/mAZ^20.98 +/- 0.13 nT/mm^0^ 40 mA^7.49 nT/mAT^1.43 C/mm 99.25 %
PHOTOELECTRIC MAGNETOGRAPH (PEM)25/01/84 - 04/04/84:
X^-0.1991 +/- 0.0009 nT/ct^5.4 nT/°C^40 mA^8.03 nT/mAY^-0.1997 +/- 0.0009 nT/ct^3.0 nT/°C^40 mA^8.03 nT/mA
05/04/84 - 22/10/84:X^0.1991 +/- 0.0009 nT/ct -5.4 nT/°C^0.3 nT/day 40 mA^8.03 nT/mA
0.202 +/- 0.004 nT/ct^3.0 nT/°C^0^40 mA^8.03 nT/mA09/08/84 - 22/10/84:F(0-990) 0.3980 +/- 0.0004 nT/ct^ 990 nTF(0-99) 0.0403 +/- 0.0003 nT/ct^ 99 nT
25/01/84 - 21/02/84:T(PEM)^0.00182 °C/ct 99.85 %22/02/84 - 22/10/84:T(PEM)^0.001849 °C/ct 99.99 %
NOTE: 1. Standard temperature is 5.0 °C for both magnetograph systems.2. Zero time is taken as 0000, 3 July 1984 U.T. for the PEM system.
The magnetograph was not fully calibrated prior to this time.
TABLE 4
Orientation comparison, 1978-1983
Year
197819791980198119821983
0.81.10.70.60.41.1
1.30.20.20.70.60.6
0.50.60.60.60.50.9
17
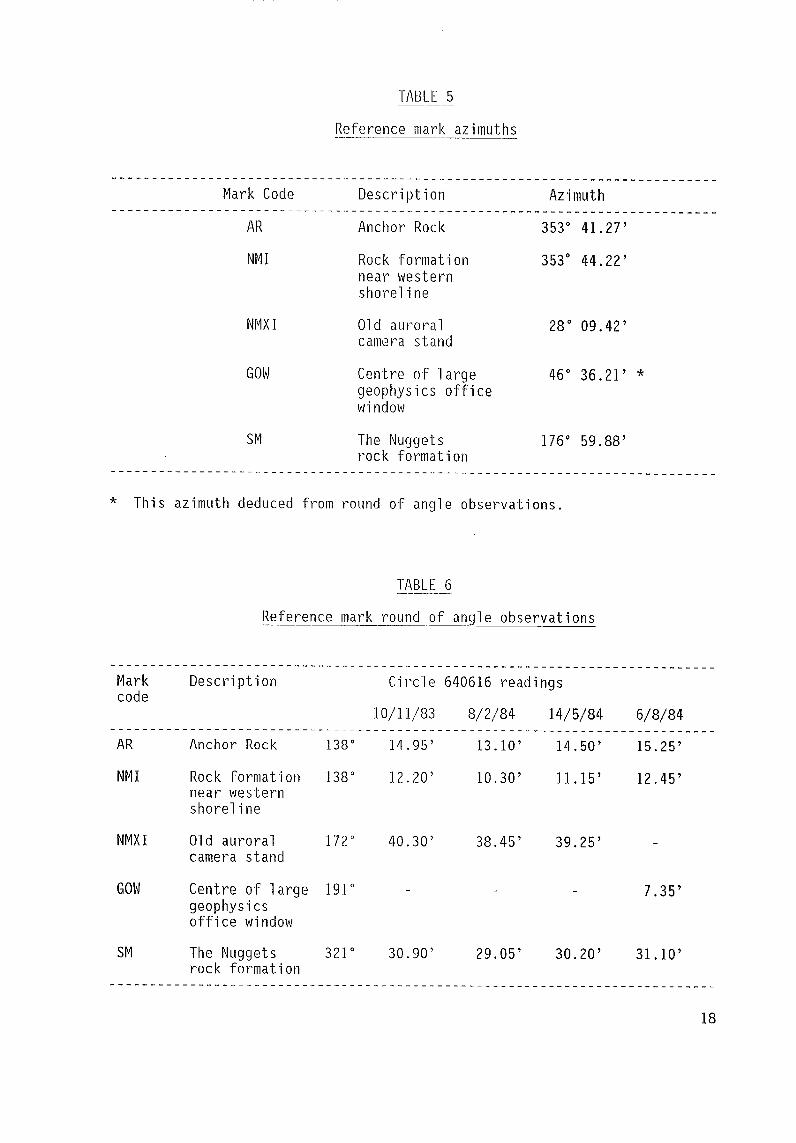
TABLE 5
Reference mark azimuths
Mark Code^Description^Azimuth
AR^
Anchor Rock^3530 41.27'
NMI
NMXI
Rock formationnear westernshoreline
Old auroralcamera stand
353° 44.22'
28° 09.42'
GOW^
Centre of large^
46° 36.21' *geophysics officewindow
SM^
The Nuggets^176° 59.88'rock formation
* This azimuth deduced from round of angle observations.
TABLE 6
Reference mark round of angle observations
Circle 640616 readings
10/11/83^8/2/84^14/5/84 6/8/84
138° 14.95' 13.10' 14.50' 15.25'
138° 12.20' 10.30' 11.15' 12.45'
172° 40.30' 38.45' 39.25'
191' 7.35'
321° 30.90' 29.05' 30.20' 31.10'
Mark^Descriptioncode
AR^Anchor Rock
NMI^Rock formationnear westernshoreline
NMXI^Old auroralcamera stand
GOW^Centre of largegeophysicsoffice window
SM^The Nuggetsrock formation
18

TABLE 7
Magnetometer comparisons, 1984
Date^
BMR^MCQ^DifferenceStandard (A)^magnetometer (B)^(A-B) nT
From 01 Nov 83From 21 Nov 83From 09 Aug 84
MNS 2.2^BMZ236II^. +108.4 *
+120.2 *+106.3 *
25 Oct 84
02 Dec 84
Dec 640505Circle 508813MNS 2.3
Dec 640506Circle 640616MNS 2.2
QHM 178QHM 179
-4.2' +/- 0.8'
+12.21 **
+7+8
Through routine baseline values
QHM 177QHM 177
*^Differences from Z baseline values.
** These comparisons were carried out by Dr Peter Hopgood of the BMRGeomagnetism Section shortly after the MNS 2.3 had been checked andadjusted.
TABLE 8
Baseline values, 1983/4
Date^
U.T.^Baseline^
Standard^
RemarksHr min^
value^
Deviation
LA COUR MAGNETOGRAPH
Declination BD^(E)01 Nov 1983^00 00 277 0.7' 0.7'21 Dec^1983^22^10 26°59.4' 0.6' silica gelreplacement27 Jan 1984^01 00 27°^1.4' 0.5'04 Apr 1984^07 00 27°^0.0' 0.4'10 Sep 1984^01 35 27°^3.0' 0.4'
Horizontal^intensity BHs^(nT)01 Nov 1983^00 00 12490 202 Jul^1984^14 25 12442 2 earthquake, MM = V
19

Vertical^intensity BZs^(nT)01 Nov 1983^00 00 63445 418 Nov 1983^03 00 63450 421 Nov 1983^03 30 63446 521 May 1984^01 44 63456 409 Aug 1984^02 45 63469 310 Sep 1984^01 20 63460 4
Vertical^intensity* BZs^(nT)01 Nov 1983^00 00 63553 318 Nov 1983^03 00 63567 421 May 1984^01 44 63575 3
Temperature BT^(°C)01 Nov 1983^00 00 -81.3 0.118 Nov 1983^02 53 -80.7 0.227 Jan 1984^01 00 -80.5 0.104 Apr 1984^07 00 -80.8 0.121 May 1984^01 43 -79.9 0.225 Sep 1984^03 35 -80.0 0.1
silica gel replacementchange in BMZ 236 correctionsilica gel replacementchange in BMZ 236 correctionsilica gel replacement
silica gel replacement
silica gel replacement
PHOTOELECTRIC MAGNETOGRAPH
X, true north intensity (nT)07 Jul^1984^00 00 10994 11
Y, true east^intensity (nT)07 Jul^1984^00 00 6091 3
Temperature^(°C)25 Jan 1984^00 00 1.67 0.0303 Feb 1984^00 00 1.73 0.02 thermistor shifted21^Feb 1984^03 00 -3.25 0.03 Edas2 input module modified03 Aug 1984^00 00 -3.31 0.03 Cable pulled through conduit
connecting variometer hutand geophysics office
28 Sep 1984^05 00 -3,27 0.02 Edas2 zero input adjusted
* BZs derived from H and F (MNS 2.2)
Note 1. Instrument corrections have not been applied.2. BHs are derived from QHM 177(1083).3. X and Y baselines are derived from QHM 177(1083) using a
collimation angle of +332.28 minutes.4. X and Y baseline datum is 5000 counts.5. PEN X and Y baseline determinations commenced on 7 July 1984.
20
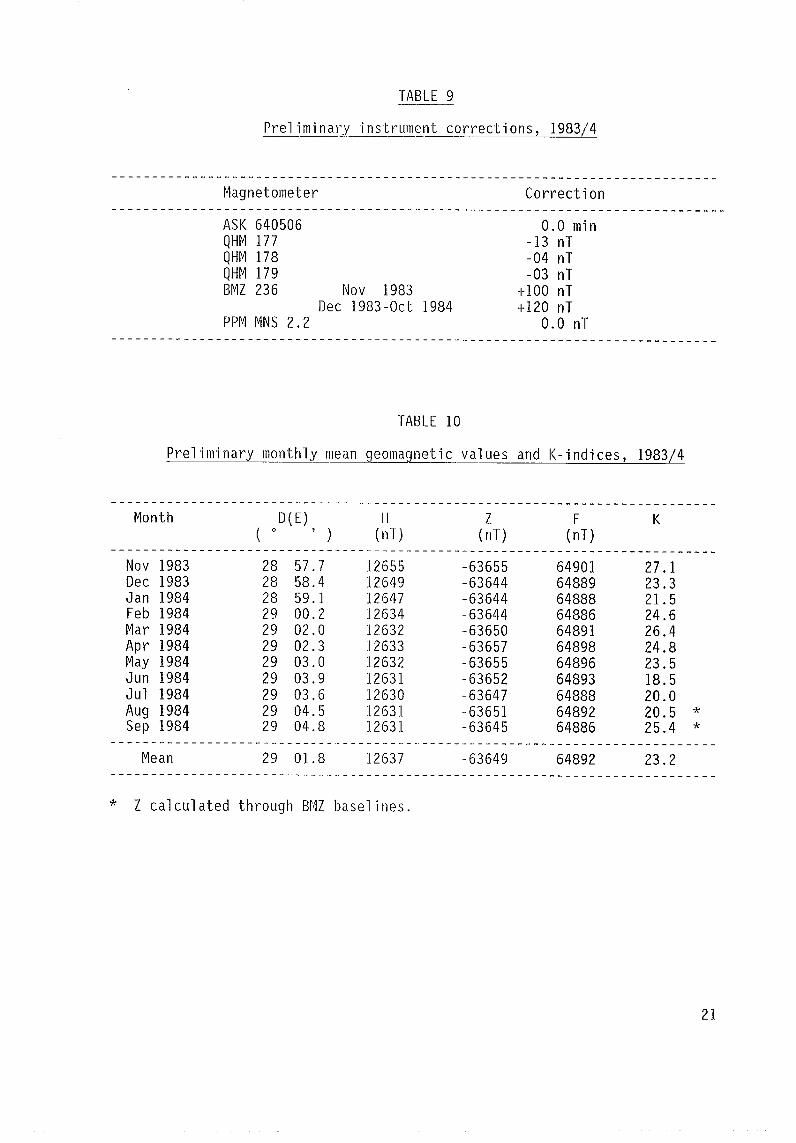
TABLE 9
Preliminary instrument corrections, 1983/4
Magnetometer^ Correction
ASK 640506QHM 177QHM 178QHM 179BMZ 236 Nov 1983
Dec 1983-Oct 1984PPM MNS 2.2
0.0 min-13 nT-04 nT-03 nT
+100 nT+120 nT
0.0 nT
TABLE 10
Preliminary monthly mean geomagnetic values and K-indices, 1983/4
Month°D(E)
)^(n) (nT) (nT)
Nov 1983 28 57.7 12655 -63655 64901 27.1Dec 1983 28 58.4 12649 -63644 64889 23.3Jan^1984 28 59.1 12647 -63644 64888 21.5Feb 1984 29 00.2 12634 -63644 64886 24.6Mar 1984 29 02.0 12632 -63650 64891 26.4Apr 1984 29 02.3 12633 -63657 64898 24.8May 1984 29 03.0 12632 -63655 64896 23.5Jun 1984 29 03.9 12631 -63652 64893 18.5Jul^1984 29 03.6 12630 -63647 64888 20.0Aug 1984 29 04.5 12631 -63651 64892 20.5 *Sep 1984 29 04.8 12631 -63645 64886 25.4 *
Mean 29 01.8 12637 -63649 64892 23.2
* Z calculated through BMZ baselines.
21

TABLE 11
Year^D(E)(^0^)
Geomagnetic annual^mean values, 1974-1984
(nT)( ° )^(nT)X(nT) (nT)
1974^27 34.3 -78 37.6 12 865 11 404 5955 -63 9561975^27 43.2 -78 38.2 12 847 11 373 5976 -63 9261976^27 51.6 -78 39.1 12 822 11 336 5992 -63 8911977^27 59.8 -78 39.9 12 802 11 304 6010 -63 8611978^28 11.3 -78 41.1 12 773 11 258 6034 -63 8381979^28 19.6 -78 42.3 12 745 11 219 6047 -63 8071980^28 28.8 -78 43.0 12 723 11 183 6067 -63 7681981^28 37.6 -78 44.6 12 687 11 136 6078 -63 7351982^28 48.0 -78 45.4 12 665 11 098 6101 -63 7101983^28 55.1 -78 45.8 12 651 11 074 6118 -63 6791984^29 01.8 -78 46.2 12 637 11 049 6132 -63 647
Mean annual^changes
1974 to 1984 8.8 -0.9 -23 -36 18 31
1974 to 1979 9.1 -0.9 -24 -37 18 30
1979 to^1984 8.4 -0.8 -22 -34 17 32
TABLE 12
Seismograph parameters
WILLMORE MARK IT SEISMOMETER
Free periodEA310 preamplifier filtersLow pass filter cutoffAmplifier attenuation settings
EA310AR311
Magnification at 1 Hz21 March 198428 August 1984
Calibration coil motor constantMass
1.0 sec0.5 Hz to 12.5 Hz
2 Hz
24 dB24/18 dB
2810/52403510/63402.3/2.1 N/A4.75 kg
22

TABLE 13
Attenuation settings for helicorder amplifier AR311
November 198324 dB18 dB
December 198324 dB18 dB
January 198424 dB18 dB
February 198424 dB18 dB
March 198424 dB18 dB
April 198424 dB18 dB
May 198424 dB18 dB
June 198424 dB18 dB
July 198424 dB18 dB
August 198424 dB18 dB
September 198424 dB18 dB
October 198424 dB18 dB
01-03,06,08-21,23,25-3004-05,07,22,24
01-06,09,13-18,21,23-25,27,29-3107-08,10-12,19-20,22,26,28
01-02,04-15,17-18,24,27-29,3103,16,19-23,25-26,30
01-03,07-14,17-2904-06,15-16
01,05,07-09,11-12,14-15,17-3102-04,06,10,13,16
01-21,24-3022-23
01-03,05-08,15-17,21-25,27-3004,09-14,18-20,26,31
02-3001
02,06,12,14-3101,03-05,07-11,13
01-06,09-14,16-18,20,22,26-28,3107-08,15,19,21,23-25,29-30
01-13,15-18,20-21,26-27,3014,19,22-25,28-29
01-02,04-05,07-15,17,19-2303,06,16,18
23
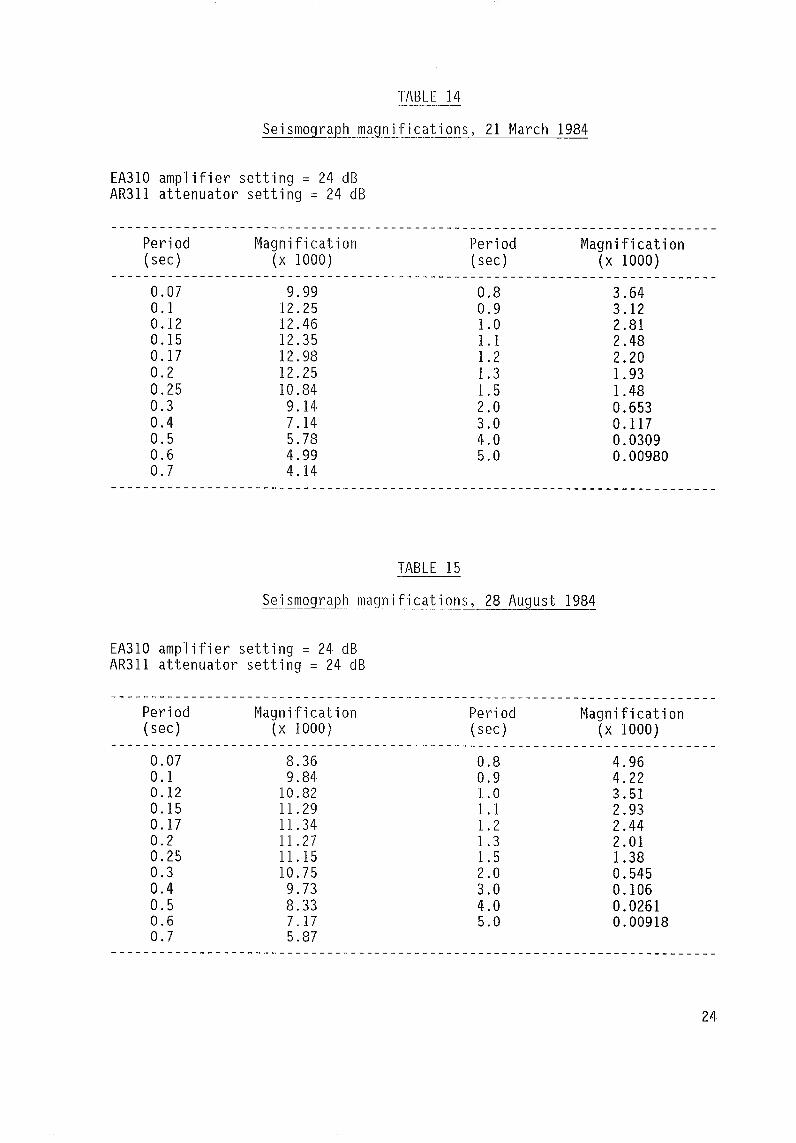
TABLE 14
Seismograph magnifications, 21 March 1984
EA310 amplifier setting = 24 dBAR311^attenuator setting = 24 dB
Period^Magnification(sec)^(x^1000)
Period(sec)
Magnification(x^1000)
0.07 9.99 0.8 3.640.1 12.25 0.9 3.120.12 12.46 1.0 2.810.15 12.35 1.1 2.480.17 12.98 1.2 2.200.2 12.25 1.3 1.930.25 10.84 1.5 1.480.3 9.14 2.0 0.6530.4 7.14 3.0 0.1170.5 5.78 4.0 0.03090.6 4.99 5.0 0.009800.7 4.14
TABLE 15
Seismograph magnifications, 28 August 1984
EA310 amplifier setting = 24 dBAR311 attenuator setting = 24 dB
Period^Magnification(sec)^(x^1000)
Period(sec)
Magnification(x^1000)
0.07 8.36 0.8 4.960.1 9.84 0.9 4.220.12 10.82 1.0 3.510.15 11.29 1.1 2.930.17 11.34 1.2 2.440.2 11.27 1.3 2.010.25 11.15 1.5 1.380.3 10.75 2.0 0.5450.4 9.73 3.0 0.1060.5 8.33 4.0 0.02610.6 7.17 5.0 0.009180.7 5.87
24

TABLE 16
Date
1983
Macquarie^Island earthquakes^1983/4
IntensityMM
Origin^timeU.T.
MagnitudeML
Nov^05 20^57^32.6 4.106 02 04 48.5 4.416 05 30 36.0 2.718 14 05^51.8 2.822 05 09 25.4 3.524 04^1228.2 2.1
05 39 36.8 5.030 00 55 06.0 3.0
Dec^07 07 43^10.915^31^54.1 2.315^32^31.9 2.2
10 14 06 26.8 3.318 50 26.8 2.5
12 09 35^14.0 4.515 01^58^22.2 2.8
06 37 39.0 3.023 12^29 06.9
13^03^01.3 3.2
1984Feb^05 04 13 08.8 2.1
07 23^10^31.1 2.510 20 48 36.8 2.313 20 05^01.5 3.815 20 27 36.0 3.4
Mar^01 23^52^27.5 3.6Apr^12 10^11^45.0 3.8May^07 05 07^10.8 3.8
21 18 07^14.7 4.023* 05^17^18.6 5.424 05 44 59.3 3.928 15^10^32.4 3.1
Jul^02 14^25^32.5 V09 15^18^57.2 2.227 16 58 00.2 3.2
Sep^13 13^15^57.3 3.822 16^11^09.3 3.023 16^26^07.8 3.0
Oct^01 04 46 50.5 III20 10 4932.0 3.021 20 02 07.0 3.2
* ISC solution - 0.1.: 05 16 34.0lat.:^51.88° Slong.:^161.08° Edepth: 10 kmmagnitude: mb 5.8, Ms 5.8
25
(Each cable is a cable pair) DORIC
PPM HUT
240 VCONTINUOUS
POWER
24V DC
^1 I HOURT/M Unit̂ PULSE111111
KEYBOARD^EDAS -2
^W W
RECORDER RECORDER
18V
P/S
Fio
MCC-I3COMP. PEMCONTROLLER
DAILYCLOSURE
PPM MNS-2
24V
P/S
Figure I MACQUARIE ISLANDPHOTOELECTRIC MAGNETOGRAPH SYSTEM
VARIOMETER HUT^ OFFICE
240V Mains
240V Mains
HEATERCONTROLLER
NON—MAGNETICHEATER
/) The hour pulse from seismograph timing
2)The 24V DC from float charged batteries
3)Doily closure from Kombrook dig//al timer
4)The 7/M unit contains ÷/0 switchable ottenuators
Record 1986/21^ 24/09/354
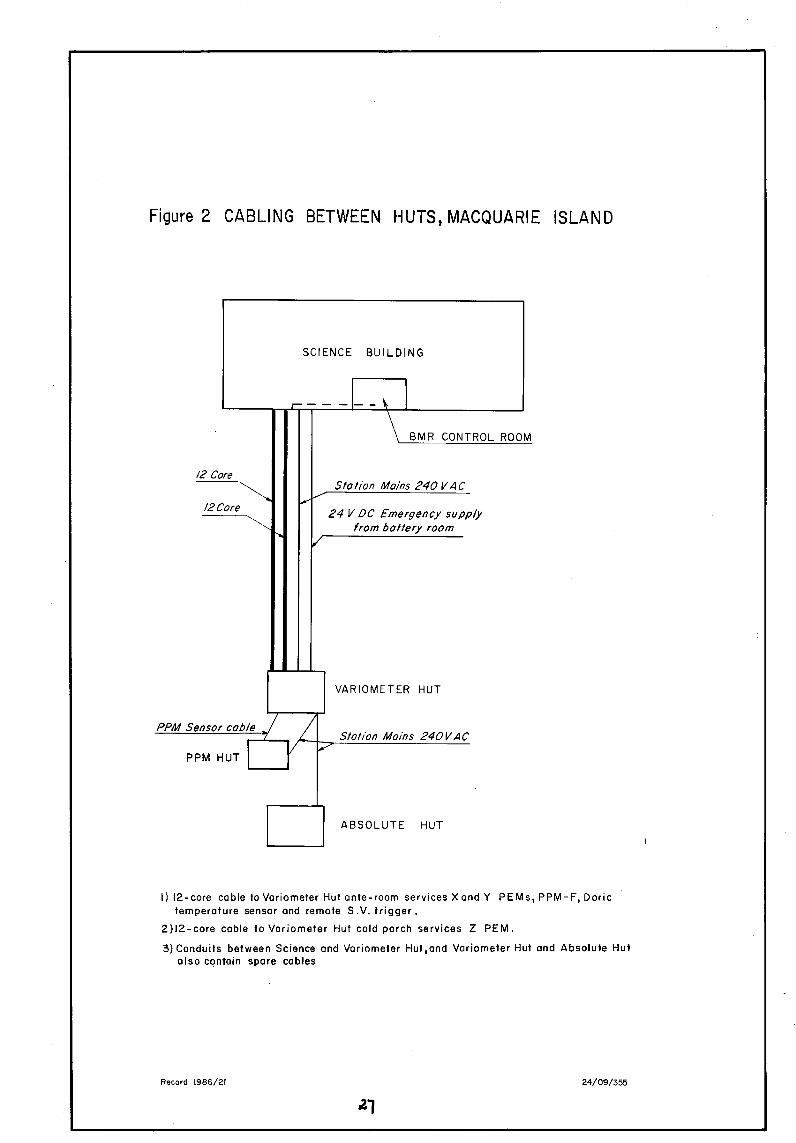
Figure 2 CABLING BETWEEN HUTS, MACQUARIE ISLAND
SCIENCE BUILDING
BMR CONTROL ROOM
PPM Sensor cable
PPM HUT
Station Mains 240 VAC
24 V DC Emergency supplyfrom battery room
VARIOMETER HUT
Station Mains 240 VAC
/2 Core
/2 Core
ABSOLUTE HUT
I) I2-core cable to Variometer Hut ante-room services X and Y PEMs, PPM-F, Dorictemperature sensor and remote S.V. trigger.
2)I2-core cable to Voriometer Hut cold porch services Z PEM.
3) Conduits between Science and Variometer Hut,ond Variometer Hut and Absolute Hutalso contain spore cables
Record 1986/21^ 24/09/355
10•0
8.0
6. 0
4.0
3•0
2.0
I .0
0.8
"b o•s
0 0.4
*4= 0.3
20.2
0-I
0-08
0-06
0.04
0-03
0.02
0•01
I^I 0•06 0•08 0•I 0.2^0.3^0.4^0.6^0.8 1.0
Period (seconds)2•0^3.0^0.4
Figure 3 Macquarie Island SP— Z curves, 1984
Record 986/21^
24/09/356
as

Corrugated fibreglass roof
Asbestos cement planks
Concrete floor
2 4m
2 2m
Concrete filled terracotta pipetopped with slate.Pier top is I.53m above floor
Walls: asbestos cement planks/sisilation/fibreglass batts /3ply plywood
1"11Power point and light switch
Figure 4. PPM hut, Macquarie IslandRecord 1986/21 24/09/357

,//
Magneticvariometerhut
de!--ce---- ,
PPM hut Cr_ ------„---,0-le- s
Magneticabsolute hut Alaskan
Omicropulsationhut
,--, RadiometerLihut
power and data cables
Store building
coil
I^
Alaskan—1.6coil^
magneticcoils
0^ 200m
_L.^ 1^1^1
I H coil
Record 1986/21
^ Figure 5. Geomagnetic huts, Macquarie Island^24/09/358