lygiadeazevedomarques thesis final - … · 26 chapter 2 analysis of acetylcholinesterase...
TRANSCRIPT

Chapter 2
Analysis of acetylcholinesterase inhibitors: bioanalysis, degradation and metabolism
Adapted from: Lygia Azevedo Marques, Martin Giera, Henk Lingeman and Wilfried Niessen.Biomedical Chromatography 2011; 25: 278-299.

25
Chapter 2 Analysis of acetylcholinesterase inhibitors
Abstract
Alzheimer’s is a neurodegenerative disease. Its symptoms are attributed to a deficiency of cholinergic neurotransmission. The drugs of choice for the treatment of Alzheimer’s disease are acetylcholinesterase (AChE) inhibitors. Starting in the 1980’s from non-specific AChE inhibitors, the first generation drugs such as physostigmine, a second generation of more selec-tive and better tolerated products has been developed. Methods to detect and quantify these drugs and their metabolites in biological samples have been developed for analysis in plasma, blood, urine and cerebrospinal fluid. Diverse detection techniques have been used, such as ultraviolet, fluorescence, electrochemical and mass spectrometry. In this review, the methods applied to the analysis of these drugs and their metabolites in different biological matrices are reviewed and discussed. The stability of these drugs in biological matrices and under stress-conditions is also included in the discussion.

26
Chapter 2 Analysis of acetylcholinesterase inhibitors
Introduction
Alzheimer’s disease (AD) is an incurable, neurodegenerative, and terminal disease first described by the German neuropathologist Alois Alzheimer in 1906. In 2006, there were 26.6 million people suffering from it worldwide, mainly among people of over 65 years old. It is estimated that in the US annually ~$ 148 billion is spent in direct and indirect costs for Alzheimer and other demen-tias (Maslow, 2008). There are three major hypotheses to explain the cause of the disease: reduced availability of the neurotransmitter acetylcholine, deposition of the amyloid-β peptides, and abnormalities of the tau protein (Gauthier and Poirier, 2008). Oxidative stress is also believed to be a significant cause in the formation of the pathology (Mamelak, 2007). Given the increasing number of people suffering from AD, many studies are in progress on how to alter the course of the disease and how to improve the quality of life for people having dementia. A number of these studies are based on the hypothesis that AD is related to a reduced availability of the neurotrans-mitter acetylcholine, which may be caused by an increased activity of the enzyme acetylcho-linesterase (AChE), which catalyzes the breakdown of acetylcholine into choline and acetic acid (Sugimoto, 2008). Acetylcholine is an important neurotransmitter in both the peripheral nervous system (PNS) and the central nervous system (CNS). Some of the drugs used in the treatment of AD are based on the inhibition of AChE, thereby increasing the level of available acetylcholine in the synaptic gap, in that way improving neuronal functions. This review pays attention to various analytical aspects related to (the development of) AChE inhibiting drugs currently applied in the treatment of AD, being: physostigmine (1), tacrine (2), donepezil (3), rivastigmine (4), galantamine (5), and huperzine A (6). The development of validated bioanalytical methods for the analysis of AChE inhibitors in biological samples is important in assessing the bioavailabil-ity and pharmacokinetics of these drugs as well as in investigations that lead to potential new drug candidates. In addition, methods described for the analysis of related compounds, like degradation products and metabolites are described in this review. This involves methods for stability indicating assays according to International Conference on Harmonization (ICH) guidelines, (ICH, 1995, ICH, 1996, ICH, 1999, ICH, 2003) which in many countries are used in regulatory affairs related to the registration of new drugs (Bakshi and Singh, 2002).
2.1 Physostigmine
Physostigmine (1), also called eserine, is an alkaloid found in Calabar beans, which are the seeds of the fabaceous plant Physostigma venenosum and which are poisonous to humans. This West African plant has been used as an ordeal poison in trials for witchcraft in Africa (Dworacek and Ruprecht, 2002). 1 can also be synthesized in several ways (Kawahara et al., 2000, Mukai et al., 2006, Nakagawa and Kawahara, 2000, Trost and Zhang, 2006). The structure of 1 is shown in Figure 2.1. Physostigmine (1) is normally used to treat glaucoma; moreover, it is an atropine antidote. Because 1 also is a reversible AChE inhibitor, capable to pass the

27
Chapter 2 Analysis of acetylcholinesterase inhibitors
blood-brain barrier, it had been tested for AD treatment. In initial studies with small groups of AD patients, the drug was effective to some degree in a few studies, while negative results were obtained in other studies. These ambiguous results are mainly due to the short half-life of 1 (15–30 min), and presumably to peripheral side effects (Sugimoto et al., 2002).
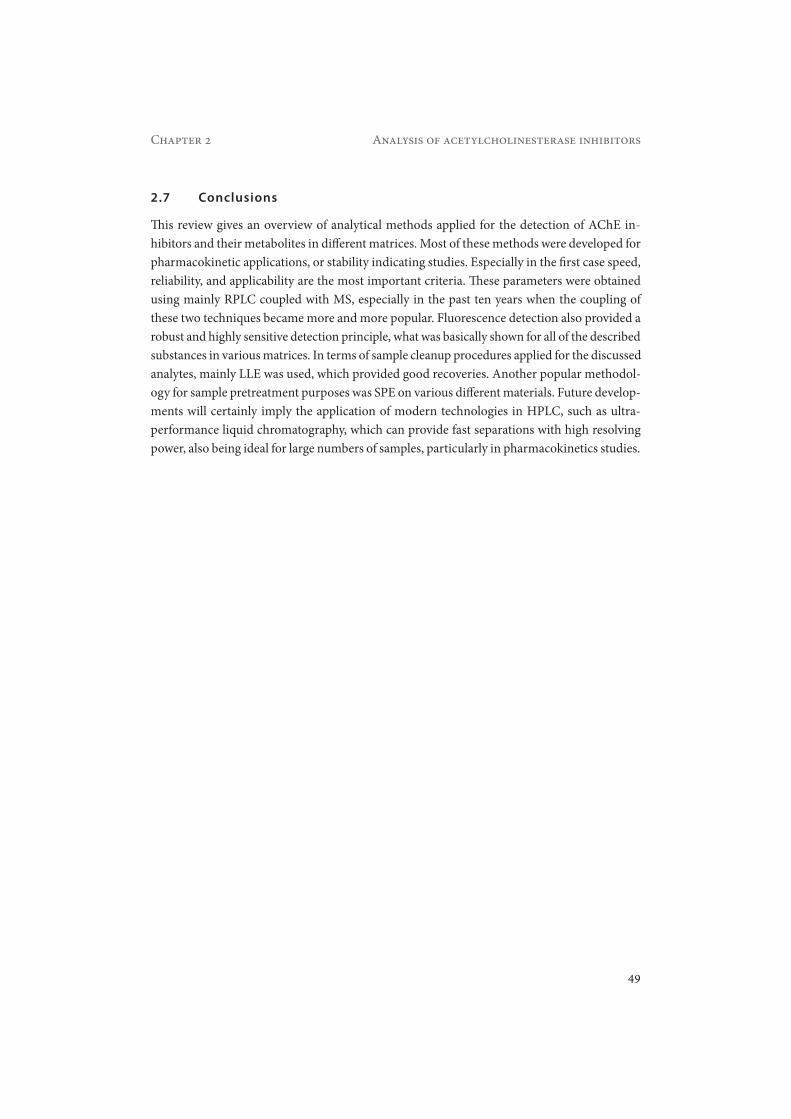
In AD treatment, physostigmine salicylate has mostly been used. Due to side effects even in a controlled release formulation designed to overcome the short half-life, further research into this drug is no longer recommended (Coelho Filho and Birks, 2001). Details for the most relevant methods developed for the analysis of 1 are given in Table 2.1.
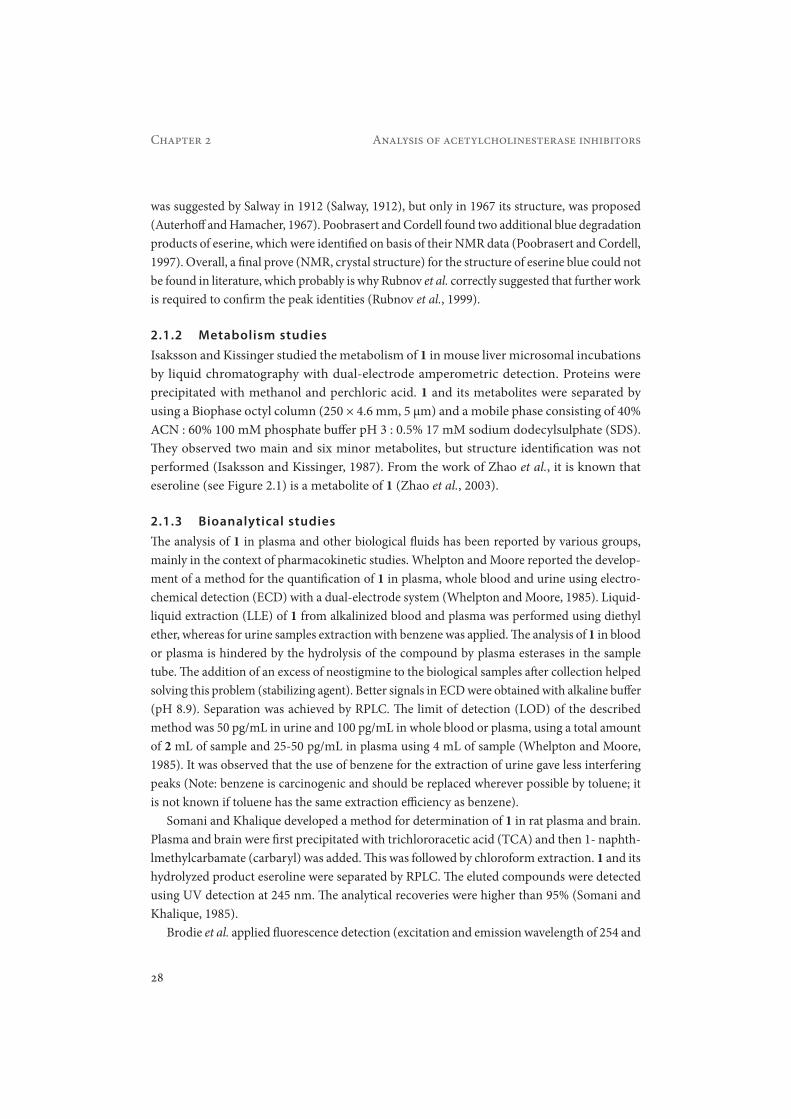
2.1.1 Degradation studiesUnder alkaline conditions (pH>9), 1 is rapidly hydrolyzed to eseroline, in the same way it is hydrolyzed by the action of the AChE and by other esterases in plasma (Lawrence and Yatim, 1990). At pH>6, eseroline can undergo subsequent autoxidation to rubreserine. The pathway of the conversion of 1 into its degradation products is shown in Figure 2.1. Rubnov et al. devel-oped an isocratic reversed-phase liquid chromatography (RPLC) method for the analysis of physostigmine salicylate and its degradation products (Rubnov et al., 1999). RPLC on a C18 column was used with a mobile phase consisting of 50% acetonitrile (ACN) : 50% 0.1 M am-monium acetate buffer (pH 6.0). UV detection at 248 and 305 nm was used; 305 nm is the optimum wavelength for detection of degradation products, whereas for 1 a better sensitivity was achieved at 248 nm. The method was capable to follow the degradation of physostigmine salicylate to eseroline, rubreserine and (probably) eserine brown (Poobrasert and Cordell, 1997, Rubnov et al., 1999). Another known degradation product of 1 is eserine blue, whose formula
Figure 2.1 Decomposition pathway of physostigmine (1), (adapted with permission from Rubnov et al., 1999).
28
Chapter 2 Analysis of acetylcholinesterase inhibitors
was suggested by Salway in 1912 (Salway, 1912), but only in 1967 its structure, was proposed (Auterhoff and Hamacher, 1967). Poobrasert and Cordell found two additional blue degradation products of eserine, which were identified on basis of their NMR data (Poobrasert and Cordell, 1997). Overall, a final prove (NMR, crystal structure) for the structure of eserine blue could not be found in literature, which probably is why Rubnov et al. correctly suggested that further work is required to confirm the peak identities (Rubnov et al., 1999).
2.1.2 Metabolism studiesIsaksson and Kissinger studied the metabolism of 1 in mouse liver microsomal incubations by liquid chromatography with dual-electrode amperometric detection. Proteins were precipitated with methanol and perchloric acid. 1 and its metabolites were separated by using a Biophase octyl column (250 × 4.6 mm, 5 μm) and a mobile phase consisting of 40% ACN : 60% 100 mM phosphate buffer pH 3 : 0.5% 17 mM sodium dodecylsulphate (SDS). They observed two main and six minor metabolites, but structure identification was not performed (Isaksson and Kissinger, 1987). From the work of Zhao et al., it is known that eseroline (see Figure 2.1) is a metabolite of 1 (Zhao et al., 2003).
2.1.3 Bioanalytical studiesThe analysis of 1 in plasma and other biological fluids has been reported by various groups, mainly in the context of pharmacokinetic studies. Whelpton and Moore reported the develop-ment of a method for the quantification of 1 in plasma, whole blood and urine using electro-chemical detection (ECD) with a dual-electrode system (Whelpton and Moore, 1985). Liquid-liquid extraction (LLE) of 1 from alkalinized blood and plasma was performed using diethyl ether, whereas for urine samples extraction with benzene was applied. The analysis of 1 in blood or plasma is hindered by the hydrolysis of the compound by plasma esterases in the sample tube. The addition of an excess of neostigmine to the biological samples after collection helped solving this problem (stabilizing agent). Better signals in ECD were obtained with alkaline buffer (pH 8.9). Separation was achieved by RPLC. The limit of detection (LOD) of the described method was 50 pg/mL in urine and 100 pg/mL in whole blood or plasma, using a total amount of 2 mL of sample and 25-50 pg/mL in plasma using 4 mL of sample (Whelpton and Moore, 1985). It was observed that the use of benzene for the extraction of urine gave less interfering peaks (Note: benzene is carcinogenic and should be replaced wherever possible by toluene; it is not known if toluene has the same extraction efficiency as benzene).
Somani and Khalique developed a method for determination of 1 in rat plasma and brain. Plasma and brain were first precipitated with trichlororacetic acid (TCA) and then 1- naphth-lmethylcarbamate (carbaryl) was added. This was followed by chloroform extraction. 1 and its hydrolyzed product eseroline were separated by RPLC. The eluted compounds were detected using UV detection at 245 nm. The analytical recoveries were higher than 95% (Somani and Khalique, 1985).
Brodie et al. applied fluorescence detection (excitation and emission wavelength of 254 and
29
Chapter 2 Analysis of acetylcholinesterase inhibitors
346 nm, respectively) for the determination of 1 in plasma (Brodie et al., 1987). After mixing the plasma with ammonium hydroxide, LLE was performed with methyl tert-butyl ether. Pyridostigmine was added as stabilizing agent. A LOD of 0.1 ng/mL was achieved also using 2 mL of blood sample (Brodie et al., 1987).
Elsayed et al. reported a method involving ion-pair LLE, normal phase high performance liquid chromatography (HPLC) separation, and fluorescence detection (excitation and emission wavelength of 240 nm and 360 nm, respectively) for 1 in human plasma (Elsayed et al., 1989). The analytes were first extracted from plasma with dichloromethane and then back-extracted into water containing 1 mM tetrabutylammonium. A silica column was used with a mobile phase of 20% ACN : 80% 0.01 M NaH2PO4 and 2.5 mM tetramethylammonium (pH 3.0). The LOD of the method was 0.1 ng/mL using 1 mL of a plasma sample (Elsayed et al., 1989).
Unni et al. determined 1 in human plasma and cerebrospinal fluid (CSF) using liquid chro-matography with electrochemical detection (Unni et al., 1989). Compound 1 was extracted with diethylether from plasma samples (2 mL) after alkalization with 0.5 mL of an ammonium hy-droxide solution. CSF samples (0.5 mL) were acidified with 50 μL of trifluoroacetic acid and extracted with chloroform. Alkaline precipitation of plasma proteins was preferred as under acidic conditions coelution of 1 with another substance was observed. The recoveries achieved were 60% for plasma and 78% for CSF. Separation was achieved with a normal phase analytical column, with 90% methanol : 10% 0.01 M sodium acetate (pH 4.6) as mobile phase. The LOD achieved with this method was 0.5 ng/mL for plasma and CSF samples (Unni et al., 1989).
Miller and Verma developed a radioimmunoassay to study the time course of plasma concentrations and tissue distributions of 1 in rats (Miller and Verma, 1989). Lawrence and Yatim developed a method for the determination of 1 in plasma, whole blood and CSF samples (Lawrence and Yatim, 1990). Neostigmine was used as stabilizing agent. Sample pretreatment was achieved using solid-phase extraction (SPE) of samples adjusted to pH 4 with a 0.01 M citrate buffer on a cyano column. Elution was accomplished with 1.5 mL of 20% ACN in citrate buffer. Separation was achieved on a reversed phase analytical column with a mobile phase consisting of 8 % ACN : 92% 100 mM sodium citrate buffer (pH 4.0) with 0.02% sodium oc-tylsulphate and 0.05% octylamine. The recovery of 1 was 99 ± 7% from standard solutions (pH 4) and 102 ± 4% from CSF. In the analysis of plasma samples, the use of methanol as precipitat-ing agent gave better recoveries (82 ± 4%) than the use of perchloric acid (62 ± 4%). The LOD was 0.2 ng/mL, using ECD, which is four times higher than in the method reported by Whelp-ton and Moore (1985). On the other hand, the SPE procedure can be performed at acidic conditions, thus reducing the alkaline hydrolysis of 1 (Lawrence and Yatim, 1990).
Zhao et al. performed the determination of 1 and its major metabolite eseroline in rat plasma using a one-step SPE procedure and photodiode array (PDA) detection (Zhao et al., 2003). This method was applied to study metabolic stability and pharmacokinetics of 1 in rats. Dif-ferent SPE packing materials were compared. The best results were obtained using a Bond Elut C18 column with a recovery of 88 ± 3% at a concentration of 0.25 μg/mL. A reversed phase column was used for separation with 15 % ACN : 85 % 10 mM sodium dihydrogen phosphate
30
Chapter 2 Analysis of acetylcholinesterase inhibitors
(pH 3.0) as mobile phase. The LOD of this method was 10 ng/mL for 1 and 25 ng/mL for es-eroline using 0.1 mL of plasma (Zhao et al., 2003).
2.2 Tacrine
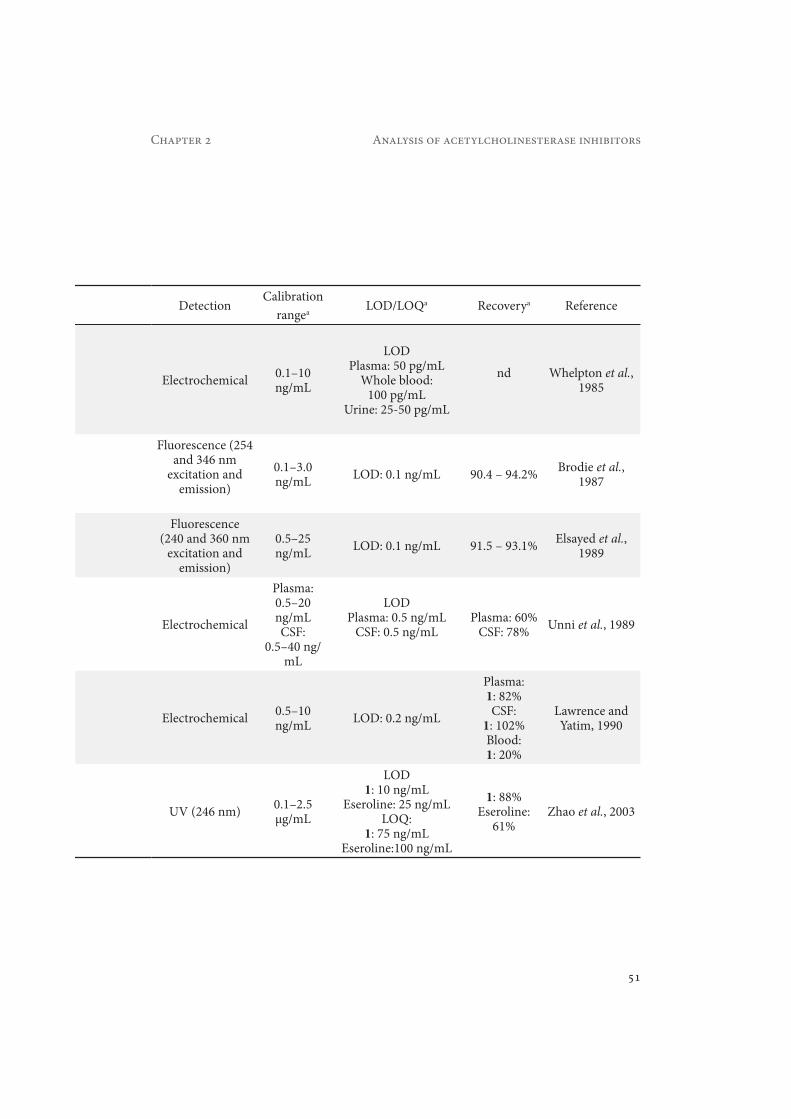
Tacrine (2) was the first drug for the treatment of AD which was clinically tested in larger patient regimes. It was approved by the FDA in 1993 (Giacobini, 1998), but is now no longer in use because of severe side effects (Polinsky, 1998). 2 is a centrally acting reversible cholinest-erase inhibitor. 2 was first synthesized by Albert and Gledhill in 1945 (Albert and Gledhill, 1945), but its pharmacology towards AChE was started being studied in 1986 by Summers et al. (Summers et al., 1986). The structure of 2 is shown in Figure 2.2. Details for the most rel-evant methods developed for the analysis of 2 are given in Table 2.2.
2.2.1 Degradation studiesSathyan et al. investigated the stability of 2 at room temperature and at 37 °C in both water and phosphate buffers at pH 1.3; 3.2; 5.5; 6.7; 7.8; and 8 (Sathyan et al., 1995). These solutions were analyzed on different days over a period of 30 days. 2 was found to be very stable under both acidic and more basic conditions. In a study investigating the chemical degradation of 2 in poly(n-butylcyanoacrylate), Wilson et al. obtained comparable results (Wilson et al., 2008). They investigated samples stored at room temperature (15–20 °C), refrigerated (3–5 °C), or at 37 °C (at a relative humidity of 75%) over a period of 3 months. 2 and the polymer were found to be physically and chemically stable and retained their pharmaceutical properties under these conditions over the tested period (Wilson et al., 2008).
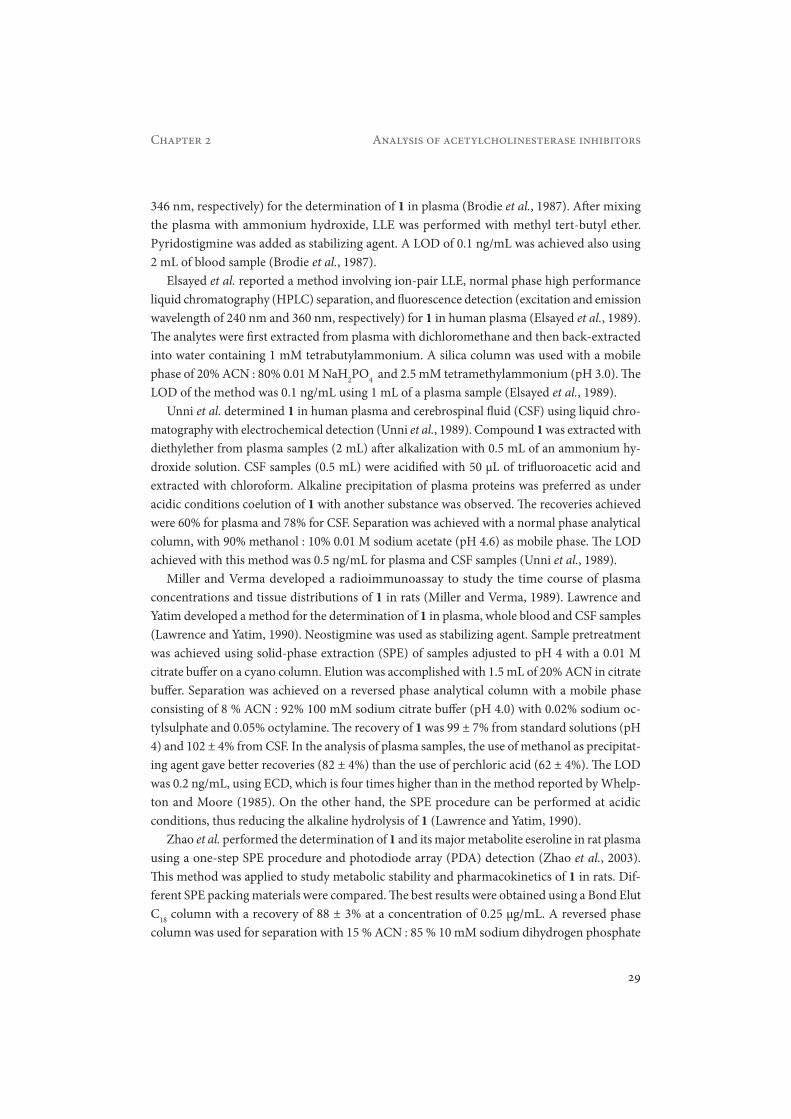
Marques et al. performed a stability study of 2 (Marques et al., 2010a). No degradation products were observed after reflux in either 2 M hydrochloric acid (HCl) or 2 M sodium hydroxide (NaOH) solution for 5 h. However, when the drug was refluxed with 3% of hydro-gen peroxide (H2O2) for 2 h, more than 50% of 2 were degraded. In this study, the bioactivity of the degradation products was also investigated. Part of the RPLC column eluate was split to an on-line continuous-flow AChE bioassay. Some of the degradation products formed under H2O2 treatment were found to inhibit AChE. The structures of tacrine (2) and the identified bioactive compounds are shown in Figure 2.2. The degradation products were identified by liquid chromatography–mass spectrometry (LC–MS) and NMR (Marques et al., 2010a).
2.2.2 Metabolism studiesIn vitro studies have shown that the cytochrome P450 enzyme 1A2 (CYP1A2) is the major enzyme involved in the oxidation of 2 (Hansen et al., 1998). The main metabolic pathway involves hydroxylation of the saturated ring at the position 1, 2, and 4. These hydroxylated metabolites have been reported to be potent AChE inhibitors and to be active in various animal

31
Chapter 2 Analysis of acetylcholinesterase inhibitors
Figure 2.2 Metabolism and decomposition pathway of tacrine (2) (adapted with permission from Pool et al., 1997 and Marques et al., 2010a.

32
Chapter 2 Analysis of acetylcholinesterase inhibitors
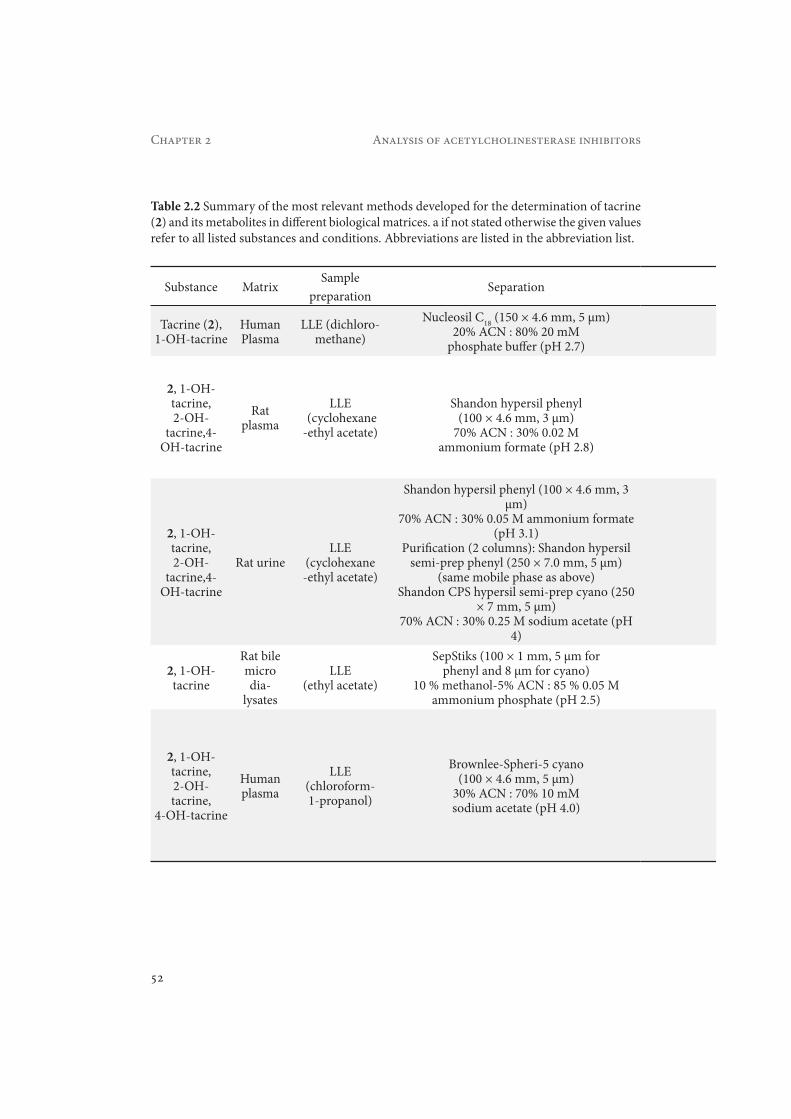
models (Hsu et al., 1990a). Hsu et al. reported the urinary metabolic profiling of 2 in rat using UV detection for the quantification and direct-probe electron ionization MS and 1H-NMR analysis for identification (Hsu et al., 1990b). The sample cleanup involved LLE with 1:1 cy-clohexane : ethyl acetate. Prior to identification, fractionation of the urine samples was performed on a semi-preparative analytical phenyl column. Each fraction was subsequently purified on a semi-preparative cyano column. This cleanup procedure resulted in clean samples without interferences for MS and 1H-NMR analysis. In this way, the hydroxylated metabolites of 2 in urine were isolated and identified (Hsu et al., 1990b).
Pool et al. used radio labeled [14C]-tacrine to investigate the major excretion route of 2 in rats, dogs and humans (Pool et al., 1997). Metabolic profiling and identification was achieved using gradient HPLC in combination with on-line radioactivity detection and thermospray (TSP) LC–MS. The sample cleanup procedure for urine samples was LLE with ethyl acetate; a typical recovery of 60% for all the metabolites was achieved. For plasma samples, a protein precipitation step with ethanol preceded the LLE (recovery ranged between 70-90%). Indi-vidual metabolites were isolated using a semi-preparative phenyl column with a linear gradi-ent elution starting from 0% ACN : 50 mM aqueous ammonium formate (pH 3.1) to a final concentration of 20 % of ACN. Further purification was achieved with a cyano column. The purified fractions were analyzed by TSP-MS and, if sufficient sample was available, addition-ally by 1H-NMR analysis. The major route of excretion was via the urine in all three species. Several mono-hydroxylated metabolites were found, involving hydroxylation at either the ali-phatic or the aromatic ring. In addition, 1,3-, 5,6- and 7,8-dihydroxylated metabolites were observed, as well as glucuronic acid conjugates. The metabolic pathway of 2, established in this study, is shown in Figure 2.2 (Pool et al., 1997).
Bao et al. reported the use of a trapping-column system for the on-line trapping and pre-concentration of the metabolites of 2 generated by dog liver microsomal incubations prior to analysis using MS and especially 1H-NMR (Bao et al., 2002). The metabolic mixture is sepa-rated by RPLC in the first column run. The metabolites are detected by a UV detector (320 nm for 1-hydroxy-tacrine). By valve switching, the analyte fraction is introduced onto the trapping column. After switching the valve again, the concentrated peak is back-flush eluted using a solvent containing 50% D3-ACN into a NMR probe. This trapping-column system is espe-cially useful if the amount of analyte is limited and when the chromatographic peaks are well separated (Bao et al., 2002). By preconcentrating the peaks eluting from the HPLC, the data acquisition time of the NMR experiments can be reduced.
2.2.3 Bioanalytical studiesEkman et al. developed a method to determine 2 and 1-OH-tacrine in human plasma (Ekman et al., 1989). Sample preparation was carried out by extraction with dichloromethane. Recov-eries for 2 and 1-OH-tacrine were higher than 93%. Separation was achieved with RPLC and UV detection. The LOD for this method was 0.3 ng/mL for both compounds. The method was used to determine 2 and 1-OH-tacrine in plasma of Alzheimer’s patients (Ekman et al., 1989).
33
Chapter 2 Analysis of acetylcholinesterase inhibitors
Hsu et al. developed a RPLC method for the determination of 2 and three of its hydroxy-lated metabolites in rat plasma (Hsu et al., 1990a). The cleanup was achieved with LLE using a 1:1 (v/v) mixture of cyclohexane : ethyl acetate. The recovery achieved was ~95% for tacrine, ~70% for 1-OH-tacrine, ~34% for 2-OH-tacrine, and ~84% for 4-OH-tacrine. The LOD was 1 ng/mL for all analytes using UV detection (Hsu et al., 1990a). The mobile phase used was 70% ACN : 30% 50 mM ammonium acetate (pH 3.1).
In another study, Hadwiger et al. determined 2 and its metabolites in rat bile microdialysates (Hadwiger et al., 1994). The in vivo microdialysis sampling is increasingly used in pharmacoki-netic and metabolic profiling studies. 2 and its metabolites were isolated from the microdialysates using LLE with ethyl acetate achieving a recovery of >84% for 2 and of >93% for 1-OH-tacrine. The compounds were analyzed using RPLC with a 1 mm i.d. microbore column packed with a phenyl stationary phase and fluorescence detection (excitation and emission at 330 nm 365 nm, respectively). A LOD of 0.25 ng/mL was achieved for 2 in a 5 μL sample. Because of the low detection limits of the microbore LC–fluorescence method, 2 could be continuously monitored in the bile for more than 4 hours using microdialysis sampling (Hadwiger et al., 1994).
Haughey et al. developed a method for the simultaneous determination of 2, 1-OH-tacrine, 2-OH-tacrine and 4-OH-tacrine in human plasma (Haughey et al., 1994). Plasma samples were alkalinized and extracted with a mixture of chloroform : 1-propanol (9 : 1, v/v). Recover-ies ranged from 68-83% for 2 and its metabolites. The separation was achieved by RPLC on a cyano column. The mobile phase consisted of 30% ACN : 70% 10 mM sodium acetate buffer (pH 4.0), the column eluent was monitored using fluorescence detection (240 and 355 nm, excitation and emission). The LOD achieved with this method was 0.5 ng/mL for 2 and 4-OH-tacrine and 1 ng/mL for 2-OH-tacrine and 1-OH-tacrine. The sensitivity of the method was adequate for the determination of 2 and its metabolites after administration of 40 mg single dose of Cognex® (tacrine tablets) to healthy volunteers (Haughey et al., 1994).
Aymard et al. developed a HPLC method with UV (239 nm) and fluorescence (330 and 360 nm excitation and emission wavelength) detection for the simultaneous determination of 2, nimodipine and their respective metabolites in the plasma of AD patients (Aymard et al., 1998). Sample preparation was carried out by using ACN as precipitating agent, followed by LLE with methyl tert.-butyl-ether : n-hexane (1:1). The recovery obtained was 67% for all compounds, except for 2-OH-tacrine for which it was 39%. Chromatography was carried out using a RP Shandon Hypersil phenyl column with 39% ACN : 61% 4.4 mM KH2PO4 buffer as mobile phase. The LOQ of the method was 0.3 ng/mL for 2 and its metabolites with 1 mL of plasma required (Aymard et al., 1998).
Hansen et al. reported the determination of 2 and three metabolites in human plasma and urine (Hansen et al., 1998). The method was based on LLE with ethyl acetate, isocratic RPLC, and fluorescence detection (330 and 365 nm for excitation and emission, respectively). The recoveries ranged from 84%-105% in plasma and from 64-100% in urine for all four compounds. The LODs achieved were 0.5 nM (0.11 ng/mL) for 2-OH-tacrine and 4-OHtacrine, and 2 nM (0.43 ng/mL) for 1-OH-tacrine and 2 in plasma, and 60 nM (12.9 ng/mL) for 2-OH-tacrine
34
Chapter 2 Analysis of acetylcholinesterase inhibitors
and 4-OH-tacrine, 30 nM (6.4 ng/mL) for 1-OH-tacrine, and 80 nM (17.1ng/mL) for 2 in urine (Hansen et al., 1998). In urine, the LODs were much higher than in plasma, which indicates that for urine a different cleanup method may be needed.
Chollet et al. developed a method for the therapeutic monitoring of 2 in human plasma (Chollet et al., 2000). The method involved protein precipitation with ACN and a fast iso-cratic separation on a cyano column eluted in reversed-phase mode with 55% ACN : 45% 0.05 M NaH2PO4 (pH 7.0) as mobile phase. The entire sample preparation took place in an HPLC vial and no further liquid transfer was required. The mean overall recovery achieved was >87%. The LOD was in the order of 0.4 ng/mL, requiring 0.5 mL of plasma. The method was applied to the therapeutic monitoring of 2 over a 60 week treatment period in patients suffering from AD (Chollet et al., 2000).
Jiang et al. developed a method for the simultaneous determination of N-butyramide-tacrine (BTHA) and 2 in mouse plasma and brain homogenate (Jiang et al., 2003). BTHA was synthe-sized as a prodrug of 2. Sample preparation was done by protein precipitation with methanol. The recoveries for BTHA in plasma or brain at 250 ng/mL were 91% and 69%, respectively. The recoveries for 2 in plasma or brain at 25 ng/mL were 71% and 73%, respectively. Separation was carried out using RPLC, with UV detection (240 nm). The LOD of the method was 200 ng/mL for BTHA and 20 ng/mL for 2 in both matrices. The results of tissue distribution studies showed that the prodrug provided a promising approach for brain target delivery, with sustained brain levels of 2 and significantly reduced toxicity of the parent drug (Jiang et al., 2003).
2.3 Donepezil
Donepezil (3) is an AChE inhibitor which was approved by the FDA in 1996 (Liang and Tang, 2004). It is a piperidine-based, reversible AChE inhibitor with a significantly lower affinity for butyrylcholinesterase (Scriabine, 2004). The drug is well tolerated with typical cholinergic side effects. Importantly, there has been no evidence of clinical changes in laboratory parameters, including liver function, as reported for 2 (Racchi et al., 2004).
Donezepil (3) was first synthesized in 1992 by Sugimoto et al. (Sugimoto et al., 1992). Soon, it was tested against AChE and found to be a highly selective inhibitor of the enzyme. Recently, a more economic process has been reported for a large-scale synthesis (Niphade et al., 2008). Details for the most relevant methods developed for the analysis of 3 are given in Table 2.3.
2.3.1 Degradation studiesPappa et al. validated a RPLC method to determine donepezil hydrochloride in tablets (Pappa et al., 2002). The mobile phase was 50% methanol : 50% 0.02 M Na2HPO4 : 0.5% triethylamine (pH 2.7), and UV detection at 268 nm. The authors observed degradation of donepezil in 1 M HCl, 1 M NaOH and 30% of H2O2 under reflux. Degradation products were not characterized (Pappa et al., 2002).

35
Chapter 2 Analysis of acetylcholinesterase inhibitors
Yamreudeewong et al. described a method to determine the stability of 3 in an extempora-neously prepared oral liquid, that is a mixture of sorbitol and water, after 4 weeks storage at both room temperature (22–26 °C) and in the refrigerator (4–8 °C) (Yamreudeewong et al., 2006). They applied a method described earlier (Pappa et al., 2002). Donepezil (3) was found to be stable with changes in concentrations within ± 10% of the initial concentrations after a storage time of up to 4 weeks (Yamreudeewong et al., 2006).
Kafkala et al. validated a RPLC method for determination of donepezil hydrochloride and its impurities in oral pharmaceutical formulations (Kafkala et al., 2008). The separation was achieved using a mobile phase of 38% methanol : 62% 0.005 M K2HPO4 (pH 3.7). The elution was isocratic for the first 15 min and altered gradually to 62% methanol : 38% 0.005M K2HPO4 (pH 3.7) over 12 min. PDA detection was used for the spectrum and peak purity extraction while the analysis was carried out at 270 nm. A total of 4 impurities were separated. The structures of these impurities are shown in Figure 2.3 (Kafkala et al., 2008).
2.3.2 Metabolism studiesThe metabolism of 3 takes place in the liver by the isoenzymes CYP2D6 and CYP3A4, which produce four major metabolites, corresponding to three metabolic pathways: O-demethylation to metabolites M1 and M2, with partial glucuronidation to metabolites M11 and M12, hydrolysis to metabolite M8 and N-oxidation to metabolite M5 and M6 (see Figure 2.4). Two of which are still active against AChE (M1 and M3) (Matsui et al., 1999a, Patel et al., 2008, Tiseo et al., 1998).
Matsui et al. investigated the absorption, distribution, metabolism, and excretion (ADME) of 14C labeled 3 in male Sprague-Dawley rats after a single oral administration (Matsui et al., 1999a). Metabolic profiling was performed in plasma, brain, liver, and kidneys at 0.5 h after administration and in urine, feces, and bile, 24 h after administration. For identification purposes, the metabolites were first isolated by thin layer chromatography (n-butanol : acetic acid : water 4:1:1) and subsequently purified with RPLC (52% ACN : 48 % 5 mM SDS (pH 2.5). The structure elucidation was done using fast-atom bombardment MS and 1H-NMR. The proposed metabolic pathway of 3 in rats is shown in Figure 2.4.
2.3.3 Bioanalytical studiesHaginaka and Seyama developed a method for determination of 3 enantiomers in rat plasma (Haginaka and Chikako, 1992). An ovomucoid (OVM)-bonded column could resolve both enantiomers of 3. On the other hand, preliminary studies revealed that 3 and a plausible me-tabolite of 3 could not be resolved on the OVM-bonded column, so they developed a coupled achiral-chiral chromatographic method involving a trapping column. Detection was achieved with fluorescence detection at 318 nm and 390 nm as excitation and emission wavelength, respectively. The detection limits of 3 and the enantiomers were 1 ng/mL with an injection volume of 0.2 mL of deproteinized plasma samples (Haginaka and Chikako, 1992).
Matsui et al. developed a method to determine the enantiomers of 3 in human plasma (Matsui et al., 1999b). The enantiomers show a slightly different extent of AChE inhibition.

36
Chapter 2 Analysis of acetylcholinesterase inhibitors
Therefore, it is important to clarify the pharmacokinetics profiles of the individual isomers in a drug development program. To prevent the interconversion of donepezil enantiomers (via a keto-enol intermediate), a mild cleanup procedure was needed. LLE from 1 mL of plasma was achieved with 3% isopropanol in n-hexane (recovery ~90%). The enantiomers of 3 were sepa-rated and quantified using an avidin-conjugated column that is suitable for RPLC-MS analysis; the achieved LOQ for both enantiomers was 0.020 ng/mL. The mobile phase used was a solu-tion of 25 % methanol : 75% 10 mM formic acid (Matsui et al., 1999b).
Next to identifying the 3- metabolites, as described in the metabolism section, Matsui et al. investigated the quantitative aspects of the ADME of 3 in male Sprague-Dawley rats after a single oral administration (Matsui et al., 1999a). For this, quantitative determinations of 3 in plasma and brain were performed using RPLC and UV detection. With an assay validated within the ranges 1.0 to 200 ng/mL for plasma, and 2.0 to 500 ng/mL for brain homogenate samples, 3 and its metabolites were quantified in plasma, brain, liver, and kidneys 0.5 h after administration and in urine, feces, and bile for 24 h after administration (Matsui et al., 1999a).
Xie et al. developed a method to determine 3 in human plasma using LC-MS/MS (Xie et al., 2006). Sample preparation was carried out by alkalinizing the plasma with phosphate buffer (pH 14) followed by extraction with ethyl acetate. The recovery was higher than 65%. Chro-matography was carried on a C18 reversed phase column. The substance was measured using
Figure 2.3 Chemical structures of donepezil hydrochloride and its impurities (adapted with permission from Kafkala et al., 2008).

37
Chapter 2 Analysis of acetylcholinesterase inhibitors
single reaction monitoring (SRM), employing the transition m/z 380 → 91. The lower limit of quantification (LLOQ) achieved for this method was 0.1 ng/mL. The method was applied to determine 3 in plasma during a pharmacokinetic study involving healthy volunteers orally receiving 5 mg of 3 (Xie et al., 2006).
Radwan et al. developed a stereoselective HPLC method for the simultaneous determination of 3 enantiomers in tablets and plasma (Radwan et al., 2006). Enantiomeric resolution was achieved on a Chiracel OD column using UV detection at 268 nm. The mobile phase consisted of 87% n-hexane : 12.9% isopropanol : 0.1% triethylamine. For sample preparation proteins were precipitated with ACN. Recoveries were higher than 93% for both enantiomers. The LOD achieved with this method was 20 ng/mL. The method was used to estimate the pharmacokinetic param-eters of 3 enantiomers up to 12 h after oral administration in rats (Radwan et al., 2006).
Apostolou et al. developed a method for the detection of 3 in human plasma using a com-pletely automated 96-well format LLE system and subsequent LC-MS/MS detection (Apos-tolou et al., 2007). The limit of quantification (LOQ) achieved with this method was 0.1 ng/mL.
In another study, Nakashima et al. increased the speed of the analysis of 3 in human and rat plasma as well as in blood and brain microdialysates by using a short C30 column in com-bination with fluorescence detection (Nakashima et al., 2006). The mobile phase used was 27% ACN : 73% 25 mM citric acid/50 mM Na2HPO4 (pH 6.0) containing 3.5 mM sodium 1-oc-tanesulfonate for plasma and 17% ACN : 3% methanol : 80% water containing 0.01% acetic acid was used as mobile phase for blood and brain microdialysates samples.
Yasui-Furukori et al. developed a simple method for the determination of 3 in human plasma, based on UV detection and the use of cisapride as internal standard (IS). Whereas the LOD and the selectivity of the method were rather poor (3 ng/mL), they were reported to be sufficient for the measurement of therapeutic concentration of 3 (Yasui-Furukori et al., 2002).
Asakawa et al. reported a fully automated method for the detection of 3 in dog plasma (Asakawa et al., 2007). Six HPLC pumps are used to deliver the solvents for washing, pretreat-ment and separation. Biological samples can be directly injected because an in-line filter performs the pretreatment of the samples. Furthermore, two C18 columns are positioned between the pumps and the auto sampler to purify the mobile phases. The typical LOD with this approach is 1 pg/mL of 3 in dog plasma (Asakawa et al., 2007).
Patel et al. developed a method for the simultaneous analysis of 3 and its active metabolite 6-O-desmethyl-donepezil (6-ODD, metabolite M1 in Figure 2.4) in human plasma (Patel et al., 2008). The sample pretreatment was done using SPE on Waters Oasis HLB cartridges. The mean recoveries obtained for 3 and 6-ODD were 62 % and 69 %, respectively. Donepezil (3) and 6-ODD in extracted plasma samples were stable for 96 h under refrigerated condition (−2 to 10 °C). The best RPLC in terms of resolution, speed, efficiency, and peak shape was achieved with a Novapak C18 column and a mobile phase consisting of 20 % methanol : 17% ACN : 63% 20 mM ammonium acetate (pH 3.43, 0.2% formic acid). MS in SRM mode was applied for the detection. An efficient RPLC separation is important because the two isomeric metabolites 5-ODD and 6-ODD have the same SRM transition (m/z 366.3 → 91.3). The LOQs achieved were

38
Chapter 2 Analysis of acetylcholinesterase inhibitors
0.10 ng/mL and 0.020 ng/mL for 3 and 6-ODD, respectively (Patel et al., 2008). The same sample pretreatment method was later on applied by Shah et al. (Shah et al., 2009). They achieved a 20% better recovery than Patel et al. by eliminating the evaporation and reconstitution step.
Yeh et al. applied field-amplified sampling stacking (FASS) in capillary electrophoresis (CE) for the quantitative analysis of 3 in human plasma (Yeh et al., 2008). FASS is used to enhance sensitivity (Chien and Burgi, 1991). An amount of 200 μL of plasma was pretreated by LLE with 3% isopropanol : 97% n-hexane, providing a recovery better than 94% (measured at 3 concentration levels). The LOQ achieved with this method was 0.5 ng/mL (Yeh et al., 2008).
2.4 Rivastigmine
Rivastigmine (4) is a pseudo-irreversible AChE inhibitor of the carbamate type. It was introduced for the treatment of mild to moderate dementia in the European Union in 1998 and in the US in 2000 (Bhatt et al., 2007). It is synthesized using a very expensive chemical intermediate N-ethyl-N-methylcarbamoyl chloride in its synthesis (Mustazza et al., 2002).
Figure 2.4 Proposed metabolic pathways of donepezil (3) (adapted with permission from Matsui et al., 1999a).

39
Chapter 2 Analysis of acetylcholinesterase inhibitors
Mustazza et al. reported the synthesis of phenylcarbamates for good candidates of AChE in order to reduce the cost of the synthesis (Mustazza et al., 2002). Details for the most relevant methods developed for the analysis of 4 are given in Table 2.4.
2.4.1 Degradation studiesRao et al. developed a stability indicating LC method to determine the rivastigmine (4) hy-drolysis product (S)-3-(1-dimethylaminoethyl) phenol (see Figure 2.5) in bulk samples (Rao et al., 2005). The method involves the use of a RP-18 column and a mobile phase of 28% ACN : 72% sodium 1-heptane sulfonate (pH 3.0, adjusted with 0.01 M phosphoric acid).
Rivastigmine tartrate was found to be stable under all forced conditions tested (acidic, oxidative, elevated temperature and under irradiation), except in alkaline solution, where hydrolysis takes place (Figure 2.5). The method was fully validated to determine rivastigmine tartrate in bulk drug as well as in formulations (Rao et al., 2005).
2.4.2 Metabolism studies4 is rapidly and extensively metabolized via esterase-mediated hydrolysis of the carbamate moiety to the decarbamylated metabolite (S)-3-(1 dimethylaminoethyl)-phenol (NAP 226-90) (Figure 2.5) (Pommier and Frigola, 2003).
Lee et al. investigated the rate and the extent of absorption and metabolism of 4 after site-specific delivery of the drug in the gastrointestinal tract (GI) in humans using a naso-intestinal intubation technique (Lee et al., 2004). The drug (3mg) was added to 10 mL water and the entire amount was administered through the tube to the specified site within the GI tract. It was observed that 4 was rapidly and equally well absorbed following specific delivery to upper and lower regions of the small intestine and from the ascending colon. The concentrations of NAP 226-90 were similar among different GI regions, suggesting that GI metabolism of 4 to its major metabolite NAP 226-90 was similar in different segments of the GI. However the authors suggested that a lower dose of 4 should be tested before a final conclusion can be made (Lee et al., 2004).
2.4.3 Bioanalytical studiesHossain developed a method to estimate the absolute bioavailability of 4 in patients with mild to moderate AD (Hossain, 2002). Plasma concentrations of 4 and its metabolite NAP 226-90 were measured with gas chromatography-mass spectrometry (GC-MS) (Hossain, 2002).
Pommier and Frigola developed a method to quantify 4 and the metabolite NAP 226-90 in human plasma (Pommier and Frigola, 2003). The cleanup procedure involved a LLE with methyl tert.-butyl-ether at basic pH and simultaneous derivatization of NAP 226-90 with propionic acid anhydride. The recovery was 115% for rivastigmine and 88% for its metabolite. The analysis was performed with RPLC coupled to atmospheric-pressure chemical ionization (APCI) MS. The LOQ of this method was 0.2 ng/mL for 4 requiring 0.5 mL of plasma (Pommier and Frigola, 2003).
Sha et al. developed a method for the quantification of 4 in canine plasma samples using headspace solid-phase microextraction (SPME) and capillary GC-MS with electron impact

40
Chapter 2 Analysis of acetylcholinesterase inhibitors
ionization (EI) (Sha et al., 2004). The aim was to develop a simple, fast and solvent-free extrac-tion method for 4 from plasma. The LOQ of this method was also 0.2 ng/mL, also requiring 0.5 mL of plasma (Sha et al., 2004).
Enz et al. developed a method for the simultaneous determination of 4 and its metabolite NAP 226-90 in rat plasma and brain homogenates (Enz et al., 2004). 4 and NAP 226-90 were extracted from plasma and brain using ethyl acetate. Recoveries for 4 and NAP 226-90 were 93% and 95%, respectively, for both matrices. Separation was achieved by RPLC and ESI-MS detection. The LOQ achieved with this method was 0.13 ng/mL in plasma and 0.6 ng/g in brain for 4 and 0.17 ng/mL in plasma and 0.83 ng/g in brain for NAP 226-90. An amount of 0.1 mL of rat plasma was required (Enz et al., 2004). The results of Enz et al. were comparable with the results obtained by the method of Pommier and Frigola (Pommier and Frigola, 2003), while both applied mass spectrometric detection with different ionization technique ESI and APCI.
Bhatt et al. developed a method for the detection of 4 in human plasma which they claim to reduce sample preparation and analysis time (Bhatt et al., 2007), what remains questionable as the method involved SPE as sample pretreatment. The recovery achieved was 86.3%. The sepa-ration was carried out using RPLC and the total run time for each sample analysis was 2.0 min which is a 4-times reduction compared to Sha et al. (Sha et al., 2004). With positive-ion elec-trospray (ESI) MS detection, the LOQ of this method also was 0.2 ng/mL (Bhatt et al., 2007).
Frankfort et al. reported a method for the determination of 4 and its metabolite NAP 226-90 in human plasma. The aim of the work was to further simplify the cleanup procedure. Using protein precipitation with methanol only, recoveries of 70.9% for 4 and 85.7% for NAP 226- 90 were achieved (Frankfort et al., 2006).
Karthik et al. developed a method for determination of 4 in rat plasma (Karthik et al., 2008). The chromatographic separation was achieved by RPLC, using a monomeric C18 column with a mobile phase consisting of 35% ACN : 75% 20 mM phosphate buffer (pH 3.0). The compound was detected using fluorescence detection at 220 nm and 293 nm as excitation and emission wavelengths, respectively. The LOD of this method was 25 ng/mL. The method was applied in
Figure 2.5 Structure of rivastigmine tartrate (4) and its hydrolysis product NAP 226-90 (adapted with permission from Rao et al., 2005).

41
Chapter 2 Analysis of acetylcholinesterase inhibitors
a pharmacokinetic study of 4 in rats (Karthik et al., 2008).Hsieh et al. developed a method for the simultaneous determination of 4, NAP 226-90 and
5 in human plasma (Hsieh et al., 2009). The method is based on the use of micellar electroki-netic chromatography (MEKC), first introduced by Terabe (Terabe, 2008). The sample cleanup using LLE with diethylether provided recoveries of 90 and 99% for 4 at 2 and 50 ng/mL, re-spectively, and of 90 and 100.8% for NAP 226-90 at 2 and 50 ng/mL, respectively. UV detection was applied at 214 or 200 nm. A 20% ACN : 25 mM Tris buffer (pH 5.0) with 160 mM sodium octansulfonate (SOS) : 0.01% poly(vinylpyrrolidinone) was chosen as the separation buffer in MEKC (Hsieh et al., 2009).
2.5 Galantamine
Galantamine (5) is the most recently approved drug for the treatment of AD by the FDA in 2001 (Hoffmann and Hock, 2004). It is a tertiary alkaloid, isolated from the bulbs and flowers of Caucasian snowdrop (Galanthus woronowii, Amaryllidaceae) (see Figure 2.6). The cost of obtaining galantamine from natural sources (Narcissus species) (de Jong et al., 2006) is very high, and a total synthesis procedure via (2)-narwedine has been extensively worked out for large-scale industrial production (Chang et al., 2010, Satcharoen et al., 2007).
Galantamine (5) started in the market with the commercial name Reminyl which was changed in 2005 to Razadyne) (Berkov et al., 2008, Leonard et al., 2005). Details for the most relevant methods developed for the analysis of 5 are given in Table 2.5.
2.5.1 Degradation studiesThe stability of 5 in methanol spiked with 2% bovine serum albumine (BSA), in human plasma and whole blood was studied by Verhaeghe et al. (Verhaeghe et al., 2003). In human plasma, 5 was found to be stable for 72 h at room temperature and in human blood for 72 h at 40 °C. In methanol spiked with 2% BSA, stability of 5 was shown for 6 months at -20 °C, for 1 month at 4 °C, and for 3 days at room temperature (Verhaeghe et al., 2003).
Leonard et al. conducted an accelerated stability study for two salts of 5: the lactate and the hydrobromide, the latter being the one that is used in the commercial drug. The compound degradation was monitored at three different pH values (2.5, 5.2, and 10.0), at three different temperatures (25, 40, and 80 °C) after 1, 7, and 28 days as well as after 2 months. It was found that the lactate exhibits a comparable or superior stability when compared to the hydrobromide under the conditions tested. Degradation was observed after two months of storage at high temperature and in combination of extreme pH (2.5 and 10.0). For instance, both hydrobromide and lactate showed a decrease in purity to 31.6% and 29.5%, respectively, after 2 months at pH 10 and 80 °C (Leonard et al., 2005).
Visky et al. applied CE-ESI-MS/MS to evaluate the impurity profile of the hydrobromide

42
Chapter 2 Analysis of acetylcholinesterase inhibitors
Figure 2.6 Metabolic pathways of galantamine (5) after a single oral dose, GLUC glucuronic acid, R, H and D, refer to the metabolites found in rat, human and dog (adapted with permission from Mannens et al., 2002).
43
Chapter 2 Analysis of acetylcholinesterase inhibitors
in stressed Reminyl extended release capsules (Visky et al., 2005). Reminyl capsules were stored in stability chambers under different conditions: 25 °C / 60% relative humidity (RH) for 18 months; 30 °C / 70% RH for 18 months; 40 °C for 6 months moreover the capsules were ir-radiated for 8 h. The sample preparation was done by weighting an accurate amount of the drug, and dissolving it with a solution of methanol : water (40 : 60, v/v), and ultrasonicating it for 5 min. Afterwards, the mixture was shaken mechanically for 30 min and the solution was filtered through a 0.45 μm filter. The authors compared the method with RPLC and also with CE-chiral-UV. The RPLC analysis was performed using a C18 analytical column, employing the following eluents: A was 95% 30 mM phosphate buffer pH 6.5 : 5% methanol, eluent B was 95% ACN : 5% methanol. Detection was accomplished using UV at 230 nm. The CE chiral- UV was performed in an uncoated fused-silica capillary. The background electrolyte composition was 20 mM α-cyclodextrin dissolved in 50 mM phosphate buffer, pH 3.0. The UV detection was performed at 214 nm. The CE-ESI-MS/MS analysis was also performed in uncoated fused-silica. The background electrolyte composition was 25% ACN : 25% methanol : 50% 100 mM ammonium acetate. The detection was performed in positive ESI mode. Both by CE and RPLC, two impurities were detected in the stressed samples (18 months, 25 °C / 60% RH) at concentrations lower than 0.05%. The identification of these impurities was done using CE-MS/MS. The unknown compounds involve a methylation at the azepine nitrogen corresponding to the formation of a quaternary ammonium derivative of 5, the second substance corresponds to O-desmethyl galantamine (structure M6 in Figure 2.6) (Visky et al., 2005).
2.5.2. Metabolism studies5 is extensively metabolized in the liver by CYP2D6 and CYP3A4, which are the same isoen-zymes involved in the metabolism of 3 (Malakova et al., 2007, Mannens et al., 2002). The principal metabolic pathways are O-demethylation, N-demethylation, N-oxidation, epimeriza-tion, glucuronidation, and sulfate conjugation. The metabolic pathway of galantamine is shown in Figure 2.6 (Mannens et al., 2002). The metabolites are either pharmacologically inactive or less when compared to 5.
2.5.3. Bioanalytical studiesClaessens et al. developed a method for the determination of 5 in human serum, in which normal-phase LC with UV detection at 235 nm was applied. The sample cleanup was achieved by LLE with dichloromethane (DCM), resulting in a recovery of 100.2%. The LOD of 5 in serum was 5 ng/mL, which was adequate for the study carried out (Claessens et al., 1983)
Tencheva et al. reported the determination of 5 and its metabolites epigalantamine (M13 in Figure 2.6) and galantaminone (M14) in human plasma and urine (Tencheva et al., 1987). Using LLE with chloroform, a recovery of 94-100% was obtained. In this work, RPLC with UV detection at 280 nm was applied. The LOD in urine and plasma was 50 ng/mL, which is ten times higher than the LOD found in serum by Claessens et al. However, the precision (RSD) of the method of Tencheva et al. was with 5% much better than the 37.8% achieved by Claes-
44
Chapter 2 Analysis of acetylcholinesterase inhibitors
sens et al. The method was applied in a pharmacokinetic study. Blood samples were taken 180 min after the oral administration of 10 mg of Nivalin (old brand name used for commercial 5) tablets. Concentrations of 3.2 μg/mL for 5 and 0.74 μg/mL for epigalantamine were de-tected in plasma. Urine samples were taken 12 h after subcutaneous administration of the drug. In urine, 0.98 μg/mL of 5, 2.54 μg/mL of epigalantamine, and 0.66 μg/mL of galantaminone were detected (Tencheva et al., 1987).
Verhaeghe et al. described a method for the analysis of 5 in heparinised human plasma (Verhaeghe et al., 2003). RPLC with positive-ion ESI-MS was used. Initially, the sample cleanup was done using a mixed-mode SPE, but under these conditions the N-oxide metabolite (M10 in Figure 2.6) is co-extracted and partially converted back to 5 during the evaporation step.
Therefore, LLE with toluene at pH 13 was used, resulting in a recovery of 5 better than 90%. The LOQ was 1 ng/mL for 5. The method was applied to the analysis of 3000 clinical samples. Despite the manual cleanup step, 750 samples could be analyzed by two lab technicians in 4 working days. The isotopically labeled IS enabled short chromatographic run times in LC-MS (2.0 min) (Verhaeghe et al., 2003).
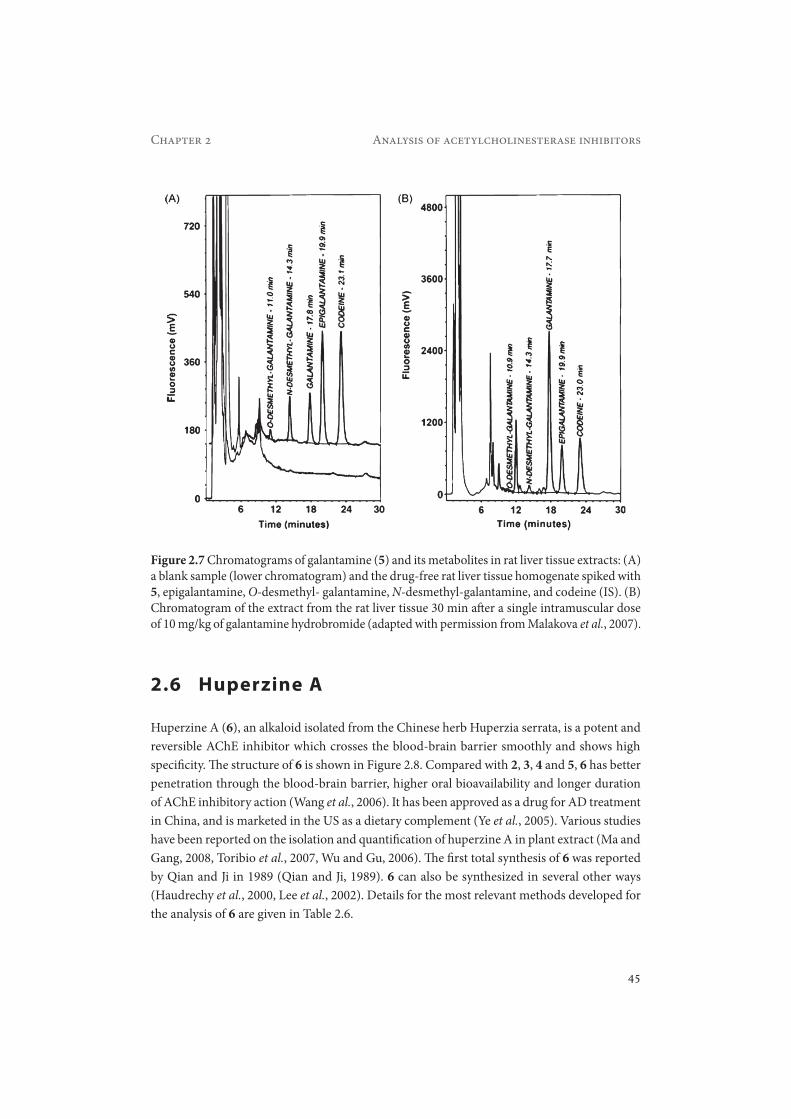
Malakova et al. developed a method for the simultaneous determination of 5 and its phase-I metabolites in rat plasma, liver and brain (Malakova et al., 2007). The method was validated using RPLC and fluorescence detection (excitation 280 nm, emission 310 nm). The identity of 5 and its metabolites in the biological samples was confirmed using RPLC-PDA-MS analysis. In this case, a sample cleanup procedure based on a mixed-mode cation-exchange reversed phase polymeric sorbent was applied. The phenomenon of the conversion of N-oxide galantamine back to 5 as described by Verhaeghe et al. was not observed in this study, as verified by the analysis of samples after the addition of galantamine N-oxide to drug free plasma. The recovery achieved was 81% for 5, 57.8% for O-desmethyl galantamine, 49.7% for N-desmethyl-galantamine and 81.3% for epigalantamine. The LOD was 0.03 μM (8.6 ng/mL) for 5 in rat plasma samples. The method was applied in pharmacokinetic studies of 5 in rat plasma, liver and brain. Typical chromatograms for extracts of a spiked blank rat liver tissue and of a rat liver tissue 30 min after administration of 10 mg/kg galantamine hydrobromide are shown in Figure 2.7 (Malakova et al., 2007).
Nirogi et al. developed a method for quantification of 5 in human plasma by RPLC MS in the SRM mode using the transitions m/z 288 → 213 for 5 and m/z 383 → 337 for loratadine (IS). The LOQ was 0.5 ng/mL (Nirogi et al., 2007).
Hsieh et al. developed a method for the simultaneous determination of 4, NAP 226-90 and 5 in human plasma (Hsieh et al., 2009). The sample cleanup using LLE with diethylether provided recoveries of >85% for 5. UV detection was carried out at 214 or 200 nm. A mobile phase consisting of 20% ACN : 25 mM Tris buffer (pH 5.0) with 160 mM sodium octansulfonate (SOS) : 0.01% poly(vinylpyrrolidinone) was chosen as the separation buffer in MEKC. The LOD achieved with this method for 5 was 0.25 ng/mL. The method was applied for monitor-ing 5 or 4 and the metabolite NAP 226-90 in plasma samples of 11 AD patients after oral ad-ministration of the commercial products Reminyl (8 mg 5) or Exelon (3 mg 4).
45
Chapter 2 Analysis of acetylcholinesterase inhibitors
2.6 Huperzine A
Huperzine A (6), an alkaloid isolated from the Chinese herb Huperzia serrata, is a potent and reversible AChE inhibitor which crosses the blood-brain barrier smoothly and shows high specificity. The structure of 6 is shown in Figure 2.8. Compared with 2, 3, 4 and 5, 6 has better penetration through the blood-brain barrier, higher oral bioavailability and longer duration of AChE inhibitory action (Wang et al., 2006). It has been approved as a drug for AD treatment in China, and is marketed in the US as a dietary complement (Ye et al., 2005). Various studies have been reported on the isolation and quantification of huperzine A in plant extract (Ma and Gang, 2008, Toribio et al., 2007, Wu and Gu, 2006). The first total synthesis of 6 was reported by Qian and Ji in 1989 (Qian and Ji, 1989). 6 can also be synthesized in several other ways (Haudrechy et al., 2000, Lee et al., 2002). Details for the most relevant methods developed for the analysis of 6 are given in Table 2.6.
Figure 2.7 Chromatograms of galantamine (5) and its metabolites in rat liver tissue extracts: (A) a blank sample (lower chromatogram) and the drug-free rat liver tissue homogenate spiked with 5, epigalantamine, O-desmethyl- galantamine, N-desmethyl-galantamine, and codeine (IS). (B) Chromatogram of the extract from the rat liver tissue 30 min after a single intramuscular dose of 10 mg/kg of galantamine hydrobromide (adapted with permission from Malakova et al., 2007).
46
Chapter 2 Analysis of acetylcholinesterase inhibitors
2.6.1 Degradation studies
Li et al. investigated the stability of 6 at 4 different conditions: in untreated plasma at room temperature for 4 h, in treated plasma in an autosampler vial at 4 °C for 10 h, at -20 °C for 2 weeks, and after three freeze-thaw cycles at -20 °C (Li et al., 2008). 6 was found to be stable under all these conditions. In this study, quantification of 6 was carried out by positive ESI LC-MS/MS, with pseudoephedrine hydrochloride as IS. LLE with ethyl acetate yielded a re-covery of 83 % for 0.1 ng/mL of 6 in plasma. Separation was achieved using a C18 column and 85% methanol : 15% water (0.2% formic acid) as the mobile phase. The LOQ was 0.05 ng/mL using 1 mL of plasma (Li et al., 2008).
Similar studies of 6 in plasma and CSF for 60 days at -20 °C, involving freeze / thaw cycles, and for 24 h in the autosampler at room temperature, reported by Pan et al., showed good stability of 6 under all investigated conditions for both biological matrices (Pan et al., 2009).
Ashani et al. showed that under the following stress conditions: pH, temperature, ionic strength, different solvents 6 was basically stable (Ashani et al., 1992).
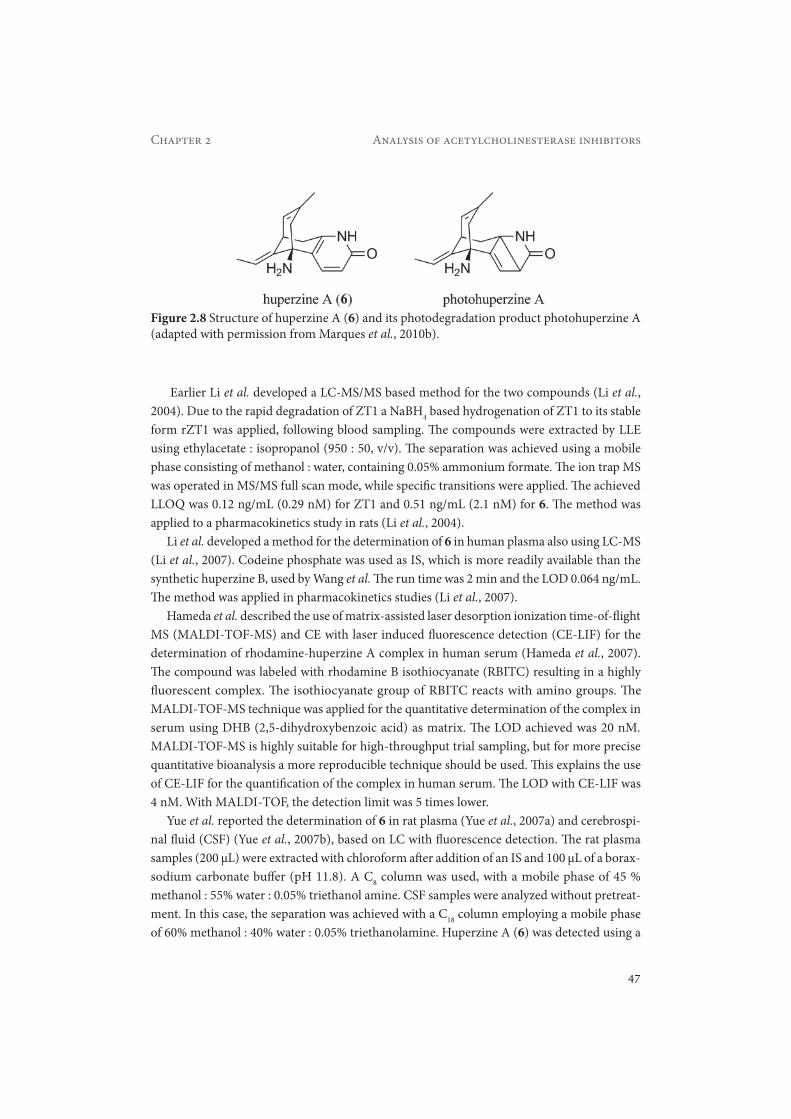
Marques et al. studied the stability of 6 under irradiation, 6 was significantly transformed to a new compound called photohuperzine A (Marques et al., 2010b). Its activity against AChE was found to be 100 times lower when compared to 6. The structures of 6 and its photodegra-dation product are shown in Figure 2.8.
2.6.2 Metabolism studiesThe metabolism of 6 in rat liver microsomes is mediated primarily by CYP1A2, with a prob-able secondary contribution of CYP3A12. CYP2C11 and 2E1 are likely not involved in the metabolism of 6 (Xiaochao et al., 2003). Garcia et al. identified and characterized the major metabolite of huperzine A in rat blood (Garcia et al., 2004). The compound was isolated from blood and liver samples and subsequently analyzed by ESI-MS and 1H-NMR spectroscopy. The metabolite was identified to be 13,14-epoxy huperzine (Garcia et al., 2004).
2.6.3 Bioanalytical studiesWang et al. reported the determination of 6 in dog plasma, using huperzine B as IS (Wang et al., 2004). The analysis was performed using a C18 column a mobile phase of 35% ACN : 40% methanol : 25% 10mM ammonium acetate, and positive-ion ESI-MS detection. The total run time was 2 min allowing a high sample throughput in pharmacokinetics studies. An LOD as low as 0.01 ng/mL was achieved, enabling the analysis of dog plasma samples from sustained-release formulations of 6 (Wang et al., 2004).
Wei et al. developed a method for the simultaneous determination of 6 and ZT1 a prodrug of 6 in plasma (Wei et al., 2006). The separation was achieved by RPLC with UV detection (313 nm). The rat plasma was extracted with a solution of chloroform : isopropyl alcohol (9 : 1, v/v). The recovery achieved for ZT1 and 6 at 0.5 nmol/mL was 92% and 102%, respec-tively. The LOQ achieved with this method was 0.02 nmol/mL (20 nM) for both compounds (Wei et al., 2006).
47
Chapter 2 Analysis of acetylcholinesterase inhibitors
Figure 2.8 Structure of huperzine A (6) and its photodegradation product photohuperzine A (adapted with permission from Marques et al., 2010b).
Earlier Li et al. developed a LC-MS/MS based method for the two compounds (Li et al., 2004). Due to the rapid degradation of ZT1 a NaBH4 based hydrogenation of ZT1 to its stable form rZT1 was applied, following blood sampling. The compounds were extracted by LLE using ethylacetate : isopropanol (950 : 50, v/v). The separation was achieved using a mobile phase consisting of methanol : water, containing 0.05% ammonium formate. The ion trap MS was operated in MS/MS full scan mode, while specific transitions were applied. The achieved LLOQ was 0.12 ng/mL (0.29 nM) for ZT1 and 0.51 ng/mL (2.1 nM) for 6. The method was applied to a pharmacokinetics study in rats (Li et al., 2004).
Li et al. developed a method for the determination of 6 in human plasma also using LC-MS (Li et al., 2007). Codeine phosphate was used as IS, which is more readily available than the synthetic huperzine B, used by Wang et al. The run time was 2 min and the LOD 0.064 ng/mL. The method was applied in pharmacokinetics studies (Li et al., 2007).
Hameda et al. described the use of matrix-assisted laser desorption ionization time-of-flight MS (MALDI-TOF-MS) and CE with laser induced fluorescence detection (CE-LIF) for the determination of rhodamine-huperzine A complex in human serum (Hameda et al., 2007). The compound was labeled with rhodamine B isothiocyanate (RBITC) resulting in a highly fluorescent complex. The isothiocyanate group of RBITC reacts with amino groups. The MALDI-TOF-MS technique was applied for the quantitative determination of the complex in serum using DHB (2,5-dihydroxybenzoic acid) as matrix. The LOD achieved was 20 nM. MALDI-TOF-MS is highly suitable for high-throughput trial sampling, but for more precise quantitative bioanalysis a more reproducible technique should be used. This explains the use of CE-LIF for the quantification of the complex in human serum. The LOD with CE-LIF was 4 nM. With MALDI-TOF, the detection limit was 5 times lower.
Yue et al. reported the determination of 6 in rat plasma (Yue et al., 2007a) and cerebrospi-nal fluid (CSF) (Yue et al., 2007b), based on LC with fluorescence detection. The rat plasma samples (200 μL) were extracted with chloroform after addition of an IS and 100 μL of a borax-sodium carbonate buffer (pH 11.8). A C8 column was used, with a mobile phase of 45 % methanol : 55% water : 0.05% triethanol amine. CSF samples were analyzed without pretreat-ment. In this case, the separation was achieved with a C18 column employing a mobile phase of 60% methanol : 40% water : 0.05% triethanolamine. Huperzine A (6) was detected using a
48
Chapter 2 Analysis of acetylcholinesterase inhibitors
fluorescence detector (310 nm excitation, 370 nm emission) for both matrices. An LOQ of 6.25 ng/mL was achieved for rat plasma, following intranasal administration
(Yue et al., 2007a). Subsequently, the levels of 6 were investigated in both rat plasma and CSF after three ways of administration (intravenous, intranasal and intragastric) in order to decide which route is more efficient in transferring the drug into the CNS. It was observed that after intranasal administration, the maximum concentration cmax in the CSF is not reached as fast and as high as for the intravenous application route. However, 30 min after drug administration (167 μg/kg), the intranasal route showed slightly higher concentrations in the CSF than the intravenous route (Yue et al., 2007b)
49
Chapter 2 Analysis of acetylcholinesterase inhibitors
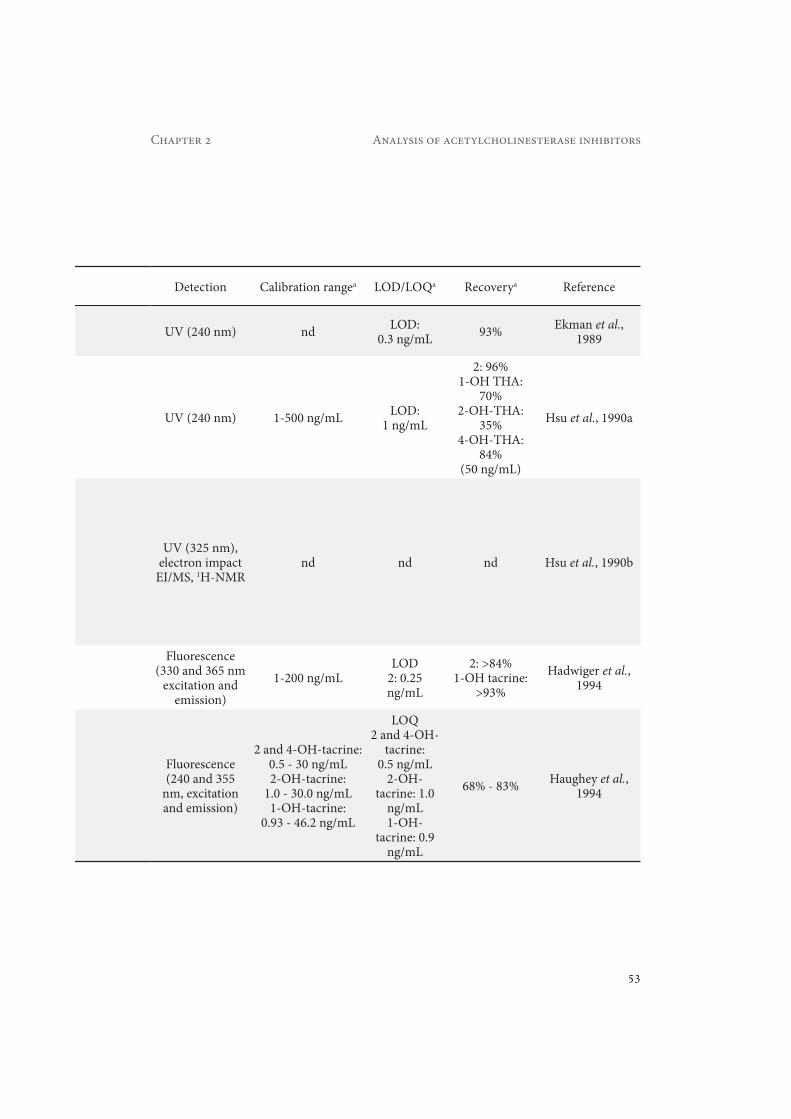
2.7 Conclusions
This review gives an overview of analytical methods applied for the detection of AChE in-hibitors and their metabolites in different matrices. Most of these methods were developed for pharmacokinetic applications, or stability indicating studies. Especially in the first case speed, reliability, and applicability are the most important criteria. These parameters were obtained using mainly RPLC coupled with MS, especially in the past ten years when the coupling of these two techniques became more and more popular. Fluorescence detection also provided a robust and highly sensitive detection principle, what was basically shown for all of the described substances in various matrices. In terms of sample cleanup procedures applied for the discussed analytes, mainly LLE was used, which provided good recoveries. Another popular methodol-ogy for sample pretreatment purposes was SPE on various different materials. Future develop-ments will certainly imply the application of modern technologies in HPLC, such as ultra-performance liquid chromatography, which can provide fast separations with high resolving power, also being ideal for large numbers of samples, particularly in pharmacokinetics studies.

50
Chapter 2 Analysis of acetylcholinesterase inhibitors
Table 2.1 Summary of the most relevant methods developed for the determination of physostigmine (1) and its metabolites in different biological matrices. a if not stated otherwise the given values refer to all listed substances and conditions. Abbreviations are listed in the abbreviation list.
Substance MatrixSample
preparationSeparation
Physostigmine (1)
Human plasma, urine, whole blood
Plasma and blood: LLE
(diethyl ether)Urine: LLE (benzene)
Spherisorb (150 × 4.6 mm, 3 μm)pH partition studies: 90% methanol - 10%
ammonium nitrate buffer pH 8.6biological extracts: 45% methanol -45% ACN - 10% NH4NO3 pH 8.9.
1 Human plasma
LLE (methyl-tert.-butyl ether)
Spherisorb 5 ODS1 (125 × 4.9 mm, 5 μm)95% ACN-5% 0.01 M sodium acetate
1 Human plasma
LLE (dichloro-methane)
Altex ultrasphere-Si (250 × 4.6 mm, 5 μm)20% ACN - 80% 0.01 M NaH2PO4 and 2.5
mM tetramethylammonium (pH 3.0)
1Human plasma,
CSF
Plasma: LLE (diethyl ether)
CSF: LLE (chloroform)
Spherisorb silica column (150 × 4.6 mm, 5 μm)
90% Methanol - 10% 0.01 M sodium acetate (pH 4.6)
1, EserolinePlasma, whole
blood, CSF
SPE (cyano
column)
Spherical C18 (100 × 4.6 mm, 3 μm)8% ACN - 92% 0.10 M sodium citrate buffer
pH 4.0 with 0.02% sodium octylsulphate and 0.05% octylamine.
1, Eseroline Rat plasma SPE (C18 column)
Alltech Ultrasphere silica (250 × 4.6 mm, 5 μm)
15% ACN - 85% 0.01 M NaH2PO4 (pH 3.0)
51
Chapter 2 Analysis of acetylcholinesterase inhibitors
DetectionCalibration
rangea LOD/LOQa Recoverya Reference
Electrochemical 0.1–10 ng/mL
LODPlasma: 50 pg/mL
Whole blood: 100 pg/mL
Urine: 25-50 pg/mL
nd Whelpton et al., 1985
Fluorescence (254and 346 nm
excitation and emission)
0.1–3.0ng/mL LOD: 0.1 ng/mL 90.4 – 94.2% Brodie et al.,
1987
Fluorescence (240 and 360 nm
excitation and emission)
0.5–25ng/mL LOD: 0.1 ng/mL 91.5 – 93.1% Elsayed et al.,
1989
Electrochemical
Plasma: 0.5–20ng/mLCSF:
0.5–40 ng/mL
LODPlasma: 0.5 ng/mL
CSF: 0.5 ng/mLPlasma: 60%
CSF: 78% Unni et al., 1989
Electrochemical 0.5–10ng/mL LOD: 0.2 ng/mL
Plasma:1: 82%CSF:
1: 102%Blood:1: 20%
Lawrence and Yatim, 1990
UV (246 nm) 0.1–2.5μg/mL
LOD1: 10 ng/mL
Eseroline: 25 ng/mLLOQ:
1: 75 ng/mLEseroline:100 ng/mL
1: 88%Eseroline:
61%Zhao et al., 2003
52
Chapter 2 Analysis of acetylcholinesterase inhibitors
Substance MatrixSample
preparationSeparation
Tacrine (2), 1-OH-tacrine
Human Plasma
LLE (dichloro- methane)
Nucleosil C18 (150 × 4.6 mm, 5 μm)20% ACN : 80% 20 mM
phosphate buffer (pH 2.7)
2, 1-OH-tacrine, 2-OH-
tacrine,4-OH-tacrine
Rat plasma
LLE (cyclohexane -ethyl acetate)
Shandon hypersil phenyl (100 × 4.6 mm, 3 μm)
70% ACN : 30% 0.02 M ammonium formate (pH 2.8)
2, 1-OH-tacrine, 2-OH-
tacrine,4-OH-tacrine
Rat urineLLE
(cyclohexane -ethyl acetate)
Shandon hypersil phenyl (100 × 4.6 mm, 3 μm)
70% ACN : 30% 0.05 M ammonium formate (pH 3.1)
Purification (2 columns): Shandon hypersil semi-prep phenyl (250 × 7.0 mm, 5 μm)
(same mobile phase as above)Shandon CPS hypersil semi-prep cyano (250
× 7 mm, 5 μm)70% ACN : 30% 0.25 M sodium acetate (pH
4)
2, 1-OH-tacrine
Rat bile microdia-
lysates
LLE (ethyl acetate)
SepStiks (100 × 1 mm, 5 μm for phenyl and 8 μm for cyano)
10 % methanol-5% ACN : 85 % 0.05 M ammonium phosphate (pH 2.5)
2, 1-OH-tacrine, 2-OH-tacrine,
4-OH-tacrine
Human plasma
LLE (chloroform- 1-propanol)
Brownlee-Spheri-5 cyano (100 × 4.6 mm, 5 μm)
30% ACN : 70% 10 mM sodium acetate (pH 4.0)
Table 2.2 Summary of the most relevant methods developed for the determination of tacrine (2) and its metabolites in different biological matrices. a if not stated otherwise the given values refer to all listed substances and conditions. Abbreviations are listed in the abbreviation list.
53
Chapter 2 Analysis of acetylcholinesterase inhibitors
Detection Calibration rangea LOD/LOQa Recoverya Reference
UV (240 nm) nd LOD: 0.3 ng/mL 93% Ekman et al.,
1989
UV (240 nm) 1-500 ng/mL LOD: 1 ng/mL
2: 96%1-OH THA:
70%2-OH-THA:
35%4-OH-THA:
84%(50 ng/mL)
Hsu et al., 1990a
UV (325 nm), electron impact
EI/MS, 1H-NMRnd nd nd Hsu et al., 1990b
Fluorescence (330 and 365 nm
excitation and emission)
1-200 ng/mLLOD
2: 0.25 ng/mL
2: >84%1-OH tacrine:
>93%Hadwiger et al.,
1994
Fluorescence (240 and 355
nm, excitation and emission)
2 and 4-OH-tacrine: 0.5 - 30 ng/mL2-OH-tacrine:
1.0 - 30.0 ng/mL1-OH-tacrine:
0.93 - 46.2 ng/mL
LOQ2 and 4-OH-
tacrine: 0.5 ng/mL
2-OH-tacrine: 1.0
ng/mL1-OH-
tacrine: 0.9 ng/mL
68% - 83% Haughey et al., 1994

54
Chapter 2 Analysis of acetylcholinesterase inhibitors
Substance MatrixSample
preparationSeparation
2, 1-OH-tacrine, 2-OH-tacrine, 4-OH-tacrine, 1,3-dihydroxy-
tacrine, dihydrodiol, 7-OH-tacrine
Urine, feces and plasma from dog,
rat and human
Plasma: precipitation with ice cold ethanol
Urine: LLE (ethyl acetate)
Hypersil phenyl (250 × 6.2 mm, 5 μm), Gradient, 0% ACN : 100% 50 mM aqueous ammonium formate (pH 3.1)increasing to 20 % ACN
in 60min, held for 30 min
2, 1-OH-tacrine, 2-OH-tacrine, 4-OH-
tacrineHuman plasma
Precipitation with ACN, followed by
LLE (methyl-tert.-
butyl ether : n-hexane)
Shandon Hypersil phenyl (250 × 4.6 mm, 5 μm)
39 % ACN : 61 % 4 mM KH2PO4 buffer
2, 1-OH-tacrine, 2-OH-tacrine, 4-OH-
tacrine
Human plasma,
urineLLE
(ethyl acetate)
LiChrospher 60 RP select- B (250 × 4 mm, 5 μm)
13 % ACN : 87 % 0.2 M acetate buffer (pH 4)
2 Human plasma
Protein precipitation with
ACN
Nucleosil cyano (125 × 4.0 mm, 5 μm)
55% ACN : 45% 0.05M NaH2PO4 buffer (pH 7.0)
2, 1-OH-tacrineDog liver
micro-somes
Protein precipitation with
ACN
Zorbax Rx-C18 (150 × 4.6 mm, 5 μm)Metabolite separation:
Gradient, 4% ACN : 96% D2O (0.01% TFA) increasing to 16%
ACN over 40 min
2, N-butyramide-tacrine (BTHA)
Mouse plasma
and brain homo-genate
Protein precipitation with
methanol
Shim-Pack C18 (150 × 6 mm, 5 μm)
Gradient, 35% methanol : 65% 0.1 M phosphate buffer (pH 6.1) held
for 5 min increasing to 70% methanol
Table 2.2 cont.

55
Chapter 2 Analysis of acetylcholinesterase inhibitors
Detection Calibration rangea LOD/LOQa Recoverya Reference
TSP/MS, UV (325 nm), 1H-NMR
nd ndUrine: 60%
Plasma: 70-90%
Pool et al., 1997
Fluorescence (330 and 360
excitation and emission)
2, 1-OH-tacrine, 2-OH-tacrine:0.5-50 ng/mL4-OH-tacrine:0.5–25 ng/mL
LOQ: 0.3 ng/mL67%
2-OH-tacrine:
39%
Aymard et al., 1998
Fluorescence (330 and 365
excitation and emission)
2-OH-tacrine and 4-OH-tacrine
Plasma: 1–12 ng/mLUrine: 24–416 ng/mL2 and 1-OH-tacrinePlasma: 5-50 ng/mL
Urine: 95-1663 ng/mL
LODPlasma:
2-OH-tacrine and 4-OH-tacrine: 0.5 nM2 and 1-OH-tacrine:
2nMUrine: 2-OH-tacrine and
4-OH-tacrine: 60nM1-OH-tacrine: 30nM
2: 80nM
Plasma:84 – 105%
Urine:64 – 100%
Hansen et al., 1998
Fluorescence (330 and 365
excitation and emission)
0–122 ng/mL LOD: 0.4 ng/mLLOQ: 1.0 ng/mL >87% Chollet et
al., 2000
UV (320 nm), ESI-MS, 1H-NMR
nd nd nd Bao et al., 2002
UV (240 nm) BTHA: 0.25–20 μg/mL2: 0.025–20 μg/mL
LODBTHA: 200 ng/mL
2: 20 ng/mL
Plasma: BTHA:
91%2: 71%Brain: BTHA:
69%2: 73%
Jiang et al., 2003
56
Chapter 2 Analysis of acetylcholinesterase inhibitors
Substance MatrixSample
preparationSeparation
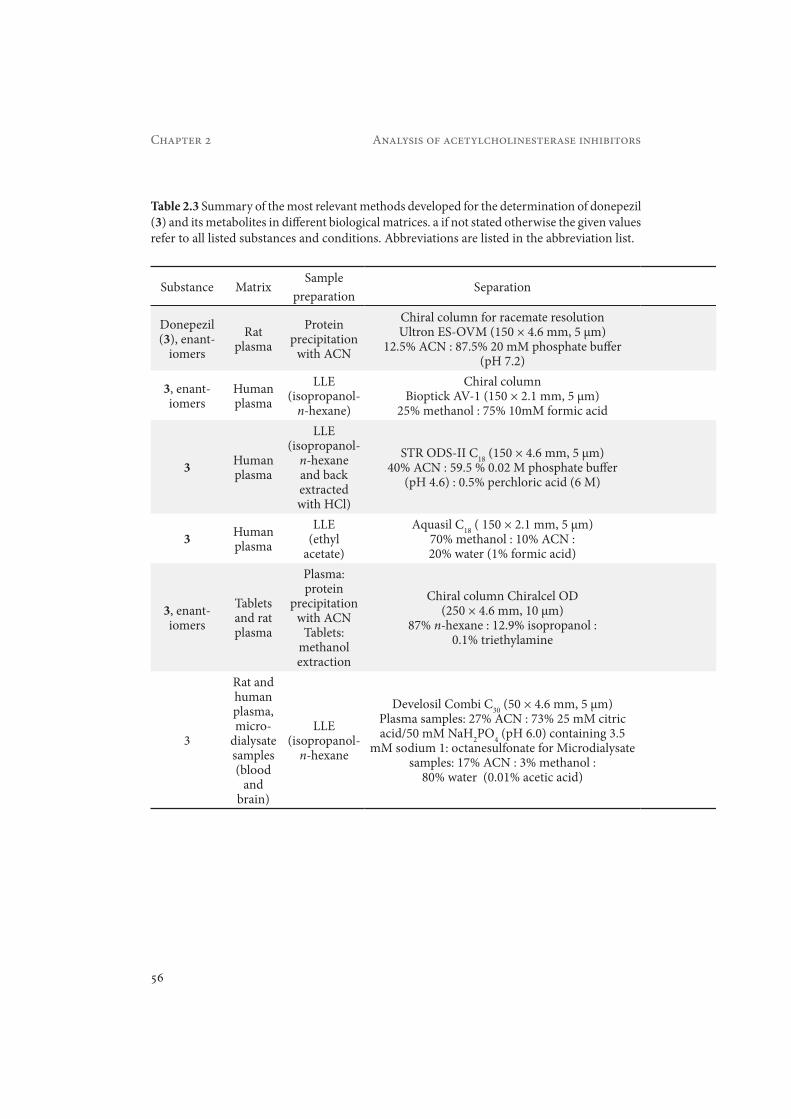
Donepezil (3), enant-
iomersRat
plasmaProtein
precipitation with ACN
Chiral column for racemate resolutionUltron ES-OVM (150 × 4.6 mm, 5 μm)
12.5% ACN : 87.5% 20 mM phosphate buffer (pH 7.2)
3, enant-iomers
Human plasma
LLE (isopropanol-
n-hexane)
Chiral columnBioptick AV-1 (150 × 2.1 mm, 5 μm)
25% methanol : 75% 10mM formic acid
3 Human plasma
LLE (isopropanol-
n-hexane and back extracted with HCl)
STR ODS-II C18 (150 × 4.6 mm, 5 μm)40% ACN : 59.5 % 0.02 M phosphate buffer
(pH 4.6) : 0.5% perchloric acid (6 M)
3 Human plasma
LLE (ethyl
acetate)
Aquasil C18 ( 150 × 2.1 mm, 5 μm)70% methanol : 10% ACN : 20% water (1% formic acid)
3, enant-iomers
Tablets and rat plasma
Plasma: protein
precipitation with ACN
Tablets: methanol extraction
Chiral column Chiralcel OD (250 × 4.6 mm, 10 μm)
87% n-hexane : 12.9% isopropanol : 0.1% triethylamine
3
Rat and human plasma, micro-
dialysate samples (blood
and brain)
LLE (isopropanol-
n-hexane
Develosil Combi C30 (50 × 4.6 mm, 5 μm)Plasma samples: 27% ACN : 73% 25 mM citric acid/50 mM NaH2PO4 (pH 6.0) containing 3.5
mM sodium 1: octanesulfonate for Microdialysate samples: 17% ACN : 3% methanol :
80% water (0.01% acetic acid)
Table 2.3 Summary of the most relevant methods developed for the determination of donepezil (3) and its metabolites in different biological matrices. a if not stated otherwise the given values refer to all listed substances and conditions. Abbreviations are listed in the abbreviation list.

57
Chapter 2 Analysis of acetylcholinesterase inhibitors
DetectionCalibration
rangea LOD/LOQa Recoverya Reference
Fluorescence (318 and 390 nm
excitation and emission)
5–500 ng/mL LOD: 1 ng/mL >99%Haginaka
and Seyana, 1992
ESI-MS/MS 0.021–50.0 ng/mL LOQ: 0.02 ng/mL >90% Matsui et
al., 1999
UV (315 nm) 3–90 ng/mL LOQ: 3 ng/mL 92.7 – 94.6%
Yasui-Furukori et
al., 2002
ESI-MS/MS 0.1–20 ng/mL LLOQ: 0.1 ng/mL >65% Xie et al, 2006
UV (268 nm) 0.05–2 μg/mL LOQ: 0.05 μg/mLLOD: 20 ng/mL 93% Radwan et
al, 2006
Fluorescence (325 and 390
excitation and emission)
Rat plasma: 5–500 nM
Microdialysates: 10–500 nM
Human plasma: 1–50 nM
LOD: Human plasma: 0.2 ng/mL
rat plasma: 1.0 ng/mLmicrodialysate:
2.1 ng/g
Rat plasma: 91%
Human plasma: 101.7%
Nakashima et al. 2006

58
Chapter 2 Analysis of acetylcholinesterase inhibitors
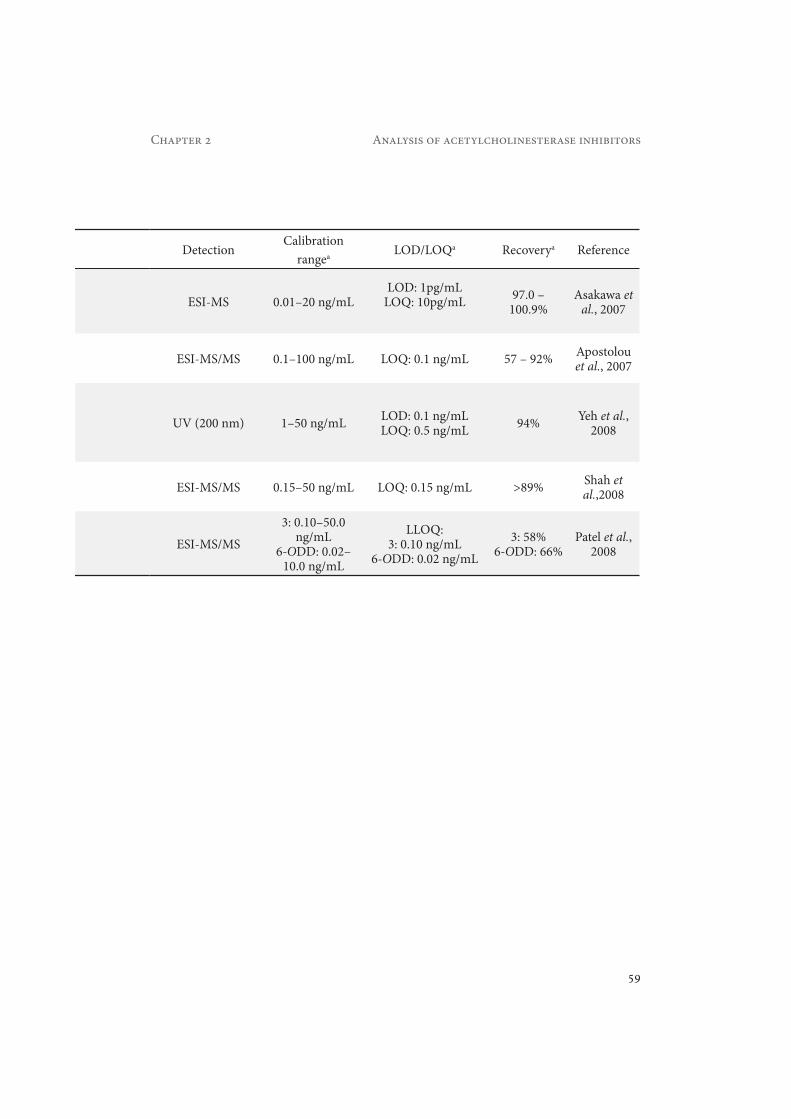
Table 2.3 cont.
Substance MatrixSample
preparationSeparation
3 Dog plasma
Online sample
pretreatmentSymmetry C18 (100 × 2.1 mm, 3.5 μm)
Gradient, 10 % ACN : 90% H2O : 1% TFA (A)90% ACN-1% TFA (B)
3 Human plasma
LLE (n-hexane)
YMC Pack ODS-A ( 50 × 4.0 mm, 5 μm)82% ACN : 18% 10mM ammonium acetate
(pH 5.0)
3 Human plasma
LLE (isopropanol-
n-hexane)
FASS-CEUncoated fused-silica capillary
(50.2 cm and 50 μm id)60 mM tris (pH 4.0) -40 mM sodium
octanesulfate : 0.01% polyvinyl alcohol.
3 Human plasma
SPE (Waters Oasis HLB cartridges)
Betabasic C8 (100 × 4.6 mm, 5 μm)90% methanol : 9.97% H2O : 0.03% formic acid
3, 6-O-desmethyl donepezil (6-ODD)
Human plasma
SPE (Waters Oasis HLB cartridges)
Novapack C18 (150 × 3.6 mm, 4 μm)20% methanol : 17% ACN-63% 20mM
ammonium acetate (pH 3.43) : 0.2% formic acid
59
Chapter 2 Analysis of acetylcholinesterase inhibitors
DetectionCalibration
rangea LOD/LOQa Recoverya Reference
ESI-MS 0.01–20 ng/mLLOD: 1pg/mL
LOQ: 10pg/mL 97.0 – 100.9%
Asakawa et al., 2007
ESI-MS/MS 0.1–100 ng/mL LOQ: 0.1 ng/mL 57 – 92% Apostolou et al., 2007
UV (200 nm) 1–50 ng/mL LOD: 0.1 ng/mLLOQ: 0.5 ng/mL 94% Yeh et al.,
2008
ESI-MS/MS 0.15–50 ng/mL LOQ: 0.15 ng/mL >89% Shah et al.,2008
ESI-MS/MS3: 0.10–50.0
ng/mL6-ODD: 0.02–
10.0 ng/mL
LLOQ:3: 0.10 ng/mL
6-ODD: 0.02 ng/mL3: 58%
6-ODD: 66%Patel et al.,
2008

60
Chapter 2 Analysis of acetylcholinesterase inhibitors
Substance MatrixSample
preparationSeparation
Rivastigmine (4), NAP 226-90
Human plasma
LLE (methyl-tert-butyl ether)
Purosphere Star C18 (55 × 2.0 mm, 3 μm)55 % methanol :
45% 20 mM ammonium acetate
4 Dog plasma
Solid phase microextraction
GC-MS, HP-5MS capillary column (30m × 0.25mm id × 0.25 μm film)
4, NAP 226-90
Rat brain and
plasmaLLE
(ethyl acetate)
Nucleosil C18 (125 × 2.0 mm, 5 μm)80% ACN : 20% H2O : 0.1 % formic acid
4, NAP 226-90
Human plasma
Protein precipitation with
methanol
Gemini C18 (150 × 2.0 mm, 5 μm)Gradient, 50% Methanol : 50% 10 mM
ammonium hydroxide increasing to 95% methanol in 0.1min, kept for 7min
4 Human plasma
SPE (Waters Oasis HLB cartridges)
Betabasic C8 (100 × 4.6 mm, 5 μm)70% ACN : 30 % H2O-0.1% formic acid
4, NAP 226-90, 5 (details
given in table 5)
Human plasma
LLE (diethylether)
MEKCUncoated fused-silica capillary (30.2 cm,
effective length 20 cm, 50 μm id)25 mM Tris buffer (pH 5.0) : 160 mM SOS-20% ACN : 0.01% poly(vinylpyrrolidone)
Table 2.4 Summary of the most relevant methods developed for the determination of rivastigmine (4) and its metabolites in different biological matrices. a if not stated otherwise the given values refer to all listed substances and conditions. Abbreviations are listed in the abbreviation list.

61
Chapter 2 Analysis of acetylcholinesterase inhibitors
Detection Calibration rangea LOD/LOQa Recoverya Reference
APCI-MS/MS 0.20–30.0 ng/mL LOQ: 0.2 ng/mL 4: 115%
NAP 226-90: 88%Pommier
et al., 2003.
EI-MS 0.20–80.0 ng/mL LOQ: 0.2 ng/mL nd Sha et al., 2004
ESI-MS/MS
4: 10–100 pmol/mL in
plasma, pmol/g in brain
LOQPlasma:
4: 0.5 pmol/mLNAP 226-90: 1 pmol/mL
Brain:4: 2.5 pmol/g
NAP 226-90: 5 pmol/g
4: 93%NAP 226-90: 95%
Enz et al., 2004
ESI-MS/MS
4: 0.25–50.0 ng/mL
NAP 226-90: 0.50-25 ng/mL
LOQ4: 0.25 ng/mL
NAP 226-90: 0.50 ng/mL4: 71%
NAP 226-90: 86%Frankfort
et al., 2006
ESI-MS/MS 0.20–20.0 ng/mL LOQ: 0.2 ng/mL 86% Bhatt et
al.,2007
UV (200 or 214
nm)0.5–50 ng/mL
LODNAP 226-90: 0.125 ng/mL
LOQNAP 226-90: 0.5 ng/mL
4: >90%NAP 226-90:
>91%Hsieh et al., 2009
62
Chapter 2 Analysis of acetylcholinesterase inhibitors
Substance MatrixSample
preparationSeparation
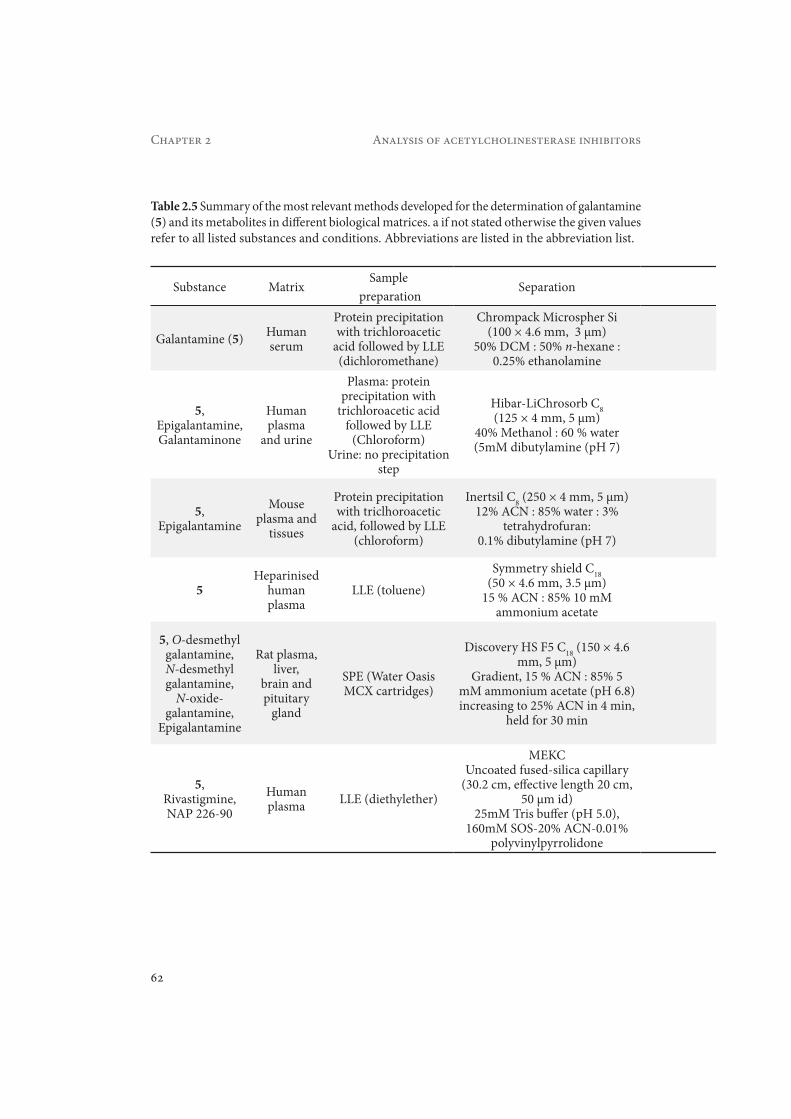
Galantamine (5) Human serum
Protein precipitation with trichloroacetic
acid followed by LLE (dichloromethane)
Chrompack Microspher Si (100 × 4.6 mm, 3 μm)
50% DCM : 50% n-hexane : 0.25% ethanolamine
5, Epigalantamine, Galantaminone
Human plasma
and urine
Plasma: protein precipitation with
trichloroacetic acid followed by LLE
(Chloroform)Urine: no precipitation
step
Hibar-LiChrosorb C8 (125 × 4 mm, 5 μm)
40% Methanol : 60 % water (5mM dibutylamine (pH 7)
5, Epigalantamine
Mouse plasma and
tissues
Protein precipitation with triclhoroacetic
acid, followed by LLE (chloroform)
Inertsil C8 (250 × 4 mm, 5 μm)12% ACN : 85% water : 3%
tetrahydrofuran: 0.1% dibutylamine (pH 7)
5Heparinised
human plasma
LLE (toluene)Symmetry shield C18
(50 × 4.6 mm, 3.5 μm)15 % ACN : 85% 10 mM
ammonium acetate
5, O-desmethyl galantamine, N-desmethyl galantamine,
N-oxide-galantamine,
Epigalantamine
Rat plasma, liver,
brain and pituitary
gland
SPE (Water Oasis MCX cartridges)
Discovery HS F5 C18 (150 × 4.6 mm, 5 μm)
Gradient, 15 % ACN : 85% 5 mM ammonium acetate (pH 6.8) increasing to 25% ACN in 4 min,
held for 30 min
5,Rivastigmine, NAP 226-90
Human plasma LLE (diethylether)
MEKCUncoated fused-silica capillary
(30.2 cm, effective length 20 cm, 50 μm id)
25mM Tris buffer (pH 5.0), 160mM SOS-20% ACN-0.01%
polyvinylpyrrolidone
Table 2.5 Summary of the most relevant methods developed for the determination of galantamine (5) and its metabolites in different biological matrices. a if not stated otherwise the given values refer to all listed substances and conditions. Abbreviations are listed in the abbreviation list.

63
Chapter 2 Analysis of acetylcholinesterase inhibitors
DetectionCalibration
rangea LOD/LOQa Recoverya Reference
UV (235 nm)
5–100 ng/mL LOD: 5 ng/mL 100.2% Claessens et
al., 1983
UV (280 nm)
0.1–10 μg/mL LOD: 50 ng/mL >95% Tencheva et
al., 1987
Fluorescence (290 and 320 nm,
excitation and emission)
nd LOD: 5ng/mL >75% Bickel et al., 1991
ESI-MS/MS 1.0–500 ng/mL LOQ: 1 ng/mL 92.9 – 97.6% Verhaeghe
et al., 2003
Fluorescence (280 and 310 nm excitation
and emission),
ESI-MS
23–5635 ng/mL
LODPlasma:
5: 8.6 ng/mLO-desmethyl-
galantamine: 52 ng/mLN-desmethyl-
galantamine andepigalantamine: 20 ng/mL
5: 81%0-desmethyl
galantamine: 57.8%N-desmethyl
galantamine: 49.7%Epigalantamine:
81.3%
Malakova et al, 2007
UV (200 or 214
nm)1.0–120.0
ng/mL
LOD0.25 ng/mL
LOQ1.0 ng/mL
85 – 100.1%Hsieh et al.,
2009

64
Chapter 2 Analysis of acetylcholinesterase inhibitors
Substance Matrix Sample preparation Separation
Huperzine A (6)
Dog plasma
LLE (n-hexane-dichloromethane-2-
propanol)
Nucleosil C18 (50 × 4.6 mm, 5 μm)35% ACN : 40% Methanol : 25% 10
mM ammonium acetate
6, ZT1 (rZT1) Rat blood
LLE (ethyl acetate-isopropanol),
ZT1 reduced to its stable derivative rZT1
using NaBH4
Supelcosil C18 (100 × 3 mm, 5 μm)Gradient (A) 2% methanol : 98% H2O : 0.05% ammonium formate(B) 90% methanol : 10% H2O-
0.05% ammonium formate
6, ZT1 Rat plasmaLLE
(chloroform-isopropanol)
Nucleosil ODS C18 (250 × 4.6 mm, 5 μm)
30% methanol : 70% 10 mM ammonium acetate
6 Human plasma
LLE (ethyl acetate)
Diamonsil C18 (150 × 4.6 mm, 5 μm)60% Methanol : 40% H2O : 0.1 %
formic acid
6 Human serum
LLE (dichloromethane)
Labeling with rhodamine B
isothiocyanate
CEUncoated silica capillary (37 cm,
75μm id)20 mM phosphate buffer (pH 9.5) :
10% methanol
6 Rat plasma LLE (chloroform)
Kromasil ODS C8 (150 × 4.6mm x 5 μm)
45% methanol : 55% H2O : 0.05% triethanol amine
6 Rat CSF and plasma
Plasma: LLE (chloroform)
CSF: Elite ODS C18 (250 × 4.6mm, 10 μm) 60% methanol : 40% H2O :
0.05% triethanol aminePlasma: cf. Yue et al., 2007a
6 Rat plasma and CSF
Impurity trapping in a precolumn
Zorbax SB C18 (150 × 3.1 mm, 3.5μm)
30% ACN : 70% 5 mM ammonium formate-0.03% diethylamine
Table 2.6 Summary of the most relevant methods developed for the determination of huperzine (6) and its metabolites in different biological matrices. a if not stated otherwise the given values refer to all listed substances and conditions. Abbreviations are listed in the abbreviation list.

65
Chapter 2 Analysis of acetylcholinesterase inhibitors
Detection Calibration rangea LOD/LOQa Recoverya Reference
ESI-MS/MS 0.05–20 ng/mL LOD: 0.01 ng/mL 73 – 84% Wang et al.,
2004
ESI-MS/MS
6: 0.51–125
ng/mLrZT1
(ZT1): 0.12–30 ng/mL
LLOQ:6: 0.51 ng/mL
rZT1: 0.12 ng/mL>88% Li et al.,
2004
UV (313 nm)
6: 5–1210 ng/mLZT1:
7–656 ng/mL
LOQ6: 5 ng/mL
ZT1: 7 ng/mL6: 99 – 102%
ZT1: 90 – 108%Wei et al.,
2006
ESI-MS/MS0.126–
25.2 ng/mL
LOD0.064 ng/mL
LOQ0.126 ng/mL
83.4% Li et al., 2007
Laser induced
fluorescence (532 nm), MALDI-TOF-MS
ndLOD
CE-LIF 4 nMMALDI-TOF 20 nM
nd Hameda et al., 2007
Fluorescence (310 and 370
excitation and
emission)
2.5–250 ng/mL
LOD: 2.5 ng/mLLOQ: 6.25 ng/mL 101.9-108.9% Yue et al.,
2007a
Fluorescence(310 and 370
excitation and
emission)
nd LOD: 132 ng/mL nd Yue et al., 2007b
ESI-MS 0.5–500 ng/mL
LOD0.25 ng/mL
LOQ0.50 ng/mL
> 94% Pan et al., 2009
66
Chapter 2 Analysis of acetylcholinesterase inhibitors
References
Albert A and Gledhill WJ. Improved synthesis of aminoacridines, Part IV. Substituted 5- aminoacridines. Journal Society of Chemical Industry 1945; 64: 169-172.
Apostolou C, Dotsikas Y, Kousoulos C and Loukas YL. Quantitative determination of donepezil in human plasma by liquid chromatography/tandem mass spectrometry employing an automated liquid-liquid extraction based on 96-well format plates. Application to a bioequivalence study. Journal of Chromatography B 2007; 848: 239-244.
Asakawa Y, Ozawa C, Osada K, Kaneko S and Asakawa N. Reduction of carry-over in column-switching HPLC/MS system with automated system washing procedure for highly sensitive direct analysis of donepezil in dog plasma. Journal of Pharmaceutical and Biomedical Analysis 2007; 43: 683-690.
Ashani Y, Peggins JO and Doctor BP. Mechanism of inhibition of cholinesterases by Huperzine-A. Biochemical and Biophysical Research Communications 1992; 184: 719-726.
Auterhoff H and Hamacher H. Die farbreaktionen des eserins. Archiv Der Pharmazie Und Berichte Der Deutschen Pharmazeutichen Gesselschaft 1967; 300: 849.
Aymard G, Cayre-Castel M, Fernandez C, Lacomblez L and Diquet B. High-performance liquid chromatography with ultraviolet and fluorimetric detection for the simultaneous determination of tacrine, nimodipine, and their respective metabolites in the plasma of patients with Alzheimer’s disease Therapeutic Drug Monitoring 1998; 20: 422-429.
Bakshi M and Singh S. Development of validated stability-indicating assay methods—critical review. Journal of Phar-maceutical and Biomedical Analysis 2002; 28: 1011-1040.
Bao D, Thanabal V and Pool WF. Determination of tacrine metabolites in microsomal incubate by high performance liquid chromatography-nuclear magnetic resonance/mass spectrometry with a column trapping system. Journal of Pharmaceutical and Biomedical Analysis 2002; 28: 23-30.
Berkov S, Bastida J, Viladomat F and Codina C. Analysis of galanthamine-type alkaloids by capillary gas chromatogra-phy-mass spectrometry in plants. Phytochemical Analysis 2008; 19: 285-293.
Bhatt J, Subbaiah G, Kambli S, Shah B, Nigam S, Patel M, Saxena A, Baliga A, Parekh H and Yadav G. A rapid and sensitive liquid chromatography-tandem mass spectrometry (LCMS/MS) method for the estimation of rivastigmine in human plasma. Journal of Chromatography B 2007; 852: 115-121.
Bickel U, Thomsen T, Fisher JP, Weber W and Kewitz H. Galanthamine: pharmacokinetics, tissue distribution and cholinesterase inhibition in brain of mice. Neuropharmacology 1991; 30: 447-454.
Brodie RR, Chasseaud LF and Robbins AD. Determination of physostigmine in plasma by high-performance liquid chromatography. Journal of Chromatography 1987; 415: 423-431.
Chang JH, Kang HU, Jung IH and Cho CG. Total synthesis of (+/-)-galanthamine via a C3-selective Stille coupling and IMDA cycloaddition cascade of 3,5-dibromo-2-pyrone. Organic Letters 2010; 12: 2016-2018.
Chien RL and Burgi DS. Field Amplified Sample Injection in High-Performance Capillary Electrophoresis. Journal of Chromatography 1991; 559: 141-152.
Chollet D, Castella E, Anderegg G, Arnera V and Hadler D. Therapeutic drug monitoring of tacrine: Simple and fast high-performance liquid chromatography assay method for its determination in human plasma. Therapeutic Drug Monitoring 2000; 22: 225-229.
Claessens HA, van Thiel M, Westra P and Soeterboek AM. High-performance liquid chromatographic determination of galanthamine, a long-acting anticholinesterase drug, in serum, urine and bile. Journal of Chromatography 1983; 275: 345-353.
Coelho Filho J and Birks J. Physostigmine for dementia due to Alzheimer’s disease. Cochrane Database of Systematic Reviews 2001: Issue 2 No CD001499 DOI 10.1002/14651858
de Jong CF, Derks RJ, Bruyneel B, Niessen W and Irth H. High-performance liquid chromatography-mass spectrometry-based acetylcholinesterase assay for the screening of inhibitors in natural extracts. Journal of Chromatography A 2006; 1112: 303-310.
Dworacek B and Ruprecht J. Physostigmine: short history and its impact on anaesthesiology of present days. Interna-tional Congress Series 2002; 1242: 6.
Ekman E, Lindstrom B and Roxin P. Determination of tacrine and its 1-hydroxy metabolite in plasma using column liquid chromatography with ultraviolet detection. Journal of Chromatography 1989; 494: 397-402.
Elsayed NM, Ryabik JR, Ferraris S, Wheeler CR and Korte DW, Jr. Determination of physostigmine in plasma by high-performance liquid chromatography and fluorescence detection. Analytical Biochemistry 1989; 177: 207-211.

67
Chapter 2 Analysis of acetylcholinesterase inhibitors
Enz A, Chappuis A and Dattler A. A simple, rapid and sensitive method for simultaneous determination of rivastigmine and its major metabolite NAP 226-90 in rat brain and plasma by reversed-phase liquid chromatography coupled to electrospray ionization mass spectrometry. Biochemical Chromatography 2004; 18: 160-166.
Frankfort SV, Ouwehand M, van Maanen MJ, Rosing H, Tulner LR and Beijnen JH. A simple and sensitive assay for the quantitative analysis of rivastigmine and its metabolite NAP 226- 90 in human EDTA plasma using coupled liquid chromatography and tandem mass spectrometry. Rapid Communications in Mass Spectrometry 2006; 20: 3330-3336.
Garcia GE, Hicks RP, Skanchy D, MooradDoctor DR, Doctor BP and Ved HS. Identification and characterization of the major huperzine A metabolite in rat blood. Journal of Analytical Toxicology 2004; 28: 379-383.
Gauthier S and Poirier J. Current and future management of Alzheimer’s disease. Alzheimer’s and Dementia 2008; 4: S48-50.
Giacobini E. Invited review: Cholinesterase inhibitors for Alzheimer’s disease therapy: from tacrine to future applications. Neurochemistry International 1998; 32: 413-419.
Hadwiger ME, Telting-Diaz M and Lunte CE. Liquid chromatographic determination of tacrine and its metabolites in rat bile microdialysates. Journal of Chromatography B 1994; 655: 235-241.
Haginaka J and Chikako S. Determination of enantiomers of 1-benzyl-4-[(5,6-dimethoxy-1- indanon)-2-yl]methylpi-peridine hydrochloride (E20E20), a centrally acting acetylcholine esterase inhibitor, in plasma by liquid chromatography with fluorometric detection. Journal of Chromatography 1992; 577: 95-102.
Hameda AB, Taborsky P, Pena-Mendez EM and Havel J. Matrix-assisted laser desorption/ionization mass spectrometry (MALDI TOF MS) study of huperzine A, a natural anti-Alzheimer’s disease product, its derivatization and its detection by highly sensitive laser induced fluorescence (LIF). Talanta 2007; 72: 780-784.
Hansen LL, Larsen JT and Brosen K. Determination of tacrine and its metabolites in human plasma and urine by high-performance liquid chromatography and fluorescence detection. Journal of Chromatography B 1998; 712: 183-191.
Haudrechy A, Chassaing C, Riche C and Langlois Y. A formal synthesis of (+)-huperzine A. Tetrahedron 2000; 56: 3181-3187.
Haughey DB, A. MC, Collus MS, Brown RR, Siedlik PH, Balogh L and Klockowski PM. Simultaneous determination of tacrine and 1-hydroxy-, 2-hydroxy-, and 4-hydroxytacrine in human plasma by high performance liquid chromatog-raphy with fluorescence detection. Journal of Pharmaceutical Sciences 1994; 83: 1582-1585.
Hoffmann M and Hock C. Alzheimer’s disease: Antidementive Drugs. International Encyclopedia of the Social & Be-havioral Sciences 2004: 418-423.
Hossain M. Estimation of the absolute bioavailability of rivastigmine in patients with mild to moderate dementia of the Alzheimer’s type. Clinical Pharmacokinetics 2002; 41: 225-234.
Hsieh YH, Yang YH, Yeh HH, Lin PC and Chen SH. Simultaneous determination of galantamine, rivastigmine and NAP 226-90 in plasma by MEKC and its application in Alzheimer’s disease. Electrophoresis 2009; 30: 644-653.
Hsu RS, DiLeo EM and Chesson SM. High-performance liquid chromatography for the determination of tacrine and its metabolites in plasma. Journal of Chromatography 1990a; 530: 170-176.
Hsu RS, Shutske GM, Dileo EM, Chesson SM, Linville AR and Allen RC. Identification of the urinary metabolites of tacrine in the rat. Drug Metabolism and Disposition 1990b; 18: 779-783.
ICH. (Q5B) Quality of Biotechnological Products: Stability Testing of Biotechnological/Biological Products. Interna-tional Conference on Harmonisation, Geneva, November 1995. Available from:http://www.ich.org/LOB/media/MEDIA426.pdf.
ICH. (Q6A) Specifications: Test procedures and acceptance criteria for new drug substances and new drug products: Chemical substances International Conference on Harmonisation, Geneva, October 1999. Available from: http://www.ich.org/LOB/media/MEDIA430.pdf.
ICH. (Q1A-R2) Stability Testing of New Drug Substances and Products. International Conference on Harmonisation, Geneva, February 2003. Available from: http://www.ich.org/LOB/media/MEDIA419.pdf
ICH. (Q1B) Stability testing: photostability testing of new drug substances and products. Proceedings of the Interna-tional Conference on Harmonisation, Geneva, November 1996. Available from: http://www.ich.org/LOB/media/MEDIA412.pdf.
Isaksson K and Kissinger PT. Metabolism of physostigmine in mouse liver microsomal incubations studied by liquid chromatography with dual-electrode amperometric detection. Journal of Chromatography 1987; 419: 165-175.
Jiang Y, Zhang Y and Zhang ZR. Simultaneous determination of N-butyramide-tacrine and tacrine in mouse plasma and brain homogenate by high-performance liquid chromatography with a simple gradient solvent system. Journal of Chromatography B 2003; 791: 285-290.
68
Chapter 2 Analysis of acetylcholinesterase inhibitors
Kafkala S, Matthaiou S, Alexaki P, Abatzis M, Bartseliotis A and Katsiabani M. New gradient high-performance liquid chromatography method for determination of donepezil hydrochloride assay and impurities content in oral pharmaceu-tical formulation. Journal of Chromatography A 2008; 1189: 392-397.
Karthik A, Sundarajan G, Surulivrlrajan M, Ranjithkumar A and Kamat SB. Fluorimetric determination of rivastigmine in rat plasma by reverse phase high performance liquid chromatographic method. Application to a pharmacokinetic study. Arzneimittelforschung 2008; 58: 205-210.
Kawahara M, Nishida A and Nakagawa M. An efficient synthesis of optically active physostigmine from tryptophan via alkylative cyclization. Organic Letters 2000; 2: 675-678.
Lawrence GD and Yatim N. Extraction of physostigmine from biologic fluids and analysis by liquid chromatography with electrochemical detection. Journal of Pharmacological Methods 1990; 24: 137-143.
Lee IYC, Jung MH, Lee HW and Yang JY. Synthesis of huperzine intermediates via Mn(III)-mediated radical cyclization. Tetrahedron Letters 2002; 43: 2407-2409.
Lee L, Hossain M, Wang Y and Sedek G. Absorption of rivastigmine from different regions of the gastrointestinal tract in humans. The Journal of Clinical Pharmacology 2004; 44: 599-604.
Leonard AK, Sileno AP, MacEvilly C, Foerder CA, Quay SC and Constantino HR. Development of a novel high-con-centration galantamine formulation suitable for intranasal delivery. Journal of Pharmaceutical Sciences 2005; 94: 1736-1746.
Li C, Du F, Yu C, Xun X, Zheng J, Xu F and Zhu D. A sensitive method for the determination of the novel cholinesterase inhibitor ZT-1 and its active metabolite huperzine A in rat blood using liquid chromatography/tandem mass spectrom-etry. Rapid Communications in Mass Spectrometry 2004; 18: 651-656.
Li W, Li J and Hu Q. Determination of huperzine A in human plasma by liquid chromatography-electrospray tandem mass spectrometry: application to a bioequivalence study on Chinese volunteers. Biomedical Chromatography 2008; 22: 354-360.
Li YX, Jiang XH, Lan K and Wang L. Simple determination of huperzine A in human plasma by liquid chromatograph-ic-tandem mass spectrometric method. Biomedical Chromatography 2007; 21: 15-20.
Liang YQ and Tang XC. Comparative effects of huperzine A, donepezil and rivastigmine on cortical acetylcholine level and acetylcholinesterase activity in rats. Neurosciences Letters 2004; 361: 56-59.
Ma X and Gang DR. In vitro production of huperzine A, a promising drug candidate for Alzheimer’s disease. Phytochem-istry 2008; 69: 2022-2028.
Malakova J, Nobilis M, Svoboda Z, Lisa M, Holcapek M, Kvetina J, Klimes J and Palicka V. High-performance liquid chromatographic method with UV photodiode-array, fluorescence and mass spectrometric detection for simultaneous determination of galantamine and its phase I metabolites in biological samples. Journal of Chromatography B 2007; 853: 265-274.
Mamelak M. Alzheimer’ s disease, oxidative stress and gammahydroxybutyrate. Neurobiology of Aging 2007; 28: 1340-1360.
Mannens GS, Snel CA, Hendrickx J, Verhaeghe T, Le Jeune L, Bode W, van Beijsterveldt L, Lavrijsen K, Leempoels J, Van Osselaer N, Van Peer A and Meuldermans W. The metabolism and excretion of galantamine in rats, dogs, and humans. Drug Metabolism and Disposition 2002; 30: 553-563.
Marques LA, Kool J, de Kanter F, Lingeman H, Niessen W and Irth H. Production and online acetylcholinesterase bio-activity profiling of chemical and biological degradation products of tacrine. Journal of Pharmaceutical and Biomedical Analysis 2010a; 53: 609-616.
Marques LA, Giera M, de Kanter FJJ, Niessen WMA, Lingeman H and Irth H. Photohuperzine A-A new photoisomer of huperzine A: Structure elucidation, formation kinetics and activity assessment. Journal of Pharmaceutical and Bio-medical Analysis 2010b; 52: 190-194.
Maslow K. Alzheimer’s disease facts and figures. Alzheimer’s and dementia 2008; 4: 110-113.
Matsui K, Mishima M, Nagai Y, Yuzuriha T and Yoshimura T. Absorption, distribution, metabolism, and excretion of donepezil (Aricept) after a single oral administration to Rat. Drug Metabolism and Disposition 1999a; 27: 1406-1414.
Matsui K, Oda Y, Nakata H and Yoshimura T. Simultaneous determination of donepezil (aricept) enantiomers in human plasma by liquid chromatography-electrospray tandem mass spectrometry. Journal of Chromatography B 1999b; 729: 147-155.
Miller RL and Verma PS. A radioimmunoassay for physostigmine in biological fluids Journal of Pharmaceutical and Biomedical Analysis 1989; 7: 955-963.
Mukai C, Yoshida T, Sorimachi M and Odani A. Co2(CO)8-catalyzed intramolecular hetero-Pauson-Khand reaction of alkynecarbodiimide: synthesis of (+/-)-physostigmine. Organic Letters 2006; 8: 83-86.

69
Chapter 2 Analysis of acetylcholinesterase inhibitors
Mustazza C, Borioni A, Del Giudice MR, Gatta F, Ferretti R, Meneguz A, Volpe MT and Lorenzini P. Synthesis and cholinesterase activity of phenylcarbamates related to Rivastigmine, a therapeutic agent for Alzheimer’s disease. Euro-pean Journal of Medicinal Chemistry 2002; 37: 91-109.
Nakagawa M and Kawahara M. A concise synthesis of physostigmine from skatole and activated aziridine via alkylative cyclization. Organic Letters 2000; 2: 953-955.
Nakashima K, Itoh K, Kono M, Nakashima MN and Wada M. Determination of donepezil hydrochloride in human and rat plasma, blood and brain microdialysates by HPLC with a short C30 column. Journal of Pharmaceutical and Bio-medical Analysis 2006; 41: 201-206.
Niphade N, Mali A, Jagtap K, Ojha RC, Vankawala PJ and Mathad VT. An improved and efficient process for the produc-tion of donepezil hydrochloride: Substitution of sodium hydroxide for n-butyl lithium via phase transfer catalysis. Organic Process Research & Development 2008; 12: 731-735.
Nirogi VSR, Kandikere VN, Mudigonda K and Maurya S. Quantitative determination of galantamine in human plasma by sensitive liquid chromatography-tandem mass spectrometry using loratadine as an internal standard. Journal of Chromatographic Science 2007; 45: 97-103.
Pan JY, Wang Q, Shao Q, Cheng YY and Qu HB. Development and validation of a column switching LC-ESI-MS assay for determination of huperzine A in rat plasma and cerebrospinal fluid. Chromatographia 2009; 69: 445-451.
Pappa H, Farru R, Vilanova PO, Palacios M and Pizzorno MT. A new HPLC method to determine Donepezil hydro-chloride in tablets. Journal of Pharmaceutical and Biomedical Analysis 2002; 27: 177-182.
Patel BN, Sharma N, Sanyal M and Shrivastav PS. Quantitation of donepezil and its active metabolite 6-O-desmethyl donepezil in human plasma by a selective and sensitive liquid chromatography-tandem mass spectrometric method. Analytica Chimica Acta 2008; 629:145-157.
Polinsky RJ. Clinical pharmacology of rivastigmine: a new-generation acetylcholinesterase inhibitor for the treatment of Alzheimer’s disease. Clinical Therapeutics 1998; 20: 634-647.
Pommier F and Frigola R. Quantitative determination of rivastigmine and its major metabolite in human plasma by liquid chromatography with atmospheric pressure chemical ionization tandem mass spectrometry. Journal of Chroma-tography B 2003; 784: 301-313.
Poobrasert O and Cordell GA. Blue degradation products of rubreserine. Journal of Natural Products 1997; 60: 578-580.
Pool WF, Reily MD, Bjorge SM and Woolf TF. Metabolic disposition of the cognition activator tacrine in rats, dogs, and humans. Species comparisons. Drug Metabolism and Disposition 1997; 25: 590-597.
Qian L and Ji R. A total synthesis of (±)-huperzine A Tetrahedron Letters 1989; 30: 2089-2090.
Racchi M, Mazzucchelli M, Porrello E, Lanni C and Govoni S. Acetylcholinesterase inhibitors: novel activities of old molecules. Pharmacological Research 2004; 50: 441-451.
Radwan MA, Abdine HH, Al-Quadeb BT, Aboul-Enein HY and Nakashima K. Stereoslective HPLC assay of donepezil enantiomers with UV detection and its application to pharmacokinetics in rats. Journal of Chromatography B 2006; 830: 114-119.
Rao BM, Srinivasu MK, Kumar KP, Bhradwaj N, Ravi R, Mohakhud PK, Reddy GO and Kumar RR. A stability indicat-ing LC method for Rivastigmine hydrogen tartrate. Journal of Pharmaceutical and Biomedical Analysis 2005; 37: 57-63.
Rubnov S, Levy D and Schneider H. Liquid chromatographic analysis of physostigmine salicylate and its degradation products. Journal of Pharmaceutical and Biomedical Analysis 1999; 18: 939-945.
Salway AH. Researches on the constitution of physostigmine Part I. Journal of the Chemical Society 1912; 101: 978-989.
Satcharoen V, McLean NJ, Kemp SC, Camp NP and Brown RCD. Stereocontrolled synthesis of (-)-galanthamine. Organic Letters 2007; 9: 1867-1869.
Sathyan G, Ritschel WA and Hussain AS. Transdermal Delivery of Tacrine .1. Identification of a Suitable Delivery Vehicle. International Journal of Pharmaceuticals 1995; 114: 75-83.
Scriabine A. The 9th International Conference on Alzheimer’s Disease and Related Disorders. Philadelphia, PA. July 17-22, 2004. CNS Drug Reviews 2004; 10: 270-280.
Sha Y, Deng C, Liu Z, Huang T, Yang B and Duan G. Headspace solid-phase microextraction and capillary gas chroma-tographic-mass spectrometric determination of rivastigmine in canine plasma samples. Journal of Chromatography B 2004; 806: 271-276.
Shah HJ, Kundlik ML, Pandya A, Prajapati S, Subbaiah G, Patel CN, Patel DM and Suhagia BN. A rapid and specific approach for direct measurement of donepezil concentration in human plasma by LC-MS/MS employing solid-phase extraction. Biomedical Chromatography 2009; 23: 141-151.

70
Chapter 2 Analysis of acetylcholinesterase inhibitors
Somani SM and Khalique A. Determination of physostigmine in plasma and brain by HPLC. Journal of Analytical Toxicology 1985; 9: 71-75.
Sugimoto H. The new approach in development of anti-Alzheimer’s disease drugs via the cholinergic hypothesis. Chemico-biological Interactions 2008; 175: 204-208.
Sugimoto H, Iimura Y, Yamanishi Y and Yamatsu K. Synthesis and Antiacetylcholinesterase Activity of 1-Benzyl-4-[(5,6-Dimethoxy-1-Indanon-2-Yl)Methyl]Piperidine Hydrochloride (E2020) and Related-Compounds. Bioorganic & Me-dicinal Chemistry Letters 1992; 2: 871-876.
Sugimoto H, Ogura H, Arai Y, Limura Y and Yamanishi Y. Research and development of donepezil hydrochloride, a new type of acetylcholinesterase inhibitor. Japanese Journal of Pharmacology 2002; 89: 7-20.
Summers WK, Majovski LV, Marsh GM, Tachiki K and Kling A. Oral Tetrahydroaminoacridine in Long-Term Treatment of Senile Dementia, Alzheimer Type. New England Journal of Medicine 1986; 315: 1241-1245.
Tencheva J, Yamboliev I and Zhivkova Z. Reversed-phase liquid chromatography for the determination of galanthamine and its metabolites in human plasma and urine. Journal of Chromatography 1987; 421: 396-400.
Terabe S. Micellar electrokinetic chromatography for high-performance analytical separation. Chemical Record 2008; 8: 291-301.
Tiseo PJ, Perdomo CA and Friedhoff LT. Metabolism and elimination of 14C-donepezil in healthy volunteers: a single-dose study. British Journal of Clinical Pharmacology 1998; 46 Suppl 1: 19-24.
Toribio A, Delannay E, Richard B, Ple K, Zeches-Hanrot M, Nuzillard JM and Renault JH. Preparative isolation of huperzines A and B from Huperzia serrata by displacement centrifugal partition chromatography. Journal of Chroma-tography 2007; 1140: 101-106.
Trost BM and Zhang Y. Molybdenum-catalyzed asymmetric allylation of 3-alkyloxindoles: application to the formal total synthesis of (-)-physostigmine. Journal of the American Chemical Society 2006; 128: 4590-4591.
Unni LK, Hannant ME, Becker RE and Giacobini E. Determination of physostigmine in plasma and cerebrospinal fluid by liquid chromatography with electrochemical detection. Clinical Chemistry 1989; 35: 292-295.
Verhaeghe T, Diels L, de Vries R, De Meulder M and de Jong J. Development and validation of a liquid chromatograph-ic-tandem mass spectrometric method for the determination of galantamine in human heparinised plasma. Journal of Chromatography B 2003; 789: 337-346.
Visky D, Jimidar I, Van Ael W, Vennekens T, Redlich D and De Smet M. Capillary electrophoresis-mass spectrometry in impurity profiling of pharmaceutical products. Electrophoresis 2005; 26: 1541-1549.
Wang R, Yan H and Tang XC. Progress in studies of huperzine A, a natural cholinesterase inhibitor from Chinese herbal medicine. Acta Pharmacologica Sinica 2006; 27: 1-26.
Wang Y, Chu D, Gu J, Fawcett JP, Wu Y and Liu W. Liquid chromatographic-tandem mass spectrometric method for the quantitation of huperzine A in dog plasma. Journal of Chromatography B 2004; 803: 375-378.
Wei G, Xiao S, Lu R and Liu C. Simultaneous determination of ZT-1 and its metabolite Huperzine A in plasma by high-performance liquid chromatography with ultraviolet detection. Journal of Chromatography B 2006; 830: 120-125.
Whelpton R and Moore T. Sensitive liquid chromatographic method for physostigmine in biological fluids using dual-electrode electrochemical detection. Journal of Chromatography 1985; 341: 361-371.
Wilson B, Samanta MK, Santhi K, Kumar KP, Paramakrishnan N and Suresh B. Targeted delivery of tacrine into the brain with polysorbate 80-coated poly(n-butylcyanoacrylate) nanoparticles. European Journal of Pharmaceutics and Biopharmaceutics 2008; 70: 75-84.
Wu QQ and Gu YH. Quantification of huperzine A in Huperzia serrata by HPLC-UV and identification of the major constituents in its alkaloid extracts by HPLC-DAD-MS-MS. Journal of Pharmaceutical and Biomedical Analysis 2006; 40: 993-998.
Xiaochao M, Haixue W, Jian X, Zhang T and Zenghong T. Identification of cytocrome P450 1A2 as enzyme involved in the microsomal metabolism of huperzine A. European Journal of Pharmacology 2003; 461: 89-92.
Xie Z, Liao Q, Xu X, Yao M, Wan J and Liu D. Rapid and sensitive determination of donepezil in human plasma by liquid chromatography/tandem mass spectrometry: application to a pharmacokinetic study. Rapid Communications in Mass Spectrometry 2006; 20: 3193-3198.
Yamreudeewong W, Dolence EK and Pahl D. Stability of donepezil in an extemporaneously prepared oral liquid Journal of Pharmacy Practice 2006; 19: 282.
Yasui-Furukori N, Furuya R, Takahata T and Tateishi T. Determination of donepezil, an acetylcholinesterase inhibitor, in human plasma by high-performance liquid chromatography with ultraviolet absorbance detection. Journal of Chro-matography B 2002; 768: 261-265.
71
Chapter 2 Analysis of acetylcholinesterase inhibitors
Ye J, Zeng S, Zhang W and Chen G. Ion-pair reverse-phase high performance liquid chromatography method for deter-mination of Huperzine-A in beagle dog serum. Journal of Chromatography B 2005; 817: 187-191.
Yeh H, Yang Y, Ko J and Chen S. Sensitive analysis of donepezil in plasma by capillary electrophoresis combining on-column field-amplified sample stacking and its application in Alzheimer’s disease. Electrophoresis 2008; 29: 3649-3657.
Yue P, Tao T, Zhao Y, Ren J and Chai X. Determination of huperzine A in rat plasma by high-performance liquid chromatography with a fluorescence detector. Journal of Pharmaceutical and Biomedical Analysis 2007a; 44: 309-312.
Yue P, Tao T, Zhao Y, Ren J and Chai X. Huperzine A in rat plasma and CSF following intranasal administration. In-ternational Journal of Pharmaceuticals 2007b; 337: 127-132.
Zhao B, Moochhala SM, Chaw CS and Yang YY. Simple liquid chromatographic method for the determination of physostigmine and its metabolite eseroline in rat plasma: application to a pharmacokinetic study. Journal of Chroma-tography B 2003; 784: 323-329.