lubricants’ contribution to fuel economy
TRANSCRIPT

Lubricants’ contribution to fuel economy
___________________________________________________
Final report for ATIEL EEIG
ED12057 | Issue Number 3 | 20/06/2019

Lubricants’ contribution to fuel economy | i
Ref: Ricardo/ED12057/Final Report/Issue Number 3
Ricardo Energy & Environment
Customer: Contact:
ATIEL EEIG Nikolas Hill Ricardo Energy & Environment Gemini Building, Harwell, Didcot, OX11 0QR, United Kingdom
t: +44 (0) 1235 75 3522
Ricardo is certificated to ISO9001, ISO14001 and OHSAS18001
Customer reference:
N/A
Confidentiality, copyright & reproduction:
This report is the Copyright of Ricardo Energy & Environment, a trading name of Ricardo-AEA Ltd and has been prepared by Ricardo Energy & Environment under contract to ATIEL EEIG for “Lubricants contribution to fuel economy” dated 16/01/2019. The contents of this report may not be reproduced in whole or in part, nor passed to any organisation or person without the specific prior written permission of the Commercial Manager at Ricardo Energy & Environment. Ricardo Energy & Environment accepts no liability whatsoever to any third party for any loss or damage arising from any interpretation or use of the information contained in this report, or reliance on any views expressed therein, other than the liability that is agreed in the said contract.
Author:
Nikolas Hill, Mark Parrett, Rui Neiva, George Hilton, Selahattin Yucel
Approved By:
Nikolas Hill
Date:
20 June 2019
Ricardo Energy & Environment reference:
Ref: ED12057- Issue Number 3

Lubricants’ contribution to fuel economy | i
Ref: Ricardo/ED12057/Final Report/Issue Number 3
Ricardo Energy & Environment
Executive summary The Association Technique de l'Industrie Européenne des Lubrifiants (ATIEL) commissioned Ricardo to assess the historic and potential future CO2 savings enabled by advancements in engine lubricant technology. Recent years have seen many technological improvements to lubricants leading to a positive effect on emissions. The work in this report quantifies these effects, and their overall impact across the EU vehicle fleet (using Ricardo’s SULTAN model), based on research carried out by Ricardo.
Advanced lubricants can have a number of impacts on the fuel efficiency of the vehicle and therefore the emissions of the transport system. These impacts can be considered as either direct or indirect.
Adjustments to the lubricant that have enabled a reduction in engine losses, such as friction, which reduce the engine fuel consumption are classified as direct impacts. Reduction of lubricant viscosity through base stock changes, viscosity modifiers or the addition of friction modifiers have proven to be routes to achieve this.
The indirect impacts are changes in engine technology with a fuel economy or emissions reducing effect, which would not be possible without lubricant formulation changes.
These direct and indirect impacts have been analysed for a backward-looking case (from 2005-2020) and a forward-looking case (2020-2030) in order to understand the long term impacts the lubricant industry has had on GHG emissions in the road transport sector. See Figure E1 for an overview of the methodology of the study.
Figure E1: Summary of the methodology
Ricardo has undertaken an extensive review of the literature to quantify these direct and indirect benefits, finding 212 papers for review. This, along with Ricardo proprietary information and consultation with ATIEL, fed into analysis of the direct and indirect benefits.
This analysis has shown that, for both gasoline and diesel light-duty vehicles, a wide range in the potential direct improvements is seen. Both the Ricardo and lubricant industry trend lines indicate a better fuel consumption improvement than the minimum ACEA requirements. Light commercial vehicles have similar direct lubricant impacts as these often have the same diesel engines as passenger cars.
However, for heavy-duty vehicles (trucks, buses and coaches), a narrower variation in fuel consumption for a given viscosity is seen, and there is less variation between the minimum and maximum trend lines.
The technologies which have had, and are expected to have, an important indirect effect on light-duty CO2 emissions include downsizing and hybridisation, ranging from stop start to full hybridisation. Low Speed Pre-Ignition (LSPI) control may enable further downsizing, and is achieved by altering lubricant additives, in particular the amount, type and ratio of calcium and magnesium detergents. Water injection and cooled Exhaust Gas Recirculation (EGR) also impact the lubricant and reduce fuel consumption.
The key indirect impacts for CO2 reduction in heavy-duty engines are focused around increased power density and downsizing. Downsizing is only applicable for a modest part of the market (for vehicles with a payload limited by the volume rather than their mass). Other technologies which have required lubricant changes to enable their introduction are steel pistons and variable displacement oil pumps.
Identification of evidenceScenario Modelling
Calculations
Main SULTAN
Scenario Database and Calculation Engine
Identify public literature/data
Collate Ricardo internal data
Gather evidence from ATIEL
experts
Review input data/evidence
Results Database and
SULTAN Results Viewer
Analysis of evidence
Reporting
Estimate lubricant impacts
• Estimate uptake of lubricants
and technologies
Consider future lubricant
challenges
Develop scenarios
Consultation and review of
information with ATIEL

Lubricants’ contribution to fuel economy | ii
Ref: Ricardo/ED12057/Final Report/Issue Number 3
Ricardo Energy & Environment
The outputs from the analysis of lubricant direct and indirect impacts on the fuel efficiency of different vehicle types, were fed directly into the SULTAN scenario modelling analysis. The amended fuel efficiency values were then used within the stock modelling process aligned to the relevant year, consequently feeding through into the overall fuel consumption of the EU vehicle parc. The results of this are shown in Figure E2.
Figure E2: Forward- and backward-looking GHG emissions reductions due to advancements in the lubrication industry
Backward-looking direct (TTW) GHG emission savings
Forward-looking direct (TTW) GHG emission savings
Note: TTW is ‘tank-to-wheel’, i.e. direct emissions from the vehicle exhaust.
From the road vehicle fleet scenario, it has been estimated that the direct benefit from engine lubricant technologies has led to 1.2 – 3.9 MtCO2e/year of avoided emissions in 2020 (compared to 2005 lubricant technology) and will continue to reduce emissions by a further 0.9 – 2.7 MtCO2e/year in 2030.
When indirect benefits are also considered, total avoided emissions have been estimated to increase by 17.8–33.4 MtCO2e/year in 2020 and further reductions beyond 2020 could reach 6.0–9.0 MtCO2e/year by 2030.
The backward-looking aspect of this modelling suggests that lubricants have constituted an important portion of the decarbonisation of the EU; avoided emissions indicated above account for a 2.0–4.0% reduction in GHG emissions in the year 2020 for the road transport sector, a figure which equates to almost 1% of the decarbonisation of the entire EU economy (for the 2016 EU emission figures from road transport).
The resulting cost savings from the direct and lube-enabled improvements to vehicle efficiency have been estimated to result in average annual cost saving per vehicle reaching €37–€67/year for passenger cars and €720–€1282/year for heavy trucks by 2020. Future potential additional annual cost savings per vehicle are estimated between €16–€25/year for cars, and €164–€207/year for heavy trucks by 2030.
The internal combustion engine is unlikely to be completely phased out soon and continues to see widespread use. In this context, it is important to see that the advancement of lubricant design has enabled a material emission reduction for a major part of the transport sector, seen since 2005, and will continue to have an impact on the wider EU emissions reduction targets through 2030 and potentially beyond.

Lubricants’ contribution to fuel economy | iii
Ref: Ricardo/ED12057/Final Report/Issue Number 3
Ricardo Energy & Environment
Table of contents
Executive summary ............................................................................................................. i
Table of contents ............................................................................................................... iii
Table of figures .................................................................................................................. iv
Table of tables .................................................................................................................... iv
Table of abbreviations ........................................................................................................ v
1 Introduction ................................................................................................................ 1
2 Overview of ATIEL and European lubricants industry ............................................ 3
2.1 ATIEL ................................................................................................................................. 3
2.2 European lubricants industry and market .......................................................................... 3
2.2.1 Overview of European lubricants industry ................................................................ 3
2.2.2 The lubricants market and specification ................................................................... 4
3 The benefits of engine lubricants ............................................................................. 5
3.1 Legislation and technology trends roadmap ..................................................................... 5
3.2 Benefits of lubricants ....................................................................................................... 10
3.2.1 Direct benefits ........................................................................................................ 10
3.2.1.1 Literature review ........................................................................................... 11
3.2.1.2 Estimates of direct CO2 benefits .................................................................. 11
3.2.2 Indirect benefits ...................................................................................................... 20
3.2.2.1 Light-duty ..................................................................................................... 20
3.2.2.2 Heavy-duty ................................................................................................... 22
3.3 Future lubricants challenges ........................................................................................... 23
3.4 Contribution of lubricants to CO2 emissions reductions .................................................. 24
3.4.1 Fleet modelling ....................................................................................................... 24
3.4.2 Results and discussion ........................................................................................... 27
3.4.2.1 Contribution of lubricants to historic GHG and fuel costs savings from EU road vehicles 27
3.4.2.2 Potential contribution of lubricants to future GHG and fuel cost savings from EU road vehicles ................................................................................................................... 29
4 Conclusions ............................................................................................................. 32
5 References ............................................................................................................... 33
Appendices ....................................................................................................................... 35
A1 Appendix 1: Technical Assumptions ...................................................................... 36
A1.1 Direct benefit quantitative assumptions .......................................................................... 36
New vehicle production volumes .............................................................................................. 36
Viscosity grades ....................................................................................................................... 36
A1.2 Indirect benefit assumptions ............................................................................................ 37
A2 Appendix 2: Additional Scenario Analysis Results ............................................... 38

Lubricants’ contribution to fuel economy | iv
Ref: Ricardo/ED12057/Final Report/Issue Number 3
Ricardo Energy & Environment
Table of figures
Figure 1.1: Outline of the methodology ................................................................................................... 2
Figure 3.1: Legislation roadmap for light and heavy-duty vehicles ......................................................... 6
Figure 3.2: Key engine technologies for light-duty gasoline (Category 1: Average passenger car)....... 7
Figure 3.3: Key engine technologies for light-duty diesel (Category 2: Large passenger car and Category 4: Light commercial vehicle) .................................................................................................... 8
Figure 3.4: Key engine technologies for heavy-duty diesel (Category 3: Long-haul truck) .................... 9
Figure 3.5: Stribeck Curve (schematic) ................................................................................................. 10
Figure 3.6: Ricardo approach to calculate lubricant specification versus time ..................................... 12
Figure 3.7: Estimated share of new gasoline engine lubricant viscosity by vehicle production year (Europe) ................................................................................................................................................ 13
Figure 3.8: Estimated share of new light-duty diesel engine lubricant viscosity by vehicle production year (Europe) ........................................................................................................................................ 13
Figure 3.9: Estimated share of new heavy-duty diesel engine lubricant viscosity by vehicle production year (Europe) ........................................................................................................................................ 14
Figure 3.10: Light-duty gasoline engine normalised fuel consumption variation with lubricant viscosity .............................................................................................................................................................. 17
Figure 3.11: Light-duty diesel engine normalised fuel consumption variation with lubricant viscosity 18
Figure 3.12: Heavy-duty diesel engine normalised fuel consumption variation with lubricant viscosity .............................................................................................................................................................. 19
Figure 3.13 SULTAN modelling process ............................................................................................... 25
Figure 3.14: Illustration of context / challenge of future CO2 targets for cars, LCVs and heavy lorries 26
Figure 3.15: Historical estimates for direct tailpipe (tank-to-wheel, TTW) GHG emissions from EU road vehicles and the contribution of engine lubricants to emissions savings .............................................. 28
Figure 3.16: Historical estimates for fuel costs from EU road vehicles and the contribution of engine lubricants to fuel savings ....................................................................................................................... 29
Figure 3.17: Potential contribution of lubricants to future GHG savings from EU road vehicles .......... 30
Figure 3.18: Potential contribution of lubricants to future fuel cost savings from EU road vehicles ..... 31
Table of tables
Table 3.1: Vehicle categories .................................................................................................................. 5
Table 3.2: Light-duty engine indirect impacts 2000 to 2030 (Vehicle categories 1, 2 and 4) ............... 21
Table 3.3: Heavy-duty engine indirect impacts 2000 to 2030 (Vehicle category 3).............................. 22
Table 3.4: Overview of the modelled scenarios .................................................................................... 25

Lubricants’ contribution to fuel economy | v
Ref: Ricardo/ED12057/Final Report/Issue Number 3
Ricardo Energy & Environment
Table of abbreviations
Abbreviation
ACEA European Automobile Manufacturers' Association
ASTM American Society for Testing and Materials
ATC Technical Committee of Petroleum Additive Manufacturers in Europe
ATIEL Association Technique de l'Industrie Européenne des Lubrifiants
ASC Ammonia Slip Catalyst
BAU Business as Usual
BEV Battery Electric Vehicle (fully electric)
BMEP Brake Mean Effective Pressure
CAC Charge Air Cooler
CEC Coordinating European Council
CGI Compacted Graphite Iron
CMP Clean Mobility Package
CNG Compressed Natural Gas
CO2 Carbon Dioxide
CO2e Carbon Dioxide equivalent
DLC Diamond-like Carbon
DOC Diesel Oxidation Catalyst
DPF Diesel Particulate Filter
EC European Commission
EEIG European Economic Interest Grouping
EELQMS ATIEL European Engine Lubricants Quality Management System
EGR Exhaust Gas Recirculation
ELR Drive Cycle - European Load Response
ESC Drive Cycle - European Stationary Cycle
ETC Drive Cycle - European Transient Cycle
ETS Emissions Trading System
EU European Union
EV Electric Vehicle
FAME Fatty Acid Methyl Ester
FCEV Fuel Cell Electric Vehicle (running on hydrogen)
FGT Fixed Geometry Turbocharger
FIE Fuel Injection Equipment
FQD Fuel Quality Directive (98/70/EC)
GHG Greenhouse Gases
GPF Gasoline Particulate Filter
GVW Gross Vehicle Weight

Lubricants’ contribution to fuel economy | vi
Ref: Ricardo/ED12057/Final Report/Issue Number 3
Ricardo Energy & Environment
Abbreviation
H2 Hydrogen
HD Heavy-Duty
HDD Heavy-Duty Diesel
HDV Heavy-Duty Vehicle (trucks, buses and coaches)
HEV Hybrid Electric Vehicle
HTHS High Temperature High Shear
HV High Voltage
ICE Internal Combustion Engine
ICEV Internal Combustion Engine Vehicle
ISO International Organisation for Standardisation
LCV Light Commercial Vehicle (van)
LDV Light-Duty Vehicle (Car or LCV)
LEV Low Emission Vehicles (includes BEVs, PHEVs, REEVs and FCEVs)
LNT Lean NOx Trap
LSPI Low Speed Pre-Ignition
LV Low Viscosity
MS Member State
Mt Mega ton (million tonnes)
NEDC New European Drive Cycle
OEM Original Equipment Manufacturer
PC Passenger car
PEMS Portable emission testing systems
PHEV Plug-in Hybrid Electric Vehicle
PM Particulate Matter
PN Particle Number
POC Particle Oxidation Catalysts
RES Renewable Energy Sources
REEV Range Extended Electric Vehicle
RW Real world
SAPS Sulphated Ash, Phosphorous and Sulphur
SCR Selective Catalytic Reduction
SCRF Selective Catalytic Reduction on Filter (i.e. DPF)
TC Test cycle
TRL Technology readiness Level
TTW Tank-to-Wheel
TWC Three Way Catalyst
TWLNT Three Way Lean NOx Trap
VGT Variable Geometry Turbocharger

Lubricants’ contribution to fuel economy | vii
Ref: Ricardo/ED12057/Final Report/Issue Number 3
Ricardo Energy & Environment
Abbreviation
WHSC World Harmonized Stationary Cycle
WHTC World Harmonized Transient Cycle
WLTC Worldwide Harmonised Light Vehicle Test Cycle
WLTP World harmonised Light-duty vehicle Test Procedure
WNTE World-harmonised Not-To-Exceed
WTT Well-to-Tank
WTW Well-to-Wheel
xEV Electric vehicles (includes BEVs, PHEVs, REEVs and FCEVs)
ZEV Zero Emission Vehicle (includes BEV and FCEV)

Lubricants’ contribution to fuel economy | 1
Ref: Ricardo/ED12057/Final Report/Issue Number 3
Ricardo Energy & Environment
1 Introduction
The Association Technique de l'Industrie Européenne des Lubrifiants (ATIEL) commissioned Ricardo to assess the historic and potential future CO2 savings enabled by advancements in lubricant technology. In recent years, there have been many technological improvements made to lubricants resulting in a significant positive effect on emissions. These effects have been quantified using a bespoke model using Ricardo’s SULTAN tool, with inputs based on research carried out by Ricardo.
The lubricant industry is aligned with the major European Union (EU) goals and policies to reduce CO2 emissions and other greenhouse gases (GHG). Fuel efficiency improvements enabled by the industry are therefore contributing to the wider policy direction of the EU. The EU has targeted progressive GHG
reduction targets by 2050, a date which a carbon neutral economy is expected. This target is enabled by the ‘2020 climate & energy package’ adopted in 2009 (European Commission, 2009) which sets three key targets: 20% reduction in greenhouse gas emissions (compared to 1990 levels), 20% of EU energy from renewable sources, 20% improvement in energy efficiency by 2020.
More recently, the EU’s climate and energy policy framework for 2030 (European Commission, 2013), agreed by Member States (MS), sets an economy-wide GHG reduction target of 40% compared to 1990 levels by 2030 (as well as a 32% share of renewable energy and a 32.5% improvement in energy efficiency). This GHG reduction target is split between the Emissions Trading System (ETS) (European Commission, 2005) and non-ETS sectors and translates to a reduction of 30% for non-ETS sectors by 2030 (compared to 2005). The Commission’s White Paper on Transport (European Commission, 2011) sets out two targets for transport emissions: a 20% reduction from 2008 levels by 2030, and a 60% reduction from 1990 levels by 2050.
Road transport is a key source of emissions which must be addressed to achieve these targets. In 2016, transport contributed to 27% of the EU’s total GHG emissions, with road transport accounting for 72% of these (European Commission, 2016). In this context, any reduction in fuel usage from the road transport sector has a large effect on overall system emissions.
In November 2017, the European Commission launched the 2nd Clean Mobility Package (CMP) (European Commission, 2017), setting out CO2 standards for new cars and vans for 2021 to 2030. Since then, the revised CO2 regulations have been finalised, meaning that average CO2 emissions for new cars/vans would have to be 37.5%/31% lower than in 2021 (respectively) in 2030 (European Commission, 2019)1. Similar CO2 standards for heavy-duty lorries/trucks, requiring 30% reduction by 2030 (versus 2019 levels), are also near finalisation (European Commission, 2018).
Advanced lubricants can have a number of impacts on the fuel efficiency of the vehicle and therefore the transport system emissions. The lubricant contributions to improving engine fuel economy (and thereby also reducing fuel costs to end-users) can be considered as either direct or indirect.
The direct impacts are those changes to the lubricant which have enabled a reduction in engine losses such as friction which reduce the engine fuel consumption. These are achieved mainly through changes to the lubricant viscosity, through either the lubricant base stock, viscosity modifiers, the addition of friction modifiers or other formulation effects to reduce engine efficiency losses.
The indirect impacts are changes in engine technology with a fuel economy or emissions reducing effect, which would not be possible without lubricant formulation changes. These may require more significant changes to the base stock, additives or formulation.
This report examines the historic and future impacts of direct and indirect contributions to fuel efficiency arising from advanced engine lubricants; an outline for the project methodology is provided in Figure 1.1.
The report is structured as follows: Chapter 2 provides a summary of the background to ATIEL and the lubricants industry. Chapter 3 provides a summary of the benefits of engine lubricants: the background legislation and technology trends is provided in Section 3.1, followed by a detailed presentation and discussion of the direct and indirect benefits of engine lubricants in Section 3.2. Finally, a discussion of the future challenges in the industry are presented in Section 3.3. This information is then used to inform
1 A transition has been taking place in the regulatory test-cycle / test procedures from the NEDC (upon which the 2020/21 targets are based) to WLTP (Worldwide Harmonised Light-duty vehicle Test Procedure). Due to the uncertainty in the correlation between NEDC and WLTP at 2021, the post-2020 CO2 targets will be set relative to the final WLTP values. There is therefore uncertainty on what the final gCO2/km targets will be.

Lubricants’ contribution to fuel economy | 2
Ref: Ricardo/ED12057/Final Report/Issue Number 3
Ricardo Energy & Environment
the SULTAN scenario modelling analysis, the methodology and results of which are presented in Section 3.4. A summary and conclusions drawn from this analysis is provided in the final Chapter 4, with references and technical appendices presented at the end of the report. A general overview of the methodology followed in the study is shown in Figure 1.1.
Figure 1.1: Outline of the methodology
Identification of evidenceScenario Modelling
Calculations
Main SULTAN
Scenario Database and Calculation Engine
Identify public literature/data
Collate Ricardo internal data
Gather evidence from ATIEL
experts
Review input data/evidence
Results Database and
SULTAN Results Viewer
Analysis of evidence
Reporting
Estimate lubricant impacts
• Estimate uptake of lubricants
and technologies
Consider future lubricant
challenges
Develop scenarios
Consultation and review of
information with ATIEL

Lubricants’ contribution to fuel economy | 3
Ref: Ricardo/ED12057/Final Report/Issue Number 3
Ricardo Energy & Environment
2 Overview of ATIEL and European lubricants industry
2.1 ATIEL
ATIEL is a European Economic Interest Grouping (EEIG) representing the combined knowledge and experience of leading European and international engine oil manufacturers and marketers.
Its collective expertise in engine lubricants technology has helped establish best practices and quality standards for the benefit of both vehicle manufacturers and consumers.
ATIEL’s members include the major European oil companies, as well as major global oil companies with a European presence. These companies have extensive experience in the manufacture and marketing of engine oils, often through their lubricant brands.
By drawing on the technical know-how of its membership, ATIEL promotes consensus on key technical issues, ensuring that engine oils continue to contribute to improved wear protection, deposit control, lower emissions and fuel economy.
This is achieved by publication of the ATIEL Code of Practice and the ATIEL European Engine Lubricants Quality Management System (EELQMS) Committee (ATIEL, 2019). The EELQMS has been jointly developed by the European Automobile Manufacturers' Association (ACEA), the Technical Committee of Petroleum Additive Manufacturers in Europe (ATC) and ATIEL. It aims to ensure that the lubricants on the market meet the performance claims being made about them by combining different standards, codes of practice and test methods in one system. This provides assurance that the needs of vehicle Original Equipment Manufacturers (OEMs) and consumers are met. The ATIEL Code of Practice is one element of EELQMS along with the ACEA European Oil Sequences, SAE International Standards and Coordinating European Council (CEC) Test Methods amongst others. ATIEL administers EELQMS and the ATIEL EELQMS Committee supports and promotes EELQMS, including auditing requirements, provision of training and guidance as well as monitoring lubricant field samples to assess conformance and promoting continuous improvement.
As of April 2019, 222 European companies, and a further 140 headquartered in other regions, have registered to the EELQMS Marketers’ Letter of Conformance. This means they can make claims for their products to meet the performance requirements of ACEA.
2.2 European lubricants industry and market
2.2.1 Overview of European lubricants industry
The European lubricants industry supplied lubricants to a European passenger car parc of circa 260 million passenger cars, circa 32 million vans and 6 million trucks in 2018 (ACEA, 2018). The lubricants industry produced an estimated 3 million tonnes of automotive lubricants in 2017 (Lindemann, 2018).
The industry supply chain is split between base oil suppliers, additive suppliers and finished lubricant marketers. Base oil suppliers supply the base stock which is the bulk of on road engine lubricant by volume. Additive suppliers develop and manufacture a wide range of chemical additives with a variety of purposes which are vital for ensuring a modern lubricant satisfies the engine and customer requirements. Finished lubricant marketers blend, store and distribute the lubricants. ATIEL represents the base oil suppliers and the finished lubricant marketers, while the additive suppliers are represented by the ATC.
It is the combined technical developments of all three parts of the supply chain which result in the development of lubricants that enabled reduced emissions of CO2 and improved fuel economy.
There are over 220 companies involved in the marketing and blending of engine lubricants, with approximately 12 companies in Europe involved in the development and production of additives.
There are many standards that a high-quality lubricant should meet; ACEA and SAE International both provide lubricant standards. ACEA provides European Oil Sequences (ACEA, 2019) for service-fill oils which define the minimum quality level of a lubricant for use with their member automotive

Lubricants’ contribution to fuel economy | 4
Ref: Ricardo/ED12057/Final Report/Issue Number 3
Ricardo Energy & Environment
manufacturers. SAE International provides standards for passenger cars, including SAE J300, Engine Oil Viscosity Classification (SAE International, 2015), which defines mono- and multi-grade engine oils and is used throughout the European lubricant industry. CEC, together with ASTM (American Society for Testing and Materials) and ISO (International Organisation for Standardisation), develops the Test Methods for performance testing of automotive engine oils.
2.2.2 The lubricants market and specification
Lubricant market
The viscosity grade of a lubricant required to be used by the OEM can vary significantly between vehicles, with a mix of different viscosities and specifications across new vehicle categories, manufacturers and engines in a given vehicle model year. Therefore, the European vehicle market at a given time point is made up of a wide mix of lubricants. This is modelled and illustrated in later Section 3.2.1 on the direct benefits of lubricants.
Lubricant specifications
There are a variety of lubricant viscosity specifications, with many OEMs having their own standards. Throughout this report multi-grade lubricants are referred to by their SAE viscosity grades (SAE International, 2015), for example 5W-30. The first number is related to the “winter viscosity”, with the second number the “summer viscosity”. The lower the number the lower the viscosity, which generally results in lower frictional engine losses and therefore lower fuel consumption. However, this is also dependant on the engine having been designed and manufactured for lower viscosity lubricants.
The direct lubricant contributions (a change in viscosity) are provided by changes to the component base stock, viscosity modifiers and the blending of the lubricant.
The specification of lubricant viscosity is often determined by the OEM in partnership with the lubricant manufacturer for their factory fill lubricants.
The indirect contributions to fuel economy improvement are predominately enabled by additive development together with changes in base stock (i.e. refined mineral oil versus synthetic).
ACEA
ACEA provides European Oil Sequences (ACEA, 2019) for service-fill oils that define different categories of lubricant. For light-duty vehicle engines (i.e. for cars and vans), the A/B class are “High SAPS” (Sulphated Ash, Phosphorous and Sulphur), while the C class are “Low SAPS” compatible with engines containing diesel or gasoline particulate filters (DPF/GPF). The E class is for heavy-duty engine oils (i.e. used in buses, coaches and trucks). Within each class there are several numbered categories, for which sequences (or specifications) are provided.
The ACEA European Oil Sequences specify the minimum requirements for fuel consumption improvement (i.e. direct contributions) for particular classes and categories of 2.5% for A5/B5-16 or 3.0% for C5-16 (using the CEC L-054-96 fuel economy test with the Mercedes Benz M111 engine versus a 15W-40 reference lubricant tested over the New European Driving Cycle).
The vehicle OEMs switching from A/B to C classes is an example of an indirect contribution of the lubricant to reduce emissions: the A/B class lubricants are not compatible with DPFs or GPFs; changes to the lubricant additives for the C class have allowed compatibility with these vehicle technologies and enabled them to be fitted to vehicles. The ACEA sequences are comprehensive, covering minimum viscosities at 150 oC and 100 oC, through to lubricant foaming tendency, oxidation, cleanliness, sludge, wear and biofuel effects.

Lubricants’ contribution to fuel economy | 5
Ref: Ricardo/ED12057/Final Report/Issue Number 3
Ricardo Energy & Environment
3 The benefits of engine lubricants
3.1 Legislation and technology trends roadmap
To represent the majority of the European vehicle parc in the analysis for this study, four vehicle categories were considered, as shown in Table 3.1 below.
Table 3.1: Vehicle categories
Category Fuel type Segment Example
1 Average passenger car Gasoline C-segment Citroen C4
2 Large passenger car Diesel D-segment VW Passat
3 Long-haul truck Diesel Circa 40 tonnes gross vehicle weight (GVW)
Volvo FH12
4 Light commercial vehicle Diesel Delivery van Ford Transit
The direct benefits attributable to engine lubricant changes are discussed and analysed for these four vehicle categories, together with the indirect benefits due to the engine technologies which would not have been possible without changes to the lubricant. The assessment of impacts for the vehicle parc was considered for the years 2005, 2018 and 2030; therefore, to feed into this the technical analysis of lubricant impacts in this section considers new vehicles for the time periods of 2000, 2005, 2010, 2018 and also with predictions for 2025 and 2030.
A significant market driver for improvements to engine fuel consumption and emissions is EU legislation. Figure 3.1 shows the emissions and CO2 reduction requirements for the different vehicle categories between 2005 and 2030, together with the vehicle test cycles for these requirements.
Throughout the 2005-2030 period a significant number of engine technology changes have or are expected to be implemented. A high-level set of roadmaps in Figure 3.2 and Figure 3.3 show the technologies for light-duty gasoline and diesel vehicles. Note that ‘category 4’ light commercial vehicle broadly aligns with the light-duty diesel roadmap as both categories typically share similar engines and technologies.
Figure 3.4 shows the technologies for the long-haul truck (heavy-duty diesel, HDD) category. The roadmaps show the period of a technology’s mainstream deployment, which is defined as adoption by several OEMs in more than one model, or significant prominence with a single OEM. The colour of the technology indicates whether that technology is enabled by the lubricant changes since 2000 for either a CO2 or emissions benefits. This is discussed further in Section 3.2.1.2.

Lubricants’ contribution to fuel economy | 6
Ref: Ricardo/ED12057/Final Report/Issue Number 3
Ricardo Energy & Environment
Figure 3.1: Legislation roadmap for light and heavy-duty vehicles

Lubricants’ contribution to fuel economy | 7
Ref: Ricardo/ED12057/Final Report/Issue Number 3
Ricardo Energy & Environment
Figure 3.2: Key engine technologies for light-duty gasoline (Category 1: Average passenger car)

Lubricants’ contribution to fuel economy | 8
Ref: Ricardo/ED12057/Final Report/Issue Number 3
Ricardo Energy & Environment
Figure 3.3: Key engine technologies for light-duty diesel (Category 2: Large passenger car and Category 4: Light commercial vehicle)

Lubricants’ contribution to fuel economy | 9
Ref: Ricardo/ED12057/Final Report/Issue Number 3
Ricardo Energy & Environment
Figure 3.4: Key engine technologies for heavy-duty diesel (Category 3: Long-haul truck)

Lubricants’ contribution to fuel economy | 10
Ref: Ricardo/ED12057/Final Report/Issue Number 3
Ricardo Energy & Environment
3.2 Benefits of lubricants
High level quantitative CO2 benefits were estimated for the four vehicle classes, considering both the direct benefits attributable to changes in engine lubricant viscosity in new vehicles since the year 2000, and the indirect benefits attributable to changes in engine technology that have been enabled by lubricant changes since 2000. Throughout this study it was assumed that a reduction in CO2 emissions is achieved directly by a reduction in fuel consumption. Potential changes in tailpipe emissions of other greenhouse gases (e.g. methane – CH4, nitrous oxide – N2O) were not considered.
Although not quantified in this study, it should be noted that driveline lubricants also play an important role in helping to improve vehicle fuel economy and therefore in meeting CO2 emission standards.
3.2.1 Direct benefits
The direct impacts analysed in this section are those changes to the lubricant which have enabled a reduction in engine losses, such as friction, which reduce the engine fuel consumption. These are achieved primarily through changes to lubricant viscosity, through either lubricant base stock or viscosity modifiers or through the addition of friction modifiers.
The majority of engine fuel consumption reduction is achieved by a reduction in engine friction. Engine friction is a highly complex topic, so for simplicity an engine’s plain bearings can be considered a significant contribution to friction reduction due to lubricant viscosity reduction. Plain bearings in an engine include the main bearings and crankshaft bearings. The Stribeck Curve (Figure 3.5) defines the friction coefficient between two fluid lubricated surfaces, such as plain bearings. Ideally plain bearings operate in the hydrodynamic lubrication regime, where Figure 3.5 shows that a reduction in viscosity reduces the engine friction. There is little surface wear in the hydrodynamic regime. However, different bearings and different engine operation can cause time spent in the mixed regime, where sufficient fluid film is required to prevent excessive wear of the surfaces and ultimately premature engine failure. To achieve a thicker fluid film means a higher lubricant viscosity. Lubricant additives can be added to prevent wear, but these may have an undesirable effect by increasing friction. Therefore, reducing lubricant viscosity is a complex task for additive manufacturers and finished lubricant marketers, requiring significant development and engine testing to ensure the friction reduction and fuel consumption benefit does not adversely impact engine durability.
Figure 3.5: Stribeck Curve (schematic)
The direct benefits considered in this study for quantitative analysis include only changes to the lubricant viscosity, as captured by the lubricant SAE grade (such as 5W-30). Assessment of fuel economy changes due to friction modifiers is not possible; due to the confidentiality surrounding additive development, lubricant companies are not willing to divulge what additives are present in a specific lubricant when it is tested. Similarly, the uptake of additives used in the lubricants supplied to European vehicles could not be quantified either.
Therefore, there are potentially greater direct CO2 benefits than those calculated where friction modifiers have been developed and included within lubricants since 2000.

Lubricants’ contribution to fuel economy | 11
Ref: Ricardo/ED12057/Final Report/Issue Number 3
Ricardo Energy & Environment
3.2.1.1 Literature review
Ricardo undertook a comprehensive literature review to source and evaluate published literature related to engine technologies, oil properties and CO2 benefits. The focus on this literature review was to determine data for the direct CO2 benefits due to lubricant viscosity changes. Two industry leading powertrain sources were included in the review: the Ricardo Powerlink Database, which is the most comprehensive collection of powertrain related material in the world with over 300,000 publications, together with SAE Mobilus which contains over 200,000 publications. It should be noted, however, that these publications are not all related to lubricants.
To identify which papers were relevant to determine the direct CO2 benefits due to lubricant viscosity changes, this literature review made use of the following search terms: ‘engine lubricant’, ‘engine lubricant viscosity’, ‘engine oil’, ‘HTHS’ and several combinations of these terms plus qualifiers (like ‘friction’), totalling 30 search terms. Using those terms, and restricting the search to papers published after 2008, Ricardo experts then analysed the abstracts of the records identified and 212 relevant papers were found for review. This then resulted in 43 papers which contained quantitative fuel consumption information for the study.
Of these, only the results with a direct quantitative relationship between viscosity and fuel consumption, which were focused on commercial lubricants and applicable to the four vehicle categories, were suitable and included in the data analysed. There were seven sources suitable for inclusion in the light-duty gasoline dataset, four in the light-duty diesel dataset and five for the heavy-duty dataset. These are data points are plotted in Figure 3.10, Figure 3.11 and Figure 3.12 shown in Section 3.2.1.2.
In addition, both lubricant industry and Ricardo test data has been used to increase the number of data points. For example, this added circa 150 additional data points to form the trends plotted on the gasoline viscosity versus fuel consumption graph.
3.2.1.2 Estimates of direct CO2 benefits
Direct benefits for new vehicles were quantified by determining and then combining two sets of trends:
1. Lubricant viscosity breakdown in the market at intervals across the 2000 to 2030 period.
2. Relative CO2 (or fuel consumption) across the lubricant viscosity range.
The result of this analysis was an estimate of the average new vehicle contribution to fuel economy attributable to the lubricant.
This approach was taken for the three different engine types which fit the four vehicle categories:
1. Light-duty gasoline (Category 1: Average passenger car).
2. Light-duty diesel (Category 2: Large passenger car and Category 4: Light commercial vehicle).
3. Heavy-duty diesel (Category 3: Long haul diesel truck).
Lubricant viscosity breakdown across the 2000 to 2030 period
Figure 3.6 shows a summary of the approach used by Ricardo: this approach considered historical and forecast market data of the number of installed engines in Europe by OEMs to determine the key engines. Although only engines with significant production volumes were considered, circa 80% of the engine market is included in this method and it represents the mainstream. For each key engine the oil grade was determined; oil retailer recommendations and Ricardo databases were used for historical viscosity, OEM specified grades for current viscosity and Ricardo’s expectations for future viscosity. Combining these gives an estimation of the viscosity split across each new vehicle market.
Further details on the specific assumptions made are included in Appendix A1.1. These include the number of engines produced within an engine family for it to qualify as a key engine, and the engine range considered applicable to the long-haul truck category.
Ricardo has categorised future lubricants with viscosities lower than 0W-20 into two categories:
• Low viscosity 1 (LV1), which is 0W-16.
• Low viscosity 2 (LV2), which is 0W-12 or 0W-8.
For LV2 there is uncertainty which viscosity grade will become mainstream towards 2030, as products with these viscosities are not yet available in the mainstream European market. For simplicity the same average CO2 benefit is assumed to apply for both 0W-12 or 0W-8 in the analysis (i.e. based on the average saving for the two grades).

Lubricants’ contribution to fuel economy | 12
Ref: Ricardo/ED12057/Final Report/Issue Number 3
Ricardo Energy & Environment
Figure 3.6: Ricardo approach to calculate lubricant specification versus time

Lubricants’ contribution to fuel economy | 13
Ref: Ricardo/ED12057/Final Report/Issue Number 3
Ricardo Energy & Environment
Light-duty viscosity breakdown
The mainstream engine lubricants for new gasoline engines show a general historical trend to lower viscosity lubricants (Figure 3.7), which is expected to continue towards 2030. The 5W-40, 0W-40 and 10W-40 grades of lubricant which were specified for a third of new mainstream gasoline engines in 2000 were no longer specified by 2018. The 0W-20 grade of lubricant represents 29% of the engines in 2018, having not been present in the mainstream at 2010. The adoption of new lower viscosity lubricants by the mainstream is expected to continue towards 2030 with mainstream adoptions of 0W-16.
Figure 3.7: Estimated share of new gasoline engine lubricant viscosity by vehicle production year (Europe)
Note: 2025 and 2030 are predictions.
The adoption of LV2 lubricants (0W-12 or 0W-8) is uncertain. Significant engine design changes may be required, including to ensure sufficient film thickness for hydrodynamic operation of bearings at these low viscosities. There is some uncertainty which OEMs will follow this approach for 2030. However, given the 37.5% fleet wide passenger car CO2 reduction required between 2021 and 2030 OEMs are expected to have to consider all possibilities to reduce fuel consumption.
Diesel passenger car and light commercial vehicle engines have a larger share of higher viscosity lubricants (Figure 3.8). They also follow a trend in the reduction of viscosity. Therefore, the future share of 0W-20 and 0W-16 lubricants is expected to be lower than for gasoline.
Figure 3.8: Estimated share of new light-duty diesel engine lubricant viscosity by vehicle production year (Europe)
Note: 2025 and 2030 are predictions.
0%
10%
20%
30%
40%
50%
60%
70%
80%
90%
100%
2000 2005 2010 2018 2025 2030
LV2 (0W-12/0W-8)
LV1 (0W16)
0W-20
0W-30
5W-20
5W-30
0W-40
5W-40
10W-40
0%
10%
20%
30%
40%
50%
60%
70%
80%
90%
100%
2000 2005 2010 2018 2025 2030
LV1 (0W-16)
0W-20
0W-30
5W-30
0W-40
5W-40

Lubricants’ contribution to fuel economy | 14
Ref: Ricardo/ED12057/Final Report/Issue Number 3
Ricardo Energy & Environment
Heavy-duty engine viscosity breakdown
HDD engine lubricant viscosity for new long-haul trucks (Figure 3.9) shows a significant shift in lubricant viscosity. The viscosity grades of 15W-40 and 10W-40 which dominated the market in 2000 were completely replaced by lower viscosities by 2018. By 2030 the new engine specifications are expected to be split between 0W-20, 0W-30 and 5W-30 grades.
Figure 3.9: Estimated share of new heavy-duty diesel engine lubricant viscosity by vehicle production year (Europe)
Note: 2025 and 2030 are predictions.
Relative fuel consumption across the lubricant viscosity range
The relative fuel consumption change was assessed for each engine class, considering engine test data. There are a variety of datasets, with lubricants run in different engines and across different test cycles.
Each dataset includes a reference lubricant operated in a given engine over a particular engine or vehicle test cycle. The lubricant is changed to a different viscosity specification and the same test is repeated, using the same engine and the same engine or vehicle test cycle. The data is plotted by SAE lubricant viscosity grade for light-duty and High Temperature High Shear (HTHS) viscosity for heavy-duty engines. The ACEA fuel economy requirement is referenced in the charts, with the industry data of commercial lubricants aligning with or exceeding the ACEA requirements.
The data presented is the public domain data, sourced as referenced in earlier Section 3.2.1.1 of this report, together with Ricardo and lubricant industry data. While the datapoints for the public domain data are shown, due to confidentiality of the data, neither the lubricant industry or Ricardo datapoints can be displayed. However, the “data range” shows the minimum and maximum spread of the data from all three sources. Both the lubricant industry and Ricardo data trend lines are shown.
The fuel consumption is normalised back to the baseline which is 15W-40. This is an industry standard baseline and is the highest viscosity seen in the mainstream European market in the period 2000 to 2030. The fuel consumption of 15W-40 is given as 100%, with the percentage fuel consumption relative to 15W-40 given for each data point.
For light duty engine classes, the upper and lower 90% confidence interval lines are used to read off the change in fuel consumption when moving from one viscosity grade to another. For heavy-duty engines, due to a smaller variation in fuel consumption at a given viscosity, the upper and lower data range lines are used. The viscosity grades change between years, so the minimum and maximum fuel consumption changes can be calculated. A weighting factor is also applied dependant on the market share of lubricant grade at each year. The result is the fuel consumption change between years, and this is fed into the SULTAN model for the fleet-level analysis – see later Section 3.4.
Light-duty fuel consumption variation with lubricant viscosity
The general trend for both gasoline and diesel engines is that as viscosity reduces (reducing SAE grade) the fuel consumption also reduces, as shown in Figure 3.10 and Figure 3.11. The industry trend
0%
10%
20%
30%
40%
50%
60%
70%
80%
90%
100%
2000 2005 2010 2018 2025 2030
0W20
0W30
5W30
10W30
5W40
10W40
15W40

Lubricants’ contribution to fuel economy | 15
Ref: Ricardo/ED12057/Final Report/Issue Number 3
Ricardo Energy & Environment
line aligns with the ACEA specification for gasoline, while for diesel it meets or exceeds it. The Ricardo trend line meets or exceeds the ACEA specification.
These trends include the data from the literature, the lubricant industry and Ricardo. The actual literature data points are presented on the graphs, but due to confidentiality only lubricant industry and Ricardo data trend lines are presented. All the data points (including those not presented) were used to calculate the full data range (shaded blue) and the upper and lower 90% confidence intervals.
In total circa 150 data points were used to inform the analysis. Regardless of whether additional data points were available, a range of fuel consumption (and therefore CO2) reduction will be present for a given viscosity change. The reasons for this are explained in the following paragraphs.
Passenger car real world light-duty driving is highly variable. As well as the variation between urban, highway and rural driving there is significant difference in both driving style and journey length. The latter impacts the proportion of cold engine operation for a journey. Similarly, the different test cycles of the data, such as the New European Driving Cycle (NEDC) and Worldwide Harmonised Light Vehicle Test Cycle (WLTC), have different proportions of cold engine operation. Therefore, the viscosity versus fuel consumption needs to consider multigrade lubricants. This means that the viscosity effectively becomes two variables. However, due to the recording of most test data, especially public domain data, it is not possible to split the fuel consumption between the impact of the cold and warm viscosity grade changes. Additionally, the actual percentage of cold operation in real world driving throughout Europe is unknown. As a result, the light-duty variation in fuel consumption for a given multigrade viscosity is significant, but also representative of the variation of real-world driving.
There is significant variation in the fuel consumption value for a given viscosity grade, due to several different reasons:
• Different test cycles have different proportions of cold and warm operation depending on the ambient temperature and the duration of the cycle.
• Different engine designs respond differently to changes in lubricant viscosity and formulation, depending on several factors including the tolerancing and surface finishes of bearing surfaces.
• There is a variation in engine builds for the same engine design which may result in engine to engine differences. The Ricardo datasets are tested with the same physical engine, but it is not clear if this is the case with all the public domain datasets.
• Different lubricant formulations, including different friction modifiers and other surface-active additives may be present, all of which impart different lubricant frictional behaviour in the multiple engine operating conditions, despite being the same dataset. Where stated datasets with consistent friction modifiers were used.
• Within a given SAE lubricant viscosity grade there is a finite range of the viscosity specification, and even broader range of dynamic viscosity (HTHS). This is especially true for 5W-30 and 0W-20 lubricant specifications where some lubricant products are more focused on fuel economy than others.
This study aims to represent the actual fuel consumption change seen across the European vehicle parc. All these variations are representative of the real world, where individual vehicles have significant differences ranging from use cycle through to the build variation and actual lubricant used. Therefore, there will always be some uncertainty. To represent this, the upper and lower 90% confidence interval trend lines are used in the calculation of the European fuel consumption changes. The range of the data is represented by a blue shaded region, although it should be noted that real world variations may lie outside of this region.
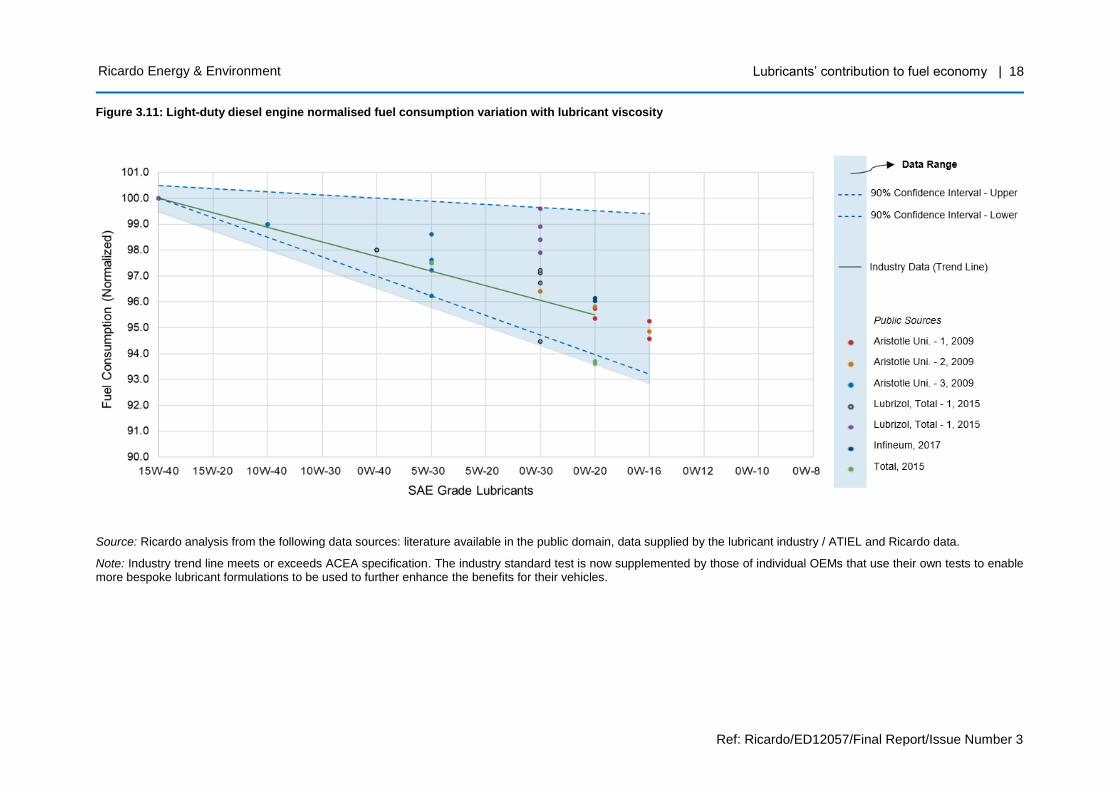
The same factors apply to light-duty diesel engines (Figure 3.11), and again a significant variation in fuel consumption is seen for a given SAE viscosity grade. The diesel spread of data is larger.
Light commercial vehicles typically have similar diesel engines to passenger cars, although the drive cycles are different. This is highly dependent on the usage which ranges from a high utilisation lightly loaded delivery van with frequent stop-starts, to a low utilisation, heavily loaded trade van. However, there is very limited drive cycle data available which considers the fuel consumption variation with lubricant viscosity. Therefore, the diesel light-duty passenger car fuel consumption versus oil viscosity trends are used for light commercial vehicles.

Lubricants’ contribution to fuel economy | 16
Ref: Ricardo/ED12057/Final Report/Issue Number 3
Ricardo Energy & Environment
Heavy-duty fuel consumption variation with lubricant viscosity
The long haul, heavy-duty vehicle category, operates a more predictable driving type than passenger cars, being predominately express way driving (motorway) and at a cruise condition. The cold start element is only a very small proportion of the overall real-world drive cycle, so consequently only warm operation is considered in this analysis. Therefore, only the warm engine viscosity is plotted which is represented by the HTHS viscosity. The equivalent SAE grades are indicated. The result is that the variation in fuel consumption for a given viscosity is much narrower, and there is less variation between the minimum and maximum trend lines used for the European fuel consumption changes. Some variations do exist, and these are due to:
• Some differences in representative test cycles.
• The different response of engine designs to changes in viscosity.
• The variation in engine builds for the same engine design which may result in engine-to-engine differences. The Ricardo datasets are tested with the same physical engine, but it is not clear if this is the case with all the public domain datasets.
• The presence of different lubricant formulations, including friction modifiers, for the different viscosity specifications present. Where stated datasets with consistent friction modifiers were used.
Figure 3.12 shows the reduction in fuel consumption as HTHS reduces.

Lubricants’ contribution to fuel economy | 17
Ref: Ricardo/ED12057/Final Report/Issue Number 3
Ricardo Energy & Environment
Figure 3.10: Light-duty gasoline engine normalised fuel consumption variation with lubricant viscosity
Source: Ricardo analysis from the following data sources: literature available in the public domain, data supplied by the lubricant industry / ATIEL and Ricardo data.
Note 1: Trend lines are based on circa 150 data points.
Note 2: Industry trend line aligns with ACEA specification, Ricardo trend line meets or exceeds ACEA specification. The industry standard test is now supplemented by those of individual OEMs that use their own tests to enable more bespoke lubricant formulations to be used to further enhance the benefits for their vehicles.
Lubricants’ contribution to fuel economy | 18
Ref: Ricardo/ED12057/Final Report/Issue Number 3
Ricardo Energy & Environment
Figure 3.11: Light-duty diesel engine normalised fuel consumption variation with lubricant viscosity
Source: Ricardo analysis from the following data sources: literature available in the public domain, data supplied by the lubricant industry / ATIEL and Ricardo data.
Note: Industry trend line meets or exceeds ACEA specification. The industry standard test is now supplemented by those of individual OEMs that use their own tests to enable more bespoke lubricant formulations to be used to further enhance the benefits for their vehicles.

Lubricants’ contribution to fuel economy | 19
Ref: Ricardo/ED12057/Final Report/Issue Number 3
Ricardo Energy & Environment
Figure 3.12: Heavy-duty diesel engine normalised fuel consumption variation with lubricant viscosity
Source: Ricardo analysis from the following data sources: literature available in the public domain and Ricardo data.

Lubricants’ contribution to fuel economy | 20
Ref: Ricardo/ED12057/Final Report/Issue Number 3
Ricardo Energy & Environment
3.2.2 Indirect benefits
Considerable engine technology changes have occurred for mainstream vehicles, both light and heavy-duty, between 2000 and 2018, and more are expected towards 2030. A high level overview of the engine technology changes both historically and Ricardo’s expectations for the future are shown in the roadmaps, these are Figure 3.2 and Figure 3.3 for light-duty vehicles and Figure 3.4 for heavy-duty vehicles.
The technologies through which the lubricant has indirect fuel consumption benefits are considered as those technologies which:
• A standard lubricant from the year 2000 would prevent the new technology from effectively working.
• A standard lubricant from the year 2000 would not provide the required engine durability with the new technology.
The technologies providing an indirect CO2 emissions benefits are shown in green and the technologies providing an engine tail pipe emissions benefit are shown in orange. Table 3.2 shows the technologies for light-duty engines which are included in the quantitative assessment of the indirect benefits. Table 3.3 shows the equivalent for heavy-duty engines.
For each technology, a high-level estimate of the CO2 benefit was made. This varied by both year and vehicle category for many of the technologies. The estimates are based on published industry data and Ricardo technical research. Table A1 and Table A2 in Appendix A1.2 show the CO2 benefit ranges and uptake rates used. The CO2 benefit was combined with the new vehicle technology uptake rate in each vehicle category at each year. The technology uptake rate was based on a combination of industry market databases, combined with Ricardo’s expectation. For future technologies Ricardo’s expectation was guided by several factors including legislative requirements, technology cost and technology readiness level (TRL).
Real world CO2 benefits are achieved using biofuels throughout Europe. Up to 7% by volume of regular grade pump diesel can be Fatty Acid Methyl Ester (FAME), and up to 10% by volume of regular grade gasoline can be ethanol (Ricardo, 2019). The introduction of biofuel blends, particularly the use of FAME blended in diesel when combined with DPF regeneration, caused significant challenges for the lubricant. Consequently, the ACEA sequences were specifically adjusted. However, biofuels are excluded from the quantitative assessment of indirect benefits as they are not an engine technology. The effects of biofuel usage across Europe are already accounted for in the SULTAN model used in Section 3.4.
The lubricant changes which have enabled these technologies include changes to the base stock and additives. The key base stock change was the mainstream engine move from predominately refined mineral oil (Group I) base stocks in 2000 to predominately synthetic (Group III and Group IV) base stocks by 2018. Synthetic base stocks have permitted increased engine temperatures, allowing technology such as downsizing, steel pistons and operating the engine hotter to reduce lubricant viscosity. The additive changes since 2000 have included low SAPS permitting the aftertreatment systems (DPF and GPF) required for reduced particulate matter (PM) mass and particle number (PN). Further base stock and additive changes have been made to accommodate the use of Exhaust Gas Recirculation (EGR) to reduce nitrogen oxide emissions (NOx).
3.2.2.1 Light-duty
The significant light-duty CO2 reducing technologies are listed in Table 3.2. These include hybridisation, ranging from stop-start which is expected to transition to mild hybridisation as well as full hybridisation, and downsizing. Historically, downsizing in gasoline engines has caused an increased uptake of turbocharging, enabled by lubricants capable of tolerating high temperatures. Low Speed Pre-Ignition (LSPI) control may enable further downsizing and is achieved by altering the lubricant additives, in particular the amount, type and ratio of calcium and magnesium detergents. Downsizing for light-duty diesel and the associated increased turbocharger boost pressures and higher temperatures have required changes to the lubricant formulation.
Future gasoline engine technology expected for CO2 reduction which impact the lubricant include water injection and cooled EGR which enable real driving emissions (RDE) compliance with continued downsizing as well as a CO2 reduction.

Lubricants’ contribution to fuel economy | 21
Ref: Ricardo/ED12057/Final Report/Issue Number 3
Ricardo Energy & Environment
Lubricant formulations have also changed to enable the introduction of emission control technology without poisoning of the catalysts. This included low SAPS lubricant formulations for close coupled catalysts for faster catalyst warm up, and for diesel engines, DPF and Selective Catalytic Reduction (SCR) systems.
Table 3.2: Light-duty engine indirect impacts 2000 to 2030 (Vehicle categories 1, 2 and 4)
Technology Fuel type affected
CO2 impact Comments
Hybridisation
Increased engine stop-start and cold starts can lead to increased water in oil, which has required lubricant changes.
Start-stop
Optimised oil to reduce low temperature viscosity to account for increased cooler engine operation caused by longer engine off periods.
Downsizing
Downsizing caused higher oil temperatures (especially compressor outlet temperatures) which were enabled by fully synthetic oil, and increased lubricant acidity, managed by anti-oxidants.
Turbocharging
Higher oil temperatures occurred with gasoline turbocharging (links to gasoline downsizing).
LSPI prevention
Switching to a balanced detergent formulation (not Ca or Mg) or different dispersants prevents LSPI for highly turbocharged engines.
Water injection
Water injection is expected to increase the water in oil content, which is anticipated to require oil development to mitigate. There is some uncertainty over the projected future uptake.
Cooled EGR
EGR causes an increase of abrasive soot particles entering the lubricant, causing wear, and increased acidity. Both require lubricant base stock and additive changes to mitigate. Cooled EGR for gasoline has a fuel consumption benefit, and therefore CO2 reducing impact, while for diesel cooled EGR reduces NOx emissions.
Close coupled catalysts
Predominately adopted by diesel vehicles during this period. An already high adoption on gasoline vehicles increased further. Lower SAPS limited the formation of sulphated ash for filters and reduced poisoning for flow through catalysts. This enabled optimised catalyst volume for the desired emissions legislation, with a lower impact of poisoning on the catalyst durability, lowering exhaust back pressure and reducing fuel consumption.
DPF
Change in lubricant ash limits and switch to low SAPS enabled DPF compatibility with oil.
GPF
Similarly to DPF, lubricant ash limit changes are expected to enable GPF compatibility.
Biofuels
The introduction of ethanol blends of up to 10% in regular grade gasoline across Europe, and biodiesel blends of up to 7% FAME in regular grade diesel across Europe required significant changes to lubricant formulation to prevent oxidation. As a result the ACEA sequences were specifically adjusted. Impacts of biofuel are not included in the analysis.
Notes: Fuel type: green G denotes gasoline, red D denotes diesel; CO2 impact: higher number of blue squares represents higher lubricant indirect impact from the technology.

Lubricants’ contribution to fuel economy | 22
Ref: Ricardo/ED12057/Final Report/Issue Number 3
Ricardo Energy & Environment
3.2.2.2 Heavy-duty
The lubricant for heavy-duty engines has been required by OEMs to be more robust, primarily due to the high lifetime durability requirements of heavy-duty engines. The focus has been on engine protection rather than providing maximum fuel economy benefits. As a result, there has been more margin to change engine technology without significant lubricant viscosity changes than for light-duty. Consequently, heavy-duty (Table 3.3) indicates fewer engine system technologies than light-duty (Table 3.2).
The key impacts for heavy-duty engine CO2 reduction are focused around increased power density (as engine power has historically increased in Europe) and downsizing (as future engine power remains constant). Downsizing is only applicable for a modest part of the heavy-duty vehicle market, which is limited by the volume of goods rather than their mass. The switch to fully synthetic lubricants combined with additives to reduce compressor deposits, has enabled an increase in compressor outlet temperatures required for increased power density and downsizing.
Similarly, the adoption of steel pistons requires synthetic oil due to higher lubricant temperatures on the underside of the piston. By 2025 the adoption of steel pistons is expected across the majority of the heavy-duty engine market. Variable displacement oil pumps require good lubricant contaminant control and are expected across approximately half the heavy-duty engine market by 2030.
Lubricant changes since 2000 have also enabled the fitment of DPF emissions control equipment on heavy-duty vehicles (typically for Euro VI). Low SAPS lubricants reduce DPF ash levels leading to increased intervals between filter cleaning resulting in reduced backpressure and reduced real world fuel consumption over the vehicle life. While these technologies do not provide a direct quantifiable CO2 reduction they have enabled significant emissions reduction. It is the first catalyst in the exhaust system which is typically impacted by sulphur or other poisons from the lubricant. SCR systems are typically post Diesel Oxidation Catalyst (DOC), therefore, the lubricant component of SCR sulphur poisoning is limited and is not considered in this analysis
Table 3.3: Heavy-duty engine indirect impacts 2000 to 2030 (Vehicle category 3)
Technology CO2 impact Comments
Downsizing
As demand for increased power falls, downsizing is possible, which will increase engine stress and compressor outlet temperatures further, which is enabled by lubricant changes.
Power density
Increased compressor outlet temperatures as power density increases have been enabled by fully synthetic lubricant and formulation changes (such as new anti-oxidant and detergent additives) to reduce compressor deposits.
Steel pistons Steel pistons increase the temperatures which the lubricant is exposed to, which has required synthetic oil.
Variable displacement oil pump
Good lubricant contaminant control is required due to the sliding surface contacts within the pump.
Cooled EGR
When introduced, cooled EGR did not reduce fuel consumption, but relative to the alternative methods (available at the time to meet the legislative emissions requirements), EGR prevented an increase in fuel consumption. EGR causes an increase of abrasive soot particles entering the lubricant, causing wear, and increased acidity. EGR required fundamental changes in lubricant formulation to mitigate engine issues.
DPF
Change in lubricant ash limits enabled DPF compatibility with lubricant. DPF required fundamental lubricant additive changes to mitigate engine issues.
Biofuels
The introduction of biodiesel blends up to 7% FAME in regular grade diesel across Europe required significant changes to lubricant formulation to prevent oxidation. As a result the ACEA sequences were specifically adjusted. Impacts of biofuel are not included in the analysis.
Notes: CO2 impact: higher number of blue squares represents higher lubricant indirect impact from the technology.

Lubricants’ contribution to fuel economy | 23
Ref: Ricardo/ED12057/Final Report/Issue Number 3
Ricardo Energy & Environment
3.3 Future lubricants challenges
The roadmaps (Section 3.1) and the indirect benefits (Section 3.2.2) show, respectively, the direction of future engine technology and discuss some of the lubricant challenges. This section also considers more technologies not included in the quantitative analysis as they are either not CO2-related or they are forecast to be technologies with low uptake. Both will challenge future lubricant development.
Light-duty gasoline
Significant powertrain electrification is expected for mainstream light-duty gasoline engines towards 2030: both mild hybridisation and full hybridisation. Under some driving cycles, both systems have increased cold engine operation which can allow increased levels of contaminants to enter the lubricant. For full hybrids, especially plug-in hybrids, significant time between engine use can also occur. These could cause a significant challenge for the lubricant.
Electric turbochargers and superchargers are expected to increase modestly in market share towards 2030, particularly for premium vehicles. These may challenge the lubricant by increasing engine boost pressures and therefore lubricant temperatures.
Technologies required for RDE compliance of highly downsized engines at Euro 6d and beyond are expected to cause some level of future lubricant challenge. These include water injection and cooled EGR. Water injection could result in an increase of water entering the lubricant, while cooled EGR is expected to increase the lubricant exposure to combustion contaminants. Gasoline EGR combustion contaminants differ to those of diesel EGR, which the lubricant industry has already responded to.
Light-duty diesel
Due to the higher cost of diesel vehicles, full hybridisation is not expected to be as mainstream as for gasoline, but mild hybridisation is expected. Therefore, the same mild hybrid lubricant challenges will occur as for gasoline.
Market share corrections following “diesel-gate” are expected to reduce the European diesel powertrain share further, reducing European diesel technology development. Therefore, significant future on-engine lubricant challenges are not expected.
However, future emissions limits are expected to cause lubricant challenges. The European Commission is expected to reduce limits further and include new emissions species in “Euro 7” or equivalent legislation. These are expected to require changes to the aftertreatment, which may require further changes to the lubricant to prevent catalyst poisoning.
Heavy-duty diesel
Engine technology development for HDD is relatively conservative compared to light-duty, and combined with a greater margin to change engine technology without impacting the lubricant, means fewer lubricant challenges are expected.
For example, some hybridisation is expected for long-haul HDD towards 2030, although it is only likely to give a cost-effective benefit on some routes and so the market uptake is uncertain. However, it is unlikely that any long-haul truck would operate as described for light-duty gasoline, so few lubricant challenges are expected.
As with light-duty diesel, future lubricant challenges are expected to ensure lubricant compatibility with future aftertreatment requirements; these are related to new emissions species and further emissions limit reductions.
Reducing viscosity
Perhaps the biggest future challenge for the lubricant industry is the development of lower viscosity lubricants such as 0W-16, 0W-12 and possibly 0W-8 (as discussed in the analysis of direct benefits, Section 3.2.1). To ensure that these lubricants provide fuel consumption benefits while simultaneously meeting all the various engine and aftertreatment durability requirements will be a significant challenge.
Future opportunities
The lubricant industry expects that there are greater opportunities to optimise the lubricant for lower CO2 through greater collaboration between OEMs and the lubricant industry. Through improved collaboration between all parties, the lubricant could have a greater role to play in the whole engine

Lubricants’ contribution to fuel economy | 24
Ref: Ricardo/ED12057/Final Report/Issue Number 3
Ricardo Energy & Environment
optimisation process. The resulting greater CO2 reduction of this approach could benefit the whole automotive industry, reducing European vehicle CO2 emissions further.
3.4 Contribution of lubricants to CO2 emissions reductions
3.4.1 Fleet modelling
To assess the overall benefits of lubricants on the EU road vehicle parc, Ricardo conducted a fleet scenario modelling analysis using the SULTAN model.
The SULTAN model has developed into a well-known policy analysis tool for transport in the EU. It uses a simplified stock-modelling approach and information on transport activity, emission factors, and fuel efficiency to develop estimates for net energy consumption and emissions from different transport modes. The impact of various policy decisions can be analysed in both a forward- and backward-looking way, in order to develop understandings of industry changes associated with policy decisions.
An overview of the SULTAN model and the modelling process is provided in Box 1 and Figure 3.13 below, respectively.
The outputs from the analysis of lubricants’ direct and indirect impacts on the fuel efficiency of different vehicle types, outlined in sections 3.2.1 and 3.2.2, were fed directly into the SULTAN scenario modelling analysis. For this, the baseline scenario values for fuel efficiency of each powertrain type (car, LCV, heavy truck, etc.) were adjusted in line with outputs from the data collection and consultation with ATIEL. The amended fuel efficiency values were then used within the stock modelling process aligned to the relevant year, consequently feeding through into the derived evolution in the overall fuel consumption of the entire EU vehicle parc.
Box 1: Overview of the SULTAN model
In previous work for the European Commission’s Directorate General on Climate Action (DG CLIMA) (the EU Transport GHG: Routes to 2050 projects2), Ricardo Energy & Environment developed the sustainable transport illustrative scenarios tool called SULTAN (SUstainabLe TrANsport). The model has most recently been enhanced and updated to the European Commission’s 2016 Reference scenario (REF2016), as part of work for DG CLIMA considering transport’s potential contribution to the EU’s 2030 decarbonisation objectives. It has also been further utilised in a number of other UK and European projects, e.g.:
• Analysing the potential impacts of different ultra-low emission vehicle (ULEV) measures/incentives on emissions from European passenger cars (for Greenpeace and T&E).
• Evaluating the potential energy, GHG, NOx and PM emissions impacts of different low emission vehicle uptake scenarios in London (for Transport for London).
• Evaluating the potential fuel consumption and GHG impacts of uptake of cost-effective lightweighting by heavy-duty vehicles (for DG Climate Action).
• Evaluating the wider impacts of scenarios for High EV uptake in Europe to 2050, in comparison to alternatives with more significant use of low carbon fuels (CONCAWE).
• Analysis of the potential contribution of low carbon fuels in decarbonising light-duty vehicles (LDVs, i.e. passenger cars and vans) from 2020-2050 in the context of the European Commission’s 2nd Clean Mobility Package (CMP), and the EU’s medium- and long-term GHG reduction targets (for ePURE).
2 http://www.eutransportghg2050.eu/

Lubricants’ contribution to fuel economy | 25
Ref: Ricardo/ED12057/Final Report/Issue Number 3
Ricardo Energy & Environment
Figure 3.13 SULTAN modelling process
For the fleet-level analysis, this study considers both forward- and backward-looking scenarios to estimate both the historic benefits and the future potential. These scenarios are set up in different ways: (i) The backward-looking scenarios adjust baseline fuel efficiency figures in the period 2005-2020 to calculate the increase in emissions if the direct and indirect lubricant impacts were removed. (ii) The forward-looking scenarios were developed from Ricardo analysis and estimates of future lubricant improvements in the period 2020-2030, also in comparison with the anticipated trends in emissions to meet post-2020 CO2 targets for light-duty and heavy-duty vehicles. The developed scenarios used to develop this picture are discussed in more detail in Table 3.4.
Table 3.4: Overview of the modelled scenarios
# Scenario name Summary of scenario definition
0 Baseline This scenario represents the business as usual (BAU) case for road transport in the EU, consistent with the EC’s 2016 Reference scenario (REF2016). (This excludes the post-2020 CO2 reduction targets for cars, vans and heavy trucks). This scenario is based on the assumption that no new policy is introduced to change the current fleet share or vehicle efficiency figures. REF2016 has been used as a basis for the modelling analysis for a wide range of EC impact assessments.
Historic/backward-looking scenarios
1 Minus Direct Lube3 (MinusDL)
This scenario has been developed to calculate the direct impact on CO2
emissions of advanced lubricant technology on the European vehicle fleet from 2005 to the current day. Removal of the improvements in lubricant technology over this time lead to lower modelled vehicle efficiencies as the scenario answers the question: If lubricants had not improved since 2005, what would the emissions be?
2 Minus Lube Enabled
(MinusLE)
This scenario has been developed to calculate the historic impact on CO2 emissions of lubricant enabled technologies since 2005. It does this in the same way as the Minus-DL scenario i.e. calculating the avoided emissions from lubricant enabled technologies over the period.
3 The estimated minimum (Min) and maximum (Max) benefits are assessed in two scenario variants.
Input Data / Pre-processing Output Data / Post-processing
Main SULTAN
Scenario Database and
Calculation Engine
Activity by mode
Vehicle Energy Consumption [MJ/km]• By mode, model year, powertrain type *
GHG Emission Factors [CO2e/MJ]• By fuel / energy carrier
• TTW and WTW
Lubrication Impact Inputs• Impact on new vehicle efficiency*, **
• Impact on whole fleet efficiency*, **
Other SULTAN Inputs
Vehicle stock• Fleet # projection by mode
• Survival rates
• % share of new vehicles by powertrain *
Results Database and
SULTAN Results Viewer
Notes:
* Key input variable, set by the scenarios
developed for this study
** Input variable to potential sensitivity
scenarios for this study.
SULTAN Outputs• Fleet numbers / composition by powertrain
• Energy consumption by fuel
• Total by fuel / energy carrier type
• Fuel costs (with / without tax)
• TTW, WTW GHG emissions
Additional Post-Processing
Final Results
Scenario Modelling Calculations
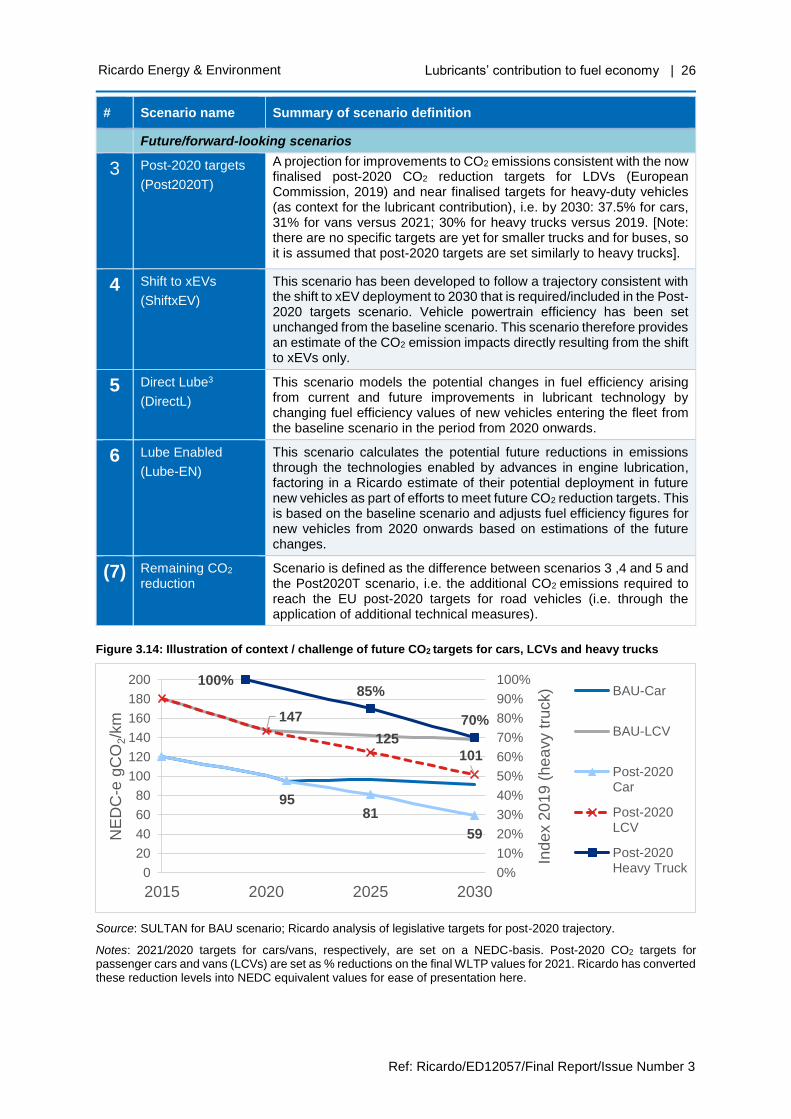
Lubricants’ contribution to fuel economy | 26
Ref: Ricardo/ED12057/Final Report/Issue Number 3
Ricardo Energy & Environment
# Scenario name Summary of scenario definition
Future/forward-looking scenarios
3 Post-2020 targets
(Post2020T)
A projection for improvements to CO2 emissions consistent with the now finalised post-2020 CO2 reduction targets for LDVs (European Commission, 2019) and near finalised targets for heavy-duty vehicles (as context for the lubricant contribution), i.e. by 2030: 37.5% for cars, 31% for vans versus 2021; 30% for heavy trucks versus 2019. [Note: there are no specific targets are yet for smaller trucks and for buses, so it is assumed that post-2020 targets are set similarly to heavy trucks].
4 Shift to xEVs
(ShiftxEV)
This scenario has been developed to follow a trajectory consistent with the shift to xEV deployment to 2030 that is required/included in the Post-2020 targets scenario. Vehicle powertrain efficiency has been set unchanged from the baseline scenario. This scenario therefore provides an estimate of the CO2 emission impacts directly resulting from the shift to xEVs only.
5 Direct Lube3
(DirectL)
This scenario models the potential changes in fuel efficiency arising from current and future improvements in lubricant technology by changing fuel efficiency values of new vehicles entering the fleet from the baseline scenario in the period from 2020 onwards.
6 Lube Enabled
(Lube-EN)
This scenario calculates the potential future reductions in emissions through the technologies enabled by advances in engine lubrication, factoring in a Ricardo estimate of their potential deployment in future new vehicles as part of efforts to meet future CO2 reduction targets. This is based on the baseline scenario and adjusts fuel efficiency figures for new vehicles from 2020 onwards based on estimations of the future changes.
(7) Remaining CO2 reduction
Scenario is defined as the difference between scenarios 3 ,4 and 5 and the Post2020T scenario, i.e. the additional CO2 emissions required to reach the EU post-2020 targets for road vehicles (i.e. through the application of additional technical measures).
Figure 3.14: Illustration of context / challenge of future CO2 targets for cars, LCVs and heavy trucks
Source: SULTAN for BAU scenario; Ricardo analysis of legislative targets for post-2020 trajectory.
Notes: 2021/2020 targets for cars/vans, respectively, are set on a NEDC-basis. Post-2020 CO2 targets for passenger cars and vans (LCVs) are set as % reductions on the final WLTP values for 2021. Ricardo has converted these reduction levels into NEDC equivalent values for ease of presentation here.
9581
59
147
125
101
100%85%
70%
0%
10%
20%
30%
40%
50%
60%
70%
80%
90%
100%
0
20
40
60
80
100
120
140
160
180
200
2015 2020 2025 2030
Ind
ex 2
01
9 (
he
avy t
ruck)
NE
DC
-e g
CO
2/k
m
BAU-Car
BAU-LCV
Post-2020Car
Post-2020LCV
Post-2020Heavy Truck

Lubricants’ contribution to fuel economy | 27
Ref: Ricardo/ED12057/Final Report/Issue Number 3
Ricardo Energy & Environment
3.4.2 Results and discussion
The scenario modelling carried out in SULTAN has calculated the impact lubricants have had on EU emissions and fuel costs for the entire European vehicle fleet in the period in the period 2005-2030. This is shown in Sections 3.4.2.1 and 3.4.2.2.
From a historic perspective, lubricants have avoided 17.8–33.4 MtCO2e since 2005 and will continue to result in a further 6.0–9.0 MtCO2e reduction in road transport emissions by 2030. This has contributed to a 2.2–4.1% decarbonisation of the road transport sector (2005-2020) and will continue to provide further future GHG savings in the road transport sector, contributing to the 2030 CMP target.
This is matched with significant financial savings for consumers due to the improved fuel efficiency of their vehicles. These cost savings have been enabled through a relatively low intervention approach when compared to other fuel efficiency improvement technologies.
3.4.2.1 Contribution of lubricants to historic GHG and fuel costs savings from EU road vehicles
The potential avoided emissions from advanced lubricant technologies is shown in Figure 3.15. This shows the range of impacts (Min-Max) from the lubricant’s direct impact on fuel economy (from lower viscosity). The range of indirect impact is also shown (Min-Max), i.e. from the role lubricants play in enabling other technologies which then play a role in improving fuel efficiency.
The results in the charts show the in-year impact for the entire vehicle fleet since 2005, and this results in a relatively wide range between the minimum and maximum impacts, with a direct contribution of 1.2–3.9 MtCO2 in emissions reductions by 2020, and 16.6–29.5 MtCO2 emissions by lubricant enabled technologies.
EU 2020 climate & energy package, agreed in 2009, set the target of a 20% reduction in GHG emissions by 2020 (versus 1990); the analysis shows that lubricants have played a significant role in contributing to this objective. Based on the fleet analysis a reduction of 2.2–4.1% in road transport emissions by 2020 has been enabled by the advances in lubricants in this timeframe. Additionally, as road transport accounted for 27% of all EU emissions in 2016, this would represent a contribution of almost 1% of the decarbonisation of the entire EU economy in that year.
In addition to the contribution to CO2 reduction, a further substantial impact that lubricants have had is on reducing fuel costs to drivers. The improvement in fuel efficiency lubricants enables, leads to a direct reduction in fuel costs. The estimated results of this impact for EU road transport end-users is shown in Figure 3.16, with engine lubricants contributing €1.1–€3.0 billion in end-user fuel savings per year by 2020, and contributing to even greater savings by lube-enabled technologies.
A 2.8–4.7% reduction in the overall fuel bill has potentially been enabled from lubricant improvements over the modelled timeframe.
Overall, the above range of fuel savings equate to the average annual saving per vehicle (for combined direct lubricant and lube-enabled savings) by 2020 reaching between €37–€67/year for cars and €720–€1282/year for heavy trucks.
Whilst the cost of implementing the lubricant enabled technologies can be high, the incremental cost for improved lubricants is small (especially when compared to other fuel efficiency interventions or vehicle replacement), this represents a significant saving for both commercial and private road users.

Lubricants’ contribution to fuel economy | 28
Ref: Ricardo/ED12057/Final Report/Issue Number 3
Ricardo Energy & Environment
Figure 3.15: Historical estimates for direct tailpipe (tank-to-wheel, TTW) GHG emissions from EU road vehicles and the contribution of engine lubricants to emissions savings
GHG savings (Max)
GHG savings (Min)
Source: Ricardo scenario modelling using SULTAN.
Note: The ‘Lube Enabled’ impacts include only estimates due to technologies applied to vehicles, and do not include estimates for other impacts resulting from biofuel uptake.

Lubricants’ contribution to fuel economy | 29
Ref: Ricardo/ED12057/Final Report/Issue Number 3
Ricardo Energy & Environment
Figure 3.16: Historical estimates for fuel costs from EU road vehicles and the contribution of engine lubricants to fuel savings
Fuel savings (Max)
Fuel savings (Min)
Source: Ricardo scenario modelling using SULTAN.
3.4.2.2 Potential contribution of lubricants to future GHG and fuel cost savings from EU road vehicles
The forward-looking scenarios estimate the future reductions in GHG emissions which will be enabled by further improvements in lubrication technology from the present day. It should be noted that these GHG and fuel savings are in addition to the improvements already implemented in previous years. Figure 3.17 shows this estimated reduction from 2020-2030. This is an important time period for EU GHG emissions as it will see a rapid change in the targeted emissions reduction due to the EU 2030 climate & energy framework. This sets targets for a 40% reduction in EU GHG emissions (from 1990 levels) by the end of the decade, and an objective for 2030 to reduce EU non-ETS sector GHG emissions by 30%, relative to 2005. The difference between the ‘Post2020T’ scenario and the other modelled scenarios shows that current measures are unlikely to be enough for the road transport sector to meet the EU targets.
In this work, it is estimated that between 6.0–9.0 MtCO2e can be avoided through expected improvements in lubricants and their enabling effect on other vehicle technologies in the year 2030. The forward-looking lubricant impacts shown here represent a 0.8–1.3% reduction in emission from the transport sector over this time. This reduction can be set against wider system reductions in GHG emissions, and as this trend continues, further emissions reductions may become more difficult (and expensive), therefore those arising from lubricant technologies may become relatively more valuable.
Further fuel cost reductions are expected for vehicle end-users to 2030, due to the positive impact that lubricants have on road vehicle efficiency. The potential fuel costs savings are shown in Figure 3.18. In

Lubricants’ contribution to fuel economy | 30
Ref: Ricardo/ED12057/Final Report/Issue Number 3
Ricardo Energy & Environment
the maximum improvement scenario, a saving of €8.25 billion/year is estimated to be possible for EU road transport in 2030.
This will mean an additional average annual saving per vehicle by 2030 of between €16–€25/year for cars and €164–€207/year for heavy trucks (for combined direct lubricant and lube-enabled savings).
Figure 3.17: Potential contribution of lubricants to future GHG savings from EU road vehicles
GHG savings (Max)
GHG savings (Min)
Source: Ricardo scenario modelling using SULTAN.
Note: The ‘Lube Enabled’ impacts include only estimates due to technologies applied to vehicles, and do not include estimates for other impacts resulting from biofuel uptake.

Lubricants’ contribution to fuel economy | 31
Ref: Ricardo/ED12057/Final Report/Issue Number 3
Ricardo Energy & Environment
Figure 3.18: Potential contribution of lubricants to future fuel cost savings from EU road vehicles
Fuel savings (Max)
Fuel savings (Min)
Source: Ricardo scenario modelling using SULTAN.
Lubricants’ contribution to fuel economy | 32
Ref: Ricardo/ED12057/Final Report/Issue Number 3
Ricardo Energy & Environment
4 Conclusions
This report shows the key role the lubricant industry has played and will continue to play in decarbonising the road transport sector. This decarbonisation has been evaluated through two main mechanisms – direct and indirect benefits.
The direct benefits refer to the engine fuel efficiency improvement from using a more advanced engine lubricants, in particular lower viscosity lubricants, enabled by advances in lubricant formulation, including both additive and base oil technology. The analysis of the direct benefits shows a clear historical shift to lower viscosity lubricant specification since 2000 across passenger car and commercial vehicle engines. This shift is expected to continue towards 2030. Testing evidence (public domain, lubricant industry and Ricardo) shows a clear trend of CO2 reductions attributable to the use of lower viscosity lubricant specification. The true real-world magnitude of this reduction in Europe falls within a range depending on a number of factors.
The indirect benefits refer to engine technologies which have been enabled by a shift to more advanced lubricants. Of these, eleven technologies were found to have benefited by advances in lubricants for light-duty vehicles and seven for heavy-duty vehicles.
From the road vehicle fleet scenario analysis using the SULTAN model, it has been estimated that the direct benefit from engine lubricant technologies has increased to up to 3.9 MtCO2e/year of avoided emissions in 2020 (compared to 2005 lubricant technology) and future improvements to lubricants have the potential to continue to reduce emissions by up to a further 2.7 MtCO2e/year in 2030.
To understand the wider benefit from engine lubricant technology improvements, consideration of the indirect benefits is also important – i.e. due to the enabling/optimisation of other vehicle technical fuel efficiency improvements. When this is also considered, total avoided emissions have been estimated to increase by 16.6–29.5 MtCO2e/year in 2020 and further direct and indirect emissions reductions beyond 2020 could reach 6.0–9.0 MtCO2e/year by 2030. This backward-looking aspect of this modelling suggests that lubricants have constituted a significant portion of the decarbonisation of the EU. The avoided emissions indicated above account for a 2.2–4.1% reduction in GHG emissions in the year 2020. This figure equates to almost 1% of the decarbonisation of the entire EU economy (for 2016 EU emission figures from road transport).
Further emissions reductions are possible also as a result of future advances in the industry to 2030, potentially leading to both direct and indirect benefits. These could lead to an additional 0.8–1.3% reduction in road transport sector emissions per year by 2030 (based on 2020 levels).
As the use of advanced lubricants will lead to an increase in vehicle fuel efficiency, there is also a cost saving from reduced fuel usage. The estimated value of this is €13.8–€26.2bn when compared to 2005 and a further reduction of €5.2–€8.3bn for EU road transport as a whole could be enabled to 2030.
This equates to a historical annual cost saving per vehicle (for combined direct lubricant and lube-enabled savings) of €37–€67/year for passenger cars and €720–€1282/year for heavy trucks by 2020. Future potential additional annual cost savings per vehicle are estimated between €16–€25/year for cars, and €164–€207/year for heavy trucks by 2030.
The internal combustion engine is unlikely to be completely phased out soon and continues to see widespread use. In this context, it is important to see that the advancement of lubricant design has enabled a material emission reduction for a major part of the transport sector, seen since 2005, and will continue to have an impact on the wider EU emissions reduction targets through 2030 and potentially beyond.

Lubricants’ contribution to fuel economy | 33
Ref: Ricardo/ED12057/Final Report/Issue Number 3
Ricardo Energy & Environment
5 References
ACEA. (2018). Vehicles in use in Europe.
ACEA. (2019). Lubricants. Retrieved from ACEA - European Automobile Manufacturers Association: https://www.acea.be/industry-topics/tag/category/lubricants
ATIEL. (2019). Code of Practice. Retrieved from ATIEL - Association Technique de l'Industrie Européenne des Lubrifiants : https://atiel.org/code-of-practice/code-of-practice
Champagne, N., & Laurent, D. (2015). Improving fuel economy and durability of new engines with innovative lubricants.
European Commission. (2005). Emissions Trading Scheme. Retrieved from Europa: https://ec.europa.eu/clima/policies/ets_en
European Commission. (2009). 2020 climate & energy package. Retrieved from European Commission: https://ec.europa.eu/clima/policies/strategies/2020_en
European Commission. (2011). White Paper on Transport. Retrieved from https://ec.europa.eu/transport/sites/transport/files/themes/strategies/doc/2001_white_paper/lb_com_2001_0370_en.pdf
European Commission. (2013). Climate and Energy Policy Framework 2030. Retrieved from https://ec.europa.eu/clima/policies/strategies/2030_en
European Commission. (2016). Road Transport: Reducing CO2 emissions from vehicles. Retrieved from Europa: https://ec.europa.eu/clima/policies/transport/vehicles_en#tab-0-0
European Commission. (2017). Energy Union: Commission takes action to reinforce EU's global leadership in clean vehicles. Retrieved from European Commission: https://ec.europa.eu/transport/modes/road/news/2017-11-08-driving-clean-mobility_en
European Commission. (2017a). Proposal for post-2020 CO2 targets for cars and vans. Retrieved from European Commission, DG Climate Action: https://ec.europa.eu/clima/policies/transport/vehicles/proposal_en
European Commission. (2018). Reducing CO2 emissions from heavy-duty vehicles. Retrieved from European Commission: https://ec.europa.eu/clima/policies/transport/vehicles/heavy_en
European Commission. (2019). Stricter CO2 emission standards for cars and vans signed off by the Council. Retrieved from European Council of the European Union: https://www.consilium.europa.eu/en/press/press-releases/2019/04/15/stricter-co2-emission-standards-for-cars-and-vans-signed-off-by-the-council/
European Commission. (2019a). REGULATION OF THE EUROPEAN PARLIAMENT AND OF THE COUNCIL setting CO2 emission performance standards for new passenger cars and for new light commercial vehicles, and repealing Regulations (EC) No 443/2009 and (EU) No 510/2011 (recast). Retrieved from https://data.consilium.europa.eu/doc/document/PE-6-2019-INIT/en/pdf
Fenske, G. R., Ajayi, L., Erck, R. A., & Demas, N. G. (2011). Lubricants - Pathway to improving fuel efficiency of legacy vehicle fleets. Argonne National Laboratory.
Fontaras, G., Vouitsis, E., & Samaras, Z. (2009). Experimental evaluation of the fuel consumption and emissions reduction potential of low viscosity lubricants. Aristotle University of Thessaloniki.
Green, D. A., Selby, K., Mainwaring, R., & Herrera, R. (2011). The effect of engine, axle and transmission lubricant, and operating conditions on heavy duty diesel fuel economy.
Hallworth, G. (2015). Driving truck efficiency. Infineum Insight.
Infineum Insight. (2016). Maximising fuel economy: Research uncovers road to increased lubricant derived fuel economy.
Infineum Insight. (2017). Advanced viscosity modifiers.

Lubricants’ contribution to fuel economy | 34
Ref: Ricardo/ED12057/Final Report/Issue Number 3
Ricardo Energy & Environment
Kwon, W. (2012). Recent trends of oil design. KSAE Powertrain Division and Fuel & Environmental Division Joint Workshop - Technologies for Improving Automotive Energy & Environment.
Lindemann, L. (2018). Future Challenges of the Lubricants Industry. FUCHS Capital Market Day 2018.
Liu, H., Jin, J., Li, H., Yamamori, K., Kaneko, T., Yamashita, M., & Zhang, L. (2017). 0W-16 fuel economy gasoline engine oil compatible with low speed pre-ignition performance.
Nouvel, N., Crane, S., & Obrecht, N. (2015). Towards 0W-16 engine oil viscosity grade in Europe - German OEM fuel economy tests.
Ricardo. (2019). Retrieved from EMLEG: www.emleg.com
SAE International. (2015). J300_201501: Engine Oil Viscosity Classification. Retrieved from https://www.sae.org/standards/content/j300_201501/
Shakespear, P. (2018). Giving CO2 the slip. Transport Engineer.
Stone, A. (n.d.). The European lubricant industry: A tenuous road to recovery. Retrieved from Fuels and Lubricants Magazine: https://www.fuelsandlubes.com/fli-article/the-european-lubricants-industry-a-tenuous-road-to-recovery/
Sullivan, T. (2011). Pushing Bounaries - Shell claims breakthrough for fuel economy. Lubes 'n' Greases.

Lubricants’ contribution to fuel economy | 35
Ref: Ricardo/ED12057/Final Report/Issue Number 3
Ricardo Energy & Environment
Appendices
Appendix 1: Technical Assumptions 36
Appendix 2: Additional Scenario Analysis Results 38

Lubricants’ contribution to fuel economy | 36
Ref: Ricardo/ED12057/Final Report/Issue Number 3
Ricardo Energy & Environment
A1 Appendix 1: Technical Assumptions
A1.1 Direct benefit quantitative assumptions
New vehicle production volumes
• Light-duty vehicle production in Europe:
o To simplify the analysis, only engine families with over 100,000 units annual production were considered. This results in circa 50 engines variants being considered at each year, and represents circa 80% of the total new engine installations (83% in 2018). This ensures that the majority of the market is represented in the viscosity grades selected.
• Heavy-duty vehicle production in Europe:
o The heavy-duty category considers only circa 40 tonne haul tractor units, which typically have engines capacities between 9.0 and 16.0 litres; these constraints were applied when processing the data
o Again, so simplify the analysis, only engine families with over 5,000 units annual production were considered. This results in nearly all engines variants being considered. This ensures that the majority of the market is represented in the viscosity grades selected.
Viscosity grades
• Light-duty viscosity grades:
o Historical viscosity grades for each engine type for 2000, 2005 and 2010 were based on lubricant retailer recommendations for applicable vehicles.
o Current viscosity grades (2018) were based on vehicle manufacturer and lubricant retailer recommendations.
o Future viscosity grades for 2025 and 2030 are Ricardo’s expectations based on individual manufacturer trends and market conservativism, fuel type, level of engine rating (such as Brake Mean Effective Pressure (BMEP) level and whether it is a naturally aspirated or turbocharged engine). Ricardo have categorised future lubricants with viscosities lower than 0W-20 into two categories:
▪ Low viscosity 1 (LV1) is 0W-16.
▪ Low viscosity 2 (LV2) is 0W-12 or 0W-8, as there is uncertainty which viscosity grade will become mainstream. For simplicity the CO2 benefit is assumed to be the same for both.
• Heavy-duty engine viscosity grades:
o Historical viscosity grades for each engine type for 2000 and 2005 were based on a Ricardo database.
o Current viscosity grades (2018) were based on vehicle manufacturer and lubricant retailer recommendations.
o Future viscosity grades for 2025 and 2030 are Ricardo’s expectations based on individual manufacturer trends and market trends.

Lubricants’ contribution to fuel economy | 37
Ref: Ricardo/ED12057/Final Report/Issue Number 3
Ricardo Energy & Environment
A1.2 Indirect benefit assumptions
Table A1: Light-duty indirect technology: High-level estimate of the CO2 benefit (relative to 2000 baseline) and uptake rate for new light duty vehicle sales
Table A2: Heavy-duty indirect technology: High-level estimate of the CO2 benefit (relative to 2000 baseline) and uptake rate for new heavy-duty vehicle sales

Lubricants’ contribution to fuel economy | 38
Ref: Ricardo/ED12057/Final Report/Issue Number 3
Ricardo Energy & Environment
A2 Appendix 2: Additional Scenario Analysis Results
Presented below in Figure A1 and Figure A2 are the tailpipe GHG emissions and end-user fuel cost savings in context with overall GHG emissions and fuel costs from EU road transport.
Figure A1: Historical estimates for direct tailpipe (tank-to-wheel, TTW) GHG emissions and end-user fuel costs from EU road vehicles and the contribution of engine lubricants to savings
Field Chart
GHG emissions (Max benefit)
GHG emissions (Min benefit)
600
650
700
750
800
850
900
2005 2010 2015 2020
GH
G e
mis
sio
ns [
MtC
O2e
]
Historical Trajectory Minus Direct Lube (Max)
Minus Lube Enabled (Max) Baseline
600
650
700
750
800
850
900
2005 2010 2015 2020
GH
G e
mis
sio
ns [
MtC
O2e
]
Historical Trajectory Minus Direct Lube (Min)
Minus Lube Enabled (Min) Baseline

Lubricants’ contribution to fuel economy | 39
Ref: Ricardo/ED12057/Final Report/Issue Number 3
Ricardo Energy & Environment
Field Chart
Fuel costs (Max benefit)
Fuel costs (Min benefit)
Source: Ricardo scenario modelling using SULTAN.
Notes: The ‘Lube Enabled’ impacts include only estimates due to technologies applied to vehicles, and do not include estimates for other impacts resulting from biofuel uptake.
300
350
400
450
500
550
2005 2010 2015 2020
Fu
el co
sts
[€b
illio
n]
Historical Trajectory Minus Direct Lube (Max)
Minus Lube Enabled (Max) Baseline
300
350
400
450
500
550
2005 2010 2015 2020
Fu
el co
sts
[€b
illio
n]
Historical Trajectory Minus Direct Lube (Min)
Minus Lube Enabled (Min) Baseline

Lubricants’ contribution to fuel economy | 40
Ref: Ricardo/ED12057/Final Report/Issue Number 3
Ricardo Energy & Environment
Figure A2: Potential contribution of lubricants to future GHG and end-user fuel cost savings from EU road vehicles
Field Chart
GHG emissions (Max benefit)
GHG emissions (Min benefit)
Fuel costs (Max benefit)
600
650
700
750
800
850
2020 2025 2030
GH
G e
mis
sio
ns [
MtC
O2e
]
Post2020T Other CO2 RednShiftxEV Lube Enabled (Max)Direct Lube (Max) Baseline
600
650
700
750
800
850
2020 2025 2030
GH
G e
mis
sio
ns [
MtC
O2e
]
Post2020T Other CO2 RednShiftxEV Lube Enabled (Min)Direct Lube (Min) Baseline
300
350
400
450
500
550
2020 2025 2030
Fu
el c
osts
[€b
illio
n]
Post2020T Other CO2 RednShiftxEV Lube Enabled (Max)Direct Lube (Max) Baseline

Lubricants’ contribution to fuel economy | 41
Ref: Ricardo/ED12057/Final Report/Issue Number 3
Ricardo Energy & Environment
Field Chart
Fuel costs (Min benefit)
Source: Ricardo scenario modelling using SULTAN.
Notes: The ‘Lube Enabled’ impacts include only estimates due to technologies applied to vehicles, and do not include estimates for other impacts resulting from biofuel uptake.
300
350
400
450
500
550
2020 2025 2030
Fu
el c
osts
[€b
illio
n]
Post2020T Other CO2 RednShiftxEV Lube Enabled (Min)Direct Lube (Min) Baseline

The Gemini Building Fermi Avenue Harwell Didcot Oxfordshire OX11 0QR United Kingdom
t: +44 (0)1235 753000 e: [email protected]
ee.ricardo.com