lrs 2014 cafr - michigan office of the auditor general · introductory section michigan legislative...
TRANSCRIPT
MICHIGAN LEGISLATIVE RETIREMENT SYSTEM • 1
Michigan Legislative Retirement System
Comprehensive Annual Financial Report for the Fiscal Year Ended September 30, 2014
M L R S
A Pension and Other Employee Benefit Trust Fund of the State of Michigan
Prepared by:
Michigan Legislative Retirement System Anderson House Office Building, Suite S0927
P.O. Box 30014 Lansing, Michigan 48909
(517) 373-0575
2 • MICHIGAN LEGISLATIVE RETIREMENT SYSTEM
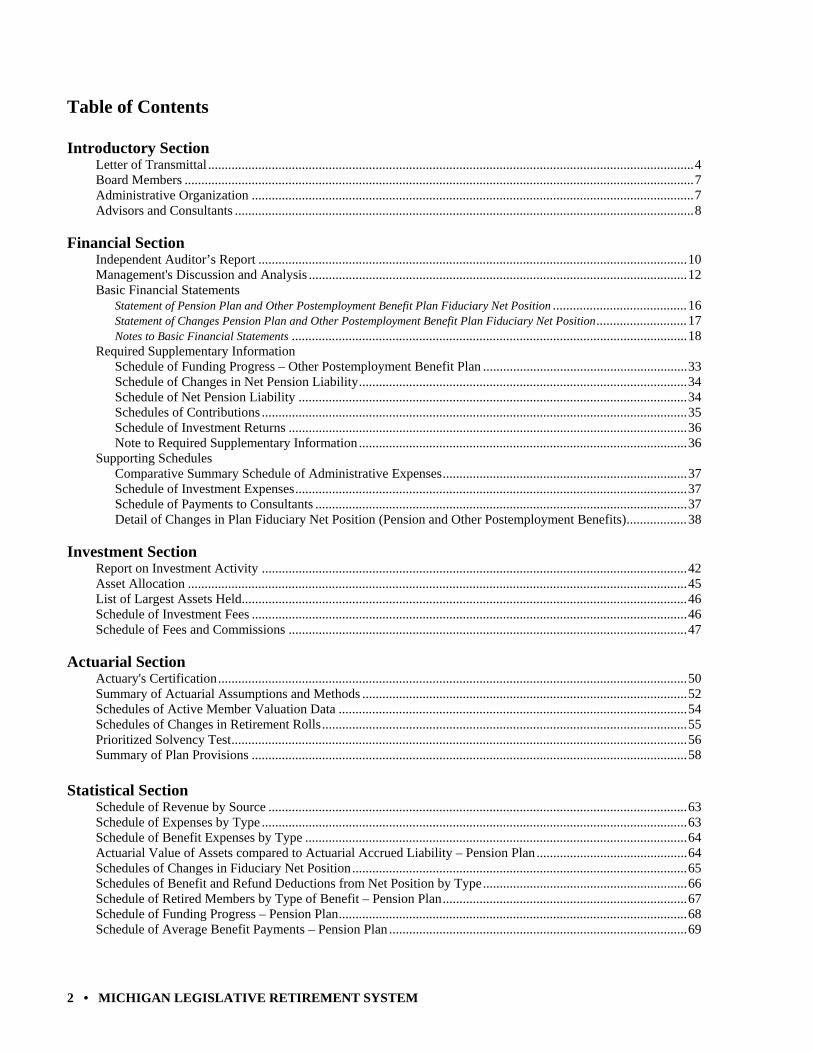
Table of Contents Introductory Section
Letter of Transmittal ................................................................................................................................................. 4 Board Members ........................................................................................................................................................ 7 Administrative Organization .................................................................................................................................... 7 Advisors and Consultants ......................................................................................................................................... 8
Financial Section
Independent Auditor’s Report ................................................................................................................................ 10 Management's Discussion and Analysis ................................................................................................................. 12 Basic Financial Statements Statement of Pension Plan and Other Postemployment Benefit Plan Fiduciary Net Position ........................................ 16 Statement of Changes Pension Plan and Other Postemployment Benefit Plan Fiduciary Net Position ........................... 17 Notes to Basic Financial Statements ...................................................................................................................... 18 Required Supplementary Information Schedule of Funding Progress – Other Postemployment Benefit Plan ............................................................. 33 Schedule of Changes in Net Pension Liability .................................................................................................. 34 Schedule of Net Pension Liability .................................................................................................................... 34 Schedules of Contributions ............................................................................................................................... 35 Schedule of Investment Returns ....................................................................................................................... 36 Note to Required Supplementary Information .................................................................................................. 36 Supporting Schedules Comparative Summary Schedule of Administrative Expenses ......................................................................... 37 Schedule of Investment Expenses ..................................................................................................................... 37 Schedule of Payments to Consultants ............................................................................................................... 37 Detail of Changes in Plan Fiduciary Net Position (Pension and Other Postemployment Benefits) .................. 38
Investment Section Report on Investment Activity ............................................................................................................................... 42 Asset Allocation ..................................................................................................................................................... 45 List of Largest Assets Held..................................................................................................................................... 46 Schedule of Investment Fees .................................................................................................................................. 46 Schedule of Fees and Commissions ....................................................................................................................... 47
Actuarial Section
Actuary's Certification ............................................................................................................................................ 50 Summary of Actuarial Assumptions and Methods ................................................................................................. 52 Schedules of Active Member Valuation Data ........................................................................................................ 54 Schedules of Changes in Retirement Rolls ............................................................................................................. 55 Prioritized Solvency Test ........................................................................................................................................ 56 Summary of Plan Provisions .................................................................................................................................. 58
Statistical Section
Schedule of Revenue by Source ............................................................................................................................. 63 Schedule of Expenses by Type ............................................................................................................................... 63 Schedule of Benefit Expenses by Type .................................................................................................................. 64 Actuarial Value of Assets compared to Actuarial Accrued Liability – Pension Plan ............................................. 64 Schedules of Changes in Fiduciary Net Position .................................................................................................... 65 Schedules of Benefit and Refund Deductions from Net Position by Type ............................................................. 66 Schedule of Retired Members by Type of Benefit – Pension Plan ......................................................................... 67 Schedule of Funding Progress – Pension Plan ........................................................................................................ 68 Schedule of Average Benefit Payments – Pension Plan ......................................................................................... 69
INTRODUCTORY SECTION
MICHIGAN LEGISLATIVE RETIREMENT SYSTEM • 3
Michigan Legislative Retirement System
Comprehensive Annual Financial Report for the Fiscal Year Ended September 30, 2014
INTRODUCTORY SECTION
Certificate of Achievement Letter of Transmittal
Retirement Board Members Advisors and Consultants
Organization Chart
INTRODUCTORY SECTION
4 • MICHIGAN LEGISLATIVE RETIREMENT SYSTEM
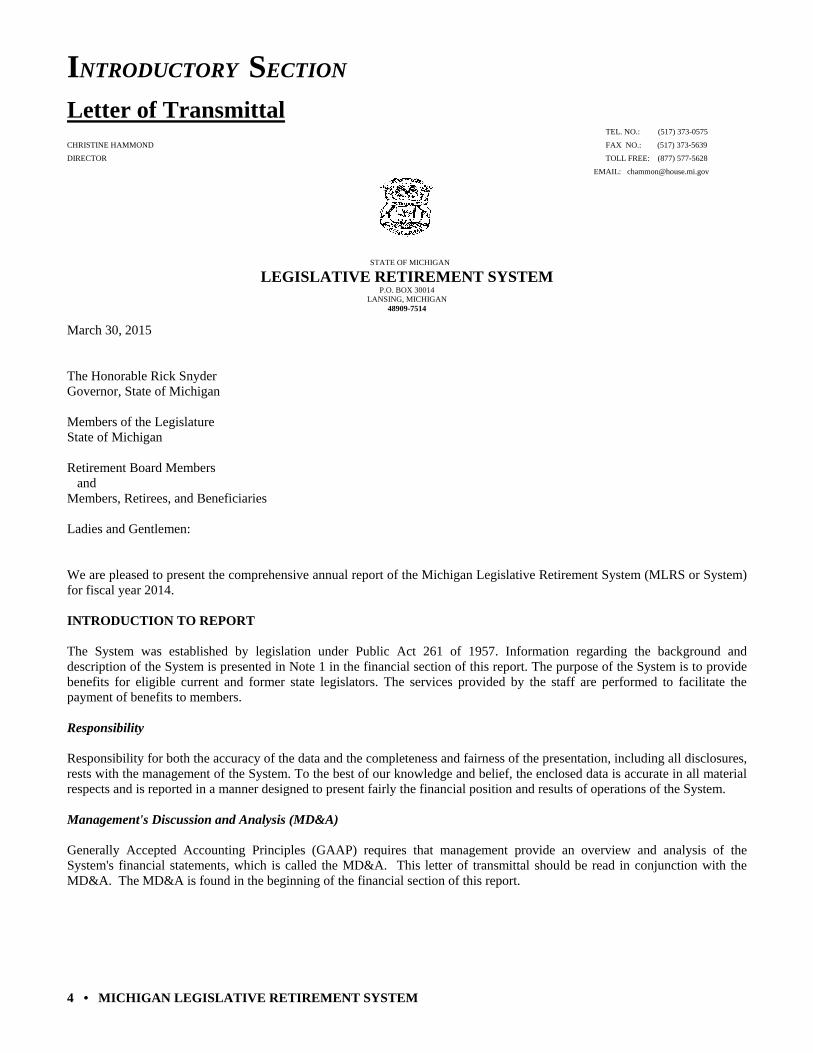
Letter of Transmittal TEL. NO.: (517) 373-0575
CHRISTINE HAMMOND FAX NO.: (517) 373-5639
DIRECTOR TOLL FREE: (877) 577-5628
EMAIL: [email protected]
STATE OF MICHIGAN
LEGISLATIVE RETIREMENT SYSTEM P.O. BOX 30014
LANSING, MICHIGAN 48909-7514
March 30, 2015 The Honorable Rick Snyder Governor, State of Michigan Members of the Legislature State of Michigan Retirement Board Members and Members, Retirees, and Beneficiaries Ladies and Gentlemen: We are pleased to present the comprehensive annual report of the Michigan Legislative Retirement System (MLRS or System) for fiscal year 2014. INTRODUCTION TO REPORT The System was established by legislation under Public Act 261 of 1957. Information regarding the background and description of the System is presented in Note 1 in the financial section of this report. The purpose of the System is to provide benefits for eligible current and former state legislators. The services provided by the staff are performed to facilitate the payment of benefits to members. Responsibility Responsibility for both the accuracy of the data and the completeness and fairness of the presentation, including all disclosures, rests with the management of the System. To the best of our knowledge and belief, the enclosed data is accurate in all material respects and is reported in a manner designed to present fairly the financial position and results of operations of the System. Management's Discussion and Analysis (MD&A) Generally Accepted Accounting Principles (GAAP) requires that management provide an overview and analysis of the System's financial statements, which is called the MD&A. This letter of transmittal should be read in conjunction with the MD&A. The MD&A is found in the beginning of the financial section of this report.
INTRODUCTORY SECTION
MICHIGAN LEGISLATIVE RETIREMENT SYSTEM • 5
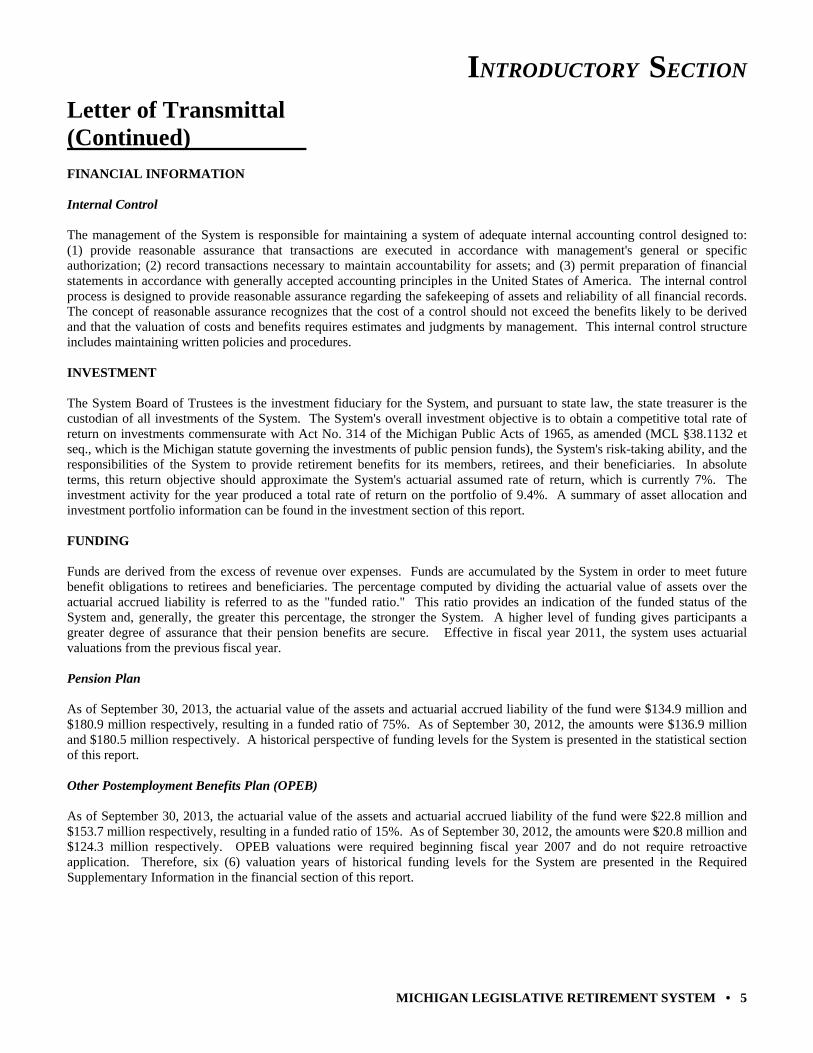
Letter of Transmittal (Continued) FINANCIAL INFORMATION Internal Control The management of the System is responsible for maintaining a system of adequate internal accounting control designed to: (1) provide reasonable assurance that transactions are executed in accordance with management's general or specific authorization; (2) record transactions necessary to maintain accountability for assets; and (3) permit preparation of financial statements in accordance with generally accepted accounting principles in the United States of America. The internal control process is designed to provide reasonable assurance regarding the safekeeping of assets and reliability of all financial records. The concept of reasonable assurance recognizes that the cost of a control should not exceed the benefits likely to be derived and that the valuation of costs and benefits requires estimates and judgments by management. This internal control structure includes maintaining written policies and procedures. INVESTMENT The System Board of Trustees is the investment fiduciary for the System, and pursuant to state law, the state treasurer is the custodian of all investments of the System. The System's overall investment objective is to obtain a competitive total rate of return on investments commensurate with Act No. 314 of the Michigan Public Acts of 1965, as amended (MCL §38.1132 et seq., which is the Michigan statute governing the investments of public pension funds), the System's risk-taking ability, and the responsibilities of the System to provide retirement benefits for its members, retirees, and their beneficiaries. In absolute terms, this return objective should approximate the System's actuarial assumed rate of return, which is currently 7%. The investment activity for the year produced a total rate of return on the portfolio of 9.4%. A summary of asset allocation and investment portfolio information can be found in the investment section of this report. FUNDING Funds are derived from the excess of revenue over expenses. Funds are accumulated by the System in order to meet future benefit obligations to retirees and beneficiaries. The percentage computed by dividing the actuarial value of assets over the actuarial accrued liability is referred to as the "funded ratio." This ratio provides an indication of the funded status of the System and, generally, the greater this percentage, the stronger the System. A higher level of funding gives participants a greater degree of assurance that their pension benefits are secure. Effective in fiscal year 2011, the system uses actuarial valuations from the previous fiscal year. Pension Plan As of September 30, 2013, the actuarial value of the assets and actuarial accrued liability of the fund were $134.9 million and $180.9 million respectively, resulting in a funded ratio of 75%. As of September 30, 2012, the amounts were $136.9 million and $180.5 million respectively. A historical perspective of funding levels for the System is presented in the statistical section of this report. Other Postemployment Benefits Plan (OPEB) As of September 30, 2013, the actuarial value of the assets and actuarial accrued liability of the fund were $22.8 million and $153.7 million respectively, resulting in a funded ratio of 15%. As of September 30, 2012, the amounts were $20.8 million and $124.3 million respectively. OPEB valuations were required beginning fiscal year 2007 and do not require retroactive application. Therefore, six (6) valuation years of historical funding levels for the System are presented in the Required Supplementary Information in the financial section of this report.
INTRODUCTORY SECTION
6 • MICHIGAN LEGISLATIVE RETIREMENT SYSTEM
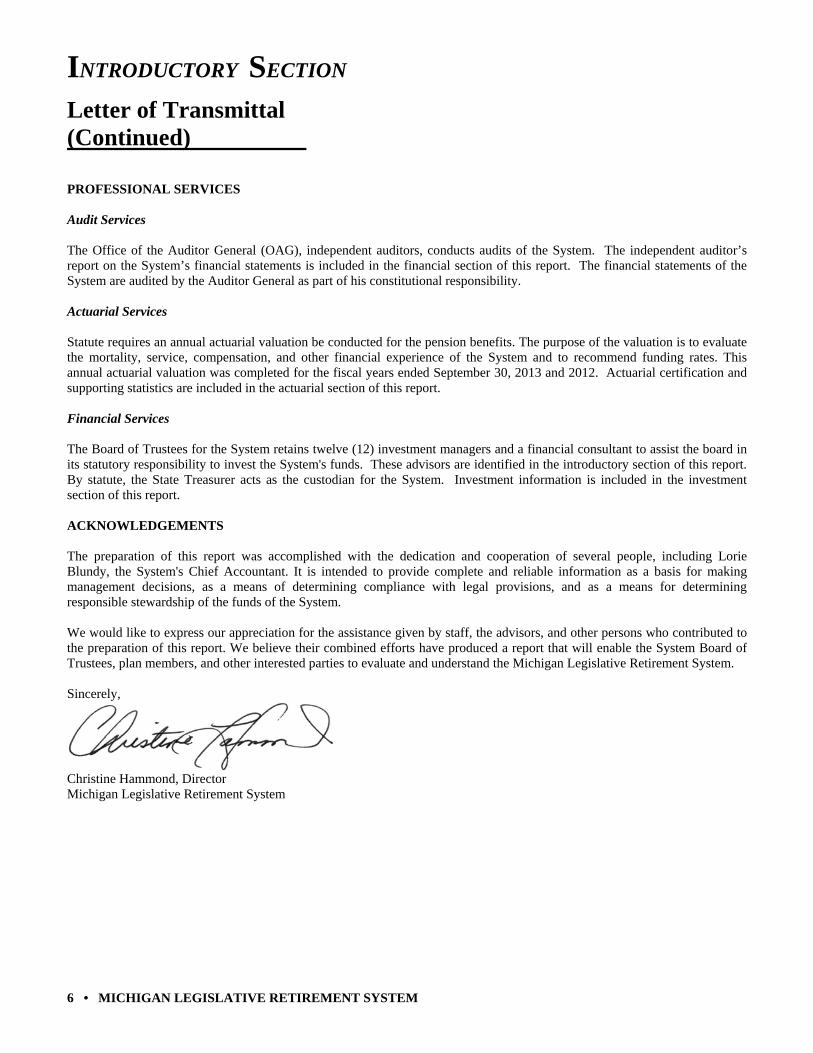
Letter of Transmittal (Continued) PROFESSIONAL SERVICES Audit Services The Office of the Auditor General (OAG), independent auditors, conducts audits of the System. The independent auditor’s report on the System’s financial statements is included in the financial section of this report. The financial statements of the System are audited by the Auditor General as part of his constitutional responsibility. Actuarial Services Statute requires an annual actuarial valuation be conducted for the pension benefits. The purpose of the valuation is to evaluate the mortality, service, compensation, and other financial experience of the System and to recommend funding rates. This annual actuarial valuation was completed for the fiscal years ended September 30, 2013 and 2012. Actuarial certification and supporting statistics are included in the actuarial section of this report. Financial Services The Board of Trustees for the System retains twelve (12) investment managers and a financial consultant to assist the board in its statutory responsibility to invest the System's funds. These advisors are identified in the introductory section of this report. By statute, the State Treasurer acts as the custodian for the System. Investment information is included in the investment section of this report. ACKNOWLEDGEMENTS The preparation of this report was accomplished with the dedication and cooperation of several people, including Lorie Blundy, the System's Chief Accountant. It is intended to provide complete and reliable information as a basis for making management decisions, as a means of determining compliance with legal provisions, and as a means for determining responsible stewardship of the funds of the System. We would like to express our appreciation for the assistance given by staff, the advisors, and other persons who contributed to the preparation of this report. We believe their combined efforts have produced a report that will enable the System Board of Trustees, plan members, and other interested parties to evaluate and understand the Michigan Legislative Retirement System. Sincerely,
Christine Hammond, Director Michigan Legislative Retirement System
INTRODUCTORY SECTION
MICHIGAN LEGISLATIVE RETIREMENT SYSTEM • 7
Administrative Organization
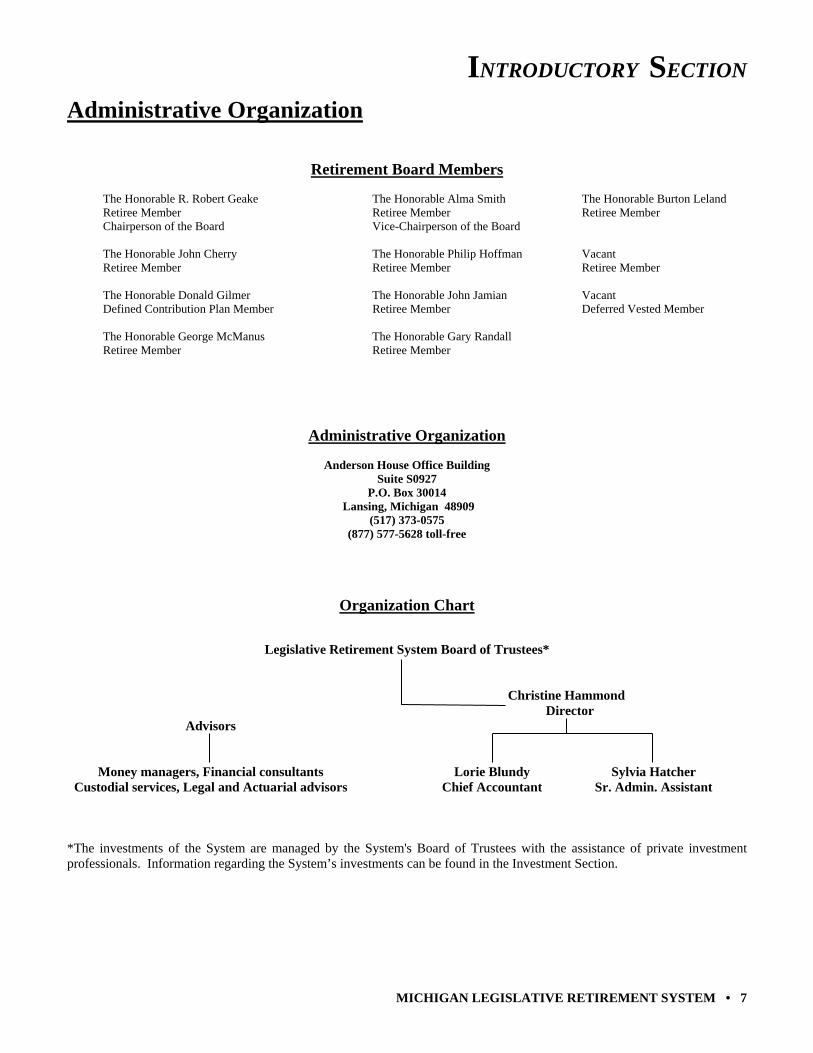
Retirement Board Members The Honorable R. Robert Geake The Honorable Alma Smith The Honorable Burton Leland Retiree Member Retiree Member Retiree Member Chairperson of the Board Vice-Chairperson of the Board The Honorable John Cherry The Honorable Philip Hoffman Vacant Retiree Member Retiree Member Retiree Member The Honorable Donald Gilmer The Honorable John Jamian Vacant Defined Contribution Plan Member Retiree Member Deferred Vested Member The Honorable George McManus The Honorable Gary Randall Retiree Member Retiree Member
Administrative Organization
Anderson House Office Building Suite S0927
P.O. Box 30014 Lansing, Michigan 48909
(517) 373-0575 (877) 577-5628 toll-free
Organization Chart
Legislative Retirement System Board of Trustees*
Christine Hammond Director Advisors Money managers, Financial consultants Lorie Blundy Sylvia Hatcher Custodial services, Legal and Actuarial advisors Chief Accountant Sr. Admin. Assistant *The investments of the System are managed by the System's Board of Trustees with the assistance of private investment professionals. Information regarding the System’s investments can be found in the Investment Section.
INTRODUCTORY SECTION
8 • MICHIGAN LEGISLATIVE RETIREMENT SYSTEM
Administrative Organization (continued)
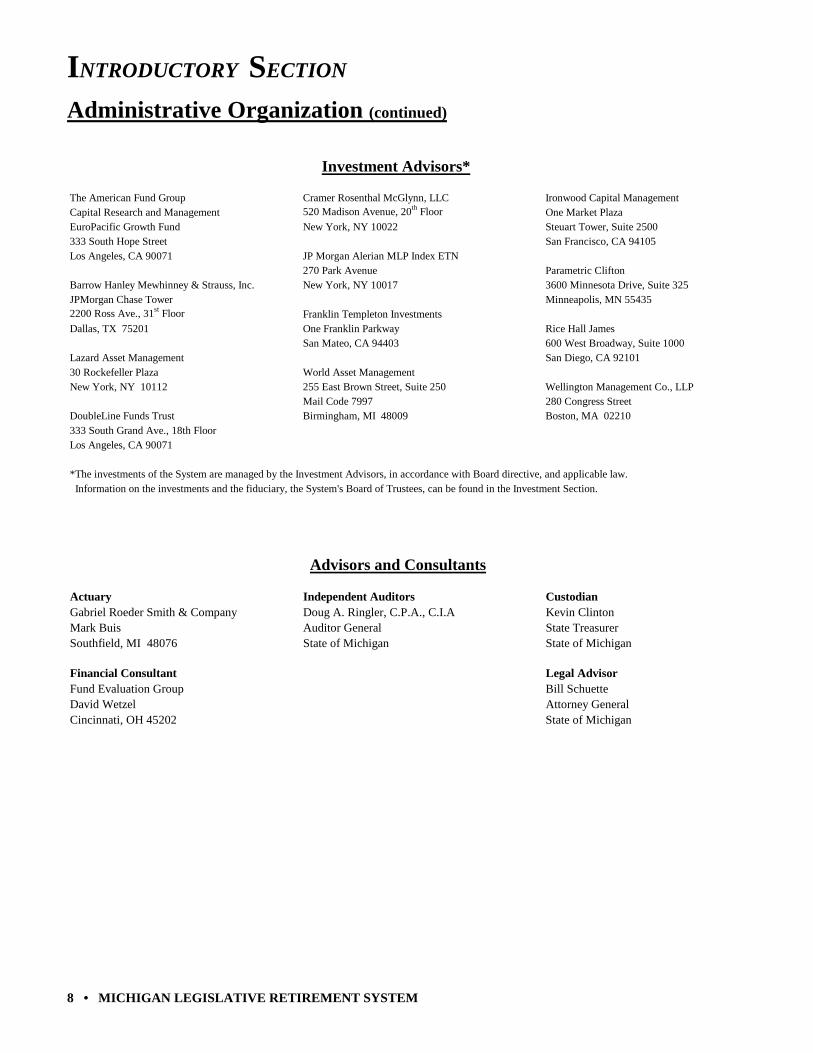
Investment Advisors*
The American Fund Group Cramer Rosenthal McGlynn, LLC Ironwood Capital ManagementCapital Research and Management 520 Madison Avenue, 20th Floor One Market PlazaEuroPacific Growth Fund New York, NY 10022 Steuart Tower, Suite 2500333 South Hope Street San Francisco, CA 94105Los Angeles, CA 90071 JP Morgan Alerian MLP Index ETN
270 Park Avenue Parametric Clifton Barrow Hanley Mewhinney & Strauss, Inc. New York, NY 10017 3600 Minnesota Drive, Suite 325JPMorgan Chase Tower Minneapolis, MN 554352200 Ross Ave., 31st Floor Franklin Templeton InvestmentsDallas, TX 75201 One Franklin Parkway Rice Hall James
San Mateo, CA 94403 600 West Broadway, Suite 1000Lazard Asset Management San Diego, CA 9210130 Rockefeller Plaza World Asset ManagementNew York, NY 10112 255 East Brown Street, Suite 250 Wellington Management Co., LLP
Mail Code 7997 280 Congress StreetDoubleLine Funds Trust Birmingham, MI 48009 Boston, MA 02210333 South Grand Ave., 18th FloorLos Angeles, CA 90071
*The investments of the System are managed by the Investment Advisors, in accordance with Board directive, and applicable law. Information on the investments and the fiduciary, the System's Board of Trustees, can be found in the Investment Section.
Advisors and Consultants
Actuary Independent Auditors CustodianGabriel Roeder Smith & Company Doug A. Ringler, C.P.A., C.I.A Kevin ClintonMark Buis Auditor General State TreasurerSouthfield, MI 48076 State of Michigan State of Michigan
Financial Consultant Legal AdvisorFund Evaluation Group Bill SchuetteDavid Wetzel Attorney GeneralCincinnati, OH 45202 State of Michigan
FINANCIAL SECTION
MICHIGAN LEGISLATIVE RETIREMENT SYSTEM • 9
Michigan Legislative Retirement System
Comprehensive Annual Financial Report for the Fiscal Year Ended September 30, 2014
FINANCIAL SECTION
Independent Auditor's Report Management's Discussion and Analysis
Basic Financial Statements Notes to Basic Financial Statements
Required Supplementary Information Note to Required Supplementary Information
Supporting Schedules
10 • MICHIGAN LEGISLATIVE RETIREMENT SYSTEM
MICHIGAN LEGISLATIVE RETIREMENT SYSTEM • 11

FINANCIAL SECTION
12 • MICHIGAN LEGISLATIVE RETIREMENT SYSTEM
Management's Discussion and Analysis
The management's discussion and analysis (MD&A) of the System provides an overview of the financial activities and performance for the fiscal years ended September 30, 2014, 2013 and 2012. This should be read in conjunction with the financial statements and required supplemental information (RSI), which provides information for September 30, 2014 and 2013. THE STATEMENT OF NET POSITION AND THE STATEMENT OF CHANGES IN NET POSITION This Comprehensive Annual Financial Report (CAFR) consists of two financial statements; Statement of Pension Plan and Other Postemployment Benefit Plan Fiduciary Net Position (page 16) and Statements of Changes in Pension Plan and Other Postemployment Benefit Plan Fiduciary Net Position (page 17). These financial statements report information about the System, as a whole, and about its financial condition that should help answer the question: Is the System, as a whole, better off or worse off as a result of this year’s activities? These statements include all assets and liabilities using the economic resources measurement focus and the accrual basis of accounting. Under the accrual basis of accounting, all revenues and expenses are taken into account regardless of when cash is received or paid. The Statement of Pension Plan and Other Postemployment Benefit Plan Fiduciary Net Position, presents all of the System’s assets and liabilities, with the difference between the two reported as net position. Over time, increases and decreases in net position measure whether the System’s financial position is improving or deteriorating. The Statement of Pension Plan and Other Postemployment Benefit Plan Fiduciary Net Position, presents how the System’s net position changed during the most recent fiscal year. These two financial statements should be reviewed along with the Schedule of Net Pension Liability (page 34) and Schedules of Contributions (page 35) to determine whether the System is becoming financially stronger or weaker and to understand changes over time in the funded status of the System. FINANCIAL ANALYSIS The Statement of Pension Plan and Other Postemployment Benefit Plan Net Position, presents information on the System's assets and liabilities using the accrual basis of accounting. Over time, increases or decreases in net position may serve as a useful indicator of the System's financial strength or weakness. System's net position, for the fiscal year ending September 30, 2014, increased by $1.7 million or 1.0%, due to an increase in the market value of the System's investments. The System's net position for the fiscal year ending September 30, 2013, increased by $11.9 million or 7.2%, due to an increase in the market value of the System's investments. Net Position As of September 30 ($ in Thousands)
Increase Increase2014 (Decrease) 2013 (Decrease) 2012
Assets: Cash 1,395$ (66.5)% 4,166$ 70.5 % 2,444$ Receivables 551 (40.1) 921 55.1 594 Investments 177,214 2.6 172,673 6.2 162,517 Total assets: 179,161 0.8 177,760 7.4 165,555 Liabilities: Warrants outstanding 31 2,471.7 1 (95.7) 28 Accounts payable 549 (38.3) 889 54.0 578 Total liabilities: 580 (35.0) 891 47.2 605 Total net position 178,581$ 1.0 % 176,869$ 7.2 % 164,950$
FINANCIAL SECTION
MICHIGAN LEGISLATIVE RETIREMENT SYSTEM • 13
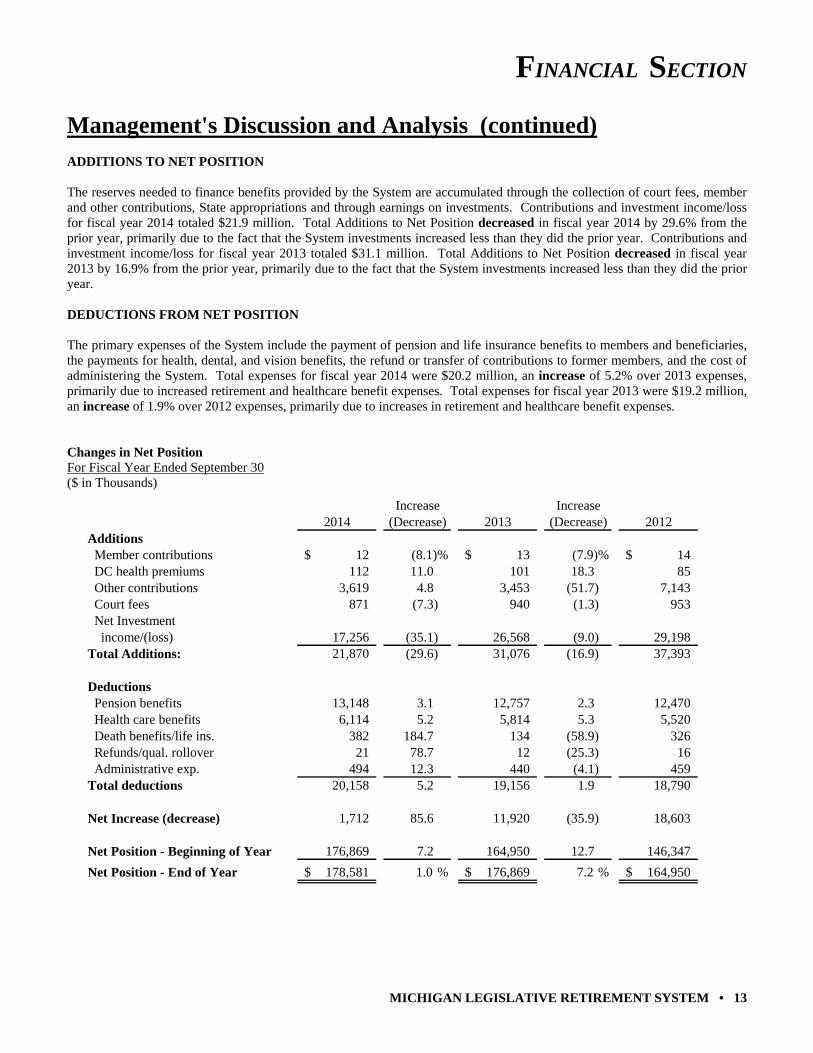
Management's Discussion and Analysis (continued) ADDITIONS TO NET POSITION The reserves needed to finance benefits provided by the System are accumulated through the collection of court fees, member and other contributions, State appropriations and through earnings on investments. Contributions and investment income/loss for fiscal year 2014 totaled $21.9 million. Total Additions to Net Position decreased in fiscal year 2014 by 29.6% from the prior year, primarily due to the fact that the System investments increased less than they did the prior year. Contributions and investment income/loss for fiscal year 2013 totaled $31.1 million. Total Additions to Net Position decreased in fiscal year 2013 by 16.9% from the prior year, primarily due to the fact that the System investments increased less than they did the prior year. DEDUCTIONS FROM NET POSITION The primary expenses of the System include the payment of pension and life insurance benefits to members and beneficiaries, the payments for health, dental, and vision benefits, the refund or transfer of contributions to former members, and the cost of administering the System. Total expenses for fiscal year 2014 were $20.2 million, an increase of 5.2% over 2013 expenses, primarily due to increased retirement and healthcare benefit expenses. Total expenses for fiscal year 2013 were $19.2 million, an increase of 1.9% over 2012 expenses, primarily due to increases in retirement and healthcare benefit expenses. Changes in Net Position For Fiscal Year Ended September 30 ($ in Thousands)
Increase Increase2014 (Decrease) 2013 (Decrease) 2012
Additions Member contributions 12$ (8.1)% 13$ (7.9)% 14$ DC health premiums 112 11.0 101 18.3 85 Other contributions 3,619 4.8 3,453 (51.7) 7,143 Court fees 871 (7.3) 940 (1.3) 953 Net Investment income/(loss) 17,256 (35.1) 26,568 (9.0) 29,198 Total Additions: 21,870 (29.6) 31,076 (16.9) 37,393
Deductions Pension benefits 13,148 3.1 12,757 2.3 12,470 Health care benefits 6,114 5.2 5,814 5.3 5,520 Death benefits/life ins. 382 184.7 134 (58.9) 326 Refunds/qual. rollover 21 78.7 12 (25.3) 16 Administrative exp. 494 12.3 440 (4.1) 459 Total deductions 20,158 5.2 19,156 1.9 18,790
Net Increase (decrease) 1,712 85.6 11,920 (35.9) 18,603
Net Position - Beginning of Year 176,869 7.2 164,950 12.7 146,347
Net Position - End of Year 178,581$ 1.0 % 176,869$ 7.2 % 164,950$
FINANCIAL SECTION
14 • MICHIGAN LEGISLATIVE RETIREMENT SYSTEM
Management's Discussion and Analysis (continued) Overall Financial Analysis In accordance with its enabling statute, the MLRS Board of Trustees has fiduciary responsibility for the management of the system’s funds, and it oversees its carefully structured and carefully monitored investment program to meet the system’s financial goals, established through its Investment Policy Statement. The Board seeks to achieve an optimal rate of return balanced with prudent levels of risk, to preserve capital and avoid large losses, to meet or exceed the system’s 7% rate of return actuarial assumption over the long-term, to ensure that the portfolio investment managers meet or exceed their benchmarks over the long-term, and to ensure that the portfolio is invested in a cost-effective manner. In fiscal year 2014, a significant “unknown” factor for the system fiduciaries was how to prepare the fund for the market’s reaction to the US Federal Reserve’s effort to taper away from its program of “quantitative easing” (“QE”). The Fed’s uncertain timing for QE tapering, and the expectant rise in the Fed’s interest rate, caused the financial markets to fluctuate throughout most of the fiscal year. In addition, concerns over the slower-than-average post-recession economic growth in the US (2.2% v 4.3%) tempered anticipated market increases. Despite these moderating influences, the portfolio posted a strong 9.4% annual rate of return, exceeding both its benchmark and the system’s 7% expected rate of return actuarial assumption. This rate of return allowed the portfolio’s 5-year rate of return to equal 11%, far exceeding the 7% actuarial assumption. During fiscal year 2014, the MLRS Board reviewed capital markets studies in conjunction with its asset allocation review, and it chose to add the new alternative investment allocation of 5% commodities to the portfolio, in order to further fine-tune the fund’s diversification. In addition, it chose to discontinue its long-time relationship with PIMCO Total Return Bond Fund, in light of the resignation of PIMCO’s chief investment officer and founder. Detailed information regarding the MLRS investment program and performance can be found in the Investment Section of this report (beginning on page 42). Financial Questions or Requests This financial report is designed to provide a general overview of the System's financial position. Requests for additional information or questions about this report should be addressed to: Michigan Legislative Retirement System, P.O. Box 30014, Lansing, MI 48909.

FINANCIAL SECTION
MICHIGAN LEGISLATIVE RETIREMENT SYSTEM • 15
This page was intentionally left blank.
FINANCIAL SECTION
16 • MICHIGAN LEGISLATIVE RETIREMENT SYSTEM
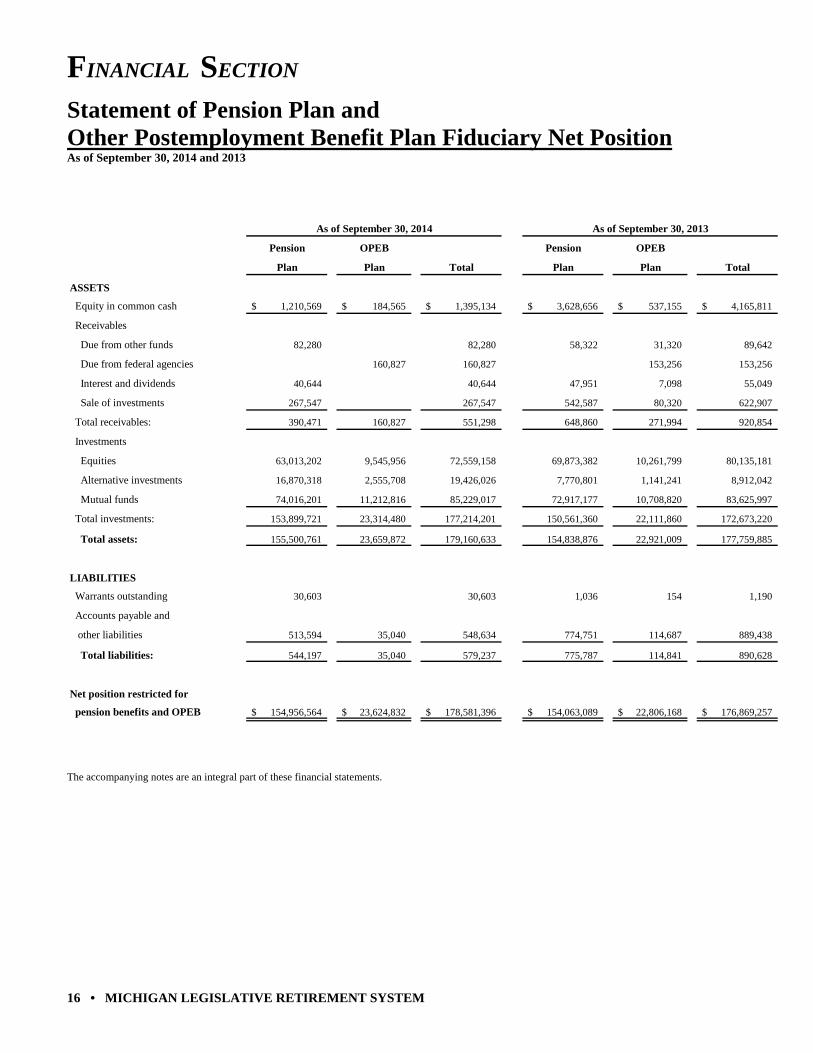
Statement of Pension Plan and Other Postemployment Benefit Plan Fiduciary Net Position As of September 30, 2014 and 2013
As of September 30, 2014 As of September 30, 2013
Pension OPEB Pension OPEB
Plan Plan Total Plan Plan Total
ASSETS
Equity in common cash 1,210,569$ 184,565$ 1,395,134$ 3,628,656$ 537,155$ 4,165,811$
Receivables
Due from other funds 82,280 82,280 58,322 31,320 89,642
Due from federal agencies 160,827 160,827 153,256 153,256
Interest and dividends 40,644 40,644 47,951 7,098 55,049
Sale of investments 267,547 267,547 542,587 80,320 622,907
Total receivables: 390,471 160,827 551,298 648,860 271,994 920,854
Investments
Equities 63,013,202 9,545,956 72,559,158 69,873,382 10,261,799 80,135,181
Alternative investments 16,870,318 2,555,708 19,426,026 7,770,801 1,141,241 8,912,042
Mutual funds 74,016,201 11,212,816 85,229,017 72,917,177 10,708,820 83,625,997
Total investments: 153,899,721 23,314,480 177,214,201 150,561,360 22,111,860 172,673,220
Total assets: 155,500,761 23,659,872 179,160,633 154,838,876 22,921,009 177,759,885
LIABILITIES
Warrants outstanding 30,603 30,603 1,036 154 1,190
Accounts payable and
other liabilities 513,594 35,040 548,634 774,751 114,687 889,438
Total liabilities: 544,197 35,040 579,237 775,787 114,841 890,628
Net position restricted for
pension benefits and OPEB 154,956,564$ 23,624,832$ 178,581,396$ 154,063,089$ 22,806,168$ 176,869,257$
The accompanying notes are an integral part of these financial statements.
FINANCIAL SECTION
MICHIGAN LEGISLATIVE RETIREMENT SYSTEM • 17
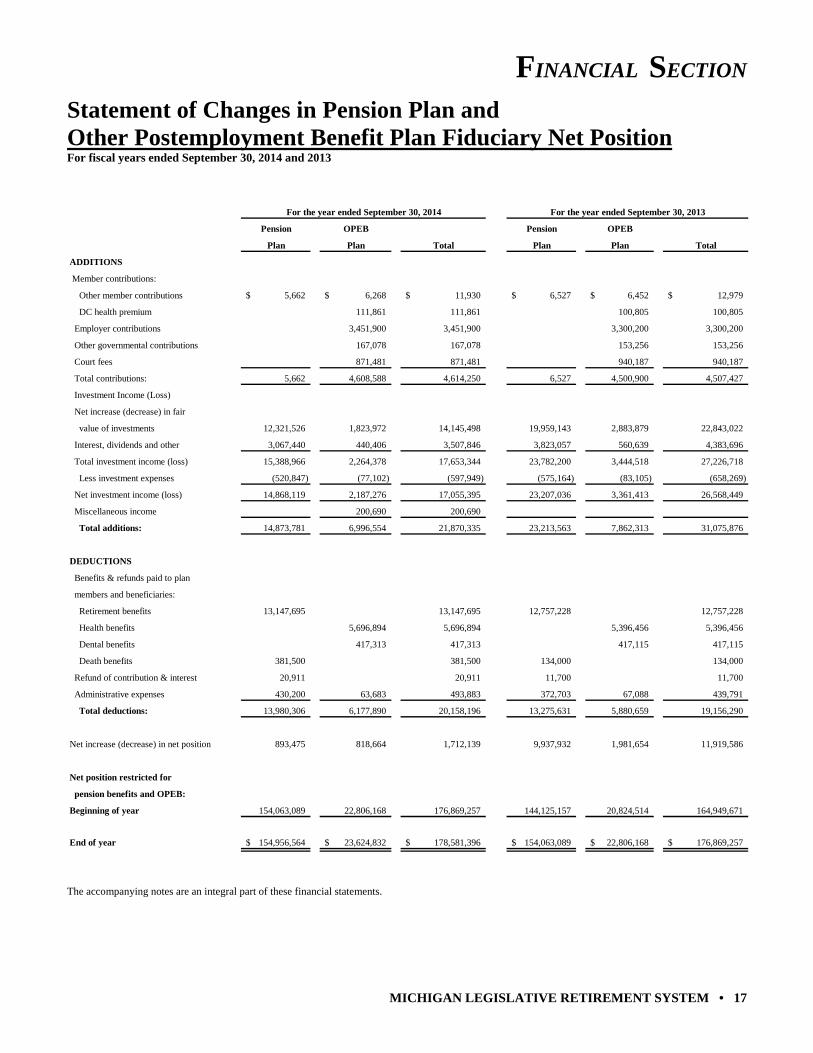
Statement of Changes in Pension Plan and Other Postemployment Benefit Plan Fiduciary Net Position For fiscal years ended September 30, 2014 and 2013
For the year ended September 30, 2014 For the year ended September 30, 2013
Pension OPEB Pension OPEB
Plan Plan Total Plan Plan Total
ADDITIONS
Member contributions:
Other member contributions 5,662$ 6,268$ 11,930$ 6,527$ 6,452$ 12,979$
DC health premium 111,861 111,861 100,805 100,805
Employer contributions 3,451,900 3,451,900 3,300,200 3,300,200
Other governmental contributions 167,078 167,078 153,256 153,256
Court fees 871,481 871,481 940,187 940,187
Total contributions: 5,662 4,608,588 4,614,250 6,527 4,500,900 4,507,427
Investment Income (Loss)
Net increase (decrease) in fair
value of investments 12,321,526 1,823,972 14,145,498 19,959,143 2,883,879 22,843,022
Interest, dividends and other 3,067,440 440,406 3,507,846 3,823,057 560,639 4,383,696
Total investment income (loss) 15,388,966 2,264,378 17,653,344 23,782,200 3,444,518 27,226,718
Less investment expenses (520,847) (77,102) (597,949) (575,164) (83,105) (658,269)
Net investment income (loss) 14,868,119 2,187,276 17,055,395 23,207,036 3,361,413 26,568,449
Miscellaneous income 200,690 200,690
Total additions: 14,873,781 6,996,554 21,870,335 23,213,563 7,862,313 31,075,876
DEDUCTIONS
Benefits & refunds paid to plan
members and beneficiaries:
Retirement benefits 13,147,695 13,147,695 12,757,228 12,757,228
Health benefits 5,696,894 5,696,894 5,396,456 5,396,456
Dental benefits 417,313 417,313 417,115 417,115
Death benefits 381,500 381,500 134,000 134,000
Refund of contribution & interest 20,911 20,911 11,700 11,700
Administrative expenses 430,200 63,683 493,883 372,703 67,088 439,791
Total deductions: 13,980,306 6,177,890 20,158,196 13,275,631 5,880,659 19,156,290
Net increase (decrease) in net position 893,475 818,664 1,712,139 9,937,932 1,981,654 11,919,586
Net position restricted for
pension benefits and OPEB:
Beginning of year 154,063,089 22,806,168 176,869,257 144,125,157 20,824,514 164,949,671
End of year 154,956,564$ 23,624,832$ 178,581,396$ 154,063,089$ 22,806,168$ 176,869,257$
The accompanying notes are an integral part of these financial statements.
FINANCIAL SECTION
18 • MICHIGAN LEGISLATIVE RETIREMENT SYSTEM
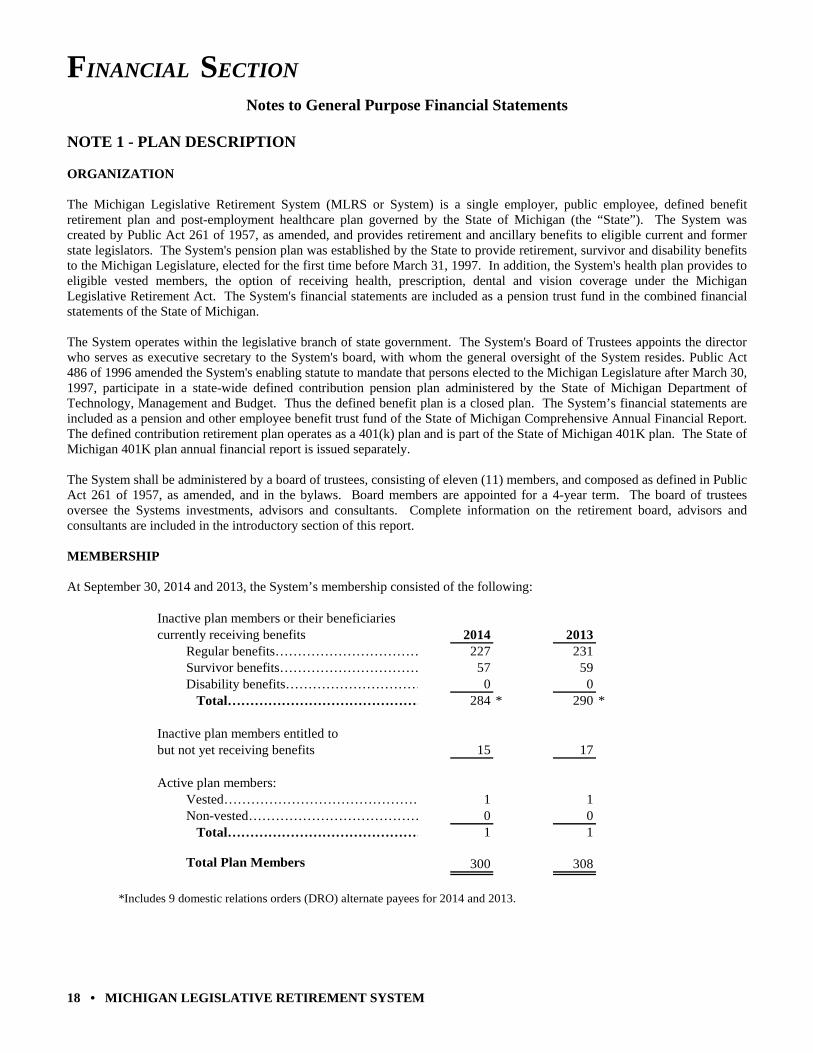
Notes to General Purpose Financial Statements NOTE 1 - PLAN DESCRIPTION ORGANIZATION The Michigan Legislative Retirement System (MLRS or System) is a single employer, public employee, defined benefit retirement plan and post-employment healthcare plan governed by the State of Michigan (the “State”). The System was created by Public Act 261 of 1957, as amended, and provides retirement and ancillary benefits to eligible current and former state legislators. The System's pension plan was established by the State to provide retirement, survivor and disability benefits to the Michigan Legislature, elected for the first time before March 31, 1997. In addition, the System's health plan provides to eligible vested members, the option of receiving health, prescription, dental and vision coverage under the Michigan Legislative Retirement Act. The System's financial statements are included as a pension trust fund in the combined financial statements of the State of Michigan. The System operates within the legislative branch of state government. The System's Board of Trustees appoints the director who serves as executive secretary to the System's board, with whom the general oversight of the System resides. Public Act 486 of 1996 amended the System's enabling statute to mandate that persons elected to the Michigan Legislature after March 30, 1997, participate in a state-wide defined contribution pension plan administered by the State of Michigan Department of Technology, Management and Budget. Thus the defined benefit plan is a closed plan. The System’s financial statements are included as a pension and other employee benefit trust fund of the State of Michigan Comprehensive Annual Financial Report. The defined contribution retirement plan operates as a 401(k) plan and is part of the State of Michigan 401K plan. The State of Michigan 401K plan annual financial report is issued separately. The System shall be administered by a board of trustees, consisting of eleven (11) members, and composed as defined in Public Act 261 of 1957, as amended, and in the bylaws. Board members are appointed for a 4-year term. The board of trustees oversee the Systems investments, advisors and consultants. Complete information on the retirement board, advisors and consultants are included in the introductory section of this report. MEMBERSHIP At September 30, 2014 and 2013, the System’s membership consisted of the following:
Inactive plan members or their beneficiaries currently receiving benefits 2014 2013
Regular benefits…………………………… 227 231Survivor benefits…………………………… 57 59Disability benefits………………………… 0 0 Total……………………………………… 284 * 290 *
Inactive plan members entitled to but not yet receiving benefits 15 17
Active plan members:Vested……………………………………… 1 1Non-vested………………………………… 0 0 Total……………………………………… 1 1
Total Plan Members 300 308
*Includes 9 domestic relations orders (DRO) alternate payees for 2014 and 2013.
FINANCIAL SECTION
MICHIGAN LEGISLATIVE RETIREMENT SYSTEM • 19
Notes to General Purpose Financial Statements (Continued) MEMBERSHIP (continued)
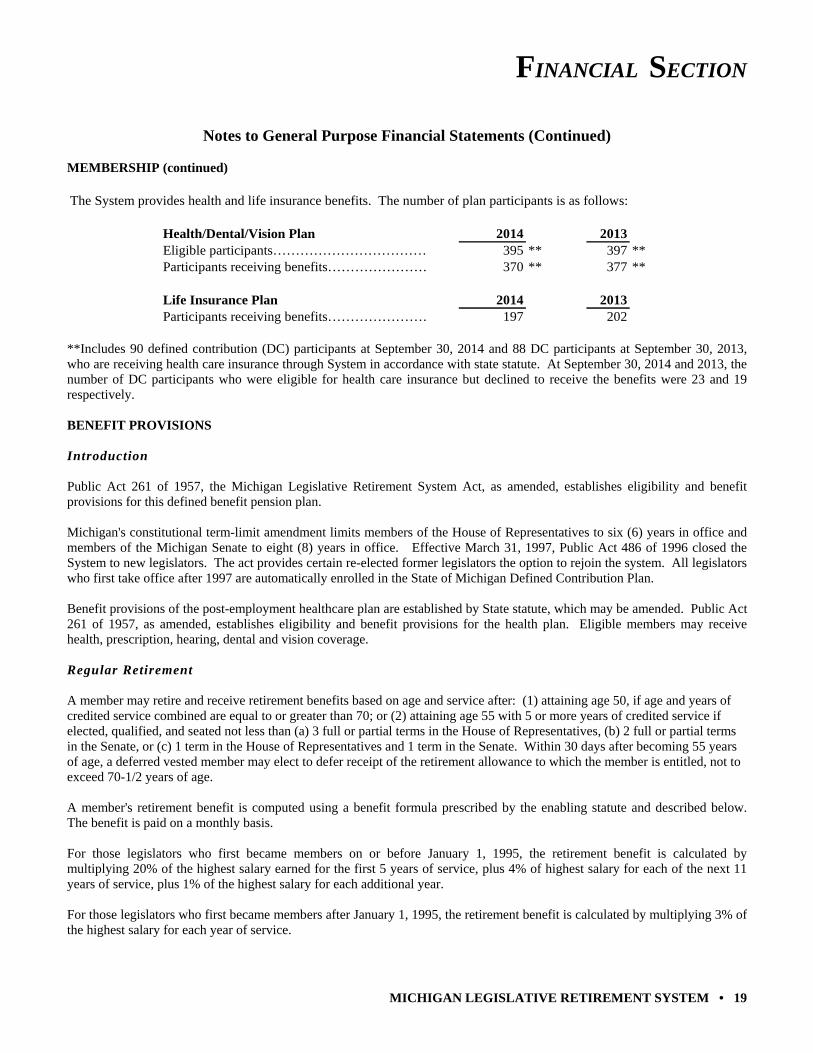
The System provides health and life insurance benefits. The number of plan participants is as follows:
Health/Dental/Vision Plan 2014 2013Eligible participants……………………………… 395 ** 397 **Participants receiving benefits…………………… 370 ** 377 **
Life Insurance Plan 2014 2013Participants receiving benefits…………………… 197 202
**Includes 90 defined contribution (DC) participants at September 30, 2014 and 88 DC participants at September 30, 2013, who are receiving health care insurance through System in accordance with state statute. At September 30, 2014 and 2013, the number of DC participants who were eligible for health care insurance but declined to receive the benefits were 23 and 19 respectively. BENEFIT PROVISIONS Introduction Public Act 261 of 1957, the Michigan Legislative Retirement System Act, as amended, establishes eligibility and benefit provisions for this defined benefit pension plan. Michigan's constitutional term-limit amendment limits members of the House of Representatives to six (6) years in office and members of the Michigan Senate to eight (8) years in office. Effective March 31, 1997, Public Act 486 of 1996 closed the System to new legislators. The act provides certain re-elected former legislators the option to rejoin the system. All legislators who first take office after 1997 are automatically enrolled in the State of Michigan Defined Contribution Plan. Benefit provisions of the post-employment healthcare plan are established by State statute, which may be amended. Public Act 261 of 1957, as amended, establishes eligibility and benefit provisions for the health plan. Eligible members may receive health, prescription, hearing, dental and vision coverage. Regular Retirement A member may retire and receive retirement benefits based on age and service after: (1) attaining age 50, if age and years of credited service combined are equal to or greater than 70; or (2) attaining age 55 with 5 or more years of credited service if elected, qualified, and seated not less than (a) 3 full or partial terms in the House of Representatives, (b) 2 full or partial terms in the Senate, or (c) 1 term in the House of Representatives and 1 term in the Senate. Within 30 days after becoming 55 years of age, a deferred vested member may elect to defer receipt of the retirement allowance to which the member is entitled, not to exceed 70-1/2 years of age. A member's retirement benefit is computed using a benefit formula prescribed by the enabling statute and described below. The benefit is paid on a monthly basis. For those legislators who first became members on or before January 1, 1995, the retirement benefit is calculated by multiplying 20% of the highest salary earned for the first 5 years of service, plus 4% of highest salary for each of the next 11 years of service, plus 1% of the highest salary for each additional year. For those legislators who first became members after January 1, 1995, the retirement benefit is calculated by multiplying 3% of the highest salary for each year of service.
FINANCIAL SECTION
20 • MICHIGAN LEGISLATIVE RETIREMENT SYSTEM
Notes to General Purpose Financial Statements (Continued) BENEFIT PROVISIONS (continued) Post Retirement Benefit Adjustment For those legislators who first became members on or before January 1, 1995, the annual retirement benefit payable to a retiree and/or his/her survivor is increased by 4% compounded annually. The adjustment is effective each January. For those legislators who first became members after January 1, 1995, the annual retirement benefit payable to a retiree and/or his/her survivor is increased by 4%, but it is not compounded annually. The adjustment is effective each January. Other Postemployment Benefits Under Section 50a and 50b of the Legislative Retirement System Act, all retirees and their dependents and survivors receive health, dental, vision, and hearing insurance coverage. The System also provides health, dental, vision, and hearing insurance coverage for deferred vested members who were members on or before January 1, 1995, and for their survivors and dependents. In addition, in accordance with state law, the System provides health insurance coverage to eligible former legislators (and their dependents) who meet certain vesting requirements established by statute and who belong to the State's Defined Contribution Plan. Member enrollment to the System’s health plan is voluntary. The System pays for health, dental, vision, and hearing benefits on a modified pay-as-you-go basis; however, the State has begun to advance fund for future System health insurance costs. Public Act 200 of 2011 amended the System’s enabling statute and closed the OPEB Plan. All qualified participants must have completed six (6) years of service before January 1, 2013 to qualify for health insurance in the System. Life Insurance Benefits The System provides $150,000 in life insurance coverage to active members. Deferred vested members are covered by varying amounts of life insurance, ranging from $5,000 to $150,000, depending on the member's date of deferral and, in some instances, the payment of an annual premium. Retirees are covered by varying amounts of life insurance, ranging from $2,500 to $75,000, depending on their retirement dates and, in some instances, the payment of an annual premium. The System prefunds life insurance benefits using the entry age actuarial cost method. The life insurance plan and the pension plan use the same actuarial assumptions, which are stated in the actuarial section. Disability Benefit A member or deferred vested member who becomes disabled as determined by at least (2) licensed physicians appointed by the board of trustees is eligible for a disability benefit computed in the same manner described under Regular Retirement. Survivor Benefit Upon the death of a vested member or deferred vested member who meets the service, but not the age requirements, for regular retirement (see Regular Retirement), or upon the death of a retiree, a surviving spouse shall be entitled to a benefit equal to 66 2/3% of the benefit the member would have received or was receiving at the time of death. Special provisions apply to surviving minor children and surviving spouses with minor children. Refunds A member who leaves legislative service may request a refund of his/her contributions from the Members' Saving Fund. A member who receives a refund of contributions forfeits all rights to any future System benefits. Members who return to legislative service and who previously received a refund of their contributions may reinstate their service through repayment of the refund plus interest in accordance with the statute.
FINANCIAL SECTION
MICHIGAN LEGISLATIVE RETIREMENT SYSTEM • 21
NOTE 2 - SUMMARY OF SIGNIFICANT ACCOUNTING POLICIES Basis of Accounting and Presentation The System's financial statements are prepared using the economic resources measurement focus and the accrual basis of accounting, as provided by generally accepted accounting principles for governments. Contributions are recognized as revenue when due, pursuant to formal commitments, as well as statutory requirements. Benefits and refunds are recognized when due and payable in accordance with the terms of the plan. GASB Statement No. 67, which was adopted during the fiscal year ended September 30, 2014, addresses accounting and financial reporting requirements for pension plans. The requirements for GASB Statement No. 67 requires changes in presentation of the financial statements, notes to the financial statements, and required supplementary information. Significant changes include an actuarial calculation of total and net pension liability. It also includes comprehensive footnote disclosure regarding the pension liability, the sensitivity of the net pension liability to the discount rate, and increased investment activity disclosures. The implementation of GASB Statement No. 67 did not significantly impact the accounting for accounts receivables and investment balances. The total pension liability, determined in accordance with GASB Statement No. 67, is presented in Note 4 on page 25 and in the Required Supplementary Information on page 32. Contributions and Reserves The Legislative Retirement System Act provides for several "reserves" or "funds." These funds and the contributions and other monies allocated to them are described below. Members' Savings Fund (MSF) — A member who first becomes a member on or before January 1, 1995, with less than 20 years of experience, contributed approximately 7% of salary to MSF. A member who first becomes a member after January 1, 1995, contributed approximately 5% of salary to MSF. Beginning January 1, 1999, there were no member contributions allocated to MSF except for approximately 4% of salary for the period beginning on January 1, 1999 and ending on December 31, 2000, for members who first becomes a member after December 1, 1994 and on or before January 1, 1995, in accordance with legislation. Eligible members may make other contributions to the MSF to purchase special service credit or to repay previously refunded contributions. MSF represents active member contributions (and interest credited from the Income Fund) less amounts transferred to reserves for retirement and amounts refunded to terminated members. At September 30, 2014, and 2013, the balance in this account was $0.4 million and $0.5 million, respectively. Members' Retirement Fund (MRF) — The MRF represents the reserves for payment of retirement benefits. At retirement a member's accumulated contributions (with interest) are transferred to the MRF (from the MSF). Interest is credited to the MRF (from the Income Fund), and monthly allowances are debited. At each fiscal year end an actuarial valuation determines the 100% funding requirements for the MRF. Any amounts required to 100% fund the MRF are transferred in the next fiscal year. At September 30, 2014, and 2013, the balance in this account was $59.6 million and $64.6 million, respectively. Survivors' Retirement Fund (SRF) — On and before January 1, 1999, all members with less than 20 years of service contributed 1/2% of salary to the SRF. After January 1, 1999, there are no member contributions allocated to the SRF. Interest is credited annually to the SRF (from the Income Fund), and member savings are transferred to the SRF from the MSF upon the death of a vested member, and additional state contributions may be made in order to make the SRF 100% funded. Survivors' monthly retirement allowances are paid from this fund upon the death of vested members, deferred vested members, and retirants. At September 30, 2014, and 2013, the balance in this account was $69.9 million and $65.8 million, respectively. Insurance Revolving Fund (IRF) — On and before January 1, 1999, all members contributed 1/2% of salary to the Insurance Revolving Fund. After January 1, 1999, there are no member contributions allocated to the IRF. State contributions, if any, member premiums, and interest from the Income Fund are credited to this fund. Life insurance benefits are paid from the IRF to beneficiaries of members, retirants, and deferred vested members. At September 30, 2014, and 2013, the balance in this account was $25.0 million and $23.2 million, respectively.
FINANCIAL SECTION
22 • MICHIGAN LEGISLATIVE RETIREMENT SYSTEM
Notes to General Purpose Financial Statements (Continued) Contributions and Reserves (continued) Health Insurance Fund (HIF) — On and before January 1, 1999, all members contributed 1% of salary to this fund. After January 1, 1999, member contributions are made as follows: (1) members who first became members on or before January 1, 1995, contribute 9% to the HIF; (2) members who first became members after January 1, 1995, contribute 7% to the HIF. This fund is also credited with employer contributions, court fees, other governmental contributions and interest income. Funds from this reserve are used to pay health care expenses and are accumulated to fully fund the future health insurance liabilities for the System. At September 30, 2014, and 2013, the balance in this account was $23.6 million and $22.8 million, respectively. Use of Health Insurance Reserve Funds In July, 2011, the Michigan Legislature passed, and Governor Rick Snyder signed, a new law that provides for the use of the health insurance reserve funds to pay for the current costs associated with the retiree health insurance plan. Before the passage of the new law, Public Act 99 of 2011, the system statute prohibited the use of certain prefunding dollars maintained in the health insurance reserve, and their investment income, until the retiree health insurance (OPEB) liabilities in the system became 100% funded. Public Act 99 of 2011 removed the 100%-funding requirement, and thus allows for the immediate use of the funds for health insurance costs of the system. The system used $1.3 million and $1.3 million from the reserve to pay health insurance costs for fiscal year ending September 30, 2014 and 2013, respectively. Income Fund (IF) — The IF is credited with all investment earnings and other miscellaneous income. Interest transfers are made annually to the other reserves, based on beginning balance. This fund also accounts for investment and administrative expenses and interest on refunds and transfers. Fair Value of Investments System investments are presented at fair value. Securities traded on a national exchange are valued at the last reported sales price at current exchange rates. Corporate bonds not traded on a national or international exchange are based on equivalent values of comparable securities with similar yield and risk. Other investments that do not have an established market are recorded at estimated fair value. Short-term investments are carried at cost, which approximates fair value. Reporting Entity The System is a pension trust fund of the State of Michigan. As such, the System is considered part of the State and is included in the State’s comprehensive annual financial report as a pension trust fund. The System and the System's Board of Trustees are not financially accountable for any other entities. Accordingly, the System is the only entity included in this financial report. Investment Income Dividend income is recognized on the ex-dividend date, and interest income is recognized on the accrual basis as earned. Fair value changes are recorded as investment income or loss. Purchases and sales of investments are recorded as of the trade date. Cost of Administering the System The retirement system shall pay the expenses for the administration of the retirement system, exclusive of amounts payable as retirement allowances and other benefits provided in this act, from the income fund. Related Party Transactions The cash account includes $1.4 million and $4.2 million, on September 30, 2014, and 2013, respectively, which represents funds deposited in a common cash investment pool maintained for various State operating funds. The participating funds in the common cash pool earn interest at various rates depending upon prevailing short-term interest rates. Earnings from these activities amounted to $2,173 and $3,505 for the years ended September 30, 2014 and 2013, respectively.
FINANCIAL SECTION
MICHIGAN LEGISLATIVE RETIREMENT SYSTEM • 23
Notes to General Purpose Financial Statements (Continued)
Fixed Assets Fixed assets, which are immaterial in amount, are not recognized on the accounting records. Administrative disbursements are treated as expenses, and equipment expenses are not capitalized. Excess Benefits Internal Revenue Service (IRS) Code Section 415 requires that, for individuals who receive retirement benefits in excess of established limits, these benefits should be recorded and reported outside of the pension fund in order to keep the qualified status of the plan. This includes coordination of benefits issued where a retiree participates in more than one qualified plan. The System provided excess benefits to five (5) retirees, for a total amount of $101,852 as of September 30, 2014 and $89,907 as of September 30, 2013. NOTE 3 - CONTRIBUTIONS AND FUNDED STATUS Member Contributions On or before January 1, 1999, the following contributions were made by members of the System: Members who first became members on or before January 1, 1995, contributed 9% of their salaries to the System. The contributions were placed in the following reserves created by the enabling statute: 7% to the Members' Savings Fund for the first 20 years of service; 0.5% to the Insurance Revolving Fund; 0.5% to the Survivors' Retirement Fund for the first 20 years of service; and 1% to the Health Insurance Fund. Members who first became members on or after January 1, 1995, contributed 7% of their salaries to the System. The contributions were placed in the following reserves created by the enabling statute: 5% to the Members' Savings Fund; 0.5% to the Insurance Revolving Fund; 0.5% to the Survivors' Retirement Fund; and 1% to the Health Insurance Fund. After January 1, 1999, the following contributions are made by the members of the System: Members who first became members after December 1, 1994, contribute 9% of their salaries to the System. The contributions are placed in accordance with enabling statute to Health Insurance Fund. Members who first became members after December 1, 1994 and on or before January 1, 1995, contributed 13% of their salaries to the System. The contributions were placed in the following reserves in accordance with the enabling statute: 9% to the Health Insurance Fund and 4% to the Members' Savings Fund until December 31, 2000. After December 31, 2000, these members contribute 9% of their salaries to the System. The contributions are placed in accordance with enabling statute to Health Insurance Fund. Members who first became members after January 1, 1995, contribute 7% of their salaries to the System. The contributions are placed in the following reserve in accordance with the enabling statute: 7% to the Health Insurance Fund. Member contributions are tax-deferred through the provisions of section 414(h)(2) of the Internal Revenue Code. State Contributions State contributions are made on the basis of actuarial requirements as determined by the System actuary and approved by the Board of Trustees. Through the annual state budgetary process, the Legislature annually appropriates, and the Governor approves, the State contributions along with certain court fee revenues, which are paid to the System pursuant to state statute. A chart showing State contributions is presented in the Required Supplementary Information in the financial section of this report.
FINANCIAL SECTION
24 • MICHIGAN LEGISLATIVE RETIREMENT SYSTEM
Notes to General Purpose Financial Statements (Continued)
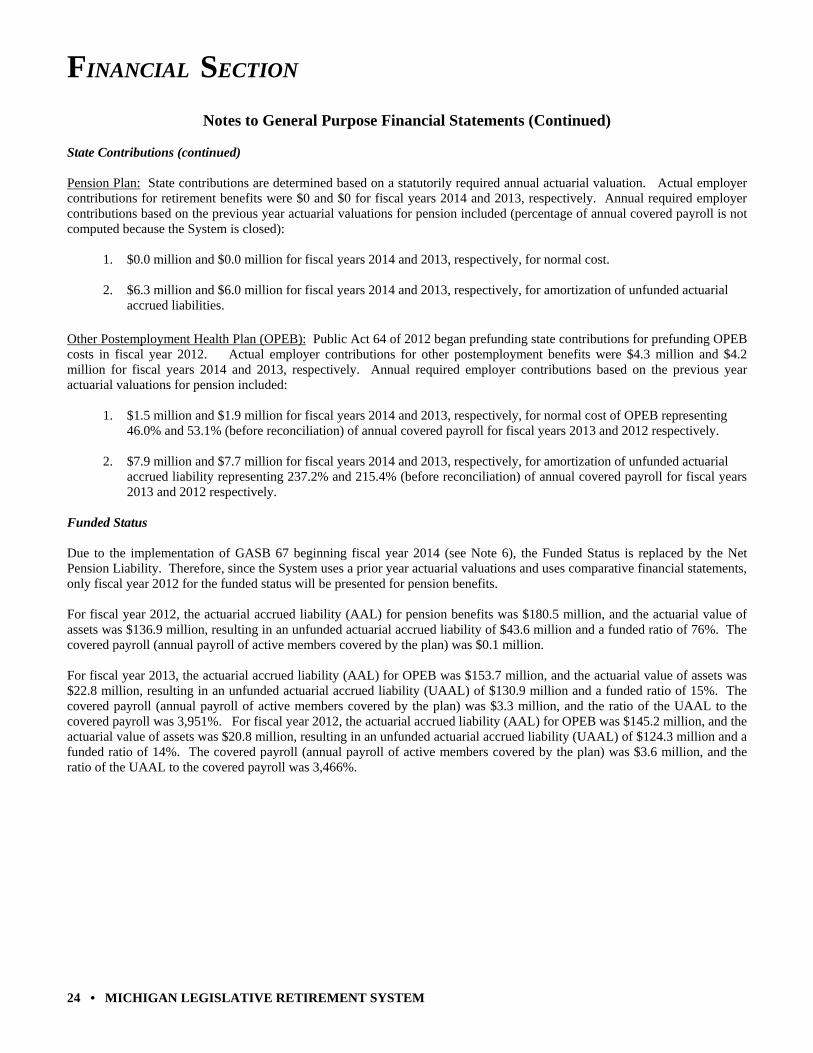
State Contributions (continued) Pension Plan: State contributions are determined based on a statutorily required annual actuarial valuation. Actual employer contributions for retirement benefits were $0 and $0 for fiscal years 2014 and 2013, respectively. Annual required employer contributions based on the previous year actuarial valuations for pension included (percentage of annual covered payroll is not computed because the System is closed): 1. $0.0 million and $0.0 million for fiscal years 2014 and 2013, respectively, for normal cost. 2. $6.3 million and $6.0 million for fiscal years 2014 and 2013, respectively, for amortization of unfunded actuarial accrued liabilities. Other Postemployment Health Plan (OPEB): Public Act 64 of 2012 began prefunding state contributions for prefunding OPEB costs in fiscal year 2012. Actual employer contributions for other postemployment benefits were $4.3 million and $4.2 million for fiscal years 2014 and 2013, respectively. Annual required employer contributions based on the previous year actuarial valuations for pension included: 1. $1.5 million and $1.9 million for fiscal years 2014 and 2013, respectively, for normal cost of OPEB representing 46.0% and 53.1% (before reconciliation) of annual covered payroll for fiscal years 2013 and 2012 respectively. 2. $7.9 million and $7.7 million for fiscal years 2014 and 2013, respectively, for amortization of unfunded actuarial accrued liability representing 237.2% and 215.4% (before reconciliation) of annual covered payroll for fiscal years
2013 and 2012 respectively. Funded Status Due to the implementation of GASB 67 beginning fiscal year 2014 (see Note 6), the Funded Status is replaced by the Net Pension Liability. Therefore, since the System uses a prior year actuarial valuations and uses comparative financial statements, only fiscal year 2012 for the funded status will be presented for pension benefits. For fiscal year 2012, the actuarial accrued liability (AAL) for pension benefits was $180.5 million, and the actuarial value of assets was $136.9 million, resulting in an unfunded actuarial accrued liability of $43.6 million and a funded ratio of 76%. The covered payroll (annual payroll of active members covered by the plan) was $0.1 million. For fiscal year 2013, the actuarial accrued liability (AAL) for OPEB was $153.7 million, and the actuarial value of assets was $22.8 million, resulting in an unfunded actuarial accrued liability (UAAL) of $130.9 million and a funded ratio of 15%. The covered payroll (annual payroll of active members covered by the plan) was $3.3 million, and the ratio of the UAAL to the covered payroll was 3,951%. For fiscal year 2012, the actuarial accrued liability (AAL) for OPEB was $145.2 million, and the actuarial value of assets was $20.8 million, resulting in an unfunded actuarial accrued liability (UAAL) of $124.3 million and a funded ratio of 14%. The covered payroll (annual payroll of active members covered by the plan) was $3.6 million, and the ratio of the UAAL to the covered payroll was 3,466%.
FINANCIAL SECTION
MICHIGAN LEGISLATIVE RETIREMENT SYSTEM • 25
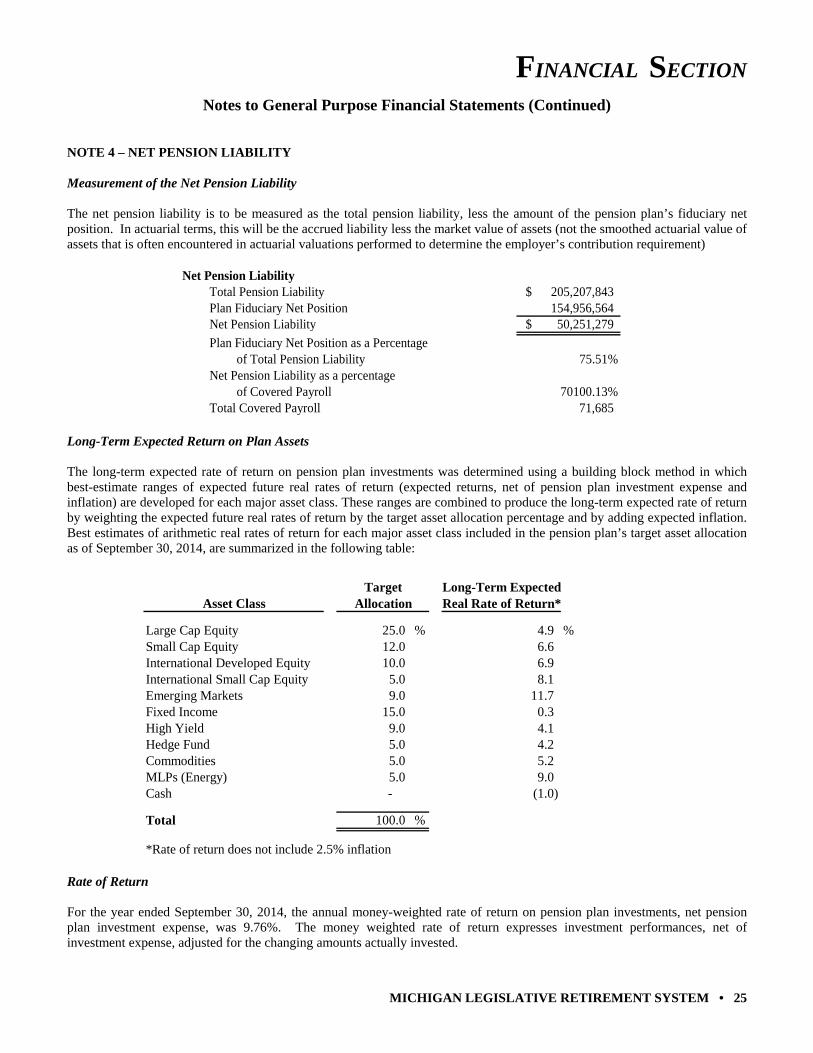
Notes to General Purpose Financial Statements (Continued) NOTE 4 – NET PENSION LIABILITY Measurement of the Net Pension Liability The net pension liability is to be measured as the total pension liability, less the amount of the pension plan’s fiduciary net position. In actuarial terms, this will be the accrued liability less the market value of assets (not the smoothed actuarial value of assets that is often encountered in actuarial valuations performed to determine the employer’s contribution requirement)
Net Pension LiabilityTotal Pension Liability 205,207,843$ Plan Fiduciary Net Position 154,956,564 Net Pension Liability 50,251,279$
Plan Fiduciary Net Position as a Percentageof Total Pension Liability 75.51%
Net Pension Liability as a percentageof Covered Payroll 70100.13%
Total Covered Payroll 71,685
Long-Term Expected Return on Plan Assets The long-term expected rate of return on pension plan investments was determined using a building block method in which best-estimate ranges of expected future real rates of return (expected returns, net of pension plan investment expense and inflation) are developed for each major asset class. These ranges are combined to produce the long-term expected rate of return by weighting the expected future real rates of return by the target asset allocation percentage and by adding expected inflation. Best estimates of arithmetic real rates of return for each major asset class included in the pension plan’s target asset allocation as of September 30, 2014, are summarized in the following table:
Target Long-Term ExpectedAsset Class Allocation Real Rate of Return*
Large Cap Equity 25.0 % 4.9 %Small Cap Equity 12.0 6.6 International Developed Equity 10.0 6.9 International Small Cap Equity 5.0 8.1 Emerging Markets 9.0 11.7 Fixed Income 15.0 0.3 High Yield 9.0 4.1 Hedge Fund 5.0 4.2 Commodities 5.0 5.2 MLPs (Energy) 5.0 9.0 Cash - (1.0)
Total 100.0 %
*Rate of return does not include 2.5% inflation Rate of Return For the year ended September 30, 2014, the annual money-weighted rate of return on pension plan investments, net pension plan investment expense, was 9.76%. The money weighted rate of return expresses investment performances, net of investment expense, adjusted for the changing amounts actually invested.
FINANCIAL SECTION
26 • MICHIGAN LEGISLATIVE RETIREMENT SYSTEM
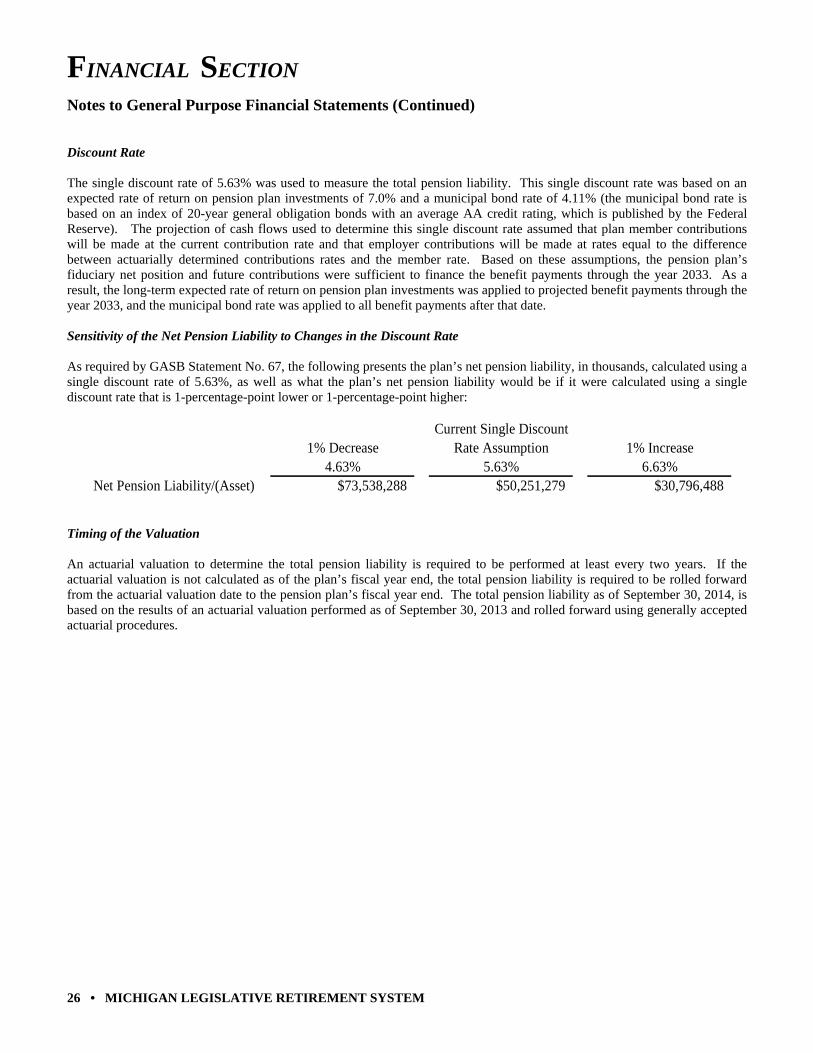
Notes to General Purpose Financial Statements (Continued) Discount Rate The single discount rate of 5.63% was used to measure the total pension liability. This single discount rate was based on an expected rate of return on pension plan investments of 7.0% and a municipal bond rate of 4.11% (the municipal bond rate is based on an index of 20-year general obligation bonds with an average AA credit rating, which is published by the Federal Reserve). The projection of cash flows used to determine this single discount rate assumed that plan member contributions will be made at the current contribution rate and that employer contributions will be made at rates equal to the difference between actuarially determined contributions rates and the member rate. Based on these assumptions, the pension plan’s fiduciary net position and future contributions were sufficient to finance the benefit payments through the year 2033. As a result, the long-term expected rate of return on pension plan investments was applied to projected benefit payments through the year 2033, and the municipal bond rate was applied to all benefit payments after that date. Sensitivity of the Net Pension Liability to Changes in the Discount Rate As required by GASB Statement No. 67, the following presents the plan’s net pension liability, in thousands, calculated using a single discount rate of 5.63%, as well as what the plan’s net pension liability would be if it were calculated using a single discount rate that is 1-percentage-point lower or 1-percentage-point higher:
Current Single Discount1% Decrease Rate Assumption 1% Increase
4.63% 5.63% 6.63%Net Pension Liability/(Asset) $73,538,288 $50,251,279 $30,796,488
Timing of the Valuation An actuarial valuation to determine the total pension liability is required to be performed at least every two years. If the actuarial valuation is not calculated as of the plan’s fiscal year end, the total pension liability is required to be rolled forward from the actuarial valuation date to the pension plan’s fiscal year end. The total pension liability as of September 30, 2014, is based on the results of an actuarial valuation performed as of September 30, 2013 and rolled forward using generally accepted actuarial procedures.
FINANCIAL SECTION
MICHIGAN LEGISLATIVE RETIREMENT SYSTEM • 27
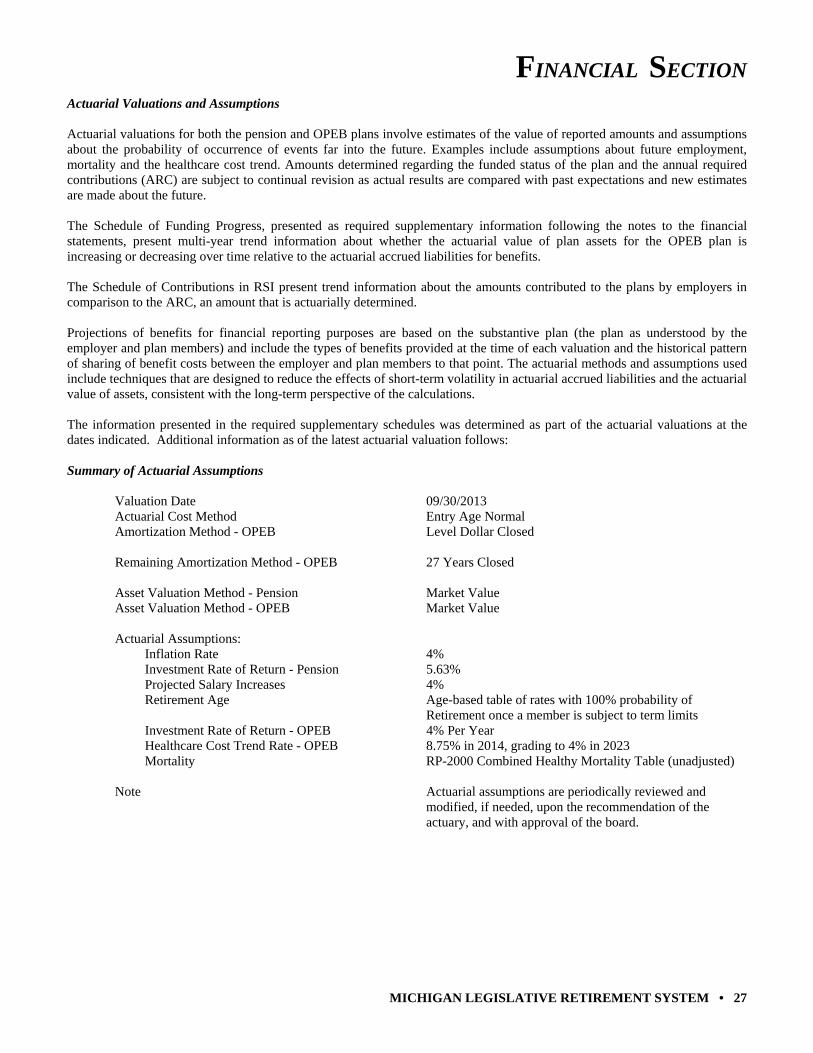
Actuarial Valuations and Assumptions Actuarial valuations for both the pension and OPEB plans involve estimates of the value of reported amounts and assumptions about the probability of occurrence of events far into the future. Examples include assumptions about future employment, mortality and the healthcare cost trend. Amounts determined regarding the funded status of the plan and the annual required contributions (ARC) are subject to continual revision as actual results are compared with past expectations and new estimates are made about the future. The Schedule of Funding Progress, presented as required supplementary information following the notes to the financial statements, present multi-year trend information about whether the actuarial value of plan assets for the OPEB plan is increasing or decreasing over time relative to the actuarial accrued liabilities for benefits. The Schedule of Contributions in RSI present trend information about the amounts contributed to the plans by employers in comparison to the ARC, an amount that is actuarially determined. Projections of benefits for financial reporting purposes are based on the substantive plan (the plan as understood by the employer and plan members) and include the types of benefits provided at the time of each valuation and the historical pattern of sharing of benefit costs between the employer and plan members to that point. The actuarial methods and assumptions used include techniques that are designed to reduce the effects of short-term volatility in actuarial accrued liabilities and the actuarial value of assets, consistent with the long-term perspective of the calculations. The information presented in the required supplementary schedules was determined as part of the actuarial valuations at the dates indicated. Additional information as of the latest actuarial valuation follows: Summary of Actuarial Assumptions Valuation Date 09/30/2013 Actuarial Cost Method Entry Age Normal Amortization Method - OPEB Level Dollar Closed Remaining Amortization Method - OPEB 27 Years Closed Asset Valuation Method - Pension Market Value Asset Valuation Method - OPEB Market Value Actuarial Assumptions: Inflation Rate 4% Investment Rate of Return - Pension 5.63% Projected Salary Increases 4% Retirement Age Age-based table of rates with 100% probability of Retirement once a member is subject to term limits Investment Rate of Return - OPEB 4% Per Year Healthcare Cost Trend Rate - OPEB 8.75% in 2014, grading to 4% in 2023 Mortality RP-2000 Combined Healthy Mortality Table (unadjusted) Note Actuarial assumptions are periodically reviewed and modified, if needed, upon the recommendation of the actuary, and with approval of the board.
FINANCIAL SECTION
28 • MICHIGAN LEGISLATIVE RETIREMENT SYSTEM
Notes to General Purpose Financial Statements (Continued)
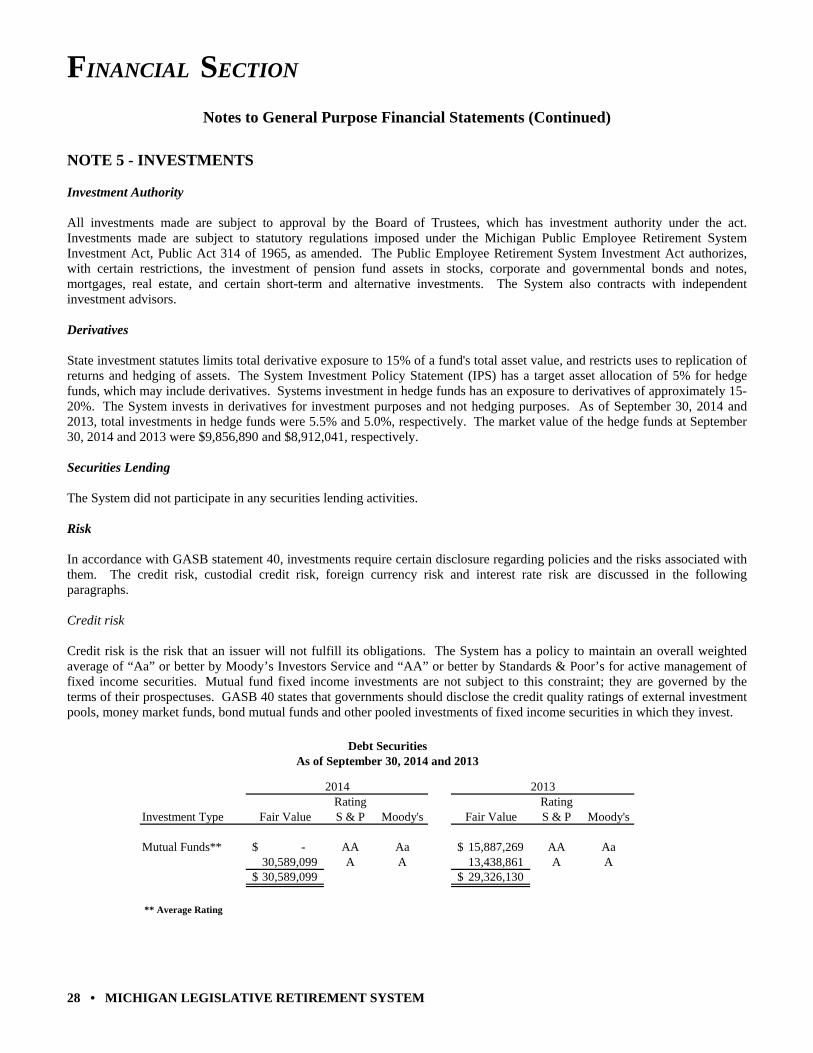
NOTE 5 - INVESTMENTS Investment Authority All investments made are subject to approval by the Board of Trustees, which has investment authority under the act. Investments made are subject to statutory regulations imposed under the Michigan Public Employee Retirement System Investment Act, Public Act 314 of 1965, as amended. The Public Employee Retirement System Investment Act authorizes, with certain restrictions, the investment of pension fund assets in stocks, corporate and governmental bonds and notes, mortgages, real estate, and certain short-term and alternative investments. The System also contracts with independent investment advisors. Derivatives State investment statutes limits total derivative exposure to 15% of a fund's total asset value, and restricts uses to replication of returns and hedging of assets. The System Investment Policy Statement (IPS) has a target asset allocation of 5% for hedge funds, which may include derivatives. Systems investment in hedge funds has an exposure to derivatives of approximately 15-20%. The System invests in derivatives for investment purposes and not hedging purposes. As of September 30, 2014 and 2013, total investments in hedge funds were 5.5% and 5.0%, respectively. The market value of the hedge funds at September 30, 2014 and 2013 were $9,856,890 and $8,912,041, respectively. Securities Lending The System did not participate in any securities lending activities. Risk In accordance with GASB statement 40, investments require certain disclosure regarding policies and the risks associated with them. The credit risk, custodial credit risk, foreign currency risk and interest rate risk are discussed in the following paragraphs. Credit risk Credit risk is the risk that an issuer will not fulfill its obligations. The System has a policy to maintain an overall weighted average of “Aa” or better by Moody’s Investors Service and “AA” or better by Standards & Poor’s for active management of fixed income securities. Mutual fund fixed income investments are not subject to this constraint; they are governed by the terms of their prospectuses. GASB 40 states that governments should disclose the credit quality ratings of external investment pools, money market funds, bond mutual funds and other pooled investments of fixed income securities in which they invest.
Debt Securities
As of September 30, 2014 and 2013
2014 2013Rating Rating
Investment Type Fair Value S & P Moody's Fair Value S & P Moody's
Mutual Funds** -$ AA Aa 15,887,269$ AA Aa30,589,099 A A 13,438,861 A A30,589,099$ 29,326,130$
** Average Rating
FINANCIAL SECTION
MICHIGAN LEGISLATIVE RETIREMENT SYSTEM • 29
Notes to General Purpose Financial Statements (Continued)
Custodial credit risk The custodial credit risk for deposits is the risk that, in the event of the failure of a depository financial institution, the System's deposits may not be recovered. Deposits are exposed to custodial credit risk if they are not covered by depository insurance and the deposits are: a.) Uncollateralized, b.) Collateralized with securities held by the pledging financial institution, or c.) Collateralized with securities held by the pledging financial institution's trust department or agent but not in the depositor-government's name. The common cash pool is managed by the State Treasurer and is authorized to invest surplus funds in depository accounts at financial institutions, bonds, notes, and other U.S. government debt, prime commercial paper, certificates of deposits, and special State investment programs. At September 30, 2014, the common cash pool held the majority of its funds in depository accounts 52.7% and prime commercial paper 44.8%. At September 30, 2013, the common cash pool held the majority of its funds in depository accounts 63.7% and prime commercial paper 34.5%. The State Treasurer's policy for common cash depository accounts requires financial institutions to secure State funds with collateral, to be organized under federal or State law, and to maintain an office in Michigan. The policy also restricts deposits to a maximum of 50% of the financial institution's net worth. As of September 30, 2014 and September 30, 2013, 100% of the State's common cash depository accounts were either covered by federal depository insurance or collateralized with securities held in the State's name by the State's agent. The State Treasurer's policy requires prime commercial paper to be rated "A-1" by S&P or "P-1" by Moody's or higher at purchase and places requirements and restrictions on the borrower. Additional details on the common cash pool policies and risk disclosures are described in the State of Michigan Comprehensive Annual Financial Report. Concentration of Credit Risk Concentration of credit risk is the risk of loss attributed to the magnitude of a government's investment in a single issuer. System is prohibited by Public Act 314 of 1965, as amended, from investing in more than 5% of the outstanding stock or obligations of any one issuer or investing more than 5% of its assets in the stock or obligations of any one issuer. At September 30, 2014 and 2013, there were no investments in any one issuer that accounted for more than 5% of System's assets nor were there any investments totaling more than 5% of the stock or obligations of any one issuer. Foreign currency risk Foreign currency risk is the risk that changes in exchange rates will adversely affect the fair value of deposits. Public Act 35 of 1997 requires State deposits be held in a financial institution which maintains a principal office or branch office located in the State of Michigan. The System had no common cash deposits subject to foreign currency risk at September 30, 2014. Custodial credit risk associated with investments In accordance with GASB statement 40, investments also require certain disclosures regarding policies and procedures with respect to the risks associated with them. The custodial credit risk for investments is the risk that, in the event of a failure of the counterparty, the System will not be able to recover the value of the investment or collateral securities that are in the possession of an outside party. Investment securities are exposed to custodial credit risk if the securities are uninsured, are not registered in the name of the government and are held by either: a.) the counterparty, or b.) the counterparty's trust department or agent but are not in the government's name. The State Treasurer does not have an investment policy for managing custodial credit risk. At September 30, 2014 and September 30, 2013, the System's investments were not exposed to custodial credit risk.
FINANCIAL SECTION
30 • MICHIGAN LEGISLATIVE RETIREMENT SYSTEM
Notes to General Purpose Financial Statements (Continued)
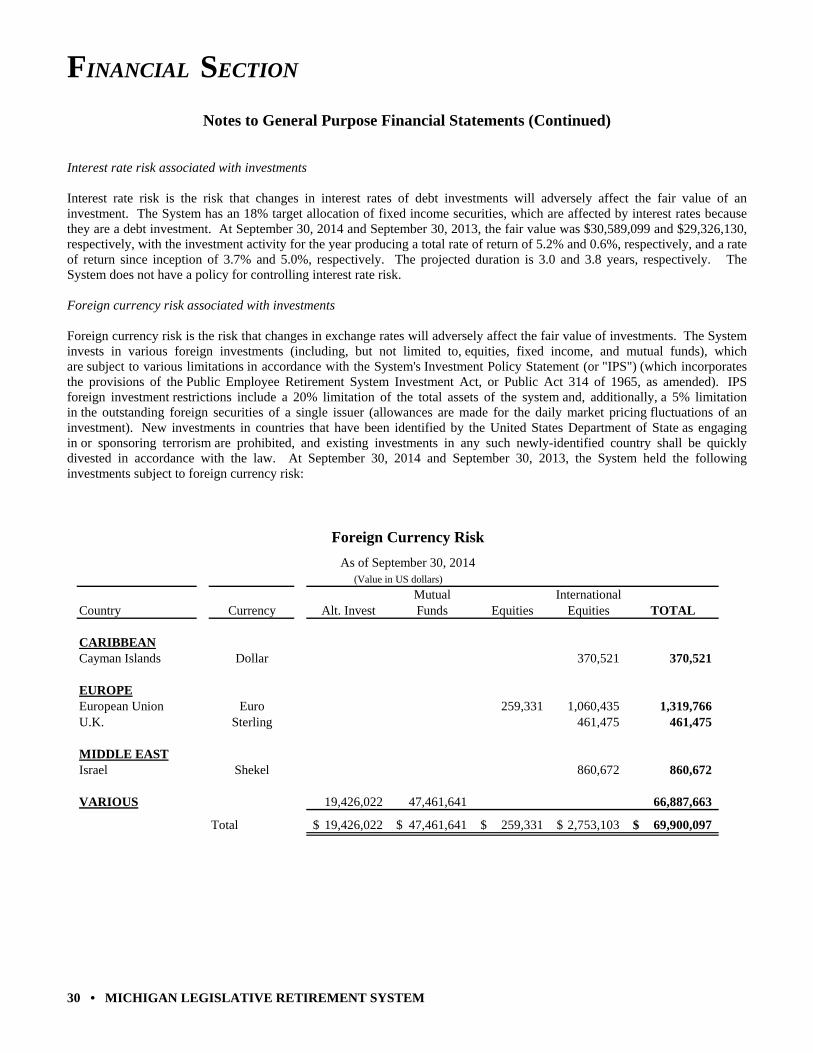
Interest rate risk associated with investments Interest rate risk is the risk that changes in interest rates of debt investments will adversely affect the fair value of an investment. The System has an 18% target allocation of fixed income securities, which are affected by interest rates because they are a debt investment. At September 30, 2014 and September 30, 2013, the fair value was $30,589,099 and $29,326,130, respectively, with the investment activity for the year producing a total rate of return of 5.2% and 0.6%, respectively, and a rate of return since inception of 3.7% and 5.0%, respectively. The projected duration is 3.0 and 3.8 years, respectively. The System does not have a policy for controlling interest rate risk. Foreign currency risk associated with investments Foreign currency risk is the risk that changes in exchange rates will adversely affect the fair value of investments. The System invests in various foreign investments (including, but not limited to, equities, fixed income, and mutual funds), which are subject to various limitations in accordance with the System's Investment Policy Statement (or "IPS") (which incorporates the provisions of the Public Employee Retirement System Investment Act, or Public Act 314 of 1965, as amended). IPS foreign investment restrictions include a 20% limitation of the total assets of the system and, additionally, a 5% limitation in the outstanding foreign securities of a single issuer (allowances are made for the daily market pricing fluctuations of an investment). New investments in countries that have been identified by the United States Department of State as engaging in or sponsoring terrorism are prohibited, and existing investments in any such newly-identified country shall be quickly divested in accordance with the law. At September 30, 2014 and September 30, 2013, the System held the following investments subject to foreign currency risk:
Foreign Currency Risk
As of September 30, 2014(Value in US dollars)
Mutual InternationalCountry Currency Alt. Invest Funds Equities Equities TOTAL
CARIBBEANCayman Islands Dollar 370,521 370,521
EUROPEEuropean Union Euro 259,331 1,060,435 1,319,766 U.K. Sterling 461,475 461,475
MIDDLE EASTIsrael Shekel 860,672 860,672
VARIOUS 19,426,022 47,461,641 66,887,663
Total 19,426,022$ 47,461,641$ 259,331$ 2,753,103$ 69,900,097$
FINANCIAL SECTION
MICHIGAN LEGISLATIVE RETIREMENT SYSTEM • 31
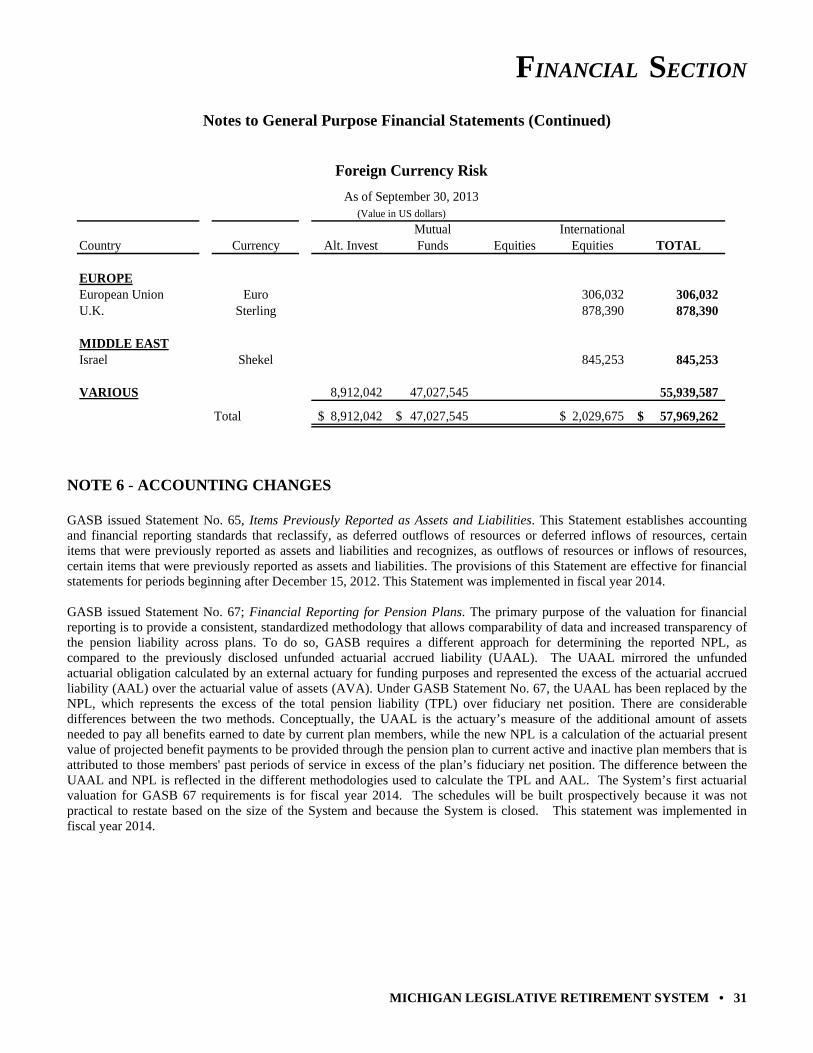
Notes to General Purpose Financial Statements (Continued)
Foreign Currency Risk
As of September 30, 2013(Value in US dollars)
Mutual InternationalCountry Currency Alt. Invest Funds Equities Equities TOTAL
EUROPEEuropean Union Euro 306,032 306,032 U.K. Sterling 878,390 878,390
MIDDLE EASTIsrael Shekel 845,253 845,253
VARIOUS 8,912,042 47,027,545 55,939,587
Total 8,912,042$ 47,027,545$ 2,029,675$ 57,969,262$
NOTE 6 - ACCOUNTING CHANGES GASB issued Statement No. 65, Items Previously Reported as Assets and Liabilities. This Statement establishes accounting and financial reporting standards that reclassify, as deferred outflows of resources or deferred inflows of resources, certain items that were previously reported as assets and liabilities and recognizes, as outflows of resources or inflows of resources, certain items that were previously reported as assets and liabilities. The provisions of this Statement are effective for financial statements for periods beginning after December 15, 2012. This Statement was implemented in fiscal year 2014. GASB issued Statement No. 67; Financial Reporting for Pension Plans. The primary purpose of the valuation for financial reporting is to provide a consistent, standardized methodology that allows comparability of data and increased transparency of the pension liability across plans. To do so, GASB requires a different approach for determining the reported NPL, as compared to the previously disclosed unfunded actuarial accrued liability (UAAL). The UAAL mirrored the unfunded actuarial obligation calculated by an external actuary for funding purposes and represented the excess of the actuarial accrued liability (AAL) over the actuarial value of assets (AVA). Under GASB Statement No. 67, the UAAL has been replaced by the NPL, which represents the excess of the total pension liability (TPL) over fiduciary net position. There are considerable differences between the two methods. Conceptually, the UAAL is the actuary’s measure of the additional amount of assets needed to pay all benefits earned to date by current plan members, while the new NPL is a calculation of the actuarial present value of projected benefit payments to be provided through the pension plan to current active and inactive plan members that is attributed to those members' past periods of service in excess of the plan’s fiduciary net position. The difference between the UAAL and NPL is reflected in the different methodologies used to calculate the TPL and AAL. The System’s first actuarial valuation for GASB 67 requirements is for fiscal year 2014. The schedules will be built prospectively because it was not practical to restate based on the size of the System and because the System is closed. This statement was implemented in fiscal year 2014.
FINANCIAL SECTION
32 • MICHIGAN LEGISLATIVE RETIREMENT SYSTEM
Notes to General Purpose Financial Statements (Continued) NOTE 7 - NEW ACCOUNTING PRONOUNCEMENTS GASB issued Statement No. 68, Accounting and Financial Reporting for Pensions – An Amendment of GASB Statement No. 27, Accounting for Pensions by State and Local Governmental Employers, as well as the requirements of Statement No. 50, Pension Disclosures, as they relate to pensions that are provided through pension plans administered as trusts or equivalent arrangements that meet certain criteria. The requirements of Statements 27 and 50 remain applicable for pensions that are not covered by the scope of this Statement. The objective of this Statement is to improve the decision-usefulness of information in employer and governmental nonemployer contributing entity financial reports and will enhance its value for assessing accountability and interperiod equity by requiring recognition of the entire net pension liability and a more comprehensive measure of pension expense. This Statement is effective for participating employers for their fiscal years beginning after June 15, 2014.
FINANCIAL SECTION
MICHIGAN LEGISLATIVE RETIREMENT SYSTEM • 33
Required Supplementary Information
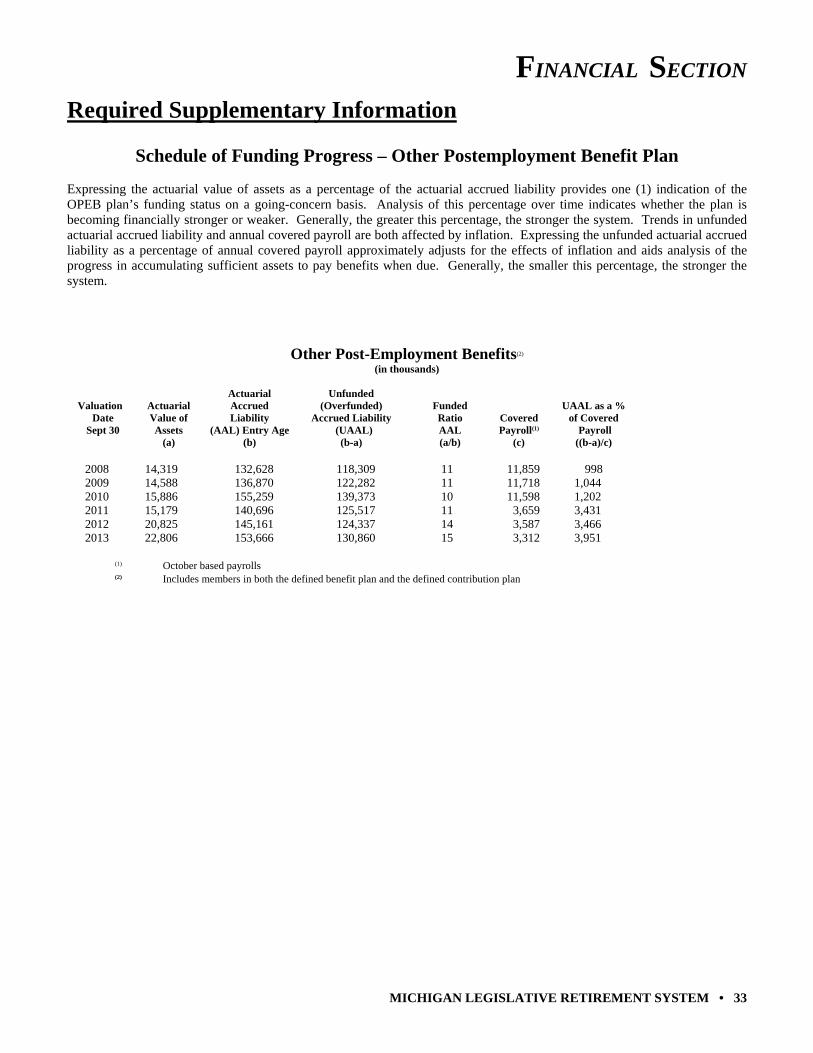
Schedule of Funding Progress – Other Postemployment Benefit Plan Expressing the actuarial value of assets as a percentage of the actuarial accrued liability provides one (1) indication of the OPEB plan’s funding status on a going-concern basis. Analysis of this percentage over time indicates whether the plan is becoming financially stronger or weaker. Generally, the greater this percentage, the stronger the system. Trends in unfunded actuarial accrued liability and annual covered payroll are both affected by inflation. Expressing the unfunded actuarial accrued liability as a percentage of annual covered payroll approximately adjusts for the effects of inflation and aids analysis of the progress in accumulating sufficient assets to pay benefits when due. Generally, the smaller this percentage, the stronger the system.
Other Post-Employment Benefits(2)
(in thousands) Actuarial Unfunded Valuation Actuarial Accrued (Overfunded) Funded UAAL as a % Date Value of Liability Accrued Liability Ratio Covered of Covered Sept 30 Assets (AAL) Entry Age (UAAL) AAL Payroll(1) Payroll (a) (b) (b-a) (a/b) (c) ((b-a)/c) 2008 14,319 132,628 118,309 11 11,859 998 2009 14,588 136,870 122,282 11 11,718 1,044 2010 15,886 155,259 139,373 10 11,598 1,202 2011 15,179 140,696 125,517 11 3,659 3,431 2012 20,825 145,161 124,337 14 3,587 3,466 2013 22,806 153,666 130,860 15 3,312 3,951 (1) October based payrolls (2) Includes members in both the defined benefit plan and the defined contribution plan
FINANCIAL SECTION
34 • MICHIGAN LEGISLATIVE RETIREMENT SYSTEM
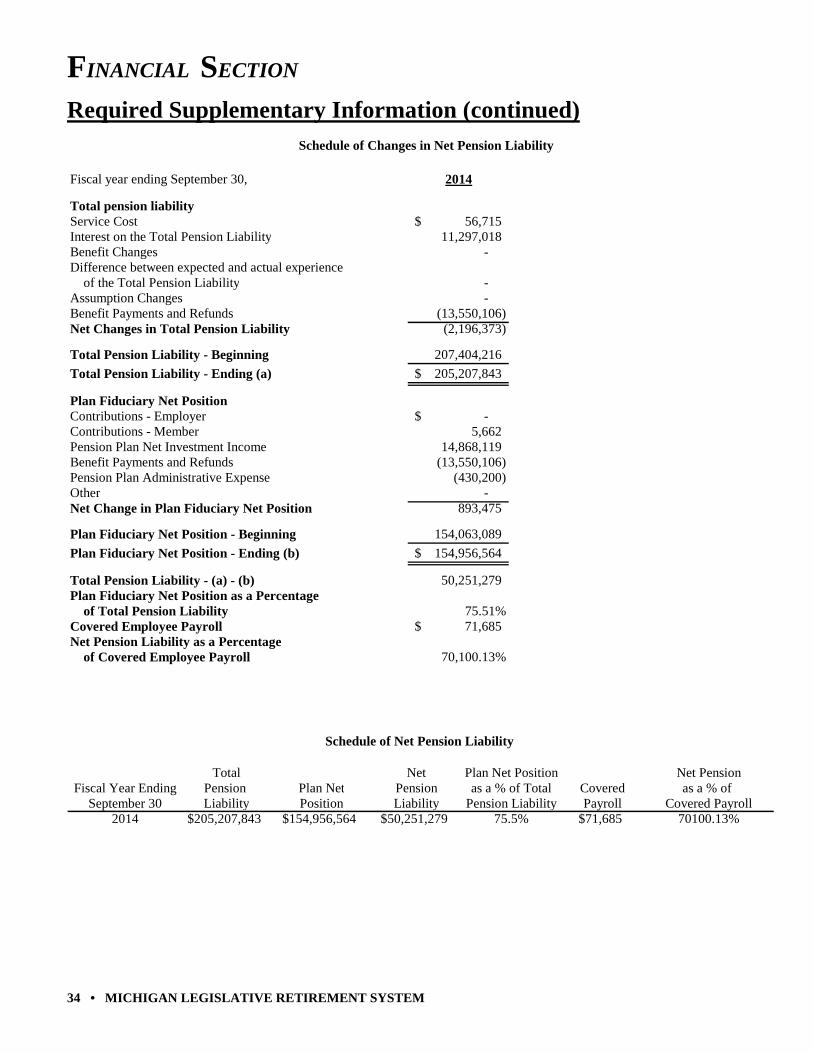
Required Supplementary Information (continued) Schedule of Changes in Net Pension Liability
Fiscal year ending September 30, 2014
Total pension liabilityService Cost 56,715$ Interest on the Total Pension Liability 11,297,018 Benefit Changes - Difference between expected and actual experience of the Total Pension Liability - Assumption Changes - Benefit Payments and Refunds (13,550,106) Net Changes in Total Pension Liability (2,196,373)
Total Pension Liability - Beginning 207,404,216
Total Pension Liability - Ending (a) 205,207,843$
Plan Fiduciary Net PositionContributions - Employer -$ Contributions - Member 5,662 Pension Plan Net Investment Income 14,868,119 Benefit Payments and Refunds (13,550,106) Pension Plan Administrative Expense (430,200) Other - Net Change in Plan Fiduciary Net Position 893,475
Plan Fiduciary Net Position - Beginning 154,063,089
Plan Fiduciary Net Position - Ending (b) 154,956,564$
Total Pension Liability - (a) - (b) 50,251,279 Plan Fiduciary Net Position as a Percentage of Total Pension Liability 75.51%Covered Employee Payroll 71,685$ Net Pension Liability as a Percentage of Covered Employee Payroll 70,100.13%
Schedule of Net Pension Liability
Total Net Plan Net Position Net PensionFiscal Year Ending Pension Plan Net Pension as a % of Total Covered as a % of
September 30 Liability Position Liability Pension Liability Payroll Covered Payroll2014 $205,207,843 $154,956,564 $50,251,279 75.5% $71,685 70100.13%
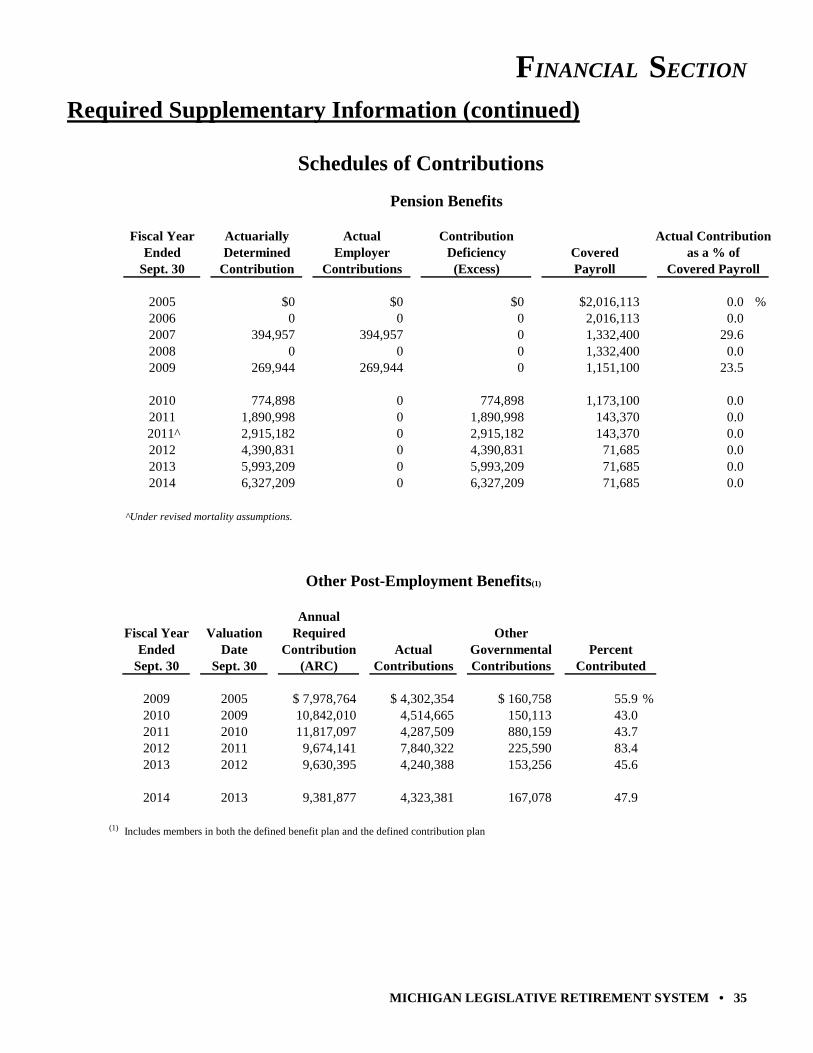
FINANCIAL SECTION
MICHIGAN LEGISLATIVE RETIREMENT SYSTEM • 35
Required Supplementary Information (continued)
Schedules of Contributions
Pension Benefits
Fiscal Year Actuarially Actual Contribution Actual ContributionEnded Determined Employer Deficiency Covered as a % of
Sept. 30 Contribution Contributions (Excess) Payroll Covered Payroll
2005 $0 $0 $0 $2,016,113 0.0 %2006 0 0 0 2,016,113 0.02007 394,957 394,957 0 1,332,400 29.62008 0 0 0 1,332,400 0.02009 269,944 269,944 0 1,151,100 23.5
2010 774,898 0 774,898 1,173,100 0.02011 1,890,998 0 1,890,998 143,370 0.0
2011^ 2,915,182 0 2,915,182 143,370 0.02012 4,390,831 0 4,390,831 71,685 0.02013 5,993,209 0 5,993,209 71,685 0.02014 6,327,209 0 6,327,209 71,685 0.0
^Under revised mortality assumptions.
Other Post-Employment Benefits(1)
AnnualFiscal Year Valuation Required Other
Ended Date Contribution Actual Governmental PercentSept. 30 Sept. 30 (ARC) Contributions Contributions Contributed
2009 2005 $ 7,978,764 $ 4,302,354 $ 160,758 55.9 %2010 2009 10,842,010 4,514,665 150,113 43.02011 2010 11,817,097 4,287,509 880,159 43.72012 2011 9,674,141 7,840,322 225,590 83.42013 2012 9,630,395 4,240,388 153,256 45.6
2014 2013 9,381,877 4,323,381 167,078 47.9
(1) Includes members in both the defined benefit plan and the defined contribution plan
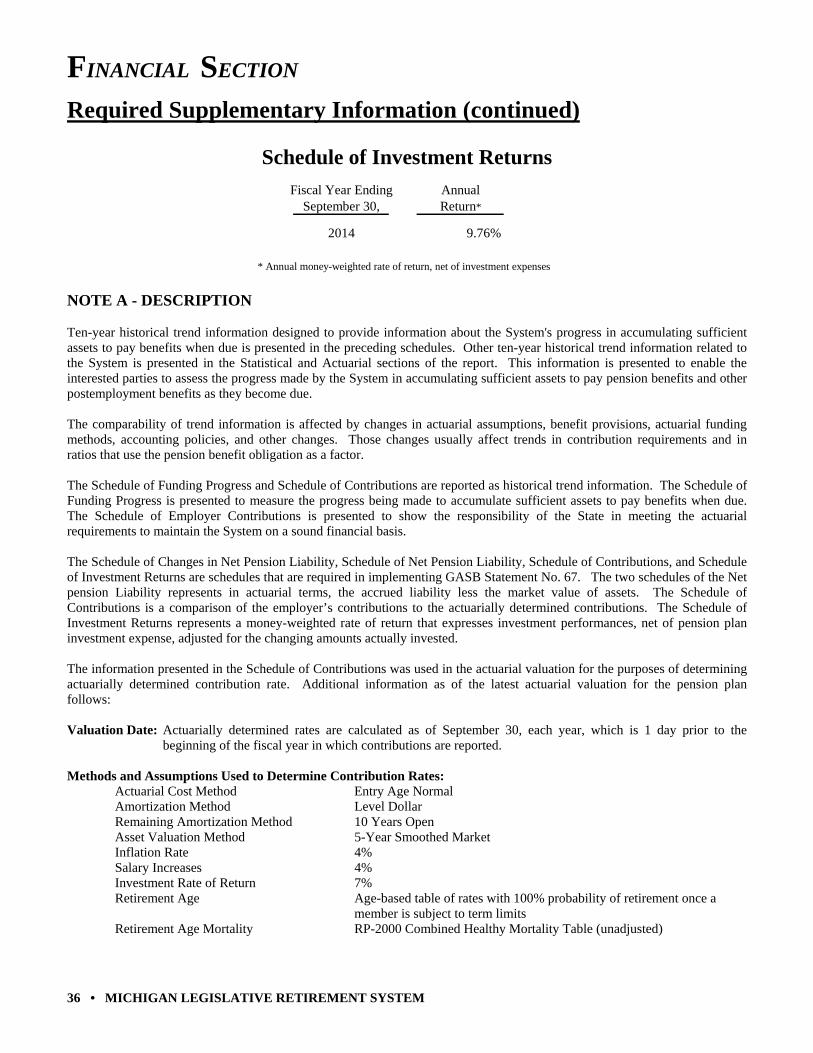
FINANCIAL SECTION
36 • MICHIGAN LEGISLATIVE RETIREMENT SYSTEM
Required Supplementary Information (continued)
Schedule of Investment Returns
Fiscal Year Ending AnnualSeptember 30, Return*
2014 9.76%
* Annual money-weighted rate of return, net of investment expenses
NOTE A - DESCRIPTION Ten-year historical trend information designed to provide information about the System's progress in accumulating sufficient assets to pay benefits when due is presented in the preceding schedules. Other ten-year historical trend information related to the System is presented in the Statistical and Actuarial sections of the report. This information is presented to enable the interested parties to assess the progress made by the System in accumulating sufficient assets to pay pension benefits and other postemployment benefits as they become due. The comparability of trend information is affected by changes in actuarial assumptions, benefit provisions, actuarial funding methods, accounting policies, and other changes. Those changes usually affect trends in contribution requirements and in ratios that use the pension benefit obligation as a factor. The Schedule of Funding Progress and Schedule of Contributions are reported as historical trend information. The Schedule of Funding Progress is presented to measure the progress being made to accumulate sufficient assets to pay benefits when due. The Schedule of Employer Contributions is presented to show the responsibility of the State in meeting the actuarial requirements to maintain the System on a sound financial basis. The Schedule of Changes in Net Pension Liability, Schedule of Net Pension Liability, Schedule of Contributions, and Schedule of Investment Returns are schedules that are required in implementing GASB Statement No. 67. The two schedules of the Net pension Liability represents in actuarial terms, the accrued liability less the market value of assets. The Schedule of Contributions is a comparison of the employer’s contributions to the actuarially determined contributions. The Schedule of Investment Returns represents a money-weighted rate of return that expresses investment performances, net of pension plan investment expense, adjusted for the changing amounts actually invested. The information presented in the Schedule of Contributions was used in the actuarial valuation for the purposes of determining actuarially determined contribution rate. Additional information as of the latest actuarial valuation for the pension plan follows: Valuation Date: Actuarially determined rates are calculated as of September 30, each year, which is 1 day prior to the
beginning of the fiscal year in which contributions are reported. Methods and Assumptions Used to Determine Contribution Rates: Actuarial Cost Method Entry Age Normal Amortization Method Level Dollar Remaining Amortization Method 10 Years Open Asset Valuation Method 5-Year Smoothed Market Inflation Rate 4% Salary Increases 4% Investment Rate of Return 7% Retirement Age Age-based table of rates with 100% probability of retirement once a member is subject to term limits Retirement Age Mortality RP-2000 Combined Healthy Mortality Table (unadjusted)
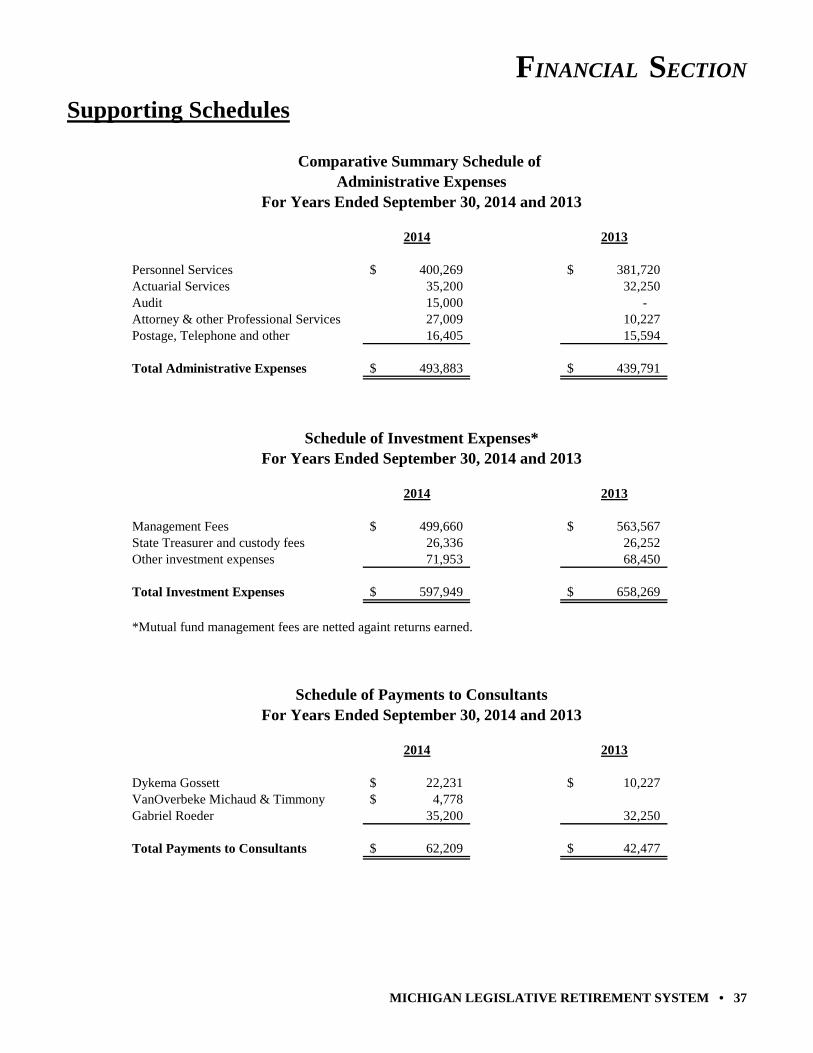
FINANCIAL SECTION
MICHIGAN LEGISLATIVE RETIREMENT SYSTEM • 37
Supporting Schedules
Comparative Summary Schedule of Administrative Expenses
For Years Ended September 30, 2014 and 2013
2014 2013
Personnel Services 400,269$ 381,720$ Actuarial Services 35,200 32,250 Audit 15,000 - Attorney & other Professional Services 27,009 10,227 Postage, Telephone and other 16,405 15,594
Total Administrative Expenses 493,883$ 439,791$
Schedule of Investment Expenses*For Years Ended September 30, 2014 and 2013
2014 2013
Management Fees 499,660$ 563,567$ State Treasurer and custody fees 26,336 26,252 Other investment expenses 71,953 68,450
Total Investment Expenses 597,949$ 658,269$
*Mutual fund management fees are netted againt returns earned.
Schedule of Payments to ConsultantsFor Years Ended September 30, 2014 and 2013
2014 2013
Dykema Gossett 22,231$ 10,227$ VanOverbeke Michaud & Timmony 4,778$ Gabriel Roeder 35,200 32,250
Total Payments to Consultants 62,209$ 42,477$
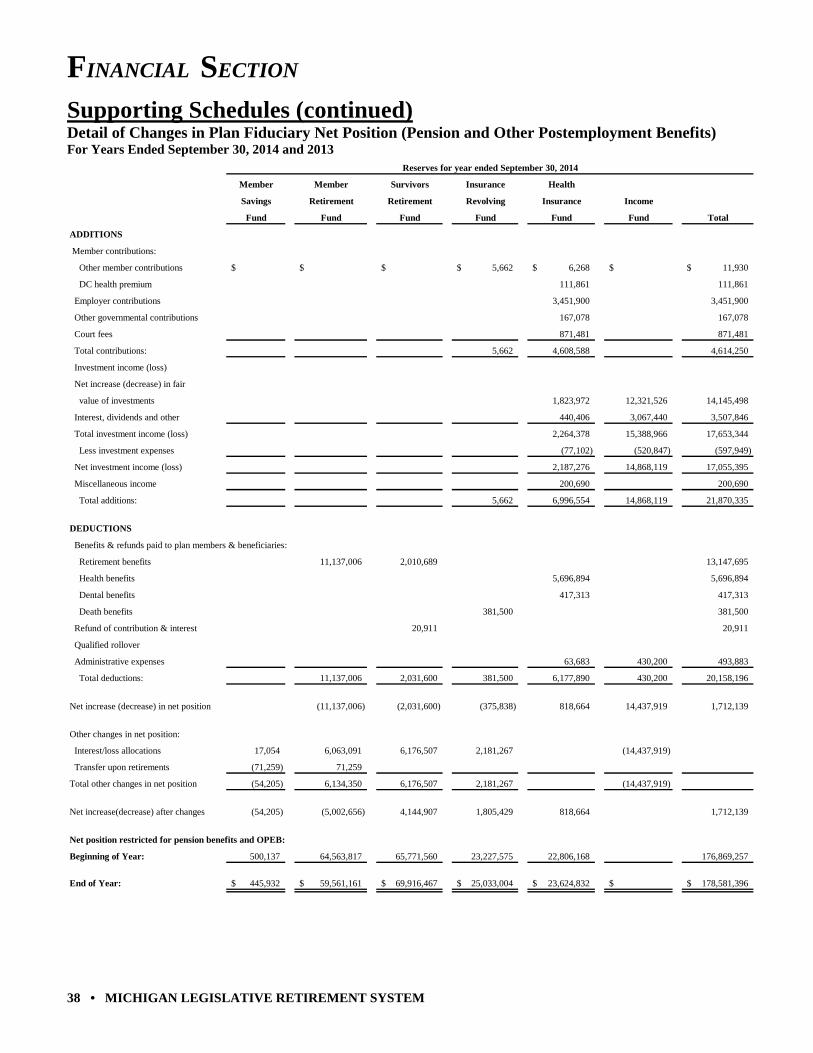
FINANCIAL SECTION
38 • MICHIGAN LEGISLATIVE RETIREMENT SYSTEM
Supporting Schedules (continued) Detail of Changes in Plan Fiduciary Net Position (Pension and Other Postemployment Benefits) For Years Ended September 30, 2014 and 2013
Reserves for year ended September 30, 2014
Member Member Survivors Insurance Health
Savings Retirement Retirement Revolving Insurance Income
Fund Fund Fund Fund Fund Fund Total
ADDITIONS
Member contributions:
Other member contributions $ $ $ 5,662$ 6,268$ $ 11,930$
DC health premium 111,861 111,861
Employer contributions 3,451,900 3,451,900
Other governmental contributions 167,078 167,078
Court fees 871,481 871,481
Total contributions: 5,662 4,608,588 4,614,250
Investment income (loss)
Net increase (decrease) in fair
value of investments 1,823,972 12,321,526 14,145,498
Interest, dividends and other 440,406 3,067,440 3,507,846
Total investment income (loss) 2,264,378 15,388,966 17,653,344
Less investment expenses (77,102) (520,847) (597,949)
Net investment income (loss) 2,187,276 14,868,119 17,055,395
Miscellaneous income 200,690 200,690
Total additions: 5,662 6,996,554 14,868,119 21,870,335
DEDUCTIONS
Benefits & refunds paid to plan members & beneficiaries:
Retirement benefits 11,137,006 2,010,689 13,147,695
Health benefits 5,696,894 5,696,894
Dental benefits 417,313 417,313
Death benefits 381,500 381,500
Refund of contribution & interest 20,911 20,911
Qualified rollover
Administrative expenses 63,683 430,200 493,883
Total deductions: 11,137,006 2,031,600 381,500 6,177,890 430,200 20,158,196
Net increase (decrease) in net position (11,137,006) (2,031,600) (375,838) 818,664 14,437,919 1,712,139
Other changes in net position:
Interest/loss allocations 17,054 6,063,091 6,176,507 2,181,267 (14,437,919)
Transfer upon retirements (71,259) 71,259
Total other changes in net position (54,205) 6,134,350 6,176,507 2,181,267 (14,437,919)
Net increase(decrease) after changes (54,205) (5,002,656) 4,144,907 1,805,429 818,664 1,712,139
Net position restricted for pension benefits and OPEB:
Beginning of Year: 500,137 64,563,817 65,771,560 23,227,575 22,806,168 176,869,257
End of Year: 445,932$ 59,561,161$ 69,916,467$ 25,033,004$ 23,624,832$ $ 178,581,396$
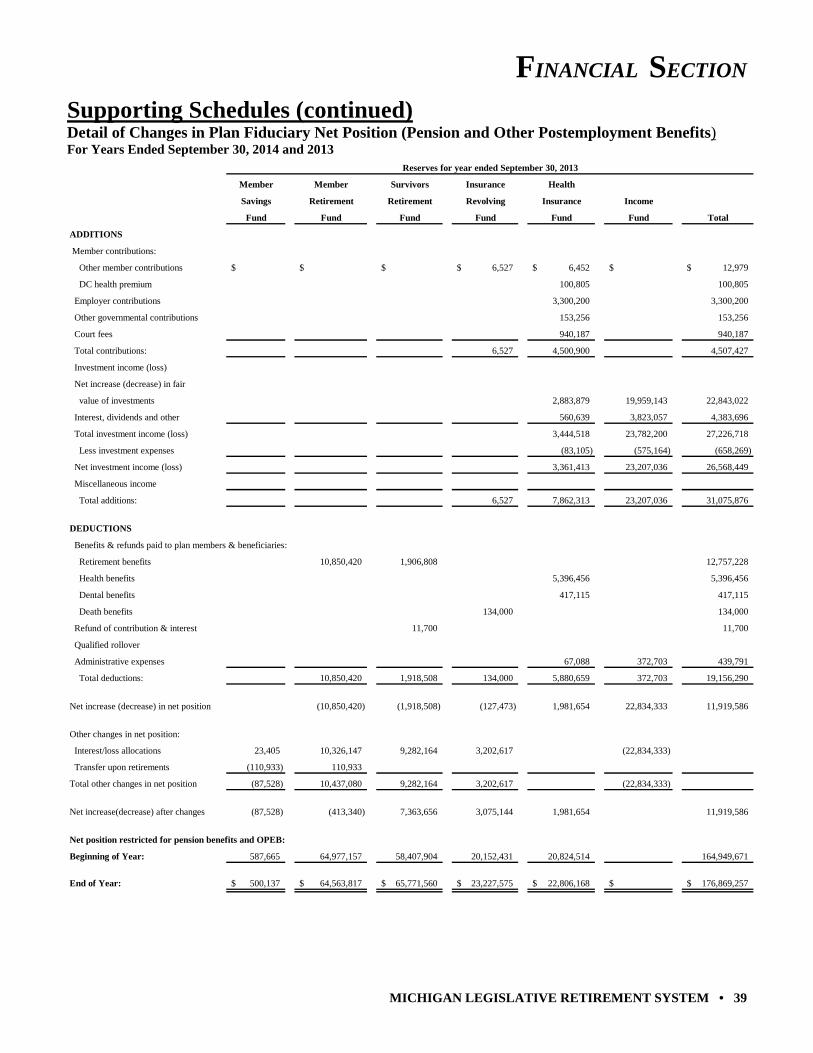
FINANCIAL SECTION
MICHIGAN LEGISLATIVE RETIREMENT SYSTEM • 39
Supporting Schedules (continued) Detail of Changes in Plan Fiduciary Net Position (Pension and Other Postemployment Benefits) For Years Ended September 30, 2014 and 2013
Reserves for year ended September 30, 2013
Member Member Survivors Insurance Health
Savings Retirement Retirement Revolving Insurance Income
Fund Fund Fund Fund Fund Fund Total
ADDITIONS
Member contributions:
Other member contributions $ $ $ 6,527$ 6,452$ $ 12,979$
DC health premium 100,805 100,805
Employer contributions 3,300,200 3,300,200
Other governmental contributions 153,256 153,256
Court fees 940,187 940,187
Total contributions: 6,527 4,500,900 4,507,427
Investment income (loss)
Net increase (decrease) in fair
value of investments 2,883,879 19,959,143 22,843,022
Interest, dividends and other 560,639 3,823,057 4,383,696
Total investment income (loss) 3,444,518 23,782,200 27,226,718
Less investment expenses (83,105) (575,164) (658,269)
Net investment income (loss) 3,361,413 23,207,036 26,568,449
Miscellaneous income
Total additions: 6,527 7,862,313 23,207,036 31,075,876
DEDUCTIONS
Benefits & refunds paid to plan members & beneficiaries:
Retirement benefits 10,850,420 1,906,808 12,757,228
Health benefits 5,396,456 5,396,456
Dental benefits 417,115 417,115
Death benefits 134,000 134,000
Refund of contribution & interest 11,700 11,700
Qualified rollover
Administrative expenses 67,088 372,703 439,791
Total deductions: 10,850,420 1,918,508 134,000 5,880,659 372,703 19,156,290
Net increase (decrease) in net position (10,850,420) (1,918,508) (127,473) 1,981,654 22,834,333 11,919,586
Other changes in net position:
Interest/loss allocations 23,405 10,326,147 9,282,164 3,202,617 (22,834,333)
Transfer upon retirements (110,933) 110,933
Total other changes in net position (87,528) 10,437,080 9,282,164 3,202,617 (22,834,333)
Net increase(decrease) after changes (87,528) (413,340) 7,363,656 3,075,144 1,981,654 11,919,586
Net position restricted for pension benefits and OPEB:
Beginning of Year: 587,665 64,977,157 58,407,904 20,152,431 20,824,514 164,949,671
End of Year: 500,137$ 64,563,817$ 65,771,560$ 23,227,575$ 22,806,168$ $ 176,869,257$

FINANCIAL SECTION
40 • MICHIGAN LEGISLATIVE RETIREMENT SYSTEM
This page was intentionally left blank.
INVESTMENT SECTION
MICHIGAN LEGISLATIVE RETIREMENT SYSTEM • 41
Michigan Legislative Retirement System
Comprehensive Annual Financial Report for the Fiscal Year Ended September 30, 2014
INVESTMENT SECTION
Report on Investment Activity Asset Allocation
Investment Summary List of Largest Assets Held
Schedule of Investment Fees Schedule of Fees and Commissions
INVESTMENT SECTION
42 • MICHIGAN LEGISLATIVE RETIREMENT SYSTEM
Report on Investment Activity
INTRODUCTION The System's Board of Trustees is the investment fiduciary for the system in accordance with the law. Investment decisions, including investment policies and procedures, are subject to statutory regulations imposed by the Michigan Public Employee Retirement System Investment Act, Public Act 314 of 1965, as amended. As the investment fiduciary for the system, the board’s responsibilities include, but are not limited to: (1) establishing an investment policy and asset allocation for the System pension fund; (2) prudently selecting investment managers and consultants for the system, and (3) conducting periodic reviews to ensure that its policies are followed and that its investment professionals perform satisfactorily in accordance with established standards and goals. The State Treasurer for the State of Michigan acts as the custodian for the System funds pursuant to state law, and the board has also contracted with independent investment advisors to assist with investment decisions and to manage the pension fund assets. INVESTMENT OBJECTIVES The System’s primary investment objective is to provide a real rate of return, net of inflation, administrative and investment expenses, sufficient to support the system’s ability to meet its obligations to plan participants and beneficiaries without undue exposure to risk. In absolute terms, this return objective should approximate the System’s actuarial assumed rate of return, which is currently 7%. The System seeks to attain investment results over a full market cycle. It does not expect that all investment objectives will be attained in each year and recognizes that over various periods of time the System investment results may produce significant “over” or “under” performance relative to broad markets. For this reason, the board of trustees takes a LONG-TERM perspective and will measure quantitative investment returns over a 5-year moving period. Managers and other parties are also expected to meet qualitative performance objectives (adherence to its investment philosophy and System policies, continuity of firm personnel and practices, etc.) as established by the board. MARKET REVIEW The market review is prepared by the Fund Evaluation Group (FEG). FEG is the investment advisor for the System and they monitor all the investments and the performance of the investments. Twelve Months Ending September 30, 2014
From an investment perspective, one of the most significant unknowns during the Legislative Retirement System’s (LRS) fiscal year was the markets’ reaction to the end of quantitative easing. Consensus expectations were for the U.S. Federal Reserve (Fed) to continue to slow (taper) the pace of their bond buying program with its termination slated for just after the close of the LRS fiscal year (which is September). The uncertainty as to the timing and the impending “lift off” (i.e., an initial move up in the Federal funds rate) caused the markets to fluctuate during the fiscal year, but the diversification of the portfolio helped reduce overall volatility and generate solid returns during the period. Overall, the economy has been growing, but only at an annualized rate of 2.2% since the end of the recession in 2009. While positive, this growth rate pales in comparison to the 4.3% average rate during other economic recoveries since World War II. Despite this slower-than-average post-recession growth, the LRS’s investment portfolio had another strong fiscal year posting a 9.4% (net-of-fees) total return for the one year period ending September 30, 2014.
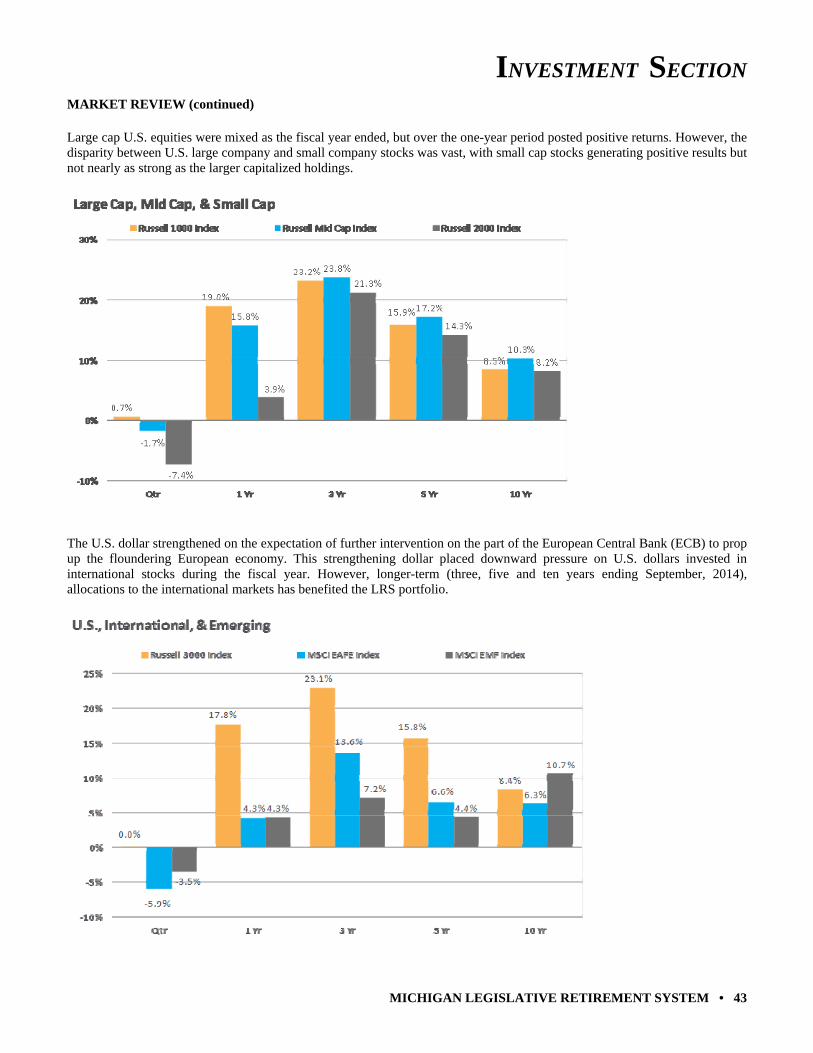
INVESTMENT SECTION
MICHIGAN LEGISLATIVE RETIREMENT SYSTEM • 43
MARKET REVIEW (continued) Large cap U.S. equities were mixed as the fiscal year ended, but over the one-year period posted positive returns. However, the disparity between U.S. large company and small company stocks was vast, with small cap stocks generating positive results but not nearly as strong as the larger capitalized holdings.
The U.S. dollar strengthened on the expectation of further intervention on the part of the European Central Bank (ECB) to prop up the floundering European economy. This strengthening dollar placed downward pressure on U.S. dollars invested in international stocks during the fiscal year. However, longer-term (three, five and ten years ending September, 2014), allocations to the international markets has benefited the LRS portfolio.
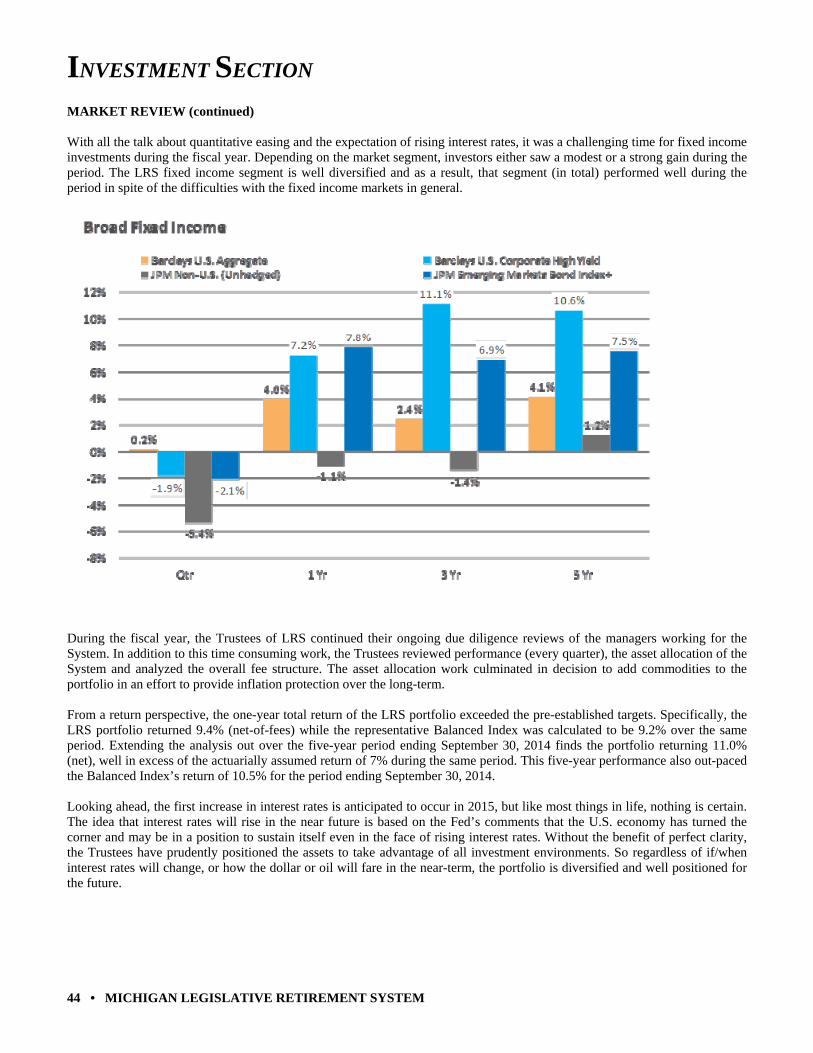
INVESTMENT SECTION
44 • MICHIGAN LEGISLATIVE RETIREMENT SYSTEM
MARKET REVIEW (continued) With all the talk about quantitative easing and the expectation of rising interest rates, it was a challenging time for fixed income investments during the fiscal year. Depending on the market segment, investors either saw a modest or a strong gain during the period. The LRS fixed income segment is well diversified and as a result, that segment (in total) performed well during the period in spite of the difficulties with the fixed income markets in general.
During the fiscal year, the Trustees of LRS continued their ongoing due diligence reviews of the managers working for the System. In addition to this time consuming work, the Trustees reviewed performance (every quarter), the asset allocation of the System and analyzed the overall fee structure. The asset allocation work culminated in decision to add commodities to the portfolio in an effort to provide inflation protection over the long-term. From a return perspective, the one-year total return of the LRS portfolio exceeded the pre-established targets. Specifically, the LRS portfolio returned 9.4% (net-of-fees) while the representative Balanced Index was calculated to be 9.2% over the same period. Extending the analysis out over the five-year period ending September 30, 2014 finds the portfolio returning 11.0% (net), well in excess of the actuarially assumed return of 7% during the same period. This five-year performance also out-paced the Balanced Index’s return of 10.5% for the period ending September 30, 2014. Looking ahead, the first increase in interest rates is anticipated to occur in 2015, but like most things in life, nothing is certain. The idea that interest rates will rise in the near future is based on the Fed’s comments that the U.S. economy has turned the corner and may be in a position to sustain itself even in the face of rising interest rates. Without the benefit of perfect clarity, the Trustees have prudently positioned the assets to take advantage of all investment environments. So regardless of if/when interest rates will change, or how the dollar or oil will fare in the near-term, the portfolio is diversified and well positioned for the future.
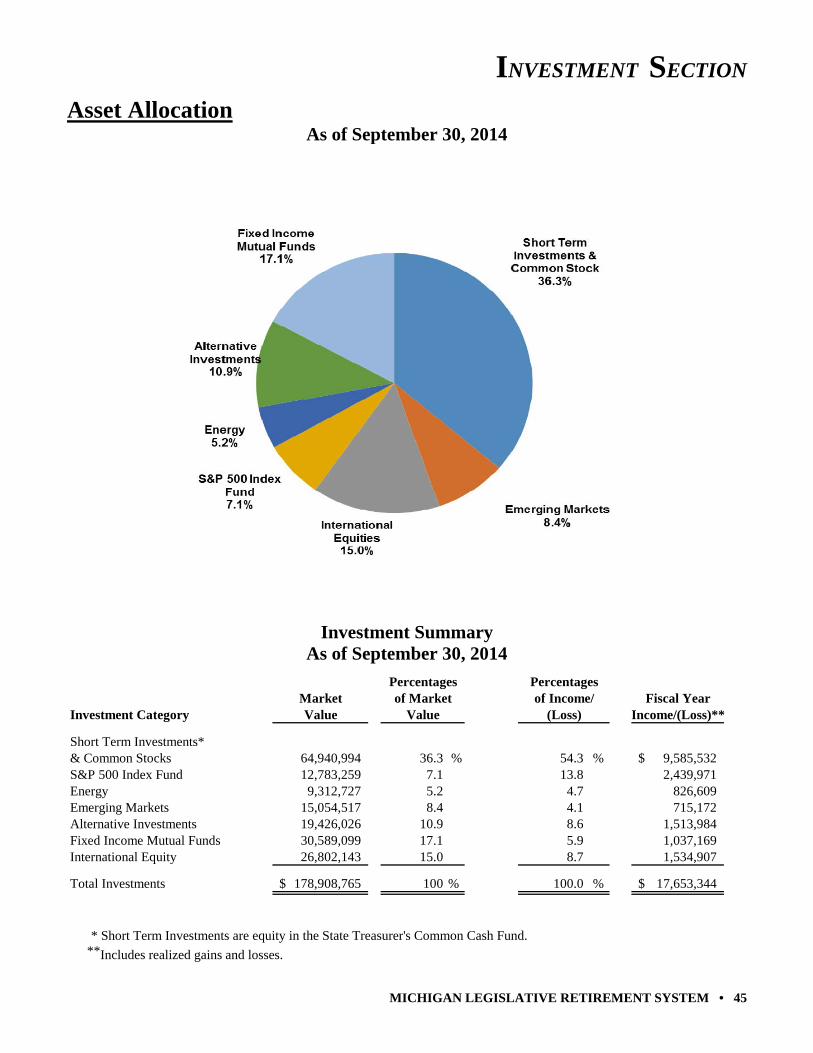
INVESTMENT SECTION
MICHIGAN LEGISLATIVE RETIREMENT SYSTEM • 45
Asset Allocation
As of September 30, 2014
Investment Summary
As of September 30, 2014
Percentages PercentagesMarket of Market of Income/ Fiscal Year
Investment Category Value Value (Loss) Income/(Loss)**
Short Term Investments*& Common Stocks 64,940,994 36.3 % 54.3 % 9,585,532$ S&P 500 Index Fund 12,783,259 7.1 13.8 2,439,971 Energy 9,312,727 5.2 4.7 826,609 Emerging Markets 15,054,517 8.4 4.1 715,172 Alternative Investments 19,426,026 10.9 8.6 1,513,984 Fixed Income Mutual Funds 30,589,099 17.1 5.9 1,037,169 International Equity 26,802,143 15.0 8.7 1,534,907
Total Investments 178,908,765$ 100 % 100.0 % 17,653,344$
* Short Term Investments are equity in the State Treasurer's Common Cash Fund.
**Includes realized gains and losses.
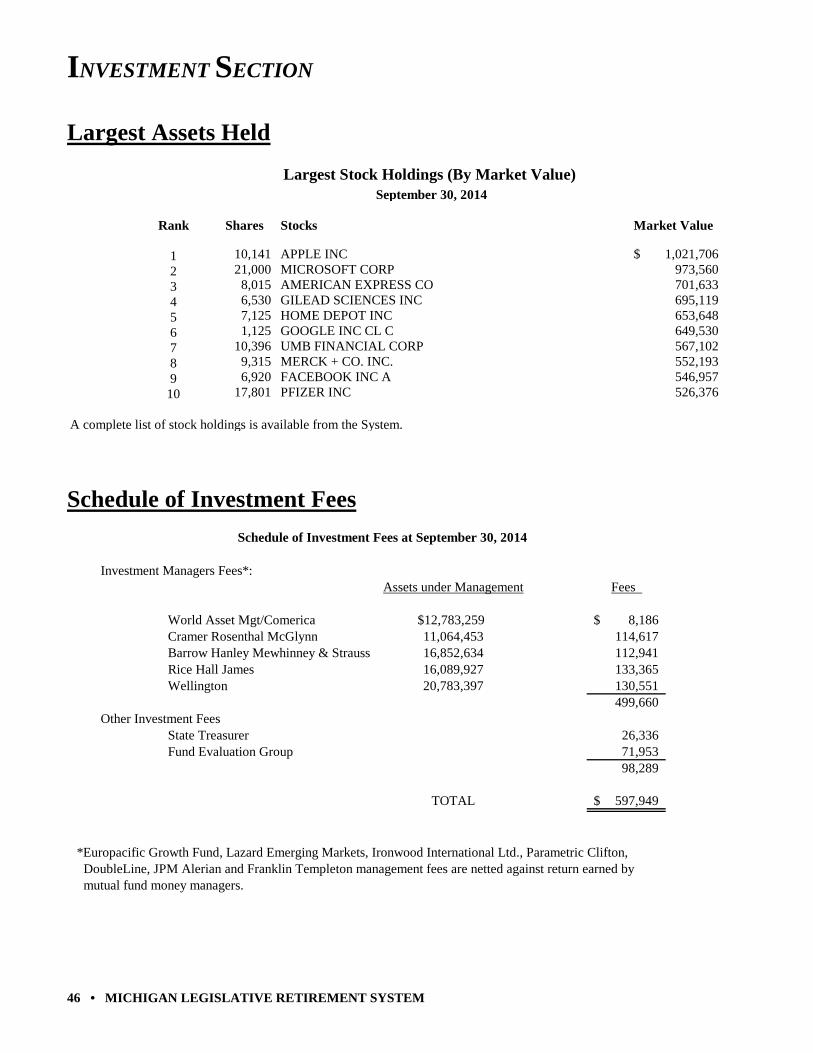
INVESTMENT SECTION
46 • MICHIGAN LEGISLATIVE RETIREMENT SYSTEM
Largest Assets Held
Largest Stock Holdings (By Market Value) September 30, 2014
Rank Shares Stocks Market Value
1 10,141 APPLE INC 1,021,706$ 2 21,000 MICROSOFT CORP 973,560 3 8,015 AMERICAN EXPRESS CO 701,633 4 6,530 GILEAD SCIENCES INC 695,119 5 7,125 HOME DEPOT INC 653,648 6 1,125 GOOGLE INC CL C 649,530 7 10,396 UMB FINANCIAL CORP 567,102 8 9,315 MERCK + CO. INC. 552,193 9 6,920 FACEBOOK INC A 546,957
10 17,801 PFIZER INC 526,376
A complete list of stock holdings is available from the System.
Schedule of Investment Fees
Schedule of Investment Fees at September 30, 2014
Investment Managers Fees*:Assets under Management Fees
World Asset Mgt/Comerica $12,783,259 8,186$ Cramer Rosenthal McGlynn 11,064,453 114,617
Barrow Hanley Mewhinney & Strauss 16,852,634 112,941 Rice Hall James 16,089,927 133,365 Wellington 20,783,397 130,551
499,660 Other Investment Fees
State Treasurer 26,336 Fund Evaluation Group 71,953
98,289
TOTAL 597,949$
*Europacific Growth Fund, Lazard Emerging Markets, Ironwood International Ltd., Parametric Clifton, DoubleLine, JPM Alerian and Franklin Templeton management fees are netted against return earned by mutual fund money managers.
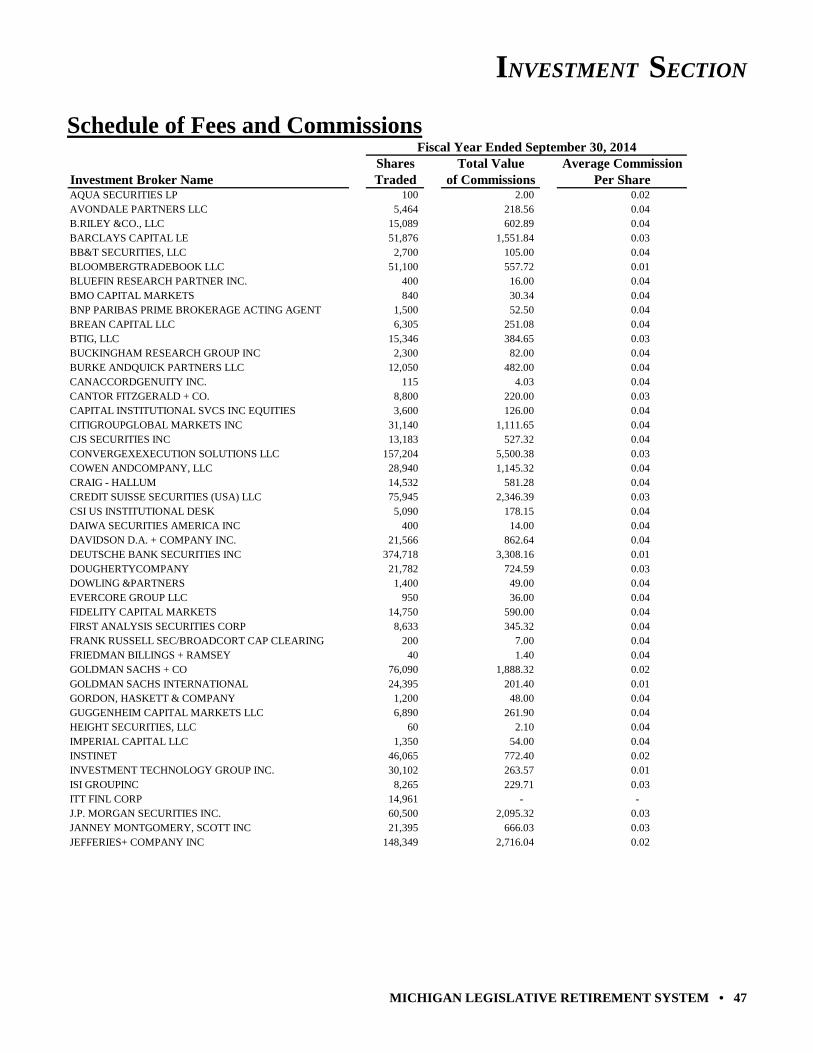
INVESTMENT SECTION
MICHIGAN LEGISLATIVE RETIREMENT SYSTEM • 47
Schedule of Fees and Commissions Fiscal Year Ended September 30, 2014
Shares Total Value Average CommissionInvestment Broker Name Traded of Commissions Per ShareAQUA SECURITIES LP 100 2.00 0.02 AVONDALE PARTNERS LLC 5,464 218.56 0.04 B.RILEY &CO., LLC 15,089 602.89 0.04 BARCLAYS CAPITAL LE 51,876 1,551.84 0.03 BB&T SECURITIES, LLC 2,700 105.00 0.04 BLOOMBERGTRADEBOOK LLC 51,100 557.72 0.01 BLUEFIN RESEARCH PARTNER INC. 400 16.00 0.04 BMO CAPITAL MARKETS 840 30.34 0.04 BNP PARIBAS PRIME BROKERAGE ACTING AGENT 1,500 52.50 0.04 BREAN CAPITAL LLC 6,305 251.08 0.04 BTIG, LLC 15,346 384.65 0.03 BUCKINGHAM RESEARCH GROUP INC 2,300 82.00 0.04 BURKE ANDQUICK PARTNERS LLC 12,050 482.00 0.04 CANACCORDGENUITY INC. 115 4.03 0.04 CANTOR FITZGERALD + CO. 8,800 220.00 0.03 CAPITAL INSTITUTIONAL SVCS INC EQUITIES 3,600 126.00 0.04 CITIGROUPGLOBAL MARKETS INC 31,140 1,111.65 0.04 CJS SECURITIES INC 13,183 527.32 0.04 CONVERGEXEXECUTION SOLUTIONS LLC 157,204 5,500.38 0.03 COWEN ANDCOMPANY, LLC 28,940 1,145.32 0.04 CRAIG - HALLUM 14,532 581.28 0.04 CREDIT SUISSE SECURITIES (USA) LLC 75,945 2,346.39 0.03 CSI US INSTITUTIONAL DESK 5,090 178.15 0.04 DAIWA SECURITIES AMERICA INC 400 14.00 0.04 DAVIDSON D.A. + COMPANY INC. 21,566 862.64 0.04 DEUTSCHE BANK SECURITIES INC 374,718 3,308.16 0.01 DOUGHERTYCOMPANY 21,782 724.59 0.03 DOWLING &PARTNERS 1,400 49.00 0.04 EVERCORE GROUP LLC 950 36.00 0.04 FIDELITY CAPITAL MARKETS 14,750 590.00 0.04 FIRST ANALYSIS SECURITIES CORP 8,633 345.32 0.04 FRANK RUSSELL SEC/BROADCORT CAP CLEARING 200 7.00 0.04 FRIEDMAN BILLINGS + RAMSEY 40 1.40 0.04 GOLDMAN SACHS + CO 76,090 1,888.32 0.02 GOLDMAN SACHS INTERNATIONAL 24,395 201.40 0.01 GORDON, HASKETT & COMPANY 1,200 48.00 0.04 GUGGENHEIM CAPITAL MARKETS LLC 6,890 261.90 0.04 HEIGHT SECURITIES, LLC 60 2.10 0.04 IMPERIAL CAPITAL LLC 1,350 54.00 0.04 INSTINET 46,065 772.40 0.02 INVESTMENT TECHNOLOGY GROUP INC. 30,102 263.57 0.01 ISI GROUPINC 8,265 229.71 0.03 ITT FINL CORP 14,961 - - J.P. MORGAN SECURITIES INC. 60,500 2,095.32 0.03 JANNEY MONTGOMERY, SCOTT INC 21,395 666.03 0.03 JEFFERIES+ COMPANY INC 148,349 2,716.04 0.02
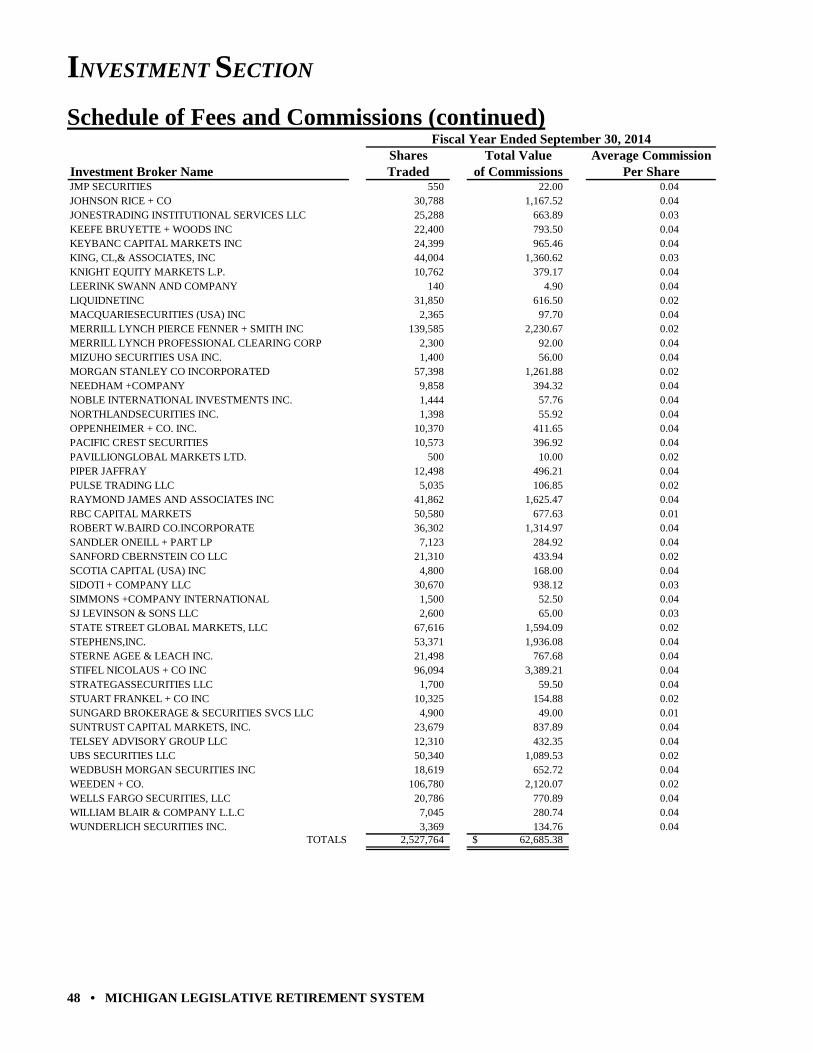
INVESTMENT SECTION
48 • MICHIGAN LEGISLATIVE RETIREMENT SYSTEM
Schedule of Fees and Commissions (continued) Fiscal Year Ended September 30, 2014
Shares Total Value Average CommissionInvestment Broker Name Traded of Commissions Per ShareJMP SECURITIES 550 22.00 0.04 JOHNSON RICE + CO 30,788 1,167.52 0.04 JONESTRADING INSTITUTIONAL SERVICES LLC 25,288 663.89 0.03 KEEFE BRUYETTE + WOODS INC 22,400 793.50 0.04 KEYBANC CAPITAL MARKETS INC 24,399 965.46 0.04 KING, CL,& ASSOCIATES, INC 44,004 1,360.62 0.03 KNIGHT EQUITY MARKETS L.P. 10,762 379.17 0.04 LEERINK SWANN AND COMPANY 140 4.90 0.04 LIQUIDNETINC 31,850 616.50 0.02 MACQUARIESECURITIES (USA) INC 2,365 97.70 0.04 MERRILL LYNCH PIERCE FENNER + SMITH INC 139,585 2,230.67 0.02 MERRILL LYNCH PROFESSIONAL CLEARING CORP 2,300 92.00 0.04 MIZUHO SECURITIES USA INC. 1,400 56.00 0.04 MORGAN STANLEY CO INCORPORATED 57,398 1,261.88 0.02 NEEDHAM +COMPANY 9,858 394.32 0.04 NOBLE INTERNATIONAL INVESTMENTS INC. 1,444 57.76 0.04 NORTHLANDSECURITIES INC. 1,398 55.92 0.04 OPPENHEIMER + CO. INC. 10,370 411.65 0.04 PACIFIC CREST SECURITIES 10,573 396.92 0.04 PAVILLIONGLOBAL MARKETS LTD. 500 10.00 0.02 PIPER JAFFRAY 12,498 496.21 0.04 PULSE TRADING LLC 5,035 106.85 0.02 RAYMOND JAMES AND ASSOCIATES INC 41,862 1,625.47 0.04 RBC CAPITAL MARKETS 50,580 677.63 0.01 ROBERT W.BAIRD CO.INCORPORATE 36,302 1,314.97 0.04 SANDLER ONEILL + PART LP 7,123 284.92 0.04 SANFORD CBERNSTEIN CO LLC 21,310 433.94 0.02 SCOTIA CAPITAL (USA) INC 4,800 168.00 0.04 SIDOTI + COMPANY LLC 30,670 938.12 0.03 SIMMONS +COMPANY INTERNATIONAL 1,500 52.50 0.04 SJ LEVINSON & SONS LLC 2,600 65.00 0.03 STATE STREET GLOBAL MARKETS, LLC 67,616 1,594.09 0.02 STEPHENS,INC. 53,371 1,936.08 0.04 STERNE AGEE & LEACH INC. 21,498 767.68 0.04 STIFEL NICOLAUS + CO INC 96,094 3,389.21 0.04 STRATEGASSECURITIES LLC 1,700 59.50 0.04 STUART FRANKEL + CO INC 10,325 154.88 0.02 SUNGARD BROKERAGE & SECURITIES SVCS LLC 4,900 49.00 0.01 SUNTRUST CAPITAL MARKETS, INC. 23,679 837.89 0.04 TELSEY ADVISORY GROUP LLC 12,310 432.35 0.04 UBS SECURITIES LLC 50,340 1,089.53 0.02 WEDBUSH MORGAN SECURITIES INC 18,619 652.72 0.04 WEEDEN + CO. 106,780 2,120.07 0.02 WELLS FARGO SECURITIES, LLC 20,786 770.89 0.04 WILLIAM BLAIR & COMPANY L.L.C 7,045 280.74 0.04 WUNDERLICH SECURITIES INC. 3,369 134.76 0.04
TOTALS 2,527,764 62,685.38$

ACTUARIAL SECTION
MICHIGAN LEGISLATIVE RETIREMENT SYSTEM • 49
Michigan Legislative Retirement System
Comprehensive Annual Financial Report for the Fiscal Year Ended September 30, 2014
ACTUARIAL SECTION
Actuary's Certification Summary of Actuarial Assumptions and Methods
Schedule of Member Data Schedule of Changes in Retirement Rolls
Prioritized Solvency Test Summary of Plan Provisions
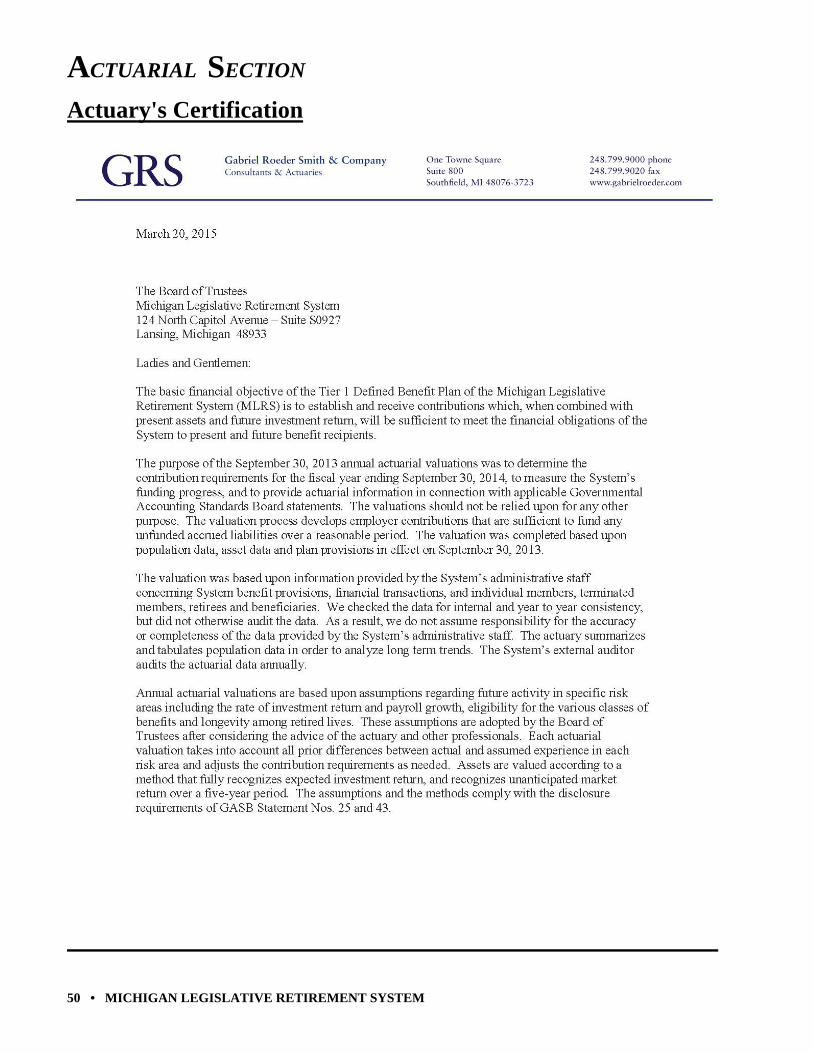
ACTUARIAL SECTION
50 • MICHIGAN LEGISLATIVE RETIREMENT SYSTEM
Actuary's Certification
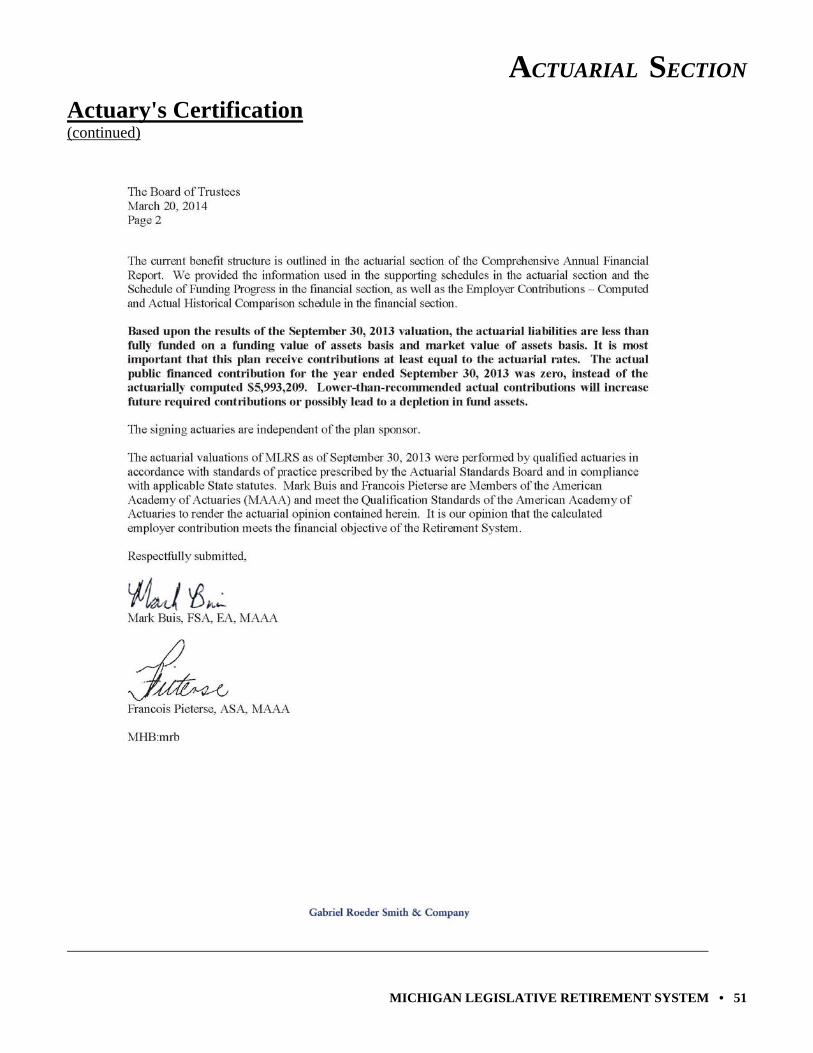
ACTUARIAL SECTION
MICHIGAN LEGISLATIVE RETIREMENT SYSTEM • 51
Actuary's Certification (continued)
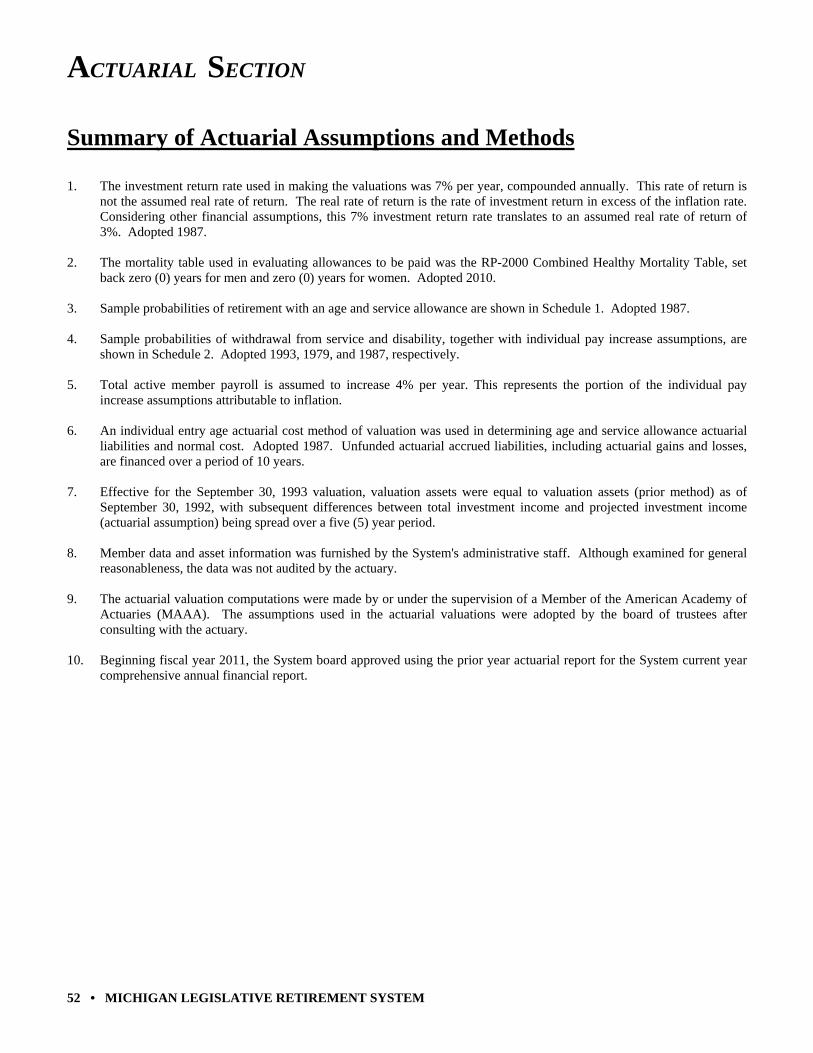
ACTUARIAL SECTION
52 • MICHIGAN LEGISLATIVE RETIREMENT SYSTEM
Summary of Actuarial Assumptions and Methods 1. The investment return rate used in making the valuations was 7% per year, compounded annually. This rate of return is
not the assumed real rate of return. The real rate of return is the rate of investment return in excess of the inflation rate. Considering other financial assumptions, this 7% investment return rate translates to an assumed real rate of return of 3%. Adopted 1987.
2. The mortality table used in evaluating allowances to be paid was the RP-2000 Combined Healthy Mortality Table, set
back zero (0) years for men and zero (0) years for women. Adopted 2010. 3. Sample probabilities of retirement with an age and service allowance are shown in Schedule 1. Adopted 1987. 4. Sample probabilities of withdrawal from service and disability, together with individual pay increase assumptions, are
shown in Schedule 2. Adopted 1993, 1979, and 1987, respectively. 5. Total active member payroll is assumed to increase 4% per year. This represents the portion of the individual pay
increase assumptions attributable to inflation. 6. An individual entry age actuarial cost method of valuation was used in determining age and service allowance actuarial
liabilities and normal cost. Adopted 1987. Unfunded actuarial accrued liabilities, including actuarial gains and losses, are financed over a period of 10 years.
7. Effective for the September 30, 1993 valuation, valuation assets were equal to valuation assets (prior method) as of
September 30, 1992, with subsequent differences between total investment income and projected investment income (actuarial assumption) being spread over a five (5) year period.
8. Member data and asset information was furnished by the System's administrative staff. Although examined for general
reasonableness, the data was not audited by the actuary. 9. The actuarial valuation computations were made by or under the supervision of a Member of the American Academy of
Actuaries (MAAA). The assumptions used in the actuarial valuations were adopted by the board of trustees after consulting with the actuary.
10. Beginning fiscal year 2011, the System board approved using the prior year actuarial report for the System current year
comprehensive annual financial report.
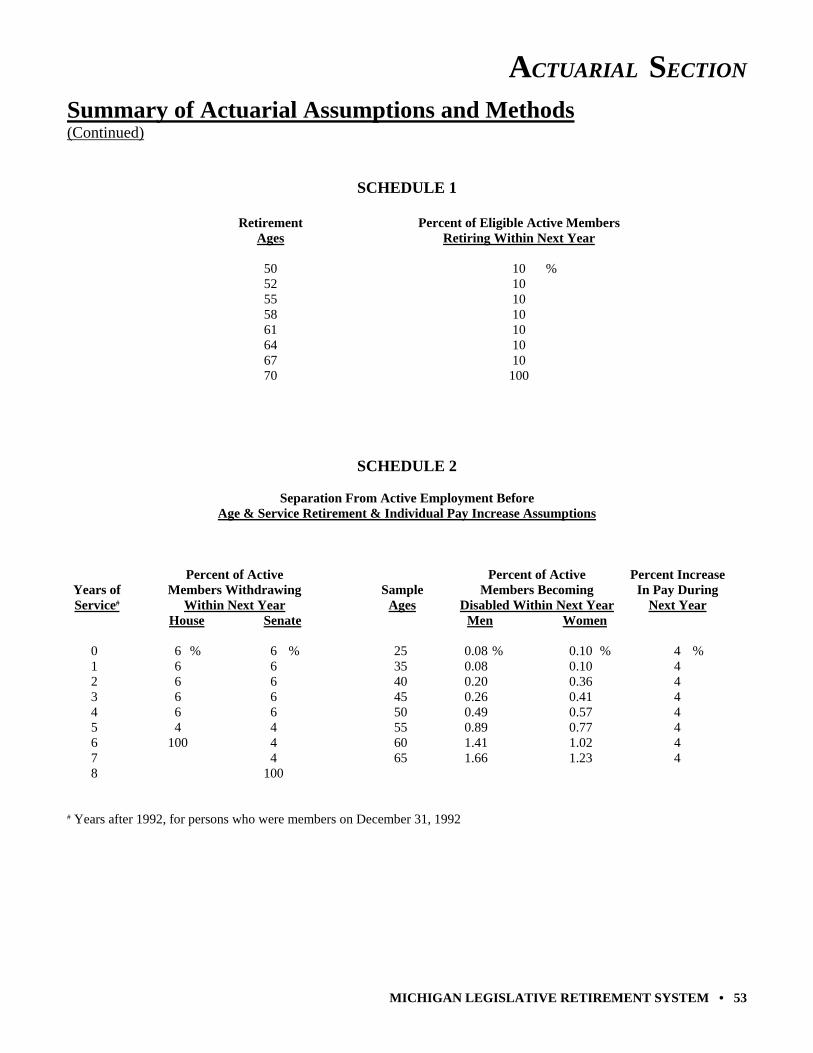
ACTUARIAL SECTION
MICHIGAN LEGISLATIVE RETIREMENT SYSTEM • 53
Summary of Actuarial Assumptions and Methods (Continued)
SCHEDULE 1 Retirement Percent of Eligible Active Members Ages Retiring Within Next Year 50 10 % 52 10 55 10 58 10 61 10 64 10 67 10 70 100
SCHEDULE 2
Separation From Active Employment Before Age & Service Retirement & Individual Pay Increase Assumptions
Percent of Active Percent of Active Percent Increase Years of Members Withdrawing Sample Members Becoming In Pay During Service# Within Next Year Ages Disabled Within Next Year Next Year
House Senate Men Women 0 6 % 6 % 25 0.08 % 0.10 % 4 % 1 6 6 35 0.08 0.10 4 2 6 6 40 0.20 0.36 4 3 6 6 45 0.26 0.41 4 4 6 6 50 0.49 0.57 4 5 4 4 55 0.89 0.77 4 6 100 4 60 1.41 1.02 4 7 4 65 1.66 1.23 4 8 100
# Years after 1992, for persons who were members on December 31, 1992
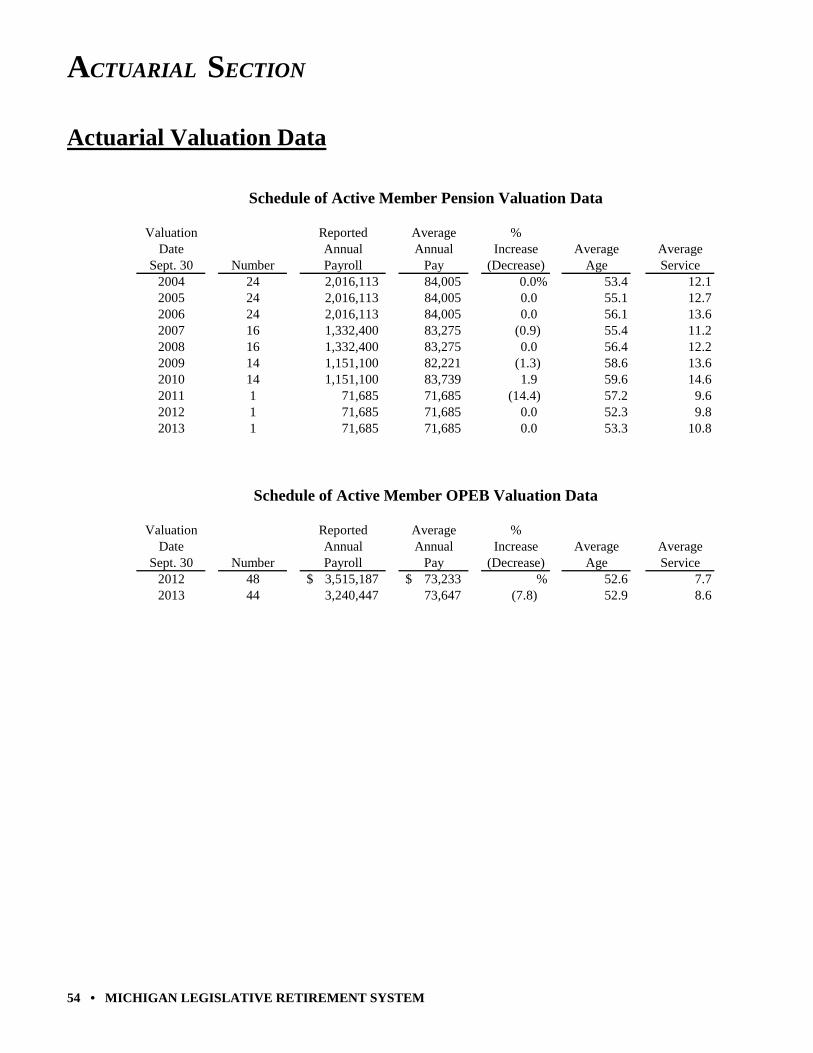
ACTUARIAL SECTION
54 • MICHIGAN LEGISLATIVE RETIREMENT SYSTEM
Actuarial Valuation Data
Schedule of Active Member Pension Valuation Data
Valuation Reported Average %Date Annual Annual Increase Average Average
Sept. 30 Number Payroll Pay (Decrease) Age Service2004 24 2,016,113 84,005 0.0% 53.4 12.12005 24 2,016,113 84,005 0.0 55.1 12.72006 24 2,016,113 84,005 0.0 56.1 13.62007 16 1,332,400 83,275 (0.9) 55.4 11.22008 16 1,332,400 83,275 0.0 56.4 12.22009 14 1,151,100 82,221 (1.3) 58.6 13.62010 14 1,151,100 83,739 1.9 59.6 14.62011 1 71,685 71,685 (14.4) 57.2 9.62012 1 71,685 71,685 0.0 52.3 9.82013 1 71,685 71,685 0.0 53.3 10.8
Schedule of Active Member OPEB Valuation Data
Valuation Reported Average %Date Annual Annual Increase Average Average
Sept. 30 Number Payroll Pay (Decrease) Age Service2012 48 3,515,187$ 73,233$ % 52.6 7.72013 44 3,240,447 73,647 (7.8) 52.9 8.6
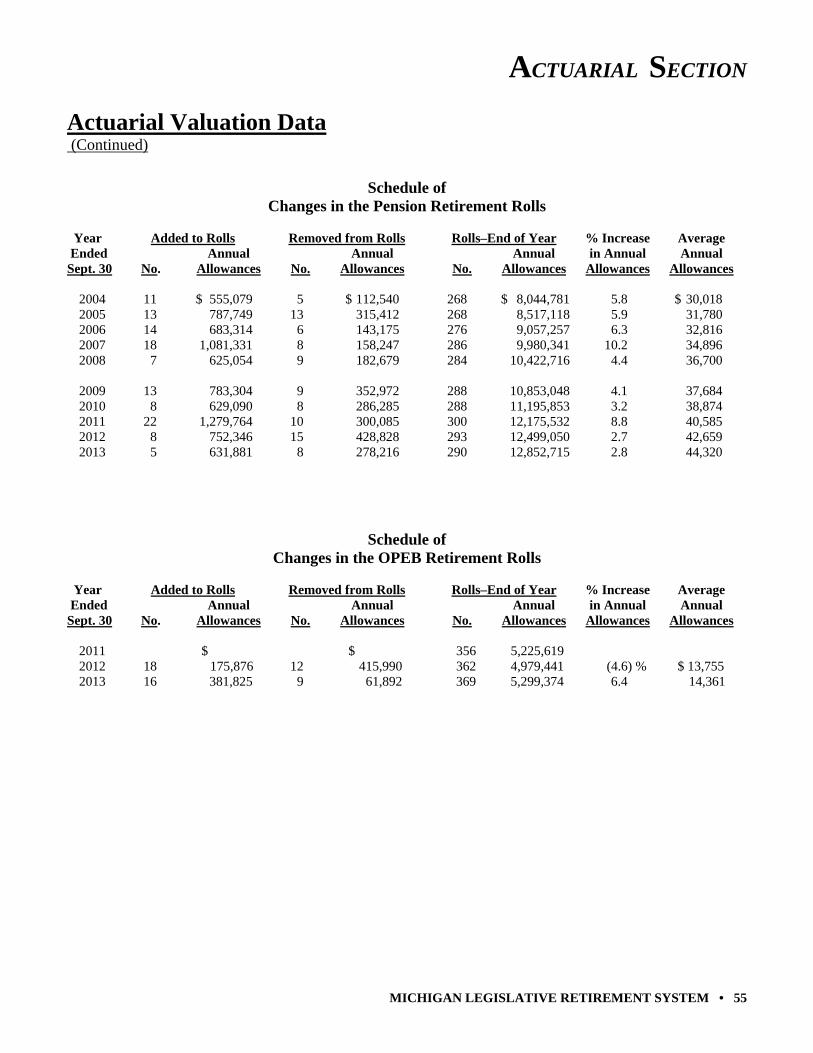
ACTUARIAL SECTION
MICHIGAN LEGISLATIVE RETIREMENT SYSTEM • 55
Actuarial Valuation Data (Continued)
Schedule of Changes in the Pension Retirement Rolls
Year Added to Rolls Removed from Rolls Rolls–End of Year % Increase Average Ended Annual Annual Annual in Annual Annual Sept. 30 No. Allowances No. Allowances No. Allowances Allowances Allowances 2004 11 $ 555,079 5 $ 112,540 268 $ 8,044,781 5.8 $ 30,018 2005 13 787,749 13 315,412 268 8,517,118 5.9 31,780 2006 14 683,314 6 143,175 276 9,057,257 6.3 32,816 2007 18 1,081,331 8 158,247 286 9,980,341 10.2 34,896 2008 7 625,054 9 182,679 284 10,422,716 4.4 36,700 2009 13 783,304 9 352,972 288 10,853,048 4.1 37,684 2010 8 629,090 8 286,285 288 11,195,853 3.2 38,874 2011 22 1,279,764 10 300,085 300 12,175,532 8.8 40,585 2012 8 752,346 15 428,828 293 12,499,050 2.7 42,659 2013 5 631,881 8 278,216 290 12,852,715 2.8 44,320
Schedule of Changes in the OPEB Retirement Rolls
Year Added to Rolls Removed from Rolls Rolls–End of Year % Increase Average Ended Annual Annual Annual in Annual Annual Sept. 30 No. Allowances No. Allowances No. Allowances Allowances Allowances 2011 $ $ 356 5,225,619 2012 18 175,876 12 415,990 362 4,979,441 (4.6) % $ 13,755 2013 16 381,825 9 61,892 369 5,299,374 6.4 14,361
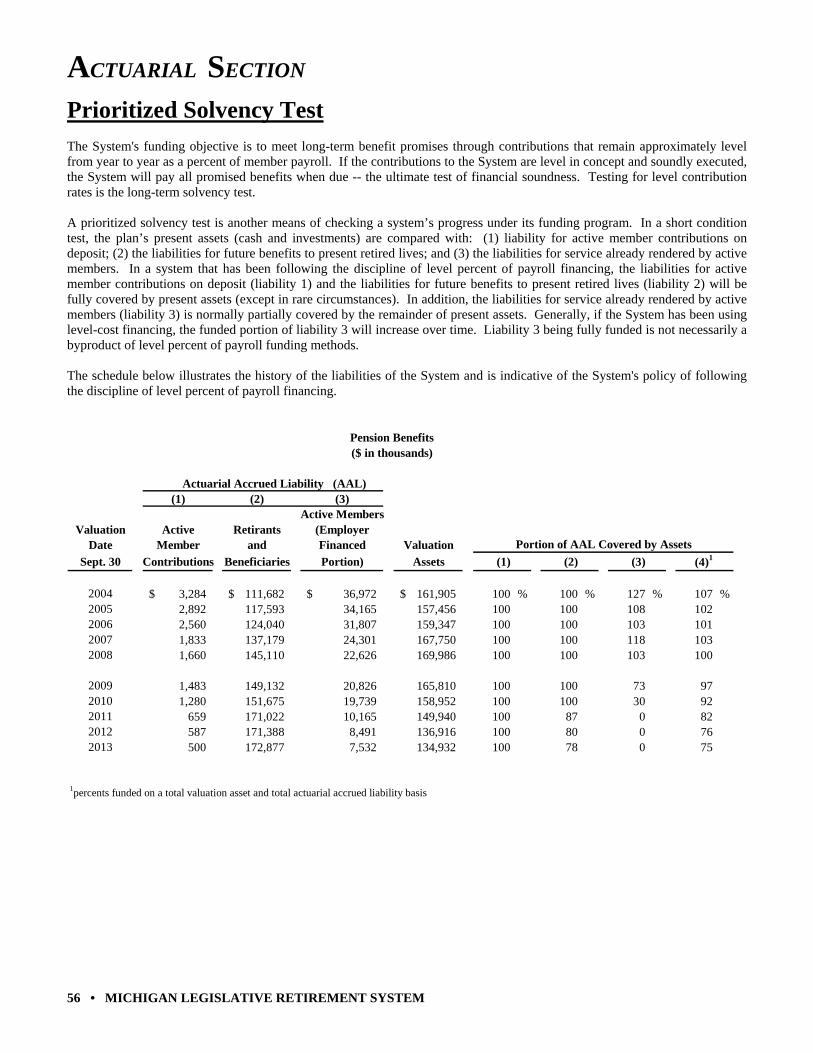
ACTUARIAL SECTION
56 • MICHIGAN LEGISLATIVE RETIREMENT SYSTEM
Prioritized Solvency Test The System's funding objective is to meet long-term benefit promises through contributions that remain approximately level from year to year as a percent of member payroll. If the contributions to the System are level in concept and soundly executed, the System will pay all promised benefits when due -- the ultimate test of financial soundness. Testing for level contribution rates is the long-term solvency test. A prioritized solvency test is another means of checking a system’s progress under its funding program. In a short condition test, the plan’s present assets (cash and investments) are compared with: (1) liability for active member contributions on deposit; (2) the liabilities for future benefits to present retired lives; and (3) the liabilities for service already rendered by active members. In a system that has been following the discipline of level percent of payroll financing, the liabilities for active member contributions on deposit (liability 1) and the liabilities for future benefits to present retired lives (liability 2) will be fully covered by present assets (except in rare circumstances). In addition, the liabilities for service already rendered by active members (liability 3) is normally partially covered by the remainder of present assets. Generally, if the System has been using level-cost financing, the funded portion of liability 3 will increase over time. Liability 3 being fully funded is not necessarily a byproduct of level percent of payroll funding methods. The schedule below illustrates the history of the liabilities of the System and is indicative of the System's policy of following the discipline of level percent of payroll financing.
Pension Benefits($ in thousands)
Actuarial Accrued Liability (AAL)(1) (2) (3)
Active MembersValuation Active Retirants (Employer
Date Member and Financed Valuation Portion of AAL Covered by Assets
Sept. 30 Contributions Beneficiaries Portion) Assets (1) (2) (3) (4)1
2004 3,284$ 111,682$ 36,972$ 161,905$ 100 % 100 % 127 % 107 %2005 2,892 117,593 34,165 157,456 100 100 108 1022006 2,560 124,040 31,807 159,347 100 100 103 1012007 1,833 137,179 24,301 167,750 100 100 118 1032008 1,660 145,110 22,626 169,986 100 100 103 100
2009 1,483 149,132 20,826 165,810 100 100 73 972010 1,280 151,675 19,739 158,952 100 100 30 922011 659 171,022 10,165 149,940 100 87 0 822012 587 171,388 8,491 136,916 100 80 0 762013 500 172,877 7,532 134,932 100 78 0 75
1percents funded on a total valuation asset and total actuarial accrued liability basis

ACTUARIAL SECTION
MICHIGAN LEGISLATIVE RETIREMENT SYSTEM • 57
Prioritized Solvency Test (continued)
Other Postemployment Benefits($ in thousands)
Actuarial Accrued Liability (AAL)(1) (2) (3)
Active MembersValuation Active Retirants (Employer
Date Member and Financed Valuation Portion of AAL Covered by Assets
Sept. 30 Contributions Beneficiaries Portion) Assets (1) (2) (3) (4)1
2008 -$ 75,777$ 56,850$ 14,319$ 0 % 19 % 0 % 11 %2009 - 80,198 56,672 14,588 0 18 0 112010 - 86,786 68,473 15,886 0 18 0 102011 - 92,385 48,311 15,179 0 16 0 112012 - 98,511 46,650 20,825 0 21 0 142013 - 103,824 49,842 22,806 0 22 0 15
1percents funded on a total valuation asset and total actuarial accrued liability basis
ACTUARIAL SECTION
58 • MICHIGAN LEGISLATIVE RETIREMENT SYSTEM
Summary Of Plan Provisions Membership Legislators who first become legislators after March 30, 1997, will not be members of the Tier 1 defined benefit plan. This summary of benefits applies only to persons who first became legislators on or before March 30, 1997, and who did not elect to transfer to Tier 2, the defined contribution plan. Term Limits For terms of office beginning on or after January 1, 1993, no person shall be elected to the House of Representatives (House) more than three (3) times and no person shall be elected to the Senate more than two (2) times. With the exception of persons who fill vacancies for partial terms and persons who serve in both the House and the Senate, the normal service limits are: House - 6 years (three 2-year terms) Senate - 8 years (two 4-year terms) Regular Retirement Eligibility - At least age 50 with age plus service equal to or exceeding 70; or at least age 55 with 5 or more years service if seated either: a) 3 times in the House or b) 2 times in the Senate or c) 1 time in the House and 1 time in the Senate. Annual Amount - Persons who first became members on or before January 1, 1995: 20% of the highest salary earned for the first 5 years of service, plus 4% of highest salary for each of the next 11 years of service, plus 1% of highest salary for each additional year of service. Persons who first became members after January 1, 1995: 3% of highest salary for each year of service. Deferred Retirement (Vested Benefit) Eligibility - 5 or more years of service if seated either: a) 3 times in the House or b) 2 times in the Senate or c) 1 time in the House and 1 time in the Senate. Benefit begins at age 55 (as early as age 50 if age plus service equals or exceeds 70). Member may delay commencement of benefits to an age not greater than age 70-1/2. Annual Amount - Computed as regular retirement benefit based on service and highest salary at termination. For persons who first became members on or before January 1, 1995, the benefit is increased 4% annually (compounded) between termination of membership and the earlier of a) benefit commencement or b) age 55. Benefits delayed beyond age 55 are actuarially equivalent to the age 55 benefit. Disability Retirement Eligibility - Disability before becoming eligible to retire or during a benefit deferral period. Annual Amount - Computed as a regular retirement benefit based on service and highest salary at time of disability.
ACTUARIAL SECTION
MICHIGAN LEGISLATIVE RETIREMENT SYSTEM • 59
Summary Of Plan Provisions (continued) Death Benefit Eligibility - 5 or more years of service if seated either: a) 3 times in the House or b) 2 times in the Senate or c) 1 time in the House and 1 time in the Senate. Benefit is paid immediately. Annual Amount - Surviving spouse receives 66 2/3% of the retirement allowance earned as of the date of death of the member. If there are eligible dependent children in his or her care, the surviving spouse receives 75% of the retirement allowance earned as of the date of death until the children are no longer dependent, at which time 66-2/3% then becomes payable. Special conditions apply if there is no surviving spouse, or if the eligible children are not under the care of the surviving spouse. Post-Retirement Cost-of-Living Adjustments The annual retirement allowance payable to a retirant or survivor is increased by 4% per year, compounded annually (non-compounded for persons first becoming members after January 1, 1995), each January 1. Life Insurance Life insurance coverage is provided from the Insurance Revolving Fund for active members, retirants, and deferred vested members. Coverage varies from $2,500 to $150,000 depending on premium payments, board policy, and statutory provisions in place at deferral and/or retirement. Post-Retirement Health Insurance Hospital, medical, and dental insurance shall be provided from the Health Insurance Fund for retirants, deferred vested members who first became members on or before January 1, 1995, and their survivors, and to the spouses and eligible children of retirants and of deferred vested members who first became members on or before January 1, 1995. In addition, the System provides health insurance coverage to eligible former legislators who belong to the State's Defined Contribution Plan (Tier 2). Member Contributions For members who first became a member on or before January 1, 1995: 9% of annual salary to the Health Insurance Fund. For members who first became a member after January 1, 1995: 7% of annual salary to the Health Insurance Fund.

ACTUARIAL SECTION
60 • MICHIGAN LEGISLATIVE RETIREMENT SYSTEM
This page was intentionally left blank.
STATISTICAL SECTION
MICHIGAN LEGISLATIVE RETIREMENT SYSTEM • 61
Michigan Legislative Retirement System
Comprehensive Annual Financial Report for the Fiscal Year Ended September 30, 2014
STATISTICAL SECTION
Schedule of Revenue by Source Schedule of Expenses by Type
Schedule of Benefit Expenses by Type Actuarial Value of Assets compared to Actuarial Accrued Liability-Pension Plan
Schedules of Changes in Net Position Schedules of Benefit and Refund Deductions from Net Position by Type
Schedule of Retired Members by Type of Benefit – Pension Plan Schedule of Funding Progress – Pension Plan
Schedule of Average Benefit Payments – Pension Plan
STATISTICAL SECTION
62 • MICHIGAN LEGISLATIVE RETIREMENT SYSTEM
Narrative Explanation to Statistical Section
The intention of this narrative description is to explain the System’s financial and operating trends of the schedules in the statistical section. It is important that this section be written clearly and accurately to help improve the understandability and usefulness of the statistical information. The statistical section contains the following schedules:
Schedule of Revenue By Source - Pension Plan and Other Postemployment Benefit Plan (OPEB)
Schedule of Expenses By Type - Pension Plan and OPEB
Schedule of Benefit Expenses By Type - Pension Plan and OPEB
Schedule of Changes in Net Position - Pension Plan
Schedule of Changes in Net Position - OPEB
Schedule of Benefit and Refund Deductions from Net Position by Type – Pension Plan
Schedule of Benefit and Refund Deductions from Net Position by Type – OPEB
These schedules are a ten (10) year comparison of the Statement of Changes in Pension Plan and Postemployment Benefits Fiduciary Net Position found in the Financial Section of this report. This is to provide a longer time period for reference and show possible trends.
Actuarial Value of Pension Plan Assets compared to Actuarial Accrued Pension Plan Liability
This is to show the trend of the actuarial value of assets compared to the actuarial accrued liability for the pension plan.
Schedule of Retired Members by Type of Benefit – Pension Plan
This schedule is to show the average amount of retirement pension benefits. It is broken out by amount and type of retirement to show possible trends in types of retirement. And to show the average pension amounts by types. The data is compiled by the actuary.
Schedule of Funding Progress – Pension Plan
This schedule is to show the System funding status on a going-concern basis. Analysis of this percentage over time indicates whether the system is becoming financially stronger or weaker. This schedule was in the financial section, but was replaced by the Net Pension Liability for the pension plan.
Schedule of Average Benefit Payments – Pension Plan
This schedule is to show the average amount of retirement pension benefits by years of service. The data is compiled by the actuary.
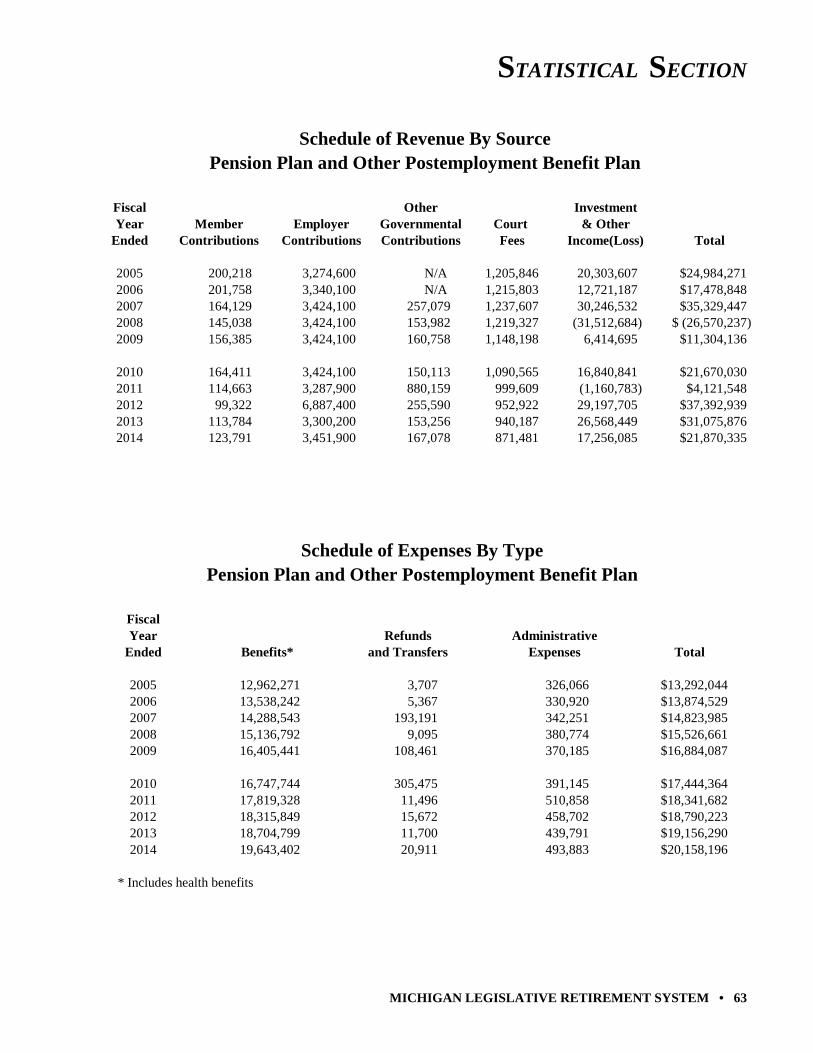
STATISTICAL SECTION
MICHIGAN LEGISLATIVE RETIREMENT SYSTEM • 63
Schedule of Revenue By SourcePension Plan and Other Postemployment Benefit Plan
Fiscal Other InvestmentYear Member Employer Governmental Court & Other
Ended Contributions Contributions Contributions Fees Income(Loss) Total
2005 200,218 3,274,600 N/A 1,205,846 20,303,607 $24,984,2712006 201,758 3,340,100 N/A 1,215,803 12,721,187 $17,478,8482007 164,129 3,424,100 257,079 1,237,607 30,246,532 $35,329,4472008 145,038 3,424,100 153,982 1,219,327 (31,512,684) $ (26,570,237)2009 156,385 3,424,100 160,758 1,148,198 6,414,695 $11,304,136
2010 164,411 3,424,100 150,113 1,090,565 16,840,841 $21,670,0302011 114,663 3,287,900 880,159 999,609 (1,160,783) $4,121,5482012 99,322 6,887,400 255,590 952,922 29,197,705 $37,392,9392013 113,784 3,300,200 153,256 940,187 26,568,449 $31,075,8762014 123,791 3,451,900 167,078 871,481 17,256,085 $21,870,335
Schedule of Expenses By TypePension Plan and Other Postemployment Benefit Plan
FiscalYear Refunds Administrative
Ended Benefits* and Transfers Expenses Total
2005 12,962,271 3,707 326,066 $13,292,0442006 13,538,242 5,367 330,920 $13,874,5292007 14,288,543 193,191 342,251 $14,823,9852008 15,136,792 9,095 380,774 $15,526,6612009 16,405,441 108,461 370,185 $16,884,087
2010 16,747,744 305,475 391,145 $17,444,3642011 17,819,328 11,496 510,858 $18,341,6822012 18,315,849 15,672 458,702 $18,790,2232013 18,704,799 11,700 439,791 $19,156,2902014 19,643,402 20,911 493,883 $20,158,196
* Includes health benefits
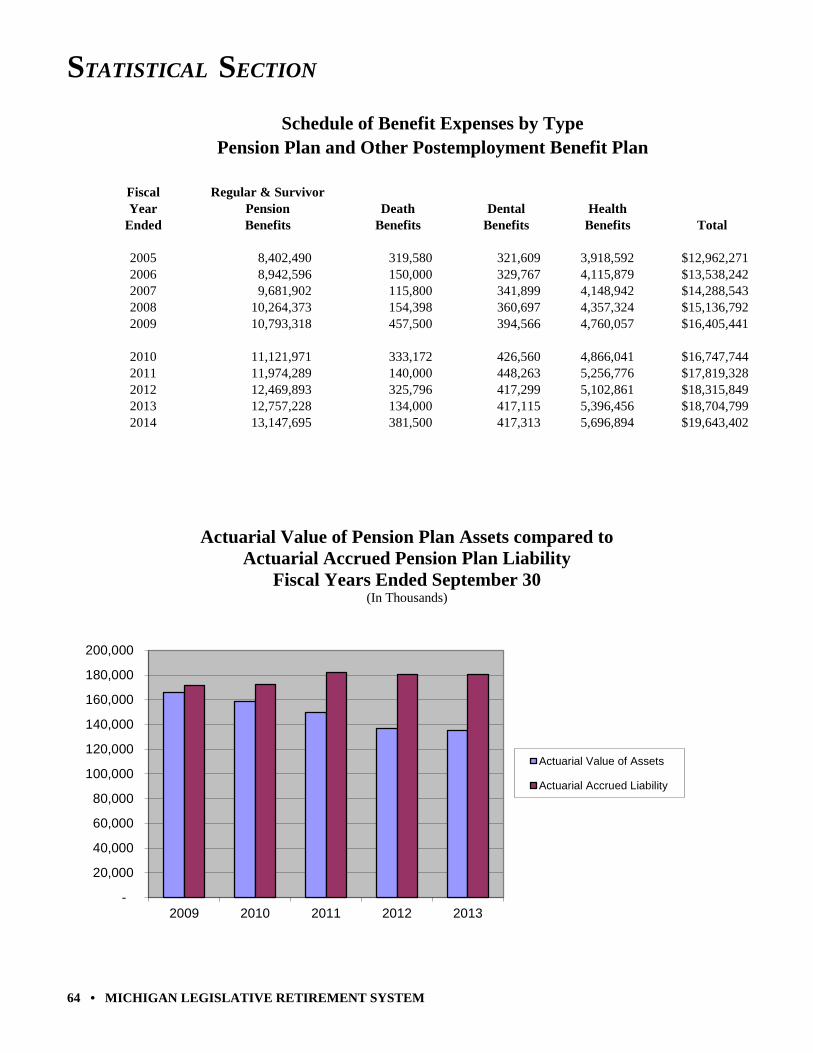
STATISTICAL SECTION
64 • MICHIGAN LEGISLATIVE RETIREMENT SYSTEM
Schedule of Benefit Expenses by TypePension Plan and Other Postemployment Benefit Plan
Fiscal Regular & SurvivorYear Pension Death Dental Health
Ended Benefits Benefits Benefits Benefits Total
2005 8,402,490 319,580 321,609 3,918,592 $12,962,2712006 8,942,596 150,000 329,767 4,115,879 $13,538,2422007 9,681,902 115,800 341,899 4,148,942 $14,288,5432008 10,264,373 154,398 360,697 4,357,324 $15,136,7922009 10,793,318 457,500 394,566 4,760,057 $16,405,441
2010 11,121,971 333,172 426,560 4,866,041 $16,747,7442011 11,974,289 140,000 448,263 5,256,776 $17,819,3282012 12,469,893 325,796 417,299 5,102,861 $18,315,8492013 12,757,228 134,000 417,115 5,396,456 $18,704,7992014 13,147,695 381,500 417,313 5,696,894 $19,643,402
Actuarial Value of Pension Plan Assets compared to Actuarial Accrued Pension Plan Liability
Fiscal Years Ended September 30 (In Thousands)
-
20,000
40,000
60,000
80,000
100,000
120,000
140,000
160,000
180,000
200,000
2009 2010 2011 2012 2013
Actuarial Value of Assets
Actuarial Accrued Liability
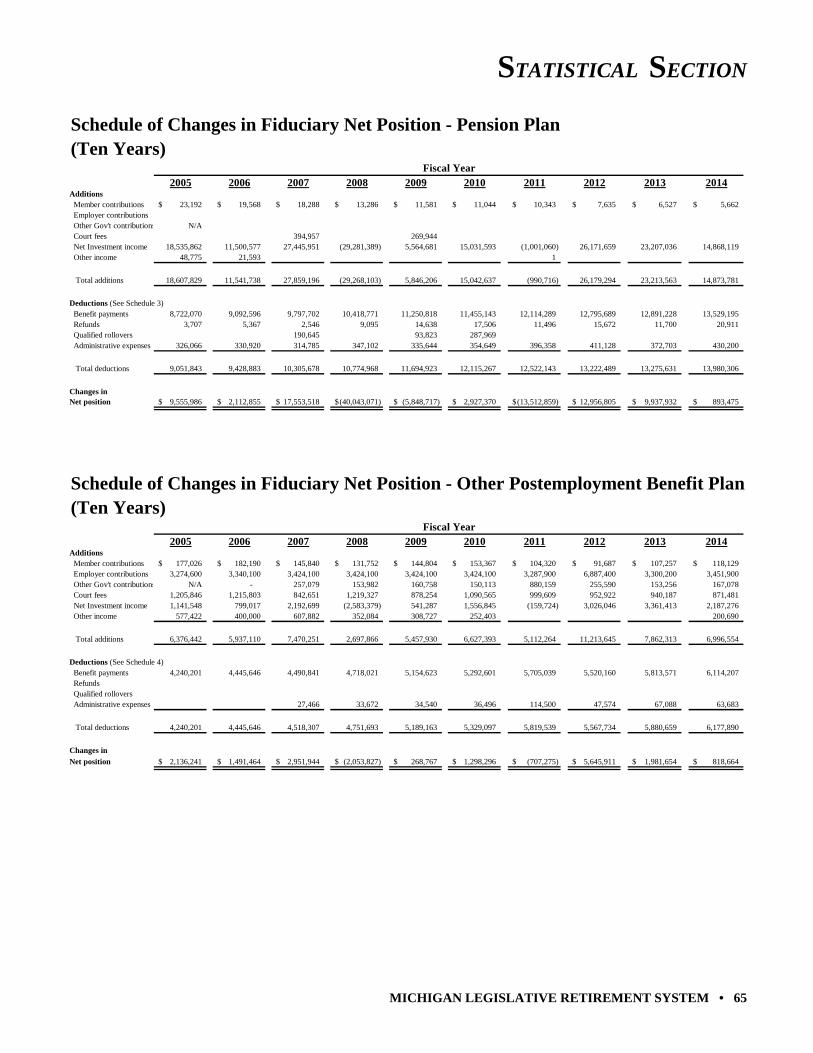
STATISTICAL SECTION
MICHIGAN LEGISLATIVE RETIREMENT SYSTEM • 65
Schedule of Changes in Fiduciary Net Position - Pension Plan(Ten Years)
Fiscal Year2005 2006 2007 2008 2009 2010 2011 2012 2013 2014
Additions Member contributions 23,192$ 19,568$ 18,288$ 13,286$ 11,581$ 11,044$ 10,343$ 7,635$ 6,527$ 5,662$ Employer contributions Other Gov't contributions N/A Court fees 394,957 269,944 Net Investment income 18,535,862 11,500,577 27,445,951 (29,281,389) 5,564,681 15,031,593 (1,001,060) 26,171,659 23,207,036 14,868,119 Other income 48,775 21,593 1
Total additions 18,607,829 11,541,738 27,859,196 (29,268,103) 5,846,206 15,042,637 (990,716) 26,179,294 23,213,563 14,873,781
Deductions (See Schedule 3) Benefit payments 8,722,070 9,092,596 9,797,702 10,418,771 11,250,818 11,455,143 12,114,289 12,795,689 12,891,228 13,529,195 Refunds 3,707 5,367 2,546 9,095 14,638 17,506 11,496 15,672 11,700 20,911 Qualified rollovers 190,645 93,823 287,969 Administrative expenses 326,066 330,920 314,785 347,102 335,644 354,649 396,358 411,128 372,703 430,200
Total deductions 9,051,843 9,428,883 10,305,678 10,774,968 11,694,923 12,115,267 12,522,143 13,222,489 13,275,631 13,980,306
Changes inNet position 9,555,986$ 2,112,855$ 17,553,518$ (40,043,071)$ (5,848,717)$ 2,927,370$ (13,512,859)$ 12,956,805$ 9,937,932$ 893,475$
Schedule of Changes in Fiduciary Net Position - Other Postemployment Benefit Plan(Ten Years)
Fiscal Year2005 2006 2007 2008 2009 2010 2011 2012 2013 2014
Additions Member contributions 177,026$ 182,190$ 145,840$ 131,752$ 144,804$ 153,367$ 104,320$ 91,687$ 107,257$ 118,129$ Employer contributions 3,274,600 3,340,100 3,424,100 3,424,100 3,424,100 3,424,100 3,287,900 6,887,400 3,300,200 3,451,900 Other Gov't contributions N/A - 257,079 153,982 160,758 150,113 880,159 255,590 153,256 167,078 Court fees 1,205,846 1,215,803 842,651 1,219,327 878,254 1,090,565 999,609 952,922 940,187 871,481 Net Investment income 1,141,548 799,017 2,192,699 (2,583,379) 541,287 1,556,845 (159,724) 3,026,046 3,361,413 2,187,276 Other income 577,422 400,000 607,882 352,084 308,727 252,403 200,690
Total additions 6,376,442 5,937,110 7,470,251 2,697,866 5,457,930 6,627,393 5,112,264 11,213,645 7,862,313 6,996,554
Deductions (See Schedule 4) Benefit payments 4,240,201 4,445,646 4,490,841 4,718,021 5,154,623 5,292,601 5,705,039 5,520,160 5,813,571 6,114,207 Refunds Qualified rollovers Administrative expenses 27,466 33,672 34,540 36,496 114,500 47,574 67,088 63,683
Total deductions 4,240,201 4,445,646 4,518,307 4,751,693 5,189,163 5,329,097 5,819,539 5,567,734 5,880,659 6,177,890
Changes in
Net position 2,136,241$ 1,491,464$ 2,951,944$ (2,053,827)$ 268,767$ 1,298,296$ (707,275)$ 5,645,911$ 1,981,654$ 818,664$
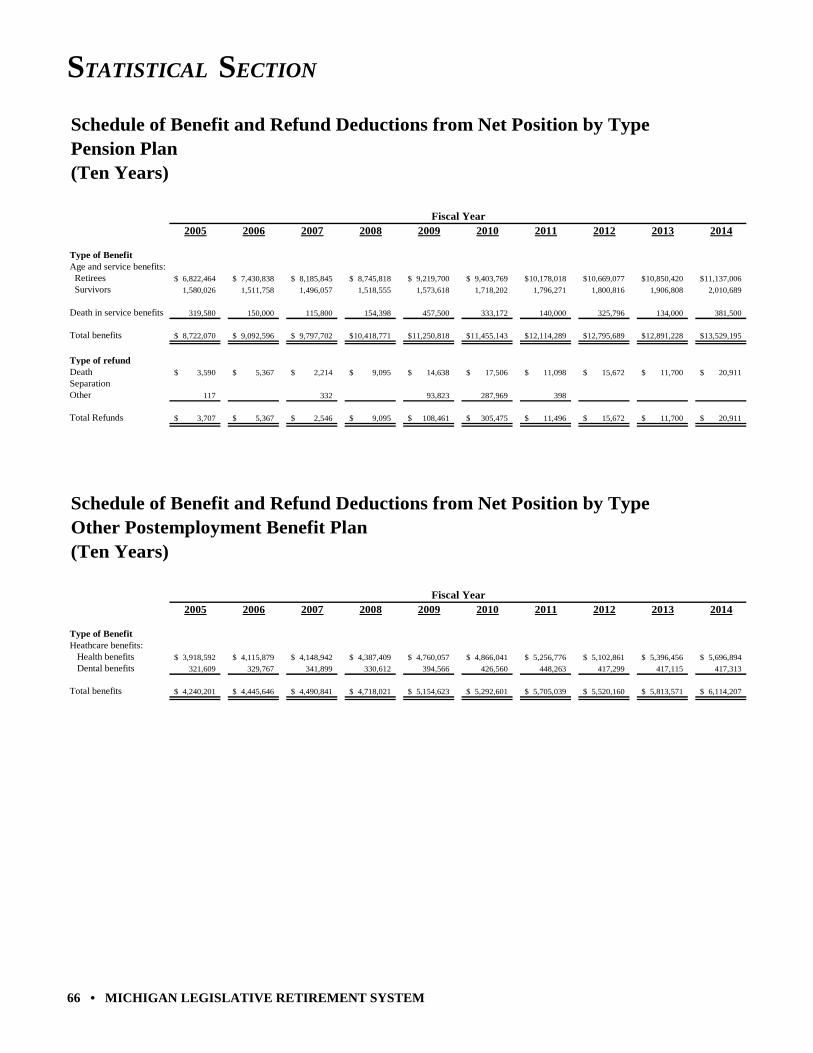
STATISTICAL SECTION
66 • MICHIGAN LEGISLATIVE RETIREMENT SYSTEM
Schedule of Benefit and Refund Deductions from Net Position by TypePension Plan(Ten Years)
Fiscal Year2005 2006 2007 2008 2009 2010 2011 2012 2013 2014
Type of BenefitAge and service benefits: Retirees 6,822,464$ 7,430,838$ 8,185,845$ 8,745,818$ 9,219,700$ 9,403,769$ 10,178,018$ 10,669,077$ 10,850,420$ 11,137,006$
Survivors 1,580,026 1,511,758 1,496,057 1,518,555 1,573,618 1,718,202 1,796,271 1,800,816 1,906,808 2,010,689
Death in service benefits 319,580 150,000 115,800 154,398 457,500 333,172 140,000 325,796 134,000 381,500
Total benefits 8,722,070$ 9,092,596$ 9,797,702$ 10,418,771$ 11,250,818$ 11,455,143$ 12,114,289$ 12,795,689$ 12,891,228$ 13,529,195$
Type of refundDeath 3,590$ 5,367$ 2,214$ 9,095$ 14,638$ 17,506$ 11,098$ 15,672$ 11,700$ 20,911$
SeparationOther 117 332 93,823 287,969 398
Total Refunds 3,707$ 5,367$ 2,546$ 9,095$ 108,461$ 305,475$ 11,496$ 15,672$ 11,700$ 20,911$
Schedule of Benefit and Refund Deductions from Net Position by TypeOther Postemployment Benefit Plan(Ten Years)
Fiscal Year2005 2006 2007 2008 2009 2010 2011 2012 2013 2014
Type of BenefitHeathcare benefits: Health benefits 3,918,592$ 4,115,879$ 4,148,942$ 4,387,409$ 4,760,057$ 4,866,041$ 5,256,776$ 5,102,861$ 5,396,456$ 5,696,894$
Dental benefits 321,609 329,767 341,899 330,612 394,566 426,560 448,263 417,299 417,115 417,313
Total benefits 4,240,201$ 4,445,646$ 4,490,841$ 4,718,021$ 5,154,623$ 5,292,601$ 5,705,039$ 5,520,160$ 5,813,571$ 6,114,207$
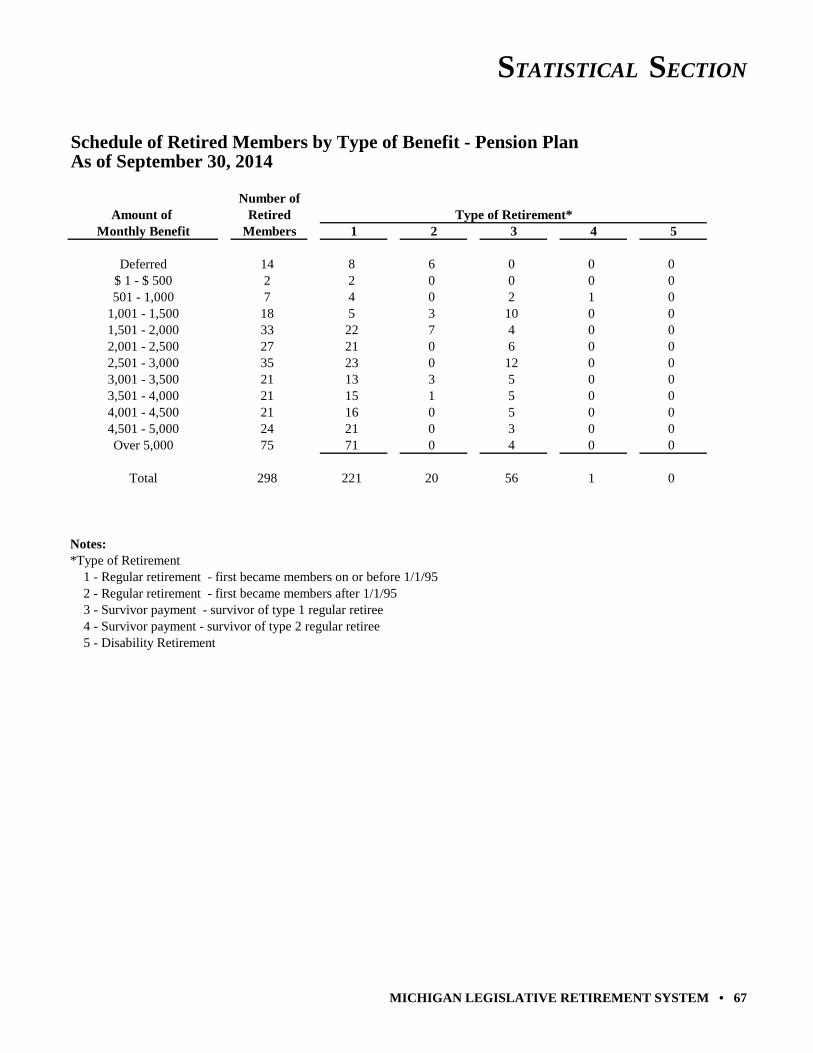
STATISTICAL SECTION
MICHIGAN LEGISLATIVE RETIREMENT SYSTEM • 67
Schedule of Retired Members by Type of Benefit - Pension PlanAs of September 30, 2014
Number ofAmount of Retired Type of Retirement*
Monthly Benefit Members 1 2 3 4 5
Deferred 14 8 6 0 0 0$ 1 - $ 500 2 2 0 0 0 0501 - 1,000 7 4 0 2 1 0
1,001 - 1,500 18 5 3 10 0 01,501 - 2,000 33 22 7 4 0 02,001 - 2,500 27 21 0 6 0 02,501 - 3,000 35 23 0 12 0 03,001 - 3,500 21 13 3 5 0 03,501 - 4,000 21 15 1 5 0 04,001 - 4,500 21 16 0 5 0 04,501 - 5,000 24 21 0 3 0 0Over 5,000 75 71 0 4 0 0
Total 298 221 20 56 1 0
Notes:*Type of Retirement 1 - Regular retirement - first became members on or before 1/1/95 2 - Regular retirement - first became members after 1/1/95 3 - Survivor payment - survivor of type 1 regular retiree 4 - Survivor payment - survivor of type 2 regular retiree 5 - Disability Retirement
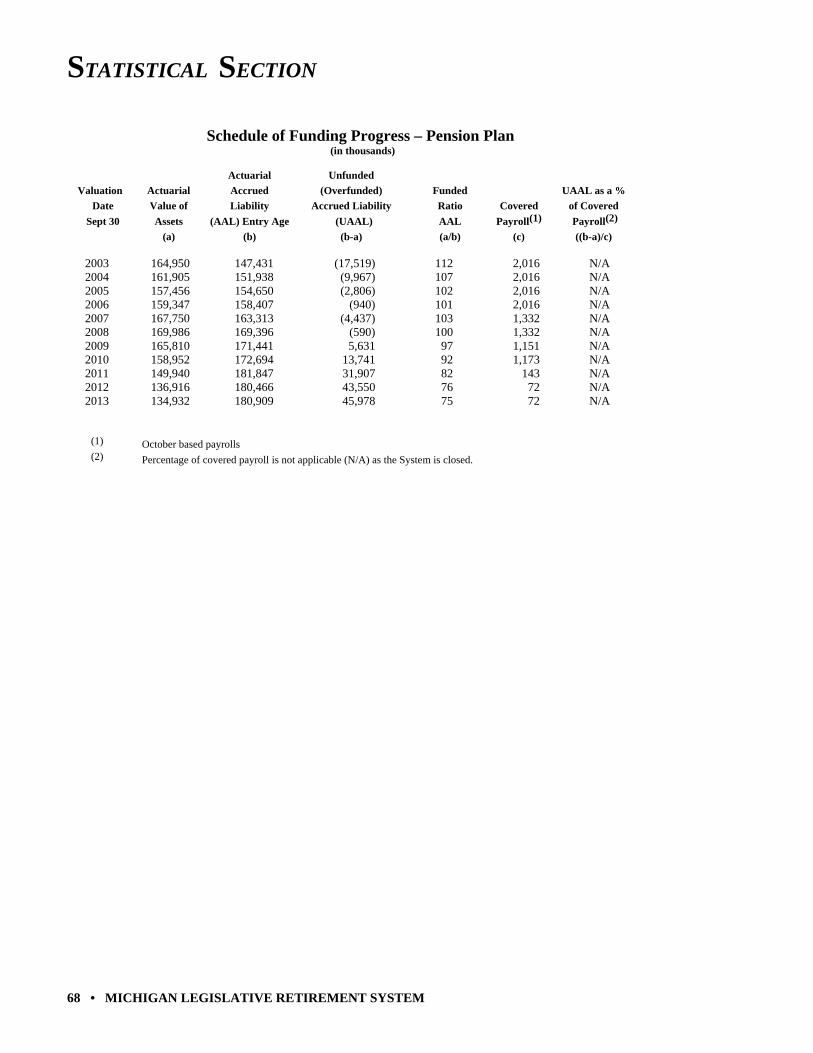
STATISTICAL SECTION
68 • MICHIGAN LEGISLATIVE RETIREMENT SYSTEM
Schedule of Funding Progress – Pension Plan (in thousands)
Actuarial Unfunded
Valuation Actuarial Accrued (Overfunded) Funded UAAL as a %
Date Value of Liability Accrued Liability Ratio Covered of Covered
Sept 30 Assets (AAL) Entry Age (UAAL) AAL Payroll(1) Payroll(2)
(a) (b) (b-a) (a/b) (c) ((b-a)/c) 2003 164,950 147,431 (17,519) 112 2,016 N/A 2004 161,905 151,938 (9,967) 107 2,016 N/A 2005 157,456 154,650 (2,806) 102 2,016 N/A 2006 159,347 158,407 (940) 101 2,016 N/A 2007 167,750 163,313 (4,437) 103 1,332 N/A 2008 169,986 169,396 (590) 100 1,332 N/A 2009 165,810 171,441 5,631 97 1,151 N/A 2010 158,952 172,694 13,741 92 1,173 N/A 2011 149,940 181,847 31,907 82 143 N/A 2012 136,916 180,466 43,550 76 72 N/A 2013 134,932 180,909 45,978 75 72 N/A
(1) October based payrolls
(2) Percentage of covered payroll is not applicable (N/A) as the System is closed.
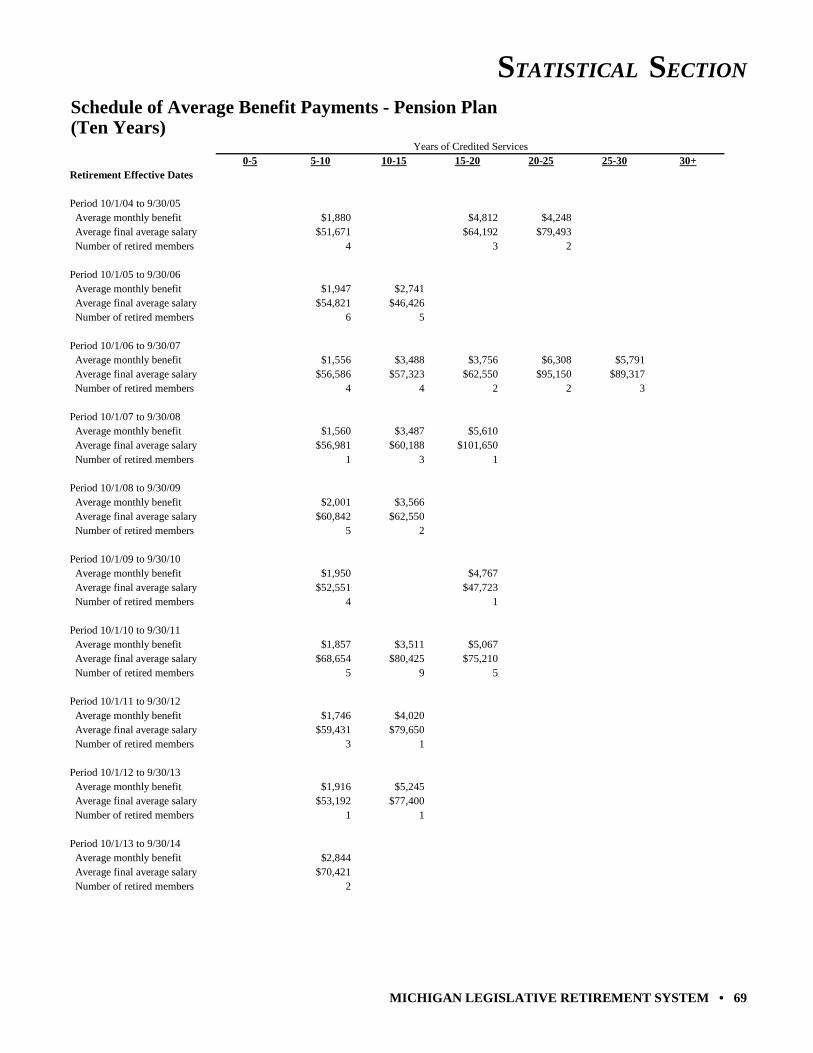
STATISTICAL SECTION
MICHIGAN LEGISLATIVE RETIREMENT SYSTEM • 69
Schedule of Average Benefit Payments - Pension Plan(Ten Years)
Years of Credited Services0-5 5-10 10-15 15-20 20-25 25-30 30+
Retirement Effective Dates
Period 10/1/04 to 9/30/05 Average monthly benefit $1,880 $4,812 $4,248 Average final average salary $51,671 $64,192 $79,493 Number of retired members 4 3 2
Period 10/1/05 to 9/30/06 Average monthly benefit $1,947 $2,741 Average final average salary $54,821 $46,426 Number of retired members 6 5
Period 10/1/06 to 9/30/07 Average monthly benefit $1,556 $3,488 $3,756 $6,308 $5,791 Average final average salary $56,586 $57,323 $62,550 $95,150 $89,317 Number of retired members 4 4 2 2 3
Period 10/1/07 to 9/30/08 Average monthly benefit $1,560 $3,487 $5,610 Average final average salary $56,981 $60,188 $101,650 Number of retired members 1 3 1
Period 10/1/08 to 9/30/09 Average monthly benefit $2,001 $3,566 Average final average salary $60,842 $62,550 Number of retired members 5 2
Period 10/1/09 to 9/30/10 Average monthly benefit $1,950 $4,767 Average final average salary $52,551 $47,723 Number of retired members 4 1
Period 10/1/10 to 9/30/11 Average monthly benefit $1,857 $3,511 $5,067 Average final average salary $68,654 $80,425 $75,210 Number of retired members 5 9 5
Period 10/1/11 to 9/30/12 Average monthly benefit $1,746 $4,020 Average final average salary $59,431 $79,650 Number of retired members 3 1
Period 10/1/12 to 9/30/13 Average monthly benefit $1,916 $5,245 Average final average salary $53,192 $77,400 Number of retired members 1 1
Period 10/1/13 to 9/30/14 Average monthly benefit $2,844 Average final average salary $70,421 Number of retired members 2