michigan public school employees’ retirement system€¦ · michigan public school employees’...
TRANSCRIPT

MICHIGAN PUBLIC SCHOOL EMPLOYEES’ RETIREMENT SYSTEM • 1
Michigan Public School Employees’ Retirement System a Pension Trust Fund of the State of Michigan
Comprehensive Annual Financial Report for the Fiscal Year Ended September 30, 2007
M P S E R S
Prepared by:
Financial Services For
Office of Retirement Services P.O. Box 30171
Lansing, Michigan 48909-7671 517-322-5103
1-800-381-5111

2 • MICHIGAN PUBLIC SCHOOL EMPLOYEES’ RETIREMENT SYSTEM
Table of Contents Introductory Section
Certificate of Achievement....................................................................................................................................... 4 Public Pension Standards Award.............................................................................................................................. 5 Letter of Transmittal................................................................................................................................................. 6 Retirement Board Members ................................................................................................................................. 12 Advisors and Consultants ...................................................................................................................................... 12 Organization Chart ............................................................................................................................................... 13
Financial Section
Independent Auditor’s Report ................................................................................................................................ 16 Management’s Discussion and Analysis ................................................................................................................ 18 Basic Financial Statements Statements of Pension Plan and Other Postemployment Plan Net Assets ......................................................... 24 Statements of Changes in Pension Plan and Other Postemployment Plan Net Assets ...................................... 25 Notes to Basic Financial Statements ................................................................................................................. 26 Required Supplementary Information Schedules of Funding Progress.......................................................................................................................... 46 Schedules of Employer and Other Contributions .............................................................................................. 47 Notes to Required Supplementary Information...................................................................................................... 48 Supporting Schedules ............................................................................................................................................. 49
Investment Section
Report on Investment Activity ............................................................................................................................... 58 Asset Allocation ..................................................................................................................................................... 75 Investment Results ................................................................................................................................................. 75 List of Largest Stock Holdings............................................................................................................................... 76 List of Largest Bond Holdings .............................................................................................................................. 76 Schedule of Investment Fees ................................................................................................................................. 77 Schedule of Investment Commissions.................................................................................................................... 78 Investment Summary.............................................................................................................................................. 79
Actuarial Section
Actuary’s Certification ........................................................................................................................................... 82 Summary of Actuarial Assumptions and Methods................................................................................................. 84 Schedule of Active Member Valuation Data.......................................................................................................... 86 Schedule of Changes in the Retirement Rolls ........................................................................................................ 86 Prioritized Solvency Test ....................................................................................................................................... 87 Analysis of System Experience .............................................................................................................................. 88 Summary of Plan Provisions ................................................................................................................................. 89
Statistical Section
Schedules of Revenues by Source .......................................................................................................................... 95 Schedules of Expenses by Type ............................................................................................................................. 96 Schedules of Changes in Net Assets....................................................................................................................... 97 Schedules of Benefits and Refunds by Type .......................................................................................................... 98 Schedules of Retired Members by Type of Benefit................................................................................................ 99 Schedule of Health Benefits ................................................................................................................................. 101 Schedules of Average Benefit Payments.............................................................................................................. 102 Schedule of Principal Participating Employers .................................................................................................... 104 Ten Year History of Membership......................................................................................................................... 105 Schedule of Participating Employers ................................................................................................................... 106
Acknowledgments ........................................................................................................................................................ 114

MICHIGAN PUBLIC SCHOOL EMPLOYEES’ RETIREMENT SYSTEM • 3
INTRODUCTORY SECTION
Certificate of Achievement Public Pension Standards Award
Letter of Transmittal Retirement Board Members
Advisors and Consultants Organization Chart

INTRODUCTORY SECTION
4 • MICHIGAN PUBLIC SCHOOL EMPLOYEES’ RETIREMENT SYSTEM
Certificate of Achievement

INTRODUCTORY SECTION
MICHIGAN PUBLIC SCHOOL EMPLOYEES’ RETIREMENT SYSTEM • 5
Public Pension Standards Award
P CP C Public Pension Coordinating Council
Public Pension Standards 2007 Award
Presented to
Michigan Office of Retirement Services
In recognition of meeting professional standards for plan design and administration as
set forth in the Public Pension Standards.
Presented by the Public Pension Coordinating Council, a confederation of
National Association of State Retirement Administrators (NASRA) National Conference on Public Employee Retirement Systems (NCPERS)
National Council on Teacher Retirement (NCTR)
Alan H. Winkle
Program Administrator

INTRODUCTORY SECTION
6 • MICHIGAN PUBLIC SCHOOL EMPLOYEES’ RETIREMENT SYSTEM
Letter of Transmittal Michigan Public School Employees’ Retirement System P.O. Box 30171 Lansing, Michigan 48909-7671 Telephone 517- 322-5103 Outside Lansing 1-800-381-5111
STATE OF MICHIGAN
JENNIFER M. GRANHOLM, Governor
DEPARTMENT OF MANAGEMENT AND BUDGET
December 14, 2007 The Honorable Jennifer M. Granholm Governor, State of Michigan, Members of the Legislature State of Michigan, Retirement Board Members and Members, Retirees and Beneficiaries Ladies and Gentlemen: We are pleased to present the comprehensive annual financial report of the Michigan Public School Employees’ Retirement System (System) for fiscal year 2007. INTRODUCTION TO REPORT The System was established by legislation under Public Act 136 of 1945, and is administered by the Office of Retirement Services (ORS). The number of active and retired members and beneficiaries of the System is presented in Note 1 of the financial statements in the Financial Section of this report. The purpose of the System is to provide benefits for all public school employees. The services performed by the staff provide benefits to members. Responsibility Responsibility for both the accuracy of the data and the completeness and fairness of the presentation, including all disclosures, rests with the leadership team of the System. To the best of our knowledge and belief, the enclosed data is accurate in all material respects and is reported in a manner designed to present fairly the financial position and results of operations of the System. Internal Control Structure The leadership team of the System is responsible for maintaining adequate internal accounting controls designed to provide reasonable assurance that transactions are executed in accordance with management’s general or specific authorization, and are recorded as necessary to maintain accountability for assets and to permit preparation of financial statements in accordance with accounting principles generally accepted in the United States of America. The internal control structure is designed to provide reasonable assurance regarding the safekeeping of assets and reliability of all financial records.

INTRODUCTORY SECTION
MICHIGAN PUBLIC SCHOOL EMPLOYEES’ RETIREMENT SYSTEM • 7
Letter of Transmittal (Continued) Independent Auditors Andrews Hooper & Pavlik P.L.C., independent auditors, conducted an annual audit of the System. The independent auditor’s report on the System’s financial statements is included in the Financial Section of this report. Statute requires that an annual actuarial valuation be conducted. The purpose of the valuation is to evaluate the mortality, service, compensation and other financial experience of the System and to recommend employer-funding rates for the subsequent year. This annual actuarial valuation was completed by Gabriel Roeder Smith & Company for the fiscal year ended September 30, 2006. Actuarial certification and supporting statistics are included in the Actuarial Section of this report. Management’s Discussion and Analysis (MD&A) Generally Accepted Accounting Principles (GAAP) requires that management provide a narrative introduction, overview, and analysis to accompany the Basic Financial Statements in the form of MD&A. This letter of transmittal is intended to complement MD&A and should be read in conjunction with it. The MD&A can be found immediately following the Independent Auditor’s Report. PROFILE OF THE GOVERNMENT In accordance with Public Act 300 of 1980, on October 31, 1980, the Public School Employees’ Chapter I Retirement Fund merged with the Public School Employees’ Chapter II Retirement Fund to establish the Public School Employees’ Retirement System. Public Acts 136 of 1945 and 259 of 1974, respectively, created the two original funds. A twelve-member board governs administrative policy. Employer contributions and investment earnings provide financing for the System. Under Public Act 91 of 1985, employees may contribute additional amounts into a “member investment plan.” ECONOMIC CONDITIONS AND OUTLOOK Despite challenging economic times, the System continues to show strong performance. Investments The State Treasurer is the investment fiduciary and custodian of all investments of the System pursuant to State law. The primary investment objective is to maximize the rate of return on the total investment portfolio, consistent with a high degree of prudence and sufficient diversity to eliminate inordinate risks and to meet the actuarial assumption for the investment return rate. The investment activity for the year produced a total rate of return on the portfolio of 17.2%. For the last five years, the System has experienced an annualized rate of return of 14.0%. A summary of asset allocation and rates of return can be found in the Investment Section of this report. Accounting System Transactions of the System are reported on the accrual basis of accounting. Revenues are recorded when earned, and expenses are recorded when incurred. Participants’ benefits are recorded when payable by law. We believe that the accounting and administrative internal controls established by the System provide reasonable assurance the System is carrying out its responsibilities in safeguarding its assets, in maintaining the reliability of the financial records for preparing financial statements, and in maintaining accountability for its assets. Funding Funds are derived from the excess of additions to plan net assets over deductions from plan net assets. Funds are accumulated by the System in order to meet future benefit obligations to retirees and beneficiaries. The percentage computed by dividing the actuarial value of assets by the actuarial accrued liability is referred to as the “funded ratio.” This ratio provides an indication of the funding status of the System and generally, the greater this percentage, the
INTRODUCTORY SECTION
8 • MICHIGAN PUBLIC SCHOOL EMPLOYEES’ RETIREMENT SYSTEM
Letter of Transmittal (Continued) stronger the System. Effective in fiscal year 2001, the System used the valuation from the previous fiscal year for this report. This approach is consistent with Governmental Accounting Standards Board (GASB) Statement No. 25. Consistent with this approach, the most recent actuarial valuation was performed as of September 30, 2006. The actuarial value of the assets and actuarial accrued liability were $43.0 billion and $49.1 billion, respectively, resulting in a funded ratio of 87.5% at September 30, 2006. A historical perspective of funding levels for the System is presented on the Schedule of Funding Progress in the Required Supplementary Information in the Financial Section of this report. Postemployment Benefits In fiscal year 2007 the System implemented Governmental Accounting Standards Board (GASB) Statement No. 43, Financial Reporting for Postemployment Benefit Plans Other Than Pension Plans. A GASB 43 compliant actuarial valuation was completed as of September 30, 2006, to determine the actuarial accrued liability if the postemployment benefits were to be pre-funded. If these benefits were pre-funded, the actuarial accrued liability would be $25.4 billion. Statement No. 43 does not require retroactive application of the reporting changes. Therefore, in this year of transition, only one valuation year is presented and is included in the required supplementary information of this report. MAJOR GOALS ACCOMPLISHED The Michigan Department of Management and Budget, Office of Retirement Services (ORS) is a customer focused organization that serves its members and employees today and prepares them for tomorrow. Progress in fiscal year 2007 has allowed us to do so better than ever before – we are providing better and faster service to customers, we reengineered our processes, and have nearly completed our “Vision ORS” technology project. Below are some of the highlights. Focus on Our Customer Webinars - We began using webinar technology to provide information to employers and members. The sessions are recorded so they can be viewed again at any time. The pilot project—How to Complete a Final Salary Affidavit for employers—met with such an overwhelmingly positive response (100 percent indicated an increased understanding; 98 percent liked the webinar format), we immediately moved forward with webinars for employers and plan to expand our offerings for both member and employer audiences. Webinars require 2/3 less staff time to produce compared to face-to-face seminars, and they eliminate travel costs and the associated safety risks. Our customers, both members and employers, are also able to benefit from the elimination of travel costs and inconvenience since they are able to participate in the webinars from their own home or office. Pension payroll system - We deployed a new system that permits daily payroll runs; customers no longer have to wait for a monthly run to receive a refund, adjustment, or first pension payment. It also relieves bottlenecks in workload processing caused by trying to meet monthly deadlines. Customer self-service - This project will allow active members and retirees to access account information and perform transactions via a secure website. In order to get to this point, subject matter experts gathered requirements to create bid documents for vendors. The planning sessions dove deep into the inner workings of our retirement administration system to finalize exactly what we wanted our members to do online and how they would go about doing it. Preretirement meetings - We offered 108 meetings to those nearing retirement eligibility, with 7,094 in attendance. Those who attended one of these meetings could schedule a personalized telephone appointment to address any specific questions or concerns they might have before retiring. Customer contact - Most of our customers still view the telephone as their primary means of communicating; this year our representatives answered 225,611 calls. A growing number of customers have found email correspondence better meets their busy lifestyles as demonstrated by the 19,099 pieces of correspondence we responded to this year. Our staff also provided face-to-face interaction with 8,206 individuals who visited our office. Payroll Advisory Team - ORS convened a Payroll Advisory Team that meets quarterly to address needs and priorities of our public school employers. The team of 16 is made up of reporting unit payroll staff, software vendors, Michigan School

INTRODUCTORY SECTION
MICHIGAN PUBLIC SCHOOL EMPLOYEES’ RETIREMENT SYSTEM • 9
Letter of Transmittal (Continued) Business Officials, and ORS staff. Already we have seen benefits. As a result of the team’s suggestions we have expanded online system availability to employers and improved our tax deferred payment agreement process. Employer resources consolidated - ORS completely overhauled reference materials school personnel need to report employee information. All the employer publications were consolidated into a single comprehensive, user-friendly Reporting Instruction Manual (RIM) that can be accessed online from the redesigned employer website. Improved search capabilities and embedded hyperlinks make it easy for employers to navigate the new RIM and locate the specific information they need. Continuously Improve Processes Reengineering - To ensure we are making the most of our new technology tools, we reengineered 77 processes within the organization. This effort identified efficiencies, and found many ways to improve the speed and quality of services to our customers. We have expanded this reengineering to other administrations within the State’s Department of Management and Budget. Medicare Advantage - Working with Blue Cross Blue Shield of Michigan (BCBSM), ORS combined its supplemental hospital, medical, and drug coverage with Medicare Parts A and B into a Medicare Advantage plan for its public school retirees. Medicare pays the retirement system a set amount each month to cover the cost of each member’s claims and administrative services. Savings result from the system providing high quality care and services at a cost that is less than the amount Medicare pays. Estimated savings for fiscal year 2007 are $45 million. Administrative efficiencies benefit both the system and the customer. Combining BCBSM and Medicare coverage into Medicare Advantage eliminates redundant administrative services between the two carriers, and members only need one ID card, one benefits handbook, one explanation of benefits statement per service, and one customer service center to contact. The plan also has the potential to improve the quality of care, leading to better health outcomes and cost savings. File imaging - ORS is reaching “paperless” status: nearly all of our old paper files have now been scanned into electronic images. In 2007, we imaged 63,643 member files, 551,808 paper documents, and 254,630 microfiche documents so that staff can quickly access the files with a few clicks of a mouse rather than waiting for a paper file to be delivered. By dismantling and eliminating the need for our paper files prior to the office renovation we will save $7,040 in fiscal year 2007. Promote a Positive Work Environment Strategic planning - ORS engaged an all-inclusive approach to strategic planning. The entire staff participated in a group session to identify business issues of importance. Volunteer work groups also worked together to craft the seven strategic goals that will direct ORS for the next three-five years. All-Staff meetings - ORS hosted two meetings to honor the hard work and dedication of its staff and to deliver direct, relevant business news. The first meeting included our annual presentation of the ORS Excellence Awards to celebrate staff nominated for awards in the categories of Customer Service, Every Day Hero, Innovator, Leadership, and Living the Values. The second meeting focused heavily on upcoming technology and customer service tools that will allow staff to do their jobs with greater ease. Optimize Technology Forms, letters, and bar-coding project - When a customer requests a form, the system will pre-populate certain form fields so the customer only needs to provide the information not already contained in our system. Adding barcodes to the forms streamlines the process. The project also includes a process that electronically collects all correspondence and forms requests each day, and uses a secure website to send documents to the State’s central printing and mail facility, increasing the efficiency and security of our print and mail process. In fiscal year 2007 we reviewed, updated, and tested 160 forms, creating greater efficiencies and offering better customer service. We are nearing final implementation stages.

INTRODUCTORY SECTION
10 • MICHIGAN PUBLIC SCHOOL EMPLOYEES’ RETIREMENT SYSTEM
Letter of Transmittal (Continued) Server replacement - A major project to replace existing servers with new hardware and upgrade some of the middleware software versions is complete. This upgrade was accomplished with support from several different areas in the business and provides enhanced functionality and additional performance improvements. Of special significance is the introduction of a separate set of servers that mirror our production servers and will serve as our disaster recovery site. The separate servers are located in a different building from our production servers and will be used for technical testing. The servers will always be ready to take over if there should be an emergency. Workforce management software - Software implemented in our customer service center uses historical activity data to forecast future customer demands. Monitoring the workload volumes for a variety of time intervals assists with scheduling staff for phone and non-phone activities to provide better customer service. Invest in Employee Development Customer Service Center training - Staff created and executed contact center training for new employees. Trainees attended formal classroom sessions and were tested on the information presented. Topics included an overview of the retirement systems, software programs, and telephone etiquette. Subject matter experts shared valuable knowledge on insurance, service credit, eligibility, and preretirement topics. Trainees also observed contact center staff during customer calls. Workforce development staff - The development staff created a series of six training videos to help staff stay on top of new software and program features and techniques. The training videos utilized software that allowed us to connect with our audience by creating interactive video tutorials that were posted online and offered free of charge to all staff in DMB. Competency Based Training reviews - Senior leadership met individually with every employee and their direct supervisor to ensure each employee is given the opportunity to do what they do best on a daily basis. In addition employees are able to share their personal progress and challenges from the past year, and speak out about any suggestions they have for ways our organization could best utilize their skills. AWARDS AND ACKNOWLEDGEMENTS ORS received the following recognitions:
• Certificate of Achievement for Excellence in Financial Reporting for our fiscal year 2006 Comprehensive Annual Financial Report. Awarded by the Government Finance Officers Association of the United States and Canada.
• Public Pension Standards 2007 Award for meeting standards for public retirement system management and administration. Awarded by the Public Pension Coordinating Council.
• Blue Pencil-Gold Screen Award for two online video tutorials produced in-house on the topics of earning and purchasing service credit. Awarded by the National Association of Government Communicators in the Shoestring Budget category.
• 2007 Outstanding Program Award for our reorganization and reengineering efforts as we transitioned to become a process-based organization. Awarded by the National Association of State Chief Administrators.
• Innovator Award for our introduction of a phone appointment process that provides high-quality counseling services with less travel time and cost. Awarded by the State of Michigan Department of Management and Budget.
INTRODUCTORY SECTION
MICHIGAN PUBLIC SCHOOL EMPLOYEES’ RETIREMENT SYSTEM • 11
Letter of Transmittal (Continued) The preparation of this report was accomplished with the dedication and cooperation of many people. It is intended to provide complete and reliable information as a basis for making management decisions, as a means of determining compliance with legal provisions, and as a means for determining responsible stewardship of the funds of the System. We would, therefore, like to express our appreciation for the assistance given by staff, the advisors and the many people who contributed to its preparation. We believe their combined efforts have produced a report that will enable employers and plan members to better evaluate and understand the Michigan Public School Employees’ Retirement System. Their cooperation contributes significantly to the success of the System. Sincerely, Lisa Webb Sharpe, Director Department of Management and Budget Phillip J. Stoddard, Director Office of Retirement Services

INTRODUCTORY SECTION
12 • MICHIGAN PUBLIC SCHOOL EMPLOYEES’ RETIREMENT SYSTEM
Administrative Organization Retirement Board Members* Ivy Bailey Active Classroom Teacher Term Expires March 30, 2008
Vacant Active Superintendent Term Expires March 30, 2009
Martha Pichla Active Classroom Teacher Term Expires March 30, 2009
William Lawson, Jr. Retired Finance/Operations Term Expired March 30, 2007; continues to serve
Marc Whitefield General Public - Investments Term Expires March 30, 2008
Jeffrey Hoffman General Public - Actuary/Health Insurance Term Expired March 30, 2006; continues to serve
Lenore Croudy Community College Trustee Term Expires March 30, 2008
Richard Montcalm Active Finance/Operations, Non-Superintendent Term Expires March 30, 2008
John Olekszyk Retired Teacher Term Expires March 30, 2010
Diana Osborn, Chair Active Non-Certified Support Term Expires March 30, 2009
Edwin Martinson Reporting Unit Board of Control Term Expires March 30, 2008
Michael P. Flanagan Ex-officio Member Representing State Superintendent of Education
* Statute provides that board members may continue to serve after their term expires until they are either replaced or reappointed.
Administrative Organization Department of Management and Budget
Office of Retirement Services P.O. Box 30171
Lansing, Michigan 48909-7671 517-322-5103
1-800-381-5111
Advisors and Consultants Actuaries Gabriel Roeder Smith & Co. Alan Sonnanstine Southfield, Michigan
Auditors Thomas H. McTavish, C.P.A. Auditor General State of Michigan Andrews Hooper & Pavlik P.L.C. Jeffrey J. Fineis, C.P.A. Okemos, Michigan
Investment Manager and Custodian Robert J. Kleine State Treasurer State of Michigan
Legal Advisor Mike Cox Attorney General State of Michigan
Medical Advisors Gabriel Roeder Smith & Co. Southfield, Michigan
Investment Performance Measurement State Street Corporation State Street Analytics Boston, MA

INTRODUCTORY SECTION
MICHIGAN PUBLIC SCHOOL EMPLOYEES’ RETIREMENT SYSTEM • 13
Administrative Organization (Continued)
Operations Organizational Support Laurie Hill, Acting Assistant Director Tim McCormick, Director
Patricia Lack, Director
* The investments of the System are managed by the Michigan Department of Treasury. Information on the investments and the fiduciary, Michigan Department of Treasury, can be found in the Investment Section, Introduction. In addition, see the Investment Section, Schedule of Investment Fees and Schedule of Investment Commissions for information regarding the investment fees and commissions paid as well as investment professionals utilized by the System.
Phillip J. Stoddard, Director
Jon M. Braeutigam, Acting Director
Office ofRetirement Services
Robert J. Kleine, State Treasurer
Bureau of Investments
Financial ServicesMichael Gilliland, Director
Fiscal Management Division
Organization Chart
Department of Management & BudgetLisa Webb Sharpe, Director
Department of Treasury *

14 • MICHIGAN PUBLIC SCHOOL EMPLOYEES’ RETIREMENT SYSTEM
This page was intentionally left blank.

MICHIGAN PUBLIC SCHOOL EMPLOYEES’ RETIREMENT SYSTEM • 15
FINANCIAL SECTION
Independent Auditor’s Report Management’s Discussion and Analysis
Basic Financial Statements Notes to Basic Financial Statements
Required Supplementary Information Notes to Required Supplementary Information
Supporting Schedules
FINANCIAL SECTION
16 • MICHIGAN PUBLIC SCHOOL EMPLOYEES’ RETIREMENT SYSTEM
Independent Auditor’s Report

FINANCIAL SECTION
MICHIGAN PUBLIC SCHOOL EMPLOYEES’ RETIREMENT SYSTEM • 17
MICHIGAN PUBLIC SCHOOL EMPLOYEES’ RETIREMENT SYSTEM • 17
Independent Auditor’s Report (Continued)

FINANCIAL SECTION
18 • MICHIGAN PUBLIC SCHOOL EMPLOYEES’ RETIREMENT SYSTEM
Management’s Discussion and Analysis
Our discussion and analysis of the Michigan Public School Employees’ Retirement System’s (System) financial performance provides an overview of the System’s financial activities for the fiscal year ended September 30, 2007. Please read it in conjunction with the transmittal letter in the Introductory Section on page 6 and the basic financial statements, which follow this discussion.
FINANCIAL HIGHLIGHTS
• System assets exceeded liabilities at the close of fiscal year 2007 by $49.1 billion (reported as net assets). Net assets are held in trust to meet future benefit payments.
• The System’s funding objective is to meet long-term benefit obligations through contributions and investment income. As of September 30, 2006, the funded ratio for pension benefits was approximately 87.5% and the funded ratio for other postemployment benefits was approximately 2.5%
• Revenues for the year were $9.2 billion, which is comprised primarily of contributions of $1.9 billion and investment gains of $7.2 billion.
• Expenses increased over the prior year from $3.5 billion to $3.7 billion or 4.4%. Most of this increase represented increased retirement benefits paid.
THE STATEMENT OF PLAN NET ASSETS AND THE STATEMENT OF CHANGES IN PLAN NET ASSETS
This Comprehensive Annual Financial Report (CAFR) consists of two financial statements; The Statements of Pension Plan and Other Postemployment Plan Net Assets (page 24) and The Statements of Changes in Pension Plan and Other Postemployment Plan Net Assets (page 25). These financial statements report information about the System, as a whole, and about its financial condition that should help answer the question: Is the System, as a whole, better off or worse off as a result of this year’s activities? These statements include all assets and liabilities using the economic resources measurement focus and the accrual basis of accounting. Under the accrual basis of accounting, all revenues and expenses are taken into account regardless of when cash is received or paid. The Statement of Pension Plan and Other Postemployment Plan Net Assets presents all of the System’s assets and liabilities, with the difference between the two reported as net assets. Over time, increases and decreases in net assets measure whether the System’s financial position is improving or deteriorating. The Statement of Changes in Pension Plan and Other Postemployment Plan Net Assets presents how the System’s net assets changed during the most recent fiscal year. These two financial statements should be reviewed along with the Schedules of Funding Progress (page 46) and Schedules of Employer and Other Contributions (page 47) to determine whether the System is becoming financially stronger or weaker and to understand changes over time in the funded status of the System.
FINANCIAL SECTION
MICHIGAN PUBLIC SCHOOL EMPLOYEES’ RETIREMENT SYSTEM • 19
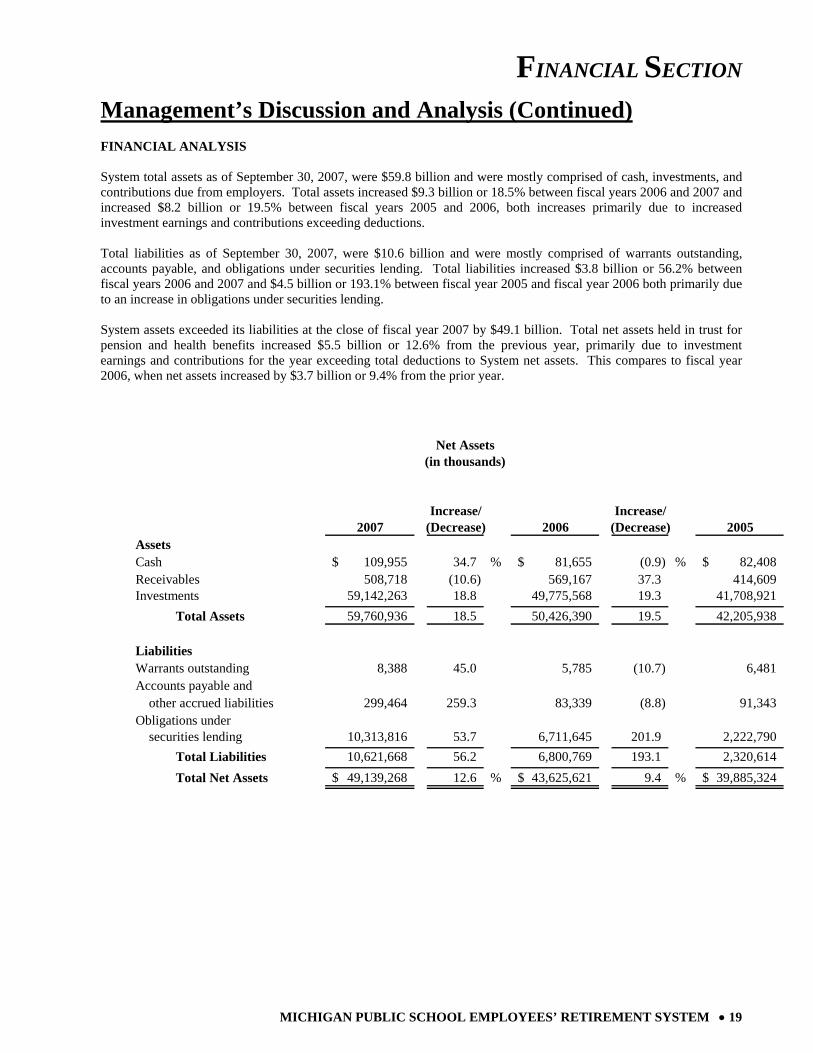
Management’s Discussion and Analysis (Continued) FINANCIAL ANALYSIS System total assets as of September 30, 2007, were $59.8 billion and were mostly comprised of cash, investments, and contributions due from employers. Total assets increased $9.3 billion or 18.5% between fiscal years 2006 and 2007 and increased $8.2 billion or 19.5% between fiscal years 2005 and 2006, both increases primarily due to increased investment earnings and contributions exceeding deductions. Total liabilities as of September 30, 2007, were $10.6 billion and were mostly comprised of warrants outstanding, accounts payable, and obligations under securities lending. Total liabilities increased $3.8 billion or 56.2% between fiscal years 2006 and 2007 and $4.5 billion or 193.1% between fiscal year 2005 and fiscal year 2006 both primarily due to an increase in obligations under securities lending. System assets exceeded its liabilities at the close of fiscal year 2007 by $49.1 billion. Total net assets held in trust for pension and health benefits increased $5.5 billion or 12.6% from the previous year, primarily due to investment earnings and contributions for the year exceeding total deductions to System net assets. This compares to fiscal year 2006, when net assets increased by $3.7 billion or 9.4% from the prior year.
Increase/ Increase/2007 (Decrease) 2006 (Decrease) 2005
AssetsCash 109,955$ 34.7 % 81,655$ (0.9) % 82,408$ Receivables 508,718 (10.6) 569,167 37.3 414,609 Investments 59,142,263 18.8 49,775,568 19.3 41,708,921 Total Assets 59,760,936 18.5 50,426,390 19.5 42,205,938
LiabilitiesWarrants outstanding 8,388 45.0 5,785 (10.7) 6,481 Accounts payable and other accrued liabilities 299,464 259.3 83,339 (8.8) 91,343 Obligations under securities lending 10,313,816 53.7 6,711,645 201.9 2,222,790 Total Liabilities 10,621,668 56.2 6,800,769 193.1 2,320,614 Total Net Assets 49,139,268$ 12.6 % 43,625,621$ 9.4 % 39,885,324$
slkdjf s slkdfj s
Net Assets
(in thousands)
FINANCIAL SECTION
20 • MICHIGAN PUBLIC SCHOOL EMPLOYEES’ RETIREMENT SYSTEM
Management’s Discussion and Analysis (Continued) REVENUES - ADDITIONS TO PLAN NET ASSETS The reserves needed to finance retirement and health benefits are accumulated through the collection of employer and employee contributions and through earnings on investments. Contributions and net investment income/(losses) for fiscal year 2007 totaled approximately $9.2 billion. Total additions for fiscal year 2007 increased approximately $1,926.4 million or 26.6% from those of fiscal year 2006 due primarily to increased investment earnings. Total additions increased approximately $767.7 million or 11.9% from fiscal year 2005 to fiscal year 2006 due primarily to increased investment earnings. Total contributions decreased between fiscal years 2006 and 2007 by $332.3 million or (14.6)%, while investment income increased $2,256.4 million or 45.4%. Total contributions increased from fiscal year 2005 to fiscal year 2006 by $367.9 million or 19.3%, while investment income increased $399.3 million or 8.7% during that timeframe. The Investment Section of this report reviews the results of investment activity for fiscal year 2007. The increase in member contributions from fiscal year 2005 to 2006 is primarily due to a change in policy regarding Tax Deferred Payment (TDP) agreements whereby those participants wishing to purchase service credit through a TDP agreement could do so without accruing interest if they signed before January of 2005. Consequently, there was a significant increase in employee contributions in fiscal year 2006 as these agreements get paid over time. The decrease in member and employer contributions from fiscal year 2006 to 2007 is primarily the result of fewer active members due to retirements and legislation passed during fiscal year 2007 that allowed a one time revaluation of the system assets and interest only contributions. These changes, enacted due to a projected revenue shortfall for the State in fiscal year 2007, resulted in approximately $297 million in credits to the participating employers. EXPENSES - DEDUCTIONS FROM PLAN NET ASSETS
The primary expenses of the System include the payment of pension benefits to members and beneficiaries, payment for health, dental and vision benefits, refund of contributions to former members, and the cost of administering the System. Total deductions for fiscal year 2007 were $3.6 billion, an increase of 4.4% over fiscal year 2006 expenses. Total deductions for fiscal year 2006 were $3.5 billion, which was an increase of 4.2% over fiscal year 2005 expenses. The health, dental, and vision care expenses during the year decreased by $44.6 million or (7.0)% from $634.8 million to $590.2 million. This compares to a decrease of $71.2 million or (10.1)% from $706.0 million to $634.8 million between fiscal years 2005 and 2006. The payment of pension benefits increased by $183.6 million or 6.6% between fiscal years 2006 and 2007 and by $203.3 million or 7.9% from fiscal year 2005 to fiscal year 2006. In fiscal year 2007, the increase in pension benefit expenses resulted from an increase in retirees (5,636) and an increase in benefit payments to retirees. In fiscal year 2006, the increase in pension benefit expenses resulted from an increase in retirees (5,457) and an increase in benefit payments to retirees. Administrative expenses increased by $5.9 million or 7.2% between fiscal years 2006 and 2007, primarily due to an increase in personnel services and accounting expenses. Administrative expenses increased by $6.4 million or 8.5% between fiscal years 2005 and 2006 primarily due to an increase in personnel services and accounting expenses. In addition to the factors described above which may be characterized as normal participant population changes, the fairly substantive increase in refunds and transfers is more appropriately tied to economic factors. The 34% increase in transfers and refunds between fiscal years 2006 and 2007 is likely due to Michigan's struggling economy as well as the more "portable" younger members of the system who may be working for a few years and then seeking employment in other states or other professions, taking their vested retirement dollars with them.

FINANCIAL SECTION
MICHIGAN PUBLIC SCHOOL EMPLOYEES’ RETIREMENT SYSTEM • 21
Management’s Discussion and Analysis (Continued)
Increase/ Increase/2007 (Decrease) 2006 (Decrease) 2005
Additions:Member Contributions 434.0$ (26.5) % 590.4$ 37.1 % 430.7$ Employer Contributions 1,507.0 (10.5) 1,682.9 14.1 1,474.7 Other Governmental Contributions - * - - * - - Net Investment Income (Loss) 7,225.0 45.4 4,968.6 8.7 4,569.3 Miscellaneous Income 2.8 460.0 0.5 N/A - Total Additions 9,168.8 26.6 7,242.4 11.9 6,474.7
slkdjf s slkdjf slkdjfDeductions:Pension Benefits 2,944.9 6.6 2,761.3 7.9 2,558.0 Health Care Benefits 590.2 (7.0) 634.8 (10.1) 706.0 Refunds and Transfers to Other Systems 32.3 34.0 24.1 7.6 22.4 Administrative Expenses 87.8 7.2 81.9 8.5 75.5 Total Deductions 3,655.2 4.4 3,502.1 4.2 3,361.9
slkdjf s slkdjf slkdjfNet Increase 5,513.6 47.4 3,740.3 20.2 3,112.8
Net Assets - Beginning of Year 43,625.6 9.4 39,885.3 8.5 36,772.5 Net Assets - End of Year 49,139.2$ 12.6 % 43,625.6$ 9.4 % 39,885.3$
* The amount represents less than $100,000.
Changes in Plan Net Assets(in millions)

FINANCIAL SECTION
22 • MICHIGAN PUBLIC SCHOOL EMPLOYEES’ RETIREMENT SYSTEM
Management’s Discussion and Analysis (Continued) RETIREMENT SYSTEM AS A WHOLE The System’s combined net assets experienced increases for 2007 and 2006 that preceded an increase for the prior year. This increase is a result of a moderate national economic upturn that resulted in improved investment income earnings. Management believes, and actuarial studies concur, that the System is in a financial position to meet its current obligations. We believe the current financial position has improved, in part, due to a prudent investment program, cost controls, and strategic planning. CONTACTING SYSTEM FINANCIAL MANAGEMENT This financial report is designed to provide the Retirement Board, our membership, taxpayers, investors, and creditors with a general overview of the System’s finances and to demonstrate the System’s accountability for the money it receives. If you have any questions about this report or need additional financial information, contact the Office of Retirement Services, P.O. Box 30171, Lansing, MI 48909-7671.

FINANCIAL SECTION
MICHIGAN PUBLIC SCHOOL EMPLOYEES’ RETIREMENT SYSTEM • 23
This page was intentionally left blank.

FINANCIAL SECTION
24 • MICHIGAN PUBLIC SCHOOL EMPLOYEES’ RETIREMENT SYSTEM
Statements of Pension Plan and Other Postemployment Plan Net Assets As of September 30, 2007 and 2006
September 30, 2007 September 30, 2006
Pension OPEB Pension OPEB
Plan Plan Total Plan Plan Total
Assets: Equity in common cash 107,566,776$ 2,388,139$ 109,954,915$ 80,357,716$ 1,296,841$ 81,654,557$ Receivables: Amounts due from employer 238,796,864 28,920 238,825,784 266,283,583 21,445 266,305,028 Amounts due from employer long term 266,823,141 266,823,141 301,654,065 301,654,065 Interest and dividends 3,002,393 66,658 3,069,051 1,188,724 19,184 1,207,908
Total receivables 508,622,398 95,578 508,717,976 569,126,372 40,629 569,167,001
Investments: Short term investment pools 1,044,227,905 23,183,381 1,067,411,286 1,157,407,064 18,678,636 1,176,085,700 Fixed income pools 7,853,184,370 174,352,135 8,027,536,505 6,938,196,103 111,971,014 7,050,167,117 Domestic equity pools 22,491,305,149 499,339,742 22,990,644,891 20,495,687,889 330,766,515 20,826,454,404 Real estate pool 4,262,390,199 94,631,273 4,357,021,472 3,193,938,710 51,544,890 3,245,483,600 Alternative investment pools 6,696,601,576 148,674,312 6,845,275,888 5,404,045,256 87,212,356 5,491,257,612 International equities pools 5,420,219,819 120,336,777 5,540,556,596 5,190,705,051 83,769,397 5,274,474,448 Cash collateral on loaned securities 10,089,807,870 224,008,435 10,313,816,305 6,605,050,628 106,594,596 6,711,645,224
Total investments 57,857,736,888 1,284,526,055 59,142,262,943 48,985,030,701 790,537,404 49,775,568,105
Total assets 58,473,926,062 1,287,009,772 59,760,935,834 49,634,514,789 791,874,874 50,426,389,663
Liabilities: Warrants outstanding 8,205,995 182,184 8,388,179 5,693,574 91,884 5,785,458 Accounts payable and other accrued liabilities 12,979,302 286,484,956 299,464,258 28,428,915 54,909,796 83,338,711 Obligations under securities lending 10,089,807,870 224,008,435 10,313,816,305 6,605,050,628 106,594,596 6,711,645,224
Total liabilities 10,110,993,167 510,675,575 10,621,668,742 6,639,173,117 161,596,276 6,800,769,393
Net Assets Held in Trust for Pension and OPEB Benefits* 48,362,932,895$ 776,334,197$ 49,139,267,092$ 42,995,341,672$ 630,278,598$ 43,625,620,270$
*A schedule of funding progress is presented in the Required Supplementary Information in the Financial Section. The accompanying notes are an integral part of these financial statements.

FINANCIAL SECTION
MICHIGAN PUBLIC SCHOOL EMPLOYEES’ RETIREMENT SYSTEM • 25
Statements of Changes in Pension Plan and Other Postemployment Plan Net Assets For Fiscal Years Ended September 30, 2007 and 2006
September 30, 2007Pension OPEB Pension OPEB
Plan Plan Total Plan Plan TotalAdditions:Contributions: Member contributions 356,761,212$ 77,206,778$ 433,967,990$ 518,599,720$ 71,813,553$ 590,413,273$ Employer contributions: Colleges, universities and federal 63,505,126 57,764,985 121,270,111 69,385,887 59,030,437 128,416,324 School districts and other 771,861,256 613,915,415 1,385,776,671 926,546,538 627,899,121 1,554,445,659 Other governmental contributions 63,054 63,054 64,574 64,574
Total contributions 1,192,127,594 748,950,232 1,941,077,826 1,514,532,145 758,807,685 2,273,339,830
Investment income (loss): Net appreciation (depreciation) in fair value of investments 6,262,637,852 6,262,637,852 4,016,811,356 4,016,811,356 Interest, dividends, and other 961,168,862 50,417,122 1,011,585,984 959,109,354 41,909,987 1,001,019,341 Investment expenses: Real estate operating expenses (1,011,213) (1,011,213) (325,681) (325,681) Other investment expenses (67,046,587) (67,046,587) (54,782,035) (54,782,035) Securities lending activities: Securities lending income 470,628,987 470,628,987 156,767,000 156,767,000 Securities lending expenses (451,816,635) (451,816,635) (150,871,583) (150,871,583)
Net investment income (loss) 7,174,561,266 50,417,122 7,224,978,388 4,926,708,411 41,909,987 4,968,618,398
Transfers from other systems 5,794 5,794 2,647 2,647 Miscellaneous income 2,553,474 260,709 2,814,183 469,085 469,085
Total additions 8,369,248,128 799,628,063 9,168,876,191 6,441,712,288 800,717,672 7,242,429,960
Deductions: Benefits and refunds paid to plan members and beneficiaries: Retirement benefits 2,944,920,179 2,944,920,179 2,761,292,217 2,761,292,217 Health benefits 521,420,684 521,420,684 565,261,409 565,261,409 Dental/vision benefits 68,805,781 68,805,781 69,550,438 69,550,438 Refunds of member contributions 32,141,952 30,580 32,172,532 23,903,822 42,370 23,946,192 Transfers to other systems 105,572 105,572 123,059 123,059 Administrative expenses 24,489,202 63,315,419 87,804,621 22,501,098 59,459,690 81,960,788
Total deductions 3,001,656,905 653,572,464 3,655,229,369 2,807,820,196 694,313,907 3,502,134,103
Net Increase 5,367,591,223 146,055,599 5,513,646,822 3,633,892,092 106,403,765 3,740,295,857
Net Assets Held in Trust for Pension and OPEB Benefits:Beginning of Year 42,995,341,672 630,278,598 43,625,620,270 39,361,449,580 523,874,833 39,885,324,413
End of Year* 48,362,932,895$ 776,334,197$ 49,139,267,092$ 42,995,341,672$ 630,278,598$ 43,625,620,270$
* A schedule of funding progress is presented in the Required Supplementary Information in the Financial Section.The accompanying notes are an integral part of these financial statements.
September 30, 2006

FINANCIAL SECTION
26 • MICHIGAN PUBLIC SCHOOL EMPLOYEES’ RETIREMENT SYSTEM
Notes to Basic Financial Statements
NOTE 1 - PLAN DESCRIPTION ORGANIZATION The Michigan Public School Employees’ Retirement System (System) is a cost-sharing, multiple employer, state-wide, defined benefit public employee retirement plan governed by the State of Michigan (State) originally created under Public Act 136 of 1945, recodified and currently operating under the provisions of Public Act 300 of 1980, as amended. Section 25 of this act establishes the board’s authority to promulgate or amend the provisions of the System. The System’s pension plan was established to provide retirement, survivor and disability benefits to the public school employees. In addition, the System’s health plan provides all retirees with the option of receiving health, dental and vision coverage under the Michigan Public School Employees’ Retirement Act. There are 714 participating employers. A list of employers is provided in the Statistical Section. The System is a qualified pension trust fund under section 401(a) of the Internal Revenue Code. By statute, employees of K-12 public school districts, public school academies, district libraries, tax-supported community colleges and seven universities may be members. The seven universities are: Eastern Michigan, Central Michigan, Northern Michigan, Western Michigan, Ferris State, Michigan Technological and Lake Superior State. Employees, who first become employed by one of the seven universities on or after January 1, 1996, become members of an alternative plan. The System’s financial statements are included as a pension trust fund in the combined financial statements of the State. The System is administered by the Office of Retirement Services within the Michigan Department of Management and Budget. The Department Director appoints the Office Director who serves as Executive Secretary to the System’s Board, with whom the general oversight of the System resides. The State Treasurer serves as the investment officer and custodian for the System.
MEMBERSHIP
At September 30, 2007, and 2006, the System's membership consisted of the following:
Retirees and beneficiariescurrently receiving benefits: 2007 2006* Regular benefits 143,394 138,306 Survivor benefits 13,941 13,484 Disability benefits 5,509 5,373 Total 162,844 157,163
Current Employees: Vested 119,989 119,192 Non-vested 175,995 189,041 Total 295,984 308,233
Inactive employees entitledto benefits and not yetreceiving them 14,999 15,679
Total All Members 473,827 481,075
*Restated based on more complete information provided by the actuary.

FINANCIAL SECTION
Notes to Basic Financial Statements (Continued)
MICHIGAN PUBLIC SCHOOL EMPLOYEES’ RETIREMENT SYSTEM • 27
Enrollment in the health plan is voluntary. The number of participants is as follows:
Health/Dental/Vision Plan 2007 2006*
Eligible participants 162,844 157,163Participants receiving benefits: Health 121,804 118,535 Dental/Vision 129,771 125,752
*Restated based on more complete information provided by the actuary. BENEFIT PROVISIONS - PENSION Introduction Benefit provisions of the defined benefit pension plan are established by State statute, which may be amended. Public Act 300 of 1980, as amended, establishes eligibility and benefit provisions for the defined benefit pension plan. Retirement benefits are determined by final average compensation and years of service. Members are eligible to receive a monthly benefit when they meet certain age and service requirements. The System also provides disability and survivor benefits. A member who leaves Michigan public school employment may request a refund of his or her member contribution account. A refund cancels a former member’s rights to future benefits. However, returning members who previously received a refund of their contributions may reinstate their service through repayment of the refund upon satisfaction of certain requirements. Regular Retirement The retirement benefit is based on a member’s years of credited service (employment) and final average compensation. Final average compensation is the member’s highest total wages earned during a specific period of consecutive calendar months divided by the service credit accrued during that same time period. For a Member Investment Plan (MIP) member, the averaging period is 36 consecutive months. For a Basic Plan member, this period is the 60 consecutive months yielding the highest total wages. The annual pension is paid monthly for the lifetime of a retiree and equals 1.5% of a member’s final average compensation multiplied by the total number of years of credited service. A MIP member may retire at:
1. any age with 30 or more years of credited service; or 2. age 60 with 10 or more years of credited service; or 3. age 60 with 5 years of credited service provided the member has worked through his or her 60th birthday and
has credited service in each of the five school fiscal years immediately preceding the retirement effective date. A Basic Plan member may retire at: 1. age 55 with 30 or more years of credited service; or 2. age 60 with 10 or more years of credited service. There is no mandatory retirement age.
FINANCIAL SECTION
Notes to Basic Financial Statements (Continued)
28 • MICHIGAN PUBLIC SCHOOL EMPLOYEES’ RETIREMENT SYSTEM
Early Retirement A member may retire with an early permanently reduced pension: 1. after completing at least 15 but less than 30 years of credited service; and 2. after attaining age 55; and 3. with credited service in each of the 5 school years immediately preceding the pension effective date. The early pension is computed in the same manner as a regular pension, but is permanently reduced 0.5% for each full and partial month between the pension effective date and the date the member will attain age 60. Deferred Retirement If a member terminates employment before attaining the age qualification, but after accruing 10 or more years of credited service, the member becomes a deferred member and is eligible for a pension at the time the age qualification is attained. Non-Duty Disability Benefit A member with 10 or more years of credited service who becomes totally and permanently disabled due to any non-duty related cause and who has not met the age requirement for a regular pension is eligible for a non-duty disability pension computed in the same manner as an age and service pension, upon recommendation from the member’s personal physician and the Retirement Board physician and the approval of the Retirement Board. An Annual Certification of Disability is conducted each January. Upon prior approval, total disability benefits plus authorized outside earnings are limited to 100% of final average compensation (increased by two percent for each year retired). Duty Disability Benefit A member who becomes totally and permanently disabled as a result of a duty-related cause, who has not met the age and service requirement for a regular pension, and who is in receipt of weekly workers’ compensation is eligible for a duty disability pension computed in the same manner as an age and service pension (but based upon a minimum of 10 years of service) upon recommendation from the member’s personal physician and the Retirement Board physician and the approval of the Retirement Board. An Annual Certification of Disability is conducted each January. Upon prior approval, total disability benefits plus authorized outside earnings are limited to 100% of final average compensation (increased by two percent for each year retired). Forms of Payment The election of a pension option is made at the time of application. Once a member has retired, the option choice is irrevocable. The pension effective date is the first of the calendar month following the date the member has satisfied the age and service requirements, has terminated public school employment and has the completed application forms on file with the System for a period of 15 days. A retroactive pension can be paid for no more than 12 calendar months. Thus, delay in filing the application can result in a loss of some retroactive pension benefits. An applicant may select only one of the following options. Straight Life Pension — The Straight Life Pension pays the largest level pension a retiree can receive during his or her lifetime and stops with the month of a retiree’s death. There are no monthly benefits for a beneficiary. The pension benefit is computed with no beneficiary rights. If the retiree made contributions while an employee and has not received the total accumulated contributions before death, a refund of the balance of the contributions is made to the beneficiary of record. If the retiree did not make any contributions, there will not be payments to any beneficiaries.
FINANCIAL SECTION
Notes to Basic Financial Statements (Continued)
MICHIGAN PUBLIC SCHOOL EMPLOYEES’ RETIREMENT SYSTEM • 29
Survivor Options — Under the Survivor Options, 100% Survivor Pension, 100% Equated, 75% Survivor Pension, 75% Equated, 50% Survivor Pension and 50% Equated, the reduction is an actuarial determination dependent upon the combined life expectancies of a retiree and a beneficiary, and varies from case to case. A beneficiary may only be a spouse, brother, sister, parent or child (including an adopted child) of a retiring member. If the beneficiary pre-deceases a retiree, the pension will revert to either the Straight Life or Straight Life Equated amount (“pop-up” provision). 100% Survivor Pension — pays a reduced pension to a retiree. The month after a retiree’s death, the same amount will be paid to a designated beneficiary for the remainder of his or her lifetime. 75% Survivor Pension — pays a reduced pension to a retiree. The month after a retiree’s death, 75% of the pension amount will be paid to a designated beneficiary for the remainder of his or her lifetime. 50% Survivor Pension — pays a reduced pension to a retiree. The month after a retiree’s death, 50% of the pension amount will be paid to a designated beneficiary for the remainder of his or her lifetime. Equated Plan — The Equated Plan may be combined with the Straight Life, 100% Survivor, 75% Survivor, or 50% Survivor Pension by any member under age 61, except a disability applicant. The Equated Plan provides a higher pension every month until age 62, at which time the monthly pension is permanently decreased to a lower amount than the Straight Life, 100%, 75%, or 50% Survivor alone would provide. The intent of the Equated Plan is for the retiree’s pension to decrease at age 62 by approximately the same amount as that person’s Social Security benefit will provide. The System pension until age 62 should be about the same as the combined System pension and Social Security after age 62. The projected Social Security pension the retiring member obtains from the Social Security Administration and furnishes to the System is used in the Equated Plan calculation. The actual Social Security pension may vary from the estimate. NOTE: The reduction in the pension at age 62 pertains to the Equated Plan only and affects only the retiree. A beneficiary under 100% Equated, 75% Equated or 50% Equated will receive the 100%, 75%, or 50% Survivor amount the month following the retiree’s death as if the Equated Plan had not been chosen. A beneficiary does not participate in the Equated Plan. Survivor Benefit A non-duty survivor pension is available if a Member Investment Plan participant has 10 years of credited service or, if age 60 or older, with five years of credited service. The Basic Plan provides a survivor pension with 15 years of credited service or, if age 60 or older, with 10 years of credited service. An active member may nominate as a survivor beneficiary a spouse, child(ren) (including adopted child(ren)), brother, sister, or a parent. If other than the spouse is nominated and a spouse exists, the spouse must waive this benefit. If no beneficiary has been nominated, the beneficiary is automatically the spouse; or, if there is no spouse, unmarried children under age 18 share the benefit equally until age 18. The benefit is computed as a regular pension but reduced in accordance with an Option 2 (100% survivor pension factor). The pension begins the first of the month following the member’s death. In the event of the death of a deferred member, the System begins payment to the nominated beneficiary at the time the member would have attained the minimum age qualification. A duty survivor pension is payable if weekly Workers’ Compensation is being paid to the eligible beneficiary due to the member’s death. A spouse receives the benefit (based on a minimum of 10 years of service credit) reduced in accordance with a l00% survivor pension factor. If there is no spouse, unmarried children under age 18 share the benefit equally until age 18; if there is no spouse or child(ren), a disabled and dependent parent is eligible.

FINANCIAL SECTION
Notes to Basic Financial Statements (Continued)
30 • MICHIGAN PUBLIC SCHOOL EMPLOYEES’ RETIREMENT SYSTEM
Post Retirement Adjustments Member Investment Plan (MIP) recipients receive an annual post-retirement non-compounded increase of three percent of the initial pension in the October following twelve months of retirement. Basic Plan recipients receive a supplemental payment in those years when investment earnings exceed actuarial assumptions. On January 1, 1990, pre-October 1, 1981, retirees received an increase that ranged from 1% to 22% dependent upon the pension effective date. On October 1, 1990, the base pension of all retirees with an effective pension date of January 1, 1987, or earlier was increased to include all prior post-retirement adjustments. On January 1, 1986, all recipients through calendar year 1985 received a permanent 8% increase that established the 1986 base pension. In addition, each October, retirees with a pension effective date of January 1, 1987, or earlier receive a fixed increase equal to 3% of the base pension. Both increases are deducted from the distribution of excess investment income, if any. Beginning in 1983, eligible recipients receive an annual distribution of excess investment income, if any. One time upward adjustments were made in 1972, 1974, 1976, and 1977 for retirees who retired on or after July 1, 1956, and were eligible for Social Security benefits. (Social Security coverage was enacted by referendum in 1956). The minimum base pension of retirees who were unable to qualify for Social Security through their public school employment (essentially pre-July 1, 1956 retirees), was increased in 1965, 1971, 1972, 1974, and 1981 with a percentage increase granted in 1976 and 1977. Member Contributions Mandatory member contributions were phased out between 1974 and 1977, with the plan remaining noncontributory until January 1, 1987, when the Member Investment Plan (MIP) was enacted. MIP members enrolled in MIP prior to January 1, 1990, contribute at a permanently fixed rate of 3.9% of gross wages. The MIP contribution rate was 4.0% from January 1, 1987, the effective date of the MIP, until January 1, 1990, when it was reduced to 3.9%. Members first hired January 1, 1990, or later and returning members who did not work between January 1, 1987, through December 31, 1989, contribute at the following graduated permanently fixed contribution rates: 3% of the first $5,000; 3.6% of $5,001 through $15,000; 4.3% of all wages over $15,000. Basic Plan members make no contributions. For a limited period ending December 31, 1992, an active Basic Plan member could enroll in the MIP by paying the contributions that would have been made had enrollment occurred initially on January 1, 1987, or on the date of hire, plus interest. MIP contributions at the rate of 3.9% of gross wages begin at enrollment. Actuarial rate of interest is posted to member accounts on July 1st on all MIP monies on deposit for 12 months. If a member leaves public school service and no pension is payable, the member’s accumulated contributions plus interest, if any, are refundable. Employer Contributions Each school district or reporting entity is required to contribute the full actuarial funding contribution amount to fund pension benefits. BENEFIT PROVISIONS – OTHER POSTEMPLOYMENT Introduction Benefit provisions are established by State statute, which may be amended. Public Act 300 of 1980, as amended, establishes eligibility and benefit provisions. Retirees have the option of health coverage, which is currently funded on a cash disbursement basis by the employers. The System has contracted to provide the comprehensive group medical, hearing,

FINANCIAL SECTION
Notes to Basic Financial Statements (Continued)
MICHIGAN PUBLIC SCHOOL EMPLOYEES’ RETIREMENT SYSTEM • 31
dental and vision coverages for retirees and beneficiaries. A significant portion of the premium is paid by the System with the balance deducted from the monthly pension. Pension recipients are eligible for fully paid Master Health Plan coverage and 90% paid Dental Plan, Vision Plan and Hearing Plan coverage with the following exceptions:
1. Retirees not yet eligible for Medicare coverage pay an amount equal to the Medicare Part B premiums.
2. Retirees with less than 30 years of service, who terminate employment after October 31, 1980, with vested deferred benefits, are eligible for partially employer paid health benefit coverage (no payment for less than 21 years of service).
3. To limit future liabilities of Other Postemployment Benefits a graded premium heath insurance subsidy has
been put into place for all members of the Michigan Public School Employees Retirement System who first work on or after July 1, 2008.
Dependents may receive 90% employer paid health benefit coverages (partial payment for dependents of deferred vested members who had 21 or more years of service). The number of participants and other relevant financial information are as follows:
2007 2006*Health, Dental and Vision Plan:
Eligible Participants 162,844 157,163Participants receiving benefits:
Health 121,804 118,535Dental/Vision 129,771 125,752
Expenses for the year $653,572,464 $694,313,906Employer payroll contribution rate 6.55% 6.55%
*Restated based on more complete information provided by the actuary.
The only requirements for health benefits are that the retiree or beneficiary make application and be in receipt of a monthly pension. Applications for enrollment after retirement are accepted anytime during the year, with coverage effective six months following the receipt of the application. NOTE 2 - SUMMARY OF SIGNIFICANT ACCOUNTING POLICIES Basis of Accounting and Presentation The System’s financial statements are prepared using the accrual basis of accounting. Contributions from the employers are recognized as revenue when due and payable. Benefits and refunds are recognized when due and payable in accordance with the terms of the System. Reserves Reserve for Employee Contributions — Members no longer contribute to this reserve except to purchase eligible service credit or repay previously refunded contributions. This reserve represents active member contributions and interest less amounts transferred to the Reserve for Retired Benefit Payments for regular and disability retirement, amounts refunded to terminated members, and amounts transferred to the Reserve for Employer Contributions representing unclaimed funds. At September 30, 2007, and 2006, the balance in this account was $1.6 billion for both years.

FINANCIAL SECTION
Notes to Basic Financial Statements (Continued)
32 • MICHIGAN PUBLIC SCHOOL EMPLOYEES’ RETIREMENT SYSTEM
Reserve for Member Investment Plan — This reserve represents MIP contributions and interest less refunds and transfers to the Reserve for Retired Benefit Payments. At September 30, 2007, and 2006, the balance in this account was $3.8 billion and $3.5 billion, respectively. Reserve for Employer Contributions — All reporting unit contributions, except payments for health benefits, are credited to this reserve. Interest from the Reserve for Undistributed Investment Income account is credited annually. Amounts are transferred annually to the Reserve for Retired Benefit Payments to bring the balance of that reserve into balance with the actuarial present value of retirement allowances. At September 30, 2007, and 2006, the balance in this account was ($18.5) billion and ($17.1) billion, respectively. Reserve for Retired Benefit Payments — This represents the reserves for payment of future retirement benefits to current retirees. At retirement, a member’s accumulated contributions plus interest are transferred into this reserve. Monthly benefits, which are paid to the retiree, reduce this reserve. At the end of each fiscal year, an amount, determined by an annual actuarial valuation, is transferred from the Reserve for Employer Contributions to bring the balance of this reserve into balance with the actuarial present value of retirement allowances. At September 30, 2007, and 2006, the balance in this account was $29.1 billion and $27.2 billion, respectively. Reserve for Undistributed Investment Income and Reserve for Administrative Expenses — The Reserve for Undistributed Investment Income account is credited with all investment earnings. Interest is transferred annually to the other reserves. Administrative expenses of the System are paid from the Reserve for Administrative Expenses, which is credited with amounts from the Reserve for Undistributed Investment Income to cover the expenses. For ease of reporting and understanding, the two reserves are presented as one reserve in the supporting schedules. At September 30, 2007, and 2006, the balance in this account was $32.4 billion and $27.8 billion, respectively. The balance of this reserve includes the balance of the Stabilization Subaccount. Stabilization Subaccount — Under Public Act 143, effective November 19, 1997, the actuarial value of assets was set at market at September 30, 1997, with the 5 year smoothing of investment gains or losses applied prospectively. Also, the inflation component of the salary scale was reduced from 4% to 3.5%. The Act also established a stabilization subaccount of the Reserve for Undistributed Investment Income (income fund) to which any over funding is credited. As of September 30, 2007, the balance in the subaccount was zero. The balance in the subaccount is included in the balance of the income fund, which is included in pension plan net assets. Reserve for Health (OPEB) Benefits — This reserve is credited with employee and employer contributions for retirees’ health, dental and vision benefits. This reserve includes revenue from the federal government for retiree drug subsidy payments (RDS) pursuant to the provisions of Medicare Part D. Currently, the required contribution is based on pay-as-you-go funding. It represents a level of funding that, if paid on an ongoing basis, is projected to cover normal cost each year and amortize any unfunded actuarial liability (or funding excess) over a period not to exceed thirty years. Interest is allocated based on the beginning balance of the fund. Health, dental and vision benefits are paid from this fund. The System pays 90% of the monthly premium, membership, or subscription fee for dental, vision and hearing benefits. At September 30, 2007, and 2006, the balance in this account was $776.3 million and $630.2 million, respectively. Reporting Entity The System is a pension trust fund of the State. As such, the System is considered part of the State and is included in the State’s Comprehensive Annual Financial Report as a pension trust fund. The System and its Board are not financially accountable for any other entities or other organizations. Accordingly, the System is the only entity included in this financial report. Benefit Protection Public Act 100 of 2002 was passed by the Michigan Legislature to protect pension benefits of public employees from alienation (being transferred). Alienation is attachment, garnishment, levy, execution, bankruptcy or other legal process except for divorce orders or eligible domestic relation orders. The statutes governing the System contained an “anti-
FINANCIAL SECTION
Notes to Basic Financial Statements (Continued)
MICHIGAN PUBLIC SCHOOL EMPLOYEES’ RETIREMENT SYSTEM • 33
alienation” clause to provide for this protection; however, many smaller public pension systems did not have the benefit of this protection. Therefore, Public Act 100 of 2002 was passed to establish legal protection of pension assets that encompasses all public employees. Fair Value of Investments Plan investments are reported at fair value. Securities traded on a national or international exchange are valued at the last reported sales price at current exchange rates. Corporate bonds not traded on a national or international exchange are based on equivalent values of comparable securities with similar yield and risk. Real estate debt is valued on the basis of future principal and interest payments, and is discounted at prevailing interest rates for similar instruments. The fair value of real estate investments is based on independent appraisals. Other investments that do not have an established market are recorded at estimated fair value. Investment Income Dividend and interest income is recognized on the accrual basis. Fair value changes are recorded as investment income or loss. Purchases and sales of investments are recorded as of the trade date (the date upon which the transaction is initiated), except for purchase and sale of mortgages, real estate, and alternative investments which are recorded as of the settlement date (the date upon which the transaction is ultimately completed). The effect of recording such transactions as of the settlement date does not materially affect the financial statements. Costs of Administering the System Each year a restricted general fund appropriation is requested to fund the on-going business operations of the System. These administrative costs are ultimately funded by the System through the regular transfer of funds from the System to the State’s general fund based on either a direct cost or allocation basis depending on the nature of the expense. Costs of administering the System are financed by undistributed investment income of the System. Property and Equipment Office space is leased from the State on a year to year basis. Office equipment is capitalized if the value exceeds $5,000. These assets are recorded at cost and are reported net of depreciation in the Statement of Pension Plan and Post-employment Healthcare Plan Net Assets. Such assets are depreciated on a straight-line basis over 10 years. As of September 30, 1998, all capitalized equipment was fully depreciated. No additional equipment has been capitalized for the System since that date. Related Party Transactions Leases and Services — The System leases operating space and purchases certain administrative, data processing, legal and investment services from the State. The space and services are not otherwise available by competitive bid. The following summarizes costs incurred by the System for such services.
2007 2006
Building Rentals 793,603$ 613,290$ Technological Support 9,079,681 8,123,257 Attorney General 223,467 215,737 Investment Services 8,559,613 7,913,937 Personnel Services 8,915,499 8,809,695

FINANCIAL SECTION
Notes to Basic Financial Statements (Continued)
34 • MICHIGAN PUBLIC SCHOOL EMPLOYEES’ RETIREMENT SYSTEM
Commitment and Contingency – The State has signed a contract with a vendor for technological support through 2007. As of September 30, 2007, the System’s portion of this commitment is approximately $1.7 million. Cash — On September 30, 2007, and 2006, the System had $109.9 million and $81.6 million, respectively, in a common cash investment pool maintained for various State operating funds. The participating funds in the common cash pool earn interest at various rates depending upon prevailing short-term interest rates. Earnings from these activities amounted to $7.0 million and $6.8 million for the years ended September 30, 2007, and 2006, respectively. Reclassification of Prior Year Amounts Certain prior year amounts have been reclassified to conform with the current year presentation. Fiscal year 2006 Medicare Part D revenue in the amount of $64,574 was reclassified from the pension plan to the heath plan. NOTE 3 - CONTRIBUTIONS AND FUNDED STATUS Contributions The majority of the members currently participate on a contributory basis. Reporting units are required by Public Act 300 of 1980, as amended, to contribute amounts necessary to finance the coverage of members and retiree health benefits. Contribution provisions are specified by State statute and may be amended only by action of the State Legislature. Employer contributions to the System are determined on an actuarial basis using the entry age normal actuarial cost method. Under this method, the actuarial present value of the projected benefits of each individual included in the actuarial valuation is allocated on a level basis over the service of the individual between entry age and assumed exit age. The portion of this cost allocated to the current valuation year is called the normal cost. The remainder is called the actuarial accrued liability. Normal cost is funded on a current basis. For retirement benefits, the unfunded (overfunded) actuarial accrued liability is amortized over a 29 year period for the 2007 fiscal year and 30 year period for the 2006 fiscal year. For health benefits, the unfunded (overfunded) actuarial accrued liability is amortized over a maximum period of 30 years. Because this is the first year of OPEB reporting, comparative data is not yet available. GASB Statement 43 does not require retroactive presentation. Actual employer contributions for retirement benefits were $835.4 million and $996.0 million for fiscal years 2007 and 2006, respectively, representing 10.2% of annual covered payroll for the year ended September 30, 2006. The fiscal year 2007 annual covered payroll is not yet available. Required employer contributions based on previous year actuarial valuations for pensions:
1. $551.1 million and $581.2 million for fiscal years 2007 and 2006, respectively, for the normal cost of pensions representing 5.6% and 5.7% (before reconciliation) of annual covered payroll for fiscal years 2006 and 2005, respectively.
2. $368.4 million and $580.6 million for fiscal years 2007 and 2006, respectively, for amortization of unfunded
actuarial accrued liability representing 3.8% and 5.7% (before reconciliation) of annual covered payroll for fiscal years 2006 and 2005, respectively.
Actual employer contributions for other postemployment benefits (OPEB) were $671.7 million for fiscal year 2007. The fiscal year 2007 annual covered payroll is not yet available. Required employer contributions based on previous year actuarial valuations for OPEB included:

FINANCIAL SECTION
Notes to Basic Financial Statements (Continued)
MICHIGAN PUBLIC SCHOOL EMPLOYEES’ RETIREMENT SYSTEM • 35
1. $1,595.5 million for fiscal year 2007 for the normal cost of OPEB representing 16.3% (before reconciliation) of annual covered payroll for fiscal year 2006.
2. $901.6 million for fiscal year 2007 for amortization of unfunded actuarial accrued liability representing 9.2%
(before reconciliation) of annual covered payroll for fiscal year 2006. The System is required to reconcile with actuarial requirements annually. Any funding excess or deficiency for pension benefits is smoothed over 5 years. One fifth (20%) of the funding excess or deficiency is included in the subsequent years’ contribution, and is not recognized as a payable or receivable in the accounting records.
In May 1996, the Internal Revenue Service issued a private letter ruling allowing the System’s members to purchase service credit and repay refunds using tax-deferred (pre-tax) dollars. The program was implemented in fiscal year 1997-1998, and payments began in fiscal year 1998-1999. The program allows members to purchase service credit and repay refunds on a tax-deferred basis. Members sign an irrevocable agreement that identifies the contract duration, monthly payment, total contract amount and years of service credit being purchased. The duration of the contract can range from 1 to 20 years. The amounts are withheld from members’ paychecks and are treated as employer pick-up contributions pursuant to Internal Revenue Code Section 414(h). At September 30, 2007, and 2006, there were 42,658 and 46,423 agreements, respectively. The agreements were discounted using the assumed actuarial rate of return of 8% for September 30, 2007, and 2006. The average length of a contract was approximately 7.8 and 11.8 years for 2007 and 2006. The short term receivable was $77 million and the discounted long term receivable was $267 million at September 30, 2007. At September 30, 2006, the short term receivable was $84 million and the discounted long term receivable was $301 million. In March of 2007, the Governor signed Executive Order 2007-3 as a means to reduce expenditures due to an anticipated revenue shortfall for fiscal year 2007. In conjunction with this Executive Order, Public Act 15 of 2007 was voted into law by the legislature to allow two, one-time changes in the way the System is funded for fiscal year 2007. The first change revalues System assets according to their actual market value as of September 30, 2006, for the purpose of determining the required amount of employer contributions. Assets are currently valued by a five-year smoothing process, last performed in 1997. The second change allows for an interest only payment on the unfunded actuarially accrued liability (UAAL) for fiscal year 2007, deferring the remaining payments for this fiscal year. Through these two measures, the savings to the School Aid Fund (for K-12 and Intermediate School Districts), Community Colleges and Universities totaled approximately $297 million in the form of credits to offset an equal amount of pension obligation payments that those entities would otherwise have to pay. Funded Status Participating employers are required to contribute at an actuarially determined rate for both pension benefits and OPEB. For fiscal year 2006, the actuarial accrued liability (AAL) for pension benefits was $49.1 billion, and the actuarial value of assets was $43.0 billion, resulting in an unfunded actuarial accrued liability (UAAL) of $6.1 billion and a funded ratio of 87.5%. The covered payroll (annual payroll of active employees covered by the plan) was $9.8 billion, and the ratio of the UAAL to the covered payroll was 62.6%. For fiscal year 2006, the actuarial accrued liability (AAL) for OPEB benefits was $25.4 billion, and the actuarial value of assets was $630.2 million, resulting in an unfunded actuarial accrued liability (UAAL) of $24.8 billion and a funded ratio of 2.48%. The covered payroll (annual payroll of active employees covered by the plan) was $9.8 billion, and the ratio of the UAAL to the covered payroll was 252.5%. Actuarial Valuations and Assumptions Actuarial valuations for both the pension and OPEB plans involve estimates of the value of reported amounts and assumptions about the probability of occurrence of events far into the future. Examples include assumptions about

FINANCIAL SECTION
Notes to Basic Financial Statements (Continued)
36 • MICHIGAN PUBLIC SCHOOL EMPLOYEES’ RETIREMENT SYSTEM
future employment, mortality and the healthcare cost trend. Amounts determined regarding the funded status of the plan and the annual required contributions (ARC) are subject to continual revision as actual results are compared with past expectations and new estimates are made about the future. The schedule of funding progress, presented as required supplementary information following the notes to the financial statements, presents multi-year trend information about whether the actuarial value of plan assets for both pension and OPEB plans is increasing or decreasing over time relative to the actuarial accrued liabilities for benefits. The accompanying schedules of employer contributions present trend information about the amounts contributed to the plan by employers in comparison to the ARC, an amount that is actuarially determined in accordance with the parameters of GASB Statement No. 25 for pension contributions and GASB Statement No. 43 for health contributions. Projections of benefits for financial reporting purposes are based on the substantive plan (the plan as understood by the employer and plan members) and include the types of benefits provided at the time of each valuation and the historical pattern of sharing of benefit costs between the employer and plan members to that point. The actuarial methods and assumptions used include techniques that are designed to reduce the effects of short-term volatility in actuarial accrued liabilities and the actuarial value of assets, consistent with the long-term perspective of the calculations. The information presented in the required supplementary schedules was determined as part of the actuarial valuations at the dates indicated. Additional information as of the latest actuarial valuation follows:
Summary of Actuarial AssumptionsValuation Date 9/30/2006Actuarial Cost Method Entry Age, NormalAmortization Method Level Percent of Payroll, Closed
Remaining Amortization Period 30 years1
Asset Valuation Method 5-Year Smoothed Market2
Actuarial Assumptions: Inflation Rate 3.5% Investment Rate of Return - Pension 8% Investment Rate of Return - Health 4% Projected Salary Increases 3.5 to 15.9% Cost-of-Living Adjustments 3% Annual Non-Compounded for MIP Members Healthcare Cost Trend Rate 10.0% Year 1 graded to 3.5% Year 12
1 Based on the provisions of GASB Statement No. 25, when the actuarial accrued liability for a defined benefit pension plan is under funded or over funded, the difference should be amortized over a period not to exceed thirty years for the fiscal periods beginning on or after June 15, 2006.
2 The actuarial value of assets was written up to the market value as of September 30, 2006. Beginning October 1, 2006, a 5-year smoothed market value will again be developed.

FINANCIAL SECTION
Notes to Basic Financial Statements (Continued)
MICHIGAN PUBLIC SCHOOL EMPLOYEES’ RETIREMENT SYSTEM • 37
NOTE 4 - INVESTMENTS Investment Authority Under Public Act 380 of 1965, as amended, the authority for the purchase and the sale of investments resides with the State Treasurer. Investments are made subject to the Michigan Public Pension Investment Act, Public Act 314 of 1965, as amended. The Michigan Public Pension Investment Act authorizes, with certain restrictions, the investment of pension fund assets in stocks, corporate and government bonds and notes, mortgages, real estate, and certain short-term and alternative investments. Investments must be made for the exclusive purposes of providing benefits to active members, retired members and beneficiaries, and for defraying the expenses of investing the assets. Under Public Act 314 of 1965, as amended, the State Treasurer may invest up to 5% of the System’s assets in small businesses having more than one-half of assets or employees in Michigan as described in section 20(a) of the Act and up to 20% of the System’s assets in investments not otherwise qualified under the Act as described in section 20(d). Alternative investments include limited partnerships and distributions from these partnerships in the form of bonds, preferred stock, common stock and direct investments. Derivatives The State Treasurer employs the use of derivatives in the investment of the pension trust funds. Derivatives are used in managing pension trust fund portfolios, but uses do not include speculation or leverage of investments. Less than 12.0% of the total pension trust fund’s portfolio has been invested from time to time in futures contracts, collateralized mortgages, swap agreements, and option contracts. State investment statutes limit total derivative exposure to 15.0% of a fund’s total asset value, and restrict uses to replication of returns and hedging of assets. Swap agreements represent the largest category of derivatives used, and they represented 6.6% of market value of total pooled assets on September 30, 2007, and 9.0% of market value of total pooled assets on September 30, 2006. Futures contracts represent the second largest category of derivatives used, and they represented 0.2% of market value of total pooled assets on September 30, 2007, and 0.0% of market value of total pooled assets on September 30, 2006. Option contracts represent the third largest category of derivatives used, and they represented 0.0% of market value of total pooled assets on September 30, 2007, and 0.6% of market value of total pooled assets on September 30, 2006. To enhance management flexibility, the State Treasurer has traded futures contracts tied to Bond indices and Standard and Poor’s indices. The bond futures are combined with the rest of the fixed income investments to manage interest rate risk. The Standard and Poor’s futures contracts are combined with short-term investments or with underlying stock to replicate or enhance the return of the Standard and Poor’s indices. To capitalize on shorter-term windows of investment opportunities, the State Treasurer has traded option contracts. Options allow more flexibility in achieving investment goals without disturbing the return/risk profiles of the longer-term strategies of the underlying investments. To diversify the pension fund’s portfolio, the State Treasurer has entered into swap agreements with investment grade counterparties, which are tied to stock market indices in the United States and twenty-two foreign countries. The notional amounts of the swap agreements at September 30, 2007, and 2006, were $2,460.7 million and $2,830.5 million, respectively. Approximately one half of the notional amount tied to foreign stock market indices is hedged against foreign currency fluctuations. The swap agreements provide that the System will pay quarterly, over the term of the swap agreements, interest indexed to the three month London Inter Bank Offer Rate (LIBOR), adjusted for an interest rate spread, on the notional amount stated in the agreements. At the maturity of the swap agreements, the pension fund will either receive the increase in the value of the equity indices from the level at the inception of the agreements, or pay the decrease in the value of the indices. Swap agreement maturity dates range from October 2007 to September 2010. U.S. domestic LIBOR based floating rate notes and other investments earning short-term interest are held to correspond with the notional amount of the swap agreements. The State Treasurer maintains custody and control of these dedicated notes and short-term investments.

FINANCIAL SECTION
Notes to Basic Financial Statements (Continued)
38 • MICHIGAN PUBLIC SCHOOL EMPLOYEES’ RETIREMENT SYSTEM
The value of these synthetic equity structures is a combination of the value of the swap agreements and the value of the notes and short-term investments. The book value represents the cost of the notes and short-term investments. The current value represents the current value of the notes and short-term investments and the change in value of the underlying indices from the inception of the swap agreements. The current value is used as a representation of the fair value based on the intention to hold all swap agreements until maturity. For fiscal years ending September 30, 2007, and 2006, international and domestic equity investment programs involving swaps, received realized gains and earned interest income of $978.8 million and $647.7 million, respectively. The unrealized gain of $761.0 million at September 30, 2007, and $1,064.2 million at September 30, 2006, primarily reflects increases in international stock indices and changes in currency exchange rates. The combined swap structure generally realizes gains and losses on a rolling three year basis. The respective September 30, 2007, and 2006 swap values are as follows:
Notional Value Current Value
9/30/2007 (dollars in millions) 2,460.7$ 3,217.9$ 9/30/2006 (dollars in millions) 2,830.5 3,892.7
The September 30, 2006 amounts shown above reflect both the total International Equity Pool swap exposure, and the smaller swap exposure to the Standard and Poor’s Small Cap Index Pool. Swap contracts in the Standard and Poor’s Small Cap Index Pool matured during the year ending September 30, 2007. Therefore, the September 30, 2007 amounts shown above include only swaps from the International Equity Pool. Securities Lending State statutes allow the System to participate in securities lending transactions, and the System has, by way of a Security Lending Authorization Agreement, authorized the agent bank to lend the System’s securities to broker-dealers and banks pursuant to a form of loan agreement. During the fiscal year, the agent bank lent, at the direction of the System, the System’s securities and received cash (United States and foreign currency), securities issued or guaranteed by the United States government, sovereign debt rated A or better, convertible bonds and irrevocable bank letters of credit as collateral. The agent bank did not have the ability to pledge or sell collateral securities delivered absent a borrower default. Borrowers were required to deliver collateral for each loan equal to (i) in case of loaned securities denominated in United States dollars or whose primary trading market was located in the United States or sovereign debt issued by foreign governments, 102% of the market value of the loaned securities; and (ii) in the case of loaned securities not denominated in United States dollars or whose primary trading market was not located in the United States, 105% of the market value of the loaned securities. The System did not impose any restrictions during the fiscal year on the amount of loans that the agent bank made on its behalf and the agent bank indemnified the System by agreeing to purchase replacement securities, or return cash collateral in the event any borrower failed to return the loaned security or pay distributions thereon. There were no such failures by any borrowers during the fiscal year. Moreover, there were no losses during the fiscal year resulting from a default of the borrowers or the agent bank. During the fiscal year, the System and the borrowers maintained the right to terminate all securities lending transactions on demand. The cash collateral received on each loan was invested in a collateral account dedicated to the System. As of September 30, 2007, such account had an average weighted maturity to next reset of 25 days and an average weighted maturity of 710 days. Because the loans were terminable at will, their duration did not generally match the duration of the investments made with cash collateral. On September 30, 2007, the System had no credit risk exposure to borrowers. The cash collateral held for securities on loan for the System as of September 30, 2007 was

FINANCIAL SECTION
Notes to Basic Financial Statements (Continued)
MICHIGAN PUBLIC SCHOOL EMPLOYEES’ RETIREMENT SYSTEM • 39
$10,313,816,305. The carrying amount, which is the fair market value, of securities on loan for the System as of September 30, 2007 was $10,054,100,679. Gross income from security lending for the fiscal year was $470,628,987. Expenses associated with this income were the borrower’s rebate of $448,233,768 and fees paid to the agent of $3,582,867. Risk In accordance with GASB Statement No. 40, investments require certain disclosures regarding policies and practices and the risks associated with them. The credit risk, (including custodial credit risk and concentration of credit risk), the interest rate risk, and the foreign currency risk are discussed in the following paragraphs. Amounts represent the pro rata share of the underlying investments as required by GASB No. 40. These are held in internal investment pools and reported as such in the financial statements. Credit Risk - Credit risk is the risk that an issuer will not fulfill its obligations.
• Short-Term Fixed Income Investments - Prime commercial paper investments must be rated A-1 or P-1 at the
time of purchase as rated by the two major rating services Standard and Poor’s Corporation (S&P) and Moody’s Investor Service (Moody’s), respectively. Borrowers must have at least $400.0 million in commercial paper outstanding, and the State Treasurer may not invest in more than 10% of the borrower’s outstanding debt. The investments are further limited to $200.0 million in any borrower, unless the borrower has a A-1+ rating in which case the investment is not to exceed $300.0 million.
• Long-Term Fixed Income Investments – These investments must be investment grade or better at the time of
purchase unless specific requirements are met as defined in P.A. 314 of 1965, as amended, and the State Treasurer’s investment policy. Law defines investment grade as investments in the top four major grades, rated by two national rating services, S&P (AAA, AA, A, BBB) and Moody’s (Aaa, Aa, A, Baa). At September 30, 2007, the System was in compliance with the policy in all material aspects.
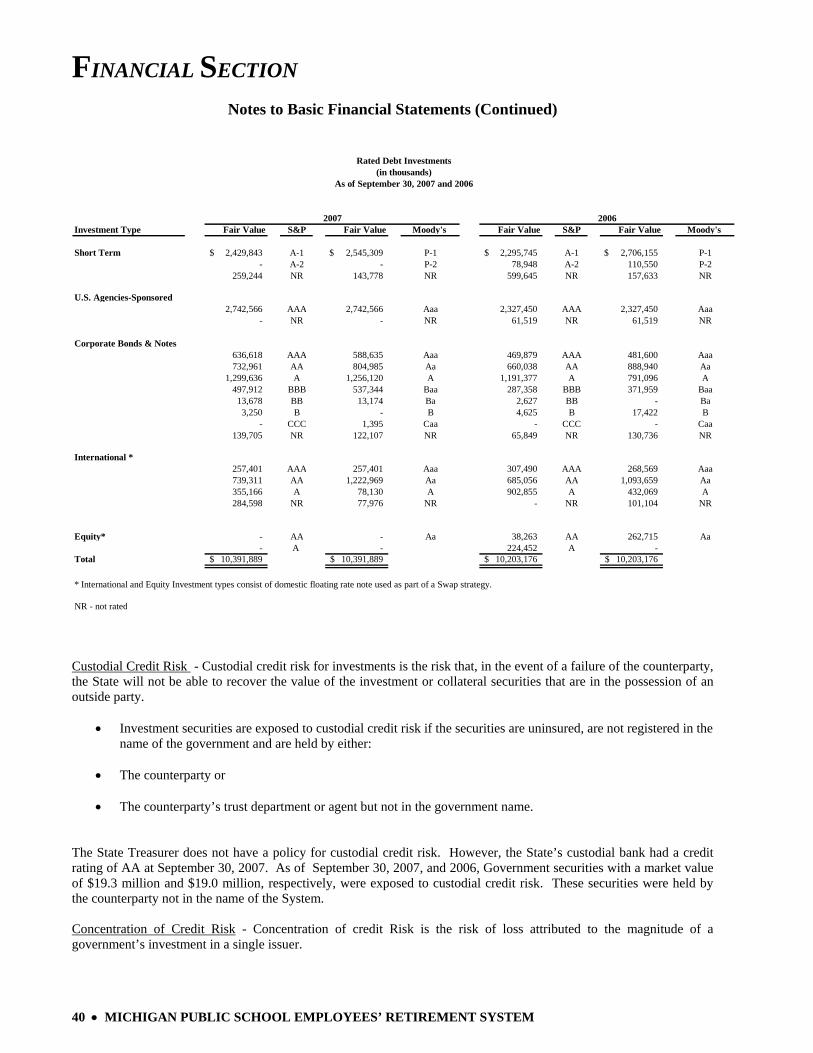
FINANCIAL SECTION
Notes to Basic Financial Statements (Continued)
40 • MICHIGAN PUBLIC SCHOOL EMPLOYEES’ RETIREMENT SYSTEM
Investment Type Fair Value S&P Fair Value Moody's Fair Value S&P Fair Value Moody's
Short Term 2,429,843$ A-1 2,545,309$ P-1 2,295,745$ A-1 2,706,155$ P-1- A-2 - P-2 78,948 A-2 110,550 P-2
259,244 NR 143,778 NR 599,645 NR 157,633 NR
U.S. Agencies-Sponsored 2,742,566 AAA 2,742,566 Aaa 2,327,450 AAA 2,327,450 Aaa - NR - NR 61,519 NR 61,519 NR
Corporate Bonds & Notes636,618 AAA 588,635 Aaa 469,879 AAA 481,600 Aaa732,961 AA 804,985 Aa 660,038 AA 888,940 Aa
1,299,636 A 1,256,120 A 1,191,377 A 791,096 A497,912 BBB 537,344 Baa 287,358 BBB 371,959 Baa
13,678 BB 13,174 Ba 2,627 BB - Ba3,250 B - B 4,625 B 17,422 B
- CCC 1,395 Caa - CCC - Caa139,705 NR 122,107 NR 65,849 NR 130,736 NR
International *257,401 AAA 257,401 Aaa 307,490 AAA 268,569 Aaa739,311 AA 1,222,969 Aa 685,056 AA 1,093,659 Aa355,166 A 78,130 A 902,855 A 432,069 A284,598 NR 77,976 NR - NR 101,104 NR
Equity* - AA - Aa 38,263 AA 262,715 Aa- A - 224,452 A -
Total 10,391,889$ 10,391,889$ 10,203,176$ 10,203,176$
* International and Equity Investment types consist of domestic floating rate note used as part of a Swap strategy.
NR - not rated
2006
Rated Debt Investments(in thousands)
As of September 30, 2007 and 2006
2007
Custodial Credit Risk - Custodial credit risk for investments is the risk that, in the event of a failure of the counterparty, the State will not be able to recover the value of the investment or collateral securities that are in the possession of an outside party.
• Investment securities are exposed to custodial credit risk if the securities are uninsured, are not registered in the name of the government and are held by either:
• The counterparty or
• The counterparty’s trust department or agent but not in the government name.
The State Treasurer does not have a policy for custodial credit risk. However, the State’s custodial bank had a credit rating of AA at September 30, 2007. As of September 30, 2007, and 2006, Government securities with a market value of $19.3 million and $19.0 million, respectively, were exposed to custodial credit risk. These securities were held by the counterparty not in the name of the System. Concentration of Credit Risk - Concentration of credit Risk is the risk of loss attributed to the magnitude of a government’s investment in a single issuer.

FINANCIAL SECTION
Notes to Basic Financial Statements (Continued)
MICHIGAN PUBLIC SCHOOL EMPLOYEES’ RETIREMENT SYSTEM • 41
Other than obligations issued, assumed or guaranteed by the United States, its agencies or United States government sponsored enterprises, the System is prohibited by P.A. 314 of 1965, as amended, from investing in more than 5% of the outstanding obligations of any one issuer or investing more than 5% of a system’s assets in the obligations of any one issuer. At September 30, 2007, and 2006, there were no investments in a single issuer that accounted for more than 5% of the System’s assets nor were there any investments totaling more than 5% of the obligations of any one issuer, other than U.S. Government Securities as described above. Interest Rate Risk - Fixed Income Investments - Interest rate risk is the risk that changes in interest rates of debt investments will adversely affect the fair value of an investment. The State Treasurer’s policy states that cash equivalents are invested in short-term fixed income securities with an average weighted maturity of less than one year to provide liquidity and safety of principal from capital market and default risk. At September 30, 2007, and 2006, the fair value of the System’s prime commercial paper was $2,684.5 million and $2,974.3 million with the weighted average maturity of 12 days and 41 days, respectively. The State Treasurer does not have a policy regarding interest rate risk for long-term debt investments. However, the pension funds are invested with a long-term strategy. The goal is to balance higher returns while accepting minimum risk for the return. Analyzing the yield curve on individual securities as compared to U.S. Treasuries determines, in part, what is an acceptable risk for the return. Therefore, market conditions such as lower interest rates result in shorter duration and higher interest rates result in longer duration.

FINANCIAL SECTION
Notes to Basic Financial Statements (Continued)
42 • MICHIGAN PUBLIC SCHOOL EMPLOYEES’ RETIREMENT SYSTEM
Fair Value
Effective Duration in
Years Fair Value
Effective Duration in
YearsGovernment U. S. Treasury 415,558$ 4.8 450,694$ 3.1 U. S. Agencies - Backed 1,266,064 5.7 976,139 5.7 U. S. Agencies - Sponsored 2,742,566 3.3 2,388,969 3.7
Corporate 3,323,760 4.9 2,681,753 4.4
International* U. S. Treasury 77,611 0.1 77,665 0.5 U. S. Agencies - Sponsored - 38,732 0.1 Corporate 1,636,476 0.1 1,856,669 0.1
Equities* Corporate - 265,715 0.6
Total 9,462,035$ 8,736,336$
The interest rates reset on a quarterly basis for these securities.*International and Equities contain U.S. Government and Corporate Debt Securities as a part of their derivative strategies.
2007 2006
Debt Securities(in thousands)
As of September 30, 2007 and 2006
Foreign Currency Risk - Foreign currency risk is the risk that changes in exchange rates will adversely affect the fair value of an investment or deposit. The System invests in various securities denominated in foreign currencies. These investments are limited to 20% of the total assets of the System with an additional limit of 5% of the outstanding foreign securities of any single issuer. No investment is allowed in a country that has been identified by the United States State Department as engaging in or sponsoring terrorism. These limits are set forth in P.A. 314 of 1965, as amended. The types of foreign investments include equities, fixed income, mutual funds, real estate, and limited partnerships. At September 30, 2007, and September 30, 2006, the total amount of foreign investment subject to foreign currency risk was $3,969.3 million and $2,489.1 million which amounted to 8.1% and 5.8% of total investments (exclusive of cash collateral on loaned securities) of the System, respectively.

FINANCIAL SECTION
Notes to Basic Financial Statements (Continued)
MICHIGAN PUBLIC SCHOOL EMPLOYEES’ RETIREMENT SYSTEM • 43
Alt. Invest. Equity Real Estate Equities DerivativesMarket Value Market Value Market Value Market Value Market Value
Region Country Currency in U.S. $ in U.S. $ in U.S. $ in U.S. $ in U.S. $*
AMERICA
Canada Dollar 46,424$ Mexico Peso 80,022$
EUROPE
European Union Euro 632,055$ 44,542 183,473 161,285$ Switzerland Franc 53,879 33,830 29,913 Sweden Krona 15,055 9,257 Denmark Krone 722 10,096 2,636 Norway Krone 11,985 1,737 U.K. Sterling 25,748 3,524 90,079 67,058
PACIFICAustralia Dollar 44,667 27,677 China Renminbi 9,540 Hong Kong Dollar 16,192 26,082 India Rupee 432 Japan Yen 4,333 135,646 108,030 41,093 Singapore Dollar 5,731 4,539 South Korea Won 16,857 22,984
VARIOUS 392,450$ 1,609,745
Total 662,136$ 328,307$ 392,450$ 2,192,164$ 394,261$
* Note: International derivatives' market value exposure to foreign currency risk is the net amount of unrealized gains and unrealized losses. Maturity dates on these investments range from October 2007 through September 2010 with an average maturity of 1.2 years.
Foreign Currency Risk(in thousands)
As of September 30, 2007
International
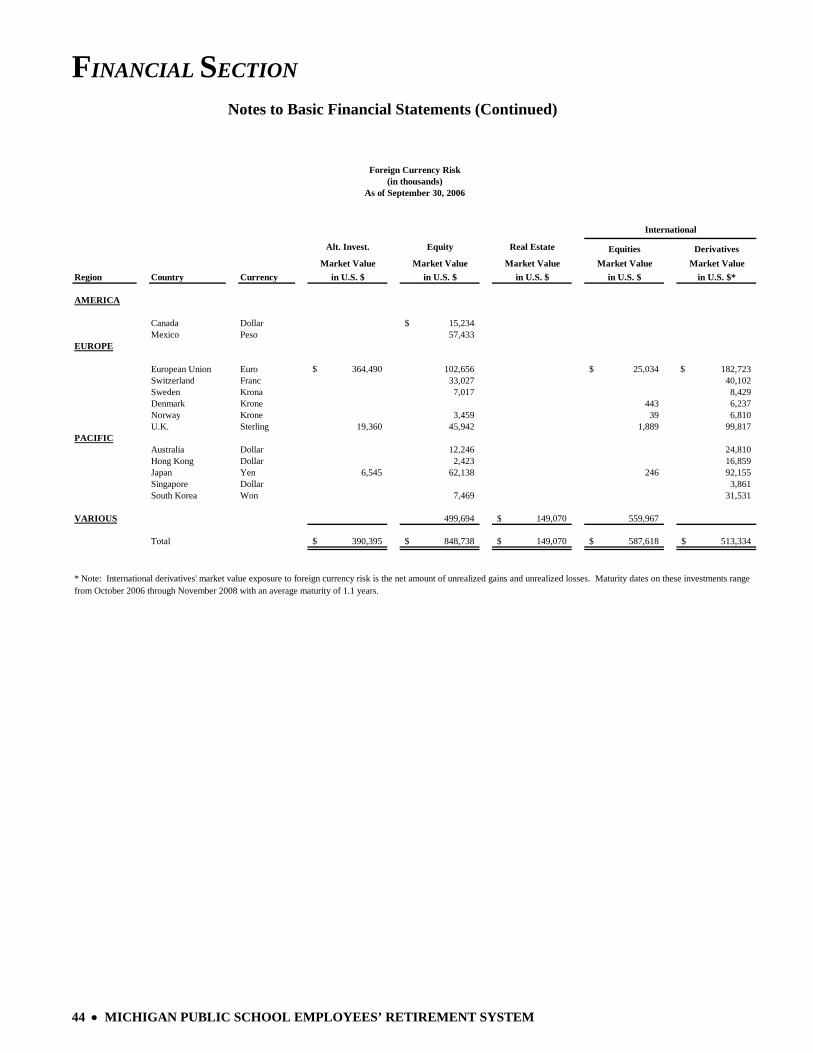
FINANCIAL SECTION
Notes to Basic Financial Statements (Continued)
44 • MICHIGAN PUBLIC SCHOOL EMPLOYEES’ RETIREMENT SYSTEM
Alt. Invest. Equity Real Estate Equities DerivativesMarket Value Market Value Market Value Market Value Market Value
Region Country Currency in U.S. $ in U.S. $ in U.S. $ in U.S. $ in U.S. $*
AMERICA
Canada Dollar 15,234$ Mexico Peso 57,433
EUROPE
European Union Euro 364,490$ 102,656 25,034$ 182,723$ Switzerland Franc 33,027 40,102 Sweden Krona 7,017 8,429 Denmark Krone 443 6,237 Norway Krone 3,459 39 6,810 U.K. Sterling 19,360 45,942 1,889 99,817
PACIFICAustralia Dollar 12,246 24,810 Hong Kong Dollar 2,423 16,859 Japan Yen 6,545 62,138 246 92,155 Singapore Dollar 3,861 South Korea Won 7,469 31,531
VARIOUS 499,694 149,070$ 559,967
Total 390,395$ 848,738$ 149,070$ 587,618$ 513,334$
* Note: International derivatives' market value exposure to foreign currency risk is the net amount of unrealized gains and unrealized losses. Maturity dates on these investments range from October 2006 through November 2008 with an average maturity of 1.1 years.
Foreign Currency Risk(in thousands)
As of September 30, 2006
International

FINANCIAL SECTION
Notes to Basic Financial Statements (Continued)
MICHIGAN PUBLIC SCHOOL EMPLOYEES’ RETIREMENT SYSTEM • 45
NOTE 5 — ACCOUNTING CHANGES The GASB has issued Statement No. 43, Financial Reporting for Postemployment Benefit Plans Other Than Pension Plans, which establishes uniform standards of financial reporting by state and local governmental entities for other postemployment benefit (OPEB) plans. The requirements of this statement are effective one year prior to the effective date of the related Statement (GASB Statement No. 45, Accounting and Financial Reporting by Employers for Postemployment Benefits other than Pensions) for the employer or the largest employer in the plan. Because the State of Michigan is a phase 1 government (those with total annual revenues of $100 million or more), the System is required to implement Statement No. 43 in financial statements for periods beginning after December 15, 2005. The Statement was adopted in fiscal year 2007 and is reflected in this report. The GASB has issued Statement No. 50, Pension Disclosures, which amends GASB Statements No. 25 and No. 27, and more closely aligns the financial reporting requirements for pensions with those for OPEB. This Statement is effective for periods beginning after June 15, 2007. Early implementation is encouraged. With the implementation of Statement No. 43 in fiscal year 2007, we have chosen to early implement Statement No. 50 as reflected in this report. NOTE 6 — COMMITMENTS AND CONTINGENCIES Under the Administrative Procedures Act, members may appeal a decision made by the Board. Once the administrative procedure has been exhausted, the decision may be appealed in Michigan’s court system. Various cases that have exhausted the administrative procedures have been appealed in the court system. These cases are in the normal course of business and the System does not anticipate any material loss as a result of the contingent liabilities.

FINANCIAL SECTION
46 • MICHIGAN PUBLIC SCHOOL EMPLOYEES’ RETIREMENT SYSTEM
Required Supplementary Information
Schedules of Funding Progress
Expressing the net assets available for benefits as a percentage of the actuarial accrued liability provides one indication of the System’s funding status. Analysis of this percentage over time indicates whether the System is becoming financially stronger or weaker. Generally, the greater this percentage, the stronger the System. Trends in unfunded actuarial accrued liability and annual covered payroll are both affected by inflation. Expressing the underfunded or overfunded actuarial accrued liability as a percentage of annual covered payroll approximately adjusts for the effects of inflation and aids analysis of progress made in accumulating sufficient assets to pay benefits when due. Generally, the smaller this percentage, the stronger the System.
Actuarial UnfundedValuation Actuarial Accrued (O verfunded)
Date Value of Liability Accrued Liability CoveredSept 30 Assets (AAL) Entry Age (UAAL) Payroll x
(a) (b) (b-a) (c)
1997 25,485$ 30,179$ 4,694$ 84.4 % 8,027$ 58.5 %1997 2 30,051 29,792 (259) 100.9 8,027 (3.2) 1998 31,870 32,137 267 99.2 8,265 3.2 1998 1 31,870 32,863 993 97.0 8,265 12.0 1999 34,095 34,348 253 99.3 8,644 2.9 2000 36,893 37,139 246 99.3 8,985 2.7 2001 38,399 39,774 1,375 96.5 9,264 14.8 2002 38,382 41,957 3,575 91.5 9,707 36.8 2003 38,726 44,769 6,043 86.5 10,044 60.2 2004 1 38,784 46,317 7,533 83.7 10,407 72.4 2005 38,211 48,206 9,995 79.3 10,206 97.9 2006 39,893 49,136 9,243 81.2 9,806 94.3 2006 3 42,995 49,136 6,141 87.5 9,806 62.6
1 Revised actuarial assumptions2 Revised actuarial assumptions and revised asset valuation method3 Revised asset valuation method.
Actuarial UnfundedValuation Actuarial Accrued (O verfunded)
Date Value of Liability Accrued Liability CoveredSept 30 Assets (AAL) Entry Age (UAAL) Payroll
(a) (b) (b-a) (c)
2006 630$ 25,387$ 24,757$ 2.5% 9,806$ 252.5 %
AAL of Covered Payroll(a/b) ((b-a)/c)
Other Postemployment Benefits ($ in millions)
Funded Ratio UAAL as a %
AAL of Covered Payroll(a/b) ((b-a)/c)
Retirement Benefits ($ in millions)
Funded Ratio UAAL as a %

FINANCIAL SECTION
MICHIGAN PUBLIC SCHOOL EMPLOYEES’ RETIREMENT SYSTEM • 47
Required Supplementary Information (Continued)
Schedules of Employer and Other Contributions
Annual Fiscal Year Required
Ended Contribution Actual PercentageSept. 30 (ARC)1 Contributions2 Contributed
1998 537,557,091$ 674,716,330$ 125.52 %1999 593,525,284 574,436,929 96.782000 572,605,695 655,258,923 114.432001 582,404,345 756,002,136 129.812002 668,956,633 603,949,327 90.282003 812,891,416 697,906,265 85.852004 978,035,492 697,647,338 71.332005 1,023,336,739 774,277,778 75.662006 1,161,843,239 995,932,425 85.722007 919,560,821 3 835,366,382 90.84
1 The ARC has been recalculated for all years presented in order to reflect only the employer's share of the actuarial required contributions and current assumptions.
2 Differences between the ARC and the actual contributions are the results of a timing difference between when the actuarial valuation is completed and the contributions are made. Contribution rates are adjusted each year through a reconciliation process.
3Pursuant to Public Act 15 of 2007, the System's assets were revalued to their actual market value as of September 30, 2006. The five-year smoothing will begin again in fiscal year 2008.
Annual
Fiscal Year Required OtherEnded Contribution Actual Governmental Percentage
Sept. 30 (ARC) Contributions Contributions Contributed
2007 2,497,157,802$ 671,680,400$ 63,054$ 26.90 %
Retirement Benefits
Other Postemployment Benefits

FINANCIAL SECTION
48 • MICHIGAN PUBLIC SCHOOL EMPLOYEES’ RETIREMENT SYSTEM
Notes to Required Supplementary Information
NOTE A - DESCRIPTION Ten year historical trend information designed to provide information about the System’s progress made in accumulating sufficient assets to pay benefits when due is presented in the preceding schedules. Other ten year historical trend information related to the System is presented in the Statistical and Actuarial Sections of the report. This information is presented to enable the reader to assess the progress made by the System in accumulating sufficient assets to pay pension and other postemployment benefits as they become due. Because this is the first year the System is reporting other postemployment benefits in accordance with GASB Statement No. 43, only one year of historical trend information is provided. In this transition year and until three actuarial valuations have been performed in accordance with the parameters, the required schedules of funding progress and employer contributions will include information for as many valuations as are available. The comparability of trend information is affected by changes in actuarial assumptions, benefit provisions, actuarial funding methods, accounting policies, and other changes. Those changes usually affect trends in contribution requirements and in ratios that use the pension and other postemployment benefit obligations as a factor. The Schedules of Funding Progress and Schedules of Employer and Other Contributions are reported as historical trend information. The Schedules of Funding Progress are presented to measure the progress being made to accumulate sufficient assets to pay benefits when due. The Schedules of Employer and Other Contributions are presented to show the responsibility of the Employer in meeting the actuarial requirements to maintain the System on a sound financial basis.

FINANCIAL SECTION
MICHIGAN PUBLIC SCHOOL EMPLOYEES’ RETIREMENT SYSTEM • 49
Supporting Schedules
2007 2006Personnel Services: Staff Salaries 6,078,833$ 6,029,778$ Retirement and Social Security 1,541,969 1,651,209 Other Fringe Benefits 1,294,697 1,128,708 Total 8,915,499 8,809,695
Professional Services: Accounting 1,537,394 1,268,334 Actuarial 245,500 174,869 Attorney General 223,467 215,737 Audit 51,700 48,501 Consulting 79,021 39,590 Medical 384,215 393,927 Total 2,521,297 2,140,958
Building and Equipment: Building Rentals 793,603 613,290 Equipment Purchase, Maintenance, and Rentals 57,804 53,144 Total 851,407 666,434
Miscellaneous: Travel and Board Meetings 24,130 39,372 Office Supplies 57,619 70,238 Postage, Telephone, and Other 2,783,564 2,323,112 Printing 256,005 328,032 Technological Support 9,079,681 8,123,257 Total 12,200,999 10,884,011
Total Administrative Expenses 24,489,202$ 22,501,098$
2007 2006 Health Fees 57,906,980$ 54,335,949$ Dental Fees 5,408,439 4,953,290 Vision Fees - 170,451
Total Administrative Expenses 63,315,419$ 59,459,690$
Health Plan Administrative ExpensesFor Fiscal Years Ended September 30, 2007 and 2006
Comparative Summary Schedule of Pension Plan Administrative Expenses
For Fiscal Years Ended September 30, 2007 and 2006
Comparative Summary Schedule of

FINANCIAL SECTION
50 • MICHIGAN PUBLIC SCHOOL EMPLOYEES’ RETIREMENT SYSTEM
Supporting Schedules (Continued)
2007 2006
Real Estate Operating Expenses 1,011,213$ 325,681$ Securities Lending Expenses 451,816,635 150,871,583 Other Investment Expenses*: ORS-Investment Expenses 8,559,613 7,913,937 Custody Fees 1,043,686 909,195 Management Fees-Real Estate 3,398,427 2,056,735 Management Fees-Alternative 51,248,340 43,139,209 Management Fees-International 1,884,423 - Research Fees 912,099 762,959
Total Investment Expenses 519,874,436$ 205,979,299$
*Refer to the Investment Section for fees paid to investment professionals
2007 2006
Accounting 1,537,394$ 1,268,334$ Independent Auditors 51,700 48,501 Medical Advisor 384,215 393,927 Actuary 245,500 174,869 Consulting 79,021 39,590 Attorney General 223,467 215,737
Total Payments 2,521,297$ 2,140,958$
Schedule of Investment Expenses
Schedule of Payments to Consultants
For Fiscal Years Ended September 30, 2007 and 2006
For Fiscal Years Ended September 30, 2007 and 2006

FINANCIAL SECTION
MICHIGAN PUBLIC SCHOOL EMPLOYEES’ RETIREMENT SYSTEM • 51
This page was intentionally left blank.

FINANCIAL SECTION
52 • MICHIGAN PUBLIC SCHOOL EMPLOYEES’ RETIREMENT SYSTEM
Supporting Schedules (Continued)Detail of Changes in Plan Net Assets (Pension and Other Postemployment Benefits)For the Year Ended September 30, 2007
MemberEmployee Investment Employer
Contributions Plan ContributionsAdditions:Contributions: Member contributions 50,117,301$ 306,643,911$ Employer contributions: Colleges, universities and federal 63,505,126$ School districts and other 771,861,256 Other governmental contributions Total contributions 50,117,301 306,643,911 835,366,382
Investment income (loss): Net appreciation (depreciation) in fair value of investments Interest, dividends, and otherInvestment expenses: Real estate operating expenses Other investment expensesSecurities lending activities: Securities lending income Securities lending expenses
Net investment income (loss) - - -
Transfers from other systems 5,794 Miscellaneous income 22,989 Total additions 50,123,095 306,643,911 835,389,371
Deductions: Benefits and refunds paid to plan members and beneficiaries: Retirement benefits Health benefits Dental/vision benefits Refund of member contributions 3,802,635 27,744,845 580,684 Transfers to other systems 65,587 39,985 Administrative expenses Total deductions 3,868,222 27,784,830 580,684 Net Increase (Decrease) before other changes 46,254,873 278,859,081 834,808,687 Other Changes in Net Assets: Interest allocation 52,543,707 257,744,140 Transfers upon retirement (102,849,659) (224,896,110)
Transfer - stabilization account Transfers of employer shares (2,292,319,836) Total other changes in net assets (50,305,952) 32,848,030 (2,292,319,836) Net Increase (Decrease) (4,051,079) 311,707,111 (1,457,511,149) Net Assets Held in Trust for Pension and OPEB Benefits:Beginning of Year 1,583,873,582 3,506,035,283 (17,065,061,088) End of Year 1,579,822,503$ 3,817,742,394$ (18,522,572,237)$
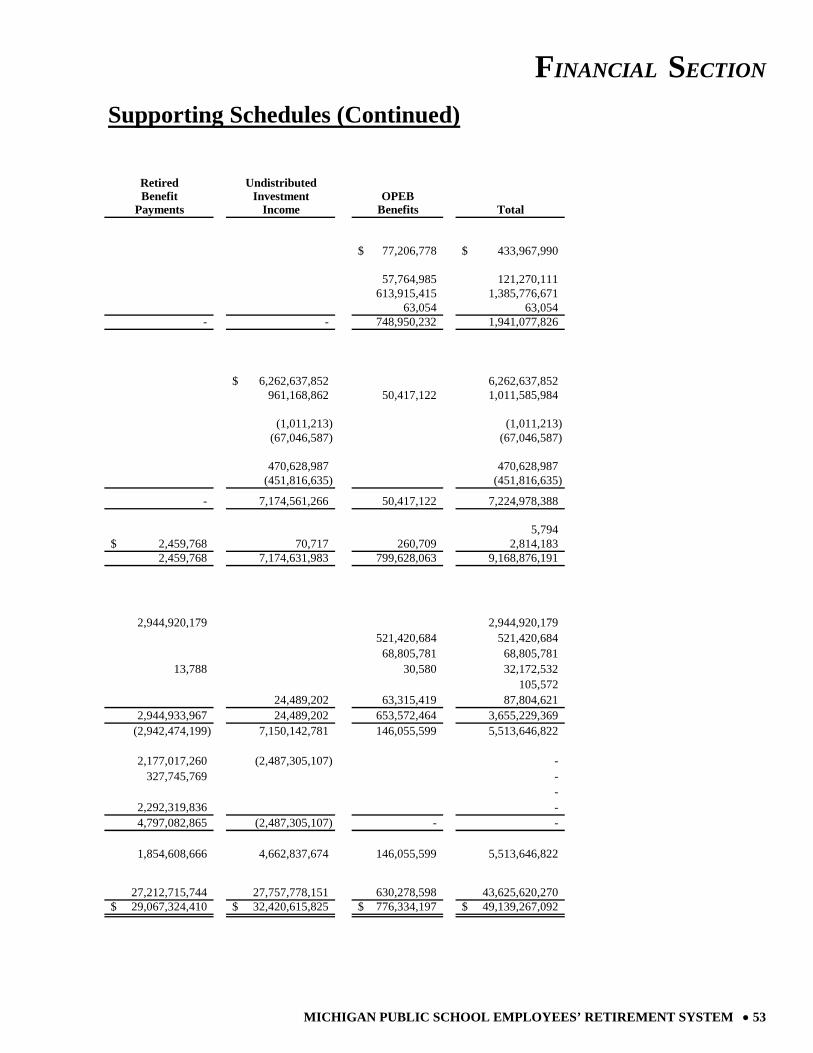
FINANCIAL SECTION
MICHIGAN PUBLIC SCHOOL EMPLOYEES’ RETIREMENT SYSTEM • 53
Supporting Schedules (Continued)
Retired UndistributedBenefit Investment OPEB
Payments Income Benefits Total
77,206,778$ 433,967,990$
57,764,985 121,270,111 613,915,415 1,385,776,671
63,054 63,054 - - 748,950,232 1,941,077,826
6,262,637,852$ 6,262,637,852 961,168,862 50,417,122 1,011,585,984
(1,011,213) (1,011,213) (67,046,587) (67,046,587)
470,628,987 470,628,987 (451,816,635) (451,816,635)
- 7,174,561,266 50,417,122 7,224,978,388
5,794 2,459,768$ 70,717 260,709 2,814,183 2,459,768 7,174,631,983 799,628,063 9,168,876,191
2,944,920,179 2,944,920,179 521,420,684 521,420,684
68,805,781 68,805,781 13,788 30,580 32,172,532
105,572 24,489,202 63,315,419 87,804,621
2,944,933,967 24,489,202 653,572,464 3,655,229,369 (2,942,474,199) 7,150,142,781 146,055,599 5,513,646,822
2,177,017,260 (2,487,305,107) - 327,745,769 -
- 2,292,319,836 - 4,797,082,865 (2,487,305,107) - -
1,854,608,666 4,662,837,674 146,055,599 5,513,646,822
27,212,715,744 27,757,778,151 630,278,598 43,625,620,270 29,067,324,410$ 32,420,615,825$ 776,334,197$ 49,139,267,092$

FINANCIAL SECTION
54 • MICHIGAN PUBLIC SCHOOL EMPLOYEES’ RETIREMENT SYSTEM
Supporting Schedules (Continued)Detail of Changes in Plan Net Assets (Pension and Other Postemployment Benefits)For the Year Ended September 30, 2006
MemberEmployee Investment Employer
Contributions Plan ContributionsAdditions:Contributions: Member contributions 225,497,865$ 293,101,855$ Employer contributions: Colleges, universities and federal 69,385,887$ School districts and other 926,546,538 Other governmental contributions Total contributions 225,497,865 293,101,855 995,932,425
Investment income (loss): Net appreciation (depreciation) in fair value of investments Interest, dividends, and otherInvestment expenses: Real estate operating expenses Other investment expensesSecurities lending activities: Securities lending income Securities lending expenses
Net investment income (loss) - - -
Transfers from other systems 2,647 Miscellaneous income Total additions 225,500,512 293,101,855 995,932,425
Deductions: Benefits and refunds paid to plan members and beneficiaries: Retirement benefits Health benefits Dental/vision benefits Refund of member contributions 2,614,414 20,808,233 474,347 Transfers to other systems 86,530 36,529 Administrative expenses Total deductions 2,700,944 20,844,762 474,347 Net Increase (Decrease) before other changes 222,799,568 272,257,093 995,458,078 Other Changes in Net Assets: Interest allocation 49,280,411 83,242,741 Transfers upon retirement (93,295,235) (281,936,074)
Transfer - stabilization account Transfers of employer shares (8,652,938,007) Total other changes in net assets (44,014,824) (198,693,333) (8,652,938,007) Net Increase (Decrease) 178,784,744 73,563,760 (7,657,479,929) Net Assets Held in Trust for Pension and OPEB Benefits:Beginning of Year 1,405,088,838 3,432,471,523 (9,407,581,159) End of Year 1,583,873,582$ 3,506,035,283$ (17,065,061,088)$

FINANCIAL SECTION
MICHIGAN PUBLIC SCHOOL EMPLOYEES’ RETIREMENT SYSTEM • 55
Supporting Schedules (Continued)
Retired UndistributedBenefit Investment OPEB
Payments Income Benefits Total
71,813,553$ 590,413,273$
59,030,437 128,416,324 627,899,121 1,554,445,659
64,574 64,574 - - 758,807,685 2,273,339,830
4,016,811,356$ 4,016,811,356 959,109,354 41,909,987 1,001,019,341
(325,681) (325,681) (54,782,035) (54,782,035)
156,767,000 156,767,000 (150,871,583) (150,871,583)
- 4,926,708,411 41,909,987 4,968,618,398
2,647 464,297$ 4,788 469,085 464,297 4,926,713,199 800,717,672 7,242,429,960
2,761,292,217$ 2,761,292,217 565,261,409 565,261,409
69,550,438 69,550,438 6,828 42,370 23,946,192
123,059 22,501,098 59,459,690 81,960,788
2,761,299,045 22,501,098 694,313,907 3,502,134,103 (2,760,834,748) 4,904,212,101 106,403,765 3,740,295,857
1,551,509,717 (1,684,032,869) - 375,231,309 -
- 8,652,938,007 -
10,579,679,033 (1,684,032,869) - -
7,818,844,285 3,220,179,232 106,403,765 3,740,295,857
19,393,871,459 24,537,598,919 523,874,833 39,885,324,413 27,212,715,744$ 27,757,778,151$ 630,278,598$ 43,625,620,270$

56 • MICHIGAN PUBLIC SCHOOL EMPLOYEES’ RETIREMENT SYSTEM
This page was intentionally left blank.

MICHIGAN PUBLIC SCHOOL EMPLOYEES’ RETIREMENT SYSTEM • 57
INVESTMENT SECTION Prepared by Michigan Department of Treasury, Bureau of Investments
Jon M. Braeutigam, Acting Director
Report on Investment Activity Asset Allocation
Investment Results List of Largest Stock Holdings List of Largest Bond Holdings
Schedule of Investment Fees Schedule of Investment Commissions
Investment Summary

INVESTMENT SECTION
Report on Investment Activity
58 • MICHIGAN PUBLIC SCHOOL EMPLOYEES’ RETIREMENT SYSTEM
INTRODUCTION The State Treasurer reports investment activity quarterly to the Investment Advisory Committee (Committee), which reviews the investments, goals, and objectives of the retirement funds and may submit recommendations regarding them to the State Treasurer. The Investment Advisory Committee may also, by a majority vote, direct the State Treasurer to dispose of any holdings that, in the Committee’s judgment, are not suitable for the funds involved, and may, by unanimous vote, direct the State Treasurer to make specific investments. The Investment Advisory Committee was created by Act 380 of the Public Acts of 1965. The three public members of the five-member committee are appointed by the Governor with the advice and consent of the Senate for three-year terms. The Director of the Department of Labor and Economic Growth and the Director of the Department of Management and Budget are ex-officio members. As of September 30, 2007, members of the Committee were as follows: David G. Sowerby, CFA (public member), Robert E. Swaney, CFA (public member), James B. Jacobs (public member), Keith W. Cooley (ex-officio member), and Lisa Webb Sharpe (ex-officio member). The public members serve without pay, but may be paid actual and necessary travel and other expenses. INVESTMENT POLICY & GOALS Investment policy states that the fiduciary will operate within standard investment practices of the prudent person and in accordance with Public Employee Retirement System Investment Act 314 of 1965. The fiduciary is authorized to invest in government obligations, corporate obligations, various short-term obligations, corporate (domestic and international) stocks, private equity interests, mutual funds, real estate interests, and other investments subject to specific parameters. Above all, pension fund assets are to be invested for the exclusive benefit of the members of the System, in a fiduciary capacity. The System’s Proxy Voting Policy sets forth directives on the following issues: Boards of Directors, corporate governance, social issues, corporate restructurings and defenses. All proxies are reviewed and voted in accordance with the System’s policy. The primary function of the System is to provide retirement, survivor and disability benefits to its members. The State Treasurer is the sole investment fiduciary and custodian of the System’s investments pursuant to State law. The goals of the System are: 1. Achieve the optimal rate of return possible within prudent levels of risk.
2. Maintain sufficient liquidity to pay benefits. 3. Diversify assets to preserve capital and avoid large losses.
4. Meet or exceed the actuarial assumption over the long term. 5. Perform in the top half of the public plan universe over the long term. 6. Exceed individual asset class benchmarks over the long term. 7. Operate in a cost-effective manner.

INVESTMENT SECTION
Report on Investment Activity (Continued)
MICHIGAN PUBLIC SCHOOL EMPLOYEES’ RETIREMENT SYSTEM • 59
The strategy for achieving these goals is carried out by investing the assets of the System according to a three-year asset allocation model. The System currently has seven different asset classes it invests in, which provides for a well-diversified portfolio.
Three-YearInvestment Category Target %
Domestic Equity - Active 29.2% 24.0% Large Cap Core Pool 15.6% Large Cap Value Pool 5.0% Large Cap Growth Pool 5.4% Mid Cap Pool 2.2% Small Cap Pool 1.0%Domestic Equity - Passive 17.8% 16.0% S&P 500 Index Pool 16.1% S&P MidCap Index Pool 1.7%International Equity 11.3% 12.0% International Equity Pool - Passive 8.4% International Equity Pool - Active 2.9%Alternative Investments Pool 14.0% 14.0%Real Estate Pool 8.9% 10.0%Fixed Income 16.4% 22.0% Government Bond Pool 7.9% Corporate Bond Pool 5.5% Fixed Income Bond Pools 2.5% Treasury Inflation Prot. Sec. Pool 0.5%Short Term Investment Pool 2.4% 1.0%Commodities 0.0% 1.0%
Total 100.0% 100.0%xxx xxx
Asset Allocation(Excludes Collateral on Loaned Securities)
As of 9/30/07Actual %
INVESTMENT AUTHORITY Pursuant to State Law (Section 91 of Act No. 380 of the Public Acts of 1965, as amended), the State Treasurer, State of Michigan, is the investment fiduciary for the following four State sponsored retirement systems: Michigan Public School Employees’ Retirement System, Michigan State Employees’ Retirement System, Michigan State Police Retirement System, and Michigan Judges’ Retirement System. Act No. 314 of the Public Acts of 1965, as amended, authorizes the investment of assets of public employee retirement systems or plans created and established by the State or any political subdivision.

INVESTMENT SECTION
Report on Investment Activity (Continued)
60 • MICHIGAN PUBLIC SCHOOL EMPLOYEES’ RETIREMENT SYSTEM
INVESTMENT RESULTS Total Portfolio Results For the fiscal year ended September 30, 2007, the total System’s rate of return was 17.2% as compiled by State Street Analytics. Annualized rates of return for the three-year period ending September 30, 2007, were 14.3%; for the five-year period were 14.0%; and for the ten-year period were 8.2%. Returns were calculated using a time-weighted rate of return in accordance with industry standards, unless a modification is described in the discussion of the reported return. Investment results were once again driven by double-digit returns from every major asset class except fixed income and short-term investments. Equity performance was strong much of the year in spite of soaring commodity and energy prices. International stocks turned in the best performance, led by emerging markets and the benefit of a declining dollar. Domestic equities were also strong, with mid cap stocks (S&P 400) turning in the best performance for the period, followed by larger companies (S&P 500) then small cap (S&P 600). Credit markets experienced turmoil in July and August due to problems associated with subprime mortgages and concerns with housing. However, a 50 basis point cut in the federal funds rate in mid September provided some stability to the credit markets as well as a positive lift to the equity markets. The Alternative Investments Division continued to benefit from an extraordinarily liquid credit environment that fueled strong mergers and acquisitions, for most of the year, and refinancing activity for its buyout sector. Robust commercial real estate markets allowed the Real Estate pool to experience strong gains from both sales and appraisals of property. Investment grade bonds generally had positive returns for the year. The yield curve shifted from being inverted to being positively sloped as ten to thirty year rates remained relatively unchanged while short-term to ten year rates declined.
For the fiscal year, the Dow Jones Industrial Average provided a total return of 21.7%, while the broader based S&P 500 returned 16.4%. The Lehman Brothers U.S. Government/Credit Bond Index appreciated 5.08%.
The U.S. economy grew at an estimated rate of 2.6% in fiscal year 2007 as measured by real gross domestic product. The first half was weak due to a significant rise in imports and a decline in inventories. The second half of the fiscal year picked up due to a narrowing of the trade deficit, a pick up in defense spending and a surge in commercial construction. Corporate earnings remained strong for most of the year, led by robust profits from energy companies and a rebound in technology, but earnings growth slowed for some sectors, namely housing and financials, late in the year. Strong demand sent commodity and energy prices climbing during most of the year, with oil moving close to $80 per barrel in September.
For the first time since June of 2003, Federal Reserve Chairman Ben Bernanke and the Federal Reserve decided unanimously to cut the federal funds rate from 5.25% to 4.75%. They expressed a general concern that tightening credit conditions and disruptions in the financial markets might have the potential to intensify the housing correction and possibly restrain future economic growth. The System remains well diversified, both across and within asset classes, and positioned to benefit from moderate economic growth. Large Cap Core Pool The objective of the pool of large company core stocks is to generate a rate of return from investment in common stocks and equity equivalents that exceeds that of the S&P 500 Index. The pool invests primarily in equities and equity-related securities of U.S. companies with market capitalization generally greater than $5 billion that have passed several screens based on the stocks’ valuation, risk attributes and tracking error relative to the overall index. The goal is to build a portfolio of stocks that will provide excess returns relative to the S&P 500 while providing minimal tracking error to the index. At times a portion of the pool may be invested in exchange traded funds (ETFs) and fixed-income short-term securities with maturities of less than one year.

INVESTMENT SECTION
Report on Investment Activity (Continued)
MICHIGAN PUBLIC SCHOOL EMPLOYEES’ RETIREMENT SYSTEM • 61
The pool invests in equities and equity related securities that are listed on U.S. national securities exchanges, including American Depository Receipts (ADRs). It may also invest in stocks that are traded over-the-counter. The pool diversifies its investments by allocating its equities with consideration of the weightings of the S&P 500 Index.
The following summarizes the weightings of the pool as of September 30, 2007:
Financials 20.5 %Technology 17.2Healthcare 12.9Consumer Discretionary 11.5Industrials 10.3Consumer Staples 9.3Energy 8.7Utilities 3.2Telecom 3.0Materials 2.5Short Term Investments 0.9Total 100.0 %
The System’s Large Cap Core pool was established in July of 2007, and therefore does not have performance for the entire 2007 fiscal year. At the close of fiscal year 2007, the Large Cap Core pool represented 15.6% of total investments. The following summarizes the System's 78.1% ownership share of the Large Cap Core pool at September 30, 2007:
Short Term Pooled Investments 21,609$ Equities 7,599,000 Settlement Principal Payable (13,932) Accrued dividends 9,352 Total 7,616,029$
Large Cap Core Pool(in thousands)
Large Cap Value Pool The objective of the pool of large company value stocks is to generate a rate of return from investment in common stocks and equity equivalents that exceeds that of the S&P Citigroup Value Index. The pool invests primarily in equities and equity-related securities of U.S. companies with market capitalization generally greater than $5 billion that are significantly under-priced as measured by several valuation criteria, including price-to-earnings and price-to-book value ratios, as well as below fair value as determined by several quantitative and qualitative valuation models. The focus is on companies trading 25% or more below estimated fair value with

INVESTMENT SECTION
Report on Investment Activity (Continued)
62 • MICHIGAN PUBLIC SCHOOL EMPLOYEES’ RETIREMENT SYSTEM
experienced management and conservative accounting practices. At times a portion of the pool may be invested in fixed-income short-term securities with maturities of less than one year. The pool invests in equities and equity related securities that are listed on U.S. national securities exchanges, including American Depository Receipts (ADRs). It may also invest in stocks that are traded over-the-counter. The pool diversifies its investments by allocating its equities among ten sectors with some consideration to the weightings of the S&P Citigroup Value Index.
The following summarizes the weightings of the pool as of September 30, 2007:
The System’s Large Cap Value pool achieved a total rate of return of 13.7% for fiscal year 2007. This compared with 16.1% for the S&P Citigroup Value Index. At the close of fiscal year 2007, the Large Cap Value pool represented 5.0% of total investments. This compares to 13.2% for fiscal year 2006. The following summarizes the System's 78.4% ownership share of the Large Cap Value pool at September 30, 2007:
Short Term Pooled Investments 95,594$ Equities 2,365,919 Accrued dividends 1,840 Total 2,463,353$
Large Cap Value Pool(in thousands)
Financials 33.0 %Healthcare 17.8Consumer Discretionary 9.5Energy 9.3Technology 8.1Short Term Investments 6.6Consumer Staples 5.9Industrials 3.7Telecom 3.2Materials 2.2Utitilies 0.7Total 100.0 %

INVESTMENT SECTION
Report on Investment Activity (Continued)
MICHIGAN PUBLIC SCHOOL EMPLOYEES’ RETIREMENT SYSTEM • 63
Large Cap Growth Pool The primary investment objective is to generate a rate of return from investment in common stocks and equity equivalents that exceeds that of the S&P Citigroup Growth Index.
The pool invests primarily in equities and equity-related securities of U.S. companies with market capitalization generally greater than $3 billion and which offer above-average and sustainable growth in revenues, earnings, and cash flow, identifiable catalysts, and reasonable valuations relative to their fundamentals. The focus is on companies with a strong presence in categories anticipated to be fast growing, with high rates of unit sales growth and seasoned management. At times a portion of the pool may be invested in fixed-income short-term securities with maturities of less than one year. The pool invests in equities and equity related securities that are listed on U.S. national securities exchanges, including American Depository Receipts (ADRs). It may also invest in stocks that are traded over-the-counter. The pool diversifies its investments by allocating its equities with weightings that approximate the weightings of the S&P Citigroup Growth Index. The following summarizes the weightings of various sectors in the pool as of September 30, 2007:
Technology 22.9 %Healthcare 17.2Energy 14.7Consumer Staples 13.0Industrials 11.1Financials 8.7Consumer Discretionary 8.3Short Term Investments 3.4Utitilies 0.4Materials 0.3Total 100.0 %
The Large Cap Growth pool’s total rate of return was 19.8% for fiscal year 2007 versus 16.8% for the S&P 500 Citigroup Growth Index. At the close of fiscal year 2007, the Large Cap Growth pool represented 5.4% of total investments. This compares to 13.1% for fiscal year 2006. The following summarizes the System's 78.0% ownership share of the Large Cap Growth pool at September 30, 2007:
Short Term Pooled Investments 36,053$ Equities 2,621,835 Accrued dividends 976 Total 2,658,864$
Large Cap Growth Pool(in thousands)

INVESTMENT SECTION
Report on Investment Activity (Continued)
64 • MICHIGAN PUBLIC SCHOOL EMPLOYEES’ RETIREMENT SYSTEM
Mid Cap Pool Nine Mid Cap managers were selected in 2005 and they were funded out of the Large Cap Value and Growth pools. The manager’s investment styles range from value, growth and core and they select stocks with average market capitalizations greater than $1 billion but less than $5 billion. The investment objective of the Mid Cap manager pool is to generate a combined rate of return from investment in common stocks and equivalents that exceeds the S&P 400 MidCap Index. The Mid Cap pool return for fiscal year 2007 was 22.5% versus the benchmark’s 18.8%. At the close of fiscal year 2007, the Mid Cap pool represented 2.2% of total investments. This compares to 2.1% for fiscal year 2006. The following summarizes the System's ownership share and composition of the Mid Cap pool at September 30, 2007:
CramerRosenthal Los Angeles Wellington
Artisan McGlynn Capital ManagementMidCap MidCap MidCap MidCapValue Value Core Core
Total Investment 175,233$ 172,878$ 110,384$ 154,479$
Ownership Percentage 77.4% 77.2% 77.4% 77.4%
WellingtonAlliance Putnam Rainer UBS ManagementMidCap MidCap MidCap MidCap MidCapGrowth Growth Growth Growth Growth
Total Investment 116,429$ 44,883$ 110,647$ 99,761$ 102,464$
Ownership Percentage 77.2% 77.1% 77.1% 77.1% 77.1%
Mid Cap Value and Core Pool(in thousands)
Mid Cap Growth Pool(in thousands)
Small Cap Pool The primary investment objective is to generate a rate of return from investment in common stocks and equivalents that exceeds the S&P 600 Small Cap Index by selecting stocks with market capitalizations greater than $60 million but less than $3 billion.

INVESTMENT SECTION
Report on Investment Activity (Continued)
MICHIGAN PUBLIC SCHOOL EMPLOYEES’ RETIREMENT SYSTEM • 65
In December of 2006, five new small cap managers were hired in the Small Cap pool, and in January of 2007, three managers were terminated for performance reasons. The current System’s Small Cap pool is invested with one Growth, one Core, and five Value managers. The Small Cap pool return for fiscal year 2007 was 17.9% versus the benchmark’s 14.9%. At the close of fiscal year 2007, the Small Cap pool represented 1.0% of total investments. This compares to 0.9% for fiscal year 2006. The following summarizes the System’s ownership share and composition of the Small Cap Pool at September 30, 2007:
Donald Smith Fisher GW Capital Northpointe Opus CapitalSmallCap SmallCap Small Cap SmallCap SmallCap
Value Value Value Value ValueTotal Investment 74,149$ 101,693$ 59,576$ 65,724$ 20,017$
Ownership Percentage 76.5% 79.5% 76.5% 77.1% 76.5%
Small Cap Value Pool(in thousands)
Champlain Pier CapitalSmallCap SmallCap
Core GrowthTotal Investment 64,738$ 86,591$
Ownership Percentage 76.5% 76.5%
Small Cap Growth and Core Pool(in thousands)
S&P 500 Index Pool The objective of the enhanced S&P 500 Index pool is to closely match the return performance of its benchmark, the S&P 500 Index, and to use low risk strategies to offset transaction costs and add to performance when possible. The pool generally holds all 500 stocks that make up the Standard & Poor’s 500 Index in proportion to their weighting in the index. The following summarizes the sector weightings of the pool as of September 30, 2007:

INVESTMENT SECTION
Report on Investment Activity (Continued)
66 • MICHIGAN PUBLIC SCHOOL EMPLOYEES’ RETIREMENT SYSTEM
Financials 19.8 %Information Technology 16.2Healthcare 11.7Energy 11.7Industrials 11.5Consumer Staples 9.5Consumer Discretionary 9.2Telecomm. Services 3.7Utilities 3.5Materials 3.2Total 100.0 %
The S&P 500 Index pool return for the fiscal year was 16.5% versus the benchmark's 16.4%. At the close of fiscal year 2007, the S&P 500 Index pool represented 16.1% of total investments. This compares to 16.4% for fiscal year 2006. The following summarizes the System's 78.0% ownership share of the S&P 500 Index pool at September 30, 2007:
Short Term Pooled Investments 106,102$ Equities 7,755,910 Futures Contracts 177 Accrued dividends 8,861 Total 7,871,050$
S&P 500 Index Pool(in thousands)
S&P MidCap Index Pool The objective of the S&P MidCap Index pool is to closely match the return performance of its benchmark, the S&P MidCap, and use low risk strategies to offset transaction costs and add to performance when possible. The pool invests in equities of mid-size firms. The S&P MidCap Index pool return for the fiscal year was 18.7% versus the benchmark’s 18.8%. At the close of fiscal year 2007, the S&P MidCap Index pool represented 1.7% of total investments. This compares to 1.9% for fiscal year 2006. The schedule on the following page summarizes the System’s 78.0% ownership share of the S&P MidCap Index pool at September 30, 2007:

INVESTMENT SECTION
Report on Investment Activity (Continued)
MICHIGAN PUBLIC SCHOOL EMPLOYEES’ RETIREMENT SYSTEM • 67
Short Term Pooled Investments 11,590$ Equities 813,404 Futures Contracts (27) Settlement Principal Payable (3,806) Accrued dividends 543 Total 821,704$
S&P MidCap Index Pool(in thousands)
International Equity Pool - Passive The objective of the International Equity Pool - Passive is to match the return performance of the S&P/Citigroup Broad Market Index (BMI) Europe and Pacific Composite (EPAC) adjusted for net dividends. Fifty percent of the benchmark is hedged to the U.S. Dollar and the other half is impacted by foreign currency exchange rate changes. The total passive international return for the fiscal year was 20.7% compared to the Citigroup BMI-EPAC return of 19.8%. Core passive exposure to international equity returns is achieved primarily by investing in a combination of fixed income LIBOR notes, short-term fixed income investments, and equity swap agreements on foreign stock indices in developed markets. Interest on the dedicated notes and short-term fixed income investments is exchanged for international stock returns, and the total notional amount of the swap agreements is invested in the approximate proportions of the S&P/Citigroup Broad Market Index (BMI) Europe and Pacific Composite (EPAC) country weightings in related indices. Use of swap agreements for a core position began in 1993, an American Depository Receipts (ADR) and index-related security portfolio was added in June of 1999 to increase portfolio management flexibility, and a country fund portfolio with targeted capitalization was added in September of 2002 to improve exposure to the smallest companies in the BMI index. The combination of notes, dedicated short-term investments and equity swap agreements was valued at $3,217.9 million on September 30, 2007. That valuation included a net unrealized gain of $761.0 million. The combined Swap agreements, notes and short-term investments together continue to perform like a stock index fund that realizes all gains and losses on a rolling three year basis. During fiscal year 2007, the pool received realized gains of $896.9 million on swap equity exposures and dedicated short-term investments. During the same period, $67.3 million of interest income was earned from international equity swaps. At the close of fiscal year 2007, the International Equity – Passive pool represented 8.4% of total investments. This compares to 10.4% for fiscal year 2006. The following schedule on the next page summarizes the System's 78.0% ownership share of the International Equity Pool - Passive at September 30, 2007:

INVESTMENT SECTION
Report on Investment Activity (Continued)
68 • MICHIGAN PUBLIC SCHOOL EMPLOYEES’ RETIREMENT SYSTEM
Short Term Pooled Investments 821,022$ Equities 838,997 Fixed Income Securities 1,714,087 Market Value of Equity Contracts 751,228 Accrued dividends and interest 12,127 Total 4,137,461$
International Equity Pool - Passive(in thousands)
International Equity Pool - Active The investment objective is to generate a rate of return from investment in common stocks and equivalents that exceeds the S&P Citigroup Broad Market Index (BMI) World Ex-United States. That benchmark is impacted by foreign currency exchange rate changes. In fiscal year 2005, the System invested in Alliance Bernstein International Style Blend, a mix of Large Cap Growth and Value. During fiscal year 2006, investments were made in the following funds: The Wellington Trust Company International Research Equity Fund and the State Street Global Asset International Alpha Select Pool. Two international managers, SSgA Int’l Small Cap Alpha and GlobeFlex Int’l Small Cap, were selected and funded during April 2007, and added to the three managers already in the pool. The International Equity Pool – Active return for the fiscal year was 26.5% versus the benchmark’s 26.0%. At the close of fiscal year 2007, the International Equity - Active pool represented 2.9% of total investments. This compares to 1.8% for fiscal year 2006. The following summarizes the System’s ownership share and composition of the pool at September 30, 2007:
Globeflex SSGAAlliance Bernstein Wellington SSGA International International
International International International SmallCap SmallCapTotal Investment 445,328$ 369,874$ 431,824$ 76,040$ 80,030$
Ownership Percentage 77.6% 77.4% 77.4% 77.9% 77.9%
International Equities Pools - Active(in thousands)
Alternative Investments Pool The Alternative Investments pool objective is to meet or exceed the benchmark for all private equity investments over long time periods. The benchmark is a blend of the S&P 500 Index plus 300 basis points and the 10 Year Yield plus 300 basis points using ending weights of equity and fixed income holdings within the portfolio. Alternative Investments are investments in the private equity market, primarily through limited partnerships. The following schedule on the next page summarizes the weightings of the pool as of September 30, 2007:
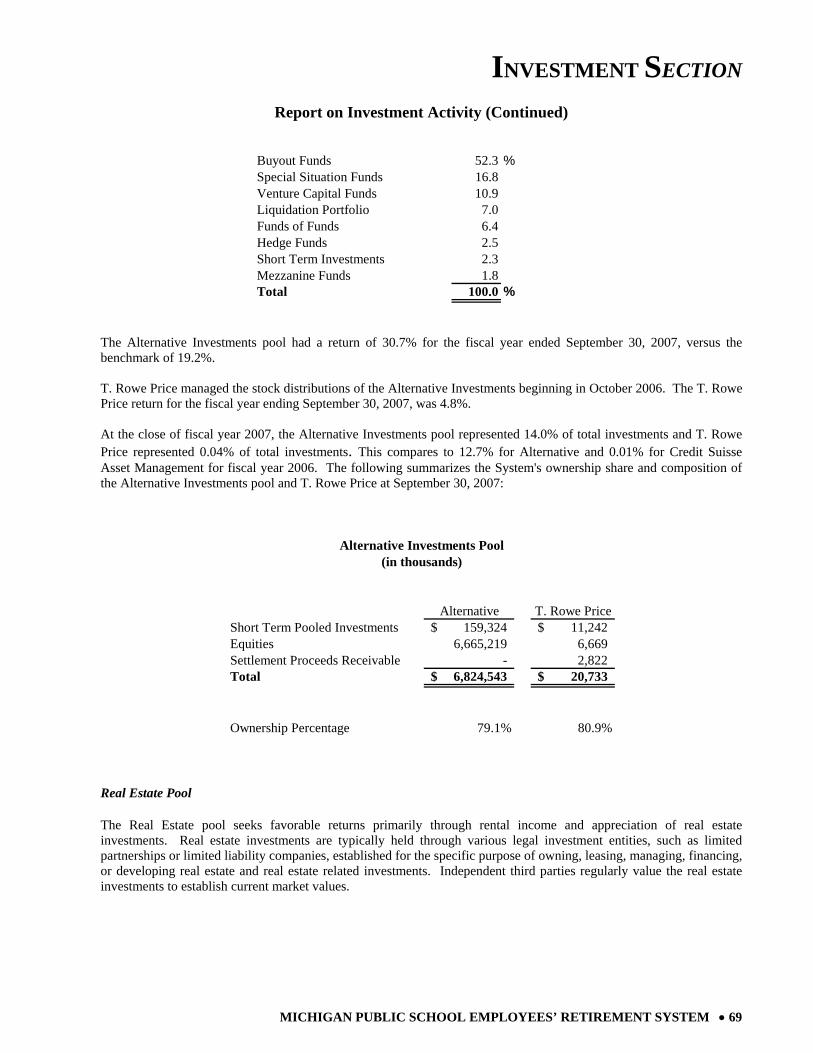
INVESTMENT SECTION
Report on Investment Activity (Continued)
MICHIGAN PUBLIC SCHOOL EMPLOYEES’ RETIREMENT SYSTEM • 69
Buyout Funds 52.3 %Special Situation Funds 16.8Venture Capital Funds 10.9Liquidation Portfolio 7.0Funds of Funds 6.4Hedge Funds 2.5Short Term Investments 2.3Mezzanine Funds 1.8Total 100.0 %
The Alternative Investments pool had a return of 30.7% for the fiscal year ended September 30, 2007, versus the benchmark of 19.2%. T. Rowe Price managed the stock distributions of the Alternative Investments beginning in October 2006. The T. Rowe Price return for the fiscal year ending September 30, 2007, was 4.8%. At the close of fiscal year 2007, the Alternative Investments pool represented 14.0% of total investments and T. Rowe Price represented 0.04% of total investments. This compares to 12.7% for Alternative and 0.01% for Credit Suisse Asset Management for fiscal year 2006. The following summarizes the System's ownership share and composition of the Alternative Investments pool and T. Rowe Price at September 30, 2007:
Alternative T. Rowe PriceShort Term Pooled Investments 159,324$ 11,242$ Equities 6,665,219 6,669 Settlement Proceeds Receivable - 2,822 Total 6,824,543$ 20,733$
Ownership Percentage 79.1% 80.9%
Alternative Investments Pool(in thousands)
Real Estate Pool The Real Estate pool seeks favorable returns primarily through rental income and appreciation of real estate investments. Real estate investments are typically held through various legal investment entities, such as limited partnerships or limited liability companies, established for the specific purpose of owning, leasing, managing, financing, or developing real estate and real estate related investments. Independent third parties regularly value the real estate investments to establish current market values.

INVESTMENT SECTION
Report on Investment Activity (Continued)
70 • MICHIGAN PUBLIC SCHOOL EMPLOYEES’ RETIREMENT SYSTEM
The Real Estate pool diversifies its holdings by:
• Geography - The pool is diversified geographically with emphasis placed upon domestic (U.S.) real estate investments. The pool may also make foreign real estate investments, which are not expected to exceed 15% of the value of the pool.
• Property Size and Value - The pool diversifies its holdings so that it is not concentrated in a limited number of large real estate investments.
• Property Type - The pool is diversified by type of property as summarized in the table below.
Multi-family apartments 22.8 %Commercial office buildings 22.3Hotels 19.4Retail shopping centers 14.4Industrial warehouse buildings 7.5Short Term Investments 5.7Senior Living 3.3Land 2.3For Sale Housing 2.3Total 100.0 %
The Real Estate pool generated a return of 20.5% for fiscal year 2007, while the benchmark return was 16.0%. The benchmark is the National Council of Real Estate Investment Fiduciaries Property Index less 130 basis points. During the year the pool benefited from continued strong flow of capital into the commercial real estate market from both domestic and foreign investors coupled with improvement in commercial real estate fundamentals, which resulted in the pool realizing strong appreciation and gains on asset sales. At the close of fiscal year 2007, the Real Estate pool represented 8.9% of total investments. This compares to 7.5% for fiscal year 2006. The following summarizes the System’s 76.5% ownership share of the Real Estate pool at September 30, 2007:
Short Term Pooled Investments 246,628$ Equities 4,110,389 Fixed Income Securities 4 Total 4,357,021$
Real Estate Pool(in thousands)
Government Bond Pool The objectives are to maximize the rate of return consistent with sound portfolio management principles and to outperform the Lehman Brothers Government Index. The Government Bond Pool invests in a diversified portfolio of United States’ government bonds including, but not limited to: treasuries, agencies, government sponsored enterprises and government guaranteed mortgages. To achieve above average returns, the pool emphasizes those sectors exhibiting the best risk/reward relationship relative to historical norms and the outlook for interest rates.

INVESTMENT SECTION
Report on Investment Activity (Continued)
MICHIGAN PUBLIC SCHOOL EMPLOYEES’ RETIREMENT SYSTEM • 71
During the fiscal year, rates continued to be volatile. Ten-year treasuries started the year at 4.6%, rose to 5.3%, then declined and ended at 4.6%. The yield curve shifted from inverted to positively sloped. Ten to thirty-year rates remained relatively unchanged while short-term to ten-year rates declined. For the fiscal year ending September 30, 2007, the Government Bond pool returned 5.9% which compared favorably to the 5.6% return of the Lehman Brothers Government Index. The following summarizes the security type breakdown of the pool as of September 30, 2007:
U.S. Agency 62.8 %GNMA 20.5U.S. Guaranteed 11.9Short Term Investments/Accruals 4.8Total 100.0 %
At the close of fiscal year 2007, the Government Bond pool represented 7.9% of total investments. This compares to 8.3% for fiscal year 2006. The following summarizes the System's 78.0% ownership share of the Government Bond pool at September 30, 2007:
Short Term Pooled Investments 151,538$ Fixed Income Securities 3,695,895 Accrued interest 35,855 Total 3,883,288$
Government Bond Pool(in thousands)
Treasury Inflation Protected Securities Pool A Treasury Inflation Protected Securities (TIPS) Pool was established in January 2007. Transfer of TIPS holdings in the Government Bond Pool provided the initial funding for the TIPS pool. The TIPS pool return from inception to fiscal year end was 6.3%. At the close of fiscal year 2007, the Treasury Inflation Protected Securities pool represented 0.5% of total investments. The following schedule on the next page summarizes the System's 75.6% ownership share of the TIPS pool at September 30, 2007:

INVESTMENT SECTION
Report on Investment Activity (Continued)
72 • MICHIGAN PUBLIC SCHOOL EMPLOYEES’ RETIREMENT SYSTEM
Short Term Pooled Investments 3,257$ Fixed Income Securities 212,293 Accrued interest 1,024 Total 216,574$
TIPS Pool(in thousands)
Corporate Bond Pool The objectives are to maximize the rate of return consistent with sound portfolio management principles and to outperform the Lehman Brothers Credit Index. The Corporate Bond Pool invests in a diversified portfolio of investment grade corporate issues. Such issues are rated in the top four categories by nationally recognized rating agencies. Non-rated issues may be acceptable if they are determined to be of comparable quality. To achieve above average returns, the pool emphasizes those sectors exhibiting the best risk/reward ratio relative to historical norms and the outlook for interest rates. For the fiscal year ending September 30, 2007, the Corporate Bond pool returned 5.3% compared to the 4.2% return of the Lehman Brothers Credit Index. The pool’s performance improved as the year progressed due to the decline in rates later in the year. The following summarizes the security type breakdown of the pool as of September 30, 2007:
Financials 23.7 %Healthcare 17.9Industrials 13.1Consumer Staples 11.9Consumer Discretionary 10.3Other 7.3Utilities 5.5Energy 2.7Materials 2.6Information Technology 2.6Short Term Investments/Accurals 2.4Total 100.0 %
At the close of fiscal year 2007, the Corporate Bond pool represented 5.5% of total investments. This compares to 6.2% for fiscal year 2006. The following schedule on the next page summarizes the System's 78.3% ownership share of the Corporate Bond pool at September 30, 2007:

INVESTMENT SECTION
Report on Investment Activity (Continued)
MICHIGAN PUBLIC SCHOOL EMPLOYEES’ RETIREMENT SYSTEM • 73
Short Term Pooled Investments 31,812$ Fixed Income Securities 2,637,449 Accrued interest 32,062 Total 2,701,323$
Corporate Bond Pool(in thousands)
Fixed Income Core Pools Five Fixed Income Core managers were selected in fiscal year 2006, beginning March 31, 2006. Their objective is to generate a rate of return exceeding the Lehman Aggregate Index net of fees. Delaware Investments, Dodge & Cox, Dupont Capital Management, Pyramis Global Advisors, and Metropolitan West Asset Management were the firms hired. The Fixed Income Core pools combined rate of return for the fiscal year was 5.3% versus the benchmark’s 5.1%. At the close of fiscal year 2007, the Fixed Income Core pools represented 1.4% of total investments. This compares to 0.9% for fiscal year 2006. The following summarizes the System's ownership share and composition of the five Fixed Income Core pools at September 30, 2007:
Delaware Dodge & Cox Dupont Pyramis Metro WestFixed Income Fixed Income Fixed Income Fixed Income Fixed Income
Core Core Core Core CoreTotal Investment 83,816$ 143,780$ 102,178$ 205,520$ 144,928$
Ownership Percentage 77.5% 77.5% 77.5% 77.5% 77.5%
Fixed Income Core Pools(in thousands)
Fixed Income Corporate Manager Pools Four fixed income corporate managers were selected and commenced management on September 15, 2006, with an objective of exceeding the return of the Lehman Credit Index net of fees. The four managers hired were AllianceBernstein, Prudential Financial, Western Asset, and Taplin, Canida & Habacht. The Fixed Income Corporate Manager pools combined rate of return for the fiscal year was 4.7% versus the benchmark’s 4.2%. At the close of fiscal year 2007, the Fixed Income Corporate Manager pools represented 1.1% of total investments. This compares to 0.9% for fiscal year 2006. The following schedule on the next page summarizes the System's ownership share and composition of the four Fixed Income Corporate Manager pools at September 30, 2007:

INVESTMENT SECTION
Report on Investment Activity (Continued)
74 • MICHIGAN PUBLIC SCHOOL EMPLOYEES’ RETIREMENT SYSTEM
Alliance Prudential Western Taplin,Bernstein Financial Asset Canida & HabachtCorporate Corporate Corporate Corporate
Total Investment 121,286$ 183,529$ 120,878$ 120,436$
Ownership Percentage 77.6% 77.6% 77.6% 77.6%
Fixed Income Corporate Manager Pools(in thousands)
Short Term Investment Pool The objective of the Short Term Investment pool is to closely match the return performance of its benchmark, the 30 day Treasury bill. The Short Term Investment pool return for the fiscal year was 5.7% versus the benchmark’s 4.9%. Potential areas of investment are:
• Obligations of the United States or its agencies. • Bankers’ acceptances, commercial accounts, certificates of deposit or depository receipts. • Repurchase agreements for the purchase of securities issued by the US government or its agencies. • Commercial paper rated at the time of purchase within the two highest classifications established by not less
than two national rating services as determined by the State Treasurer.
As of September 30, 2007, the Short Term Investment pool was 100% invested in commercial paper because of its advantages in yield and flexibility in maturities. At the close of fiscal year 2007, the Short Term Investment pool represented 2.4% of total investments. This compares to 2.9% for fiscal year 2006. The System’s ownership share of the Short Term Investment pool at September 30, 2007 was $1,177,366,201 composed of fixed income securities and equity in common cash.

INVESTMENT SECTION
MICHIGAN PUBLIC SCHOOL EMPLOYEES’ RETIREMENT SYSTEM • 75
Asset Allocation – Security Type Only
International Equity 11.3%
Short Term Investment 2.4%
Domestic Equity 47.0%
Real Estate8.9%
Alternative Investment 14.0%
Fixed Income16.4%
Investment Results for the Period Ending September 30, 2007Annualized Rate of Return1
Investment Category Current Year 3 Years 5 Years 10 Years
Total Portfolio 17.2 % 14.3 % 14.0 % 8.2 %
Total Domestic Equity 16.6 13.1 15.6 6.6 S&P 1500 Index 16.6 13.4 15.8 7.0 Large Cap Value Pool 13.7 14.1 Large Cap Growth Pool 19.8 11.7 Mid Cap Pool 22.5 Small Cap Pool 17.9 14.3 S&P 500 Index Pool 16.5 13.2 S&P MidCap Index Pool 18.7 15.8
International Equity Pool - Passive 20.7 21.8 21.3 8.4 S&P Citigroup BMI - EPAC 50/50 19.8 22.5 21.6 8.1International Equity Pool - Active 26.5
Alternative Investments Pool 30.7 26.2 19.9 13.3 Alternative Blended Benchmark2 19.2 16.1 18.6 10.0T. Rowe Price (Stock Distributions) 4.8
Real Estate Pool 20.5 17.9 13.5 12.0 NCREIF Property Blended Index3 16.0 16.9 13.8 12.2
Total Fixed Income 5.6 4.1 4.3 5.7 Lehman Brothers Government/Credit 5.1 3.7 4.2 6.0 Government Bond Pool 5.9 4.5 Corporate Bond Pool 5.3 3.7 Fixed Income Core Pool 5.3 Fixed Income Managers Pool 4.7
Short Term Investment Pool 5.7 4.3 3.1 4.2 30 Day Treasury Bill 4.9 3.9 2.8 3.51Calculations used a time-weighted rate of return based on the market rate of return in accordance with industry standards.2As of 1/1/07, index is blend of S&P 500 plus 300 bps and 10 year yield plus 300 bps based on ending weights.
History prior to 1/1/07 is S&P 500 plus 300 bps.3As of 10/1/05, index is NCREIF less 130 bps. History prior to 10/1/05 reflects NCREIF less 75 bps.

INVESTMENT SECTION
76 • MICHIGAN PUBLIC SCHOOL EMPLOYEES’ RETIREMENT SYSTEM
Largest Assets Held
Rank Shares Stocks Market Value1 6,048,904 Exxon Mobil Corporation 559,886,548$ 2 13,129,995 General Electric Corporation 543,581,805 3 3,149,733 SPDR Trust 480,586,237 4 15,954,161 Microsoft Corporation 470,009,575 5 6,675,305 American International Group 451,584,415 6 8,960,829 Citigroup Incorporated 418,201,889 7 6,183,970 Johnson and Johnson 406,286,846 8 5,213,965 Procter and Gamble Corporation 366,750,265 9 3,642,628 Chevron Corporation 340,877,139
10 10,063,253 Cisco Systems Incorporated 333,194,293
Rank Par Amount Bonds & Notes Market Value1 195,107,650$ General Electric Cap Corp 5.7275% FRN Due 2-15-2017 190,709,143$ 2 151,279,620 Treasury Inflation Index Due 7-15-2014 164,861,371 3 157,515,653 Wachovia Corp 5.28125% FRN Due 4-23-2012 156,157,080 4 155,952,540 Bank Nova Scotia 5.37% FRN Due 10-12-2007 155,964,704 5 116,964,405 HSBC Finance Corp 5.46% FRN Due 10-22-2007 116,988,500 6 116,964,405 JP Morgan Chase & Co 5.7375% FRN Due 9-21-2012 116,506,840 7 81,875,084 American Honda Finance 5.25% FRN Due 1-22-2008 81,890,312 8 77,976,270 First Tennessee Bank 5.41% FRN Due 11-7-2008 78,129,571 9 77,976,270 American Honda Finance 5.74313% FRN Due 3-13-2008 78,040,211
10 77,976,270 HBOS PLC 5.70313% FRN Due 3-14-2008 78,008,708
1A complete list of stock and bond holdings is available from the Michigan Department of Treasury.
The System's investments are commingled in various pooled accounts. Amounts, par value and numberof shares represent the System's pro-rata share based on its ownership of the investment pools.
Largest Stock Holdings (By Market Value)1
September 30, 2007
Largest Bond Holdings (By Market Value)1
September 30, 2007

INVESTMENT SECTION
MICHIGAN PUBLIC SCHOOL EMPLOYEES’ RETIREMENT SYSTEM • 77
Schedule of Investment Fees The State Treasurer is the investment fiduciary and custodian of the System’s funds pursuant to State law. Outside advisors are utilized to augment the State Treasurer’s internal staff. Only 30.4% of the total investment portfolio is managed by fully discretionary outside advisors. The Michigan Department of Treasury’s cost of operations applicable to the System for the fiscal year amounted to $8,560 thousand or two and five tenths basis points (.025%) of the market value of the Assets under Management of the State Treasurer. Act 380 of the Public Acts of 1965 created an Investment Advisory Committee (Committee) comprised of the directors of the Department of Labor and Economic Growth and the Department of Management and Budget, or their duly authorized representatives, and three public members appointed by the Governor with the advice and consent of the Senate. The public members serve without pay, but may be paid actual and necessary travel and other expenses. The Committee meets quarterly to review investments, goals and objectives and may submit recommendations to the State Treasurer. The Committee may also, by a majority vote, direct the State Treasurer to dispose of any holding in which in the Committee’s judgment is not suitable for the fund involved, and may by unanimous vote direct the State Treasurer to make specific investments.
Investment Managers' Fees:
Assets underManagement Fees Basis(in thousands) (in thousands) Points1
State Treasurer 34,067,473$ 8,560$ 2.5Outside Advisors for Fixed Income 1,226,352 1,488 12.1 Mid Cap Equity 1,087,157 5,458 50.2 Small Cap Equity 472,488 3,269 69.2 International Equity 2,197,639 4,037 18.4 Alternative 6,671,738 51,248 76.8 Real Estate 3,215,554 3,398 10.6
Total 48,938,401$ 77,458$
Other Investment Services Fees: Assets in Custody 47,761,035$ 1,956$ Securities on Loan 10,054,101 3,583
1Outside Advisors Fees are netted against income for Fixed Income, Small Cap Equity, Mid Cap Equity, and International Equity. For Alternative partnership agreements that define the management fees, the asset management fees range from 100 on remaining assets under management to 250 basis points of the committed capital. For Real Estate, the asset management fees normally range from 50 to 175 basis points. Alternative and Real Estate fees, in most cases, are netted against income.

INVESTMENT SECTION
78 • MICHIGAN PUBLIC SCHOOL EMPLOYEES’ RETIREMENT SYSTEM
Schedule of Investment Commissions
Actual Estimated EstimatedActual Number of Average Trade Research Estimated Estimated
Commissions Shares Commission Costs Costs Trade ResearchPaid (1) Traded (1) Per Share Per Share Per Share Costs Costs
Investment Brokerage Firms:Banc of America Securities LLC 23,541$ 784,700 0.03$ 0.01$ 0.02$ 7,847$ 15,694$ Bear Stearns & Co Inc. 574,203 27,914,270 0.02 0.01 0.01 279,143 295,061 Broadcort Capital 97,408 3,246,946 0.03 0.01 0.02 32,469 64,939 Cantor Fitzgerald & Co. 188,043 7,491,980 0.03 0.01 0.02 74,920 113,123 Citigroup Global Markets Inc. 525,649 17,283,886 0.03 0.01 0.02 172,839 352,810 Cowen & Co., LLC 232,619 7,753,978 0.03 0.01 0.02 77,540 155,080 Credit Suisse Securities LLC 501,321 17,286,967 0.03 0.01 0.02 172,870 328,451 Deutsche Bank Securities Inc. 207,206 6,870,624 0.03 0.01 0.02 68,706 138,500 Goldman Sachs & Co. 404,814 13,491,975 0.03 0.01 0.02 134,920 269,894 The Griswold Co., Inc. 149,173 7,458,668 0.02 0.01 0.01 74,587 74,586 Investment Technology Group Inc. 195 16,220 0.01 0.01 - 162 32 ISI Capital LLC 112,450 3,638,435 0.03 0.01 0.02 36,384 76,066 J P Morgan Securities Inc. 233,268 7,735,327 0.03 0.01 0.02 77,353 155,915 Labranche Financial Services Inc. (MARA) 28,124 1,385,995 0.02 0.01 0.01 13,860 14,264 Lehman Brothers Inc. 315,652 10,515,754 0.03 0.01 0.02 105,158 210,494 Liquidnet Inc. 170 8,516 0.02 0.01 0.01 85 85 Merrill Lynch, Pierce, Fenner & Smith, Inc. 764,286 25,067,052 0.03 0.01 0.02 250,671 513,616 Mischler Financial Group, Inc. 24,236 807,862 0.03 0.01 0.02 8,079 16,157 Morgan Stanley Co Inc. 403,495 13,449,861 0.03 0.01 0.02 134,499 268,997 OTA LLC 40,698 1,356,601 0.03 0.01 0.02 13,566 27,132 Prudential Equity Group LLC 157,881 5,262,684 0.03 0.01 0.02 52,627 105,254 Punk, Ziegel & Co. 88,145 2,938,164 0.03 0.01 0.02 29,382 58,763 Sandford C. Bernstein & Co. LLC 346,032 11,534,383 0.03 0.01 0.02 115,344 230,688 Stanford Group Co. 60,950 1,943,925 0.03 0.01 0.02 19,439 41,511 State Street Brokerage Services 1,452,324 127,349,685 0.01 0.01 - 1,273,497 178,827 Thinkequity Partners LLC 3,164 84,905 0.04 0.01 0.03 849 2,315 Thomas Weisel Partners 36,051 949,012 0.04 0.01 0.03 9,490 26,561 UBS Securities LLC 331,982 11,066,061 0.03 0.01 0.02 110,661 221,321 Wachovia Capital Markets, LLC 243 8,110 0.03 0.01 0.02 81 162 Wayne Company 13,937 425,865 0.03 0.01 0.02 4,259 9,679 Weeden & Co. 63,752 6,375,236 0.01 0.01 - 63,752 -
Total 7,381,012$ 341,503,647 0.03$ (2) 0.01$ 0.02$ 3,415,039$ 3,965,977$
(1) Commissions are included in purchase and sale prices of investments. The commissions and shares represent the System's pro-rata share of commission and share transactions based on ownership in the investment pools.(2) The average commission rate per share for all brokerage firms.
Fiscal Year Ended September 30, 2007

INVESTMENT SECTION
MICHIGAN PUBLIC SCHOOL EMPLOYEES’ RETIREMENT SYSTEM • 79
Investment Summary Fiscal Year Ended September 30, 2007
Percent ofPercent of Investment & Investment &
Market Value (a) Market Value Interest Income (b) Interest Income
Fixed Income Pools 8,027,536,505$ 16.4% 411,794,782$ 5.7%
Domestic Equity Pools 22,990,644,891 47.0% 3,321,673,296 45.7%
Real Estate Pool 4,357,021,472 8.9% 698,138,988 9.6%
Alternative Investment Pools 6,845,275,888 14.0% 1,675,439,461 23.0%
International Equities Pools 5,540,556,596 11.3% 1,096,721,528 15.0%
Short Term Investment Pools 1,177,366,201 2.4% 70,455,781 1.0%
Total 48,938,401,553$ 100.0% 7,274,223,836$ 100.0%
a Market value excludes $10,313,816,305 in cash collateral for security lending for fiscal year 2007.
b Total Investment & Interest Income excludes net security lending income of $18,812,352.

INVESTMENT SECTION
80 • MICHIGAN PUBLIC SCHOOL EMPLOYEES’ RETIREMENT SYSTEM
Investment Summary Fiscal Year Ended September 30, 2006
Percent ofPercent of Investment & Investment &
Market Value (a) Market Value Interest Income (b) Interest Income
Fixed Income Pools 7,050,167,117$ 16.3% 267,056,100$ 5.3%
Domestic Equity Pools 20,826,454,404 48.4% 2,027,327,525 40.4%
Real Estate Pool 3,245,483,600 7.5% 558,370,328 11.1%
Alternative Investment Pools 5,491,257,612 12.7% 1,214,358,151 24.2%
International Equities Pools 5,274,474,448 12.2% 891,183,032 17.8%
Short Term Investment Pools 1,257,740,257 2.9% 59,535,561 1.2%
Total 43,145,577,438$ 100.0% 5,017,830,697$ 100.0%
a Market value excludes $6,711,645,224 in cash collateral for security lending for fiscal year 2006.
b Total Investment & Interest Income excludes net security lending income of $5,895,417.
MICHIGAN PUBLIC SCHOOL EMPLOYEES’ RETIREMENT SYSTEM • 81
ACTUARIAL SECTION
Actuary’s Certification Summary of Actuarial Assumptions and Methods
Schedule of Active Member Valuation Data Schedule of Changes in the Retirement Rolls
Prioritized Solvency Test Analysis of Financial Experience
Summary of Plan Provisions

ACTUARIAL SECTION
82 • MICHIGAN PUBLIC SCHOOL EMPLOYEES’ RETIREMENT SYSTEM
Actuary’s Certification

ACTUARIAL SECTION
MICHIGAN PUBLIC SCHOOL EMPLOYEES’ RETIREMENT SYSTEM • 83

ACTUARIAL SECTION
84 • MICHIGAN PUBLIC SCHOOL EMPLOYEES’ RETIREMENT SYSTEM
Summary of Actuarial Assumptions and Methods
1. The investment return rate used in the valuations was 8% per year net of expenses, compounded annually. This rate of return is not the assumed real rate of return. The real rate of return is the rate of investment return in excess of the inflation rate. Considering other financial assumptions, this investment return rate translates to an assumed long-term real rate of return of 4.5%. Adopted 2004.
2. The healthy life mortality table used in evaluating allowances to be paid was the 1994 Group Annuity Mortality Table.
Adopted 1998.
3. Sample probabilities of regular, unreduced retirement are shown in Schedule 1 on the next page. Adopted 2004.
4. Sample probabilities of withdrawal from service and disability, together with individual pay increase assumptions, are shown in Schedule 2 on the next page of this report. Adopted 2004.
5. Total active member payroll is assumed to increase 3.5% per year. This represents the portion of the individual pay
increase assumptions attributable to inflation. In effect, this assumes no change in the number of active members. Adopted 2004.
6. An individual entry age actuarial cost method of valuation was used in determining age and service and deferred
retirement actuarial liabilities and normal cost. Adopted 1975. Unfunded actuarial accrued liabilities, are financed over a declining 40-year period beginning October 1, 1996. Adopted or Re-Adopted 1996.
7. The Department of Management and Budget approved the use of market value of assets as of September 30, 2006, for
valuation purposes. For investment gains and losses that occur after that date, a 5-year smoothing technique will be used. Specifically, the excess (shortfall) of actual investment income (including interest, dividends, realized and unrealized gains or losses) over the imputed income at the valuation interest rate is considered the gain (loss), which is spread over five years. Adopted 2007.
8. The data about persons now covered and about present assets was furnished by the System’s administrative staff.
Although examined for general reasonableness, the data was not audited by the actuary.
9. The actuarial valuation computations were made by or under the supervision of a Member of the American Academy of Actuaries (MAAA). The assumptions used in the actuarial valuations were adopted by the System’s Board and the Department of Management and Budget after consulting with the actuary.
10. A 5-year experience investigation, covering the period from September 30, 1997, through September 30, 2002, was
completed in April 2004. The purpose of the study was to analyze the actual experience of the System versus that anticipated by the actuarial assumptions then in use. The combined effect of the recommended changes in assumptions was a decrease in actuarial accrued liabilities of approximately 1.6% and a 8.3% decrease in computed employer contributions. Adopted 2004.
11. Gabriel Roeder Smith and Co. was awarded the actuarial and consulting services contract beginning October 4, 2006.
12. Election of two person retiree health coverage is assumed to be between 75 – 100% for males and 60 – 100% for females
depending on participant type.
13. A retiring member will have coverage for a surviving beneficiary or spouse (active and inactive members) is assumed to be 80% of male retirees and 67% of female retirees.
14. Twenty-one percent of future pension recipients and twenty-eight percent of current recipients eligible for retiree health
benefits will opt-out of the retiree healthcare plan.

ACTUARIAL SECTION
MICHIGAN PUBLIC SCHOOL EMPLOYEES’ RETIREMENT SYSTEM • 85
Summary of Actuarial Assumptions and Methods (Continued)
RetirementAges Basic MIP
46-50 40 %52 2555 35 % 2058 20 2261 20 2264 23 2367 22 2270 25 2571 25 2572 25 2573 25 2574 25 25
75 and over 100 100
SCHEDULE 1
Percent of Eligible Active Members Retiring Within Next Year
Percent ofPercent of Active Active Members Percent
Members Withdrawing Becoming Disabled IncreaseSample Years of Within Next Year Within In Pay During
Ages Service (Men and Women) Next Year Next Year
All 0 28.00 %1 15.002 9.003 7.004 5.50
25 5 & Over 5.00 .01 % 12.30 %35 2.65 .02 7.1845 1.60 .13 5.2155 1.40 .33 3.8160 1.40 .45 3.50
SCHEDULE 2
Separation From Active Employment BeforeAge & Service Retirement & Individual Pay Increase Assumptions

ACTUARIAL SECTION
86 • MICHIGAN PUBLIC SCHOOL EMPLOYEES’ RETIREMENT SYSTEM
Actuarial Valuation Data
Schedule of Active Member Valuation Data
Number
Reported Annual Payroll*
Average Annual
Pay%
IncreaseAverage
AgeAverage Service
1997 295,096 8,027,450$ 27,148$ 2.6 % 43.6 10.01998 302,016 8,265,463 27,368 0.8 43.5 9.71999 309,324 8,643,718 27,944 2.1 43.6 9.52000 312,699 8,984,737 28,733 2.8 43.6 9.72001 318,538 9,264,183 29,083 1.2 43.6 9.62002 326,350 9,707,281 29,745 2.3 43.6 9.52003 326,938 10,043,862 30,721 3.3 43.8 9.72004 322,494 10,407,072 32,271 5.0 43.8 9.72005 316,151 10,205,972 32,282 0.0 43.7 9.72006 308,233 9,806,452 31,815 (1.4) 44.1 9.9
* In thousands of dollars.
Valuation Date
Sept. 30
Schedule of Changes in the Retirement Rolls
Year Ended
Sept. 30 No.Annual
Allowances* No.Annual
Allowances* No.Annual
Allowances*
1997 7,691 147,433$ 3,314 27,765$ 111,842 1,371,479$ 9.6 % 12,263$ 1998 8,384 165,312 3,606 31,429 116,620 1,505,362 9.8 12,908 1999 7,842 166,104 3,549 31,641 120,913 1,639,825 8.9 13,562 2000 8,816 185,545 3,614 27,342 126,115 1,798,028 9.6 14,257 2001 8,125 146,907 3,450 1,491 130,790 1,943,444 8.1 14,859 2002 8,187 154,958 3,700 4,020 135,277 2,094,382 7.8 15,482
2003** 8,512 163,752 3,975 6,368 139,814 2,251,766 7.5 16,105 2004 9,824 197,680 4,260 17,810 145,378 2,431,636 8.0 16,726 2005 10,165 249,907 3,837 36,843 151,706 2,644,700 8.8 17,433 2006 9,853 248,852 4,396 65,092 157,163 2,828,460 6.9 17,997
* In thousands of dollars.** Revised actuarial data.
Average Annual
Allowances
Added to Rolls Removed from Rolls Rolls-End of Year % Increase in Annual
Allowances
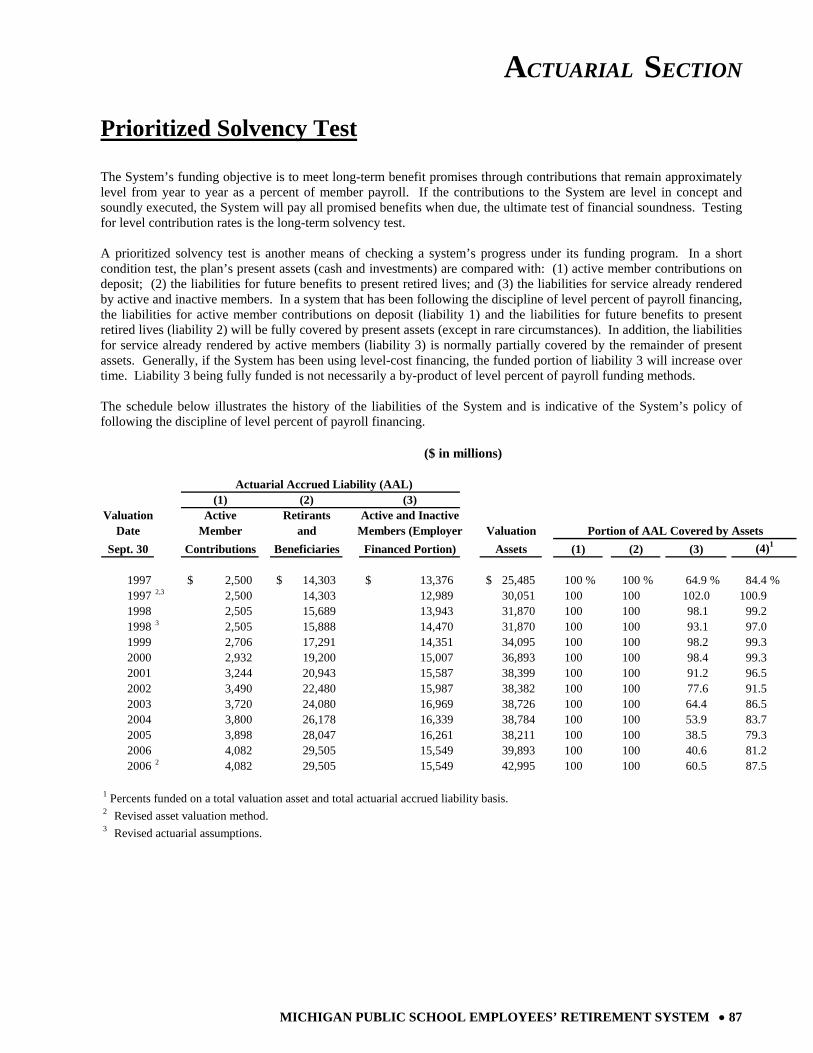
ACTUARIAL SECTION
MICHIGAN PUBLIC SCHOOL EMPLOYEES’ RETIREMENT SYSTEM • 87
Prioritized Solvency Test The System’s funding objective is to meet long-term benefit promises through contributions that remain approximately level from year to year as a percent of member payroll. If the contributions to the System are level in concept and soundly executed, the System will pay all promised benefits when due, the ultimate test of financial soundness. Testing for level contribution rates is the long-term solvency test. A prioritized solvency test is another means of checking a system’s progress under its funding program. In a short condition test, the plan’s present assets (cash and investments) are compared with: (1) active member contributions on deposit; (2) the liabilities for future benefits to present retired lives; and (3) the liabilities for service already rendered by active and inactive members. In a system that has been following the discipline of level percent of payroll financing, the liabilities for active member contributions on deposit (liability 1) and the liabilities for future benefits to present retired lives (liability 2) will be fully covered by present assets (except in rare circumstances). In addition, the liabilities for service already rendered by active members (liability 3) is normally partially covered by the remainder of present assets. Generally, if the System has been using level-cost financing, the funded portion of liability 3 will increase over time. Liability 3 being fully funded is not necessarily a by-product of level percent of payroll funding methods. The schedule below illustrates the history of the liabilities of the System and is indicative of the System’s policy of following the discipline of level percent of payroll financing.
(1) (2) (3)Valuation Active Retirants Active and Inactive
Date Member and Members (Employer ValuationSept. 30 Contributions Beneficiaries Financed Portion) Assets (1) (2) (3) (4)1
1997 2,500$ 14,303$ 13,376$ 25,485$ 100 % 100 % 64.9 % 84.4 %1997 2,3 2,500 14,303 12,989 30,051 100 100 102.0 100.91998 2,505 15,689 13,943 31,870 100 100 98.1 99.21998 3 2,505 15,888 14,470 31,870 100 100 93.1 97.01999 2,706 17,291 14,351 34,095 100 100 98.2 99.32000 2,932 19,200 15,007 36,893 100 100 98.4 99.32001 3,244 20,943 15,587 38,399 100 100 91.2 96.52002 3,490 22,480 15,987 38,382 100 100 77.6 91.52003 3,720 24,080 16,969 38,726 100 100 64.4 86.52004 3,800 26,178 16,339 38,784 100 100 53.9 83.72005 3,898 28,047 16,261 38,211 100 100 38.5 79.32006 4,082 29,505 15,549 39,893 100 100 40.6 81.22006 2 4,082 29,505 15,549 42,995 100 100 60.5 87.5
1 Percents funded on a total valuation asset and total actuarial accrued liability basis.2 Revised asset valuation method.3 Revised actuarial assumptions.
($ in millions)
Portion of AAL Covered by Assets
Actuarial Accrued Liability (AAL)

ACTUARIAL SECTION
88 • MICHIGAN PUBLIC SCHOOL EMPLOYEES’ RETIREMENT SYSTEM
Gain/(Loss)
1. Retirements (including Disability Retirement). If members retire at older ages or with lower final average pay than assumed, there is a gain. If younger ages or higher average pays, a loss. 46,169,587$
2. Withdrawal From Employment (including death-in-service). If more liabilities are released by withdrawals and deaths than assumed, there is a gain. If smaller releases,a loss. (5,918,000)
3. Pay Increases. If there are smaller pay increases than assumed, there is a gain. If greater increases, a loss. 691,550,640
4. Investment Income. If there is greater investment income than assumed, there is a gain. If less income, a loss. (204,586,913)
5. Death After Retirement. If retirants live longer than assumed, there is a loss. If not as long, a gain. (49,164,540)
6. New entrants. New entrants into the System will generally result in an actuarial loss. (98,700,211)
7. Other. Miscellaneous gains and losses resulting from data adjustments, timing of financial transactions, etc. 159,999,180
8. Composite Gain (or Loss) During Year 539,349,743$
Analysis of System Experience
Gains/(Losses) in Accrued Liabilities During Year Ended September 30, 2006Resulting from Differences Between Assumed Experience & Actual Experience
Type of Activity

ACTUARIAL SECTION
MICHIGAN PUBLIC SCHOOL EMPLOYEES’ RETIREMENT SYSTEM • 89
Summary of Plan Provisions Our actuarial valuation of the System as of September 30, 2006, is based on the present provisions of the Michigan Public School Employees’ Retirement Act (Act 300 of 1980, as amended). Regular Retirement (no reduction factor for age) Eligibility — Age 55 with 30 years credited service; or age 60 with 10 years credited service. For Member Investment Plan (MIP) members, any age with 30 years credited service; or age 60 with 10 years credited service; or age 60 with 5 years of credited service provided member worked through 60th birthday and has credited service in each of the last 5 years. Mandatory Retirement Age — None. Annual Amount — Total credited service times 1.5% of final average compensation. Final Average Compensation — Average of highest 5 consecutive years (3 years for MIP members). Early Retirement (age reduction factor used) Eligibility — Age 55 with 15 or more years credited service and earned credited service in each of the last 5 years. Annual Amount — Regular retirement benefit, reduced by 1/2% for each month by which the commencement age is less than 60. Deferred Retirement (vested benefit) Eligibility — 10 years of credited service. Benefit commences at the time age qualification is met. Annual Amount — Regular retirement benefit based on service and final average compensation at time of termination. Duty Disability Retirement Eligibility — No age or service requirement; in receipt of workers’ disability compensation. Annual Amount — Computed as regular retirement benefit with minimum benefit based on 10 years credited service. Additional limitation such that disability benefits plus authorized outside earnings limited to 100% of final average compensation (increased by 2% each year retired). Non-Duty Disability Retirement Eligibility — 10 years of credited service. Annual Amount — Computed as regular retirement benefit based on credited service and final average compensation at time of disability. Additional limitation such that disability benefits plus authorized outside earnings limited to 100% of final average compensation (increased by 2% each year retired).

ACTUARIAL SECTION
90 • MICHIGAN PUBLIC SCHOOL EMPLOYEES’ RETIREMENT SYSTEM
Summary of Plan Provisions (Continued) Duty Death Before Retirement Eligibility — No age or service requirement. Beneficiary is in receipt of workers’ compensation. Also applies to “duty disability” retirees during first three years of disability. Annual Amount — Spouse benefit computed as regular retirement benefit with minimum benefit based on ten years of credited service, reduced for 100% joint and survivor election. If no surviving spouse, children under 18 share in benefit; if no spouse or children, a disabled and dependent parent is eligible. Non-Duty Death Before Retirement Eligibility — 15 years of credited service, or age 60 and 10 years of credited service. 10 years of credited service, or age 60 and 5 years of credited service for MIP members. Annual Amount — Computed as regular retirement benefit, reduced in accordance with a 100% joint and survivor election, with payments commencing first of month following death. For the beneficiary of a deferred member, benefit commences at the time a member would have attained the minimum age qualification. Post-Retirement Cost-of-Living Adjustments One-time upward adjustments have been made in 1972, 1974, 1976 and 1977 for members retired on or after July 1, 1956, and prior to July 1, 1976, who were eligible for Social Security benefits. For members who retired prior to July 1, 1956, and not eligible for Social Security benefits based upon membership service, the minimum base pension was increased in 1965, 1971, 1972, 1974 and 1981, and in 1976 and 1977 one-time upward adjustments were made. Beginning in 1983, eligible recipients received an annual distribution of investment earnings in excess of 8% (supplemental payment). On January 1, 1986, all members who retired prior to January 1, 1986, were given a permanent 8% increase. On January 1, 1990, a one-time upward adjustment for members who retired prior to October 1, 1981, was made. Currently members receive annual increases based on the following schedule: Retired before January 1, 1987 - Greater of Supplemental payment or automatic 3% increase Retired on or after January 1, 1987 under MIP - Automatic 3% increase only Retired on or after January 1, 1987 not under MIP - Supplemental payment only Post-Retirement Health Benefits Members in receipt of pension benefits are eligible for fully System paid Master Health Care Plan coverage (90% System paid Dental Plan, Vision Plan and Hearing Plan coverage) with the following exceptions:
1. Members not yet eligible for Medicare coverage pay an amount equal to the Medicare Part B premiums.
2. Members with less than 30 years of service, who terminate employment after October 31, 1980, with vested deferred benefits, are eligible for partially System paid health benefit coverage (no System payment if less than 21 years service).
Dependents are eligible for 90% System paid health benefit coverage (partial System payment for dependents of deferred vested members who had 21 or more years of service).

ACTUARIAL SECTION
MICHIGAN PUBLIC SCHOOL EMPLOYEES’ RETIREMENT SYSTEM • 91
Summary of Plan Provisions (Continued) Member Contributions MIP Participants hired before January 1, 1990 — 3.9% of pay. MIP Participants hired on or after January 1, 1990 — 3.0% of first $5,000 of pay, plus 3.6% of next $10,000 of pay, plus 4.3% pay in excess of $15,000. Non-MIP Participants — None.

92 • MICHIGAN PUBLIC SCHOOL EMPLOYEES’ RETIREMENT SYSTEM
This page was intentionally left blank.

MICHIGAN PUBLIC SCHOOL EMPLOYEES’ RETIREMENT SYSTEM • 93
STATISTICAL SECTION
Schedules of Revenues by Source Schedules of Expenses by Type
Schedules of Changes in Net Assets Schedules of Benefits and Refunds by Type
Schedules of Retired Members by Type of Benefit Schedule of Health Benefits
Schedules of Average Benefit Payments Schedule of Principal Participating Employers
Ten Year History of Membership Schedule of Participating Employers

STATISTICAL SECTION
94 • MICHIGAN PUBLIC SCHOOL EMPLOYEES’ RETIREMENT SYSTEM
This part of the System’s comprehensive annual financial report presents detailed information as a context for understanding what the information in the financial statements, note disclosures, and required supplementary information says about the System’s overall financial health.
Contents
Financial Trends These schedules contain trend information to help the reader understand how the System’s financial performance and fiscal health has changed over time. The schedules are presented for the last ten fiscal years. Schedules included are:
• Schedule of Pension Plan Revenues by Source • Schedule of Health Plan Revenues by Source • Schedule of Pension Plan Expenses by Type • Schedule of Health Plan Expenses by Type • Schedule of Changes in Net Assets - Pension Plan • Schedule of Changes in Net Assets - Health Plan • Schedule of Pension Benefit and Refund Deductions by Type • Schedule of Health Benefit and Refund Deductions by Type
Operating Information These schedules contain contextual information to assist the reader’s understanding of how the System’s financial information relates to the combination of participating members and the benefits it provides. Schedules are presented for the last ten fiscal years, except where noted. Schedules included are:
• Schedule of Retired Members by Type of Pension Benefit • Schedule of Retired Members by Type of Health Benefit • Schedule of Health Benefits • Schedule of Average Benefit Payments - Pension • Schedule of Average Benefit Payments - Health • Schedule of Average Benefit Payments – Dental/Vision • Schedule of Principal Participating Employers • Ten Year History of Membership

STATISTICAL SECTION
MICHIGAN PUBLIC SCHOOL EMPLOYEES’ RETIREMENT SYSTEM • 95
Last Ten Years
Fiscal Year Net InvestmentEnded Member % of Annual &
Sept. 30 Contributions Dollars Covered Payroll Other Income Total
1998 252,672,436$ 622,437,022$ 7.53 % 2,409,304,679$ 3,284,414,137$ 1999 518,861,556 574,436,929 6.65 5,075,649,100 6,168,947,585 2000 321,557,146 655,258,922 7.29 4,755,872,070 5,732,688,138 2001 371,548,016 629,924,827 6.80 (4,575,630,855) (3,574,158,012) 2002 413,163,871 603,949,327 6.22 (3,733,441,844) (2,716,328,646) 2003 379,084,549 697,906,265 6.95 4,532,071,835 5,609,062,649 2004 456,352,606 697,647,338 6.70 4,130,661,746 5,284,661,690 2005 368,240,837 774,277,778 7.59 4,530,621,088 5,673,139,703 2006 518,599,720 995,932,425 10.15 4,927,180,143 6,441,712,288 2007 356,761,212 835,366,382 N/A 7,177,120,534 8,369,248,128
Last Ten Years
Fiscal Year Net InvestmentEnded Member % of Annual &
Sept. 30 Contributions Dollars Covered Payroll Other Income Total
1998 27,709,644$ 331,557,120$ 4.01 % 10,471,271$ 369,738,035$ 1999 30,397,928 346,164,992 4.01 11,437,005 387,999,925 2000 33,672,843 428,996,628 4.77 9,959,633 472,629,104 2001 38,485,260 528,272,325 5.70 10,663,468 577,421,053 2002 43,217,520 604,628,018 6.23 17,043,097 664,888,635 2003 47,394,003 657,408,261 6.55 25,584,076 730,386,340 2004 52,765,881 618,831,102 5.95 35,482,578 707,079,561 2005 62,507,616 700,366,743 6.86 38,718,254 801,592,613 2006 71,813,553 686,929,558 7.00 41,974,561 800,717,672 2007 77,206,778 671,680,400 N/A 50,740,885 799,628,063
Schedule of Pension Plan Revenues by Source
Employer Contributions
Schedule of Health Plan Revenues by Source
Employer Contributions
Total RevenueYear Ended September 30
(in millions)
6,168.9 5,732.7
(3,574.1)(2,716.3)
5,609.1 5,284.6 5,673.16,441.7
8,369.2
3,284.4
799.6800.7801.6707.1472.6 577.4 730.4664.9369.7 388.0
-6,000
-4,000
-2,000
0
2,000
4,000
6,000
8,000
10,000
1998 1999 2000 2001 2002 2003 2004 2005 2006 2007
Pension Health

STATISTICAL SECTION
96 • MICHIGAN PUBLIC SCHOOL EMPLOYEES’ RETIREMENT SYSTEM
Last Ten Years
Fiscal YearEnded Benefit Refunds Administrative
Sept. 30 Payments and Transfers Expenses Total
1998 1,454,451,439$ 21,626,704$ 14,463,339$ 1,490,541,482$ 1999 1,587,992,361 11,198,300 16,525,359 1,615,716,020 2000 1,735,936,328 17,455,802 15,918,143 1,769,310,273 2001 1,890,812,400 19,835,729 17,312,250 1,927,960,379 2002 2,041,439,863 20,813,845 23,610,482 2,085,864,190 2003 2,180,574,193 13,642,300 23,016,963 2,217,233,456 2004 2,358,216,073 18,422,941 19,374,673 2,396,013,687 2005 2,558,017,710 22,181,312 19,997,954 2,600,196,976 2006 2,761,292,217 24,026,881 22,501,098 2,807,820,196 2007 2,944,920,179 32,247,524 24,489,202 3,001,656,905
Last Ten Years
Fiscal YearEnded Benefit Refunds Administrative
Sept. 30 Payments and Transfers Expenses Total
1998 323,845,667$ (374,557)$ 32,594,836$ 356,065,946$ 1999 372,021,209 34,445,866 406,467,075 2000 425,760,691 30,902 38,039,572 463,831,165 2001 456,257,416 72,407 41,379,358 497,709,181 2002 513,171,821 67,115 44,853,969 558,092,905 2003 558,682,921 64,411 47,907,745 606,655,077 2004 615,416,903 97,849 51,118,851 666,633,603 2005 705,983,783 192,144 55,520,031 761,695,958 2006 634,811,847 42,370 59,459,690 694,313,907 2007 590,226,465 30,580 63,315,419 653,572,464
Schedule of Pension Plan Expenses by Type
Schedule of Health Plan Expenses by Type
Total Expenses Year Ended September 30
(in millions)
1,615.71,769.3
1,928.02,085.9 2,217.2
2,396.02,600.2
2,807.83,001.6
1,490.5
356.1 406.5497.7463.8 558.1 606.7 653.6694.3761.7666.6
0
500
1,000
1,500
2,000
2,500
3,000
3,500
1998 1999 2000 2001 2002 2003 2004 2005 2006 2007
PensionHealth

STATISTICAL SECTION
MICHIGAN PUBLIC SCHOOL EMPLOYEES’ RETIREMENT SYSTEM • 97
Schedule of Changes in Net Assets-Pension PlanLast Ten Years(in thousands)
1998 1999 2000 2001 2002 2003 2004 2005 2006 2007
Member contributions 252,672$ 518,862$ 321,557$ 371,548$ 413,164$ 379,085$ 456,353$ 368,241$ 518,600$ 356,761$ Employer contributions 622,437 574,436 655,259 629,924 603,949 697,906 697,647 774,277 995,932 835,366 Net investment income 2,409,304 5,075,559 4,755,474 (4,575,768) (3,733,567) 4,532,030 4,130,610 4,530,600 4,926,708 7,174,561 Transfer from other systems 20 15 3 6 Miscellaneous income 1 90 398 138 125 42 32 7 469 2,553 Total Additions 3,284,414 6,168,947 5,732,688 (3,574,158) (2,716,329) 5,609,063 5,284,662 5,673,140 6,441,712 8,369,247
Pension benefits 1,454,451 1,587,992 1,735,936 1,890,812 2,041,440 2,180,574 2,358,216 2,558,018 2,761,292 2,944,920 Refunds of member contributions 21,576 11,146 17,353 19,836 20,814 13,642 18,397 22,062 23,904 32,142 Tranfer to other systems 51 53 102 17,312 26 119 123 106 Administrative expenses 14,463 16,525 15,918 23,610 23,017 19,375 19,998 22,501 24,489 Total Deductions 1,490,541 1,615,716 1,769,309 1,927,960 2,085,864 2,217,233 2,396,014 2,600,197 2,807,820 3,001,657
Changes in net assets 1,793,873$ 4,553,231$ 3,963,379$ (5,502,118)$ (4,802,193)$ 3,391,830$ 2,888,648$ 3,072,943$ 3,633,892$ 5,367,590$
Fiscal Year
Schedule of Changes in Net Assets - Health PlanLast Ten Years(in thousands)
1998 1999 2000 2001 2002 2003 2004 2005 2006 2007
Member contributions 27,710$ 30,398$ 33,673$ 38,485$ 43,218$ 47,394$ 52,766$ 62,508$ 71,814$ 77,207$ Employer contributions 331,557 346,165 428,997 528,273 604,628 657,409 618,831 700,366 686,929 671,680 Other governmental contributions 65 63 Net investment income 10,471 11,437 9,959 10,663 17,040 25,584 35,483 38,718 41,910 50,417 Miscellaneous income 3 261 Total Additions 369,738 388,000 472,629 577,421 664,889 730,387 707,080 801,592 800,718 799,628
Health care benefits 323,846 372,021 425,760 456,257 513,172 558,683 615,417 705,983 634,812 590,226 Refunds of member contributions (375) 31 72 67 64 98 192 42 31 Administrative expenses 32,595 34,446 38,040 41,379 44,854 47,908 51,119 55,520 59,460 63,315 Total Deductions 356,066 406,467 463,831 497,708 558,093 606,655 666,634 761,695 694,314 653,572
Changes in net assets 13,672$ (18,467)$ 8,798$ 79,713$ 106,796$ 123,732$ 40,446$ 39,897$ 106,404$ 146,056$
Fiscal Year

STATISTICAL SECTION
98 • MICHIGAN PUBLIC SCHOOL EMPLOYEES’ RETIREMENT SYSTEM
Last Ten Years
Fiscal YearEnded Regular Disability Survivor Supplemental
Sept. 30 Benefits* Benefits Benefits Check Refunds Total
1998 1,412,550,359$ 35,908,817$ 5,992,263$ 21,575,588$ 1,476,027,027$ 1999 1,540,039,404 38,546,646 9,406,311 11,145,521 1,599,137,882 2000 1,684,018,116 40,453,574 11,464,638 17,353,351 1,753,289,679 2001 1,831,809,193 45,203,866 13,799,341 19,835,729 1,910,648,129 2002 1,976,611,796 48,253,882 16,574,185 20,813,845 2,062,253,708 2003 2,115,423,232 51,351,620 13,642,300 2,180,417,152 2004 2,304,740,438 53,475,635 18,397,014 2,376,613,087 2005 2,500,815,986 57,201,724 22,061,718 2,580,079,428 2006 2,573,912,214 52,500,929 134,879,074$ 23,903,822 2,785,196,039 2007 2,717,579,495 53,505,192 173,835,492 32,141,952 2,977,062,131
*Includes prior post retirement adjustments
Last Ten YearsFiscal Year
Ended Health Dental/Vision Administrative Sept. 30 Benefits Benefits Expenses Refunds Total
1998 285,446,554$ 38,399,113$ 32,594,836$ (374,557)$ 356,065,946$ 1999 331,522,164 40,499,045 34,445,866 - 406,467,075 2000 386,583,485 39,177,206 38,039,572 30,902 463,831,165 2001 407,833,031 48,424,385 41,379,358 72,407 497,709,181 2002 460,578,779 52,593,042 44,853,969 67,115 558,092,905 2003 501,566,419 57,116,502 47,907,745 64,411 606,655,077 2004 554,472,234 60,944,669 51,118,851 97,849 666,633,603 2005 641,616,478 64,367,305 55,520,031 192,144 761,695,958 2006 565,261,409 69,550,438 59,459,690 42,370 694,313,907 2007 521,420,684 68,805,781 63,315,419 30,580 653,572,464
Schedule of Pension Benefits and Refunds by Type
Schedule of Health Benefits and Refunds by Type
Total Benefit Expenses Year Ended September 30
(in millions)
1,476.0 1,599.11,753.3
1,910.62,062.3 2,180.4
2,376.6
2,785.22,977.1
3,024.8
761.7 694.3 653.6666.6606.7558.1497.7356.1 404.5 463.8
0
500
1,000
1,500
2,000
2,500
3,000
3,500
1998 1999 2000 2001 2002 2003 2004 2005 2006 2007
PensionHealth

STATISTICAL SECTION
MICHIGAN PUBLIC SCHOOL EMPLOYEES’ RETIREMENT SYSTEM • 99
Amount ofMonthly Number of Opt.1E
Pension Benefit Retirees 1 2 3 4 5 6 Opt. 1 Opt. 2 Opt. 3 Opt. 4 2E,3E,4E$ 1-200 13,389 11,592 1,057 110 442 1 187 7,726 2,615 1,896 111 1,041
201-400 19,450 16,021 1,514 125 1,375 1 414 11,001 3,753 3,191 225 1,280 401-600 14,384 11,672 1,116 75 1,096 1 424 7,699 2,939 2,552 231 963 601-800 11,198 8,991 884 45 856 1 421 5,658 2,245 2,123 211 961
801-1000 9,002 7,246 761 24 588 - 383 4,338 1,843 1,727 196 898 1001-1200 7,846 6,440 649 19 467 - 271 3,591 1,641 1,344 166 1,104 1201-1400 7,236 6,078 570 9 341 - 238 2,983 1,505 1,265 158 1,325 1401-1600 6,820 5,876 465 4 256 - 219 2,686 1,474 1,100 158 1,402 1601-1800 6,858 6,068 390 2 242 - 156 2,569 1,530 1,160 202 1,397 1801-2000 7,098 6,401 353 7 155 - 182 2,643 1,774 1,264 290 1,127 over 2000 53,882 51,921 1,196 5 268 1 491 23,069 10,345 11,074 2939 6,455
Totals 157,163 138,306 8,955 425 6,086 5 3,386 73,963 31,664 28,696 4,887 17,953
Schedule of Retired Members by Type of Pension BenefitSeptember 30, 2006
Type of Retirement * Selected Option**
* Type of Retirement **Selected Option1 - Normal retirement for age & service Opt. 1. - Straight life allowance2 - Survivor payment - normal retirement Opt. 2 - 100% survivor option3 - Duty disability retirement Opt. 3 - 50% survivor option4 - Non-duty disability retirement Opt. 4 - 75% survivor option5 - Survivor payment - duty death in service Opt. 1E, 2E, 3E, 4E - Equated retirement plans6 - Survivor payment - non-duty death in service Source: Gabriel Roeder Smith & Co.

STATISTICAL SECTION
100 • MICHIGAN PUBLIC SCHOOL EMPLOYEES’ RETIREMENT SYSTEM
Schedule of Retired Members by Type of Health Benefit
Eligible Retirees Health Dental/Vision
$ 1 – 200 13,389 7,492 8,260201 – 400 19,450 12,467 13,501401 – 600 14,384 10,058 10,797601 – 800 11,198 8,359 8,889
801 – 1,000 9,002 6,914 7,2991,001 – 1,200 7,846 6,164 6,4901,201 – 1,400 7,236 5,810 6,1161,401 – 1,600 6,820 5,551 5,8281,601 – 1,800 6,858 5,606 5,8811,801 – 2,000 7,098 5,756 6,067
Over 2,000 53,882 44,358 46,624Totals 157,163 118,535 125,752
September 30, 2006
Type of Other Post - Employment Benefits
Amount of Monthly Pension
Benefit

STATISTICAL SECTION
MICHIGAN PUBLIC SCHOOL EMPLOYEES’ RETIREMENT SYSTEM • 101
2007 2006Claims Health Insurance 237,048,768$ 512,937,409$ Vision Insurance 2,467,684 7,334,013 Dental Insurance 64,513,216 60,089,425
Total Claims 304,029,668 580,360,847
IBNR (Incurred but not reported claims) Health Insurance 284,371,916 52,324,000 Vision Insurance 257,881 364,000 Dental Insurance 1,567,000 1,763,000
Total IBNR 286,196,797 54,451,000
Administrative Fees Health Insurance 57,906,980 54,335,949 Vision Insurance - 170,451 Dental Insurance 5,408,439 4,953,290
Total Administrative Fees 63,315,419 59,459,690
Subtotal 653,541,884 694,271,537
Refunds 30,580 42,370
Grand Total 653,572,464$ 694,313,907$
Schedule of Health BenefitsFor Years Ended September 30, 2007 and 2006

STATISTICAL SECTION
102 • MICHIGAN PUBLIC SCHOOL EMPLOYEES’ RETIREMENT SYSTEM
Schedule of Average Benefit Payments - Pension Last Ten Years
Payment Periods0-5 5-10 10-15 15-20 20-25 25-30 30+ Total
Period 10/1/96 to 9/30/97:Average Monthly Benefit 359$ 134$ 230$ 424$ 703$ 1,064$ 1,779$ 1,022$ Average Final Average Salary 4,725 13,993 12,738 17,348 22,636 27,515 38,285 26,540Number of Active Retirants 333 2,742 15,893 18,982 17,724 13,941 42,027 111,642
Period 10/1/97 to 9/30/98:Average Monthly Benefit 390$ 139$ 238$ 438$ 726$ 1,097$ 1,864$ 1,076$ Average Final Average Salary 4,043 14,351 13,165 17,927 23,340 28,399 40,260 27,831 Number of Active Retirants 416 3,136 16,145 19,479 18,358 14,337 44,749 116,620
Period 10/1/98 to 9/30/99:Average Monthly Benefit 439$ 143$ 246$ 452$ 746$ 1,131$ 1,944$ 1,130$ Average Final Average Salary 3,467 14,633 13,635 18,462 23,931 29,187 42,081 29,072Number of Active Retirants 528 3,338 16,299 19,815 18,838 14,535 47,560 120,913
Period 10/1/99 to 9/30/00:Average Monthly Benefit 480$ 147$ 255$ 466$ 769$ 1,167$ 2,024$ 1,188$ Average Final Average Salary 2,964 14,900 14,121 19,103 24,654 29,984 43,957 30,424Number of Active Retirants 666 3,545 16,545 20,206 19,332 14,839 50,982 126,115
Period 10/1/00 to 9/30/01:Average Monthly Benefit 500$ 154$ 268$ 483$ 793$ 1,201$ 2,092$ 1,238$ Average Final Average Salary 2,492 15,236 14,669 19,730 25,420 30,751 45,564 31,613Number of Active Retirants 814 3,783 16,842 20,543 19,844 15,128 53,836 130,790
Period 10/1/01 to 9/30/02:Average Monthly Benefit 527$ 154$ 272$ 495$ 815$ 1,237$ 2,166$ 1,290$ Average Final Average Salary 2,171 15,438 15,160 20,407 26,097 31,542 47,124 32,795Number of Active Retirants 934 3,951 17,068 20,977 20,201 15,427 56,719 135,277
Period 10/1/02 to 9/30/03:Average Monthly Benefit 543$ 159$ 280$ 510$ 837$ 1,273$ 2,232$ 1,342$ Average Final Average Salary 2,225 15,789 15,635 21,059 26,790 32,349 48,604 34,014Number of Active Retirants 896 4,139 17,285 21,404 20,533 15,698 59,859 139,814
Period 10/1/03 to 9/30/04:Average Monthly Benefit 607$ 181$ 309$ 514$ 881$ 1,238$ 2,288$ 1,394$ Average Final Average Salary 1,640 16,138 16,357 21,257 27,798 32,353 50,198 35,268Number of Active Retirants 1,178 4,386 15,706 23,764 18,842 18,076 63,426 145,378
Period 10/1/04 to 9/30/05:Average Monthly Benefit 583$ 170$ 298$ 540$ 887$ 1,346$ 2,374$ 1,453$ Average Final Average Salary 1,542 16,607 16,719 22,539 28,288 34,036 50,418 35,938Number of Active Retirants 1,396 4,601 17,884 22,502 21,321 16,548 67,454 151,706
Period 10/1/05 to 9/30/06:Average Monthly Benefit 388$ 176$ 308$ 557$ 912$ 1,381$ 2,419$ 1,500$ Average Final Average Salary 8,395 17,286 17,447 23,464 29,324 35,216 53,049 38,048Number of Active Retirants 406 4,921 18,378 23,204 21,814 17,107 71,333 157,163
Credited Service (Years)
Source: Gabriel Roeder Smith & Co.

STATISTICAL SECTION
MICHIGAN PUBLIC SCHOOL EMPLOYEES’ RETIREMENT SYSTEM • 103
Schedule of Average Benefit Payments - Health September 30, 2006
0-5 5-10 10-15 15-20 20-25 25-30 30+ Total
114 188 337 587 937 1,678 2,505 1,59214,348 16,926 17,732 23,228 28,848 40,434 51,670 38,192
200 3,602 10,994 15,777 16,341 20,508 48,162 115,584
174 190 341 593 952 1,684 2,493 1,60617,201 17,372 18,411 24,056 29,679 40,967 52,919 39,334
217 3,710 10,952 15,987 16,465 20,803 50,401 118,535
Schedule of Average Benefit Payments - Dental/VisionSeptember 30, 2006
0-5 5-10 10-15 15-20 20-25 25-30 30+ Total
121 188 336 582 933 1,685 2,503 1,58114,741 16,957 17,768 23,221 28,858 40,661 51,804 38,138
228 3,858 11,858 16,959 17,352 21,664 50,334 122,253
178 190 340 588 947 1,691 2,489 1,59217,087 17,378 18,437 24,041 29,696 41,171 53,026 39,231
247 4,009 11,884 17,278 17,576 22,022 52,736 125,752
Period 10/1/05 to 9/30/06: Average Monthly Benefit Average Final Average Salary Number of Active Retirants
Period 10/1/04 to 9/30/05: Average Monthly Benefit Average Final Average Salary Number of Active Retirants
Average Final Average Salary Number of Active Retirants
Payment Periods Credited Service (Years)
Period 10/1/05 to 9/30/06: Average Monthly Benefit Average Final Average Salary Number of Active Retirants
Payment Periods Credited Service (Years)
Period 10/1/04 to 9/30/05: Average Monthly Benefit

STATISTICAL SECTION
104 • MICHIGAN PUBLIC SCHOOL EMPLOYEES’ RETIREMENT SYSTEM
Schedule of Principal Participating Employers For Fiscal Years Ending September 30, 2006 and 1997
Percentage Percentage of Total of Total
Participating Employer Employees* System Employees* System
Detroit Public Schools 18,765 4.60 % 24,099 7.11 %Utica Community Schools 5,438 1.33 4,065 1.20Grand Rapids Public Schools 4,785 1.17 5,136 1.51Ann Arbor Public Schools 4,425 1.08 4,032 1.19Flint Community Schools 4,235 1.04 5,156 1.52Dearborn Public Schools 3,586 0.88 2,776 0.82Lansing Public Schools 3,501 0.86 3,603 1.06Livonia Public Schools 3,318 0.81 3,130 0.92Kalamazoo Public Schools 3,274 0.80 2,993 0.88Plymouth-Canton Community S D 3,273 0.80 2,388 0.70
All other 353,641 86.63 281,697 83.09
Total 408,241 100.00 % 339,075 100.00 %
*Employee totals for principal participating employers may not match the information presented in Note 1 of this report. These variances are the results of 2006 data conversion.
2006 1997

STATISTICAL SECTION
MICHIGAN PUBLIC SCHOOL EMPLOYEES’ RETIREMENT SYSTEM • 105
Ten Year History of Membership Fiscal Year Ended September 30
295,984
162,844
0
50
100
150
200
250
300
350
1998 1999 2000 2001 2002 2003 2004 2005 2006 2007
Thousands
ACTIVE RETIRED
Source: Gabriel Roeder Smith & Co.

STATISTICAL SECTION
106 • MICHIGAN PUBLIC SCHOOL EMPLOYEES’ RETIREMENT SYSTEM
Schedule of Participating Employers through 9/30/07 Universities: Central Michigan University Eastern Michigan University Ferris State University Lake Superior State University Michigan Technological University Northern Michigan University Western Michigan University Community Colleges: Alpena Community College Bay De Noc Community College Charles S Mott Community College Delta College Glen Oaks Community College Gogebic Community College Grand Rapids Community College Henry Ford Community College Jackson County Community College Kalamazoo Valley Community College Kellogg Community College Kirtland Community College Lake Michigan College Lansing Community College Macomb Community College Mid-Michigan Community College Monroe County Community College Montcalm Community College Muskegon Community College North Central Michigan College Northwestern Michigan College Oakland Community College Schoolcraft Community College Southwestern Michigan College St Clair County Community College Washtenaw Community College Wayne County Community College West Shore Community College Intermediate School Districts: Allegan County Intermediate School District Alpena-Montmorency-Alcona E. S. D. Barry Intermediate School District Bay-Arenac Intermediate School District Berrien Intermediate School District Branch Intermediate School District COOR Intermediate School District Calhoun Intermediate School District
Charlevoix-Emmet Intermediate School District Cheboygan-Otsego-Presque Isle ISD Clare-Gladwin Intermediate School District Clinton County R. E. S. A. Copper Country Intermediate School District Delta-Schoolcraft Intermediate School District Dickinson-Iron Intermediate School District Eastern U P Intermediate School District Eaton Intermediate School District Genesee Intermediate School District Gogebic-Ontonagon Intermediate School District Gratiot-Isabella R. E. S. D. Hillsdale Intermediate School District Huron Intermediate School District Ingham Intermediate School District Ionia Intermediate School District Iosco Intermediate School District Jackson Intermediate School District Kalamazoo Valley Intermediate School District Kent Intermediate School District Lapeer Intermediate School District Lenawee Intermediate School District Lewis Cass Intermediate School District Livingston Intermediate School District Macomb Intermediate School District Manistee Intermediate School District Marquette-Alger Intermediate School District Mason Lake Intermediate School District Mecosta-Osceola Intermediate School District Menominee Intermediate School District Midland County Ed Service Agency Monroe Intermediate School District Montcalm Area Intermediate School District Muskegon Area Intermediate School District Newaygo Intermediate School District Oakland Intermediate School District Oceana Intermediate School District Ottawa Area Intermediate School District Saginaw Intermediate School District Sanilac Intermediate School District Shiawassee R. E. S. D. St. Clair Intermediate School District St. Joseph Intermediate School District Traverse Bay Area Intermediate School District Tuscola Intermediate School District Van Buren Intermediate School District Washtenaw Intermediate School District Wayne R. E. S. A. Wexford-Missaukee Intermediate School District

STATISTICAL SECTION
MICHIGAN PUBLIC SCHOOL EMPLOYEES’ RETIREMENT SYSTEM • 107
Schedule of Participating Employers through 9/30/07 (Continued) K – 12 School Districts: Adams Township School District Adams-Sigel #3 School Addison Community Schools Adrian Public Schools Airport Community Schools Akron-Fairgrove Schools Alba Public Schools Albion Public Schools Alcona Community Schools Algonac Community Schools Allegan Public Schools Allen Park Public Schools Allendale Public Schools Alma Public Schools Almont Community Schools Alpena Public Schools Anchor Bay School District Ann Arbor Public Schools Arenac-Eastern High School Armada Area Schools Arvon Township Schools Ashley Community Schools Athens Area Schools Atherton Community Schools Atlanta Community Schools Au Gres-Sims School District Autrain-Onota Public Schools Avondale School District Bad Axe Public Schools Baldwin Community Schools Bangor Public Schools Bangor Township Schools Baraga Township Schools Bark River - Harris Schools Bath Community Schools Battle Creek Public Schools Bay City Public Schools Beal City Schools Bear Lake School Beaver Island Community Schools Beaverton Rural School District Bedford Public Schools Beecher Community School District Belding Area Schools Bellaire Public Schools Bellevue Community Schools Bendle Public Schools Bentley Community Schools Benton Harbor Area Schools Benzie County Central Schools
Berkley City School District Berrien Springs Public Schools Bessemer Area School District Big Bay De Noc School District Big Burning-Colfax #1f School Big Jackson School District Big Rapids Public Schools Birch Run Area Schools Birmingham City Schools Blissfield Community School District Bloomfield #7 Frl-Rapson School Bloomfield Hills School District Bloomingdale Public Schools Bois Blanc Township School District Boyne City Public Schools Boyne Falls Public Schools Brandon School District Brandywine Public Schools Breckenridge Community Schools Breitung Township Schools Bridgeport-Spaulding Comm. School District Bridgman Public Schools Brighton Area Schools Brimley Public Schools Britton-Macon Area School Bronson Community Schools Brown City Community Schools Buchanan Community Schools Buckley Community Schools Buena Vista School District Bullock Creek School District Burr Oak Community Schools Burt Township School District Byron Area Schools Byron Center Public Schools Cadillac Area Public Schools Caledonia Community Schools Calumet Public Schools Camden-Frontier School Capac Community Schools Carman-Ainsworth Community School District Carney-Nadeau Public Schools Caro Community Schools Carrollton School District Carson City-Crystal Area Schools Carsonville-Port Sanilac School Caseville Public Schools Cass City Public Schools Cassopolis Public Schools Cedar Springs Public Schools Center Line Public Schools Central Lake-Antrim County Public Schools Central Montcalm Public Schools

STATISTICAL SECTION
108 • MICHIGAN PUBLIC SCHOOL EMPLOYEES’ RETIREMENT SYSTEM
Schedule of Participating Employers through 9/30/07 (Continued) K - 12 School Districts (continued): Centreville Public Schools Charlevoix Public Schools Charlotte Public Schools Chassell Township Schools Cheboygan Area School District Chelsea School District Chesaning-Union Schools Chippewa Hills School District Chippewa Valley Schools Church School Clare Public Schools Clarenceville School District Clarkston Community Schools Clawson City School District Climax-Scotts Community Schools Clinton Community Schools Clintondale Community Schools Clio Area School District Coldwater Community Schools Coleman Community Schools Coloma Community Schools Colon Community School Columbia School District Comstock Park Public Schools Comstock Public Schools Concord Community Schools Constantine Public Schools Coon-Berlin Township School District #3 Coopersville Public Schools Corunna Public Schools Covert Public Schools Crawford-AuSable School District Crawford-Excelsior School District #1 Crestwood School District Croswell-Lexington Schools Dansville Agricultural School Davison Community Schools Dearborn Heights School District #7 Dearborn Public Schools Decatur Public Schools Deckerville Community School District Deerfield Public Schools Delton-Kellogg Schools DeTour Area Schools Detroit Public Schools Dewitt Public Schools Dexter Community Schools Dollar Bay-Tamarack School District Dowagiac-Union School District Dryden Community Schools
Dundee Community Schools Durand Area Schools East China Township School District East Detroit School District East Grand Rapids Public Schools East Jackson Public Schools East Jordan Public Schools East Lansing Public Schools Eaton Rapids Public Schools Eau Claire Public Schools Eccles-Sigel #4 School Ecorse Public Schools Edwardsburg Public Schools Elk Rapids Schools Ellsworth Community Schools Elm River Township Schools Engadine Consolidated School District #4 Escanaba Area Public Schools Essexville-Hampton Public Schools Evart Public Schools Ewen-Trout Creek Consolidated School District Fairview Area Schools Farmington Public Schools Farwell Area Schools Fennville Public Schools Fenton Area Public Schools Ferndale City School District Fitzgerald Public Schools Flat Rock Community Schools Flint City School District Flushing Community Schools Forest Area Schools Forest Hills Public Schools Forest Park School District Fowler Public Schools Fowlerville Community Schools Frankenmuth School District Frankfort-Elberta Area Schools Fraser Public Schools Free Soil Community School District # 8 Freeland Community Schools Fremont Public Schools Fruitport Community Schools Fulton Schools Galesburg-Augusta Community School District Galien Township School Garden City Public Schools Gaylord Community Schools Genesee School District Gerrish-Higgins School District Gibraltar School District Gladstone Area Schools

STATISTICAL SECTION
MICHIGAN PUBLIC SCHOOL EMPLOYEES’ RETIREMENT SYSTEM • 109
Schedule of Participating Employers through 9/30/07 (Continued) K - 12 School Districts (continued): Gladwin Community Schools Glen Lake Community Schools Glenn-Ganges School District #4 Gobles Public Schools Godfrey-Lee Public Schools Godwin Heights Public Schools Goodrich Area Schools Grand Blanc Community Schools Grand Haven Public Schools Grand Ledge Public Schools Grand Rapids Public Schools Grandville Public Schools Grant Public Schools Grant Township School Grass Lake Community Schools Greenville Public Schools Grosse Ile Township Schools Grosse Pointe Public Schools Gull Lake Community Schools Gwinn Area Community Schools Hale Area Schools Hamilton Community Schools Hamtramck Public Schools Hancock Public Schools Hanover Horton School District Harbor Beach Community School District Harbor Springs Public Schools Harper Creek Community Schools Harper Woods Public Schools Harrison Community Schools Hart Public Schools Hartford Public Schools Hartland Consolidated Schools Haslett Public Schools Hastings Area School District Haynor- Easton Township School District #6 Hazel Park Public Schools Hemlock Public Schools Hesperia Community Schools Highland Park School District Hillman Community Schools Hillsdale Community Schools Holland Public Schools Holly Area Schools Holt Public Schools Holton Public Schools Homer Community Schools Hopkins Public Schools Houghton Lake Community Schools Houghton-Portage Township School District Howell Public Schools
Hudson Area Schools Hudsonville Public Schools Huron School District Huron Valley School District Ida Public Schools Imlay City Community Schools Inkster Public Schools Inland Lakes Schools Ionia Public Schools Iron Mountain Public Schools Ironwood-Gogebic City Area Schools Ishpeming Public Schools Ithaca Public Schools Jackson Public Schools Jefferson Schools Jenison Public Schools Johannesburg-Lewiston Area Schools Jonesville Community Schools Kalamazoo Public Schools Kaleva Norman Dickson School District Kalkaska Public Schools Kearsley Community Schools Kelloggsville Public Schools Kenowa Hills Public Schools Kent City Community Schools Kentwood Public Schools Kingsley Area Schools Kingston Community Schools Kipper School L’Anse Creuse Public Schools L’Anse Public Schools Laingsburg Community Schools Lake City Area Schools Lake Fenton Community School District Lake Linden-Hubbell Public Schools Lake Orion Community School #3 Lake Shore Public Schools Laker Schools LakeShore Public Schools Lakeview Community Schools Lakeview Public Schools Lakeview School District Lakeville Community Schools Lakewood School District Lamphere Public Schools Lansing Public Schools Lapeer Public Schools Lawrence Public Schools Lawton Community Schools Leland Public Schools Les Cheneaux Community Schools Leslie Public Schools Lincoln Consolidated Schools Lincoln Park Public Schools

STATISTICAL SECTION
110 • MICHIGAN PUBLIC SCHOOL EMPLOYEES’ RETIREMENT SYSTEM
Schedule of Participating Employers through 9/30/07 (Continued) K - 12 School Districts (continued): Linden Community Schools Litchfield Community Schools Littlefield Public Schools Livonia Public Schools Lowell Area Schools Ludington Area Schools Mackinaw City Public Schools Mackinac Island Public Schools Madison District Public Schools Madison School District #2 Mancelona Public Schools Manchester Community Schools Manistee Public Schools Manistique Area Schools Manton Consolidated School District Maple Valley Schools Mar Lee School District Marcellus Community Schools Marion Public Schools Marlette Community Schools Marquette Area Public Schools Marshall Public Schools Martin Public Schools Marysville Public Schools Mason Co.-Eastern-Custer #5 School District Mason Consolidated Schools Mason County Central School District Mason Public Schools Mattawan Consolidated Schools Mayville Community Schools McBain Rural Agricultural School Melvindale-Northern Allen Park School District Memphis Community Schools Mendon Community School Menominee Area Public Schools Meridian Public Schools Merrill Community Schools Mesick Consolidated Schools Michigan Center School District Mid Peninsula Schools Midland City Schools Milan Area Schools Millington Community School District Mio-Ausable Schools Mona Shores School District #29 Monroe Public Schools Montabella Community Schools Montague Area Public Schools Montrose Community Schools Moran Township School District
Morenci Area Schools Morley-Stanwood Community Schools Morrice Area Schools Mt Clemens Community Schools Mt Morris Consolidated Schools Mt Pleasant Public Schools Munising Public Schools Muskegon City Public Schools Muskegon Heights City Public Schools Napoleon Comm. School District Negaunee Public Schools New Buffalo Area Schools New Haven Community Schools New Lothrup Area Public Schools Newaygo Public Schools Nice Community Schools Niles Public Schools North Adams-Jerome Public Schools North Branch Area Schools North Central Area Schools North Dickinson School North Huron Schools North Levalley School #2 North Muskegon Public Schools Northport Public Schools Northview Public Schools Northville Public Schools Northwest School District Norway-Vulcan Area Schools Nottawa Community Schools Novi Community School District Oak Park School District Oakridge Public Schools Okemos Public Schools Olivet Community Schools Onaway Area Community Schools Onekama Consolidated Schools Onsted Community Schools Ontonagon Area School District Orchard View Schools Oscoda Area Schools Otsego Public Schools Ovid-Elsie Area Schools Owendale-Gagetown Area Schools Owosso Public Schools Oxford Area Community Schools Palo Community Schools Parchment School District Paw Paw Public Schools Peck Community Schools Pellston Public Schools Pennfield Schools

STATISTICAL SECTION
MICHIGAN PUBLIC SCHOOL EMPLOYEES’ RETIREMENT SYSTEM • 111
Schedule of Participating Employers through 9/30/07 (Continued) K - 12 School Districts (continued): Pentwater Public Schools Perry Public Schools Petoskey Public Schools Pewamo-Westphalia Comm School District Pickford Public Schools Pinckney Community Schools Pinconning Area Schools Pine River Area Schools Pittsford Area Schools Plainwell Community Schools Plymouth-Canton Community School District Pontiac City School District Port Hope Community Schools Port Huron Area Schools Portage Public Schools Portland Public Schools Posen Consolidated Schools Potterville Public Schools Powell Township School District Quincy Community Schools Rapid River Public Schools Ravenna Public Schools #24 Reading Community Schools Redford-Union School District #1 Reed City Public School District Reese Public Schools Reeths-Puffer Schools Republic-Michigamme Schools Richmond Community Schools River Rouge Public Schools River School River Valley School District Riverside-Hagar School District #6 Riverview Public Schools Rochester Community Schools Rockford Public Schools Rogers City Area Schools Romeo Community Schools Romulus Community Schools Roseville Community Schools Royal Oak City School District Rudyard Public Schools Saginaw City Schools Saginaw Township Community Schools Saline Area Schools Sand Creek Community Schools Sandusky Community Schools Saranac Community Schools Saugatuck Public Schools Sault Ste Marie Public Schools Schoolcraft Community Schools
Shelby Public Schools Shepherd Public Schools South Haven Public Schools South Lake Public Schools South Lyon Community Schools South Redford School District Southfield Public Schools Southgate Community School District Sparta Area Schools Spring Lake Public Schools Springport Public Schools St Charles Community Schools St Ignace Public Schools St Johns Public Schools St Joseph Public Schools St Louis Public Schools Standish-Sterling Community School District Stanton Twnshp. Public Schools Stephenson Area Public Schools Stockbridge Community Schools Strange-Oneida School #3 Sturgis Public Schools Summerfield Schools Superior Central School District Suttons Bay Public Schools Swan Valley School District Swartz Creek Community Schools Tahquamenon Area School District Tawas Area Schools Taylor Township Schools Tecumseh Public Schools Tekonsha Community Schools Thornapple-Kellogg School Three Rivers Community Schools Traverse City Public Schools Trenton Public Schools Tri-County Area Schools Troy City School District Ubly Community Schools Union City Community Schools Unionville-Sebewaing Area Schools Utica Community Schools Van Buren Public Schools Vanderbilt Area Schools Vandercook Lake Public Schools Vandyke Public Schools Vassar Public Schools Verona Mills School Vestaburg Community Schools Vicksburg Community Schools Wakefield Township Schools Walden Green Day School

STATISTICAL SECTION
112 • MICHIGAN PUBLIC SCHOOL EMPLOYEES’ RETIREMENT SYSTEM
Schedule of Participating Employers through 9/30/07 (Continued) K - 12 School Districts (continued): Waldron Area Schools Walkerville Rural Community School District Walled Lake Consolidated Schools Warren Consolidated Schools Warren Woods Public Schools Waterford School District Watersmeet Township School District Watervliet Public Schools Waverly Community Schools Wayland Union Schools Wayne-Westland Community Schools Webberville Community Schools Wells Township School #18 West Bloomfield Schools West Branch-Rose City Area Schools West Iron County Public Schools West Ottawa Public Schools Western School District Westwood Community Schools Westwood Heights Schools White Cloud Public Schools White Pigeon Community Schools White Pine School District Whitefish Township School Whiteford Agricultural School Whitehall District Schools Whitmore Lake Public Schools Whittemore-Prescott Area Schools Williamston Community Schools Willow Run Community Schools Windover High School Wolverine Community Schools Wood School District #8 Woodhaven-Brownstown School District Wyandotte Public Schools Wyoming Public Schools Yale Public School District Ypsilanti Public Schools Zeeland Public Schools Public School Academies: Academic Transitional Academy of St. Clair Academy for Plastics Manufacturing Technology Academy of Style AGBU Alex & Marie Manoogian School Arts Academy in the Woods Bay-Arenac Community High School Ben Ross Public School Academy Blue Water Learning Academy
Casman Alternative Academy Central Academy Cole Academy Colin Powell Academy Commonwealth Community Development Academy Concord Academy Countryside Charter School Creative Technologies Academy Da Vinci Institute Dearborn Academy Detroit Academy of Arts & Sciences Detroit Community High School Discovery Elementary School Edison Oakland Public School Academy Edison Public School Academy El-Hajj Malik El-Shabazz Academy Gateway Middle High School Gaudior Academy Grand Rapids Child Discovery Center Health Career Academy of St Clair Co Henry Ford Academy Holly Academy Honey Creek Community School Hope Academy Horizons Community High School Hospitality Academy of St. Clair County Information Technology Academy of St Clair County International Academy of Flint Joseph K. Lumsden Public.School Academy Macomb Academy Martin Luther King, Jr. Public School Academy Merritt Academy Michigan Technological Academy Mid-Michigan Public School Academy Nah Tah Wahsh Public School Academy Nataki Talibah School of Detroit New Beginnings Academy New Branches School North Star Academy Oakland International Academy Outlook Academy Plymouth Educational Center Charter School Public Safety Academy of St. Clair County St. Clair County Learning Academy St. Clair County Intervention Academy Summit Academy Washtenaw Technical Middle College Woodland Park Academy YMCA Service Learning Academy

STATISTICAL SECTION
MICHIGAN PUBLIC SCHOOL EMPLOYEES’ RETIREMENT SYSTEM • 113
Schedule of Participating Employers through 9/30/07 (Continued) Libraries: Ann Arbor District Library Bacon Memorial District Library Cheboygan Area Public Library Flint Public Library Grosse Pointe Public Library Hackley Public Library Houghton Lake Public Library Kalamazoo Public Library Public Libraries of Saginaw Tecumseh Public Library Willard District Library

114 • MICHIGAN PUBLIC SCHOOL EMPLOYEES’ RETIREMENT SYSTEM
ACKNOWLEDGMENTS The Michigan Public School Employees’ Retirement System Comprehensive Annual Financial Report is prepared by Financial Services, Fiscal Management Division. Staff of the division for the fiscal year 2006-2007 report included: Management: Patricia Lack, CPA, Director Ronald Foss, Accounting Manager Cindy Peters, Accounting Manager Accountants: Randy Bitner Trina Guy Erik Simmer Paula Webb Julie Zolnai Technical and Support Staff: Patricia Jorae Jamin Schroeder Erik Simmer Marilyn Williams Special thanks are also extended to the Office of Retirement Services personnel, accounting and support personnel throughout Financial Services, Investments Division of Treasury, Office of the Auditor General, Andrews Hooper & Pavlik P.L.C., Gabriel Roeder Smith & Co., and the staff at the Office of Financial Management. Preparation of this report would not have been possible without the efforts of these individuals.
The report may be viewed on-line at: www.michigan.gov/ors