lrfd abutment and retaining wall analysis and design … manual/ablrfd users... · user's...
TRANSCRIPT

USER'S MANUAL FOR
LRFD ABUTMENT AND RETAINING WALL ANALYSIS AND DESIGN
(ABLRFD)
Version 1.16.0.0

USER’S MANUAL FOR
COMPUTER PROGRAM ABLRFD LRFD ABUTMENT AND RETAINING WALL
ANALYSIS AND DESIGN Version 1.16.0.0
Prepared by: Imbsen & Associates, Inc. for
Pennsylvania Department of Transportation
January 2017
Copyright © 1998-2017 Commonwealth of Pennsylvania Department of Transportation

This page intentionally left blank

LRFD ABUTMENT AND RETAINING WALL ANALYSIS AND DESIGN
i
TABLE OF CONTENTS
CHAPTER 1 - GENERAL DESCRIPTION ............................................................................................................. 1-1
1.1 PROGRAM IDENTIFICATION ............................................................................................................ 1-1 1.2 ABBREVIATION .................................................................................................................................. 1-2
CHAPTER 2 - PROGRAM DESCRIPTION ............................................................................................................ 2-1
2.1 GENERAL ........................................................................................................................................... 2-1 2.2 SUBSTRUCTURE TYPES .................................................................................................................. 2-1 2.3 FOOTING TYPES ............................................................................................................................... 2-7 2.4 PROGRAM FUNCTIONS .................................................................................................................... 2-7 2.5 LOADINGS .......................................................................................................................................... 2-9 2.6 ASSUMPTIONS AND LIMITATIONS .................................................................................................. 2-9
CHAPTER 3 - METHOD OF SOLUTION ............................................................................................................... 3-1
3.1 NOTATION .......................................................................................................................................... 3-2 3.2 GEOMETRY ...................................................................................................................................... 3-10
3.2.1 Footing Design Iteration ...................................................................................................... 3-10 3.3 APPLIED LOAD EFFECTS ............................................................................................................... 3-17
3.3.1 Construction Stages ........................................................................................................... 3-17 3.3.2 Applied Loads ..................................................................................................................... 3-20
3.3.2.1 DC ...................................................................................................................... 3-20 3.3.2.2 DW ..................................................................................................................... 3-20 3.3.2.3 DCAT ................................................................................................................. 3-21 3.3.2.4 DCAS ................................................................................................................. 3-21 3.3.2.5 EV ...................................................................................................................... 3-26 3.3.2.6 EH ...................................................................................................................... 3-26 3.3.2.7 EH-V .................................................................................................................. 3-31
3.3.2.7.1 Overall EH-V Equations ................................................................... 3-31 3.3.2.7.2 Internal Footing EH-V Equations ..................................................... 3-32
3.3.2.8 WA-E .................................................................................................................. 3-34 3.3.2.9 LS ....................................................................................................................... 3-35 3.3.2.10 ES ...................................................................................................................... 3-36 3.3.2.11 WA ..................................................................................................................... 3-37 3.3.2.12 WSUP ................................................................................................................ 3-38 3.3.2.13 WSUB ................................................................................................................ 3-38 3.3.2.14 WL ...................................................................................................................... 3-39 3.3.2.15 PL ....................................................................................................................... 3-39 3.3.2.16 LL ....................................................................................................................... 3-39 3.3.2.17 LLAS .................................................................................................................. 3-39 3.3.2.18 BR ...................................................................................................................... 3-39 3.3.2.19 CE ...................................................................................................................... 3-39 3.3.2.20 TU ...................................................................................................................... 3-40 3.3.2.21 FR ...................................................................................................................... 3-40 3.3.2.22 EQ ...................................................................................................................... 3-40 3.3.2.23 CT ...................................................................................................................... 3-41
3.3.3 Load Cases ......................................................................................................................... 3-41 3.3.4 Limit States and Load Combinations .................................................................................. 3-41 3.3.5 Eta Factor ........................................................................................................................... 3-45 3.3.6 Average Load Factor .......................................................................................................... 3-45 3.3.7 Earthquake Loading ............................................................................................................ 3-45
3.4 STABILITY ........................................................................................................................................ 3-47 3.4.1 Spread Footing Stability ...................................................................................................... 3-47
3.4.1.1 Overturning (Eccentricity Check) ....................................................................... 3-47 3.4.1.2 Sliding Check for Spread Footings .................................................................... 3-47
3.4.1.2.1 Sliding Resistance of Rock Foundations ......................................... 3-48 3.4.1.2.2 Sliding Resistance of Sand Foundations ......................................... 3-49

LRFD ABUTMENT AND RETAINING WALL ANALYSIS AND DESIGN
ii
3.4.1.2.3 Sliding Resistance of Clay Foundations .......................................... 3-49 3.4.1.2.4 Sliding Resistance of Clayey-Sandy “C-Phi” Soils .......................... 3-49
3.4.1.3 Settlement of Spread Footings .......................................................................... 3-53 3.4.1.3.1 Elastic Settlement ............................................................................ 3-54 3.4.1.3.2 Consolidation Settlement of Clays (and C- φ Soils) ........................ 3-57 3.4.1.3.3 Secondary Settlement of Clays (and C-φ Soils) .............................. 3-61 3.4.1.3.4 Allowable Settlement ....................................................................... 3-62
3.4.1.4 Bearing Capacity Check .................................................................................... 3-62 3.4.1.4.1 Bearing Capacity of Rock Foundations ........................................... 3-62 3.4.1.4.2 Bearing Capacity of Clay and Sand Foundations ........................... 3-62
3.4.1.4.2.1 Category 1 - Soil Condition 1: Single Soil Layer .. 3-64 3.4.1.4.2.2 Category 2 - Two Clay layers or Undrained Two
Layer Mixed Soil .......................................................... 3-68 3.4.1.4.2.3 Category 3 – Sand over Clay or Mixed Soil / Clay or
Mixed Soil over Sand ................................................... 3-69 3.4.1.4.2.4 Category 4 - Loose over Dense Sand or Dense over
Loose Sand .................................................................. 3-73 3.4.1.4.3 Applied Bearing Pressure ................................................................ 3-76
3.4.2 Pedestal Footing Stability ................................................................................................... 3-76 3.4.2.1 Pedestal Footing Overturning / Eccentricity Check ........................................... 3-76 3.4.2.2 Pedestal Footing Bearing Pressure Check ........................................................ 3-78 3.4.2.3 Pedestal Footing Sliding Stability ...................................................................... 3-79 3.4.2.4 Pedestal Overturning / Eccentricity Check ........................................................ 3-79 3.4.2.5 Pedestal Bearing Pressure Check ..................................................................... 3-79 3.4.2.6 Pedestal Settlement ........................................................................................... 3-83
3.4.3 Pile Footings ....................................................................................................................... 3-83 3.4.3.1 Pile Group Properties ........................................................................................ 3-83 3.4.3.2 Vertical Load Stability ........................................................................................ 3-83 3.4.3.3 Lateral Load Stability ......................................................................................... 3-85
3.5 FOOTING .......................................................................................................................................... 3-86 3.5.1 Structural Analysis .............................................................................................................. 3-86
3.5.1.1 Spread Footing .................................................................................................. 3-88 3.5.1.2 Pile Footings ...................................................................................................... 3-89
3.5.1.2.1 Perpendicular Direction ................................................................... 3-89 3.5.1.2.2 Parallel Direction ............................................................................. 3-91
3.5.1.3 Pedestal Footings .............................................................................................. 3-92 3.5.1.3.1 Footing Flexural Loads (parallel direction) ...................................... 3-92 3.5.1.3.2 Shear Loads (parallel direction) ...................................................... 3-93
3.5.1.4 Service Load Stresses ....................................................................................... 3-94 3.5.2 Specification Checking ....................................................................................................... 3-95
3.5.2.1 Strength Check – Analysis ................................................................................. 3-96 3.5.2.2 Strength Check – Design ................................................................................... 3-97 3.5.2.3 Development Length .......................................................................................... 3-99 3.5.2.4 Development Length Correction Factors ......................................................... 3-101 3.5.2.5 Phi Factor and Over-reinforced Sections ........................................................ 3-102 3.5.2.6 Spacing Requirements .................................................................................... 3-103 3.5.2.7 Minimum Area of Reinforcement ..................................................................... 3-103
3.5.2.7.1 Minimum Based on Temperature and Shrinkage Requirements .. 3-103 3.5.2.7.2 Minimum Based on Flexural Requirements .................................. 3-105
3.5.2.8 Serviceability Crack Control ............................................................................. 3-106 3.5.2.9 Shear ............................................................................................................... 3-106 3.5.2.10 Punching Shear (Pile Footings Only) .............................................................. 3-107
3.5.3 Design of a Footing Section .............................................................................................. 3-107 3.6 BACKWALL AND STEM ................................................................................................................. 3-110
3.6.1 Structural Analysis ............................................................................................................ 3-111 3.6.2 Specification Checking ..................................................................................................... 3-116
3.6.2.1 Strength Considerations - Moment/Axial Capacity .......................................... 3-116 3.6.2.2 Spacing Requirements (maximum and minimum) ........................................... 3-122 3.6.2.3 Minimum Area .................................................................................................. 3-122

LRFD ABUTMENT AND RETAINING WALL ANALYSIS AND DESIGN
iii
3.6.2.4 Serviceability Allowable Stress ........................................................................ 3-122 3.6.2.5 Shear ............................................................................................................... 3-122
3.6.3 Design of a Stem Section ................................................................................................. 3-123 3.6.3.1 Optimum Reinforcement Selection .................................................................. 3-126
3.6.4 Design of a Backwall Section ........................................................................................... 3-127 3.6.5 Gravity Wall Tension Check ............................................................................................. 3-129
3.7 DESIGN CONSIDERATIONS ......................................................................................................... 3-130 3.7.1 Spread Footings ............................................................................................................... 3-130
3.7.1.1 Design Algorithm ............................................................................................. 3-130 3.7.1.2 Evaluation of Optimal Design .......................................................................... 3-130
3.7.1.2.1 Backfill Area for Structures Situated In a Fill ................................. 3-132 3.7.1.2.2 Backfill Area for Structures Situated In a Cut ................................ 3-132 3.7.1.2.3 Special Cases of Backfill Areas for Structures Situated In a Cut .. 3-133
3.7.2 Pedestal Footings ............................................................................................................. 3-137 3.7.2.1 Pedestal Design Algorithm .............................................................................. 3-137 3.7.2.2 Evaluation of Pedestal Optimal Design ........................................................... 3-141
3.7.3 Pile/Caisson Footings ....................................................................................................... 3-142 3.7.3.1 Design Algorithm for Pile Footings .................................................................. 3-142 3.7.3.2 Evaluation of Pile Optimal Design ................................................................... 3-153
3.7.4 Shear Design .................................................................................................................... 3-153 3.8 TOLERANCES ................................................................................................................................ 3-155
3.8.1 Spread Footing ................................................................................................................. 3-155 3.8.2 Pile Footing ....................................................................................................................... 3-155 3.8.3 Pedestal Footing ............................................................................................................... 3-155 3.8.4 Rebar Calculations ........................................................................................................... 3-156
3.9 NO SOLUTION FOUND .................................................................................................................. 3-157 3.9.1 Spread Footing ................................................................................................................. 3-157 3.9.2 Pile Footing ....................................................................................................................... 3-158 3.9.3 Pedestal Footing ............................................................................................................... 3-160
CHAPTER 4 - GETTING STARTED ...................................................................................................................... 4-1
4.1 INSTALLATION ................................................................................................................................... 4-1 4.2 PREPARING INPUT ........................................................................................................................... 4-2 4.3 ENGINEERING ASSISTANT .............................................................................................................. 4-3 4.4 RUNNING THE PROGRAM WITHOUT ENGASST ............................................................................ 4-4
CHAPTER 5 - INPUT DESCRIPTION .................................................................................................................... 5-1
5.1 INPUT DATA REQUIREMENTS ......................................................................................................... 5-1 5.2 ORDER OF COMMANDS ................................................................................................................... 5-4 5.3 CFG - CONFIGURATION COMMAND .............................................................................................. 5-11 5.4 TTL - TITLE COMMAND ................................................................................................................... 5-12 5.5 CTL - CONTROL COMMAND ........................................................................................................... 5-13 5.6 AT1 - ABUTMENT TYPE I COMMAND ............................................................................................. 5-15 5.7 AT2 - ABUTMENT TYPE II COMMAND ............................................................................................ 5-18 5.8 AWB - ABUTMENT WITHOUT BACKWALL COMMAND ................................................................. 5-22 5.9 RWL - RETAINING WALL COMMAND ............................................................................................. 5-25 5.10 FTG - FOOTING COMMAND ............................................................................................................ 5-28 5.11 SPR - SPREAD COMMAND ............................................................................................................. 5-30 5.12 PIL - PILE COMMAND ...................................................................................................................... 5-33 5.13 CAI - CAISSON COMMAND ............................................................................................................. 5-35 5.14 PED - PEDESTAL COMMAND ......................................................................................................... 5-36 5.15 LYD - PILE/CAISSON LAYOUT DESIGN COMMAND ..................................................................... 5-40 5.16 LYA - PILE/CAISSON LAYOUT ANALYSIS COMMAND .................................................................. 5-43 5.17 MAT - MATERIALS COMMAND ....................................................................................................... 5-45 5.18 SOI - SOIL DATA COMMAND ........................................................................................................... 5-47 5.19 RCK - ROCK DATA COMMAND ....................................................................................................... 5-54 5.20 CNS - CONSOLIDATION SETTLEMENT COMMAND ..................................................................... 5-56 5.21 MRD - MISCELLANEOUS REINFORCEMENT DATA COMMAND .................................................. 5-57

LRFD ABUTMENT AND RETAINING WALL ANALYSIS AND DESIGN
iv
5.22 CVR - REINFORCEMENT COVER COMMAND ............................................................................... 5-58 5.23 SPD - REINFORCEMENT DESIGN COMMAND .............................................................................. 5-60 5.24 BAR - BAR SIZE COMMAND ............................................................................................................ 5-61 5.25 SPA - BAR SPACING FOR ANALYSIS COMMAND ......................................................................... 5-62 5.26 ARE - REINFORCEMENT AREA COMMAND .................................................................................. 5-64 5.27 SRA - STEM REINFORCEMENT AREAS COMMAND ..................................................................... 5-66 5.28 SRB - STEM REINFORCEMENT BARS COMMAND ....................................................................... 5-68 5.29 LDC - LOAD CONTROL COMMAND ................................................................................................ 5-70 5.30 LAB - LOADS ON ABUTMENTS COMMAND ................................................................................... 5-73 5.31 ASL – APPROACH SLAB LOAD COMMAND ................................................................................... 5-76 5.32 LRT - LOADS ON RETAINING WALLS COMMAND ......................................................................... 5-81 5.33 DLL - DESIGN LIVE LOADING COMMAND ..................................................................................... 5-83 5.34 SLL - SPECIAL LIVE LOADING COMMAND .................................................................................... 5-84 5.35 EQL - EARTHQUAKE LOADS COMMAND ...................................................................................... 5-85 5.36 OIN - OUTPUT OF INPUT COMMAND ............................................................................................. 5-86 5.37 OUR - OUTPUT OF RESULTS COMMAND ..................................................................................... 5-87 5.38 OUI - OUTPUT OF INTERMEDIATE DATA COMMAND .................................................................. 5-89
CHAPTER 6 - DETAILED INPUT DESCRIPTION ................................................................................................. 6-1
6.5 CTL - CONTROL COMMAND ............................................................................................................. 6-1 6.5.3 Footing Datum ...................................................................................................................... 6-1
6.6 AT1 - ABUTMENT TYPE 1 COMMAND .............................................................................................. 6-1 6.6.13 Front Water Level ................................................................................................................. 6-1 6.6.14 Back Water Level .................................................................................................................. 6-3
6.7 AT2 - ABUTMENT TYPE 2 COMMAND .............................................................................................. 6-4 6.7.20 Front Water Level ................................................................................................................. 6-4 6.7.21 Back Water Level .................................................................................................................. 6-4
6.8 AWB - ABUTMENT WITHOUT BACKWALL COMMAND ................................................................... 6-4 6.8.9 Front Water Level ................................................................................................................. 6-4 6.8.10 Back Water Level .................................................................................................................. 6-4 6.8.11 Type of Abutment ................................................................................................................. 6-4
6.9 RWL - RETAINING WALL COMMAND ............................................................................................... 6-4 6.9.11 Front Water Level ................................................................................................................. 6-4 6.9.12 Back Water Level .................................................................................................................. 6-5 6.9.13 Type of Wall .......................................................................................................................... 6-5
6.10 FTG - FOOTING COMMAND .............................................................................................................. 6-6 6.10.9 Footing Thickness Increment & 6.10.10 Footing Width Increment................................. 6-12 6.10.10 Footing Width Increment ..................................................................................................... 6-12 6.10.11 Footing Stem Increment ..................................................................................................... 6-12
6.12 PIL - PILE COMMAND ...................................................................................................................... 6-13 6.12.3 Pile Embedment ................................................................................................................. 6-13 6.12.5 Strength Axial Capacity ...................................................................................................... 6-13 6.12.7 Strength Lateral Capacity ................................................................................................... 6-13 6.12.8 Pile Uplift Capacity .............................................................................................................. 6-14
6.13 CAI - CAISSON COMMAND ............................................................................................................ 6-15 6.13.2 Caisson Embedment .......................................................................................................... 6-15 6.13.4 Strength Axial Capacity ...................................................................................................... 6-15 6.13.6 Strength Lateral Capacity ................................................................................................... 6-15 6.13.7 Caisson Uplift Capacity ....................................................................................................... 6-15
6.14 PED - PEDESTAL COMMAND ......................................................................................................... 6-15 6.14.4 Minimum Pedestal Width .................................................................................................... 6-15 6.14.5 Minimum Pedestal Thickness ............................................................................................. 6-16 6.14.8 Maximum Pedestal Width ................................................................................................... 6-16 6.14.9 Maximum Pedestal Thickness ............................................................................................ 6-16
6.15 LYD - PILE/CAISSON LAYOUT DESIGN COMMAND ..................................................................... 6-16 6.15.6 Pile Spacing Rounding ....................................................................................................... 6-16 6.15.7 Row Distances Rounding ................................................................................................... 6-17 6.15.10 Last Row % Batter .............................................................................................................. 6-17

LRFD ABUTMENT AND RETAINING WALL ANALYSIS AND DESIGN
v
6.16 LYA - PILE/CAISSON LAYOUT ANALYSIS COMMAND ................................................................. 6-17 6.16.4 Percent Battered ................................................................................................................. 6-17
6.17 MAT - MATERIALS COMMAND ....................................................................................................... 6-17 6.17.8 Backfill Friction Angle ......................................................................................................... 6-17 6.17.11 Minimum Equivalent Fluid Pressure ................................................................................... 6-17
6.18 SOI - SOIL DATA COMMAND .......................................................................................................... 6-17 6.18.3 Footing Near Slope ............................................................................................................. 6-18 6.18.5 Allowable Settlement .......................................................................................................... 6-19 6.18.6 Bearing Capacity Phi Factor ............................................................................................... 6-19 6.18.7 Sliding Phi Factor ................................................................................................................ 6-19 6.18.10 Layer 1 Undrained Shear Strength ..................................................................................... 6-20 6.18.12 Layer 1 Saturated Unit Weight / Density ............................................................................ 6-20 6.18.14 Layer 1 Poisson's Ratio ....................................................................................................... 6-20 6.18.15 Layer 1 Cohesion ................................................................................................................ 6-20 6.18.16 Layer 1 Effective Friction Angle .......................................................................................... 6-20 6.18.17 Layer 1 Ncq .......................................................................................................................... 6-21 6.18.18 Layer 1 Nq .......................................................................................................................... 6-21 6.18.20 Layer 2 Undrained Shear Strength ..................................................................................... 6-21 6.18.22 Layer 2 Saturated Unit Weight / Density ............................................................................ 6-21 6.18.24 Layer 2 Poisson's Ratio ....................................................................................................... 6-21 6.18.25 Layer 2 Cohesion ................................................................................................................ 6-21 6.18.26 Layer 2 Effective Friction Angle .......................................................................................... 6-21 6.18.27 Layer 2 Ncq .......................................................................................................................... 6-21 6.18.28 Layer 2 Nq ........................................................................................................................... 6-22 6.18.29 Apply Inclination Factors ..................................................................................................... 6-22 6.18.30 Precast or Cast-in-Place ..................................................................................................... 6-22
6.19 RCK - ROCK DATA COMMAND ....................................................................................................... 6-22 6.19.1 Empirical Bearing Capacity ................................................................................................. 6-22 6.19.4 Sliding Resistance .............................................................................................................. 6-23 6.19.5 Allowable Settlement .......................................................................................................... 6-23 6.19.6 Bearing Capacity Phi Factor ............................................................................................... 6-23 6.19.7 Sliding Phi Factor ................................................................................................................ 6-24 6.19.9 Concrete / Rock Friction ..................................................................................................... 6-24 6.19.10 Intact Rock Modulus ........................................................................................................... 6-24
6.20 CNS - CONSOLIDATION SETTLEMENT COMMAND ..................................................................... 6-25 6.20.1 Number of soil layers .......................................................................................................... 6-25 6.20.2 Void Ratio ........................................................................................................................... 6-26 6.20.3 Compression Index ............................................................................................................. 6-26 6.20.4 Re-compression Index ........................................................................................................ 6-26 6.20.5 Secondary Compression Index........................................................................................... 6-26 6.20.6 Initial Effective Stress ......................................................................................................... 6-26 6.20.7 Maximum Past Effective Stress .......................................................................................... 6-28 6.20.8 Primary Consolidation Time ................................................................................................ 6-33 6.20.9 Service Life ......................................................................................................................... 6-33
6.21 MRD - MISCELLANEOUS REINFORCEMENT DATA COMMAND .................................................. 6-33 6.21.1 Aggregate Size ................................................................................................................... 6-33 6.21.2 Development Correction Factor .......................................................................................... 6-33 6.21.3 Backwall Exposure ............................................................................................................. 6-33 6.21.4 Stem Exposure ................................................................................................................... 6-34 6.21.5 Footing Exposure ................................................................................................................ 6-34
6.23 SPD - REINFORCEMENT DESIGN COMMAND .............................................................................. 6-34 6.23.5 User Requested Minimum Bar Spacing & 6.23.6 Bar Spacing Increment .................... 6-34
6.24 BAR - BAR SIZE COMMAND ............................................................................................................ 6-34 6.27 SRA - STEM REINFORCEMENT AREAS COMMAND ..................................................................... 6-35 6.29 LDC – LOAD CONTROL COMMAND ............................................................................................... 6-36
6.29.4 Temp LS ............................................................................................................................. 6-36 6.29.5 Final LS ............................................................................................................................... 6-36
6.31 ASL – APPROACH SLAB LOAD COMMAND ................................................................................... 6-36

LRFD ABUTMENT AND RETAINING WALL ANALYSIS AND DESIGN
vi
6.31.1 Approach Slab DC .............................................................................................................. 6-36 6.31.2 Approach Slab LL ............................................................................................................... 6-36
6.32 LRT – LOADS ON RETAINING WALL COMMAND .......................................................................... 6-38 6.32.2 Y Distance to CT ................................................................................................................. 6-38
6.35 EQL - EARTHQUAKE LOADS COMMAND ...................................................................................... 6-38 6.35.1 Response Modification ....................................................................................................... 6-39 6.35.2 Soil Pressure Factor ........................................................................................................... 6-39 6.35.3 Phi Factor Foundation ........................................................................................................ 6-39 6.35.5 Horizontal Superstructure Force ......................................................................................... 6-39 6.35.6 Horizontal External Structure Force ................................................................................... 6-39
6.36 OIN - OUTPUT OF INPUT COMMAND ............................................................................................. 6-40 6.37 OUR - OUTPUT OF RESULTS COMMAND ..................................................................................... 6-41 6.38 OUI - OUTPUT OF INTERMEDIATE DATA COMMAND .................................................................. 6-43
CHAPTER 7 - OUTPUT DESCRIPTION ................................................................................................................ 7-1
7.1 GENERAL OUTPUT INFORMATION ................................................................................................. 7-1 7.1.1 Output Table Controls ........................................................................................................... 7-1 7.1.2 Page Format ......................................................................................................................... 7-1 7.1.3 Page Numbering ................................................................................................................... 7-2 7.1.4 Page Header ......................................................................................................................... 7-2 7.1.5 Units ...................................................................................................................................... 7-2 7.1.6 Sign Conventions .................................................................................................................. 7-4
7.2 COVER PAGE ..................................................................................................................................... 7-5 7.3 INPUT DATA ....................................................................................................................................... 7-6
7.3.1 Echo of Input Data ................................................................................................................ 7-6 7.3.2 Input Commands .................................................................................................................. 7-8 7.3.3 Input Summary Tables .......................................................................................................... 7-8
7.4 RESULTS .......................................................................................................................................... 7-10 7.4.1 Additional Information ......................................................................................................... 7-10 7.4.2 Pile Pattern ......................................................................................................................... 7-12 7.4.3 Output Legend .................................................................................................................... 7-13 7.4.4 Factored Forces .................................................................................................................. 7-13 7.4.5 Footing Stability .................................................................................................................. 7-18
7.4.5.1 Pile Footing ........................................................................................................ 7-18 7.4.5.2 Spread Footing .................................................................................................. 7-21 7.4.5.3 Pedestal Footing ................................................................................................ 7-25
7.4.6 Controlling Footing Forces .................................................................................................. 7-30 7.4.7 Footing Flexure ................................................................................................................... 7-31
7.4.7.1 Footing Flexure – Analysis ................................................................................ 7-32 7.4.7.2 Footing Flexure – Design ................................................................................... 7-34
7.4.8 Crack Control ...................................................................................................................... 7-36 7.4.8.1 Crack Control in Footings and Cantilever Stems ............................................... 7-36 7.4.8.2 Crack Control Check for Gravity Walls .............................................................. 7-41
7.4.9 Reinforcement Summary .................................................................................................... 7-42 7.4.10 Shear Results ..................................................................................................................... 7-47 7.4.11 Reinforcement Design Details ............................................................................................ 7-50 7.4.12 Optimal Design Details ....................................................................................................... 7-56
7.5 INTERMEDIATE RESULTS .............................................................................................................. 7-59 7.5.1 Unfactored Loads ............................................................................................................... 7-59 7.5.2 Load Factors ....................................................................................................................... 7-63 7.5.3 Intermediate Bearing Resistance Values ........................................................................... 7-65 7.5.4 Moment/Axial Interaction .................................................................................................... 7-67 7.5.5 Internal Footing Forces ....................................................................................................... 7-69 7.5.6 Minimum Reinforcement Check.......................................................................................... 7-72
7.6 FORMATTED OUTPUT TABLES ..................................................................................................... 7-75 7.6.1 INPUT ECHO Report Format - Using Spread Footing Input .............................................. 7-75 7.6.2 INPUT COMMANDS Report Format - Using Spread Footing Input ................................... 7-77 7.6.3 INPUT SUMMARY Report Format ..................................................................................... 7-80

LRFD ABUTMENT AND RETAINING WALL ANALYSIS AND DESIGN
vii
7.6.4 ADDITIONAL INFORMATION Report Summary................................................................ 7-86 7.6.5 OUTPUT LEGEND Report Summary ................................................................................. 7-87 7.6.6 FACTORED FORCES Report Format ................................................................................ 7-87 7.6.7 FOOTING STABILITY Report Format ................................................................................ 7-88 7.6.8 CONTROLLING FOOTING FORCES Report Format ........................................................ 7-93 7.6.9 FOOTING FLEXURE – ANALYSIS Report Format ............................................................ 7-93 7.6.10 FOOTING FLEXURE - DESIGN Report Format ................................................................ 7-94 7.6.11 CRACK CONTROL - ANALYSIS Report Format ............................................................... 7-95 7.6.12 CRACK CONTROL - DESIGN Report Format ................................................................... 7-97 7.6.13 GRAVITY WALL STRESS CHECK Report Format ............................................................ 7-98 7.6.14 REINFORCEMENT SUMMARY - ANALYSIS Report Format ............................................ 7-98 7.6.15 REINFORCEMENT SUMMARY - DESIGN Report ............................................................ 7-99 7.6.16 SHEAR RESULTS Report Format ................................................................................... 7-101 7.6.17 REINFORCEMENT AND OPTIMUM DESIGN DETAILS Report Formats ...................... 7-102
7.6.17.1 Reinforcement Design Details ......................................................................... 7-102 7.6.17.2 Optimum Design Details .................................................................................. 7-104
7.6.18 UNFACTORED LOADS Report Summary ....................................................................... 7-105 7.6.19 LOAD FACTORS Report Summary ................................................................................. 7-107 7.6.20 INTERMEDIATE BEARING RESISTANCE VALUES Report Format .............................. 7-108 7.6.21 MOMENT AXIAL INTERACTION Report Format ............................................................. 7-109 7.6.22 INTERNAL FOOTING FORCES Report Format .............................................................. 7-110 7.6.23 MINIMUM REINFORCEMENT CHECK Report Format ................................................... 7-112
7.7 SPECIFICATION CHECK WARNINGS .......................................................................................... 7-113 7.8 SPECIFICATION CHECK FAILURES ............................................................................................. 7-114
CHAPTER 8 - EXAMPLE PROBLEMS ................................................................................................................. 8-1
8.1 EXAMPLE PROBLEMS ...................................................................................................................... 8-1 8.2 EXAMPLE 1 (DESIGN) ....................................................................................................................... 8-4 8.3 EXAMPLE 2 (DESIGN) ....................................................................................................................... 8-8 8.4 EXAMPLE 3 ...................................................................................................................................... 8-12 8.5 EXAMPLE 4 ...................................................................................................................................... 8-16 8.6 EXAMPLE 5 (DESIGN) ..................................................................................................................... 8-20 8.7 EXAMPLE 6 (DESIGN) ..................................................................................................................... 8-21 8.8 EXAMPLE 7 ...................................................................................................................................... 8-25 8.9 EXAMPLE 8 ...................................................................................................................................... 8-29 8.10 EXAMPLE 9 (DESIGN) ..................................................................................................................... 8-33 8.11 EXAMPLE 10 .................................................................................................................................... 8-37 8.12 EXAMPLE 11 .................................................................................................................................... 8-40 8.13 EXAMPLE 12 (DESIGN) ................................................................................................................... 8-44 8.14 EXAMPLE 13 (DESIGN) ................................................................................................................... 8-48 8.15 EXAMPLE 14 .................................................................................................................................... 8-52
CHAPTER 9 - TECHNICAL QUESTIONS AND REVISION REQUEST ............................................................... 9-1
9.1 TECHNICAL QUESTIONS .................................................................................................................. 9-1 9.2 REVISION REQUEST ......................................................................................................................... 9-1

LRFD ABUTMENT AND RETAINING WALL ANALYSIS AND DESIGN
viii
LIST OF FIGURES Figure 2.1-1 Directions ............................................................................................................................... 2-2 Figure 2.2-1 Abutment Type I ..................................................................................................................... 2-3 Figure 2.2-2 Abutment Type II .................................................................................................................... 2-4 Figure 2.2-3 Abutment without Backwall .................................................................................................... 2-5 Figure 2.2-4 Retaining Wall ........................................................................................................................ 2-6 Figure 3.2.1-1 Incremental Positions of the Footing Geometry ................................................................... 3-12 Figure 3.2.1-2 Design Algorithm for Footing Iteration Scheme ................................................................... 3-13 Figure 3.2.1-3 Typical Attempted Footing Design Dimensions ................................................................... 3-14 Figure 3.2.1-4 Design Status of Footing Iteration Scheme Displayed on Monitor ...................................... 3-16 Figure 3.3.1-1 Construction Stages ............................................................................................................. 3-18 Figure 3.3.2.3-1 Architectural Treatment Detail ............................................................................................. 3-21 Figure 3.3.2.6-1 Illustration of EH and WA-E Loads ...................................................................................... 3-27 Figure 3.3.2.6-2 Illustration of Soil Wedge ..................................................................................................... 3-28 Figure 3.3.2.6-3 Broken Backfill Ka Values ..................................................................................................... 3-30 Figure 3.3.2.6-4 Broken Backfill Soil Height Ratio ......................................................................................... 3-31 Figure 3.3.2.7.2-1 Partial EH-V Force Diagram ................................................................................................ 3-32 Figure 3.3.2.7.2-2 Case 1 Area Diagram - Water Below Footing ...................................................................... 3-33 Figure 3.3.2.7.2-3 Case 2 Area Diagram - Water Above Affected Area ........................................................... 3-33 Figure 3.3.2.7.2-4 Case 3 Area Diagram - Water Within Affected Area ............................................................ 3-34 Figure 3.3.2.9-1 Temporary Stage - Live Load and Dead Load Surcharge Loading ..................................... 3-35 Figure 3.3.2.9-2 Final Stage - Live Load and Dead Load Surcharge Loading ............................................... 3-36 Figure 3.3.2.11-1 Illustration of WA Load ......................................................................................................... 3-37 Figure 3.3.2.13 Application of Wind at Stem Locations ................................................................................ 3-38 Figure 3.4.1.1-1 Stability Check for Spread Footing ...................................................................................... 3-48 Figure 3.4.1.2.4-1 Illustration of Pressure Distribution Under Spread Footing.................................................. 3-51 Figure 3.4.1.3.1-1 Settlement Influence Factor based on Christian and Carrier ............................................... 3-55 Figure 3.4.1.3.1-2 Considerations for Settlement for Two Layers of Soil .......................................................... 3-57 Figure 3.4.1.3.2-1 Description of Z and Hw values ............................................................................................ 3-59 Figure 3.4.1.3.2-2 Consolidation Settlement Reduction Factor ........................................................................ 3-61 Figure 3.4.1.4.2-1 Df definition (from Bowles Second Edition Figure 4-3) ........................................................ 3-64 Figure 3.4.1.4.2.4-1 Punching Shear Coefficient Graph (Ks) ............................................................................... 3-75 Figure 3.4.2.1-1 Stability Check for Pedestal Footing and Pedestal .............................................................. 3-77 Figure 3.4.2.5-1 Pedestal Weight (pw) and Moment (pm) ............................................................................... 3-81 Figure 3.4.3.2-1 Force Relationships for Vertical & Battered Piles ................................................................ 3-84 Figure 3.5.1-1 Critical Location for Footing Analysis ................................................................................... 3-87 Figure 3.5.1.1-1 Heel Shear Analysis Points Locations ................................................................................. 3-88 Figure 3.5.1.1-2 Spread Footing Heel - Applied Load and Shear Diagram ................................................... 3-89 Figure 3.5.1.2.1-1 Pile Footing Heel - Applied Load and Shear Diagram ......................................................... 3-90 Figure 3.5.1.2.1-2 Contribution of Pile to Moment and Force Calculations ....................................................... 3-91 Figure 3.5.2.1-1 Singly Reinforced Section .................................................................................................... 3-97 Figure 3.5.2.7.1-1 Temperature and shrinkage dimension location RWL, AWB............................................. 3-104 Figure 3.5.2.7.1-2 Temperature and shrinkage dimension locations AT1, AT2 .............................................. 3-105 Figure 3.6-1 Type II Abutment Section Height at Stem Points of Analysis Above Stem Notch ............. 3-111 Figure 3.6.1-1 Lateral Forces of Cross Section ......................................................................................... 3-112 Figure 3.6.1-2 Stem and Backwall Points of Analysis ............................................................................... 3-113 Figure 3.6.2.1-1 Moment-Interaction Diagram of a Singly Reinforced Section ............................................ 3-117 Figure 3.6.3-1 Stem Design Considerations ............................................................................................. 3-125 Figure 3.6.3-2 Cutoff Considerations for Abutment Types I and II ............................................................ 3-126 Figure 3.6.4-1 Backwall Height for Splice Check ...................................................................................... 3-128 Figure 3.7.1.2-2 Examples of Backfill Area for Structures Situated in a Fill ................................................. 3-134 Figure 3.7.1.2-3 Examples of Backfill Areas for Structures Situated in a Cut .............................................. 3-135 Figure 3.7.1.2-4 Special Cases of Backfill Areas for Structures Situated in a Cut ....................................... 3-136 Figure 3.7.2.1-1 Outline of Pedestal Design Procedure ............................................................................... 3-138 Figure 3.7.2.1-2 Pedestal Configurations for Design ................................................................................... 3-139 Figure 3.7.3.1-1 Schematics of Sample Pile Patterns .................................................................................. 3-143 Figure 3.7.3.1-2 Pile Spacings - Center to Center ....................................................................................... 3-145

LRFD ABUTMENT AND RETAINING WALL ANALYSIS AND DESIGN
ix
Figure 3.9.1-1 No-Solution-Found Message For Spread Footing ............................................................. 3-157 Figure 3.9.2-1 No-Solution-Found Message For Pile Footings ................................................................. 3-159 Figure 3.9.3-1 No-Solution-Found Message For Pedestal Footings ......................................................... 3-160 Figure 5.2-1 Overall View of the Input File ................................................................................................. 5-5 Figure 5.5-1 Footing Elevation Fixity ........................................................................................................ 5-14 Figure 5.6-1 Abutment Type I ................................................................................................................... 5-17 Figure 5.7-1 Abutment Type II .................................................................................................................. 5-21 Figure 5.8-1 Abutment Without Backwall ................................................................................................. 5-24 Figure 5.9-1 Retaining Wall ...................................................................................................................... 5-27 Figure 5.11-1 SPR Command Ground Slope Orientation .......................................................................... 5-32 Figure 5.12-1 Pile / Caisson Dimensions ................................................................................................... 5-34 Figure 5.14-1 Pedestal Dimensions ........................................................................................................... 5-38 Figure 5.14-2 Pedestal Dimensions ........................................................................................................... 5-39 Figure 5.15-1 Pile / Caisson Design Layouts ............................................................................................. 5-42 Figure 5.16-1 Pile / Caisson Analysis Layout ............................................................................................. 5-44 Figure 5.18-1 Soil / Rock Foundation Dimensions for Spread Footings .................................................... 5-51 Figure 5.18-2 Footing on a Slope Criteria .................................................................................................. 5-52 Figure 5.18-3 Footing Near a Slope ........................................................................................................... 5-53 Figure 5.22-1 Concrete Cover .................................................................................................................... 5-59 Figure 5.25-1 Rebar Spacing for SPA Command ...................................................................................... 5-63 Figure 5.27-1 Stem Backface Reinforcement Areas Description ............................................................... 5-67 Figure 5.28-1 Stem Backface Reinforcement Bars Description ................................................................. 5-69 Figure 5.29-1 Construction Stages ............................................................................................................. 5-71 Figure 5.30-1 Loads on Abutments ............................................................................................................ 5-75 Figure 5.31-1 Type 1 or Type 2 Approach Slab – Abutment With Backwall .............................................. 5-77 Figure 5.31-2 Type 1 or Type 2 Approach Slab – Abutment Without Backwall (Deep Beams) ................ 5-78 Figure 5.31-3 Type 1 or Type 2 Approach Slab – Abutment Without Backwall (Shallow Beams .....................
With Abutment Corbel) ........................................................................................................ 5-79 Figure 5.31-4 Type 3 and 4 Approach Slab – Abutment With Backwall (Approach Slab .................................
Connected to Superstructure) ............................................................................................. 5-80 Figure 5.32-1 Loads on Retaining Walls .................................................................................................... 5-82 Figure 6.6.13-1 Height and Footing Datum ..................................................................................................... 6-2 Figure 6.6.14-1 Water Level and Uplift Pressure ............................................................................................ 6-3 Figure 6.10-1 Conflicting Input ..................................................................................................................... 6-8 Figure 6.20 -1 Embankment Effects on Settlement ..................................................................................... 6-25 Figure 6.20.6 -1 Initial Effective Stress ........................................................................................................... 6-27 Figure 6.20.7-1 Case 1 - Normal Consolidation ............................................................................................ 6-28 Figure 6.20.7-2 Case 1 - Underconsolidation ................................................................................................ 6-29 Figure 6.20.7-3 Case 2 - Overconsolidation due to Past Regional Stress .................................................... 6-30 Figure 6.20.7-4 Case 3 - Overconsolidation due to Discrete Surface Loads-A ............................................ 6-31 Figure 6.20.7-5 Case 3 - Overconsolidation due to Discrete Surface Loads-B ............................................ 6-31 Figure 6.20.7-6 Case 4 - Overconsolidated due to Mechanical Compaction of the soil ............................... 6-32 Figure 6.27-1 SRA Example ....................................................................................................................... 6-35 Figure 6.32-1 Y Distance to CT .................................................................................................................. 6-38 Figure 7.1.4-1 Page Header .......................................................................................................................... 7-2 Figure 7.3.1-1 Cover Page ............................................................................................................................ 7-7 Figure 7.3.3-1 Sample Input Command Report - illustrating the MRD, DLL and EQL commands ............... 7-9 Figure 7.4.1-1 Sample Summary Input Command Description of the AT1 and FTG command ................. 7-10 Figure 7.4.1-2 Footing and Pedestal Geometry .......................................................................................... 7-11 Figure 7.4.2-1 Pile Pattern Component of the Stability Report ................................................................... 7-13 Figure 7.4.4-1 Output Legend ..................................................................................................................... 7-14 Figure 7.4.4-2 Factored Forces at the Foundation. ..................................................................................... 7-15 Figure 7.4.4-3 Factored Forces at the Pedestal Base................................................................................. 7-16 Figure 7.4.4-4 Factored Loads in the Stem ................................................................................................. 7-17 Figure 7.4.4-5 Factored Forces in the Footing ............................................................................................ 7-18 Figure 7.4.5.1-1 Pile Axial Loads and Resistance in Footing Stability Report ............................................... 7-19
LRFD ABUTMENT AND RETAINING WALL ANALYSIS AND DESIGN
x
Figure 7.4.5.1-2 Pile Lateral Resistance in Footing Stability Report .............................................................. 7-20 Figure 7.4.5.1-3 Unit Length Diagram ............................................................................................................ 7-21 Figure 7.4.5.2-1 Bearing Capacity Report for Footing Stability ...................................................................... 7-22 Figure 7.4.5.2-2 Sliding Resistance................................................................................................................ 7-23 Figure 7.4.5.2-3 Settlement - Spread Footing Stability Report ...................................................................... 7-24 Figure 7.4.5.3-1 Overturning and Bearing - Pedestal on Foundation ............................................................ 7-26 Figure 7.4.5.3-2 Overturning and Bearing - Pedestal on Footing .................................................................. 7-28 Figure 7.4.5.3-3 Pedestal Sliding (Footing Stability) ...................................................................................... 7-28 Figure 7.4.5.3-4 Pedestal Settlement ............................................................................................................. 7-29 Figure 7.4.6-1 Controlling Forces ................................................................................................................ 7-31 Figure 7.4.7-1 Flexural Strength Report for a Pile Footing Analysis ........................................................... 7-32 Figure 7.4.7-2 Flexural Strength Report for a Pile Footing Design ............................................................. 7-34 Figure 7.4.8.1-1 Crack Control in Backwall and Stem (Analysis Run) ........................................................... 7-36 Figure 7.4.8.1-2 Footing Crack Control Report (Analysis Run) ...................................................................... 7-37 Figure 7.4.8.1-3 Crack Control in Backwall and Stem (Design Run) ............................................................. 7-39 Figure 7.4.8.1-4 Footing Crack Control Report (Design Run) ........................................................................ 7-40 Figure 7.4.8.2-1 Gravity Wall - Tension Check .............................................................................................. 7-42 Figure 7.4.9-1 Summary of Reinforcement Perpendicular Footing Bar Development (Analysis Run) ....... 7-43 Figure 7.4.9-2 Summary of Reinforcement in the Stem & Backwall (Analysis Run) ................................... 7-44 Figure 7.4.9-3 Summary of Reinforcement in the Stem and Backwall (Design Run) ................................. 7-44 Figure 7.4.9-4 Summary of Reinforcement in the Pile Footing (Analysis Run) ........................................... 7-45 Figure 7.4.9-5 Summary of Reinforcement in the Pile Footing (Design Run) ............................................. 7-46 Figure 7.4.10-1 Shear Results in the Backwall and Stem ............................................................................. 7-47 Figure 7.4.10-2 Shear Results at cutoff locations ......................................................................................... 7-48 Figure 7.4.10-3 Shear Results in the Footing (Pile Footing Variation) .......................................................... 7-48 Figure 7.4.11-1 Design Details for Abutment Backwall ................................................................................. 7-50 Figure 7.4.11-2 Design Details for a Footing (Perpendicular Direction) ........................................................ 7-52 Figure 7.4.11-3 Design Details for Stem Location ......................................................................................... 7-54 Figure 7.4.12-1 Optimal Design Results (Backwall) ...................................................................................... 7-56 Figure 7.4.12-2 Optimal Design Results (Footing and Stem) ....................................................................... 7-57 Figure 7.5.1-1 Sample Unfactored Loads Report for Stem Location A ....................................................... 7-59 Figure 7.5.1-2 Sample Unfactored Loads Report for the Backwall ............................................................. 7-60 Figure 7.5.1-3 Sample Unfactored Loads Report for Stem Location A ....................................................... 7-61 Figure 7.5.1-4 Sample Showing Unfactored Loads for Pedestal ................................................................ 7-62 Figure 7.5.2-1 Load Factors Applied to the Backwall Loads ....................................................................... 7-64 Figure 7.5.2-2 Load Factors in the Footing ................................................................................................. 7-64 Figure 7.5.3-1 Intermediate Bearing Resistance ......................................................................................... 7-66 Figure 7.5.4-1 Moment Axial Interaction ..................................................................................................... 7-68 Figure 7.5.5-1 Heel Internal Moment ........................................................................................................... 7-70 Figure 7.5.5-2 Heel Shear from Internal Force Report ................................................................................ 7-71 Figure 7.5.5-3 Pile Loads from Internal Force Report ................................................................................. 7-71 Figure 7.5.6-1 Minimum Reinforcement Check Report ............................................................................... 7-73 Figure 7.7-1 Specification Check Warnings Page .................................................................................. 7-113 Figure 7.8-1 Specification Check Failures Page .................................................................................... 7-114 Figure 8.2-1 Example 1 Abutment Geometry ............................................................................................. 8-4 Figure 8.3-1 Example 2 Abutment Geometry ............................................................................................. 8-8 Figure 8.4-1 Example 3 Wall Geometry ................................................................................................... 8-12 Figure 8.5-1 Example 4 Abutment and Pedestal Geometry ..................................................................... 8-16 Figure 8.7-1 Example 6 Abutment Geometry ........................................................................................... 8-21 Figure 8.8-1 Example 7 Gravity Wall Geometry ....................................................................................... 8-25 Figure 8.9-1 Example 8 Abutment and Footing Geometry ....................................................................... 8-29 Figure 8.10-1 Example 9 Retaining Wall and Pedestal Geometry ............................................................. 8-33 Figure 8.11-1 Example 10 Gravity Wall Geometry ..................................................................................... 8-37 Figure 8.12-1 Example 11 Abutment Geometry ......................................................................................... 8-40 Figure 8.13-1 Example 12 Abutment Geometry ........................................................................................ 8-44 Figure 8.14-1 Example 13 Retaining Wall Geometry ................................................................................. 8-48 Figure 8.15-1 Example 14 Abutment Geometry ......................................................................................... 8-52

LRFD ABUTMENT AND RETAINING WALL ANALYSIS AND DESIGN
xi
LIST OF TABLES Table 3.2.1-1 Sample Footing Configurations ............................................................................................ 3-16 Table 3.3.2-1 User or Program Applied Loads ........................................................................................... 3-22 Table 3.3.2-2 Foundation Applied Loads ................................................................................................... 3-23 Table 3.3.2-3 Footing Applied Loads ......................................................................................................... 3-24 Table 3.3.2-4 Stem Applied Loads ............................................................................................................. 3-25 Table 3.3.2-5 Backwall Applied Loads (Final Stage Only) ......................................................................... 3-26 Table 3.3.4-1 Load Factor/Load Combination Table: Temporary Stage.................................................... 3-42 Table 3.3.4-2 Load Factor/Load Combination Table: Final Stage ............................................................. 3-43 Table 3.4.1.2.4-1 Unfactored Sliding Resistance for Clays.............................................................................. 3-52 Table 3.4.1.3.1-1 Elastic Distortion Settlement Factor – (From Table 4.4 of {FDNHBK}) ............................ 3-56 Table 3.4.1.3.1-2 Shape and Rigidity Factor – Cd ( From Table 4.1 of {FDNHBK}) ........................................ 3-56 Table 3.4.1.4.2-1 Soil Categories and Conditions ............................................................................................ 3-63 Table 3.5.2.3-1 Development Lengths (Idb) for Straight bars (A5.11.2.1) ................................................... 3-100 Table 3.7.3.1-1 Pile Patterns used in the Program ..................................................................................... 3-144 Table 5.2-1 Recommended Order of Commands ..................................................................................... 5-7 Table 5.2-2 Commands in Alphabetical Order .......................................................................................... 5-9 Table 7.1-1 Typical Units ........................................................................................................................... 7-3 Table 7.1-2 Sign Conventions ................................................................................................................... 7-4 Table 8.1-1 Example Problem Matrix ........................................................................................................ 8-2

LRFD ABUTMENT AND RETAINING WALL ANALYSIS AND DESIGN
xii
This page intentionally left blank

LRFD ABUTMENT AND RETAINING WALL ANALYSIS AND DESIGN
xiii
SUMMAR Y OF R EVISION S
SUMMARY OF JUNE 1999 REVISIONS - VERSION 1.2
This release of ABLRFD Version 1.2 contains the following error corrections and enhancements:
1. All dates have been modified to display a 4 digit year in the output file.
2. The default value for reinforcement grade in SI units has been changed to 420 MPa and the upper limit
for reinforcement grade has been changed to 450 MPa.
3. The program now uses soft metric reinforcement (the dimensions and data of US units bars converted to
SI units) as per PennDOT standard drawing BC-736M-1-A. The true SI units reinforcement that was
allowed in the previous version has been disabled.
The program has been converted to the Digital Visual Fortran Version 6.0B compiler as a Win32 application. It will
run on Windows 95, Windows 98 and Windows NT Version 4.0 operating systems. It will NOT run under the DOS
6.22 or below operating systems.

LRFD ABUTMENT AND RETAINING WALL ANALYSIS AND DESIGN
xiv
SUMMARY OF MARCH 2001 REVISIONS –VERSION 1.3
Since the release of ABLRFD Version 1.2 several revision requests and user requested enhancements have
been received. This release of ABLRFD Version 1.3 corrects the following known problems and provides
enhancements. The following list describes the changes made to the program.
ABLRFD Version 1.3 contains the following revisions:
1. Revised the moment calculation to properly take into account the effect from changing the “Bearing
Location Y” on the AT1 and AT2 commands.
2. Changed the ARE and SRA commands for the upper limit of Area per Unit Width parameter to 8500
mm2to be consistent with the US unit upper limit.
3. Revised the program so that foundations with battered piles or caissons can be run without entering the
strength and service lateral capacities.
4. Revised output messages, for a spread footing on rock run that fails to obtain a design, to clarify that
sliding is not checked when “N” is entered for the Sliding Resistance on the RCK command.
5. Revised to make the program to run when the user-input minimum footing width is exactly equal to the
sum of the user-input toe plus the user-input heel plus the stem width at the top of the footing.
6. Revised the default values of Toe End Cover and Heel End Cover to 2” (50mm) for the CVR command in
accordance with BD-631 and BD-632M.
7. Enhanced the program so input files do not have to reside in the same directory as the executable file.
8. Revised the program so it can run under Windows 2000. It should also run under Windows 9x, and
Windows NT.
9. Revised the program to use unfactored horizontal and vertical loads when computing the inclination
factors and use B’ and L’ when determining if the footing is continuous.
10. Revised the default for the Top Width parameter for the AWB and RWL commands to 1'-5.25" in
accordance with BD-624M.
11. Revised the program to work properly for parameter 4 of the EQL command.

LRFD ABUTMENT AND RETAINING WALL ANALYSIS AND DESIGN
xv
12. Clarified several error messages.
13. Several pages of the User's Manual have been revised including a new Chapter 9.
14. The parameter definition file is now named as ABLRFD.PD. Previously it was using the .PDF file
extension that would cause confusion with the Acrobat Adobe file.

LRFD ABUTMENT AND RETAINING WALL ANALYSIS AND DESIGN
xvi
SUMMARY OF SEPTEMBER 2003 REVISIONS - VERSION 1.4
Since the release of ABLRFD Version 1.3 several revision requests and user requested enhancements have
been received. This release of ABLRFD Version 1.4 contains the following revisions and enhancements.
1. A user input horizontal live load has been added to be applied on the Backwall (Request 10)
2. The output routines have been revamped to decrease program size and to allow easier modification. A
blank page that appears when no warnings are present at the end of the input echo has been removed
(Request 11).
3. The program does not stop with an error if the height of backfill is zero at the analysis point for a design
run (Request 27).
4. Two new user inputs have been added to the FTG command that allows the user to control the
increments that the program uses to increase the footing width and thickness. These can be used to
speed up the program for a design run (Request 29).
5. Significant modifications have been made as to how settlement is calculated for foundations on cohesive
soil and a "Detailed Consolidation Settlement" report has been added to the output. (Requests 30, 112).
6. A copyright notice has been added to the program output for use during beta testing (Request 31).
7. The pile selection process has been modified to utilize all possible pile patterns (Request 32).
8. The bearing capacity routine has been modified so that if at least one soil layer has no cohesion, but has
an internal angle of friction, the Ncq does not have to be entered on the SOI card (Request 34).
9. A user input horizontal wind load acting on the substructure has been added to the program (Request 35).
10. Additional compiler settings in Visual Fortran have been activated to trap divide by zero errors (Request
36).
11. The Average Load Factor is now being shown in the Foundations section of the Factored Load Table in
the output (Request 40).
12. The program now calculates the area of reinforcement correctly for backwalls (Request 42).
13. The water pressure part of the saturated backfill is now factored as a water load and it is no longer

LRFD ABUTMENT AND RETAINING WALL ANALYSIS AND DESIGN
xvii
considered as a component of the horizontal earth pressure. The horizontal earth pressure equations
have been modified to better model the application of the forces upon the structure (Request 53).
14. The program now checks the height difference between the front and back water levels to assure that it
complies with DM-4 3.11.3. Also, the program will verify that the back water level depth does not fall
below the bottom of soil layer(s) for spread footings, or bottom of footing for all foundation types on rock.
(Request 56).
15. The footing moment calculation for final surcharge has been corrected when temporary surcharge is
entered as zero. This applies to Live Load and Earth Surcharge (Request 71).
16. The minimum water differential between the front and back water levels for US units is now considered
as 3’-0” instead of 3’-3”. (Request 98)
17. The User Manual Chapter 5 description of the MRD Parameter 2 (Development Length Correction Factor)
was modified to exclude reference to epoxy coating. Epoxy coating is already considered for development
length calculations in the program and should not be entered by the user (Request 101).
18. The metric values for moist and saturated density of backfill have been updated to be in accordance with
DM-4 Section 3.11.5.5 (Request 108)
19. The bearing capacity routines now consistently use the absolute value of eccentricity when calculating
effective footing width. For the case of negative eccentricity, this prevents the effective footing width from
exceeding the actual footing width. (Request 111).
20. The program has been revised to use the height of stem measured to the top of footing when computing
stem forces and moments. Previously the height of stem measured to the bottom of footing was used.
For retaining walls the program reports results for both Temporary and Final Construction Stages.
Because the Temporary Construction Stage will not control for Retaining Walls, the lateral earth pressure
(EH) is computed only for the Final Construction Stage. This lateral earth pressure is then applied to the
Temporary Construction Stage (Request 113).
21. For retaining walls, the method of computing lateral earth pressure for broken backfills has been revised
to use a backfill soil with a internal friction angle φ = 33˚ and the broken backfill calculations have been
documented in the User's Manual. Input items have been added to the Materials (MAT) input command
for "Backfill Friction Angle", "Backfill Unit Weight Dry ", "Backfill Unit Weight Saturated ", and "Minimum
Equivalent Fluid Pressure". The Active Earth Pressure Coefficient (Ka) is now calculated separately for
Stem and Foundation earth pressure calculations, and a "Lateral Earth Pressure Intermediate Values"
report has been added to the output (Request 114).
LRFD ABUTMENT AND RETAINING WALL ANALYSIS AND DESIGN
xviii
22. A tolerance has been added to the front and back water height check to eliminate a false warning
message (Request 117).
23. The program has been revised to assign the proper soil category when computing Soil Bearing Capacity
for Category 3 (sand over clay) when the shear zone is less than the soil height. (Request 118)
This is a list of error corrections and or enhancements that are known but will be implemented in a later version:
1. A minimum value of tension will be allowed in caissons and piles. (Request 13)
2. The backfill material properties will become user input items. They are currently hard coded in as system
parameters (Request 43).
3. The J-bars protruding from footings in to the stem will be epoxy coated regardless of whether the user
specifies epoxy coated bars or not as per DM-4 Section 5.4.3.6P (Request 44).
4. The concrete density will become a user specified input item. The user will have to specify two concrete
densities. One will be used for calculating the Modulus of Elasticity, the other will be for load
considerations (Request 45).
5. The following revisions will be made to conform to DM-4 2000 specifications and standards.
a. Increase the maximum value for the Temp. ES on LDC card by 10 ft (3.05m). Update pp. 3-25
and 3-26 of manual to be consistent with nomenclature of 2000 DM-4 (Request 47).
b. Use equations for active earth pressure coefficient rather than table of values (Request 48, 49).
c. Revise elastic settlement for foundations on stiff cohesive soils - refers back to Eq. D10.6.2.2.3b-
1. Update p. 3-40 of manual to reflect the use of equation D10.6.2.2.3b-1 for the case of stiff
cohesive soils. Add from equation D10.6.2.2.3b-1 to input under SOI or CNS input commands
(Request 50)
d. Update manual (Section 3.5.2.9) and program to accommodate new equation for dv. If Eqn.
A5.7.3.3.1 is satisfied for the section, it is under reinforced or balanced and dv should be
computed when no prestressing is present (as in abutments) (Request 52).
6. The reinforcement modification factors will conform to AASHTO Article 5.11.2.1.3 and 5.11.2.4.2.
(Request 55, 82)

LRFD ABUTMENT AND RETAINING WALL ANALYSIS AND DESIGN
xix
7. Reinforcement design algorithm will be optimized and the design reinforcement output will be clarified
(Request 57, 99)
8. Increment width before thickness in footings for a design run to speed up execution. (Request 60)
9. The program will be revised to correct unit conversion errors for input items in the LAB, LRT, DLL, SLL,
and EQL commands. (Request 61)
10. The Wind Load Factor (WL) will be modified to 1.0 for both service and strength limit states. (Request 66)
11. A negative 2” eccentricity will be applied at the bearings for the minimum load case. Currently the positive
2” eccentricity is applied for both the maximum and minimum load cases (Request 69).
12. The program will calculate moment resistance based on Temperature and Shrinkage steel when a
negative moment is detected in the stem. (Request 80)
13. Pile Group Resistance will be shown as “kips(kN)/unit length” versus the current output which is
“resistance per unit width of structure”. (Request 83)
14. A new Friction Force Input item will be added. The friction force will be applied at the bearings.
(Request84)
15. The program will be revised to only apply the Development Length Reduction Factor once. Currently, the
factor located on the MRD card Parameter 2 is applied twice. To apply a correction factor correctly, the
user should enter the square root of the Correction Factor to be used. (Request 101)
16. The maximum shear in a footing on piles/caissons will be evaluated at various points of interest within
piles located in the toe/heel projection. Similarly the maximum shear in a spread footing will be evaluated
at incremental points along the toe/heel projection Currently the program assumes the critical shear
location at the back face of the stem or an effective depth away from the stem depending on the sign of
the moment. Until this revision is implemented, the user must perform hand computations to check the
maximum shear in the heel/toe projection. Refer to PennDOT e-Notification ABLRFD No. 1 for further
details. (Request 110)
17. The program will be revised, for piles, to check that the ratio of unfactored vertical load to horizontal load
is not be less than 3.5 (excluding seismic forces) as specified in Section 6.15.1P of DM-4 (Request 115).
LRFD ABUTMENT AND RETAINING WALL ANALYSIS AND DESIGN
xx
SUMMARY OF NOVEMBER 2004 REVISIONS - VERSION 1.4.0.3
Since the release of ABLRFD Version 1.4 several revision requests and user requested enhancements have
been received. This release of ABLRFD Version 1.4.0.3 contains the following revisions and enhancements.
1. The 1.4 top footing bar development length correction factor is now only applied to footing bars which
have 12 in (300 mm) of concrete beneath them. The user entered development length correction factor is
now only being applied once in the program. The cover for stem J-bar development length calculations is
now using the correct stem clear cover value (Request 55).
2. The program has been modified to use an optimized design process for all foundation types. The
optimization has decreased the amount of trial footing sizes required to find an economical design
(Request 60).
3. The Users Manual has been modified to reflect the proper units for loads applied to abutments and
retaining walls. The new unit conveys that the force is applied per unit of width (Request 61,128).
4. The program has been enhanced to compute shear in the heel at multiple locations to enable it to detect
the maximum shear in the heel and corresponding location for both spread and pile foundation types.
Also, the vertical component of the Lateral Earth Pressure is now considered a partial force being applied
to the side of the footing (Request 110).
5. The unfactored vertical force to horizontal force ratio check, from DM-4 Section 6.15.1P, has been added
to the program to check the Service loads on battered pile foundations. A warning will now be printed if
the ratio check is violated (Requests 115).
6. The User’s Manual has been modified to indicate that the Saturated Soil Density must be entered for all
soil types (Request 127).
7. The Temporary Stage Horizontal Earth Pressure calculations have been restored in the program for
retaining walls (Request 129).
8. The maximum bar diameter is now being correctly utilized for pile foundation analysis runs where
reinforcement is specified as area per width. This revision only affects crack control spacing calculations.
Also, the spacing during an area per width analysis run is now being calculated rather than using the
design width as the spacing for crack control calculations (Request 130).
9. A typographical error has been corrected for a Backfill related input check warning messages (Request
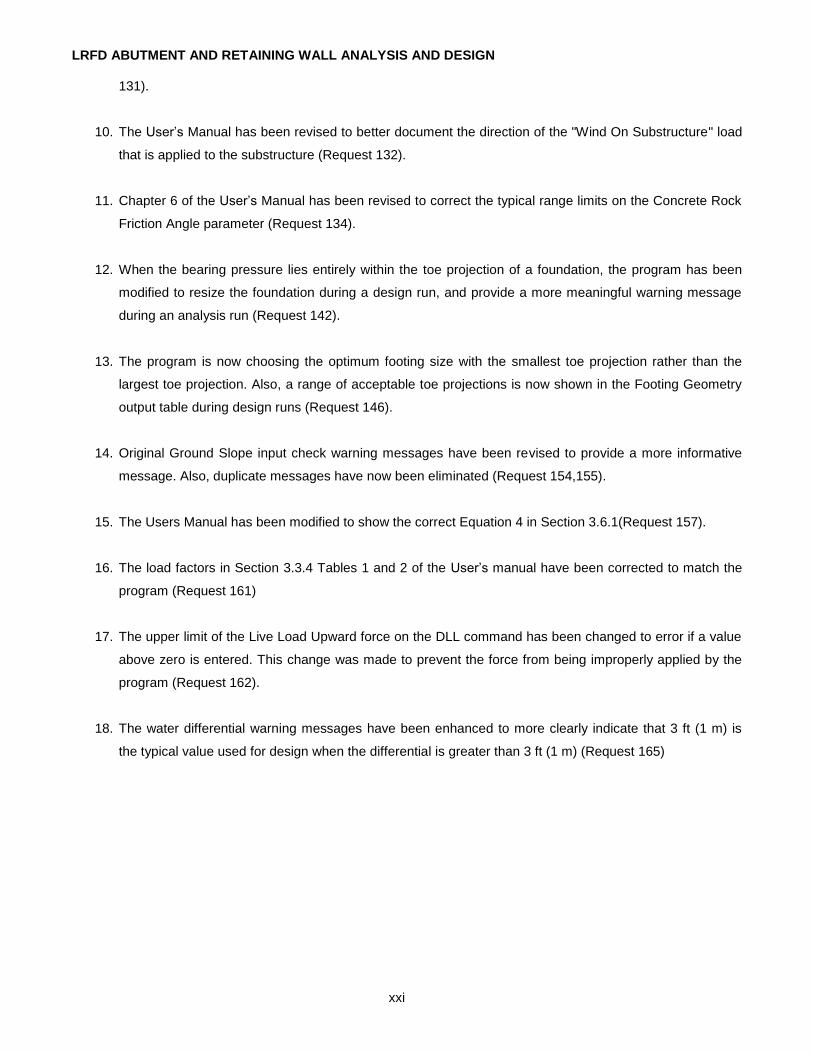
LRFD ABUTMENT AND RETAINING WALL ANALYSIS AND DESIGN
xxi
131).
10. The User’s Manual has been revised to better document the direction of the "Wind On Substructure" load
that is applied to the substructure (Request 132).
11. Chapter 6 of the User’s Manual has been revised to correct the typical range limits on the Concrete Rock
Friction Angle parameter (Request 134).
12. When the bearing pressure lies entirely within the toe projection of a foundation, the program has been
modified to resize the foundation during a design run, and provide a more meaningful warning message
during an analysis run (Request 142).
13. The program is now choosing the optimum footing size with the smallest toe projection rather than the
largest toe projection. Also, a range of acceptable toe projections is now shown in the Footing Geometry
output table during design runs (Request 146).
14. Original Ground Slope input check warning messages have been revised to provide a more informative
message. Also, duplicate messages have now been eliminated (Request 154,155).
15. The Users Manual has been modified to show the correct Equation 4 in Section 3.6.1(Request 157).
16. The load factors in Section 3.3.4 Tables 1 and 2 of the User’s manual have been corrected to match the
program (Request 161)
17. The upper limit of the Live Load Upward force on the DLL command has been changed to error if a value
above zero is entered. This change was made to prevent the force from being improperly applied by the
program (Request 162).
18. The water differential warning messages have been enhanced to more clearly indicate that 3 ft (1 m) is
the typical value used for design when the differential is greater than 3 ft (1 m) (Request 165)

LRFD ABUTMENT AND RETAINING WALL ANALYSIS AND DESIGN
xxii
SUMMARY OF APRIL 2006 REVISIONS - VERSION 1.4.0.4
Since the release of ABLRFD Version 1.4.0.3 several revision requests and user requested enhancements have
been received. This release of ABLRFD Version 1.4.0.4 contains the following revisions and enhancements.
1. The program was revised to allow the top of rock layer to be equal with the top of the footing. Previously
the program would halt with an error for this condition (Request 196).
2. The angle (sr) of the partial earth pressure applied to the heel (Pa1), used in the internal Footing EH-V
calculations from User Manual Section 3.3.2.5.2, was corrected for the Coulomb failure method.
Previously, for the Coulomb method the program would calculate a lesser Internal Footing EH-V force
due to the use of the incorrect angle which could lead to unconservative perpendicular heel
reinforcement. The Rankine method is unaffected by this revision (Request 196).
3. The program has been modified to use the correct Ka value for the Internal Footing EH-V force
calculation for the temporary stage. Previously the program would use the final Ka value for both the
temporary and final stage Internal Footing EH-V calculations (Request 202).

LRFD ABUTMENT AND RETAINING WALL ANALYSIS AND DESIGN
xxiii
SUMMARY OF JULY 2006 REVISIONS - VERSION 1.5.0.0
Since the release of ABLRFD Version 1.4.0.4 several revision requests and user requested enhancements have
been received. This release of ABLRFD Version 1.5.0.0 contains the following revisions and enhancements.
General Revisions
1. The program now supports long file names (Request 125).
2. The program has been enhanced so temporary files are now created on the local drive for network
compatibility (Request152).
3. The wind on live load and Extreme-I earthquake load factors have been modified to match DM-4
(Request 66,138,161,167).
4. The number of heel shear analysis points has been changed from a fixed number of 50 point to dynamic
amount based on the footing geometry in an effort to reduce the program processing time (Request 200)
Input Revisions
5. Two new inputs for concrete density have been added to the program to store a density for self weight
calculations and a second density for modulus of elasticity calculations (Request 45, 87).
6. A new friction force has been added to the program and is applied at the bearings (Request 84).
7. The Ductility, Redundancy and Operational Importance Limit State factors found on the LDC card have
been modified so the default values are 1.0 as per DM4-2000 Section 1.3 (Request 88).
Output Revisions
8. The pile pattern output table has been relocated in the output to follow the footing geometry table
(Request 86).
9. The footing volume units on the Pile Pattern output table have been changed to ft3 (m3) from piles/foot
(piles/m) (Request 168).
10. The program has been modified to use more descriptive headers in the output tables for Factored Forces
and Controlling Forces (Request 58).

LRFD ABUTMENT AND RETAINING WALL ANALYSIS AND DESIGN
xxiv
11. The program has been modified to output an intermediate bearing resistance values output table
(Request 77).
Reinforcement Revisions
12. The main stem bars entering the footing are now always considered as epoxy coated for design runs as
per DM-4 2000 Section 5.4.3.6P (Request 44).
13. The backwall calculations have been modified to work properly when reinforcement is entered as areas
per width (Request 79).
14. Temperature and Shrinkage reinforcement in the front face of the stem is now considered for moment
resistance when the applied moment in the stem is negative (Request 80).
15. An informative error message is now shown when a stem reinforcement bar cannot be developed within
the footing during a design run. Previously the program would crash. (Request 133,140).
16. The program has been modified so the minimum spacing check considers the clear spacing between
bars (Request 164).
17. The program has been modified so the user may specify an allowable minimum spacing and bar spacing
requirement (Request 186).
18. The #10 SI reinforcement bar is no longer considered during design runs (Request 187).
Development Length Revisions
19. The program has been enhanced to consider hooked bars for the perpendicular reinforcement in the
footing during a design run if selected by the user (Request 185a).
20. The program has been enhanced to show development length information for perpendicular footing bars
during analysis runs when a bar size and spacing are used. Previously analysis runs did not produce
output for development length information (Request 185b).
21. The program has been enhanced to allow users to specify if hooked reinforcement bars are used in the
perpendicular direction of a footing during analysis runs (Request 185c).
22. The 0.8 limitation on the Area of Steel Ratio factor used for development lengths has been removed
(Request 185d).

LRFD ABUTMENT AND RETAINING WALL ANALYSIS AND DESIGN
xxv
23. The program has been enhanced to display a status code when the design spacing has been modified to
meet development length requirements during a design run (Request 185g).
24. The program User’s Manual has been enhanced to provide a more detailed description of the
Development Length Correction factor on the MRD command for Chapter 5 (Request 185h).
25. The program has been modified to provide the area of steel required and the area of steel provided so the
user can more easily verify the development length calculations (Request 185i).
Settlement Revisions
26. The length of the footing used for the second soil layer has been stored and is now used for settlement
calculations (Request 72).
Footing Revisions
27. The footing volume units on the Lateral Loads / Pile Group Lateral Resistance Table have been changed
to indicate the force is per unit width (Request 83).
28. The correct angle is now used in calculation of the partial EH-V force for footings. The angle is now based
on the ratio of Kav over Kah rather than the backfill slope angle. Also the top of rock layer height can now
be set equal to the top of the footing. (Request 171).
Pile Revisions
29. The program has been modified so the minimum footing width for pile/caisson foundations is based on
the minimum layout dimensions along with the normal footing minimum dimensions (Request 136,195).
30. The program has been modified so the lateral capacity of pile/caisson input is only required for an all
vertical pile/caisson foundation (Request 177).
31. The program has been modified to correct an insufficient battered pile/caisson layout selection (Request
181)
32. The program has been modified to provide a warning message when over 50% of the piles/caissons in
the last row of an analysis run have been specified as battered (Request 182).

LRFD ABUTMENT AND RETAINING WALL ANALYSIS AND DESIGN
xxvi
Stem Cutoff Revisions
33. A note for the Reinforcement Design Details tables has been modified to clarify that the theoretical cutoff
is when every other bar is no longer required (Request 184b).
34. The Reinforcement Design Details tables has been modified to include a code to indicate which extension
length criteria controls (Request 184d).
35. The program has been modified to provide crack control information for each bars cutoff location
(Request184e).
36. The program was modified so factors shear resistance for the stem cutoff locations will now appear in the
Shear Results table and rather than the Reinforcement Design Details table (Request 184g).
User Manual Revisions
37. The variable notation used for active earth pressure coefficients have been changed to match notation
used in DM-4 (Request 47).
38. The default value for the Minimum Equivalent Fluid Pressure in Chapter 5 Section 5.17 has been
changed to match the default value the program is currently using (Request 174).
39. The example input files have been modified so warning messages will not appear in the program output.
Chapter 8 of the User’s manual is now formatted to match the Input Summary table from the output
(Request 175).
40. The program User’s Manual has been modified to correct a typographical error in Section 3.6.1 (Request
170).
41. The program User’s Manual has been modified to define delta as the rock/friction angle (Request 144).
42. The program User’s Manual has been modified to indicate that a minimum water differential is still
required when the water level is below the bottom of the footing for the Back Water Level input value on
the AT1, AT2, AWB, and RWL cards (Request 213).
Engineering Assistant Revisions
43. The Engineering Assistant figures have been modified to include descriptive captions (Request 158).

LRFD ABUTMENT AND RETAINING WALL ANALYSIS AND DESIGN
xxvii
44. The correct figures have been inserted for the LYD command in the Engineering Assistant configuration
files (Request 183).
Programming Revisions
45. The program has been converted to be a Windows DLL (Request 126).
46. The program has been modified so blank information is returned as output if the ABLRFD DLL is used
with the APRAS run option (Request 179).
47. The program has been converted to Intel Visual Fortran (Request 190).

LRFD ABUTMENT AND RETAINING WALL ANALYSIS AND DESIGN
xxviii
SUMMARY OF JANUARY 2007 REVISIONS - VERSION 1.5.0.1
Since the release of ABLRFD Version 1.5.0.0 several revision requests have been received. This release of
ABLRFD Version 1.5.0.1 contains the following revisions.
1. The heel shear at the face of the stem has been corrected to use the partial Vertical component of the
Horizontal Earth Pressure (EH-V) force. Previously, the program was incorrectly using the EH-V force
calculated from the full height of the abutment or wall (Request 233).
2. The program has been modified to prevent debug messages from being displayed while the program is
running (Request 231).
3. The program has been revised so 50 points of analysis are now used to determine the maximum shear
within the heel of the footing (Request 239).

LRFD ABUTMENT AND RETAINING WALL ANALYSIS AND DESIGN
xxix
SUMMARY OF APRIL 2007 REVISIONS - VERSION 1.6.0.0
Since the release of ABLRFD Version 1.5.0.1 several revision requests and user requested enhancements have
been received. This release of ABLRFD Version 1.6.0.0 contains the following revisions and enhancements.
Input Revisions
1. An input check has been added to the program for pile/caisson foundation analysis runs which ensures
that the parallel reinforcement cover entered on the CVR command will not cause interference with the
adjacent perpendicular reinforcement. (Request 238)
2. An input check has been added to the program for pile/caisson foundations which checks the distance
between the face of the pile and the footing edge to ensure the minimum distance from DM-4 is not
violated. The program will continue with a warning message for analysis runs and halt with an error
message for design runs. (Request 242)
Output Revisions
3. The program has been modified to correct an erroneously displayed status code in the crack control
tables. The “spacing less than minimum allowed” status code was being displayed at all times. (Request
225)
4. The program has been modified to indicate which stem locations have cracked in the “Crack Control –
Analysis/Design” output table. When this occurs the message provides instructions on how the user
should proceed. (Request 237)
5. The “Footing Stability On Pedestal” table has been revised to show all Service load cases and stages for
the pedestal sliding check. Previously only the maximum case final stage was checked. (Request 243)
Reinforcement Revisions
6. The crack control equations have been modified in the program to conform to DM-4. The exposure input
parameters on the MRD card have been changed from Normal to Class 1 and from Severe to Class 2 to
comply with DM-4. Input files created before v1.5.1.0 will require modification. (Request 199)
7. The program has been modified to calculate a spacing for use with serviceability checks when the
reinforcement is entered as an area per width. (Request 197)
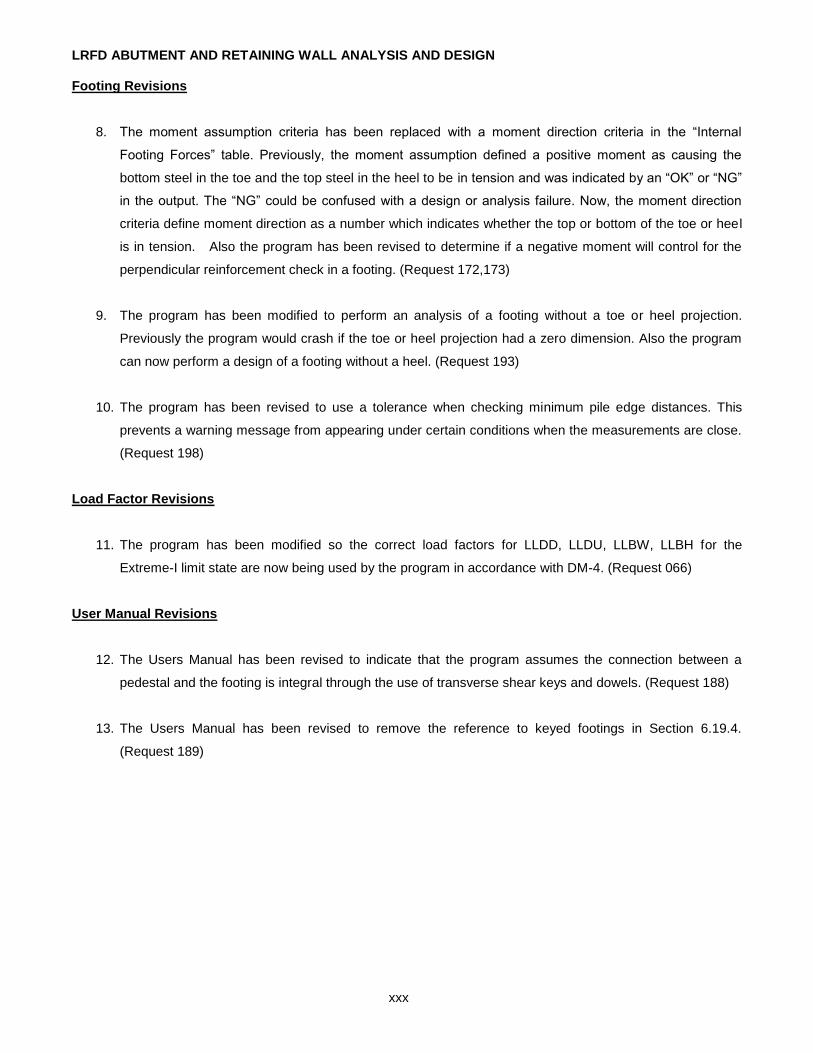
LRFD ABUTMENT AND RETAINING WALL ANALYSIS AND DESIGN
xxx
Footing Revisions
8. The moment assumption criteria has been replaced with a moment direction criteria in the “Internal
Footing Forces” table. Previously, the moment assumption defined a positive moment as causing the
bottom steel in the toe and the top steel in the heel to be in tension and was indicated by an “OK” or “NG”
in the output. The “NG” could be confused with a design or analysis failure. Now, the moment direction
criteria define moment direction as a number which indicates whether the top or bottom of the toe or heel
is in tension. Also the program has been revised to determine if a negative moment will control for the
perpendicular reinforcement check in a footing. (Request 172,173)
9. The program has been modified to perform an analysis of a footing without a toe or heel projection.
Previously the program would crash if the toe or heel projection had a zero dimension. Also the program
can now perform a design of a footing without a heel. (Request 193)
10. The program has been revised to use a tolerance when checking minimum pile edge distances. This
prevents a warning message from appearing under certain conditions when the measurements are close.
(Request 198)
Load Factor Revisions
11. The program has been modified so the correct load factors for LLDD, LLDU, LLBW, LLBH for the
Extreme-I limit state are now being used by the program in accordance with DM-4. (Request 066)
User Manual Revisions
12. The Users Manual has been revised to indicate that the program assumes the connection between a
pedestal and the footing is integral through the use of transverse shear keys and dowels. (Request 188)
13. The Users Manual has been revised to remove the reference to keyed footings in Section 6.19.4.
(Request 189)

LRFD ABUTMENT AND RETAINING WALL ANALYSIS AND DESIGN
xxxi
SUMMARY OF FEBRUARY 2008 REVISIONS - VERSION 1.7.0.0
Since the release of ABLRFD Version 1.6.0.0 several revision requests and user requested enhancements have
been received. This release of ABLRFD Version 1.7.0.0 contains the following revisions and enhancements.
Input Revisions
1. A new input has been added to the OUI command to show the Factored Forces and Moment Axial
Interaction Forces for each designed stem bar at the cutoff location. Previously the program would only
show these forces for the largest cutoff stem bar. (Request 184k)
2. The program has been revised to allow up to 512 characters to be entered on an input command line.
(Request 194)
3. The program has been revised so a warning message is shown if the Datum is set on the CTL command
for an analysis run. (Request 221)
4. New input items for the “Loads on Retaining Wall (LRT)” command have been added to the program. The
new loads allow for the addition of dead load due to a noise wall and wind on an external structure.
(Request 224)
5. The upper limit of the DC load on the LAB command has been increased to accommodate higher loads.
(Request 246)
6. The program has been revised to properly calculate the default minimum footing width when the toe
and/or heel projection inputs on the FTG command are left blank for pile/caisson design runs. Previously,
under certain conditions, the calculated minimum footing width could be incorrect which would cause the
program to stop with an error. (Request 262)
Output Revisions
7. The program has been revised so cutoff information will not be shown in the “Reinforcement Design
Details” Table for stem bars which cannot be cutoff. (Request 184j)
8. The “Reinforcement Summary for Design” output table for pedestal foundations has been restored in the
program. This output table was accidentally disabled starting with ABLRFD Version 1.4. (Request 191)
9. A Specification Check Warning and Specification Check Error Table have been added to the ABLRFD
program. (Request 222)

LRFD ABUTMENT AND RETAINING WALL ANALYSIS AND DESIGN
xxxii
10. The program has been enhanced so the eccentricity check will now be shown in the output tables as an
allowable eccentricity and an eccentricity performance ratio. (Request 223)
11. An error message relating to footing width in the output has been revised so the message will not be
truncated. (Request 226)
Stem Cutoff Changes
12. The program has been modified so the Type II Abutment will now set stem locations at quarter points
using the seat level as the top of stem. Previously the program would set Stem Location A at the stem
notch and then set the remaining stem locations at third points. (Request 184h)
13. The program has been enhanced to consider the weight of stem bars including cutoffs when determining
the most economical bar size and spacing during a design run. (Request 184i)
User Manual Changes
14. A typographical error has been fixed in User Manual Section 3.4.1.3.1 to correct a referenced DM-4
Article. (Request 234)
15. Documentation has been added to Users Manual to describe the Footing Stem Increment parameter on
the FTG Command. (Request 250)
16. The DM-4 and AASHTO Section 10 references in the ABLRFD program have been updated. (Request
261)

LRFD ABUTMENT AND RETAINING WALL ANALYSIS AND DESIGN
xxxiii
SUMMARY OF DECEMBER 2008 REVISIONS - VERSION 1.8.0.0
Since the release of ABLRFD Version 1.7.0.0 several revision requests and user requested enhancements have
been received. This release of ABLRFD Version 1.8.0.0 contains the following revisions and enhancements.
Input Revisions
1. The program has been revised to calculate a minimum cover value for parallel reinforcement in the
footing for design runs. The calculated value is compared to the user entered cover with the larger value
being shown in the “Input Summary” Table and used in all design calculations. Previously, the program
would permit the perpendicular and parallel bars to be in the same plane. The program was also
incorrectly displaying the default cover values for parallel reinforcement during a design run on the “Input
Summary” Table while continuing to use the user entered value for all deign calculations. (Requests 252,
268)
2. The program has been revised so stem batter values can be left blank or set to zero without causing the
program to halt processing. Previously, entering a zero for a batter component would cause the program
to crash. (Request 230)
3. The program has been revised to allow for the design of a substructure without a toe projection.
Previously the program would only allow a design with a 1 foot minimum toe projection. (Requests 100,
266)
4. The Y distance to Wind Load on External Structure parameter on the LRT command has been revised so
the program upper limit now matches the value documented in the Users Manual. (Request 279)
5. The upper limit of the Downward Live Load parameter on the DLL command has been increased to 10
kip/ft (150 kN/m). (Request 280)
Output Revisions
6. The Footing Flexure table has been revised to indicate which minimum reinforcement condition controlled
for a design run if minimum reinforcement controls. (Request 059)
7. The program has been revised to eliminate the soft classification for rock foundations and to now report
the maximum bearing pressures for all rock foundations. Previously, the program would report uniform
bearing pressures if the Modulus of Elasticity of the Concrete exceeded the Modulus of Elasticity of the
rock. (Request 109)

LRFD ABUTMENT AND RETAINING WALL ANALYSIS AND DESIGN
xxxiv
8. The headings for the “Specification Check” table have been revised to correctly reflect with verbiage
when errors or warnings have been found. Previously, the program had fixed headers which would cause
confusion with verbiage not matching the presence or lack of errors/warnings. (Request 271)
Loading Revisions
9. A new load has been added to the program to account for the weight of an Architectural Treatment placed
on the front face of an abutment or wall. (Request 253)
Serviceability Revisions
10. The program has been revised to properly indicate when a section is cracked on the “Crack Control” table
for analysis runs. Previously, under certain circumstances, the program would indicate a section was not
cracked even when an actual stress was being reported. (Request 247)
11. The program has been revised to prevent an erroneous status flag for allowable spacing from appearing
in the “Crack Control” table for analysis runs when a stem section has cracked. Previously, under certain
conditions, the program would report a spacing failure even when the actual spacing was less than the
allowable. (Request 273)
General Changes
12. The program has been modified so the effective footing width cannot be less than zero. Previously, for
certain input files, the effective footing width could become less than zero leading to a program crash.
(Request 248)
13. The program has been modified to print to the screen the range of B’ values for a footing width which
causes an L’ over B’ < 1 warning during a design run. This change greatly reduced the amount of warning
messages printed to the screen. Previously, the program would print one line to the screen for each
iteration of a footing width design (Request 263)
14. The program has been modified to allow a zero length toe/heel projection in the water force calculation
routine. Previously, if a zero projection was encountered, the program would output a cryptic warning
message. (Request 264)

LRFD ABUTMENT AND RETAINING WALL ANALYSIS AND DESIGN
xxxv
User Manual Changes
15. Chapter 3 of the User Manual has been modified so all effective consolidation stresses are annotated
with a prime character. (Request 123)
16. The contact information in Chapter 9 has been updated to reflect the new organizational name changes
at PennDOT. (Request 270)

LRFD ABUTMENT AND RETAINING WALL ANALYSIS AND DESIGN
xxxvi
SUMMARY OF FEBRUARY 2010 REVISIONS - VERSION 1.9.0.0
Since the release of ABLRFD Version 1.8.0.0 several revision requests and user requested enhancements have
been received. This release of ABLRFD Version 1.9.0.0 contains the following revisions and enhancements.
Input Revisions
1. An input check has been added to the program to check if the bottom of the footing is located above the
top of the rock layer. If it is, then an error message is printed in the output to provide a recommendation
for how this issue can be corrected. Previously, a cryptic error message was displayed indicating a
negative embedment depth. (Request 254)
2. An input check has been added to the program to ensure that parallel reinforcement information has not
been added for a spread footing analysis run. Previously, the program would provide a cryptic warning
message and terminate. (Request 276)
Output Revisions
3. The program has been revised to now list the title and page number in the Specification Check Warning
and Error tables for each occurrence of a warning found in the Moment Axial Interaction table. Previously,
the program would only display the title and page number for the last stem location even when no
problem occurred at the location. (Request 277)
4. The program has been enhanced to generate a PDF file for each output file. When possible, the PDF file
contains bookmarks for easier navigation of the output. The PDF file also makes it easier to print and
paginate the program output. (Request 284)
5. The program has been modified to pass a crack control warning for analysis runs to the specification
check output when applicable. Previously, the program was not reporting this warning. (Request 292)
Loading Revisions
6. The Wind on Substructure force has been revised to distribute the user entered force vertically along the
face of the wind area. For stem locations, the program will determine the applicable wind area and use
the magnitude of the calculated distributed force to determine the wind load. The Wind on Substructure
force is now applied for both the Temporary and Final stages and can be applied in both the positive or
negative direction. Previously, the program would incorrectly calculate the Wind on Substructure moment
for the Stem Locations. (Request 286)

LRFD ABUTMENT AND RETAINING WALL ANALYSIS AND DESIGN
xxxvii
Settlement Revisions
7. The program has been revised to prevent maximizing the H/Beff ratio when calculating the Elastic
Settlement Factor in Figure 3.4.1.3.1-1 for a Strong over Weak Layer soil condition. Previously, the
program would maximize this ratio which could lead to large calculated settlement values for Strong over
Weak Layer soil conditions (Request 287)
Serviceability Revisions
8. The program has been modified to account for 1 inch of foundation unevenness at the bottom of the
footing when calculating the crack control spacing. Previously the program would use the entire cover
dimension when calculating the crack control spacing. (Request 291)
General Changes
9. The ABLRFD program has been revised to no longer support SI unit input files. This is based on a
decision by AASHTO Subcommittee on Bridges and Structures to no longer publish updates to the SI unit
version 2007 AASHTO LRFD Bridge Design Specifications. (Request 290)
Pile Foundation Changes
10. The pile pattern design algorithm was investigated to determine why changing the percent battered piles
in the last row for a design run would cause the program to change from a 2 row pattern to a 4 row
pattern. It was determined that including battered piles in the last row increased the calculated pile
spacing in row 1 which caused the pile pattern to fail for punching shear and meant the program rejected
the pattern. A future revision to ABLRFD will attempt to reduce the pile spacing in row 1 when a
reinforcement failure is detected in a effort to generate a good design for the pattern. The workaround is
to make two design runs, one with 0% battered piles in the last row, and one with 50% battered piles in
the last row, and to use the design with the least number of pile rows. (Request 288)
11. The program has been revised to now resize a pile foundation design if the ratio of the unfactored vertical
and horizontal service loads is less than 3.5. Previously, the program would only provide an output
message that the criteria had failed without changing the foundation design. Also revised program to
perform ratio check for caisson foundations during analysis runs. (Request 115)

LRFD ABUTMENT AND RETAINING WALL ANALYSIS AND DESIGN
xxxviii
SUMMARY OF MARCH 2011 REVISIONS - VERSION 1.10.0.0
Since the release of ABLRFD Version 1.9.0.0 several revision requests and user requested enhancements have
been received. This release of ABLRFD Version 1.10.0.0 contains the following revisions and enhancements.
Input Revisions
1. An input check has been added to the program to check if the back water level is above the backfill at the
stem/backfill interface. Previously, a cryptic error message was displayed stating that the back water level
was above exposed stem. (Request 296)
Output Revisions
2. The program output has been revised to properly indicate the absence of a toe or heel during an analysis
run and to prevent specification check flags from being set erroneously. (Request 267)
Loading Revisions
3. The program has been revised to apply a 2 inch eccentricity towards the heel for vertical bearing loads
when designing or analyzing the stem for the minimum load case. Previously, the program would always
apply a 2 inch eccentricity towards the toe for vertical bearing loads for both the maximum and minimum
load case when designing or analyzing the stem. The eccentricity towards the toe is still applied for the
maximum load case (Request 69)
Pile Foundation Changes
4. The pile pattern design algorithm has been revised to now reanalyze a pile pattern at a reduced row
spacing if the pattern was found to fail due to punching shear. Previously, the program would just
increment to the next pile pattern which cause large increases in the number of pile rows when the Last
Row % Batter parameter was increased on the LYD command. (Request 288)
User Manual Changes
5. The Elastic Modulus parameter on the RCK command has been renamed to Intact Elastic Modulus for
consistency with DM-4 and for clarification of which elastic modulus to enter in the program. (Request
306)

LRFD ABUTMENT AND RETAINING WALL ANALYSIS AND DESIGN
xxxix
6. The description of the Soil Level at Toe parameter on the SOI command in Chapter 5 has been expanded
to include a description of how the program uses the input value. (Request 307)

LRFD ABUTMENT AND RETAINING WALL ANALYSIS AND DESIGN
xl
SUMMARY OF AUGUST 2012 REVISIONS - VERSION 1.11.0.0
Since the release of ABLRFD Version 1.10.0.0 several revision requests and user requested enhancements have
been received. This release of ABLRFD Version 1.11.0.0 contains the following revisions and enhancements.
General
1. The ABLRFD program has been updated to the AASHTO LRFD Bridge Design Specifications Fifth
Edition 2010 and the 2012 PennDOT Design Manual Part 4.
2. The program has been revised to prevent a design run, with all vertical pile/caisson foundation, from
getting stuck in an infinite loop when punching shear controls during the footing design. (Request 345)
Input Revisions
3. Addition information has been added to the existing error message when the layout of piles is outside the
footing width. The new information includes the footing width, the distance from the front of the footing to
the first pile row and the distance from the last pile row to the end of the footing. Previously, a cryptic error
message was displayed stating layout of piles was outside the footing width with no additional
information. (Requests 297)
4. The Number of Pile Rows parameter on the LYA command has been revised so a minimum 2 rows of
piles are required. Previously, the program would allow for entry of 1 row of piles but would result in
errors. (Request 311)
5. The input check for back water level above the backfill has been revised so the check is not performed
when the back water level is left to default. Previously, the program would perform this check when the
backwater level was left to default and would stop with an error. (Request 314)
Loading Revisions
6. The Horizontal Earth Pressure load (EH) has been revised to apply the resultant at 1/3 times height of the
soil. Previously, the program would apply the resultant at 0.4 times the height of the soil. (Request 321)
7. The program has been revised to issue a warning when ETA factors other than 1.0 are entered.
(Request 324)
8. The program has been revised to no longer apply Live Load Surcharge in the Extreme I limit state.
(Request 327)

LRFD ABUTMENT AND RETAINING WALL ANALYSIS AND DESIGN
xli
Backwall Revisions
9. The program has been revised to correctly calculate the backwall section depth when the paving notch
height extends below the mid-height backwall location. (Request 341)
Flexural Revisions
10. The Flexural Phi factor has been revised to comply with the 2010 AASHTO LRFD Specifications. The phi
factor now varies linearly based on the strain in the section. Also, the moment axial interaction envelope
has been revised to include the tension controlled strain point and the point based on 0.1Agrossf’c. has
been removed.(Request 319)
11. The shrinkage and temperature reinforcement calculations for Serviceability have been revised to comply
with new shrinkage and temperature reinforcement specifications In the 2012 DM-4 Article 5.10.8 and the
2010 AASHTO LRFD Specifications. (Request 320)
Spread Foundation Revisions
12. The elastic settlement of foundations on rock has been revised to meet the specifications in the 2010
AASHTO Article 10.4.6.5. The program will now calculate the elastic settlement based on either the Rock
Mass Rating (RMR) or the Elastic Modulus Reduction Factor (Em/Ei) and Joint condition. Previously the
program would only use the Rock Quality Designation (RQD) with an assumed joint condition for elastic
settlement. (Request 322)
NOTE: this change requires that any previously existing input files using the Rock Data Command be
updated because of additional input now required.
Development Length Revisions
13. The program has been revised to remove the bar cover and spacing development length extension factor
to be compliant with the 2010 AASHTO Article 5.11.2.1.2. (Request 325)
Program Source Revisions
14. The ABLRFD program has been updated to the Intel Fortran Composer XE 2011 Compiler. (Request
312)
User Manual Revisions

LRFD ABUTMENT AND RETAINING WALL ANALYSIS AND DESIGN
xlii
15. The equation for cohesion used in the calculation of sliding resistance on clayey-sandy soils, per 2012
DM-4 Article 10.6.3.4, has been revised to correct for the units. (Request 326)
16. The Load Factor Table 3.3.4.2-2 in Chapter 3 has been revised to indicate that the Earthquake and
Collision Force loads are applied for both the minimum and maximum cases. Previously, the table
indicated that the forces were only applied for the maximum case. (Request 328)
17. The detailed description in Section 6.12.4, for the PIL command Sevice Axial Capacity parameter, has
been revised to clarify the input for piles supported on bedrock. (Request 348)
Engineering Assistant Revisions
18. The Wind on Substructure parameter on the Loads on Abutment card in Engineering Assistant has been
revised to allow for entry of negative values. (Request 302)
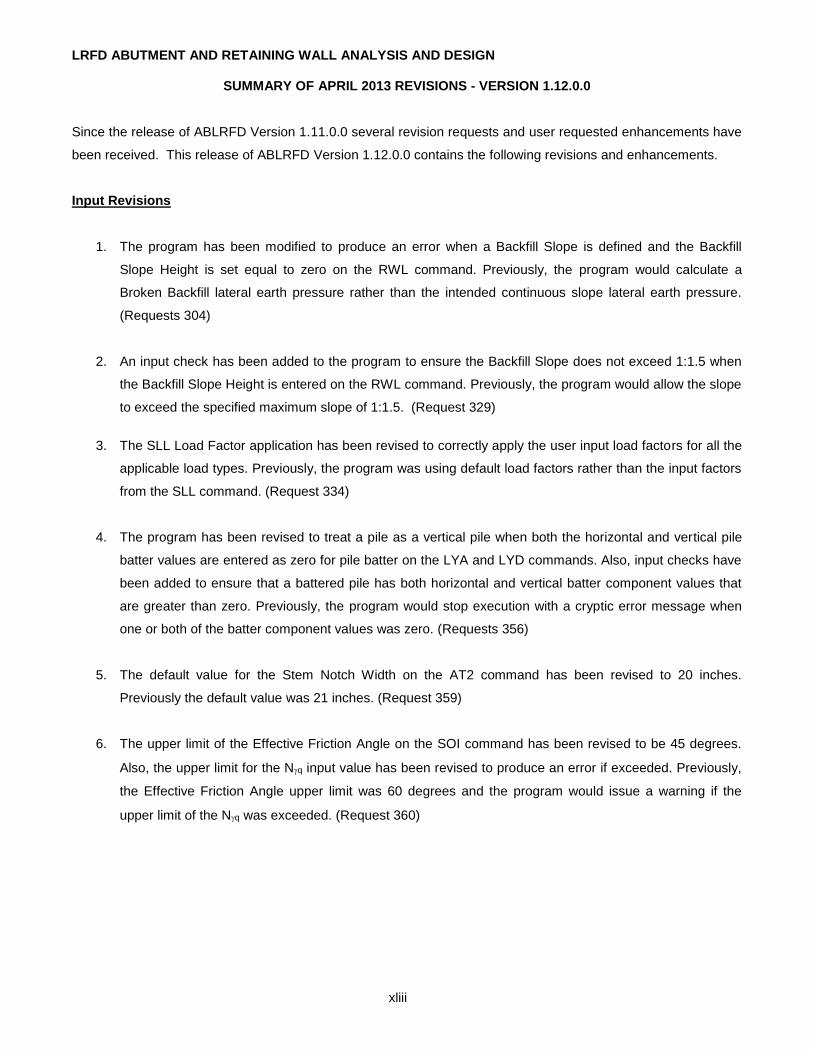
LRFD ABUTMENT AND RETAINING WALL ANALYSIS AND DESIGN
xliii
SUMMARY OF APRIL 2013 REVISIONS - VERSION 1.12.0.0
Since the release of ABLRFD Version 1.11.0.0 several revision requests and user requested enhancements have
been received. This release of ABLRFD Version 1.12.0.0 contains the following revisions and enhancements.
Input Revisions
1. The program has been modified to produce an error when a Backfill Slope is defined and the Backfill
Slope Height is set equal to zero on the RWL command. Previously, the program would calculate a
Broken Backfill lateral earth pressure rather than the intended continuous slope lateral earth pressure.
(Requests 304)
2. An input check has been added to the program to ensure the Backfill Slope does not exceed 1:1.5 when
the Backfill Slope Height is entered on the RWL command. Previously, the program would allow the slope
to exceed the specified maximum slope of 1:1.5. (Request 329)
3. The SLL Load Factor application has been revised to correctly apply the user input load factors for all the
applicable load types. Previously, the program was using default load factors rather than the input factors
from the SLL command. (Request 334)
4. The program has been revised to treat a pile as a vertical pile when both the horizontal and vertical pile
batter values are entered as zero for pile batter on the LYA and LYD commands. Also, input checks have
been added to ensure that a battered pile has both horizontal and vertical batter component values that
are greater than zero. Previously, the program would stop execution with a cryptic error message when
one or both of the batter component values was zero. (Requests 356)
5. The default value for the Stem Notch Width on the AT2 command has been revised to 20 inches.
Previously the default value was 21 inches. (Request 359)
6. The upper limit of the Effective Friction Angle on the SOI command has been revised to be 45 degrees.
Also, the upper limit for the Nq input value has been revised to produce an error if exceeded. Previously,
the Effective Friction Angle upper limit was 60 degrees and the program would issue a warning if the
upper limit of the Nq was exceeded. (Request 360)
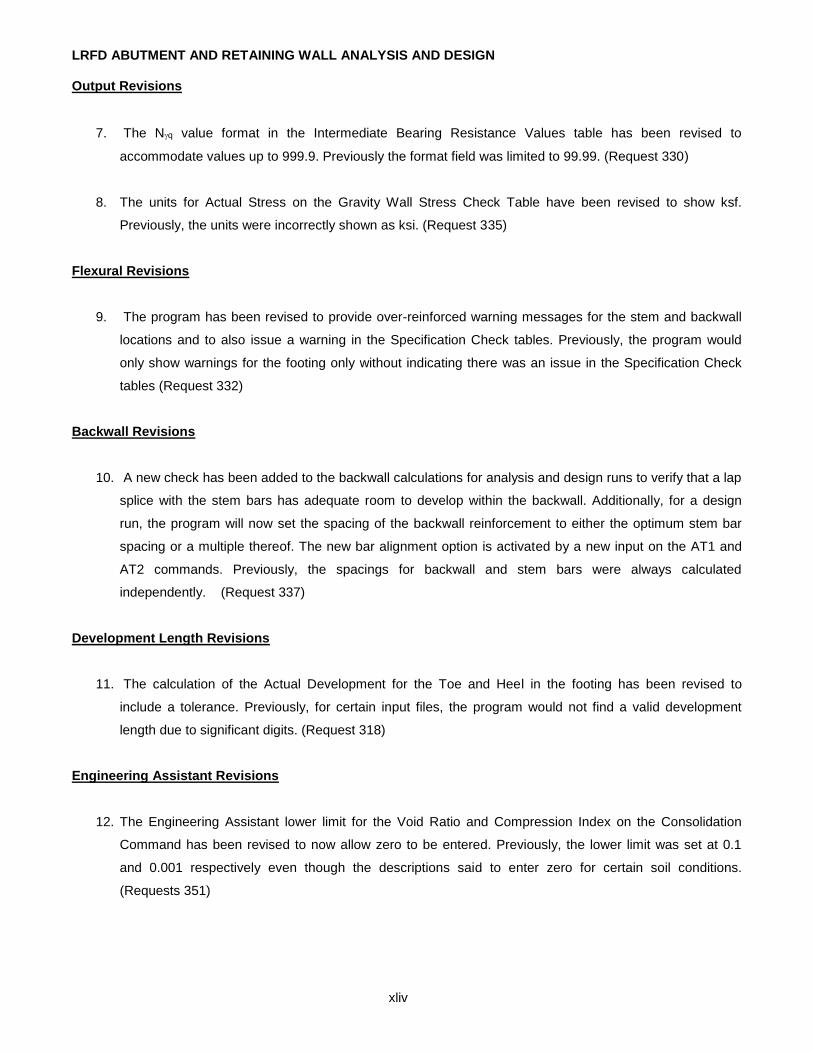
LRFD ABUTMENT AND RETAINING WALL ANALYSIS AND DESIGN
xliv
Output Revisions
7. The Nq value format in the Intermediate Bearing Resistance Values table has been revised to
accommodate values up to 999.9. Previously the format field was limited to 99.99. (Request 330)
8. The units for Actual Stress on the Gravity Wall Stress Check Table have been revised to show ksf.
Previously, the units were incorrectly shown as ksi. (Request 335)
Flexural Revisions
9. The program has been revised to provide over-reinforced warning messages for the stem and backwall
locations and to also issue a warning in the Specification Check tables. Previously, the program would
only show warnings for the footing only without indicating there was an issue in the Specification Check
tables (Request 332)
Backwall Revisions
10. A new check has been added to the backwall calculations for analysis and design runs to verify that a lap
splice with the stem bars has adequate room to develop within the backwall. Additionally, for a design
run, the program will now set the spacing of the backwall reinforcement to either the optimum stem bar
spacing or a multiple thereof. The new bar alignment option is activated by a new input on the AT1 and
AT2 commands. Previously, the spacings for backwall and stem bars were always calculated
independently. (Request 337)
Development Length Revisions
11. The calculation of the Actual Development for the Toe and Heel in the footing has been revised to
include a tolerance. Previously, for certain input files, the program would not find a valid development
length due to significant digits. (Request 318)
Engineering Assistant Revisions
12. The Engineering Assistant lower limit for the Void Ratio and Compression Index on the Consolidation
Command has been revised to now allow zero to be entered. Previously, the lower limit was set at 0.1
and 0.001 respectively even though the descriptions said to enter zero for certain soil conditions.
(Requests 351)

LRFD ABUTMENT AND RETAINING WALL ANALYSIS AND DESIGN
xlv
Pile Revisions
13. The limit on the ratio specified in DM-4 Section 6.15.1 of vertical load to horizontal load at the service limit
state for pile foundations has been revised from 3.5 to 2.4. (Request 352)
14. The minimum pile spacing for H piles has been revised to be 2.0 times the diagonal dimension of the pile.
Previously, the program would calculate the minimum spacing of H piles as 2.5 times the depth or width
of the pile cross-section. (Request 357)

LRFD ABUTMENT AND RETAINING WALL ANALYSIS AND DESIGN
xlvi
SUMMARY OF JANUARY 2014 REVISIONS - VERSION 1.13.0.0
Since the release of ABLRFD Version 1.12.0.0 several revision requests and user requested enhancements have
been received. This release of ABLRFD Version 1.13.0.0 contains the following revisions and enhancements.
Input Revisions
1. The program has been modified to produce a warning when the rear face batter slope of abutments and
retaining walls is greater than a 1:3 ratio of horizontal to vertical ratio. (Requests 317)
2. The program has been revised to exit with error messages when errors are found upon reading the input.
Previously, for certain input files the program would read in the input with errors and crash when the input
checks are performed. (Request 347)
3. A new parameter was added to the SOI command to either include or omit the inclination factors when
calculating the bearing resistance for soil. Previously, the program would always apply the inclination
factors. (Request 361)
Output Revisions
4. The Crack Control – Analysis output table has been modified for footings to display the allowable crack
control spacing for bars when the minimum bar spacing has been violated. Previously, the program would
always display an allowable crack control spacing of zero when the minimum bar spacing was violated for
footings. (Request 339)
5. The headings on the Footing Stability tables have been revised to indicate that the loads are factored.
Previously, the table headings did not explicitly state whether loads were factored on not. (Request 340)
6. The Moment Axial Interaction tables have been revised to now provide the section thickness and the
effective depth at each design location. Previously, the program did not explicitly display the section
thickness and the effective depth for each design location. (Request 349)
7. The Factored Forces and Moment Axial Interaction output tables with Stem Cuttoff Location information
have been revised to prevent empty table headers with no numbers from appearing for bars that cannot
be cutoff. Previously, the program would print an empty table for those bars that could not be cutoff.
(Request 358)
Loading Revisions
8. For certain input files with a short stem height, the height of the Partial EH-V force triangle would

LRFD ABUTMENT AND RETAINING WALL ANALYSIS AND DESIGN
xlvii
sometimes be taller than the stem height leading to a cryptic error message. The program has been
corrected so that when this condition occurs, the height of the Partial EH-V force triangle is set equal to
the stem height. (Request 301)
9. Approach Slab Loads have been added as a user input to the program in accordance with BD-628M,
Sheet 2, Note 14. When the Approach Slab Loads are entered using the new ASL command, the
approach slab is modeled as a simple span between the abutment and the sleeper slab, and the Earth
Surcharge and Live Load Surcharge loads are not included for the Final stage. In order to implement
Note 14, two separate runs of ABLRFD are required. One run with the ASL command and one without the
ASL command. Previously, approach slab loads could only be accounted for through the Earth and Live
Load Surcharge input parameters. (Request 303)
Settlement Revisions
10. A check has been added to the settlement routines to prevent a divide by zero error when calculating
Secondary Consolidation. Previously, the program would crash when the divide by zero was
encountered. (Request 350)
Crack Control Revisions
11. When performing the crack control calculations for the bottom footing reinforcement, the calculation of the
dc value has been revised to prevent the program from subtracting the 1 inch foundation unevenness
thickness more than once. Previously, the program could potentially subtract more than 1 inch of
foundation unevenness for the bottom footing reinforcement. (Request 378)
User Manual Revisions
12. The description of Concrete/Rock Friction Angle parameter on the RCK command has been revised to
provide more complete information and guidance on how the parameter should be set. (Requests 342)
13. The User Manual Section 3.6 has been revised to clarify how the section thickness at design locations
within the stem are calculated for a Type II abutment. (Request 353)
Engineering Assistant Revisions
14. The lower limits of the Void Ratio and Compression Index on the CNS command have been changed to
0.0. Previously, the lower limits were set at 0.1 for the Void Ratio and 0.001 for the Compression Index.
(Requests 351)

LRFD ABUTMENT AND RETAINING WALL ANALYSIS AND DESIGN
xlviii
SUMMARY OF MAY 2014 REVISIONS - VERSION 1.13.0.1
Since the release of ABLRFD Version 1.13.0.0 several revision requests and user requested enhancements have
been received. This release of ABLRFD Version 1.13.0.1 contains the following revisions and enhancements.
General Program Revisions
1. The method of calling the engineering program DLL from the Engineering Assistant has been changed for
compatibility with EngAsst v2.5.0.0 which uses Microsoft's .NET Framework, version 4.5. Because of this,
ABLRFD will no longer work with EngAsst v2.4.0.6 or v2.4.0.9 unless the EngAsst “Edit / Run EXE –
Command Window” option is selected. ABLRFD will no longer work with EngAsst v2.4.0.0 and earlier.
(Request 379)
2. The ABLRFD program has been updated to compile with Intel Fortran XE 2013 SP1 Update 1 using
Visual Studio 2012 Update 4. (Request 367)
Input Revisions
3. The program has been revised to correctly apply a default dry unit weight for the second soil layer on the
SOI command when the user has not entered a value. Previously, the program would apply the default
when the user had already provided a value. (Requests 380)
4. The program has been revised to issue a warning message if one the of the back face batter components
on the AT2,AWB or RWL command is either set to zero or left blank when the other component has a
value greater than zero. Previously, there would be no warning message for this condition. (Request
381)
User Manual Revisions
5. The User Manual Section 6.12.4 has been revised to clarify how the service axial capacity value is
determined. (Request 365)

LRFD ABUTMENT AND RETAINING WALL ANALYSIS AND DESIGN
xlix
SUMMARY OF APRIL 2015 REVISIONS - VERSION 1.14.0.0
Since the release of ABLRFD Version 1.13.0.1 several revision requests and user requested enhancements have
been received. This release of ABLRFD Version 1.14.0.0 contains the following revisions and enhancements.
Input Revisions
1. For Analysis runs the Footing Datum parameter on the CTL command should be left blank. But if it was
entered the program would print a warning that it should be left blank and then it would proceed to use
the input value causing confusion. To resolve this, the program has been revised to internally set the
footing datum to top of footing for Analysis runs when the Footing Datum parameter on the CTL
command is entered by the user. (Request 369)
Output Revisions
2. For pedestal footings a new footnote has been added to the Flexural Strength output table for Design and
Analysis runs, and to the Reinforcement Design Details / Footing output for Analysis runs, stating that the
program does not analyze perpendicular direction reinforcement for pedestal footings because the
program assumes the footing and pedestal are made integral using transverse shear keys and dowels
per DM-4 10.6.5.2P. (Request 192)
3. The page layout of the output file has been enhanced to allow for more characters per page width and
more lines per page in the PDF output file. The new layout has 102 characters per page width and 83
lines per page. The Table of Contents now includes a second level which is converted to a second level
of bookmarks to assist in navigating the PDF file. (Request 388)
4. The FACTORED FORCES output table has been revised to show the Vertical over Horizontal Load Ratio
for the Service limit states for pile and caisson foundation types. Previously, the program would only
output a flag and footnote during an analysis run if the ratio check was violated. (Request 392)
Loading Revisions
5. The program has been revised to prevent a divide by zero error when the calculated area for the Wind on
Substructure is less than or equal to zero. Previously, the program would populate portions of the output
reports with a Not a Number (NaN) output value and produce incorrect results. This issue was rare and
would only occur for certain input files. (Request 383)
Stem Revisions

LRFD ABUTMENT AND RETAINING WALL ANALYSIS AND DESIGN
l
6. The program has been revised to correctly consider the capacity of the minimum temperature and
shrinkage reinforcement in the front face of a stem if a negative moment is encountered during a design
run. Previously, the program would attempt to compare the positive calculated capacity for the
temperature and shrinkage reinforcement to the negative applied load resulting in errors. (Request 362)
7. A new geometry check has been added to the design loop to prevent the backwall for a Type 2 Abutment
from overhanging the end of the heel when the toe projection is being increased. Previously, the program
would stop with an error indicating the backwall overhangs the end of the heel. (Request 373)
8. The calculation of the Stem Thickness at Location D during the design loop has been revised to be
consistent with the calculations performed in the stem routines. Previously, the discrepancy in the
calculation would sometimes cause the program to halt with a geometry check error. (Request 374)
Bearing Resistance and Stability Revisions
9. The equations and documentation for bearing resistance of spread footings on two sand layers, Soil
Condition 6 and 7, have been revised to be consistent with the methodology in the Principles of
Geotechnical Engineering, Third Edition by Braja Das. Previously, the equations and documentation were
inconsistent with methodology in the Das textbook resulting in an overestimation of the bearing
resistance. This request fixes the issues documented in e-Notification 018. (Request 385)
10. The bearing resistance phi factor for the Service Limit states has been revised to be 1.0. Previously, the
program would apply the same bearing resistance phi factor to all limit states. (Request 371)
11. The program has been revised to increase the allowable kern for stability checks for the Extreme Limit
state to 2/3rds the footings base width per AASHTO 10.6.4.2 and 11.6.5. This revision affects spread
footings and pedestal footings. (Request 375)
12. The allowable kern for the Final Stage stability checks has been revised for all limit states, except the
Extreme Limit State, to be in accordance with 2014 AASHTO 11.6.3.3. This revision affects spread
footings and pedestal footings. (Request 391)
Pile/Caisson Revisions
13. The program has been revised to no longer consider the Service Limit State when checking the Factored
Axial Resistance and Factored Lateral Resistance for pile/caisson foundation design and analysis runs.
Previously, the program would resize a pile/caisson pattern or footing size if the Factored Axial
Resistance or the Factored Lateral Resistance was insufficient for the Service Limit State. (Request 366)

LRFD ABUTMENT AND RETAINING WALL ANALYSIS AND DESIGN
li
14. The pile/caisson design loop has been revised to allow for increasing the footing thickness when the
Service Load Ratio check controls a design iteration. Per DM-4 6.15.1P the Service Load Ratio is the
ratio of the SERVICE-I limit state unfactored vertical load to horizontal load and this ratio much be greater
than 2.4. Previously, when the Service Load Ratio was less than 2.4, the program would increase the
footing width without first trying to increase the footing thickness, causing some designs to be inefficient.
(Request 372)
User Manual Revisions
15. The default value for the Inclination Factor parameter on the SOI command in the ABLRFD User Manual
has been changed to “Y” to be consistent with the program and the Engineering Assistant configuration
files. (Request 384)

LRFD ABUTMENT AND RETAINING WALL ANALYSIS AND DESIGN
lii
SUMMARY OF MARCH 2016 REVISIONS - VERSION 1.15.0.0
Since the release of ABLRFD Version 1.14.0.0 several revision requests and user requested enhancements
have been received. This release of ABLRFD Version 1.15.0.0 contains the following revisions and
enhancements.
Output Revisions
1. For analysis runs a new Minimum Reinforcement Check output table has been added to provide detailed
information related to the calculation of minimum area of steel based on rho-min and temperature and
shrinkage requirements. (Request 338)
Minimum Reinforcement Revisions
2. The Crack Control spacing calculation has been revised to limit the calculated tensile stress in the
reinforcement to be no greater than 0.6*fy based on the 2014 AASHTO LRFD A5.7.3.4. Previously, the
program would use the computed tensile stress in the calculation of the Crack Control spacing without
limitation. (Request 405)
3. The calculation of Cracking Moment has been revised to use a new equation from the 2015 DM-4 Section
5.7.3.3.2 which applies multiple factors. Previously, the program would calculate the Cracking Moment
using a constant 1.2 factor. (Request 407)
Backwall Revisions
4. When the Backwall/Stem Bar Alignment input is set to ‘Y’ during a design run and no valid backwall bar
can be designed at the stem spacing with cutoffs, the program has been enhanced to set the backwall
reinforcement spacing to the stem spacing without cutoffs and the backwall bar design process is
repeated to try to find a valid design. Previously the program would end processing without finding a valid
backwall reinforcement design. (Request 395)
5. The program has been modified to check the front face temperature and shrinkage steel for adequate
moment capacity when negative moment is found in the backwall. Previously, the program would only
report a negative moment condition and the user would have to perform hand calculations. (Request 396)

LRFD ABUTMENT AND RETAINING WALL ANALYSIS AND DESIGN
liii
Settlement Revisions
6. The calculation of Elastic Settlement on Rock has been revised to use a new Elastic Modulus input added
to the RCK command. This was done because of updates to the 2014 AASHTO LRFD 10.4.6.4.
Previously, the program would calculate the Elastic Modulus based on the Elastic Modulus Reduction
Factor or the Rock Mass Rating input values on the RCK command. (Request 399)
User Manual Revisions
7. The ABLRFD Users Manual has been revised to state that unfactored wind load should be entered for
wind on substructure on the LAB command in the ABLRFD program. (Requests 398)
8. The assumption that the ABLRFD program does not consider Blast Loading has been added to the
ABLRFD Users Manual. (Requests 400)
9. The Assumption and Limitation section of Chapter 2 has been revised to condense topics and update
wording of some items. (Request 409)
The following is a list of enhancements from the 2014 AASHTO LRFD Specifications that are not included in
this version but will be implemented in a later version:
1. The 2014 AASHTO LRFD Specifications include the variation of the resistance factor, φ, for sections in
the transition zone between tension-controlled and compression-controlled defined by the net tensile
strain in the extreme tension steel and the compression-controlled and tension-controlled strain limits.
Previously, the variation in the resistance factor was expressed in terms of the ratio dt/c. (Request 406)

LRFD ABUTMENT AND RETAINING WALL ANALYSIS AND DESIGN
liv
SUMMARY OF JANUARY 2017 REVISIONS - VERSION 1.16.0.0
Since the release of ABLRFD Version 1.15.0.0 several revision requests and user requested enhancements
have been received. This release of ABLRFD Version 1.16.0.0 contains the following revisions and
enhancements.
Input Revisions
1. The lower limit of the Pile Embedment on the PIL command has been revised to be 12.0 inches,
according to DM-4 10.7.1.2. The 12" minimum caisson embedment specification check has been
removed, according to DM-4 10.8.1.2. (Request 430)
Output Revisions
2. The Extreme-I limit state output results for the horizontal EQ effects on the abutment footing have been
removed from the “Footing W/O Foundation Pressure” output report because the horizontal earthquake
loading applied to the footing (see AASHTO Figure 11.6.5.1-1) causes a negligible bending moment in
the footing. (Request 163)
3. For design runs, the cracking moment Mcr and 4/3 * Mu calculated values have been added to the bottom
of the MOMENT AXIAL INTERACTION and FLEXURAL STRENGTH output tables. (Request 408)
4. For certain Analysis run input files, a specification check error appeared in the Stem - Crack Control –
Analysis table indicating that the provided area of steel is less than minimum area required for
shrinkage/temperature control or rho min, even though area of steel provided is far greater than the
minimum area required. ABLRFD was incorrectly comparing the area of steel provided against the area
of steel required for maximum applied moment. The check has been updated to compare the area of
steel provided to the minimum area required for the minimum area for shrinkage/temperature or rho min.
(Request 422)
5. A problem preventing a valid design has been corrected when the user-input minimum footing width was
very nearly equal to the user-input minimum toe + user-input minimum heel + ABLRFD-computed stem
width at the top of footing. A tolerance factor has been added to the footing width comparison, allowing
the design to now run to completion. (Request 428)
6. The error messages displayed in the output file have been enhanced when the top of soil/rock is located
above the top of footing/pedestal or when the top of soil/rock is located below the bottom of the
footing/pedestal. Previously, a cryptic error message was displayed. (Request 429)

LRFD ABUTMENT AND RETAINING WALL ANALYSIS AND DESIGN
lv
Phi Calculation Revisions
7. The calculation of factor has been revised to use the new strain-based equation from AASHTO Section
5.5.4.2 for the situations where loading causes the strain in the section to be between the tension-
controlled and compression-controlled regions. Also, calculations for computing and considering the
moment resistance and axial load resistance for the compression-controlled strain condition of the section
have been added to ABLRFD moment axial interaction calculations. (Request 406)
Pile Revisions
8. A specific input file for a design run with battered piles that have uplift forces was found to result in a valid
design but with a performance ratio less than 1.0. An error was found in ABLRFD in which the pile
spacing required to resist uplift was incorrectly being calculated using the pile’s axial capacity for battered
piles. ABLRFD was updated to consider only the vertical component of the pile’s axial capacity (Pile Uplift
Capacity) for battered piles when calculating the pile spacing to resist the uplift. (Request 390)
Sliding Resistance Revisions
9. An input item has been added to the SOI soil data command for specifying the type of concrete footing to
be analyzed / designed. In addition to the current ‘cast-in-place’ option, ‘precast’ footings may now be
selected. Selecting ‘Precast’ will reduce the sliding resistance of the footing by 20% for footings on sand
or clayey-sandy “C-Phi” soils per A10.6.3.4-2 and D10.6.3.4. (Request 403)
User Manual Revisions
10. The ABLRFD User’s Manual Assumptions and Limitations section has been revised to state that
micropiles are not supported. (Request 412)
11. The ABLRFD User’s Manual Assumptions and Limitations section has been revised to clarify that the
ABLRFD program calculates the shear in the perpendicular direction for spread footings, pile footings,
gravity type abutments and gravity retaining walls, but only compares the perpendicular direction shear
force to the shear resistance for spread footings and pile footings. (Requests 410)
12. The ABLRFD User Manual Section 3.3.2.22 EQ has been enhanced to include additional information on
the earthquake load calculations in ABLRFD. Also, Section 3.3.7 Earthquake Loading has been added.
(Request 376)
13. Incorrect figure references in the ABLRFD User Manual Section 3.3.2.6 EH were corrected. (Request
425)

LRFD ABUTMENT AND RETAINING WALL ANALYSIS AND DESIGN
lvi
14. The ‘Allowable Caisson Uplift’ parameter on the CAI command and the ‘Allowable Pile Uplift’ on the PIL
command have been revised to ‘Caisson Uplift Capacity’ and ‘Pile Uplift Capacity’ respectively and these
parameter descriptions have been updated to emphasize that the uplift capacity is measured in the axial
direction. (Request 427)
1-1
1 GENERAL DESCRIPTION
1.1 PROGRAM IDENTIFICATION
Program Title: LRFD Abutment and Retaining Wall Analysis and Design Program Name: ABLRFD Version: 1.16.0.0 Subsystem: Substructure Authors: Pennsylvania Department of Transportation,
Imbsen and Associates, Inc., and Modjeski and Masters, Inc.
ABSTRACT:
The LRFD Abutment and Retaining Wall Analysis and Design program (ABLRFD) performs an analysis and
specifications check in accordance with the AASHTO LRFD Bridge Design Specifications and the Pennsylvania
Department of Transportation Design Manual Part 4, for cast-in-place reinforced concrete abutment and retaining
wall structures. As a result of a decision by the AASHTO Subcommittee on Bridges and Structures to no longer
publish SI unit specifications, the program only supports US customary (US) units.
The program can perform an analysis or design for a variety of abutment configurations including geometries with
or without backwalls and with either straight or notched stems. Retaining walls may have battered front and back
faces, and either sloped or level backfills. Spread, pile, caisson, and pedestal footings may be evaluated.
The loads applied to the structure are based on the LRFD limit state combinations that have been adjusted to
incorporate PennDOT policies. The limit state combinations include strength, service, and extreme limit states for
both temporary and final construction stages.
The program computes and performs specifications checking of the reinforcement at selected locations in the
stem, backwall and footing. The program also performs specifications checking of the structures for overturning,
sliding, settlement, and bearing capacity whenever applicable.

Chapter 1 General Description
1-2
1.2 ABBREVIATION
This section provides definitions of abbreviations that are commonly used throughout this User’s Manual
AASHTO - American Association of State Highway and Transportation Officials.
ABLRFD - LRFD Abutment and Retaining Wall Analysis and Design Program.
DM-4 - Pennsylvania Department of Transportation Design Manual Part 4, April 2015. This
publication (Publication 15 M) can be ordered from:
Pennsylvania Department of Transportation
Publication Sales
P.O. Box 2028
Harrisburg, PA 17105
This publication can also be downloaded free of charge from PennDOT’s website.
LRFD specifications - AASHTO LRFD Bridge Design Specifications Seventh Edition 2014. This publication
can be ordered from:
American Association of State Highway and Transportation Officials
444 North Capitol Street, N.W., Suite 249
Washington, D.C. 2001
PennDOT - Pennsylvania Department of Transportation.
Other references used in chapter 3:
[FDNHBK] - Winterkorn, H.F., and Fang, N.Y., Foundation Engineering Handbook,
Van Nostrand Reinhold Company, New York, New York, 1975.
[CC1978] - Christian, John T., and Carrier III, W. David, “Janbu, Bjerrum and Kjaernsli’s Chart
Reinterpreted”, Canadian Geotechnical Journal, Vol. 15, 1978.
[BOWLES] - Bowles, J.E., Foundation Analysis and Design, McGraw-Hill Book Company,
New York, New York, 1988.
[DAS] - Das, B. M., Principals of Geotechnical Engineering 3rd edition, PWS Publishing,
Boston, MA, 1994.

2-1
2 PROGRAM DESCRIPTION
2.1 GENERAL
The purpose of the LRFD Abutment and Retaining Wall Analysis and Design Program (ABLRFD) is to provide a
tool for bridge engineers to analyze and design cast-in-place, reinforced concrete abutments and retaining walls.
ABLRFD performs an analysis and specification check in accordance with the AASHTO LRFD Bridge Design
Specifications and the Pennsylvania Department of Transportation Design Manual Part 4. As a result of a
decision by the AASHTO Subcommittee on Bridges and Structures to no longer publish SI unit specifications, the
program only supports US customary (US) units.
The program can either analyze an existing substructure or design a new substructure, based on the values of the
input parameters entered by the user.
The program assumes a typical 1 ft strip (parallel direction) of the substructure for the structural analysis and
design. The program and documentation use the terms “perpendicular” (to the stem) and “parallel” (to the stem)
as shown in Figure 2.1-1.
2.2 SUBSTRUCTURE TYPES
The program can be used to perform an analysis or design of one of four substructure types summarized below.
Abutment Type I is an abutment with a backwall and a straight stem. The stem thickness is constant below the
seat such that the front and back face of the stem are completely vertical. Abutment Type I is shown in Figure
2.2-1.
Abutment Type II is an abutment with a backwall which may be offset from the stem. The front and back face of
the stem below the seat may be battered. Abutment Type II is shown in Figure 2.2-2.
Abutment without backwall is an abutment that resembles a retaining wall while providing a seat for the bridge
superstructure at the top of the stem. The front and back face of the stem may be battered. This abutment type
may be used to describe a gravity abutment which assumes that the stem and footing are not reinforced. Gravity
abutments may be analyzed only and they may not be designed. Gravity abutment toe and heel projections are
small or non-existent. Abutment without backwall is shown in Figure 2.2-3.

Chapter 2 Program Description
2-2
A Retaining Wall stem may have a battered front and back face. Sloped or level backfills may be specified. The
retaining wall may be used to describe a gravity wall which assumes that the stem and footing are not reinforced.
Gravity wall toe and heel projections are small or non-existent. Retaining wall is shown in Figure 2.2-4.
Figure 2.1-1 Directions
Parallel
Perpendicular
Bridge Centerline
FOOTING
SUPERSTRUCTURE
ABUTMENT
STEM
WING
WING

Chapter 2 Program Description
2-3
Figure 2.2-1 Abutment Type I
Back Face of
Abutment
Top of
Footing
Bottom of
Footing
Front
Face of
Abutment
STEM
FOOTINGTOE HEEL
BACKWALLSEAT
CORBEL

Chapter 2 Program Description
2-4
Stem Notch
Back Face
Vertical
Component
Front Face
Vertical
Component
Front Face
Horizontal
Component
Back Face
Horizontal
Component
Bottom of
Footing
Top of
Footing
STEM
FOOTING
TOE HEEL
BACKWALLSEAT
CORBEL
Figure 2.2-2 Abutment Type II

Chapter 2 Program Description
2-5
Back Face
Horizontal
ComponentFront Face
Horizontal
Component
Front Face
Vertical
Component
Back Face
Vertical
Component
Bottom of
Footing
Top of
Footing
Top of Fill (Finished
Grade)
STEM
FOOTINGTOE HEEL
SEAT
SUPERSTRUCTURE
Figure 2.2-3 Abutment without Backwall

Chapter 2 Program Description
2-6
Sloping Backfill
Front Face
Horizontal
Component
Back Face
Horizontal
Component
Bottom of
Footing
Top of
Footing
Front Face
Vertical
Component
Back Face
Vertical
Component
STEM
FOOTINGTOE HEEL
Figure 2.2-4 Retaining Wall

Chapter 2 Program Description
2-7
2.3 FOOTING TYPES
The program can be used to perform an analysis or design of one of the four footing types summarized below:
Spread footings are cast-in-place reinforced concrete footings founded on either soil or rock. Gravity abutments
and walls may only be described using the spread footing type.
Pile footings are cast-in-place reinforced concrete footings supported on piles embedded in the footing. The
individual pile capacity, both vertical and horizontal (lateral), must be entered by the user.
Caisson footings are cast-in-place reinforced concrete footings supported on caissons. The individual caisson
capacity, both vertical and horizontal (lateral), must be entered by the user.
Pedestal footings are cast-in-place reinforced concrete footings supported on cast-in-place concrete pedestals
founded on rock. Both the footing and the pedestals are analyzed and/or designed by this program.
2.4 PROGRAM FUNCTIONS
ABLRFD performs the functions listed below:
1. Input Processing - The program prompts the user for the name of the input file and output file and then
processes the input. The program checks the user-entered input values and compares them with lower and
upper limits stored in the program. If the user value is less than the lower limit, or greater than the upper limit,
an error or warning is issued. If an error is detected, the program will stop processing, otherwise the program
will continue on to the calculations involving the geometry.
2. Define Geometry - The program processes the input data to establish the geometry of the abutment or
retaining wall. This geometry is used to calculate the dead loads, earth pressure, and other loads acting on
the substructure and foundation. For analyses, the geometry of the stem and footing is not altered. For
design, the geometry of the stem is not altered, but the program considers various combinations of footing
width, thickness and toe projection.
3. Apply Loads - The program applies the loads that are applicable for a given substructure type for the two
construction conditions that are described in Section 2.5. The effects of these loads are combined according
to the limit states as specified in the LRFD Specifications. The resulting forces and moments are used to
evaluate stability of the substructure.
4. Check Stability - The program evaluates the overall stability of each substructure type by examining:
overturning, sliding, bearing capacity, and settlement as applicable. Overturning is satisfactory if the location

Chapter 2 Program Description
2-8
of the resultant force falls within the kern area of the footing. The kern area depends on the foundation
material (soil or rock). Sliding is checked by comparing the horizontal forces to the resistance force. The
bearing capacity of the foundation is evaluated by considering: the bearing resistance based on the entered
properties for soil or as entered for rock; the distribution of applied loads at the footing base; and, the
geometry of the footing. The settlement of spread footings is evaluated on the properties of the foundation
material and the applied load. Consolidation and secondary settlements are considered for soils with
cohesion.
5. Modify Footing Dimensions - For design problems, if the substructure is unstable, the program will revise the
footing geometry. The modifications to the geometry include, where applicable: changes in footing size
(width, thickness, stem location); variations in the number of piles and/or pile pattern; and, changes in the
pedestal geometry (width, thickness, back offset, front projection). For analysis problems, the stability
conditions that were violated are reported in the output, but the program does not adjust the geometry.
6. Footing Reinforcement Design - The program evaluates the reinforcement requirements at the toe and heel
locations within the footing. Flexural reinforcement is considered for both strength (moment capacity) and
serviceability (crack control) conditions. For a design problem, the program determines the area of steel
required for the strength limit state. This area is used to compute the bar spacing for each bar size. The
spacing is reduced as necessary to satisfy the serviceability requirements. At least one bar size and a
corresponding bar spacing are needed to satisfy the design criteria. If a solution cannot be found, the
program modifies the footing geometry and returns to function 2. The shear capacity is based on the
concrete strength only (i.e., an unreinforced section). If the shear resistance is inadequate, the design
procedure is re-evaluated with a thicker footing. For analysis problems, the resistance calculated using the
user specified reinforcement is compared to the applied loads.
7. Stem Reinforcement Design - For design, the program computes the reinforcement in the stem based on the
reinforcement area required for strength at the quarter points. Moment and axial load interaction is
considered for both strength (flexure) and serviceability (crack control) criteria. The procedure for evaluating
the reinforcement required (bar size and spacing) is similar to that used in the footing. The bar size and
spacing for each bar size are determined at the base of the stem. The program then tries to find one "cutoff"
point for each bar size at which every other bar may be terminated, in which case consideration will be given
to the development and embedment length requirements of the bar. The optimum solution is then indicated
as the bar size and spacing that satisfy all design criteria and provide the least reinforcement area. For
analysis problems, the reinforcement specified by the user in the stem is checked for conformance to the
specifications.

Chapter 2 Program Description
2-9
2.5 LOADINGS
The program applies the Dead Loads (DC, DW, EV), Live Loads (LR, BR, CE, PL), Water and Wind Loads (WL,
WSUP,WSUB,WA-E), Earth Pressure (EH, ES, LS), Temperature Force Effect (TU), Earthquake Effect (EQ) and
Collision Force (CT) to the substructure as defined in the LRFD Specifications. Some of these loads are entered
as input by the user and others are calculated by the program.
The program applies the above loads as two construction conditions; the temporary construction condition and
the final construction condition. The temporary construction condition is a structure constructed and backfilled to
the seat level of an abutment or to the top of a retaining wall. For temporary construction conditions, the bridge
superstructure loads are not being applied, but a live load surcharge and an earth surcharge may be applied to
the backfill. The final construction condition includes all loads.
2.6 ASSUMPTIONS AND LIMITATIONS
The following is a list of the basic assumptions and limitations used by ABLRFD:
1. The bearing capacity of rock foundations is not calculated by the program and must be supplied by the
user.
2. Pedestals must be founded on rock. For design, the clear spacing between pedestals remains constant
as specified by the user. Pedestal footing reinforcement is considered in the parallel direction only.
Pedestal footing reinforcement is not analyzed in the perpendicular direction (toe and heel locations)
because the footing and pedestal are assumed to be made integral using transverse shear keys and
dowels as per DM-4 Section 10.6.5.2P.
3. Spread footing reinforcement is considered in the perpendicular direction only.
4. Shear in spread footings and pile footings for cantilever type abutments and cantilever type retaining
walls is considered in the perpendicular direction only. Shear in the footings of gravity type abutments and
gravity type retaining walls is calculated in the perpendicular direction only but not checked.
5. Only backface vertical reinforcement is designed in the stem. Minimum temperature and shrinkage
reinforcement (#4’s @ 12 inches) in the front face is only considered for negative moment conditions in
the stem.
6. Foundations may consist of one or two soil layers or of only one rock layer. Soil and rock layers may not
be mixed.
7. The material under the lowest soil layer is assumed to be infinitely stiff.
8. For design, the footing thickness is increased in one direction only; upward when the footing bottom
elevation is fixed, or downward when the footing top elevation is fixed.
9. The gravity wall substructures are considered to be unreinforced.
10. Only the effective friction angle of soil is considered in the computations.
11. Horizontal loads applied to the abutment are assumed to be acting toward the center of the bridge. Refer
to Table 3.3.2-1 through 5 and Figure 5.30-1.

Chapter 2 Program Description
2-10
12. A one foot strip (in the parallel direction) of the abutment or wall is considered for analysis and design.
13. For the computation of self weight, the density of reinforced concrete is assumed to be 150 lbs/ft3.
14. The modulus of elasticity of concrete Ec, is computed by the following formula:
Ec = 0.033 (wc)1.5 ’f c (ksi)
wc = Density of Concrete
15. The modulus of elasticity of reinforcement, Es, is assumed to be 29,000 ksi.
16. For footings on rock, the thickness of rock layer is assumed to be very large. It is inherent in the
settlement calculations and it is not entered as an input value.
17. Punching shear is checked for single piles only. Effects due to overlapping shear planes should be
checked by the engineer if piles are closely spaced.
18. The weight of fill above the toe is not included for overturning calculations.
19. A 2 inch eccentricity is applied to all vertical bearing load moment calculations for the design and analysis
of the stem only. The 2 inch eccentricity offsets the load closer to the toe for the maximum case and
closer to the heel for the minimum case.
20. Blast Loading defined in AASHTO Section 3.15 is not considered by the ABLRFD program. Blast Loading
is not shown in the DM-4 Load Factor table for Abutments which indicates that it should not be
considered, even though the AASHTO section for Blast Loading was not deleted in DM-4.
21. Micropiles are not supported by ABLRFD. Analysis runs using the PIL command can be made to obtain
the foundation loads, which can then be used to design the micropiles using other software or hand
calculations.
Additional assumptions and limitations, including parameter lower limits, and defaults, are presented with the
input descriptions in Chapter 5.

3-1
3 METHOD OF SOLUTION
The primary purpose of this program is to analyze and design cast-in-place, reinforced concrete, abutment and
retaining wall structures. The structural analysis and specifications checking are performed in accordance with
the LRFD Specifications and DM-4. This chapter provides detailed information regarding the method of solution
used in this program.
In the analysis and design of abutment and retaining wall structures used for highway bridges, the following steps
are generally required:
1. Define the geometry of the structure.
2. Calculate the applied load effects.
3. Check the structure stability regarding overturning, sliding, settlement and bearing capacity.
4. Calculate structure section resistance.
5. Perform specifications checking.
6. Adjust footing size and foundation configuration for design.
The program performs the above calculations using classical methods of structural and foundation analysis, and
following the specifications provided in the LRFD Specifications and DM-4.
For the purposes of this program, the analysis and design runs are defined as follows:
For an analysis, the structure type and size and the applied loads are known, and the program performs all
calculations mentioned above except for Step 6. For a design run, all calculations mentioned above are
performed.
The following sections describe the above calculations in detail. Refer to any standard text book on structural
and/or foundation analysis, and the appropriate sections of this manual, for calculations performed in Steps 1, 2
and 3. Refer to the LRFD Specifications and DM-4 for calculations performed in Steps 4 and 5. Refer to the
appropriate sections in this manual for the calculations performed in Step 6.

Chapter 3 Method of Solution
3-2
3.1 NOTATION
The following are the meanings of equation notations used in various expressions throughout this document.
Definitions of abbreviations can be found in Section 1.2.
a = depth of concrete stress block in a reinforced concrete section (in)
amb = maximum moment between pedestal for bottom steel (k-ft)
amo = maximum moment over the pedestal for top steel (k-ft)
A = area of cross section (ft2)
Ab = area of individual bar (in2)
Ag = gross area of cross section (ft2)
Agross = gross area of reinforced concrete section (in2)
As = area of mild steel reinforcement (in2)
As-act = area of steel provided (in2)
As-bar = area of steel for a given bar (in2)
As-gov = governing area of steel required at a given section (in2)
As-req = area of steel required (in2)
b = width of concrete cross section (in)
b = shear capacity factor (2.0)
bc = Beta factor for punching shear around piles
b = stem back face batter angle, used for EH calculations (deg)
bm = punching Index, used for bearing capacity calculation
bo = shear perimeter around the piles - used for punching shear calculations (ft)
bw = base width used for sliding calculations
B = footing width (in)
B' = effective width for load eccentric in direction of short side (in)
Base = contact length between footing and pedestal (ft)
Be = effective width (see B') used for sliding resistance calculation (ft)
Beff = effective width used for settlement calculations (ft)
Beff2 = effective width used for the settlement calculation for lower layer of soil (ft)
c = neutral axis depth (ft)
ca = soil cohesion - used for sliding capacity of sandy-clayey soils (ksf)
ccp = center to center spacing of pedestals (ft)
c, ci = soil cohesion (soil layer i)
c = cohesive strength for layer i (ksf)
Cα = coefficient of secondary compression based on void ratio definition
Cc = compression index used for computing the consolidation settlement based on void ratio definition
Ccr = recompression index based on strain definition
Cd = settlement adjustment factor for elastic settlement

Chapter 3 Method of Solution
3-3
Ci' = cohesive strength of soil (effective condition) (ksf)
CF = elastic settlement factor used in the Christian and Carrier method
d = effective depth of concrete section (in)
d = angle of friction between footing and soil or rock (deg)
db = diameter of a reinforcing bar (in)
dc = thickness of concrete cover measured from tension fiber to center of bar (in)
dh = effective depth of heel (ft)
diam = diameter of piles - used for punching shear calculations (ft)
dt = effective depth of toe (ft)
dtop = effective depth for top steel in pedestal footing - parallel direction (ft)
dv = depth of section for shear capacity computation (in)
D = shear zone for bearing resistance calculations (ft)
Df = depth to base of footing measured from soil layer directly above toe point (ft)
Df2 = depth to top of second soil layer measured from the soil layer directly above the toe (ft)
Dh = thickness of soil sub-layer used for settlement calculations (in)
DC-A = dead load due to abutment components (kip)
DC-S = dead load due to superstructure components (kip)
DW-A = dead load due to future wearing surface (kip)
DW-S = dead load due to wearing surface and utilities from superstructure (kip)
DCAS = dead load due to approach slab
eb = eccentricity of load in the B direction (in)
el = eccentricity of load in the L direction (in)
eo = void ratio at initial effective stress
ecc = eccentricity of load resultant; used for stability and pressure calculations (ft)
eccp = eccentricity of the load resultant relative to center of pedestal (ft)
eccp = eccentricity for pedestal stability calculations (ft)
E = modulus of elasticity (ksi)
Ec = modulus of elasticity of concrete (ksi)
Ei = modulus of elasticity of intact rock (ksi)
Ems = Young’s modulus for soil (ksf)
Em = rock mass modulus (ksf)
Es = modulus of elasticity of steel (ksi)
ESH = horizontal force component of ES load (kip)
ESV = vertical force component of ES load (kip)
f = strength reduction factor - applied to nominal section capacity calculations
fb = backfill friction angle (deg)
ffi = total stress angle of lateral factor for soil layer i (deg)
f 'c = compressive strength of concrete (ksi)
ffi = total stress angle of lateral factor for soil layer i (effective soil case) (deg)

Chapter 3 Method of Solution
3-4
ff = total stress angle of internal friction (deg)
ff' = total stress angle of internal friction (effective soil case) (deg)
ft = user specified strength reduction factor used for sliding
fps = factor for punching shear calculations
fr = rupture stress in concrete (ksi) (Section 3.5.1.4)
fs = tensile stress in rebar
fss = tensile stress in rebar for crack control (ksi)
fsact = actual stress in reinforcement due to applied loads (ksi)
fsuncr = tensile stress based on uncracked section properties (ksi)
fy = yield strength of steel (ksi)
fu = ultimate tensile strength of steel (ksi)
g = gravitational acceleration ( ft/s2)
g = total unit weight of Soil or Rock (pcf)
g' = effective unit weight of soil (pcf)
gD = dry unit weight of backfill (pcf)
gDC = load factor applied to dead load of components
gm = moist unit weight of soil (pcf)
gs = saturated unit weight of backfill (pcf)
gw = unit weight of water (pcf)
h = section thickness of gravity wall at given location (in)
hES = height of ES load input by user (ft)
hlfp = horizontal force including pedestal effects (kip)
hlmp = horizontal moment applied to pedestal footing (k -ft)
hlprp = pressure at heel for pedestal stability calculations (ksi)
hLS = height of LS load input by user (ft)
hmp = pedestal overturning moment due to applied horizontal loads (k-ft)
H = height of stem (ft)
H = height of section (ft)
H = height of backfill (ft)
H1 = depth of soil layer 1 (upper layer) used for settlement calculations (in)
H2 = depth of soil layer 2 (lower layer) used for settlement calculations (in)
H1 = depth of soil layer 1 (upper layer) used for bearing resistance calculations (ft)
H2 = depth of soil layer 2 (lower layer) used for bearing resistance calculations (ft)
Hcrit = critical height of soil where two soil layers maybe considered as one soil layer (ft)
Hi = depth of soil layer i; used for settlement calculations (in) and bearing resistance (ft)
HLF = horizontal force determined from the minimum load case for all limit states except the service load limit
state (kips)
HLM = overturning moment (about the toe) generated by applied horizontal loads (kip-ft)
Hlpreff = effective pressure at heel (heel pressure - pore water pressure) (ksf)

Chapter 3 Method of Solution
3-5
HMF = moment from footing based on horizontal loads (k-ft)
Hpe = see Hlpreff
Hu = unfactored horizontal force (kips)
Hw = height of water in backfill (ft)
Hw1 = height of water above center of sublayer in Layer 1 (ft)
Hw2 = height of water above center of sublayer in Layer 2 (ft)
HWT = height of water table (toe)
HWH = height of water table (heel)
ic, ig, iq = load inclination factors for evaluating bearing resistance of soils
k = shear strength ratio for two layered soil system below footing
k = fraction of effective depth that represents the location of neutral axis
Ks = punching shear coefficient for computing the bearing resistance of cohesionless soils (category 4)
I = moment of inertia (ft4)
Lfact = influence factor
lb-act = actual length available to develop a given bar (ft)
ld = development length - after consideration of all applicable factors (ft)
ldb = development length required for a given bar (ft)
ld,min = minimum development length required for a bar (ft)
Ip = rock settlement factor
L = length of the footing (in)
Leff = effective length of the footing (in)
L' = effective length of foundation (L-el) (in)
Lap = lap length (ft)
LLIM = live load including dynamic load allowance (kip)
LLAS = live load due to approach slab
LSV = vertical force component of LS load (kip)
LSH = horizontal force component of LS load (kip)
m = parameter for elastic settlement calculations for soil layer
md = adjustment factor applied to development length - considers area of steel provided and required
mi = adjustment factors applied to the development length - considers concrete cover and epoxy coating
M = applied moment (k-ft)
Mapp = net applied moment at gravity wall section (k-ft)
Mcalc = internal moment from equilibrium of axial load and strain compatibility (Kip-ft)
Mcap = moment capacity (k-ft)
Mcr = moment required to crack the section (k-ft)
Mn = nominal moment resistance of the section (k-ft)
Mservice = applied moment from service limit state; used for crack control (k-ft)
Mu = ultimate applied factored moment (k-ft)
Mx = applied moment to a pile group (k-ft)
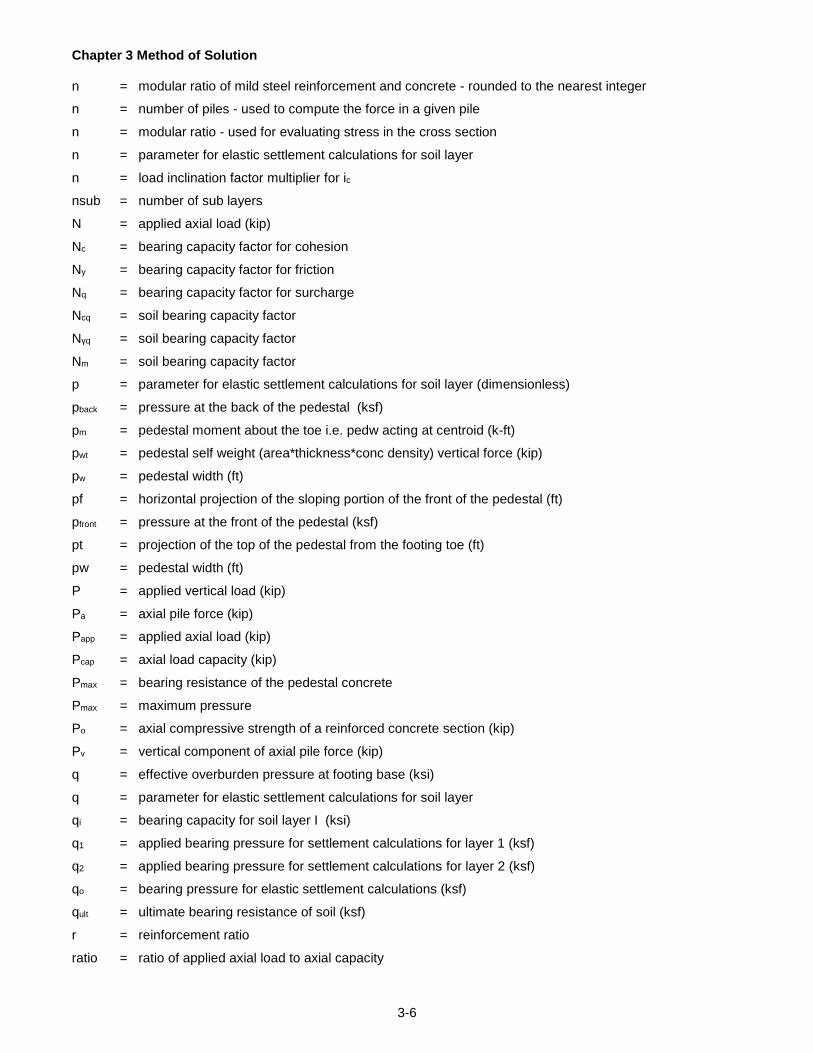
Chapter 3 Method of Solution
3-6
n = modular ratio of mild steel reinforcement and concrete - rounded to the nearest integer
n = number of piles - used to compute the force in a given pile
n = modular ratio - used for evaluating stress in the cross section
n = parameter for elastic settlement calculations for soil layer
n = load inclination factor multiplier for ic
nsub = number of sub layers
N = applied axial load (kip)
Nc = bearing capacity factor for cohesion
Ny = bearing capacity factor for friction
Nq = bearing capacity factor for surcharge
Ncq = soil bearing capacity factor
Nγq = soil bearing capacity factor
Nm = soil bearing capacity factor
p = parameter for elastic settlement calculations for soil layer (dimensionless)
pback = pressure at the back of the pedestal (ksf)
pm = pedestal moment about the toe i.e. pedw acting at centroid (k-ft)
pwt = pedestal self weight (area*thickness*conc density) vertical force (kip)
pw = pedestal width (ft)
pf = horizontal projection of the sloping portion of the front of the pedestal (ft)
pfront = pressure at the front of the pedestal (ksf)
pt = projection of the top of the pedestal from the footing toe (ft)
pw = pedestal width (ft)
P = applied vertical load (kip)
Pa = axial pile force (kip)
Papp = applied axial load (kip)
Pcap = axial load capacity (kip)
Pmax = bearing resistance of the pedestal concrete
Pmax = maximum pressure
Po = axial compressive strength of a reinforced concrete section (kip)
Pv = vertical component of axial pile force (kip)
q = effective overburden pressure at footing base (ksi)
q = parameter for elastic settlement calculations for soil layer
qi = bearing capacity for soil layer I (ksi)
q1 = applied bearing pressure for settlement calculations for layer 1 (ksf)
q2 = applied bearing pressure for settlement calculations for layer 2 (ksf)
qo = bearing pressure for elastic settlement calculations (ksf)
qult = ultimate bearing resistance of soil (ksf)
r = reinforcement ratio
ratio = ratio of applied axial load to axial capacity

Chapter 3 Method of Solution
3-7
R = nominal resistance of section - used for pedestal bearing calculations (ksf)
Ra = axial resistance of pile (kip)
Rh = horizontal (lateral) resistance of pile (kip)
Rh = horizontal (lateral) resistance of vertical pile (kip)
Rped = load resultant in pedestal (kip)
RMR = rock mass rating
RQD = rock quality designation (%)
so = initial effective vertical stress in soil at a depth below footing (ksi)
sf = final effective vertical stress in soil at a depth below footing (ksi)
sp = maximum past vertical effective stress at base level of footing (ksi)
sbar = actual bar spacing of flexural reinforcement (in)
sreq = required bar spacing of flexural reinforcement (in)
sc,sg,sq = footing shape factors for bearing resistance calculation.
samb = service moment between pedestal for bottom steel (k-ft)
samo = service moment over the pedestal for top steel (k-ft)
spac = clear spacing between pedestals (ft)
sudl = service limit state uniform distributed load applied to pedestal footing (kip/ft)
S = bar spacing
S = pedestal clear spacing
S = section modulus (ft3)
Sc = consolidation settlement (in)
Sp = maximum Pile Spacing (ft)
Su = undrained shear strength of soil (ksf)
t1, t2 = arbitrary time interval for secondary settlement calculation (years)
toprp = pressure at toe for pedestal stability calculations (ksi)
Tpreff = effective pressure at toe (toe pressure - pore water pressure) (ksi)
Tpe = see Tpreff; referenced in the figure for determining sliding resistance (ksf)
th = pedestal thickness (ft)
udl = maximum uniform distributed load applied to pedestal footing (kip/ft)
vc = Poisson’s ratio
vfact = constant for shear capacity
vlfp = vertical force for a given combination that also includes the pedestal (kip)
vmf = moment from footing based on vertical loads (kip-ft)
vmp = vertical moment for a given combination that also includes the pedestal (kip-ft)
vmp = pedestal overturning moment due to applied vertical loads (kip-ft)
vped = maximum applied shear force for pedestal footing (kips)
V = vertical force used in sliding resistance equations (kips)
Vc = shear capacity of the section (kip)
vpr = punching shear resistance (kips)
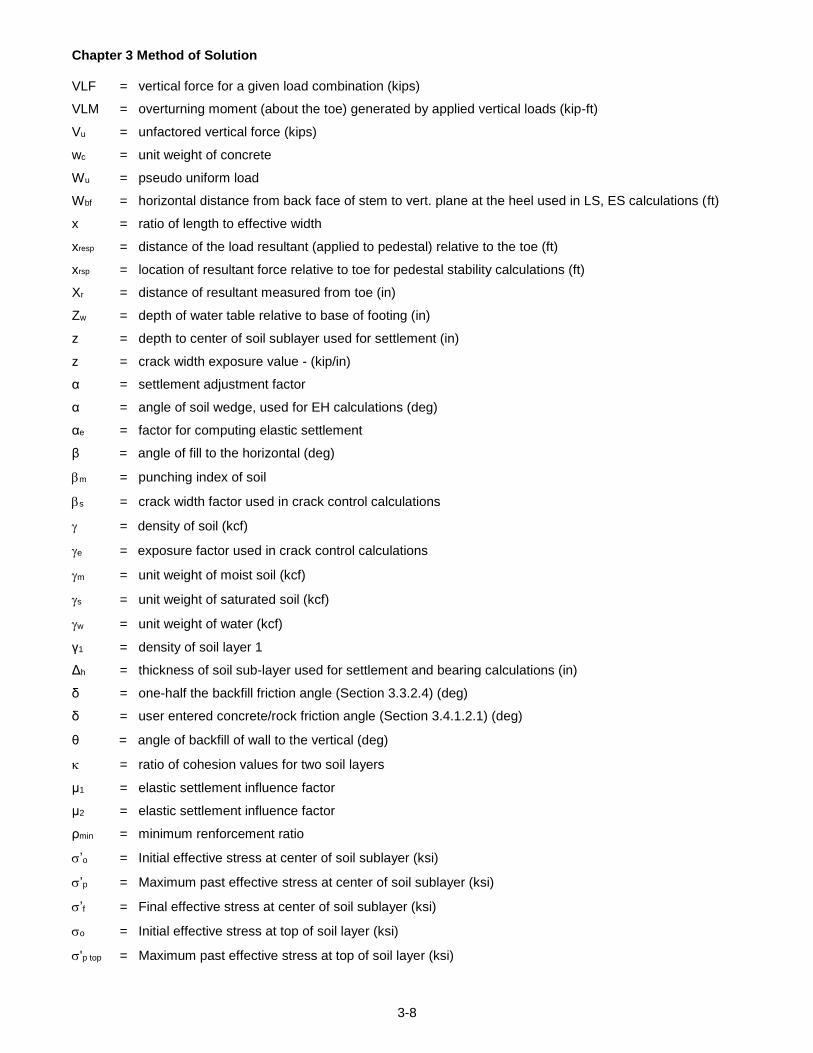
Chapter 3 Method of Solution
3-8
VLF = vertical force for a given load combination (kips)
VLM = overturning moment (about the toe) generated by applied vertical loads (kip-ft)
Vu = unfactored vertical force (kips)
wc = unit weight of concrete
Wu = pseudo uniform load
Wbf = horizontal distance from back face of stem to vert. plane at the heel used in LS, ES calculations (ft)
x = ratio of length to effective width
xresp = distance of the load resultant (applied to pedestal) relative to the toe (ft)
xrsp = location of resultant force relative to toe for pedestal stability calculations (ft)
Xr = distance of resultant measured from toe (in)
Zw = depth of water table relative to base of footing (in)
z = depth to center of soil sublayer used for settlement (in)
z = crack width exposure value - (kip/in)
α = settlement adjustment factor
α = angle of soil wedge, used for EH calculations (deg)
αe = factor for computing elastic settlement
β = angle of fill to the horizontal (deg)
m = punching index of soil
s = crack width factor used in crack control calculations
= density of soil (kcf)
e = exposure factor used in crack control calculations
m = unit weight of moist soil (kcf)
s = unit weight of saturated soil (kcf)
w = unit weight of water (kcf)
γ1 = density of soil layer 1
Δh = thickness of soil sub-layer used for settlement and bearing calculations (in)
δ = one-half the backfill friction angle (Section 3.3.2.4) (deg)
δ = user entered concrete/rock friction angle (Section 3.4.1.2.1) (deg)
θ = angle of backfill of wall to the vertical (deg)
= ratio of cohesion values for two soil layers
μ1 = elastic settlement influence factor
μ2 = elastic settlement influence factor
ρmin = minimum renforcement ratio
’o = Initial effective stress at center of soil sublayer (ksi)
’p = Maximum past effective stress at center of soil sublayer (ksi)
’f = Final effective stress at center of soil sublayer (ksi)
o = Initial effective stress at top of soil layer (ksi)
'p top = Maximum past effective stress at top of soil layer (ksi)

Chapter 3 Method of Solution
3-9
'p bottom = Maximum past effective stress at bottom of soil layer (ksi)
'ft = Final effective stress at top of soil layer (ksi)
φfl = friction angle for soil layer 1 (deg)
φ = strength reduction factor
φ' = effective angle of internal friction within backfill (deg)
φf = soil friction angle (deg)

Chapter 3 Method of Solution
3-10
3.2 GEOMETRY
The substructure type, size, backfill slope, other substructure and foundation dimensions, and geotechnical
parameters are input by the user. These dimensions and values are used to calculate the applied load effects
and the structural analysis solution. The abutment backwall and stem or retaining wall stem are defined by
various dimensions as shown on Figures 5.6-1, 5.7-1, 5.8-1, and 5.9-1. The footing is defined by its type as
shown on Figures 5.6-1, 5.7-1, 5.8-1, 5.9-1, 5.12-1, 5.14-1, 5.14-2, 5.15-1, and 5.16-1.
A design run is viewed as a series of analysis runs for a variety of footing geometry. Essentially, all of the
specification checks that would be applicable in an analysis run are considered in a design run. In an analysis
run, the program simply evaluates each applicable specification check given one user-defined specified footing
geometry. In a design run, the user specifies a range of values for the footing geometry. The program will check
all configurations of footing geometry within that range of values, discarding those configurations that do not
satisfy any of the checks. Satisfactory configurations are evaluated for their economy based on criteria selected
by the user. The most economical configuration is deemed to be the optimal design solution.
The design description is organized into the following sections. Section 3.2.1 identifies how the footing geometry
can be modified. It has a detailed description of the iteration scheme used within the program. Section 3.7
addresses the special considerations for design. The ‘design’ algorithms and criteria for selecting the optimal
design solution are described for spread footings in Section 3.7.1, pedestal footings in Section 3.7.2, and, pile
footings in Section 3.7.3.
Sections 3.5.3 and 3.6.3 describe the checks that are performed for each footing and stem cross section. They
specifically address the design algorithms that are applied for the rebar checks in the footing and stem. Shear
checks for design are described in Section 3.7.4.
3.2.1 Footing Design Iteration
The scope of the footing geometry configurations that will be checked by the program is defined by user-
specified maximum and minimum values for the footing thickness, footing width, toe projection, and, heel
projection. These values are entered by using the FTG command (see Section 5.10). Refer to Section
6.10 for further information concerning the limitations of this input.
Figure 1 illustrates how the footing dimensions are reconfigured. The footing thickness may be increased
upwards or downwards. The width extends incrementally towards the heel side, and the stem moves
incrementally from the toe side to the heel side. The following incremental values are used by default in
the program:
Footing thickness is increased by 2 inches.
Chapter 3 Method of Solution
3-11
Footing width is increased by 3 inches.
Stem location is moved by 1 inch.
If applying an incremental value causes a footing dimension to fall outside the user-specified limiting
values, then the dimension is adjusted to the limiting value. For example, if the user specifies a minimum
thickness of 2 ft. and a maximum thickness of 2.4 ft., the program will check footing thickness
configurations of 2.0 ft, 2.17 ft, 2.33 ft, and 2.4 ft. Since 2.50 ft. exceeds the limit imposed by the user,
the program will use 2.4 ft instead.
Conceptually, the footing iteration algorithm consists of combinations of width and thickness while looping
through the stem positions. The description that follows is based on Figure 2. The figure illustrates a
typical iteration scheme.
The program applies a design optimization algorithm that provides efficient footing dimension selection.
The program begins by initializing the footing geometry with the minimum toe projection, maximum
thickness, and minimum width. For any selected footing configuration, the applied loads are evaluated
and combined as described in Section 3.3, and the applicable stability checks are evaluated, as
described in Section 3.4. At this point, footing-specific designs, i.e. pile pattern layouts or pedestal
geometry configurations, are evaluated as described in Section 3.7. After all of the applicable
specification checks have been evaluated and are satisfied, the program determines the cost of the
configuration as described in Section 3.7.
The next step is to determine if another footing configuration can be evaluated. The set of configurations
is defined as: minimum and maximum toe projections; minimum heel projection; and stem position
incremental value (see Figure 1d). The first parameter to be considered is the stem position. For a given
footing thickness and width, the program checks a finite set of configurations of the stem location. Each
stem position increment that is applied will move the stem closer to the heel. If the stem position does not
reach the limit imposed by the minimum heel or maximum toe projection, the stem is repositioned by an
increment and the program returns to the load evaluation stage. If the stem position reaches the
minimum heel or maximum toe limit, then the design algorithm determines whether to increase the
thickness or width of the footing.

Chapter 3 Method of Solution
3-12
minmax
(a) footing thickness variation - downward
min
max
(c) footing width variation
(d) toe and heel projections
min
toe
max
toe
max
heel
min
heel
minmax
(b) footing thickness variation - upward
Increment width by
3.0 inches (default)
Increment stem position
by 1.0 inch.
Increment thickness
by 2.0 inches (default)
Figure 3.2.1-1 Incremental Positions of the Footing Geometry

Chapter 3 Method of Solution
3-13
Start
Design
initialize footing
dimensions to the
min toe projection;
max. thickness; and,
min width
Evaluate Load
Combinations
evaluate footing checks and
perform Pile / Pedestal design;
compute cost if successful
save optimal design
can
stem be
moved?
can
footing
thickness be
incremented?
can the
footing width
be incremented?
re-load optimal design
configuration;
perform stem
reinforcement design
increment stem
position;
keep footing width
and thickness as-is
increment footing thickness;
reset stem position to
min. toe projection;
keep footing width as-is
no
no
no
yes
yes
yes
STOP
output
results
Output message
that design
was NOT found
design solution
found?
no
yes
is this a max
thickness design
no
good design with
max thickness
yes
no
yes
initialize footing
dimensions to: good
design width minus ½
max footing thickness,
min footing thickness,
min toe projection
Max Thickness Ftg Design
Iteration
increment footing width; set
footing at max. thickness; reset
to min. toe projection
increment footing width; reset
footing to: min. thickness; and
min. toe projection
Otherwise
Figure 3.2.1-2 Design Algorithm for Footing Iteration Scheme
The program begins the design by using the maximum footing thickness and iterating the footing width by
the width increment until a valid design is found. When the valid design is found, the program then sets
the thickness to the minimum footing thickness and reduces the footing width by one half the maximum
footing thickness. The footing width reduction will not reduce the footing width to less than the minimum

Chapter 3 Method of Solution
3-14
footing width. The program then begins to check the load evaluation and increase the thickness. Refer to
Figure 3.
Min Width Max Width
Min Thickness
Max Thickness
Optimum
Footing Size
First Good
Footing Size
Increase Thickness
to Maximum or Last
Designed
Thickness
Max Footing Thickness * 1/2Thick Lines Indicate
Attempted Footing
Dimension Limits
Most Economical Footing Designs
Start
End
Figure 3.2.1-3 Typical Attempted Footing Design Dimensions
The set of footing thickness configurations to be examined is based on the: minimum thickness,
maximum thickness or last designed thickness, and thickness incremental value (Figure 1(b)). If the
footing thickness has not reached the maximum or last designed thickness value, then the stem position
is reset to the minimum toe projection and the footing thickness is incremented. The program returns to
the load evaluation step with the new footing dimensions.
After the program has looped through all iterations of the footing thickness, the footing width is examined.
The set of footing width positions is defined by the: minimum width, maximum width, and width
incremental value (Figure 1(c)). Each time the footing width is incremented, the footing thickness is reset
to the minimum thickness and the stem position is reset to the minimum toe projection. The program then
returns to the loads evaluation step. As the footing width increases, more stem positions are examined
because the toe and heel projections are defined relative to the width. The following example illustrates
this.
Consider a footing with the following parameters:
Stem thickness at the base is 4 ft.
Minimum footing thickness is 2 ft. and maximum footing thickness is 2.25 ft.
Minimum footing width is 8.0 ft. and maximum footing width is 10.0 ft.
Minimum toe projection is 2 ft. and the minimum heel projection is 1 ft.

Chapter 3 Method of Solution
3-15
Maximum toe and heel projections are not specified.
Table 1 shows a sample of the configurations that are checked. Configurations that are checked but not
shown (for sake of brevity) in the table are widths of 8’-3”; 8’-6”, 8’-9”, 9’-3”, 9’-6” and 9’-9”.
During a design run, the progress of the program can be examined by reviewing the design status
information that is displayed on the monitor. Two examples are shown in Figure 3.
The status information will indicate the current iteration value of the footing thickness and width. The
maximum values are also shown. Furthermore, the status will indicate if a solution was found. In case
(a) above, a solution has not been found; note that the footing width is 7.083 ft. In case (b), the status
indicates that the current width is 8.083 ft and the program will iterate until the width is 10.917 ft. A
solution was found when the footing width was 7.417 ft and the footing thickness was 2.5 ft. Section
6.10.8 describes how the program can dynamically change the maximum value of the footing width.
In summary, the program will iterate through all combinations of footing geometry as defined by the limits
and incremental values. For any footing, the program will evaluate:
1. loads (individual and combinations - as described in Section 3.3).
2. footing stability checks (e.g. eccentricity, bearing pressure, sliding ... see Section 3.4).
3. footing flexural strength checks (e.g. moment capacity, development length; see Section 3.5.2).
4. footing serviceability checks (e.g. crack control, spacing ... see Section 3.5.2).
5. footing shear check (see Section 3.5.2.9).
If the program cannot find a solution, the program will notify the user and then terminate. If one or more
solutions has been found, the optimal footing configuration (as defined in Section 3.7) is re-evaluated,
then the program will design the stem rebar by evaluating:
1. stem and backwall (if applicable) strength checks (Sections 3.6.2.1 through 3.6.2.1.3).
2. stem and backwall (if applicable) serviceability checks (Section 3.6.2.4).
3. stem shear checks (Section 3.6.2.5).
4. stem cutoff locations and optimal stem rebar (Section 3.6.3).

Chapter 3 Method of Solution
3-16
Table 3.2.1-1 Sample Footing Configurations
Footing Width
Footing
Thickness
Toe Projections Comments
8’-0”
2’-3”
2’-0”, 2’-1”, 2’-2”, ... 2’-10”, 2-11”, 3’-0”
Maximum footing thickness design
9'-0"
2’-3”
2’-0”, 2’-1”, 2’-2”, ... 2’-10”, 2-11”, 3’-0”
10'-0"
2’-3”
2’-0”, 2’-1”, 2’-2”, ... 2’-10”, 2-11”, 3’-0”
Found good design for maximum footing thickness
9’-0”
2’-0”
2’-0”, 2’-1”, 2’-2”, ... 2’-10”, 2-11”, 3’-0”, 3’-1”, 3’-2”, ... 3’-10”, 3-11”, 4’-0”
Reduce width, try minimum thickness
2’-2”
2’-0”, 2’-1”, 2’-2”, ... 2’-10”, 2-11”, 3’-0”, 3’-1”, 3’-2”, ... 3’-10”, 3-11”, 4’-0”
New Thickness
2’-3”
2’-0”, 2’-1”, 2’-2”, ... 2’-10”, 2-11”, 3’-0”, 3’-1”, 3’-2”, ... 3’-10”, 3-11”, 4’-0”
New Thickness
10’-0”
2’-0”
2’-0”, 2’-1”, 2’-2”, ... 2’-10”, 2-11”, 3’-0”, 3’-1”, 3’-2”, ... 3’-10”, 3-11”, 4’-0”, 4’-1”, 4’-2”, ... 4’-10”, 4-11”, 5’-0”
Increase width, try minimum thickness
2’-2”
2’-0”, 2’-1”, 2’-2”, ... 2’-10”, 2-11”, 3’-0”, 3’-1”, 3’-2”, ... 3’-10”, 3-11”, 4’-0”, 4’-1”, 4’-2”, ... 4’-10”, 4-11”, 5’-0”
New Thickness
Performing Footing Design ... Current Maximum Designed Current Maximum Designed Thickness Thickness Thickness Width Width Width 2.833 3.500 --?-- 7.083 45.600 --?--
(a) A design solution has not been found yet as indicated by “---?----“
Performing Footing Design ... Current Maximum Designed Current Maximum Designed Thickness Thickness Thickness Width Width Width 2.500 3.500 2.500 8.083 10.917 7.417
(b) Current width is 8.083 ft. A solution was found when the width was 7.417 ft.
Figure 3.2.1-4 Design Status of Footing Iteration Scheme Displayed on Monitor

Chapter 3 Method of Solution
3-17
3.3 APPLIED LOAD EFFECTS
Section 2.5 briefly described the load types and combinations that are considered by the program. This section
provides information about the assumptions and details associated with the loads that are computed by the
program and the factors that are applied for each limit state.
3.3.1 Construction Stages
Loading is based on two construction stages of the abutment or retaining wall:
Temporary (construction) stage
Final stage
The temporary (construction) stage simulates an abutment or retaining wall that is still under construction.
The abutment is considered to be constructed and backfilled to the seat level. Bridge superstructure
loads are non-existent at this stage, but a live load and earth surcharge may be applied to the backfill.
Retaining walls are considered to be completely constructed with a level backfill at a point where the top
of backfill meets the walls. The construction stages for abutments and retaining walls are shown in
Figure 1 (a-d), with a representation of the applicable loads.
The final stage includes all loads, backfill and abutment dimensions that the user specifies. The final
stage for abutments and retaining walls are shown in Figure 1 (a-d), with a representation of the
applicable loads.

Chapter 3 Method of Solution
3-18
Temporary Stage
Temporary Stage
Final Stage
Final Stage
(a) Abutment Type I
(b) Abutment Type II
Figure 3.3.1-1 Construction Stages

Chapter 3 Method of Solution
3-19
Temporary Stage
Temporary Stage
Final Stage
Final Stage
(d) Retaining Wall
(c) Abutment without Backwall
Figure 3.3.1-1 Construction Stages (Cont.)
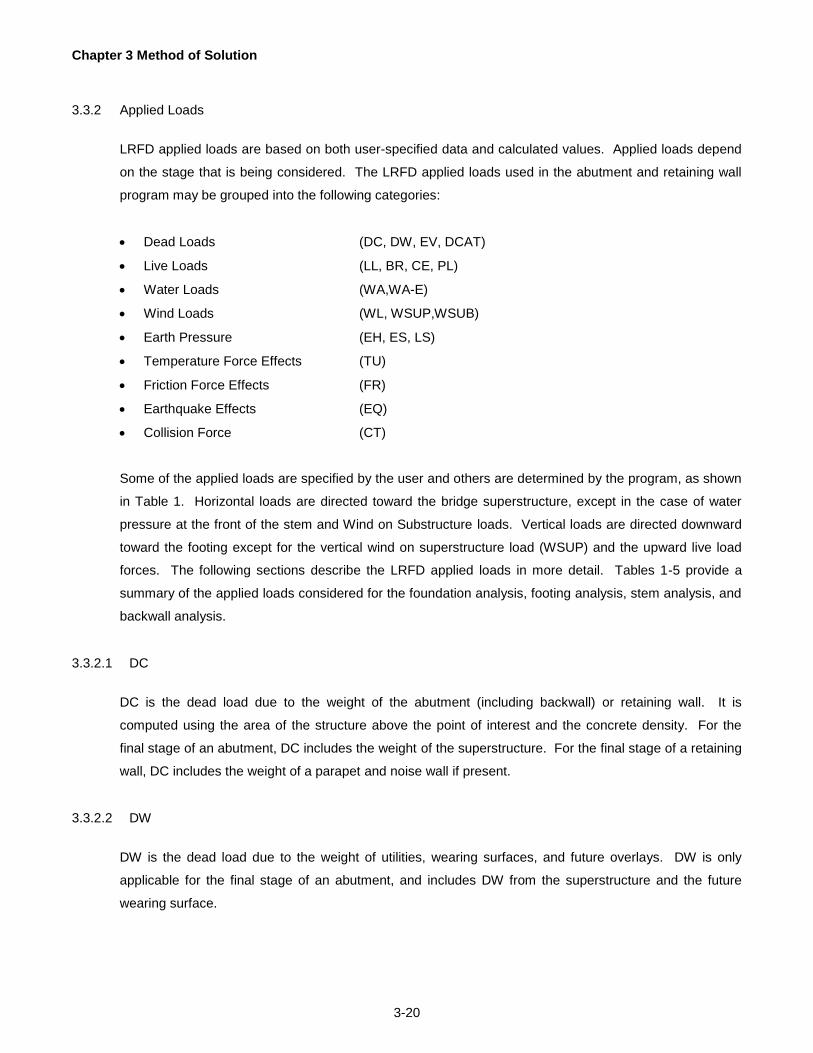
Chapter 3 Method of Solution
3-20
3.3.2 Applied Loads
LRFD applied loads are based on both user-specified data and calculated values. Applied loads depend
on the stage that is being considered. The LRFD applied loads used in the abutment and retaining wall
program may be grouped into the following categories:
Dead Loads (DC, DW, EV, DCAT)
Live Loads (LL, BR, CE, PL)
Water Loads (WA,WA-E)
Wind Loads (WL, WSUP,WSUB)
Earth Pressure (EH, ES, LS)
Temperature Force Effects (TU)
Friction Force Effects (FR)
Earthquake Effects (EQ)
Collision Force (CT)
Some of the applied loads are specified by the user and others are determined by the program, as shown
in Table 1. Horizontal loads are directed toward the bridge superstructure, except in the case of water
pressure at the front of the stem and Wind on Substructure loads. Vertical loads are directed downward
toward the footing except for the vertical wind on superstructure load (WSUP) and the upward live load
forces. The following sections describe the LRFD applied loads in more detail. Tables 1-5 provide a
summary of the applied loads considered for the foundation analysis, footing analysis, stem analysis, and
backwall analysis.
3.3.2.1 DC
DC is the dead load due to the weight of the abutment (including backwall) or retaining wall. It is
computed using the area of the structure above the point of interest and the concrete density. For the
final stage of an abutment, DC includes the weight of the superstructure. For the final stage of a retaining
wall, DC includes the weight of a parapet and noise wall if present.
3.3.2.2 DW
DW is the dead load due to the weight of utilities, wearing surfaces, and future overlays. DW is only
applicable for the final stage of an abutment, and includes DW from the superstructure and the future
wearing surface.
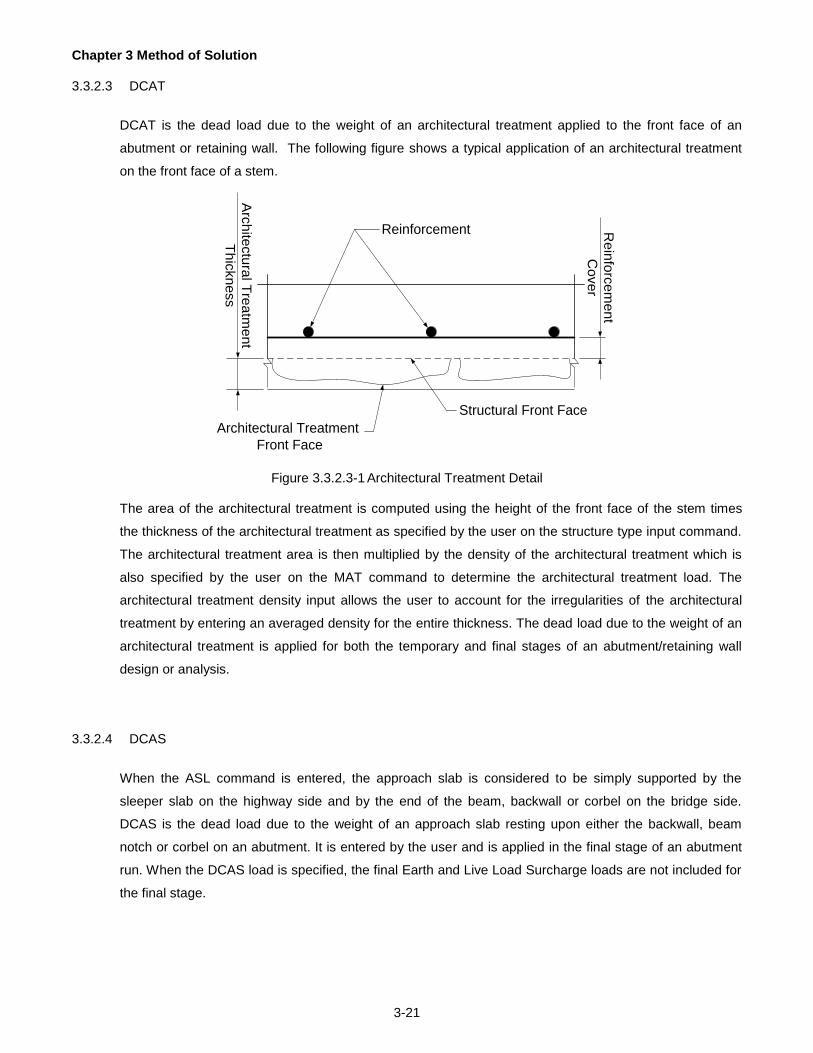
Chapter 3 Method of Solution
3-21
3.3.2.3 DCAT
DCAT is the dead load due to the weight of an architectural treatment applied to the front face of an
abutment or retaining wall. The following figure shows a typical application of an architectural treatment
on the front face of a stem.
Re
info
rce
me
nt
Co
ve
r
Arc
hite
ctu
ral T
rea
tme
nt
Th
ickn
ess
Structural Front Face
Architectural Treatment
Front Face
Reinforcement
Figure 3.3.2.3-1 Architectural Treatment Detail
The area of the architectural treatment is computed using the height of the front face of the stem times
the thickness of the architectural treatment as specified by the user on the structure type input command.
The architectural treatment area is then multiplied by the density of the architectural treatment which is
also specified by the user on the MAT command to determine the architectural treatment load. The
architectural treatment density input allows the user to account for the irregularities of the architectural
treatment by entering an averaged density for the entire thickness. The dead load due to the weight of an
architectural treatment is applied for both the temporary and final stages of an abutment/retaining wall
design or analysis.
3.3.2.4 DCAS
When the ASL command is entered, the approach slab is considered to be simply supported by the
sleeper slab on the highway side and by the end of the beam, backwall or corbel on the bridge side.
DCAS is the dead load due to the weight of an approach slab resting upon either the backwall, beam
notch or corbel on an abutment. It is entered by the user and is applied in the final stage of an abutment
run. When the DCAS load is specified, the final Earth and Live Load Surcharge loads are not included for
the final stage.

Chapter 3 Method of Solution
3-22
Table 3.3.2-1 User or Program Applied Loads
User Specified
Program Calculated
Description
Vert.
Horiz.
Vert.
Horiz.
DC
Substructure weight
DC
Superstructure weight
DC
Parapet weight on retaining wall
DCAS3
Approach slab weight
DCAT
Architectural Treatment weight
DW
Wearing surface on backfill
DW
Wearing surface on superstructure
EV
Earth weight of backfill soil
EH
EH
Earth pressure of backfill soil
ES1
ES1
ES1
Earth surcharge
LS1
LS1
LS1
Live load surcharge
WA
Water pressure on front of stem
WA-E
Water pressure due to backfill soil
WA
Buoyancy
WSUP
WSUP
Wind on superstructure
WSUB
WSUB
Wind on substructure
WL
Wind on live load
TU
Thermal force from superstructure
FR
Friction force from superstructure
LL2
Live load from superstructure
LL
Live load for backwall only
LLAS3
Live load on the approach slab
PL
Pedestrian live load
BR2
Live load braking force
CE2
Live load centrifugal force
EQ
Earthquake force from superstructure
EQ
Earthquake force due to earth pressure
CT
Collision force applied to the parapet on top of retaining
wall
Notes: 1 The actual surcharge force applied to the structure are determined by the program, based on user
input and geometry.
2 These loads are specified for a design or special live load.
3 Applied to abutments only.

Chapter 3 Method of Solution
3-23
Table 3.3.2-2 Foundation Applied Loads
Vertical
Horizontal
Description
Temp.
Final
Temp.
Final
DC1
DC
Substructure weight
DC
Superstructure weight
DCAT
DCAT
Architectural Treatment weight
DC
Parapet weight on retaining wall
DCAS3
Approach slab weight
DW
Wearing surface on backfill
DW
Wearing surface on superstructure
EV1
EV
Earth weight of backfill soil
EH1
EH
EH1
EH
Earth pressure of backfill soil
ES1
ES
ES1
ES
Earth surcharge
LS1
LS
LS1
LS
Live load surcharge
WA
WA
Water pressure on front of stem
WA-E
WA-E
Water pressure due to backfill soil
WA
WA
Buoyancy
WSUP
WSUP
Wind on superstructure
WSUB3
WSUB3
WSUB3
WSUB3
Wind on substructure
WL
Wind on live load
TU
Thermal force from superstructure
FR
Friction force from superstructure
LL2
Live load from superstructure
LL
Live load for backwall only
LLAS3
Live load from approach slab
DC
Parapet weight on retaining wall
PL
Pedestrian live load
BR2
Live load braking force
CE2
Live load centrifugal force
EQ
Earthquake force from superstructure
EQ
Earthquake force due to earth pressure
CT
Collision force applied to the parapet on top of retaining wall
Notes: 1 Temporary stage considers concrete and soil up to seat level
2 Design or special live load, depending on user input
3 Applied to abutments only.

Chapter 3 Method of Solution
3-24
Table 3.3.2-3 Footing Applied Loads
Heel
Toe
Description
Temp.
Final
Temp.
Final
DC
DC
DC
DC
Toe of heel protection weight
DW
Wearing surface on backfill
EV1
EV
Earth (backfill soil) weight
EH1
EH
Earth pressure (vertical) of backfill soil
EH1
EH
Earth pressure (horizontal) of backfill soil
ES1
ES
Earth surcharge
LS1
LS
Live load surcharge
WA
WA
Buoyancy
Notes: 1 Temporary stage considers concrete and soil up to seat level.

Chapter 3 Method of Solution
3-25
Table 3.3.2-4 Stem Applied Loads
Axial
Moment
Shear
Description
Temp.
Final
Temp.
Final
Temp.
Final
DC1
DC
DC1
DC
Substructure weight
DC
DC4
Superstructure weight
DCAT
DCAT
DCAT
DCAT
Architectural Treatment weight
DC
DC
Parapet weight on retaining wall
DCAS3
DCAS3
Approach slab weight
DW
DW
Wearing surface on backfill
DW
DW4
Wearing surface on superstructure
EV1
EV
EV1
EV
Earth weight of backfill soil
EH1
EH
EH1
EH
EH1
EH
Earth pressure of backfill soil
ES1
ES
ES1
ES
ES1
ES
Earth surcharge
LS1
LS
LS1
LS
LS1
LS
Live load surcharge
WA
WA
WA
WA
Water pressure on front of stem
WA-E
WA-E
WA-E
WA-E
Water pressure due to backfill soil
WSUP
WSUP4
WSUP
Wind on superstructure
WSUB3
WSUB3
WSUB3
WSUB3
WSUB3
WSUB3
Wind on substructure
WL
WL
Wind on live load
TU
TU
Thermal force from superstructure
FR
FR
Friction force from superstructure
LL
LL4
Live load from superstructure
LLAS3
LLAS3
Live load from approach slab
LL
LL
Live load for backwall only
PL
PL4
Pedestrian live load
BR2
BR2
Live load braking force
CE2
CE2
Live load centrifugal force
EQ
EQ Earthquake force from
superstructure
EQ3
EQ
EQ Earthquake force due to earth
pressure
CT
CT Collision force applied to the parapet
on top of retaining wall
Notes: 1 Temporary stage considers concrete and soil up to seat level
2 Design or special live load, depending on user input.
3 Applied to abutments only
4 Moments are calculated in the vertical direction with a 2 inch positive eccentricity (towards the toe) for
the maximum load case and a 2 inch negative eccentricity (towards the heel) for the minimum load
case, from the centerline of the bearings.

Chapter 3 Method of Solution
3-26
Table 3.3.2-5 Backwall Applied Loads (Final Stage Only)
Axial
Moment
Shear
Description
Temp.
Final
Temp.
Final
Temp.
Final
DC
DC
Substructure section weight
DCAS2
DCAS2
Approach slab weight
DW
DW
Wearing surface on superstructure
EV
EV
Earth weight (pavement/backfill
soil)
EH
EH
Earth pressure of backfill soil
ES
ES
Earth surcharge
LS
LS
Live load surcharge
LL
LL
Live load for backwall only
LLAS2
LLAS2
Live load for approach slab
EQ
EQ1
Earthquake force from earth
pressure
Notes: 1 Applied to Abutments only
2 Applicability of load is based on “Approach Slab on Beam Notch” parameter on the ASL
command
3.3.2.5 EV
EV is the dead load due to the weight of the backfill soil. This load has a vertical component only. EV is a
vertical load that is applied to the heel of the footing and to an inclined stem back face. For backfill soil
above the water level, the moist unit weight of soil (entered on MAT input card) is used. The saturated
unit weight of soil (entered on MAT input card) is used for backfill soil below the water level. Soil above
the toe is neglected for force calculations due to unreliable front soil height conditions due to erosion,
scour, etc.
3.3.2.6 EH
EH is the lateral earth pressure computed by considering the active condition of the backfill soil. ABLRFD
determines whether to use Rankine or Coulomb procedures for calculation of the active earth pressure
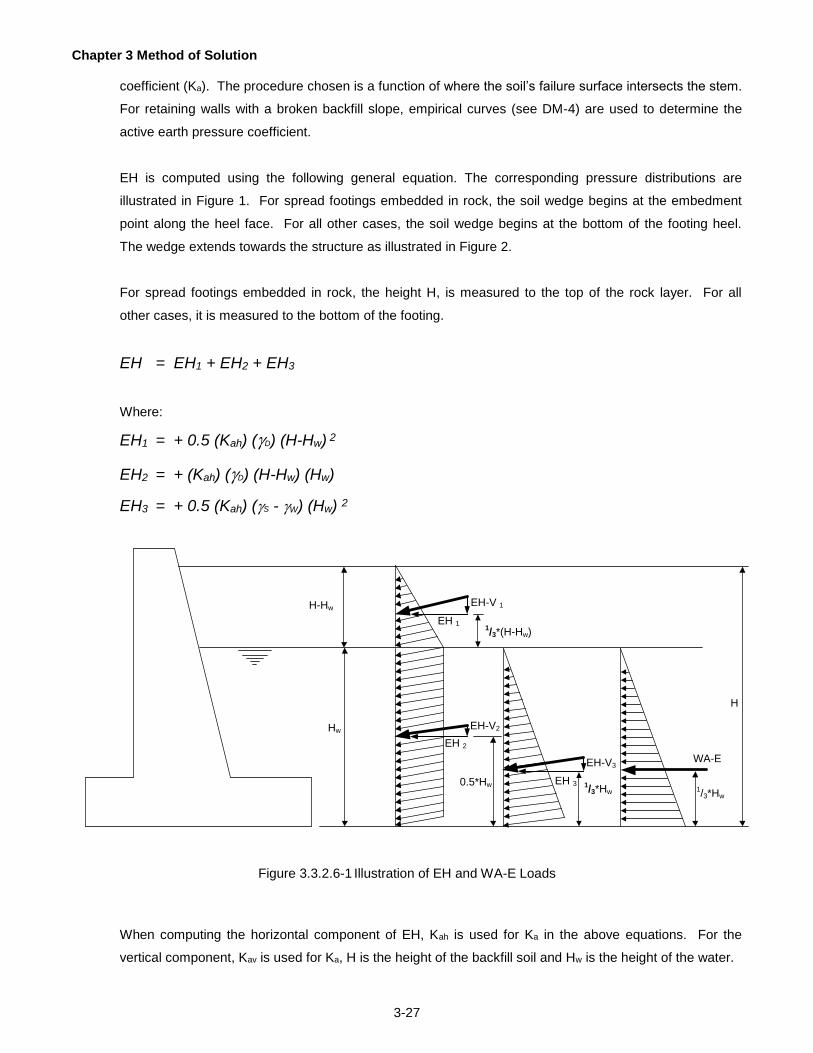
Chapter 3 Method of Solution
3-27
coefficient (Ka). The procedure chosen is a function of where the soil’s failure surface intersects the stem.
For retaining walls with a broken backfill slope, empirical curves (see DM-4) are used to determine the
active earth pressure coefficient.
EH is computed using the following general equation. The corresponding pressure distributions are
illustrated in Figure 1. For spread footings embedded in rock, the soil wedge begins at the embedment
point along the heel face. For all other cases, the soil wedge begins at the bottom of the footing heel.
The wedge extends towards the structure as illustrated in Figure 2.
For spread footings embedded in rock, the height H, is measured to the top of the rock layer. For all
other cases, it is measured to the bottom of the footing.
EH = EH1 + EH2 + EH3
Where:
EH1 = + 0.5 (Kah) (D) (H-Hw) 2
EH2 = + (Kah) (D) (H-Hw) (Hw)
EH3 = + 0.5 (Kah) (S - W) (Hw) 2
EH 1
Hw
H
H-Hw
1/3*(H-Hw)
EH 3
EH 2
0.5*Hw
WA-E
1/3*Hw
EH-V 1
EH-V2
EH-V3
1/3*Hw
Figure 3.3.2.6-1 Illustration of EH and WA-E Loads
When computing the horizontal component of EH, Kah is used for Ka in the above equations. For the
vertical component, Kav is used for Ka, H is the height of the backfill soil and Hw is the height of the water.

Chapter 3 Method of Solution
3-28
The remainder of this section describes how the coefficient of active earth pressure (Ka) is evaluated.
Coulomb Theory is used to compute Ka if the structure is a gravity wall. For all other structures, the
program computes the angle of a soil failure wedge (See Figure 2). Coulomb Theory is used to compute
Ka if the soil wedge intersects the back face of the stem. For structures with a large heel projection where
the soil wedge may not intersect the stem, Rankine Theory is used to compute Ka.
Coulomb
Top of Rock Layer
For all other cases,
wedge begins here
Wedge begins at this
point for Spread
Footing embedded in
Rock
Figure 3.3.2.6-2 Illustration of Soil Wedge
The angle of the soil wedge is computed according to the following equation:
εφ'α 90 2
1 = o
Where:
) (
)( = 1-
'sin
sinsinε
α = angle of the soil wedge measured from the vertical
= backfill slope angle measured from the horizontal
φ' = backfill internal friction angle
For spread footings embedded in rock, the soil wedge begins at the embedment point along the heel
face. For all other cases, the soil wedge begins at the bottom of the footing heel. The wedge extends
towards the structure as illustrated in Figure 2. If the soil wedge intersects the back face of the stem at a
point that is backfilled, Coulomb Theory is used to compute Ka. For example, if the soil wedge intersects
the back face of a retaining wall stem, but the intersection occurs at the exposed back face of the stem,
Rankine Theory would be applicable. A typical soil wedge is illustrated in Figure 2.

Chapter 3 Method of Solution
3-29
Once the failure mode is determined, Ka is computed and broken into horizontal and vertical components
using the equations that follow:
Coulomb Theory:
) - ( )(
) + ( = K
2
2
aδsinsin
'sin
A3.11.5.3-1
Where:
) + ) - (
) - ( ) + ( + 1
2
sin(δsin
'sinδ'sin A3.11.5.3-2
'δ 2
1 = Wall Friction Angle
= Angle of backface of wall to the vertical
Kah = Ka cos (δ + 90 - )
Kav = Ka sin (δ + 90 - )
Rankine Theory:
)( - )( + )(
) ( - )( - )( )( = K
22
22
a
'coscoscos
'coscoscoscos
D3.11.5.8.1-2
Where: Kah = Ka cos()
Kav = Ka sin()

Chapter 3 Method of Solution
3-30
Broken Backfill:
If the backfill on a retaining wall is broken, the program will derive the vertical and horizontal Ka values
from Figure 3.3.2.6-3 below. The figure is based on the 1993 LFD DM-4 Figure 5.5.2(B) Type 2 Soil
which assumes a soil unit weight of 120 pcf and an effective angle of friction of 33O.
Figure 3.3.2.6-3 Broken Backfill Ka Values
Note: The values obtained from Figure 3.3.2.6-3 are not to be less than the User Inputted Equivalent
Fluid Pressure from the MAT input card.
The height ratio is the vertical distance from the height of soil above the point of analysis to the break,
divided by, the height of soil above the analysis point. Below is a figure depicting this ratio.
0.000
0.050
0.100
0.150
0.200
0.250
0.300
0.350
0.400
0.450
0.500
0.550
0.600
0.650
0 0.1 0.2 0.3 0.4 0.5 0.6 0.7 0.8 0.9 1
Height Ratio ( H1/H)
Empirical Broken Backfill Ka Values
Ka 6:1
3:1
1.5:1
1.75:1
2:1
3:1
2:1
1.75:1
1.5:1
Kav Curves
Kah Curves

Chapter 3 Method of Solution
3-31
H (FOUND)
H1 (FOUND)
Height Ratio = H1(STEM)
H1
H
H (STEM)
Figure 3.3.2.6-4 Broken Backfill Soil Height Ratio
3.3.2.7 EH-V
The EH-V force occurs when the EH force has a vertical component, i.e. when Kav is non-zero. The
calculation of this vertical force is shown below. The first section shows how the force is calculated for the
overall structure while the second section shows the method to calculate the force for internal footing use.
For methods of Ka calculation, refer to Section 3.3.2.4. Refer to Figure 1 in Section 3.3.2.4.
3.3.2.7.1 Overall EH-V Equations
The following equations are used when the program is calculating the overall force effects of the
horizontal earth pressure in the vertical direction.
EH-V = EH-V1 + EH-V2 + EH-V3
Where:
EH-V1 = + 0.5 (Kav) (D) (H-Hw) 2
EH-V2 = + (Kav) (D) (H-Hw) (Hw)
EH-V3 = + 0.5 (Kav) (S - W) (Hw) 2
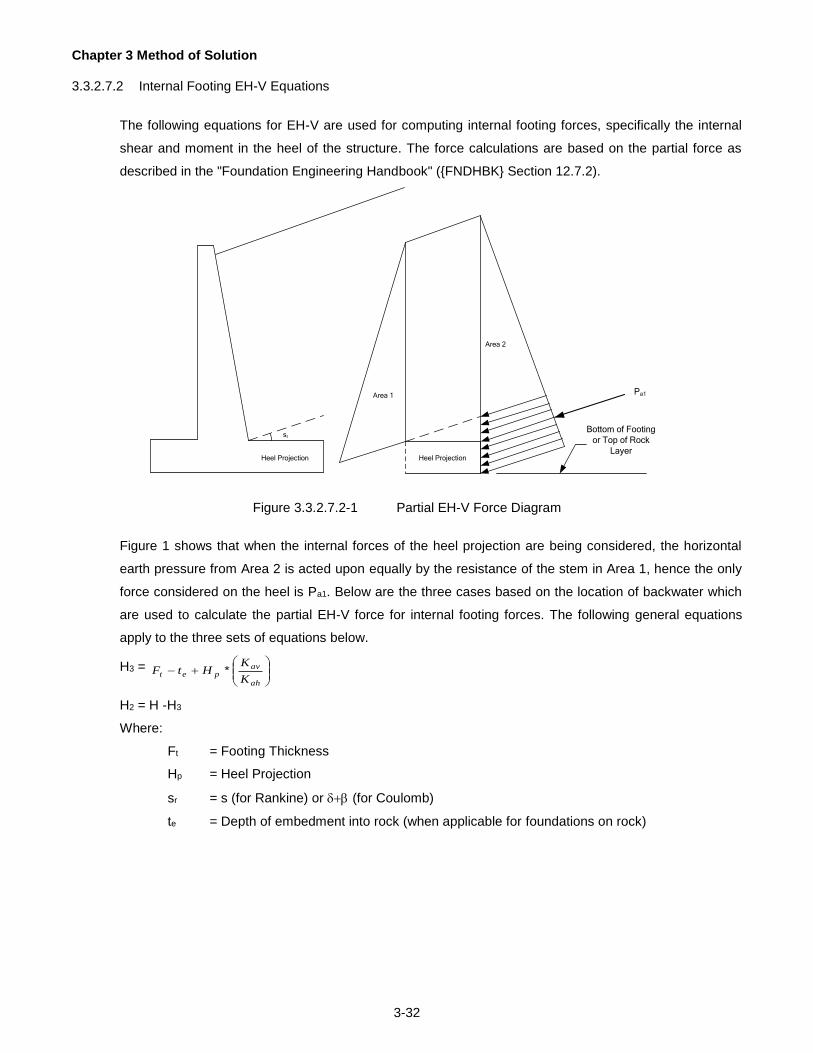
Chapter 3 Method of Solution
3-32
3.3.2.7.2 Internal Footing EH-V Equations
The following equations for EH-V are used for computing internal footing forces, specifically the internal
shear and moment in the heel of the structure. The force calculations are based on the partial force as
described in the "Foundation Engineering Handbook" ({FNDHBK} Section 12.7.2).
sr
Area 1
Area 2
Heel ProjectionHeel Projection
Pa1
Bottom of Footing
or Top of Rock
Layer
Figure 3.3.2.7.2-1 Partial EH-V Force Diagram
Figure 1 shows that when the internal forces of the heel projection are being considered, the horizontal
earth pressure from Area 2 is acted upon equally by the resistance of the stem in Area 1, hence the only
force considered on the heel is Pa1. Below are the three cases based on the location of backwater which
are used to calculate the partial EH-V force for internal footing forces. The following general equations
apply to the three sets of equations below.
H3 =
ah
avpet
K
KHtF *
H2 = H -H3
Where:
Ft = Footing Thickness
Hp = Heel Projection
sr = s (for Rankine) or (for Coulomb)
te = Depth of embedment into rock (when applicable for foundations on rock)

Chapter 3 Method of Solution
3-33
Case 1 - No back water / water below footing
H2
H3
sr
H
Hw= 0
EH-V1 Bottom of Footing or Top
of Rock layer
Figure 3.3.2.7.2-2 Case 1 Area Diagram - Water Below Footing
Equations to calculate EH-V for Case 1:
EH-V1 222
5050 HKHK davdav ..
EH-V = EH-V1
Case 2 - Back water above affected area
Hw
H2
H3
H
sr
EH-V3
EH-V2
Bottom of Footing or Top
of Rock Layer
Figure 3.3.2.7.2-3 Case 2 Area Diagram - Water Above Affected Area
Equations to calculate EH-V for Case 2:
EH-V2 3HHHK wdav
EH-V3 232
5050 HHKHK wwsavwwsav ..
EH-V = EH-V2 + EH-V3
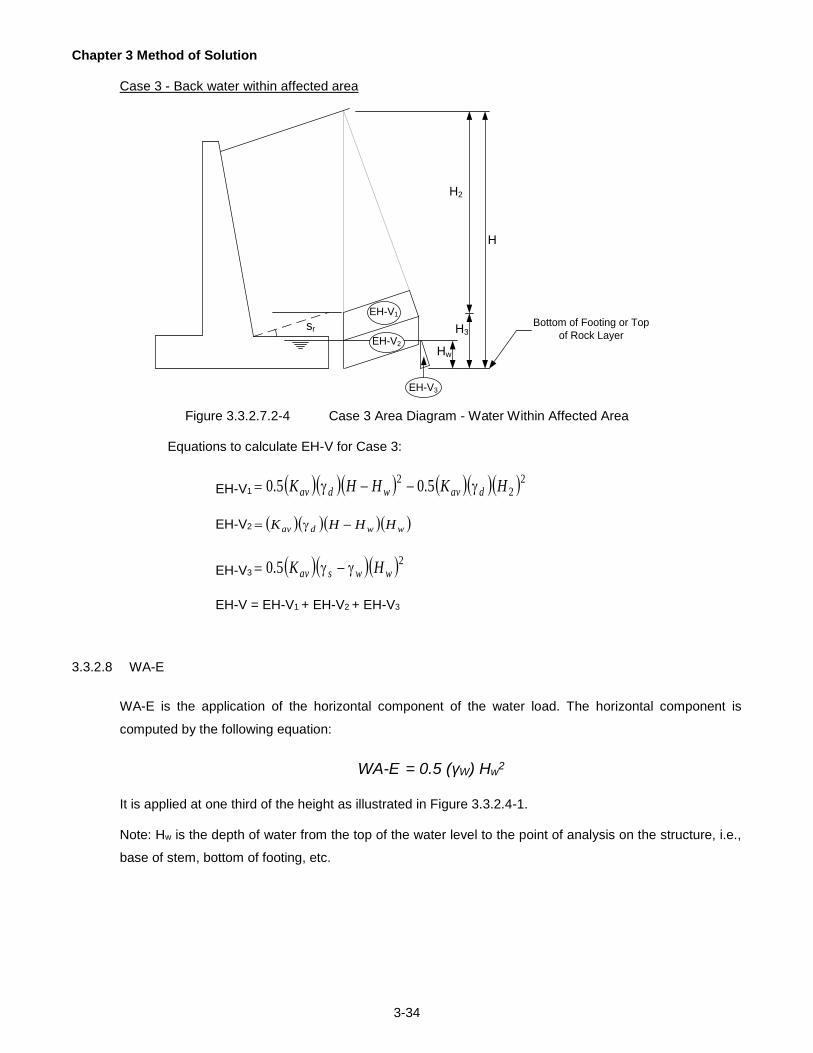
Chapter 3 Method of Solution
3-34
Case 3 - Back water within affected area
EH-V1
H2
H3
H
Hw
sr
EH-V3
EH-V2
Bottom of Footing or Top
of Rock Layer
Figure 3.3.2.7.2-4 Case 3 Area Diagram - Water Within Affected Area
Equations to calculate EH-V for Case 3:
EH-V1 222
5050 HKHHK davwdav ..
EH-V2 wwdav HHHK
EH-V3 250 wwsav HK .
EH-V = EH-V1 + EH-V2 + EH-V3
3.3.2.8 WA-E
WA-E is the application of the horizontal component of the water load. The horizontal component is
computed by the following equation:
WA-E = 0.5 (γW) Hw2
It is applied at one third of the height as illustrated in Figure 3.3.2.4-1. Note: Hw is the depth of water from the top of the water level to the point of analysis on the structure, i.e.,
base of stem, bottom of footing, etc.

Chapter 3 Method of Solution
3-35
3.3.2.9 LS
LS is the live load surcharge applied when a vehicular load acts on the surface of the backfill, refer to
Figure 3.3.2.9-1 and 3.3.2.9-2. LS is expressed as an equivalent a height of backfill soil. The value of LS
between may differ between the temporary stage and final stage. If approach slab loads are included in
an abutment run using the ASL command, the Final LS load is not included for the final stage. LS has
components in the horizontal and vertical direction. In the vertical direction, LS is computed as a
uniformly distributed load on the backfill:
LSv = hLS γD Wbf
In the horizontal direction, the pressure due to LS is computed as follows:
LSh = hLS γD Kah H
Ft
Hstem
W
LSvhLS-tmp
Htemp/2
LSh
Htemp
Htemp/2
ESh
Htemp
ESvhES-tmp
TpHp
Figure 3.3.2.9-1 Temporary Stage - Live Load and Dead Load Surcharge Loading

Chapter 3 Method of Solution
3-36
Ft
Hstem
LSvhLS-tmp
Htemp/2
LSh
Hfinal
Htemp/2
ESh
Hfinal
ESvhES-tmp
Hp Tp
W
Paving Notch
Thickness
Figure 3.3.2.9-2 Final Stage - Live Load and Dead Load Surcharge Loading
3.3.2.10 ES
ES is a uniform earth surcharge that may be applied to the surface of the backfill, refer to Figure 3.3.2.9-1
and 3.3.2.9-2. ES is expressed as an equivalent height of backfill soil. The value of ES may differ
between the temporary stage and final stage. If approach slab loads are included in an abutment run
using the ASL command, the Final ES Load is not included for the final stage. ES has components in the
horizontal and vertical direction. In the vertical direction, ES is computed as a uniformly distributed load
on the backfill:
ESv = hES γD Wbf
In the horizontal direction, the pressure due to ES is computed as follows:
ESh = hES γD Kah H

Chapter 3 Method of Solution
3-37
3.3.2.11 WA
WA consists of three forces, the buoyant force acting under the footing, the downward force equal to the
weight of water over the toe of the footing, and the horizontal force due to water pressure on the front
face of the stem. When computing buoyancy, the water levels at the front and back of the structure are
considered. For a design run, when the front water level is not entered, the program will calculate this
value based on the back water level and DM-4 Section 3.11.3. For analysis, if the front water level is left
blank, the program places the front water level at the bottom of the footing. The program computes an
area of buoyant effect below the footing as shown in Figure 1. The buoyant force is then determined by
multiplying the area of buoyant effect by the unit weight of water.
Note: The buoyant force is not applied for spread footings on rock.
1/3 H
WT
HWT
above the Toe
Buoyant
AreaBuoyant Area
HWH
HWH
HWH
HWH
HWT
HWT
HWT
HWT
HWT
below the Toe
Figure 3.3.2.11-1 Illustration of WA Load
The horizontal water pressure on the front face of the stem is computed according to the following
equation:
WA = ½ (γw) Hw2
It is applied at one third of the height as illustrated in Figure 3.3.2.11-1.
Note: Hw is the depth of water from the top of the water level to the point of analysis on the structure, i.e.,
base of stem, bottom of footing, etc.

Chapter 3 Method of Solution
3-38
3.3.2.12 WSUP
WSUP is the horizontal and vertical force from wind acting on a superstructure or external structure
attached to a retaining wall. This force is only applicable to abutments in the final stage and is assumed
to be transmitted to the abutments through the bearings. The vertical force typically acts in an upward
direction. For retaining walls, the force is applied in the final stage and is transmitted to the top of the
stem by a user specified vertical distance.
3.3.2.13 WSUB
WSUB is the horizontal force from wind acting on the substructure. This force is only applicable to
abutments for both the temporary and final stage. The force is transmitted into the stem from the centroid
of the exposed wind area and can be applied in either direction. A positive value contributes to
overturning. If a water level is specified, the exposed stem area is located between the water line and the
bearing seat. If no water level is specified, then the exposed stem area is located between the top of
footing and the bearing seat.
For the application of the wind load on the stem, the program calculates a distributed force based on the
exposed wind area then determines the applicable force and moment for each stem location. Figure
3.3.2.12 illustrates the application of the wind on substructure load at the stem locations.
Loc A
Stem Loc A
Stem Loc B
Stem Loc C
Stem Loc D
Wind Areas & Eccentricities
without water present
Loc A Loc B Loc C Loc D
Loc B
Loc C
Loc D
Loc A
Stem Loc A
Stem Loc B
Stem Loc C
Stem Loc D
Wind Areas & Eccentricities
with water present
Loc A Loc B,C and D
Loc B
Loc C
Loc D
Front Water
Elevation
Figure 3.3.2.13 – Application of Wind at Stem Locations

Chapter 3 Method of Solution
3-39
3.3.2.14 WL
WL is the horizontal force due to wind acting on the superstructure live load. This force is only applicable
to abutments in the final stage and is assumed to be transmitted to the abutments through the bearings.
3.3.2.15 PL
PL is the vertical live load due to pedestrians acting on the superstructure. This force is only applicable to
abutments in the final stage and is assumed to be transmitted to the abutments through the bearings.
3.3.2.16 LL
LL is the vertical live load acting on the structure. Live load is only applicable to abutments in the final
stage and as assumed to be transmitted to the abutments through the bearings. A downward live load
may be applied to the front top corner of the backwall as shown in Figure 5-30-1. A horizontal live load
may be applied to the top of the backwall as shown in Figure 5-30-1. The backwall live load is only
applied to the backwall and is not used in evaluating the loads applied to the stem or footing. A design
live load acting on the superstructure and applied at the abutment bearing seat, may be specified in the
upward and downward direction. A special live load is applied in the same way as the design live load,
but the special and design live loads are mutually exclusive (i.e., both may not be specified) in the same
run.
3.3.2.17 LLAS
When the ASL command is entered, the approach slab is considered to be simply supported by the
sleeper slab on the highway side and by the end of the beam, backwall or corbel on the bridge side. LLAS
is the live load acting on an approach slab either resting upon the backwall, beam notch or corbel on an
abutment. It is entered by the user and is applied in the final stage of an abutment run. When the LLAS
load is specified, the final Earth and Live Load Surcharge loads are not included for the final stage.
3.3.2.18 BR
BR is the horizontal braking force from the live load acting on the superstructure. This force is only
applicable to abutments in the final stage and is assumed to be transmitted to the abutments through the
bearings. Braking force for the design or special live load may be applied, but both cases may not be
specified in the same run.
3.3.2.19 CE
CE is the horizontal centrifugal force from the live load acting on the superstructure. This force is only

Chapter 3 Method of Solution
3-40
applicable to abutments in the final stage and is assumed to be transmitted to the abutments through the
bearings. Centrifugal force for the design or special live load may be applied, but both cases may not be
specified in the same run.
3.3.2.20 TU
TU is the horizontal force on the abutment induced by thermal expansion or contraction of the
superstructure. TU is only applicable for abutments, is only considered in the final stage, and is assumed
to be transmitted to the abutments through the bearings.
3.3.2.21 FR
FR is the horizontal force on the abutment induced by friction in sliding type expansion bearings. FR is
only applicable for abutments, is only considered in the final stage, and is transmitted to the abutment at
the bearings.
3.3.2.22 EQ
EQ is the total earthquake force acting on the structure. EQ is applicable for all structure types. It is
applied in the final stage only. This load is only considered in the Extreme Event I limit state. EQ is
composed of earth pressure due to earthquake force and, for abutments only, a user-specified Horizontal
Superstructure Force from the superstructure for abutments and user-specified Horizontal External
Structure Force for retaining walls. In calculating the EQ forces, the earth pressure due to earthquake
force is initially set by the program to be the same as EH (see Section 3.3.2.6 above), but may be
modified by a user input values for Response Modification factor (see Section 6.35.1) and Soil Pressure
Factor for abutments and retaining walls (see Section 6.35.2).
The program calculates the earthquake load (EQ) as follows:
𝐸𝑄 = (𝐸𝐻) 𝑆𝑜𝑖𝐹𝑎𝑐𝑡 + 𝑆𝑢𝑝𝐹𝑜𝑟
𝑅𝑒𝑠𝐹𝑎𝑐𝑡 (𝐴𝑏𝑢𝑡𝑚𝑒𝑛𝑡𝑠)
𝐸𝑄 = (𝐸𝐻) 𝑆𝑜𝑖𝐹𝑎𝑐𝑡 + 𝐸𝑥𝑡𝐹𝑜𝑟
𝑅𝑒𝑠𝐹𝑎𝑐𝑡 (𝑅𝑒𝑡𝑎𝑖𝑛𝑖𝑛𝑔 𝑊𝑎𝑙𝑙𝑠)
Where:
The lateral earth pressure (EH), the input Horizontal Superstructure Force (SupFor) and the input
Horizontal External Earthquake Force (ExtFor) are divided by the input Response Modification
Factor (ResFact) to obtain the EQ force.
Chapter 3 Method of Solution
3-41
Only the lateral earth pressure (EH) is multiplied by the input Soil Pressure Factor (SoiFact) to
obtain the EQ force.
The vertical component of the earth pressure force (EV and EH-V) is not considered in the calculation of
the EQ forces (AASHTO LRFD 3.10.1).
3.3.2.23 CT
CT is the vehicle collision force acting on top of a parapet on a retaining wall. This force is only
applicable for retaining walls in the final stage and is only applied in the Extreme Event II limit state. The
user may specify the vertical distance to this force from the top of the retaining wall as shown in Figure
5.31-1.
3.3.3 Load Cases
Extreme force effects are determined for each limit state by applying maximum or minimum load factors
to the applied loads. Limit state load cases are formed this way.
Use of the maximum or minimum load factor depends on the applied load direction under consideration.
For example, if the vertical force acting on the abutment is to be minimized, the component dead load
(DC) of the superstructure would be factored by the minimum load factor. Some applied loads have
components in both the vertical and horizontal directions. These applied loads are multiplied by the
maximum load factor because the horizontal force is always maximized and both components of force
must be multiplied by the same factor. An example of this situation is the live load surcharge (LS).
3.3.4 Limit States and Load Combinations
There are eight limit states considered by the program, namely: Service I, Strength I, Strength IP,
Strength II, Strength III, Strength V, Extreme 1, and Extreme II.
In addition, the program uses load factors for checking secondary and consolidation settlement (CSS).
Load combinations are performed in accordance with the LRFD specifications and superseded by the
DM-4 specifications. Tables 1 and 2 identify the loads and corresponding load factors that are combined
for each limit state of the temporary stage and final stage respectively. When two load factors are
presented, the first load factor is the maximum load factor and the second load factor is the minimum load
factor.

Chapter 3 Method of Solution
3-42
Table 3.3.4-1 Load Factor/Load Combination Table: Temporary Stage
Type of
Load
Service I
Strength
I
Strength
IP
Strength
II
Strength
III
Strength
V
Extreme
I
Extreme
II
CSS
DC-A
1.00/1.00
1.25/0.90
1.25/0.90
1.25/0.90
1.25/0.90
1.25/0.90
--
--
--
DC-S
--
--
--
--
--
--
--
--
--
DW-A
--
--
--
--
--
--
--
--
--
DW-S
--
--
--
--
--
--
--
--
--
EV
1.00/1.00
1.35/1.0
1.35/1.0
1.35/1.0
1.35/1.0
1.35/1.0
--
--
--
EH
1.00/1.00
1.50/1.50
1.50/1.50
1.50/1.50
1.50/1.50
1.50/1.50
--
--
--
EH-V
1.00/1.00
1.50/1.50
1.50/1.50
1.50/1.50
1.50/1.50
1.50/1.50
--
--
--
ES
1.00/1.00
1.50/1.50
1.50/1.50
1.50/1.50
1.50/1.50
1.50/1.50
--
--
--
LS
1.00/1.00
1.75/1.75
1.50/1.50
1.50/1.50
--
1.50/1.50
--
--
--
LLDD
--
--
--
--
--
--
--
--
--
LLDU
--
--
--
--
--
--
--
--
--
LLBW
--
--
--
--
--
--
--
--
--
LLBH
--
--
--
--
--
--
--
--
--
PL
--
--
--
--
--
--
--
--
--
WSUP
--
--
--
--
--
--
--
--
--
WSUB
0.30/0.30
--
--
--
1.40/1.40
0.40/0.40
--
--
--
WL
--
--
--
--
--
--
--
--
--
WA
1.0/1.0
1.0/1.0
1.0/1.0
1.0/1.0
1.0/1.0
1.0/1.0
--
--
--
BR
--
--
--
--
--
--
--
--
--
CE
--
--
--
--
--
--
--
--
--
TU
--
--
--
--
--
--
--
--
--
FR
--
--
--
--
--
--
--
--
--
EQ
--
--
--
--
--
--
--
--
--
CT
--
--
--
--
--
--
--
--
--
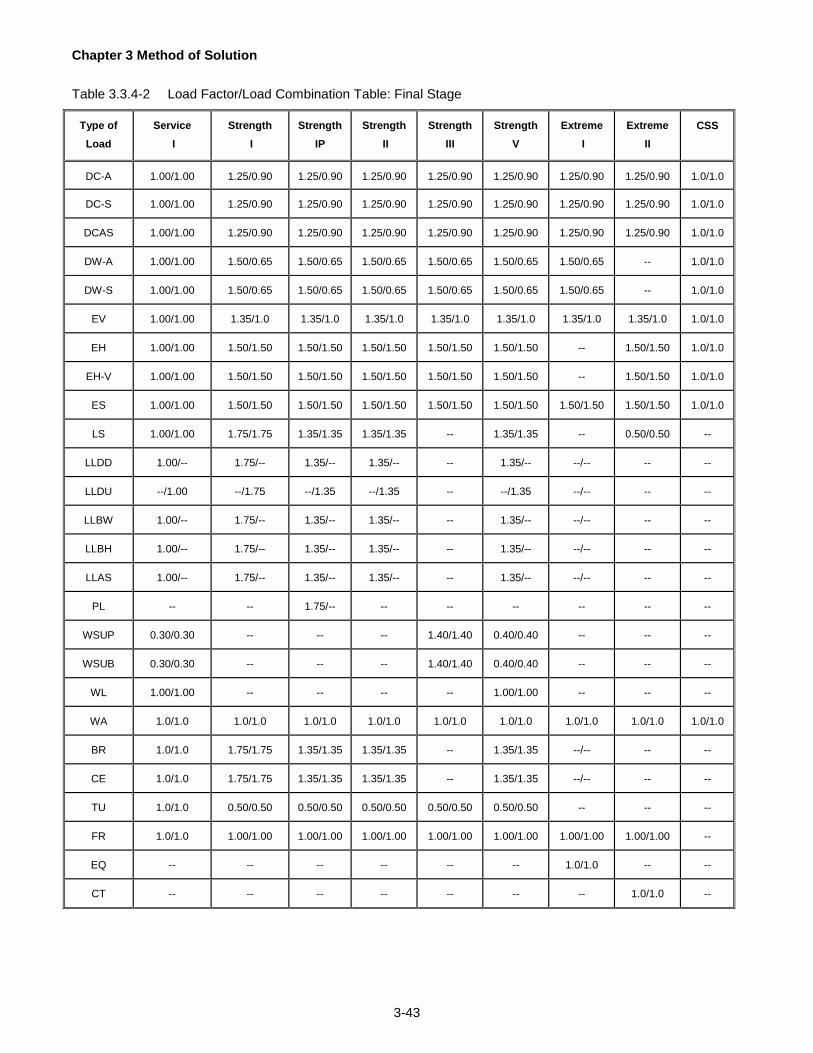
Chapter 3 Method of Solution
3-43
Table 3.3.4-2 Load Factor/Load Combination Table: Final Stage
Type of
Load
Service
I
Strength
I
Strength
IP
Strength
II
Strength
III
Strength
V
Extreme
I
Extreme
II
CSS
DC-A
1.00/1.00
1.25/0.90
1.25/0.90
1.25/0.90
1.25/0.90
1.25/0.90
1.25/0.90
1.25/0.90
1.0/1.0
DC-S
1.00/1.00
1.25/0.90
1.25/0.90
1.25/0.90
1.25/0.90
1.25/0.90
1.25/0.90
1.25/0.90
1.0/1.0
DCAS
1.00/1.00
1.25/0.90
1.25/0.90
1.25/0.90
1.25/0.90
1.25/0.90
1.25/0.90
1.25/0.90
1.0/1.0
DW-A
1.00/1.00
1.50/0.65
1.50/0.65
1.50/0.65
1.50/0.65
1.50/0.65
1.50/0.65
--
1.0/1.0
DW-S
1.00/1.00
1.50/0.65
1.50/0.65
1.50/0.65
1.50/0.65
1.50/0.65
1.50/0.65
--
1.0/1.0
EV
1.00/1.00
1.35/1.0
1.35/1.0
1.35/1.0
1.35/1.0
1.35/1.0
1.35/1.0
1.35/1.0
1.0/1.0
EH
1.00/1.00
1.50/1.50
1.50/1.50
1.50/1.50
1.50/1.50
1.50/1.50
--
1.50/1.50
1.0/1.0
EH-V
1.00/1.00
1.50/1.50
1.50/1.50
1.50/1.50
1.50/1.50
1.50/1.50
--
1.50/1.50
1.0/1.0
ES
1.00/1.00
1.50/1.50
1.50/1.50
1.50/1.50
1.50/1.50
1.50/1.50
1.50/1.50
1.50/1.50
1.0/1.0
LS
1.00/1.00
1.75/1.75
1.35/1.35
1.35/1.35
--
1.35/1.35
--
0.50/0.50
--
LLDD
1.00/--
1.75/--
1.35/--
1.35/--
--
1.35/--
--/--
--
--
LLDU
--/1.00
--/1.75
--/1.35
--/1.35
--
--/1.35
--/--
--
--
LLBW
1.00/--
1.75/--
1.35/--
1.35/--
--
1.35/--
--/--
--
--
LLBH
1.00/--
1.75/--
1.35/--
1.35/--
--
1.35/--
--/--
--
--
LLAS
1.00/--
1.75/--
1.35/--
1.35/--
--
1.35/--
--/--
--
--
PL
--
--
1.75/--
--
--
--
--
--
--
WSUP
0.30/0.30
--
--
--
1.40/1.40
0.40/0.40
--
--
--
WSUB
0.30/0.30
--
--
--
1.40/1.40
0.40/0.40
--
--
--
WL
1.00/1.00
--
--
--
--
1.00/1.00
--
--
--
WA
1.0/1.0
1.0/1.0
1.0/1.0
1.0/1.0
1.0/1.0
1.0/1.0
1.0/1.0
1.0/1.0
1.0/1.0
BR
1.0/1.0
1.75/1.75
1.35/1.35
1.35/1.35
--
1.35/1.35
--/--
--
--
CE
1.0/1.0
1.75/1.75
1.35/1.35
1.35/1.35
--
1.35/1.35
--/--
--
--
TU
1.0/1.0
0.50/0.50
0.50/0.50
0.50/0.50
0.50/0.50
0.50/0.50
--
--
--
FR
1.0/1.0
1.00/1.00
1.00/1.00
1.00/1.00
1.00/1.00
1.00/1.00
1.00/1.00
1.00/1.00
--
EQ
--
--
--
--
--
--
1.0/1.0
--
--
CT
--
--
--
--
--
--
--
1.0/1.0
--

Chapter 3 Method of Solution
3-44
The applicability of a given limit state load combination is a function of the:
1. Construction condition (temporary stage or final stage).
2. Load case (maximum or minimum).
3. Component (stem, footing, or backwall).
4. Structure type (abutment or retaining wall).
The description of the construction condition can be found in Section 2.8.1. Vehicular type loads (LL, BR,
CT...) and superstructure loads (DC) are not considered in the temporary stage load combinations
because the superstructure is not constructed.
The maximum load case refers to the situation when the objective of the load combination is to maximize
the downward vertical load. Similarly, the minimum load case refers to the situation when the objective of
the load combination is to minimize the downward vertical force. For both the maximum and minimum
load case, the horizontal load is maximized. For load types that have components in both the horizontal
and vertical directions (LS, ES, EH and EQ), the load is maximized in both directions.
The program incorporates the following “rules” in the application of load combinations.
1. If special live load command (Section 5.33) is not specified by the user, the Strength II limit state is
not applied.
2. If the earthquake command (Section 5.34) is not specified by the user, the Extreme I limit state is not
applied.
3. If the collision load (see Section 5.31) is not specified by the user, the Extreme II limit state is not
applied.
4. If the pedestrian live load (see Section 5.30) is not specified by the user, the Strength IP limit state is
not applied.
5. The backwall live load is only applicable for the final stage of Abutment Types I and II.
6. The following load cases are not applicable for retaining walls:
DC - Superstructure
DW - Superstructure and Abutment
Bearing Line Loads (LLIM, PL, WS, WL, BR, FR, CE, and parts of EQ)
Substructure Wind Loads (WSUB)
Chapter 3 Method of Solution
3-45
3.3.5 Eta Factor
The Eta () factor is the consideration of the ductility, redundancy and operational importance of the
structural component with respect to the margin of safety of the bridge. The application of the Eta factor
as per DM-4 differs from the AASHTO LRFD implementation. DM-4 states that the application of load
modifiers other than 1.0 have been found to have a detrimental affect on economical bridge designs
without a corresponding increase in comfort level. Use of load modifiers other an 1.0 require approval by
the Chief Bridge Engineer. The minimum Eta factor is assumed to be 1.0 and the maximum Eta factor is
assumed to be equal to 1.16
When load modifiers are allowed, the program applies the Eta factor based on each applied load rather
than applying one factor to all of the loads for the given limit state. If the applied load was factored by the
maximum load factor, the load contribution to the limit state response is multiplied by . If the applied
load was factored by the minimum load factor, the load contribution to the limit state response is divided
by , so as to reduce the response.
3.3.6 Average Load Factor
The average load factor is calculated by taking the sum of the factored loads for a limit state and dividing
by the sum of the unfactored loads for the same limit state. The program calculates the average load
factor for each load case and stage of a limit state. The average load factor is calculated for the
foundation only.
3.3.7 Earthquake Loading
The earthquake loads applied to the abutment emanate from three sources: the abutment mass-inertia
effect; the inertia effect of the soil; and, the forces transmitted from the superstructure.
It is typically acceptable to ignore the mass-inertia effect of the abutment (assuming that it is not
important). This effect is ignored in ABLRFD.
The unfactored earthquake loads (EQ) are calculated as per Section 3.3.2.22. The EQ loads are then
factored using the load factors specified in User Manual Table 3.3.4-2 for the Extreme I limit state.
For pile/caisson foundations, the Phi Factor Foundation input value from Section 6.35.3 is multiplied by
the pile/caisson lateral and axial resistance for Extreme Event I limit state only.
For spread footings on rock or soil, the Phi Factor Foundation input value from Section 6.35.3 is
multiplied by the bearing resistance for Extreme Event I limit state only.

Chapter 3 Method of Solution
3-46
Earthquake loads are not considered during the analysis of the Footing.
Chapter 3 Method of Solution
3-47
3.4 STABILITY
Each footing type has a unique set of checks for stability. The following sections identify the stability checks that
are evaluated for each footing type: spread, pedestal and pile.
3.4.1 Spread Footing Stability
The stability of spread footings considers: overturning, sliding, settlement, and bearing capacity. Each
type of check is described in the sections that follow.
3.4.1.1 Overturning (Eccentricity Check)
The eccentricity check examines the location of the resultant force relative to the toe of the footing. The
distance from the toe to the resultant, Xr, is calculated by dividing the net overturning moment (from both
horizontal and vertical loads) by the net vertical force as illustrated in the equation below:
VLF
HLM + VLM = X r
For spread footings on rock foundations, the resultant (R) should be situated in the middle three-quarters
of the footing base. For spread footings on soil foundations, the resultant (R) should be situated in the
middle half of the base as shown in Figure 1. The program calculates an allowable eccentricity and
verifies the eccentricity does not exceed the allowable by providing a performance ratio based on these
values.
3.4.1.2 Sliding Check for Spread Footings
The sliding check consists of comparing the factored sliding resistance to the applied horizontal force.
Sliding is not a problem if the factored resistance (R) is greater than the applied horizontal force (HLF)
as shown in the following equation:
φτR HLF
The horizontal force is determined from the minimum load case for all limit states and stages except for
the service limit state. The resistance factor is specified by the user in the SOI command. The
resistance is a function of the material in the top-most foundation layer and the concrete type of the
footing. The following sections identify how the sliding resistance is evaluated.
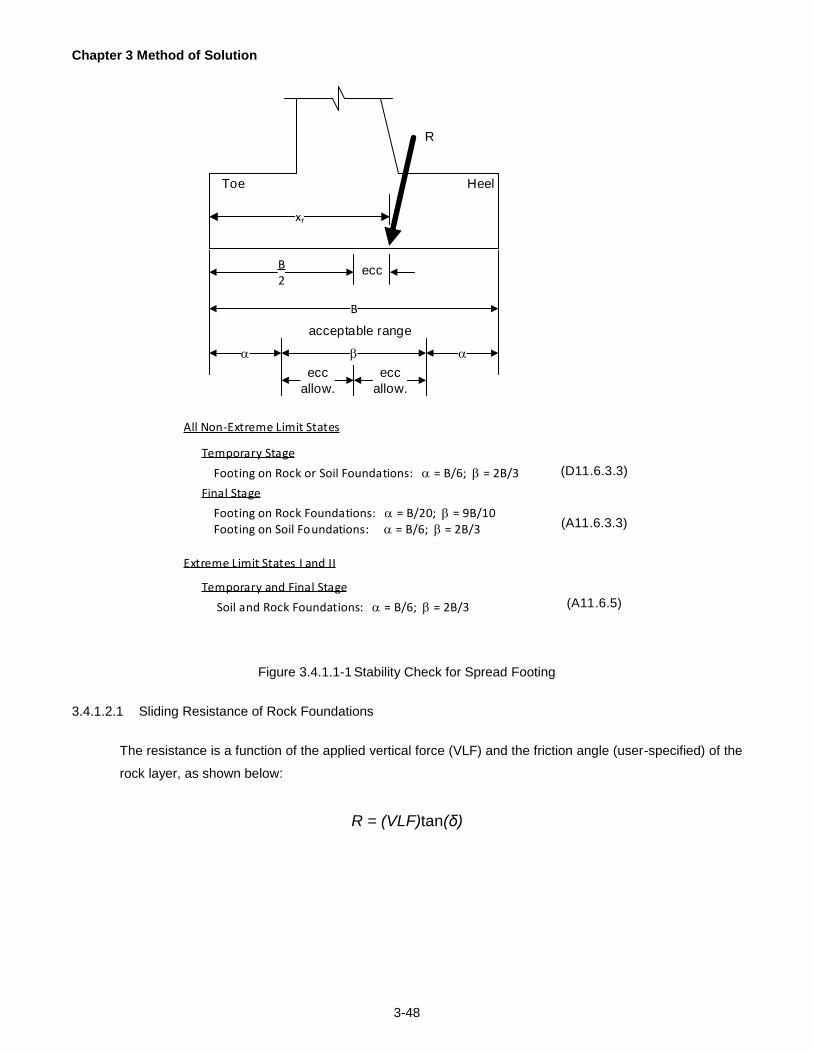
Chapter 3 Method of Solution
3-48
xr
R
Footing on Rock Foundations: = B/20; = 9B/10Footing on Soil Foundations: = B/6; = 2B/3
B2
ecc
acceptable range
B
Footing on Rock or Soil Foundations: = B/6; = 2B/3
Temporary Stage
Final Stage
Toe Heel
ecc
allow.
ecc
allow.
Soil and Rock Foundations: = B/6; = 2B/3
Extreme Limit States I and II
All Non-Extreme Limit States
Temporary and Final Stage(A11.6.5)
(D11.6.3.3)
(A11.6.3.3)
Figure 3.4.1.1-1 Stability Check for Spread Footing
3.4.1.2.1 Sliding Resistance of Rock Foundations
The resistance is a function of the applied vertical force (VLF) and the friction angle (user-specified) of the
rock layer, as shown below:
R = (VLF)tan(δ)

Chapter 3 Method of Solution
3-49
3.4.1.2.2 Sliding Resistance of Sand Foundations
The value of the cohesion of the soil layer is used to distinguish Sands from Clays. Sands have no
cohesion. The following equation is used for sands:
R = (VLF) tan A10.6.3.4-2
Where:
tan = tan φf for cast-in-place concrete
tan = 0.8 * tan φf for precast concrete footing
3.4.1.2.3 Sliding Resistance of Clay Foundations
The sliding resistance for clays (i.e., when cohesion > 0.0 and f = 0.) is based on the relative values of :
the undrained shear strength (Su); the effective bearing pressures in the footing at the toe (Tpreff) and the
heel (Hpreff) locations due to applied loads; and the location of the resultant applied force (Xr). Table 1
identifies the equations used to compute the unfactored sliding resistance of the soil.
Figure 1 illustrates the variables referenced in the Table 1. To find the equation that defines the sliding
resistance (defined in the third column); find the row in which Xr satisfies the condition in column 1; and Su
satisfies the condition(s) in column 2. Start at the first row and work downwards to find the applicable
case.
3.4.1.2.4 Sliding Resistance of Clayey-Sandy “C-Phi” Soils
For soils that have a non-zero cohesion and a non-zero friction angle, the sliding resistance is computed
as shown in the equations below:
R = (V) tan + CaBe D10.6.3.4P-3
Where:
1.0
C
0. +0.21C =
i
i
54Ca ( Ci in units of ksf) D10.6.3.4
tan = tan φf for cast-in-place concrete
tan = 0.8 * tan φf for precast concrete footing
The effective width Be is evaluated assuming that the pressure under the footing is uniformly distributed.
Hence it is computed as:
X
2
B 2 B = B re

Chapter 3 Method of Solution
3-50

Chapter 3 Method of Solution
3-51
Pressure Distribution
under Footing
Tpe
Hpe
B
xr
R
Note: Variables referenced in Table 3.4.1.2.3-1
Toe Heel
Figure 3.4.1.2.4-1 Illustration of Pressure Distribution Under Spread Footing

Chapter 3 Method of Solution
3-52
Table 3.4.1.2.4-1 Unfactored Sliding Resistance for Clays
Location of Resultant Shear Strength Condition Sliding Resistance
-- 2
H < S
pe
u &
2
T < S
pe
u
BS = R u
3
B < X r
2
T > S
pe
u XT
4
3 = R rpe
3
B < X r
2
T S
pe
u
DS 2
1 + D - X3 S = R uru
T
SX6 = D :where
pe
ur
3
2B > X r
2
H > S
pe
u
D S 2
1 + D - ) X - (B 3 S = R uru
H
S) X - (B 6 = D :where
pe
ur
3
2B > X r
2
H S
pe
u BT + H 4
3 = R pepe
3
2B X
3
Br
2
H > S
pe
u &
2
T > S
pe
u BT + H
4
1 = R pepe
3
2B X
3
Br
2
H > S
pe
u
DH2
1 +S
2
1 + D - B S = R peuu
H - T 2
1
BH 2
1 - S
= D :where
pepe
peu
Legend: Tpe, Hpe = Effective pressure at Toe and Heel; Xr = load resultant; Su = shear strength; B = footing width as illustrated in Figure 3.4.1.2.4-1. B is measured from the Toe towards the Heel.
Note: Table continues on next page.

Chapter 3 Method of Solution
3-53
Table 3.4.1.2.4-1 Unfactored Sliding Resistance for Clays (cont.)
Location of Resultant Shear Strength Condition Sliding Resistance
3
2B X
3
Br
2
H S
pe
u
DT2
1 +S
2
1 + D - B S = R peuu
T - H 2
1
BT 2
1 - S
= D :where
pepe
peu
Legend: Tpe, Hpe = Effective pressure at Toe and Heel; Xr = load resultant; Su = shear strength; B = footing width as illustrated in Figure 3.4.1.2.4-1. B is measured from the Toe towards the Heel.
3.4.1.3 Settlement of Spread Footings
There are three components to the total settlement of spread footings, namely: elastic, consolidation, and
secondary. The total settlement for Rock and Sand foundations consists of the elastic settlement only;
the consolidation and secondary settlements are computed for clay and c-phi soil foundations only. Clays
and c-phi soils are distinguished from sands by their non-zero cohesive (or undrained) strength.
If the undrained shear strength (Su) of clay is less than 4.35 psi the clay is considered to be too soft to be
used as a foundation material and the program will exit after printing an error message. A c-phi soil is
considered to be too soft to be used as a foundation material if the cohesive strength is less than 4.35 psi
and the friction angle is less than 20 degrees.
The uniform bearing pressure (q) used for the elastic settlement equation is determined from the service
limit states only. The bearing pressure is computed using the effective width (please refer to the previous
section for a definition of effective width). This width is also used to compute the pressure for the
consolidation and secondary settlement calculations.
The consolidation settlement uses a bearing pressure that is also based on the service limit states.
However, in this case, the live load and LS load are not considered in the load combinations.
The following section describes how each component of the total settlement is calculated.

Chapter 3 Method of Solution
3-54
3.4.1.3.1 Elastic Settlement
The elastic settlement for a single layer of soil or rock is computed according to the following equation (up
to 2 layers of soil maybe input into the program):
reff X
BB = B
221
For a rock foundation on a rectangular footing:
The program uses the lesser of the input rock mass modulus and input intact elastic modulus
𝐸𝑚 = 𝑀𝐼𝑁(𝐸𝑚(𝑖𝑛𝑝𝑢𝑡), 𝐸𝑖)
B
L = x
eff
eff
1
1
1.0271 + 0.0438x + x0.0005 = 2
z
β
x = I
z
p
I v1 B = CF p2ceff 1
Se=(CF)qo
Em D10.6.2.4.4-3
For a soil foundation on a rectangular footing:
E = Ems
CF = o 1 Beff1
E
q (CF) = S
ms
0e D10.6.2.4.2-1
Where: o and 1 are the influence factors based on Christian and Carrier’s work (Figure 1).
1 includes the elastic effects of a Poisson's Ratio of 0.5
o is set to 1.0. Reference DM-4 Sect 10.6.2.4.2

Chapter 3 Method of Solution
3-55
D10.6.2.4.2-1
Figure 3.4.1.3.1-1 Settlement Influence Factor based on Christian and Carrier
The elastic settlement for two layers of soil as computed based on one of the following three scenarios:
Scenario 1: If soil layer 2 (lower layer) is much stiffer than the soil layer 1 (top layer), i.e., if E2 > 10E1, the
settlement is calculated as a single layer using the properties of soil layer 1 (top layer). The depth of soil
layer 1 is only considered for elastic settlement. The settlement adjustment factor used (shown below) is
the same as for a single soil layer.
CF = o 1 Beff1
Scenario 2: If the lower layer (soil layer 2) is softer than the upper layer (soil layer 1), i.e. E2 < E1, the
settlement is calculated using the properties of the lower layer (soil layer 2) and the adjustment factor
(CF) is based on the properties of the top layer (soil layer 1) as shown in the equation below:
CF = Cd o 1 Beff1
Where: is interpolated from Table 3.4.1.3.1-1.
Cd is interpolated from Table 3.4.1.3.1-2.
ois set to 1.0.
1 is a function of: the ratio of depth of soil layer 1 (top layer) to the effective width
(H/Beff1); and the ratio of the length of the footing to the effective width (Leff1/Beff1) of the
footing. (Note: For scenario 2, the H/Beff is set to 1000 for calculation of 1 only.) The
depth of soil used is limited to six times the width of the footing.
0
0.5
1
1.5
2
-1 0 1 2 3
μ1
Log(H/Beff)
Settlement Influence Factor μ1
Leff/Beff = Leff/Beff = 10
Leff/Beff = 5
Leff/Beff = 2
Leff/Beff = 1

Chapter 3 Method of Solution
3-56
The alpha factor used in the Adjustment Factor (CF) for the Scenario 2 is based on a round footing. The
Cd factor is based on a rectangular footing and is used as an approximate correction between the round
and rectangular footing. This may lead to exaggerated settlement values under certain conditions.
Table 3.4.1.3.1-1 Elastic Distortion Settlement Factor – (From Table 4.4 of {FDNHBK})
E1/E2
Hi/B
eff
1 2 5 10 100
0.0 1.000 1.000 1.000 1.000 1.000
0.1 1.000 0.972 0.943 0.923 0.760
0.25 1.000 0.885 0.779 0.699 0.431
0.5 1.000 0.747 0.566 0.463 0.228
1.0 1.000 0.627 0.399 0.287 0.121
2.5 1.000 0.550 0.274 0.175 0.058
5.0 1.000 0.525 0.238 0.136 0.360
1.000 0.500 0.200 0.100 0.010
Table 3.4.1.3.1-2 Shape and Rigidity Factor – Cd ( From Table 4.1 of {FDNHBK})
Cd
for settlements at center of rectangle
Leff/Beff = 1.0 1.12
Leff/Beff = 1.5 1.36
Leff/Beff = 2.0 1.52
Leff/Beff = 3.0 1.78
Leff/Beff = 5.0 2.10
Leff/Beff = 10 2.53
Leff/Beff = 100 4.00
Leff/Beff = 1000 5.47
Leff/Beff = 10000 6.90
Scenario 3: If neither scenario described above applies, then the elastic settlement is equal to the sum of
the settlement for each layer. The settlement for each layer is calculated by applying the properties of
each layer in the formulation of the single layer soil described earlier. However, the thickness of the lower

Chapter 3 Method of Solution
3-57
layer of soil will be the lesser of H2 and (6B - H 1). For the lower layer, the pressure and effective width of
the footing used in the settlement equation are determined by the following relations:
H+B = B 1eff1eff2
2
1
2
1
eff
eff
eff
eff
12L
L
B
Bq = q
H+L = L 1eff eff12
The relationship between Beff1 and Beff2 is illustrated in Figure 2. Since the loads entering the footing are
always perpendicular to the length of the foundation, the Leff1 length is equal to the total length of the
footing due to lack of eccentricity in the length plane.
Soil Layer 1
Soil Layer 2
Beff2
Beff1
H1
H2
1
2
Footing
H2 not to exceed (6B-H 1)
footing width (B)
B
L
Leff1 = L
Leff2
Figure 3.4.1.3.1-2 Considerations for Settlement for Two Layers of Soil
3.4.1.3.2 Consolidation Settlement of Clays (and C- φ Soils)
Consolidation Settlement is calculated for clay soils when water is present in the soil layer(s). This
settlement is a result of the excess water being forced out of the layer, allowing the soil to increase in
density. The program however, always assumes the soil layer(s) are saturated and will consider the entire
layer for consolidation regardless of water presence. It is possible to exclude the effects of primary
consolidation for a layer by setting Cc and Ccr to zero for that layer. Also it is important to note that the
settlement calculations performed by the program do not consider effects of an adjacent embankment (
for more information refer to Section 6.20). The consolidation settlement is calculated by subdividing each
clay and (and C -φ soil) layer. The number of sublayers is calculated by dividing the layer thickness by 5
ft (1.5m) and rounding to the nearest integer. The consolidation settlement (Sc) is equal to the sum of the
consolidation settlement (Sci) for each sublayer.

Chapter 3 Method of Solution
3-58
The depth of soil considered for the settlement is restricted to the lesser of: the depth of the lower soil
layer or 6 * B below the bottom of footing.
The Final Effective Stress of each soil sublayer is computed using the Boussinesq Equation (equation 5-8
of [BOWLES]) based on the corner of a rectangular region.
Initial Effective Stress
Layer 1
1111 '' wwsatoo HZ
Layer 2
21222 )('' wwsatoo HHZ
Maximum Past Effective Stress
Layer 1
1'p The interpolated value between 'p1 Top and 'p1 Bottom at Z
Layer 2
2'p The interpolated value between 'p2 Top and 'p2 Bottom at Z
Final Effective Stress
Layer 1
1)(11 ''4' oZfactff L
Layer 2
2121111)(12 )(''4' wwsatwwsatoZfactff HHZHHL
Where: Z = Distance from the bottom of footing to center of sublayer (Figure 1).
Hw1 = Height of water above center of sublayer in Layer 1 (Figure 1)
Hw2 = Height of water above center of sublayer in Layer 2 (Figure 1)
Hw1 and Hw2 are limited to the maximum height of the soil layer.
’o1 & ’o2 = Initial effective stress at center of soil sublayer (ksi)
’p1 & ’p2 = Maximum past effective stress at center of soil sublayer (ksi)
’f1 & ’f2 = Final effective stress at center of soil sublayer (ksi)
'o1t & 'o2t = Initial effective stress at top of soil layer (input) (ksi)
Sc = Sc i
nsub
1 = i

Chapter 3 Method of Solution
3-59
'p1 top & 'p2 top = Maximum past effective stress at top of soil layer (input) (ksi)
'p1 bottom & 'p2 bottom = Maximum past effective stress at bottom of soil layer (input) (ksi)
'f1t = Final effective stress at top of soil layer 1 (ksi)
Soil Layer 1
Soil Layer 2
Footing
Center of
Sublayer in Layer 2
Z
Hw2
Hw1
H1
H2
Figure 3.4.1.3.2-1 Description of Z and Hw values
The influence factor used in the equation is calculated as per equation 5-8 of [Bowles]. The influence
factor is based on the geometry of the footing and always uses the effective dimensions of the foundation
at the bottom of the footing. The factor is a function of the footing geometry and the depth of the soil layer
as shown below:
p-q
qp +
q
1+q
q+p
qp
4
1 = L
2
1-
2fact
2tan
2
π
Where: Z
L = n
eff 15.0
Z
B = m
eff 15.0
mn = p
1+n+m = q 22
When p2 > q, the tan-1 term is negative and it is necessary to add .
Arc Tangent is in Radians

Chapter 3 Method of Solution
3-60
The effective soil pressure is evaluated for each sub-layer. It is used with the compression index (Cc),
recompression index (Ccr), and void ratio (eo) at initial vertical effective stress to compute the
consolidation settlement for the I th sub-layer as show below. The Ccr and Cc values used by the program
are based on the void ratio definition.
For Over-Consolidated Soils )''( op
σ'σ'σ'
σ'log
σ'
σ'log
Δpf
p
f
c
o
p
cr
o
i > if C + C e+1
h = Sc
σ'σ'σ'
σ'log
Δpf
o
f
cr
o
i if C e+1
h = Sc
For Normally-Consolidated Soils )''( op
C e+1
h = Sc
p
f
c
o
i
σ'
σ'log
Δ
For Under-Consolidated Soils )''( op
The ABLRFD program does not consider settlement for Under-
Consolidated soil. If Under-consolidation is encountered, the input file
should be checked for errors. Hand calculations are required along with
approval from the Chief Bridge Engineer. If Under-Consolidation is
detected during a design run, a warning will be issued and primary
consolidation settlement will be calculated assuming a normal
consolidation condition.
For the total settlement of the first layer of soil only, a settlement factor based on the average over
consolidation ratio (OCR) is applied. The OCR is computed for each sublayer and the average is then
applied to the figure below. This factor is based on Figure A10.6.2.4.3-3

Chapter 3 Method of Solution
3-61
A10.6.2.4.3-3
Figure 3.4.1.3.2-2 Consolidation Settlement Reduction Factor
ccc SS 11
If the total settlement is less than zero, the program will provide a secondary calculation for total
settlement which combines the elastic and secondary settlement values for the total settlement.
scet SSSS 1
set SSS 2
3.4.1.3.3 Secondary Settlement of Clays (and C-φ Soils)
The secondary settlement is calculated using the same sublayers as for the consolidation settlement.
The secondary settlement (Ss) is equal to the sum of the secondary settlement (Ss i) for each sublayer.
This settlement starts at the end of primary consolidation settlement.
Ss=Ss i
nsub
=1i
The secondary settlement is a function of the: coefficient of secondary compression (C); the time interval
(t2, t1) for which the settlement is being computed; and, the thickness of the sub-layer. The Coefficient of
Secondary Compression used by the program is based on the Strain definition:
t
t C h =Ss
1
2i log

Chapter 3 Method of Solution
3-62
3.4.1.3.4 Allowable Settlement
The acceptable total settlement is set by the program to a default value of 1 inch. The user may override
this value (See the SOI and RCK commands in Chapter 5). However, a warning message is still issued if
the total settlement exceeds the program default value of allowable settlement.
3.4.1.4 Bearing Capacity Check
The bearing capacity check consists of comparing the factored bearing resistance of the soil (or rock)
foundation to the factored applied loads at the bottom of footing level. The check is evaluated for all
applicable limit states / stages / load cases. The applied pressure due to the factored applied loads
depends on several factors and is described in Section 3.4.1.4.3.
3.4.1.4.1 Bearing Capacity of Rock Foundations
The user is responsible for specifying the bearing capacity of rock foundations. The capacity is specified
using the RCK command in Chapter 5.
3.4.1.4.2 Bearing Capacity of Clay and Sand Foundations
The bearing capacity of soft soils is not computed. The definition of a soft soil can be found in Section
3.4.1.3 (discussion of settlement).
The factored bearing capacity of the soil is the lesser value of qult and [(0.7)(0.85)(f'c)] for all limit states
except Service. For service limit states the factored bearing capacity is the lesser value of (1.0)*qult and
[(1.0)(0.85)(f'c)]. For multi-layer soils, qult is typically calculated using properties based on a “weighted
average” of the soil layers, except when a multi-layer capacity is used.
The effective footing width and length values are used in the bearing capacity calculations as defined in
A10.6.1.3
The depth to the ground water level from the bottom of the footing (Zw) is used in the bearing capacity
calculations and is based on the back water level entered on the AT1, AT2, AWB, or RWL command
cards. This value will be less than zero when the water level is above the bottom of the footing.
The program classifies all soil into one of 4 Soil Classifications. Three of the soil classifications contain 3
Soil Conditions. The table on the following page lists the categories and conditions for soil typing.

Chapter 3 Method of Solution
3-63
Table 3.4.1.4.2-1 Soil Categories and Conditions
Soil Category
Soil Condition
Number of
Layers
Clay
f=0 & c=0 & Su>0
Sand
20<f<60 & c=0
& Su=0
f>0 & c>0
& Su=0
Condition Description *
1 1 1 Clay, Sand, or Mixed Layer One layer of clay,
sand, or mixed Single Layer
2
2 2 Two
Layers c1 < c2
Weak Clay over Strong Clay
3 2 Two
Layers c1 > c2
Strong Clay over Weak Clay
9 2 One
Layer
One Layer
One Layer Clay One Layer Mixed
Mixed Soil with Clay - Undrained
3
4 2
One Top
Layer
One Bottom Layer
One Top
Layer D > H1
Clay or Mixed Soil over Sand
One Bottom Layer
One Top
Layer
One Bottom Layer
D > H1
Sand over Clay or Mixed Soil
f1 < 25 O or
f1 > 50 O)
Two
Layers D > H1
Mixed Soil over Mixed Soil
5 2
One Top
Layer
One Bottom Layer
One Top
Layer D ≤ H1
Clay or Mixed Soil
over Sand
One Bottom Layer
One Top
Layer
One Bottom Layer
D ≤ H1
Sand over Clay or
Mixed Soil
f1 < 25 O or
f1 > 50 O)
Two
Layers D ≤ H1
Mixed Soil over
Mixed Soil
8 2 One
Bottom Layer
One Top Layer
One Bottom Layer
Top Layer Sand over a Bottom Layer of Clay or Mixed Soil
Sand over Clay or Mixed Soil
25 O≤f1 ≤ 50 O)
4
6 2 Two
Layers H1 < 2B' & f1 > f2
Dense Sand over Loose Sand
7 2 Two
Layers H1 < 2B' & f1 < f2
Loose Sand over Dense Sand
10 2 Two
Layers H1 ≥ 2B' Two Sand Layers
* To better clarify the calculations, the categories will be sub-divided into Soil Conditions below. The
calculations are displayed in reverse order meaning the main bearing equation is listed first, then all
secondary equations used to determine the main equation are listed after.

Chapter 3 Method of Solution
3-64
Qult
Df1
D
B
α
Df2
Top of Layer 2
H1
Figure 3.4.1.4.2-1 Df definition (from Bowles Second Edition Figure 4-3)
Category Independent Calculations
The following shows calculations for values generally used by most Categories and Soil Conditions
Bearing Resistance = qult*, where is the strength reduction factor applied to bearing resistance
245tan'B5.0D f Effective Shear Depth D10.6.3.1.2gP-6
D
tanHDtanHtan 2if11if11
f
Average Soil Friction Angle for multiple Layers (Bowles
Section 4-8, Fourth Edition)
245tan 2tan f
qfeN
DC10.6.3.1.2a-1P
BeBB 2' If eB or eL are < 0 then; eB = |-eB| and eL = |-eL| A10.6.1.3-1
LeLL 2' Note: L' = L since eL is always 0 A10.6.1.3-2
3.4.1.4.2.1 Category 1 - Soil Condition 1: Single Soil Layer
For bearing resistance the equations used are shown below.
qult=cNcscic+0.5γ𝐵′Nγsγiγ+γDfNqsqiq D10.6.3.1.2a-10P

Chapter 3 Method of Solution
3-65
Input for Condition 1 - Single Layer
m = im
sat = isat
f = if
c = ci
Df = Df1
Calculation of Gamma (
wsat'
If Zw is 0
= ' D10.6.3.1.2gP-3,7
If 0< Zw < B' and f < 37O
''B
Z' m
w D10.6.3.1.2gP-2
Where m is the moist unit weight of soil
If Zw ≥ B' and f < 37O and Zw ≥ D
m D10.6.3.1.2gP-1,4
If 0< Zw < B' and f ≥ 37O and Zw <D
2
22
'2 w
mw
w ZDDD
ZZD
D10.6.3.1.2gP-5
Calculation of Nc, Nq, and N
If Footing on or near slope
Nc = Ncq A10.6.3.1.2c
N= Nq A10.6.3.1.2c
Nq = 0.0 A10.6.3.1.2c-1
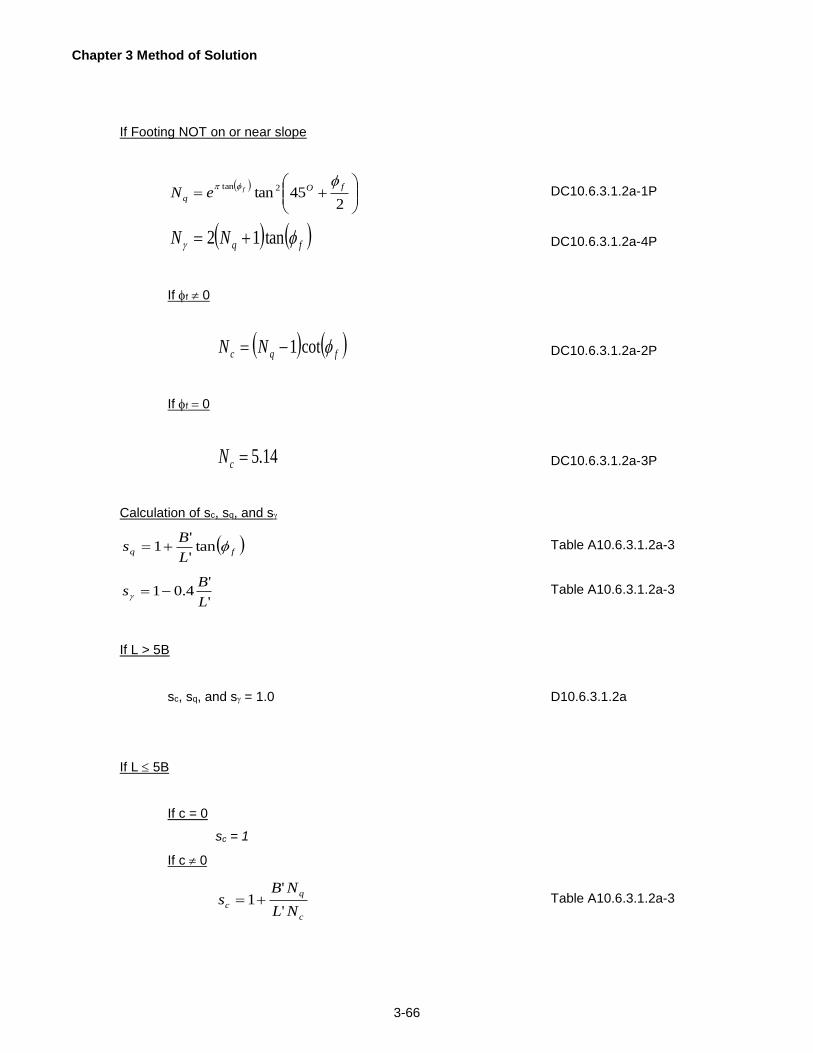
Chapter 3 Method of Solution
3-66
If Footing NOT on or near slope
245tan 2tan fO
qfeN
DC10.6.3.1.2a-1P
fqNN tan12 DC10.6.3.1.2a-4P
If f 0
fqc NN cot1 DC10.6.3.1.2a-2P
If f 0
14.5cN DC10.6.3.1.2a-3P
Calculation of sc, sq, and s
fqL
Bs tan
'
'1 Table A10.6.3.1.2a-3
'
'4.01
L
Bs
Table A10.6.3.1.2a-3
If L > 5B
sc, sq, and s = 1.0 D10.6.3.1.2a
If L 5B
If c = 0
sc = 1
If c 0
c
q
cNL
NBs
'
'1 Table A10.6.3.1.2a-3

Chapter 3 Method of Solution
3-67
Calculation of ic, iq, and i
If Hu = 0.0
ic, iq, and i = 1
If Hu 0.0
O90 Based on Figure AC10.6.3.1.2a-1
22 sin
'
'1
'
'2
cos
'
'1
'
'2
L
BL
B
B
LB
L
n
A10.6.3.1.2a-9
= 0.001 degrees Angle tolerance
n
fu
uq
)cot(c'L'BV
H1i
A10.6.3.1.2a-7
1n
fu
u
)cot(c'L'BV
H1i
A10.6.3.1.2a-8
If f = 0
c
uc
cNLB
nHi
''1 A10.6.3.1.2a-5
If f 0 and c = 0
ic = 0.0
If f 0 and c 0
1
1
q
q
qcN
iii Based on A10.6.3.1.2a-6 and
DC10.6.3.1.2a-2
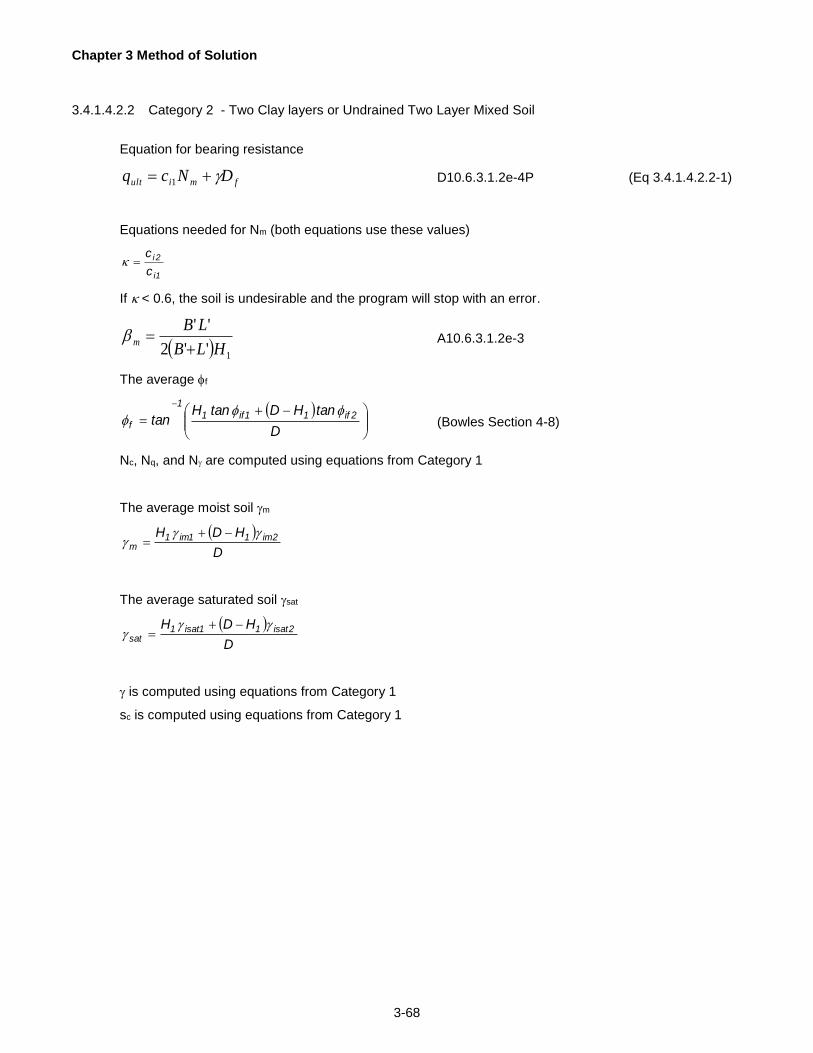
Chapter 3 Method of Solution
3-68
3.4.1.4.2.2 Category 2 - Two Clay layers or Undrained Two Layer Mixed Soil
Equation for bearing resistance
fmiult DNcq 1 D10.6.3.1.2e-4P (Eq 3.4.1.4.2.2-1)
Equations needed for Nm (both equations use these values)
1i
2i
c
c
If < 0.6, the soil is undesirable and the program will stop with an error.
1''2
''
HLB
LBm
A10.6.3.1.2e-3
The average f
D
tanHDtanHtan 2if11if1
1
f
(Bowles Section 4-8)
Nc, Nq, and N are computed using equations from Category 1
The average moist soil m
D
HDH 2im11im1m
The average saturated soil sat
D
HDH 2isat11isat1sat
is computed using equations from Category 1
sc is computed using equations from Category 1

Chapter 3 Method of Solution
3-69
Category 2: Soil Condition 2 - Weaker clay over stronger clay - Undrained
Soil Correction Factor for use in Equation 3.4.1.4.2.2-1
11111
1111 2
cmcmcmcmc
mcmcmccm
NNNNN
NNNNN
(Eq 3.4.1.4.2.2-2)
(Winterkorn and Fang 3.37)
Category 2: Soil Condition 3 - Stronger clay over weaker clay - Undrained
Soil Correction Factor for use in Equation 3.4.1.4.2.2-1
cc
m
m NsN
1
A10.6.3.1.2e-1 (Eq 3.4.1.4.2.2-3)
If Nm scNc
ccm NsN A10.6.3.1.2e-1
Category 2: Soil Condition 9 - Mixed Soil with Clay - Undrained
When c1 c2
Use Equation 3.4.1.4.2.2-2 for Nm
When c1 >c2
Use Equation 3.4.1.4.2.2-3 for Nm
3.4.1.4.2.3 Category 3 – Sand over Clay or Mixed Soil / Clay or Mixed Soil over Sand
Category three uses 3 conditions to determine the bearing pressure: Conditions 4, 5 and 8.
Category 3: Soil Condition 4 - Clay or Mixed Soil over Sand / Sand over Clay or Mixed Soil - D > H1
The Sand over Clay or Mixed condition will only occur when the if1 is between 20O and 25O or greater
than 50O. A Mixed soil over Mixed soil case may also occur for this condition.
The following values are used in the Single layer equation. The values of the soil properties are averaged.
The Maximum Depth that bearing is effective to
245tan
2
'BD 1if
Chapter 3 Method of Solution
3-70
Three Conditions Control H
H1 > D, 0h
H1+H2 > D, 1HDh
H1+H2 < D, 2Hh
The average cohesion value is calculated
hH
hcHcc ii
1
211 )( (Bowles Section 4-8)
The average f
hH
hH ifif
f
1
2111tantan
tan
(Bowles Section 4-8)
The average moist soil m
hH
hH imim
m
1
211
The average saturated soil sat
hH
hH isatisat
sat
1
211
Df = Df1
Compute Bearing Resistance following procedure for Soil Condition 1
Category 3: Soil Condition 5 - Clay or Mixed Soil over Sand / Sand over Clay or Mixed Soil - D H1
The Sand over Clay or Mixed condition will only occur when the if1 is between 20O and 25O or greater
than 50O. A Mixed soil over Mixed soil case may also occur for this condition.
The following values are used in the Single layer equation. The values of the soil properties for use in the
single layer equation are shown below. These values are used to calculate qult for the first layer
1icc
1iff
1imm
1isatsat

Chapter 3 Method of Solution
3-71
Df = Df1
Compute bearing resistance "qult1” following procedure for Soil Condition 1
The following values are used in the Single layer equation. The values of the soil properties for use in the
single layer equation are shown below. These values are used to calculate qult for the second layer
2ic67.0c A10.6.3.1.2b-1
2if1
f 67.0tan A10.6.3.1.2b-2
2imm
2isatsat
Df = Df2
Compute bearing resistance "qult2 " following procedure for Soil Condition 1
Then the critical Height is calculated
'
'12
ln'32
1
L
B
q
qB
Hult
ult
crit A10.6.3.1.2d-1
If critHH 1 Then
1ultult qq
If critHH 1 Then qult is calculated using the equation below
1if2
1if2
sin1
sin1K
A10.6.3.1.2f-2
01.0
tan1
tan1
11
'tan
'
'12
112
11
where
cK
ecK
qq if
B
HK
L
B
ifultult
if
A10.6.3.1.2f-1
If qult > qult1
qult = qult1
Category 3: Soil Condition (8) - Sand over Clay or Mixed Soil – 20 ≤ if1 ≤ 50
The following values are used in the Single layer equation. The values of the soil properties for use in the
single layer equation are shown below. Then the qult for layer one is calculated based on the following
values

Chapter 3 Method of Solution
3-72
1icc
1iff
1imm
1isatsat
Df = Df1
Compute bearing resistance "qult1” following procedure for Soil Condition 1
These values are used to calculate qult for the second layer
2ic67.0c
2if1
f 67.0tan
2imm
2isatsat
Df = Df2
Compute bearing resistance "qult2” following procedure for Soil Condition 1
Then the qult is calculated using the equation shown below
''
'167.0
24,
1
B
H
L
B
ulteqult eqq
AC10.6.3.1.2f-1
Then the critical Height is calculated
'
'12
ln'32
1
L
B
q
qB
Hutl
ult
crit A10.6.3.1.2d-1
If critHH 1 or 14, ulteqult qq Then
1ultult qq
Otherwise
4,exultult qq

Chapter 3 Method of Solution
3-73
3.4.1.4.2.4 Category 4 - Loose over Dense Sand or Dense over Loose Sand
Category four uses 3 conditions to determine the bearing pressure. Condition 6 and 7 are used when the
effective depth of bearing reaches the second layer of soil. Condition 10 is reserved for when the effective
depth of bearing does not reach the second layer
The following values are used in the Single layer equation. The values of the soil properties for use in the
single layer equation are shown below. These values are used to calculate qult for the first layer
1icc
1iff
1imm
1isatsat
Df = Df1
Compute bearing resistance "qult1” following procedure for Soil Condition 1
Retain 1 from qult1 for use in qult2
𝛾1𝑓 = 𝛾1
If H1 >= 2B'
Category 4: Soil Condition 10 - Two Sand Layers where H1 2B'
Then qult = qult1
If H1 < 2B'
Then compare if1 to if2 to determine if Soil Condition 6 or 7 controls
Category 4: Soil Condition 7 – Loose over Dense Sand where H1 2B' and (f1 <f2)
The following equation is used to calculate qult2.
𝜙𝑓 = 𝜙𝑖𝑓2
𝛾𝑚 = 𝛾𝑖𝑚2
𝛾𝑠𝑎𝑡 = 𝛾𝑖𝑠𝑎𝑡2
The 2, N2, S2, i2, Nq2, Sq2 and iq2 are computed following procedures in Section 3.4.1.4.2.1.
𝑞𝑢𝑙𝑡2 = 0.5𝛾2𝐵′𝑁𝛾2𝑠𝛾2𝑖𝛾2 + 𝛾1𝑓𝐷𝑓1𝑁𝑞2𝑠𝑞2𝑖𝑞2
This equation is derived from DAS equation 11.55 except the unit weight of the top layer is used

Chapter 3 Method of Solution
3-74
to determine the overburden.
The following equation is used to calculate qult.
2
1121
'21
B
Hqqqq ultultultult (DAS 11.54)
Category 4: Soil Condition 6 - Dense over Loose Sand where H1 2B’ and (f1 f2)
The following equations are used in the qult calculation
245taneN 1if2tan
1q1if
DC10.6.3.1.2a-1
1if1q1 tan1N2N DC10.6.3.1.2a-4
245taneN 2if2tan
2q2if
DC10.6.3.1.2a-1
2if2q2 tan1N2N DC10.6.3.1.2a-4
'1 = isat1 - w
'2 = isat2 - w
The following chart is used to determine Ks . The chart is from Principals of Geotechnical
Engineering by Braja M. Das, Third Edition

Chapter 3 Method of Solution
3-75
Figure 3.4.1.4.2.4-1 Punching Shear Coefficient Graph (Ks)
Then the bearing equation is determined by looking at the L’/B’
The following equation is used to calculate qult2.
𝜙𝑓 = 𝜙𝑖𝑓2
𝛾𝑚 = 𝛾𝑖𝑚2
𝛾𝑠𝑎𝑡 = 𝛾𝑖𝑠𝑎𝑡2
The 2, N2, S2, i2, Nq2, Sq2 and iq are computed following procedures in Section 3.4.1.4.2.1.
𝑞𝑢𝑙𝑡2 = 0.5𝛾2𝐵′𝑁𝛾2𝑠𝛾2𝑖𝛾2 + 𝛾1𝑓𝐷𝑓2𝑁𝑞2𝑠𝑞2𝑖𝑞2 (DAS 11.48)
If L’ >5*B’ then the following equation is used to calculate bearing resistance
qult=qult2+γ1' (H1)2 (1+
2Df1
H1)
Kstan(ϕif1)
B' -γ1' H1 ≤qult1 (DAS 11.44)
If L’ 5*B’ the following equation is used to calculate bearing resistance
qult=qult2+ (1 +𝐵′
𝐿′) γ1
' (H1)2 (1+2Df1
H1)
Kstan(ϕif1)
B' -γ1' H1 ≤qult1 (DAS 11.46)
0
5
10
15
20
25
30
35
40
0 0.2 0.4 0.6 0.8 1
Ks
Variation of Ks - Punching Shear Coefficient
45o
42
40
3735
3025
if1=5
('2)(N2)/('1)((’2)(N2)/(’1)(N1)
if1=50O

Chapter 3 Method of Solution
3-76
3.4.1.4.3 Applied Bearing Pressure
The applied bearing pressure due to the factored applied loads for rock foundations is the greater of the
toe (Toprp) and heel (Hlprp) pressure is used.
For all soils (sands, clays, and C-φ), the applied bearing pressure due to the factored applied loads is
based on a uniform distribution so that it is equal to VLF/Beff.
3.4.2 Pedestal Footing Stability
The footing on pedestal is checked for overturning (eccentricity), bearing pressure, and sliding. The
pedestal itself is checked for overturning (eccentricity), bearing pressure and settlement.
3.4.2.1 Pedestal Footing Overturning / Eccentricity Check
The eccentricity of the load resultant is compared to the acceptable range in DM-4. All load
combinations except for the EXTREME-I limit state and the temporary stage construction condition for
retaining walls is checked.
The eccentricity check is very similar to that of a spread footing on a rock foundation. The base width
(instead of the footing width) is used for footings situated on pedestals. The base width is that portion of
the footing width that is in contact with the pedestal i.e. it is equal to footing width minus the back offset.
Hence the eccentricity is measured relative to the center of the footing contact length (i.e. base width).
Figure 1 illustrates the acceptable range for the location of resultant (R). The resultant must lie in the
middle three-quarters of the footing contact length for the final stage and in the middle two-thirds of the
footing contact length for the temporary stage. The following are acceptable values for α and β shown in
Figure 1.
Non-Extreme Limit States
20
αbw
= and 10
9β
bw = (Final Stage) (A11.6.3.3)
6
bw = α and
3
2bw = β (Temporary Stage) (D11.6.3.3)
Extreme Limit States
6
αbw
= and 3
2β
bw = (Temporary and Final Stage) (A11.6.5)

Chapter 3 Method of Solution
3-77
The program calculates an allowable eccentricity and verifies the eccentricity does not exceed the
allowable by providing a performance ratio based on these values.
bw
2
acceptable range
xr
Rtoe heel
front back
PEDESTAL
FOOTING
STEM
xresp
Rped
pw
2eccp
ecc
back offset
bw
pw
acceptable range
Figure 3.4.2.1-1 Stability Check for Pedestal Footing and Pedestal

Chapter 3 Method of Solution
3-78
3.4.2.2 Pedestal Footing Bearing Pressure Check
The bearing pressure check of the footing consists of comparing the bearing resistance of the pedestal
concrete (Pmax), to the maximum applied pressures (maxpr) at the toe and heel locations. The applied
pressure is adjusted by the pedestal center-to-center spacing (ccp) and thickness (th), as shown in the
following equation. The pedestal footing bearing pressures that appear in the program output are shown
on a per unit width basis.
)hlpr,(topr th
ccp = Pressure Maximum ppMAX
Where the maximum resistance of the pedestal concrete (pmax) is computed by the equation below:
'max f))(0.85( = P c
Where:
∅ = 1.0 for the Service limit state
= 0.7 for all other limit states
Toe (toprp) and heel (hlprp) pressures are computed assuming that a linear pressure distribution exists
under the footing. The pressure is a function of the location of the load resultant (see previous section).
The maximum pressure at the toe and heel locations is determined from the final stage of all applicable
load combinations.
If the load resultant is within the toe side of one third of the base width, the pressures are:
X3
2VLF = topr
r
p
0.0 = hlprp
If the load resultant is situated in the heel side of one third of the base width, the pressures are:
0.0 = toprp
X-3bw
2VLF = hlpr
r
p
If the load resultant is within the center middle third of the base width, the pressures are:
bw
6ecc+1
bw
VLF = topr
p

Chapter 3 Method of Solution
3-79
bw
6ecc1
bw
VLF = hlpr
p
3.4.2.3 Pedestal Footing Sliding Stability
Sliding of the footing on the pedestal is checked by evaluating the ratio of the Vertical Force to Horizontal
Force. A ratio greater than or equal to two (2.0) is acceptable as shown in the equation below. The
forces are determined from the service limit state, final stage.
2.0 HLF
VLF
Sliding of the pedestal on the rock foundation is not checked because only the vertical force, due to the
weight of the pedestal, will increase, thus increasing the value of the ratio.
3.4.2.4 Pedestal Overturning / Eccentricity Check
For pedestal foundations, the resultant (R) must lie in the middle two-thirds of the pedestal width for the
temporary stage. The following are acceptable values for and shown in Figure 3.4.2.1-1.
Non-Extreme Limit States
20
αpw
= and 10
9β
pw = (Final Stage) (A11.6.3.3)
6
pw = α and
3
2pw = β (Temporary Stage) (D11.6.3.3)
Extreme Limit States
6
αbw
= and 3
2β
bw = (Temporary and Final Stage) (A11.6.5)
The program calculates an allowable eccentricity and verifies the eccentricity does not exceed the
allowable by providing a performance ratio based on these values.
3.4.2.5 Pedestal Bearing Pressure Check
Pedestals are assumed to bear on rock only. The bearing capacity of the foundation is a function of the
pressure distribution under the pedestal. The type of pressure distribution (uniform, linear variation) is
determined by the strength of the rock foundation. The terms “front” and “back” refer to the front and
back of the pedestal (they are analogous to the toe and heel locations in the footing). The weight of the
pedestal is considered in the bearing pressure check calculations. The bearing pressure check is not
evaluated for the temporary stage.
The bearing pressure check of the pedestal is evaluated by computing the pressure distribution under the
pedestal for each load combination and comparing the front and back pressures to the bearing capacity

Chapter 3 Method of Solution
3-80
of the rock foundation. If the factored resistance is greater than the applied pressure, the pedestal is
considered to be satisfactory:
φR > pfront
φR > pback
The LRFD resistance factor is specified by the user and is used for all limit states except Service. The
LRFD resistance factor for Service is 1.0. A separate value exists for the Extreme I (earthquake) limit
state. The bearing capacity is specified by the user (see RCK command, Chapter 5). The remainder of
this section describes how the front and back pressures are evaluated.
The pedestal front (pfront) and back (pback) pressures include the effects of the pedestal weight and the
moment generated about the toe of the pedestal by the weight of pedestal as shown in Figure 1. The
pedestal force and moment are modified by the dead load factor of the given combination as shown in the
equations below.
vlfp = VLF (ccp) + γDC pwt
vmp = ccp[vmf + VLF(pf+ pt)] + γDC pm

Chapter 3 Method of Solution
3-81
A
B
E
C D
F
P1 P2
P1 = weight of pedestal portion ABCF
P2 = weight of pedestal portion CDEF
X1
X2
X1 = lateral distance to centroid of ABCF
X2 = lateral distance to centroid of CDEF
pm = P1*X1 + P2*X2
pwt = P1 + P2
Figure 3.4.2.5-1 Pedestal Weight (pw) and Moment (pm)

Chapter 3 Method of Solution
3-82
The horizontal force and moments are adjusted to account for the pedestal spacing as follows:
HLF(ccp) = hlpf
HLF(htb)] + ccp[HMF = hmp
The location of the resultant is determined by dividing the net moment (vmp-hmp) by the vertical force
(vlfp). The eccentricity (eccp) is the distance from the location of the resultant (xresp) to the center of the
pedestal as illustrated in Figure 1. The equations are:
xresp2
pw = eccp
vlfp
hmpvmp = xresp
If the pedestal is situated on rock, the front and back pressures are computed assuming a linear variation
in the pressure distribution under the pedestal. The following equations are applied using pedestal width
(pw) and pedestal thickness (th):
Soft Rock (Emr<Ec):
theccp2pw
vlfp = p = p
frontback)(
Hard Rock (Emr>Ec):
If the resultant lies within the back third of the pedestal
thxresp3
2vlfp = p
front)(
0.0 = pback
If the resultant is in the front third of the pedestal
0.0 = pfront
thxresppw3
2vlfp = p
back)(
Chapter 3 Method of Solution
3-83
If the resultant lies within the center middle third of the pedestal
pw
eccp6 +1
thpw
vlfp = p front
pw
eccp6 1
thpw
vlfp = pback
3.4.2.6 Pedestal Settlement
The settlement of the pedestal is evaluated using the same algorithm as the settlement of a spread footing
on rock, i.e. only the elastic settlement is considered (see Section 3.4.1.3).
3.4.3 Pile Footings
The stability of pile footings is checked by examining the vertical and lateral forces in the piles. Unlike the
spread footing, the bearing capacity, settlement, and sliding checks are not applicable. The analysis is
based on the properties of the pile group. Caisson footings are handled similarly.
3.4.3.1 Pile Group Properties
Pile group properties are based on a unit width of the structure and includes the distance from the toe to
the centroid of the pile group and the moment of inertia of the pile group. When determining the moment
of inertia and centroid, the area of a single pile is assumed to be unity, while the moment of inertia of a
single pile is assumed to be negligible. Once the properties have been computed, the vertical load, Pv, on
any pile can then be calculated using the following equation based on elastic theory:
I
xM+
n
P = Pv
When the vertical load on each pile is known, axial and lateral loads can then be computed and the axial
loads can be compared against the axial pile resistance. Vertical loads are computed for each applicable
limit state, load case, and stage.
3.4.3.2 Vertical Load Stability
Vertical pile loads are used to compute the axial pile loads. When the pile is vertical, the axial load is
equal to the vertical pile load, Pv. When the pile is battered at an angle as shown in Figure 1, the axial
pile load is computed as follows:
θ cos
P = P
va
Where: = Angle between the pile axis and the vertical

Chapter 3 Method of Solution
3-84
Battered Pile Vertical Pile
Applied Load:
Pa
Pv
Pa= Pv
Resistance:
Ra
Rh
Rh
R'h
Battered Pile Vertical Pile
θ
Ph
Figure 3.4.3.2-1 Force Relationships for Vertical & Battered Piles

Chapter 3 Method of Solution
3-85
3.4.3.3 Lateral Load Stability
The program computes the lateral load acting on the pile footing and determines whether the pile footing
can resist the load. The user may specify a lateral resistance for an individual vertical pile. However, this
resistance is only applicable when all piles are vertical. If any pile is battered, the lateral resistance for
the pile footing is based on the lateral resistance of the battered piles and neglects any lateral capacity of
the vertical piles. The lateral resistance for an individual battered pile, Rh, is based on the axial pile
resistance, Ra, using the following equation:
Rh = Ra sin
For a pile footing analysis, the footing lateral load is compared to the lateral pile resistance of the pile
group as computed by the program.

Chapter 3 Method of Solution
3-86
3.5 FOOTING
3.5.1 Structural Analysis
Each footing type is checked for flexure and shear. The critical location and direction within the footing
depends on the footing type as shown in Figure 1. Spread footings are analyzed in the perpendicular
direction only. Pile footings are analyzed in both the perpendicular and parallel directions. Pile/Caisson
footings use typical sections at maximum moment location. Bar details are illustrated in Figure 5.22-1.
The user should ensure that the cover for the bottom reinforcement is sufficient to accommodate the
pile/caisson embedment when applicable. Pedestal footings are analyzed in the parallel direction only
(see Figure 2.1-1) because the footing and pedestal are assumed to be made integral using transverse
shear keys and dowels as per D10.6.5.2P. The critical location for shear may vary depending on the
direction of the applied moment. The following sections identify the idiosyncrasies of each footing type.
Loads from the service limit state are used to evaluate the moment that will determine the stresses in the
reinforcement for the crack control check. Loads from all limit states are used to evaluate the maximum
moment that must be resisted by the section.
A separate section identifies how the stress in the rebar is evaluated under the service limit state. This
generic description can be applied to all singly reinforced sections where the applied axial load is zero.
The Moment direction within the footing is used to determine the critical shear locations in the footing as
well as where the controlling moment used for perpendicular reinforcement analysis originates. For a
Condition”1” moment direction the moment induces tension in the bottom perpendicular reinforcement
within the toe and tension in the top perpendicular reinforcement within the heel. For a Condition “2”
moment direction the moment induces tension within the top perpendicular reinforcement for the toe and
tension within the bottom perpendicular reinforcement within the heel.

Chapter 3 Method of Solution
3-87
Spread, Pile and Caisson Footings (perpendicular direction)
d
TOE HEEL
Moment Critical Section
Footing Top
CoverFooting
Bottom
Cover
TOE HEEL
dtdh
dhdt
Shear Critical Section
S/2
S
d
Footing
Top
Cover
Footing
Bottom
Cover
Moment Critical Section Shear Critical Section
Pedestal Footing (parallel direction)
critical location
when toe moment
direction is “2”
STEM
critical location
when heel moment
direction is “2”
Bottom of
FootingBottom of
Footing
Top of Footing Top of Footing
STEM
Figure 3.5.1-1 Critical Location for Footing Analysis
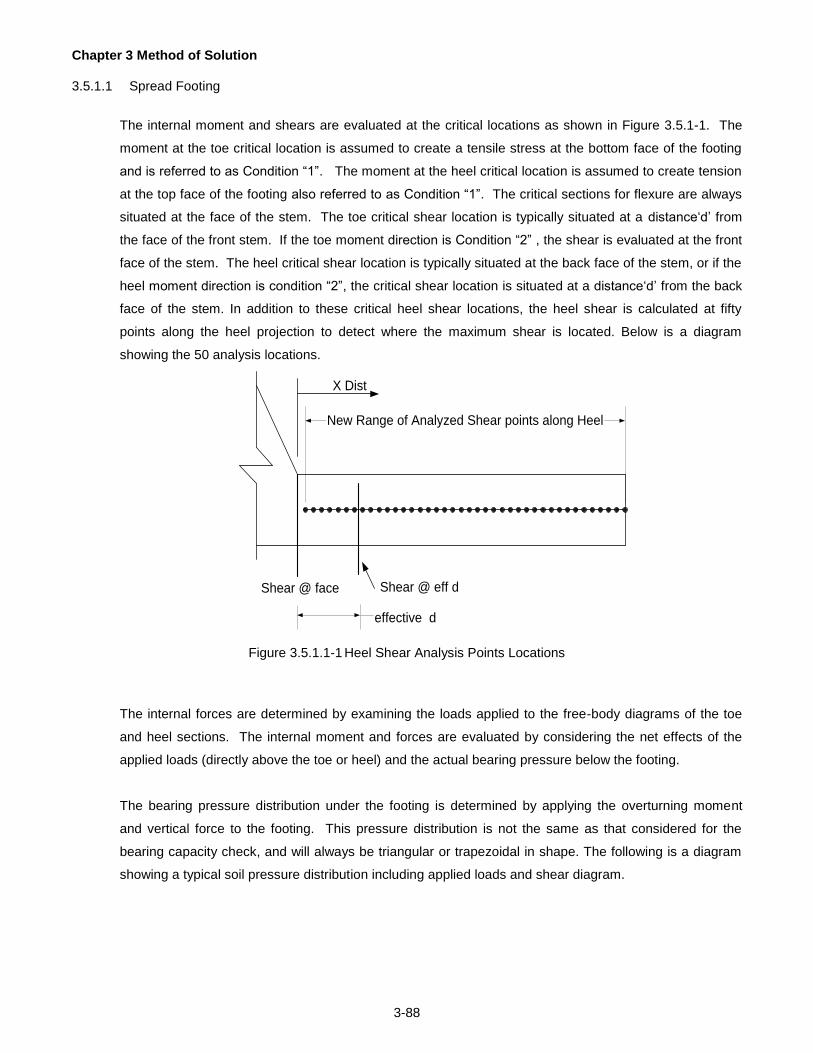
Chapter 3 Method of Solution
3-88
3.5.1.1 Spread Footing
The internal moment and shears are evaluated at the critical locations as shown in Figure 3.5.1-1. The
moment at the toe critical location is assumed to create a tensile stress at the bottom face of the footing
and is referred to as Condition “1”. The moment at the heel critical location is assumed to create tension
at the top face of the footing also referred to as Condition “1”. The critical sections for flexure are always
situated at the face of the stem. The toe critical shear location is typically situated at a distance‘d’ from
the face of the front stem. If the toe moment direction is Condition “2” , the shear is evaluated at the front
face of the stem. The heel critical shear location is typically situated at the back face of the stem, or if the
heel moment direction is condition “2”, the critical shear location is situated at a distance‘d’ from the back
face of the stem. In addition to these critical heel shear locations, the heel shear is calculated at fifty
points along the heel projection to detect where the maximum shear is located. Below is a diagram
showing the 50 analysis locations.
New Range of Analyzed Shear points along Heel
effective d
Shear @ face Shear @ eff d
X Dist
Figure 3.5.1.1-1 Heel Shear Analysis Points Locations
The internal forces are determined by examining the loads applied to the free-body diagrams of the toe
and heel sections. The internal moment and forces are evaluated by considering the net effects of the
applied loads (directly above the toe or heel) and the actual bearing pressure below the footing.
The bearing pressure distribution under the footing is determined by applying the overturning moment
and vertical force to the footing. This pressure distribution is not the same as that considered for the
bearing capacity check, and will always be triangular or trapezoidal in shape. The following is a diagram
showing a typical soil pressure distribution including applied loads and shear diagram.

Chapter 3 Method of Solution
3-89
Load due to Applied
Forces
Load due to Bearing
Pressure
Resulting Shear Diagram
Max shear may occur
at locations other than
the face or effective d
Max Shear
Figure 3.5.1.1-2 Spread Footing Heel - Applied Load and Shear Diagram
3.5.1.2 Pile Footings
For a pile footing analysis, axial pile loads are compared against the axial pile resistance given by the
user. Axial pile loads must be compressive; an exception is made for the Extreme Event I limit state
(earthquake). The tensile pile resistance may be specified by the user (CAI and PIL commands); it is only
applicable for the Extreme Event I limit state.
The pile or caisson footing is analyzed in the perpendicular and parallel directions.
3.5.1.2.1 Perpendicular Direction
The analysis of loads in the perpendicular direction of the pile footing is similar to that of the spread
footing except that the pile forces are used in lieu of the actual soil pressure. Internal moments and shear
are evaluated for strength and serviceability checks.
The internal forces are determined by computing the net effects of the loads applied to the free-body
diagrams of the toe and heel critical sections. Applied loads include footing weight, soil loads and
surcharges, resisted by buoyancy and loads from contributing piles determines if the pile moment will be
considered in the capacity. The shear force is proportioned according to the area of the pile on either
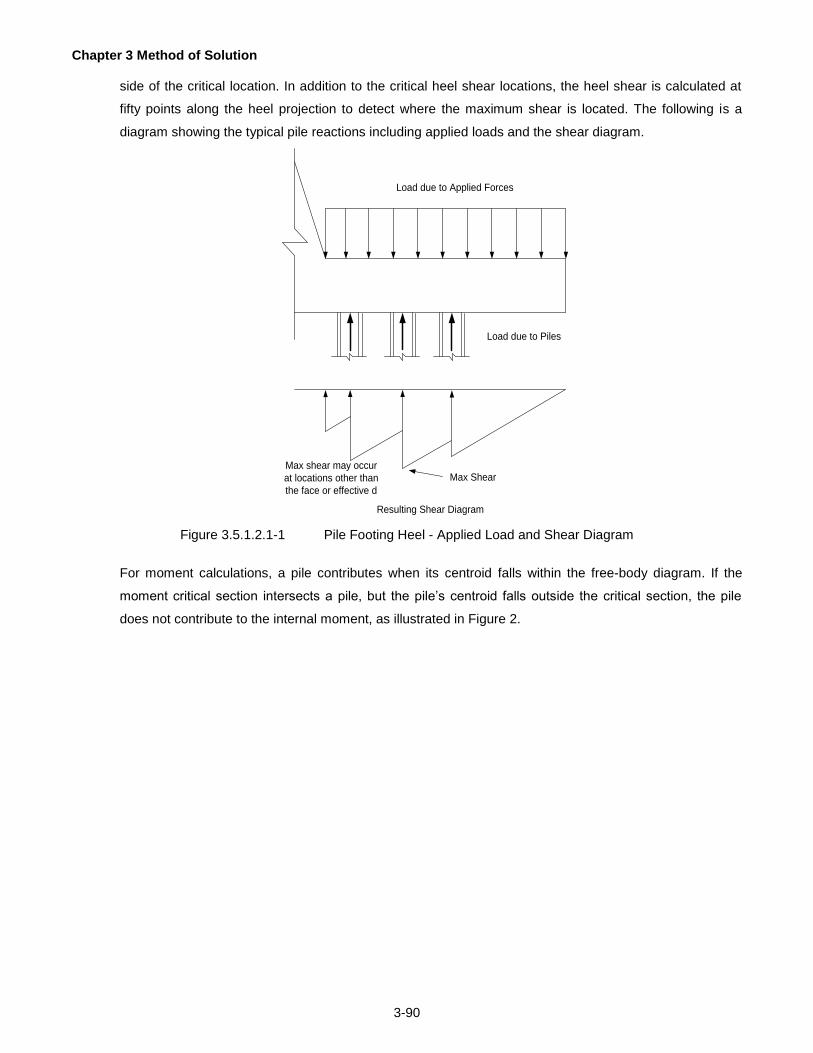
Chapter 3 Method of Solution
3-90
side of the critical location. In addition to the critical heel shear locations, the heel shear is calculated at
fifty points along the heel projection to detect where the maximum shear is located. The following is a
diagram showing the typical pile reactions including applied loads and the shear diagram.
Load due to Applied Forces
Load due to Piles
Resulting Shear Diagram
Max shear may occur
at locations other than
the face or effective d
Max Shear
Figure 3.5.1.2.1-1 Pile Footing Heel - Applied Load and Shear Diagram
For moment calculations, a pile contributes when its centroid falls within the free-body diagram. If the
moment critical section intersects a pile, but the pile’s centroid falls outside the critical section, the pile
does not contribute to the internal moment, as illustrated in Figure 2.

Chapter 3 Method of Solution
3-91
Footing Toe
Pile
c.g. of pile
d
x
Flexure: pile is not considered
because the centroid is situated
outside the critical section.
Shear: (x/d) of pile force is
considered in the calculations.
critical section
considered for
internal force/moment
calculation
Figure 3.5.1.2.1-2 Contribution of Pile to Moment and Force Calculations
For shear calculations, a pile contributes as a percentage of that portion that falls within the free body
diagram. For example, if the shear critical section intersects a pile, the contributing force is computed as
a percentage of the dimension that falls within the free body diagram, as illustrated in Figure 2.
3.5.1.2.2 Parallel Direction
Parallel moments for the pile footing are computed using the maximum vertical load on the footing. A
pseudo uniform load (Wu) is derived by dividing the maximum vertical load (VLF) by the footing width (B).
The parallel moment (M) is then computed based on the pseudo uniform load (Wu) and the maximum pile
spacing (Sp), as shown in the following equations:
20
WuS = M
2p
where:
B
VLF =Wu

Chapter 3 Method of Solution
3-92
This parallel moment is used in the analysis check of the top and bottom parallel reinforcement. The
maximum vertical force is used for the strength limit states check. The maximum vertical force from the
service limit state is used to evaluate the moment for the serviceability (crack control) checks.
3.5.1.3 Pedestal Footings
Pedestal footings are checked for: the relative values of the vertical and horizontal forces; the bearing
pressure under the footing; the location of the footing resultant force; the flexural capacity of the footing
(parallel direction); the shear capacity (parallel direction) of the footing; the bearing capacity under the
pedestal; and the serviceability of reinforcement (crack control). Pedestal footing reinforcement is not
analyzed in the perpendicular direction (toe and heel locations) because the footing and pedestal are
assumed to be made integral using transverse shear keys and dowels as per DM-4 Section 10.6.5.2P.
The critical locations are shown in Figure 3.5.1-1. Each item is described in more detail under a separate
sub-section.
3.5.1.3.1 Footing Flexural Loads (parallel direction)
The applied flexural loads of the footing are evaluated in the parallel direction only. The applied moments
are computed assuming that a uniform distributed load is applied over a continuous span structure. The
uniform load is computed for two situations, namely: strength (maximum) and service conditions. The
uniform load is determined by dividing the applicable vertical force (VLF) by the footing width (B) as
shown in the equations below:
B
VLF = udl
Where: VLF = the maximum vertical force from “strength limit state combinations”.
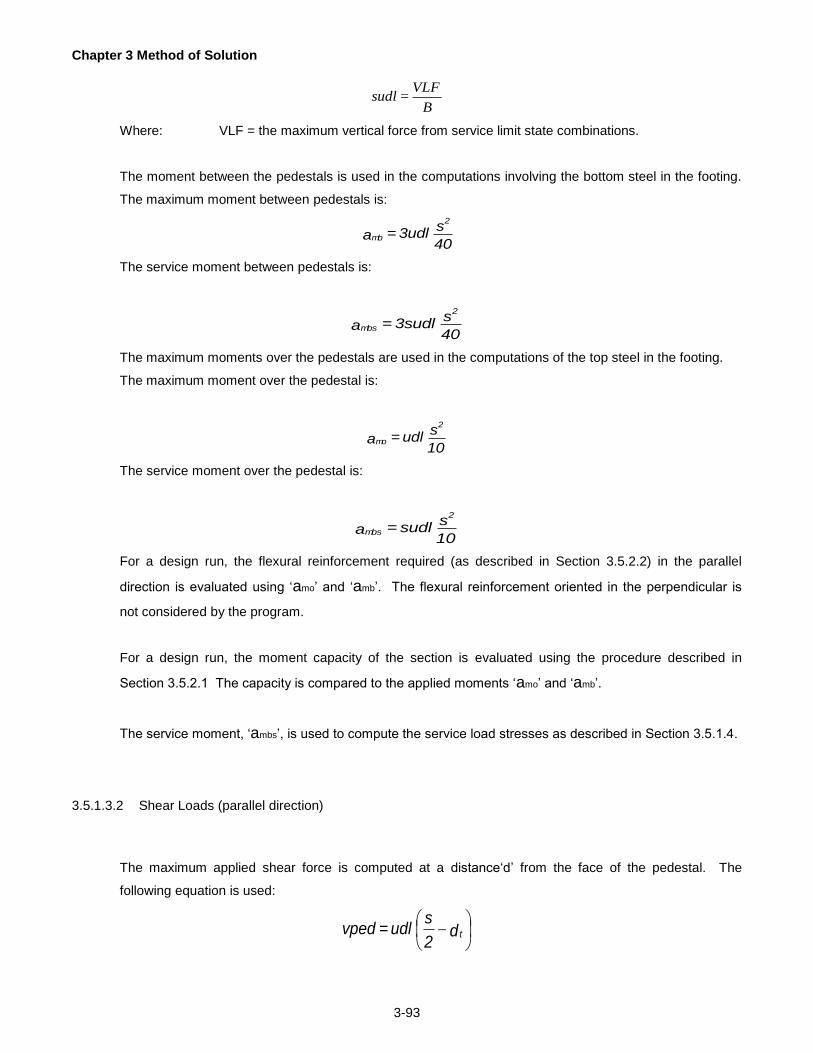
Chapter 3 Method of Solution
3-93
B
VLF = sudl
Where: VLF = the maximum vertical force from service limit state combinations.
The moment between the pedestals is used in the computations involving the bottom steel in the footing.
The maximum moment between pedestals is:
40
s 3udl = a
2
mb
The service moment between pedestals is:
40
s 3sudl = a
2
mbs
The maximum moments over the pedestals are used in the computations of the top steel in the footing.
The maximum moment over the pedestal is:
10
s udl = a
2
mo
The service moment over the pedestal is:
10
s sudl = a
2
mbs
For a design run, the flexural reinforcement required (as described in Section 3.5.2.2) in the parallel
direction is evaluated using ‘amo’ and ‘amb’. The flexural reinforcement oriented in the perpendicular is
not considered by the program.
For a design run, the moment capacity of the section is evaluated using the procedure described in
Section 3.5.2.1 The capacity is compared to the applied moments ‘amo’ and ‘amb’.
The service moment, ‘ambs’, is used to compute the service load stresses as described in Section 3.5.1.4.
3.5.1.3.2 Shear Loads (parallel direction)
The maximum applied shear force is computed at a distance‘d’ from the face of the pedestal. The
following equation is used:
d
2
s udl = vped t

Chapter 3 Method of Solution
3-94
The shear capacity of the footing section is evaluated as described in Section 3.5.2.9 and compared to
vped computed above.
3.5.1.4 Service Load Stresses
This section describes how the stress in the rebar is evaluated. It can be applied to all singly reinforced
sections experiencing flexural loads only, i.e., both toe and heel critical sections and any point in the
parallel direction.
The program will compute the stress at the extreme tensile fiber of the cross section. The stress is
computed using gross section properties. The following equations are used:
S
M +
A
P- = f suncr
where: bh = A
6
bh = S
2
The axial load is assumed to be compressive. In footing sections, the axial load is zero. Compressive
stresses are negative by the program’s definition. The rupture stress is defined as:
'f0.24 = f cr (f’c in ksi)

Chapter 3 Method of Solution
3-95
If the stress is compressive or the tensile stress is less than 80% of the rupture stress, the program sets
the applied steel stress, fs, to zero.
The actual stress is based on the reinforced concrete theory based on a cracked section under service
limit states. The actual stress fsact is computed as follows:
A jd
M = f
s
servicesact
where: 3
k 1 = j
nn+n2 = k2
ρρ
bd
As = ρ
E
E = n
c
s
The solution is obtained by solving for the neutral axis depth such that the tensile force is equal to the
compressive force and the strain compatibility is maintained.
3.5.2 Specification Checking
A given section is checked for flexural strength, crack control (serviceability) and shear. The capacity is
based on a section that has a unit width and is considered to be singly reinforced. The reinforcement is
assumed to be situated in the tensile zone. Perpendicular and parallel bar details are illustrated in Figure
5.22-1. The program does not check if the bottom reinforcement interferes with the piles or caissons.
Hence the user should provide an adequate cover in such circumstances.
The flexural strength considers the minimum area of steel, over-reinforcement ratio, and bar spacing. For
design problems, the flexural strength check evaluates the area of reinforcement required to resist the
applied moment, then, an appropriate spacing value is determined for each bar size. For analysis
problems, the flexural strength check evaluates the resisting moment based on the area of reinforcement
specified by the user. The resisting moment is compared to the applied moment. In the pile footing, the
flexural reinforcement is placed in both the perpendicular and parallel directions. Hence the
reinforcement is checked in both directions.

Chapter 3 Method of Solution
3-96
The crack control check considers the stress in the reinforcement under service limit states. Bar spacing
requirements are also considered. For design problems, the program may decrease the bar spacing
required for flexural strength to satisfy the crack control specifications. This would result in increasing the
area of reinforcement within the section. Hence, the program will check for over-reinforcing after the
service limit state checks are evaluated. If the cross section is over-reinforced, a status code (‘D’) in the
output results (crack control – design report) will be displayed (see Section 7.4.8.1-4).
The shear check ensures that the thickness of the section is adequate to resist the applied shear. Shear
reinforcement is not considered. For design problems, the section thickness will be increased
incrementally if the shear check fails.
The following sub-sections describe the details of each type of check.
3.5.2.1 Strength Check – Analysis
The user may specify the reinforcement in terms of bars and spacings (BAR and SPA commands) or in
terms of developed area of reinforcement (ARE command). If the bar-and-spacing option is used, the
development length of the bar is evaluated to determine the area of developed reinforcement. There are
three cases that may apply:
1. If the actual length available to develop a given bar, lbact, is greater than or equal to the development
length, ld, all of the reinforcement is considered to be fully developed.
2. If lbact over ld ratio is less than 0.8(ld), none of the reinforcement is considered to be developed.
3. If lbact over ld ratio is greater than 0.8(ld) and less than ld, then none of the area of reinforcement is
considered to be developed and an informative message containing a spacing that would develop the
bar is shown. The spacing is calculated with the following equation
d
bact
orignewl
lss *
Where: snew = new suggested spacing
sorig = original bar spacing
ld = Development length of bar
lbact = Available space for bar to develop in the component
The procedure for evaluating the development length is described in Section 3.5.2.3.

Chapter 3 Method of Solution
3-97
The moment capacity, Mn, is evaluated given the developed area of reinforcement, using the value of
as shown in Section 3.5.2.5. The equation to compute the moment capacity derived below is based on a
generic cross section of unit width shown in Figure 1.
From internal equilibrium (Tension = Compression):
𝐴𝑠𝑓𝑦 = 0.85𝑓𝑐′𝑎𝑏
Nominal moment capacity (Mn) is equal to tensile force multiplied by the internal lever arm:
𝑀𝑛 = 𝐴𝑠𝑓𝑦 (𝑑 − 𝑎
2)
Solving the internal equilibrium equation for a and substituting a in equation for nominal moment capacity
results in the following:
𝑀𝑛 = 𝐴𝑠𝑓𝑦 (𝑑 −𝐴𝑠𝑓𝑦
2(0.85)𝑓𝑐′𝑏
)
The factored resistance moment is compared to the factored applied moment.
d
As
b
ac
tensile force
compressive force
internallever arm
Figure 3.5.2.1-1 Singly Reinforced Section
3.5.2.2 Strength Check – Design
When the program is designing reinforcement, the development length is checked to ensure that the
selected bar size and spacing will be able to develop within the actual geometry of the concrete
component. If the bar does not develop, the program will then reduce the spacing by multiplying by a ratio
of the actual length available to the calculated development length, not less than 80%, and then check the
development again. If the reduced spacing requires a development length that is greater than the actual
geometry available then the program will indicate that the bar cannot be developed.
For perpendicular footing bars, if the Hooked Footing Bars parameter on the SPD card is set to “Y”, the
program will check if hooked bars would work when a straight bar does not. In this case the program will

Chapter 3 Method of Solution
3-98
then calculate the hooked development length of bar at its original spacing. If the hooked bar cannot be
developed in the actual geometry, the program will then reduce the spacing by a ratio of the actual length
available to the development length, not less than 80%, and then recalculate the development length. If
the reduced spacing requires a development length that is greater than the geometry available then the
program will indicate that the bar cannot be developed.
The method of reducing the spacing is shown below with accompanying equations:
When the Ldbar >Ldact
Ldratio =
8.0,
L
LMAX
dbar
dact
snew = sorig *Ldratio
Where: Ldbar = Development length of a bar
Ldact = Available space for bar to develop in the component
Ldratio = Ratio of available length to develop versus the required bar development length
sorig = Selected bar spacing
snew = New reduced bar spacing
The 0.8 in the above equation is the limit on the spacing reduction. For example, if a 9 inch spacing does
not work, then the spacing is reduced but to no less than 7.2 inches which rounds to 7 inches. This
technique allows the program to inform the user of the spacing required for the selected bar that would
allow the bar to develop within the space available.
The procedure for evaluating the development length is described in Section 3.5.2.3.
For a design run when the required area of reinforcement, As, can be developed to resist applied
moment, Mu, is calculated by solving the following quadratic equation:
0 = M
+ Ad]f[ Abf2(0.85)
fu
sy2s
c
2
y
φ'
The area of reinforcement calculated using the above equation is based on a theory of singly reinforced
rectangular concrete section.
The derivation of the above equation is shown below: Refer to Figure 3.5.2.1
From internal equilibrium (Tension = Compression)
ab'f0.85 = fA cys

Chapter 3 Method of Solution
3-99
From external equilibrium:
2
ad fAφ = Mφ = M ysnu
Solve for ‘a’ above:
b'f2(0.85)
fA d fAφ = M
c
ysysu
Simplifying the above equation results in the quadratic equation shown above.
For a design run the program solves for phi and the area of steel, iterating on the bending phi and the
area of steel until there is a convergance based on AASHTO 5.5.4.2.1.
The program will use the smallest positive root as the solution. If both roots are negative, the area
cannot be evaluated because of the incompatible relationship between the applied moment, material
strengths and the given geometry of the section, i.e., stronger materials properties and/or a deeper
section are required.
3.5.2.3 Development Length
The development length of a reinforcing bar depends on several factors including: bar size; geometry
(straight or hooked); function and the user specified correction factor (see MRD command, Chapter 5).
Straight Bars
Table 1 identifies the equations that apply for computing the required development length (Ldb ) for given
bar sizes. The actual development length is adjusted by the correction factors (m i and md), which are
described further in the next sub-section. The correction factor considers the yield strength of the
reinforcement, epoxy coating on the bar and a value specified by the user. In the equation below, ldb
refers to the development length for a given bar size (see Table 1).
Id = MAX [ 12 “, (mi md ) Idb ]
Where: Id = development length (in)
Idb = development length required for a given bar (in)
md = adjustment factor applied to development length – considers area of steel
provided and required
mi = adjustment factors applied to the development length – considers concrete cover
and epoxy coating
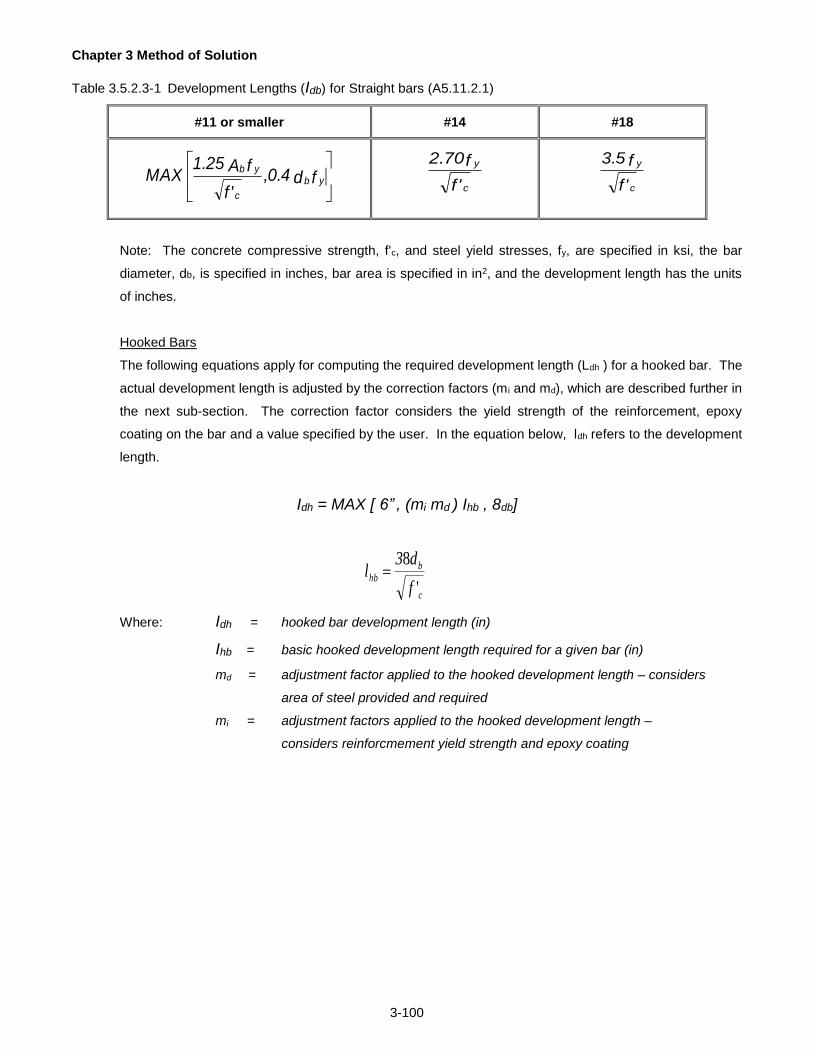
Chapter 3 Method of Solution
3-100
Table 3.5.2.3-1 Development Lengths (Idb) for Straight bars (A5.11.2.1)
#11 or smaller
#14
#18
fd,0.4
'f
fA1.25 MAX yb
c
yb
'f
f2.70
c
y
'f
f3.5
c
y
Note: The concrete compressive strength, f'c, and steel yield stresses, fy, are specified in ksi, the bar
diameter, db, is specified in inches, bar area is specified in in2, and the development length has the units
of inches.
Hooked Bars
The following equations apply for computing the required development length (Ldh ) for a hooked bar. The
actual development length is adjusted by the correction factors (m i and md), which are described further in
the next sub-section. The correction factor considers the yield strength of the reinforcement, epoxy
coating on the bar and a value specified by the user. In the equation below, ldh refers to the development
length.
Idh = MAX [ 6” , (mi md ) Ihb , 8db]
'
8
f
d3l
c
bhb
Where: Idh = hooked bar development length (in)
Ihb = basic hooked development length required for a given bar (in)
md = adjustment factor applied to the hooked development length – considers
area of steel provided and required
mi = adjustment factors applied to the hooked development length –
considers reinforcmement yield strength and epoxy coating

Chapter 3 Method of Solution
3-101
3.5.2.4 Development Length Correction Factors
The development length for hooked bars is adjusted by considering the following factors:
The following factors increase development length:
If the yield strength (fy) is greater than 60 ksi, adjust the length by fy/60.
If the bar is epoxy coated, adjust the length by a factor of 1.2
The following factor decrease development length:
Adjust the length by the ratio:
A
A
sact
sreq
The following factor can decrease or increase development length:
Adjust the length by the user specified value (see MRD command, Chapter
5).
The development length for straight bars is adjusted by considering the following factors:
The following factors increase development length:
If 12.0 in of concrete or more is placed below a footing bar, adjust the factor
increase the development length by 1.4. In some cases this factor can apply
to bottom footing rebar also.
If the bar is not epoxy coated and the cover is less than three bar diameters
or the clear spacing is less than six bar diameters, adjust the length by:
1.5
If the bar is epoxy coated and is not affected by the above cover condition,
then adjust the length by:
1.2
However, if the Top Bar Modification Factor (1.4) is applicable, the epoxy
coated factor is limited to the following:
1.4
1.7
The following factor decrease development length:
Adjust the length by the ratio:

Chapter 3 Method of Solution
3-102
A
A
sact
sreq
The following factor can decrease or increase development length:
Adjust the length by the user specified value (see MRD command, Chapter
5).
3.5.2.5 Phi Factor and Over-reinforced Sections
The section is considered to be over reinforced if the depth of the neutral axis is greater than 42% of the
effective depth of the section. For analysis runs, the program will provide a warning message if a section
is over-reinforced. For design runs, the program will not allow an over-reinforced condition.
The following equation is checked to determine if a section is over-reinforced. The relationships that apply
are based on the section illustrated in Figure 3.5.2.1-1 and the equations identified in Section 3.5.2.1.
0.42 d
c
Where:
β
a = c
1
b'f0.85
fA = a
c
ys
β1 is a function of the concrete compressive strength (LRFD 5.7.2.2)
The current LRFD specification now reduces the phi factor based on the strain condition at the cross-
section. A reduction in the phi factor for compression-controlled sections is used to compensate for
decreased ductility in comparison to tension-controlled sections. The variant resistance phi factor is
computed by the following equation:
𝜀𝑡 =0.003(𝑑−𝑐)
𝑐
AC5.7.2.1-1
0.75 ≤ ∅ = 0.75 + 0.15(𝜀𝑡−𝜀𝑐𝑙)
𝜀𝑡𝑙−𝜀𝑐𝑙 ≤ 0.9
A5.5.4.2.1-2
where:
= net tensile strain in the extreme tension steel at nominal resistance (in./in.)
cl = compression-controlled strain limit in the extreme tension steel (in./in.)
tl = tension-controlled strain limit in the extreme tension steel (in./in.)
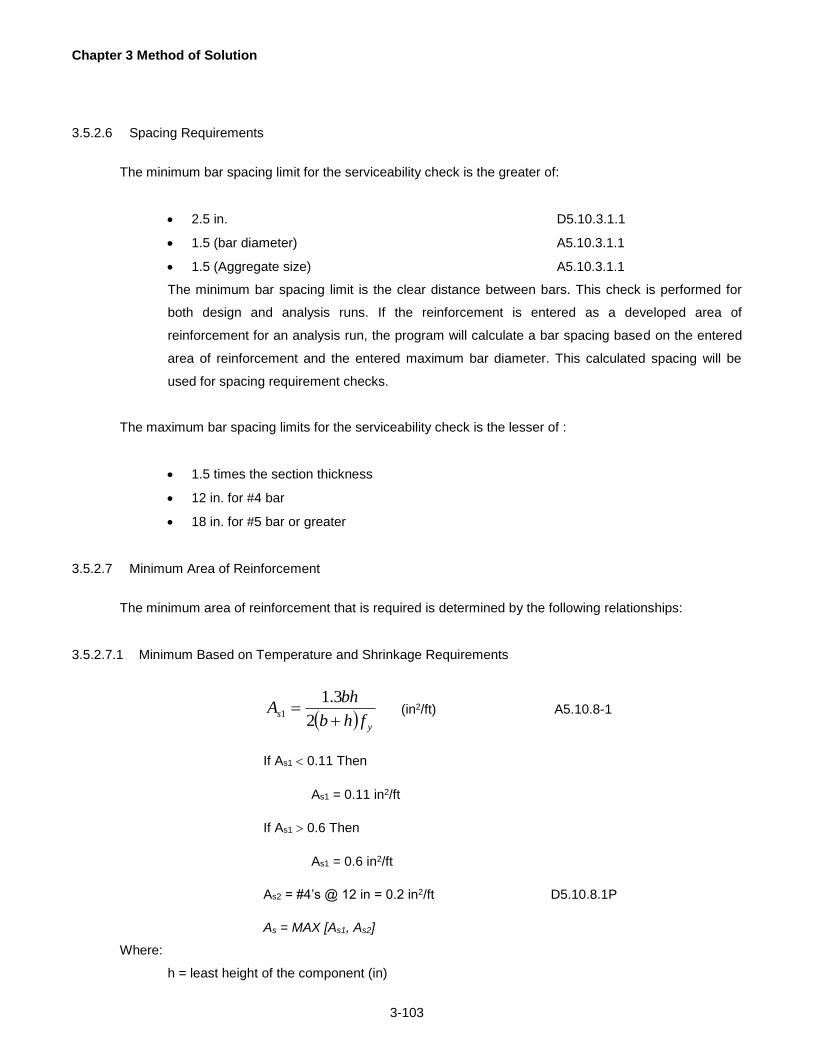
Chapter 3 Method of Solution
3-103
3.5.2.6 Spacing Requirements
The minimum bar spacing limit for the serviceability check is the greater of:
2.5 in.
D5.10.3.1.1
1.5 (bar diameter)
A5.10.3.1.1
1.5 (Aggregate size)
A5.10.3.1.1
The minimum bar spacing limit is the clear distance between bars. This check is performed for
both design and analysis runs. If the reinforcement is entered as a developed area of
reinforcement for an analysis run, the program will calculate a bar spacing based on the entered
area of reinforcement and the entered maximum bar diameter. This calculated spacing will be
used for spacing requirement checks.
The maximum bar spacing limits for the serviceability check is the lesser of :
1.5 times the section thickness
12 in. for #4 bar
18 in. for #5 bar or greater
3.5.2.7 Minimum Area of Reinforcement
The minimum area of reinforcement that is required is determined by the following relationships:
3.5.2.7.1 Minimum Based on Temperature and Shrinkage Requirements
y
sfhb
bhA
2
3.11 (in2/ft) A5.10.8-1
If As1 0.11 Then
As1 = 0.11 in2/ft
If As1 0.6 Then
As1 = 0.6 in2/ft
As2 = #4’s @ 12 in = 0.2 in2/ft D5.10.8.1P
As = MAX [As1, As2]
Where:
h = least height of the component (in)

Chapter 3 Method of Solution
3-104
b = least width of the component (in)
ABLRFD sets the least width of the component equal to the height for backwall/stem or the width of the
footing as illustrated in Figures 3.5.2.7.1-1 and 3.5.2.7.1-2.
The 0.12 in2/ft requirement from DM-4 Section 5.10.8 does not control over D5.10.8.1P and is not
considered by the ABLRFD program.
b for f
ootings
h for
footings
h for stem
b for
stem
Figure 3.5.2.7.1-1 Temperature and shrinkage dimension location RWL, AWB
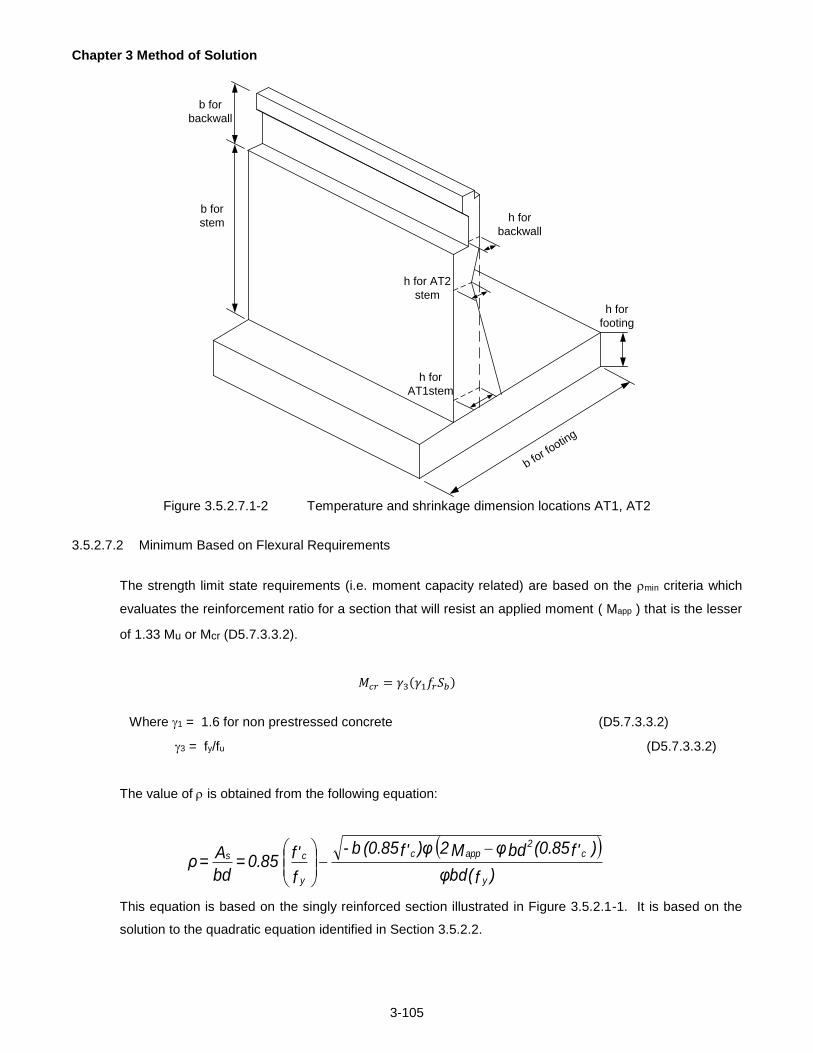
Chapter 3 Method of Solution
3-105
b for f
ooting
h for
footing
h for AT2
stem
h for
backwall
h for
AT1stem
b for
stem
b for
backwall
Figure 3.5.2.7.1-2 Temperature and shrinkage dimension locations AT1, AT2
3.5.2.7.2 Minimum Based on Flexural Requirements
The strength limit state requirements (i.e. moment capacity related) are based on the min criteria which
evaluates the reinforcement ratio for a section that will resist an applied moment ( Mapp ) that is the lesser
of 1.33 Mu or Mcr (D5.7.3.3.2).
𝑀𝑐𝑟 = 𝛾3(𝛾1𝑓𝑟𝑆𝑏)
Where 1 = 1.6 for non prestressed concrete (D5.7.3.3.2)
3 = fy/fu (D5.7.3.3.2)
The value of is obtained from the following equation:
)f(φbd
) 'f(0.85bdφM2 φ)'f(0.85 b-
f
'f 0.85 =
bd
A = ρ
y
c2
appc
y
cs
This equation is based on the singly reinforced section illustrated in Figure 3.5.2.1-1. It is based on the
solution to the quadratic equation identified in Section 3.5.2.2.

Chapter 3 Method of Solution
3-106
The cracking moment, Mcr, referenced above, is the moment applied to the section that will produce the
rupture stress of concrete at the extreme tension fiber of an uncracked section.
3.5.2.8 Serviceability Crack Control
The crack control is checked as per D5.7.3.4 where the spacing of the main tensile reinforcement is
checked against the result of Equation A5.7.3.4-1. For bottom perpendicular reinforcement (toe) the
program subtracts 1 inch of cover to account for foundation unevenness when calculating the allowable
crack control spacing.
c
sss
e df
s 2700
Where e = 1.00 for Class 1 Exposure
0.75 for Class 2 Exposure
fss = MIN( fs , 0.6*fy)
s
)(7.01
c
c
dh
d
3.5.2.9 Shear
The shear resistance of the section does not consider shear reinforcement. It is based on the strength of
the concrete and the shear depth. The shear depth (dv) is a function of: the Whitney stress block depth
(a); the effective depth (d); and the height (h) of the section as shown below:
0.72h) ,0.9d ,
a(d = d v
2MAX
A5.8.2.9
The depth of the Whitney stress block, ‘a’, is calculated by evaluating the flexural capacity of the section
as described in Section 3.5.2.1.
The shear capacity, Vc, is evaluated by the following:
'f bdβ v = V cvfactc
A5.8.3.3-3
Where: vfact = 0.0316
β = 2.0 (D5.8.3.4.2)
The maximum shear is considered from all of the limit state cases.

Chapter 3 Method of Solution
3-107
3.5.2.10 Punching Shear (Pile/Caisson Footings)
For both piles and caissons for design and analysis, the punching shear check begins by computing the
depth of the Whitney stress block (see Section 3.5.2.1), based on the effective depth for the
reinforcement in the top perpendicular direction of the footing. The shear depth is then computed using
the equation in Section 3.5.2.9.
0.72h) ,0.9d ,a
(d = d v2
MAX A5.8.2.9
Where: d = top perpendicular bar effective depth – pile/caisson embedment
h = footing thickness – pile/caisson embedment
A shear perimeter around the pile is then computed based on the pile cross sectional dimension, bo, and
the effective depth, d.
bo = 2 (a + d) + 2 (b + d) for rectangular piles
bo = π (diam + d) for circular piles
A beta factor (bc) is then computed for rectangular piles by taking the bigger dimension and dividing it by
the smaller dimension. The beta factor is 1 for circular piles. A punching shear factor is then computed
based on the beta factor:
b
0.126+0.063 = f
cps
, but not greater than 0.126 A5.13.3.6.3
The punching shear resistance is computed using the following equation and compared against the
maximum vertical pile load:
db'ff φ = v vocpspr
Punching shear is checked for single piles only. Effects due to overlapping shear planes should be
checked by the engineer if piles are closely spaced.
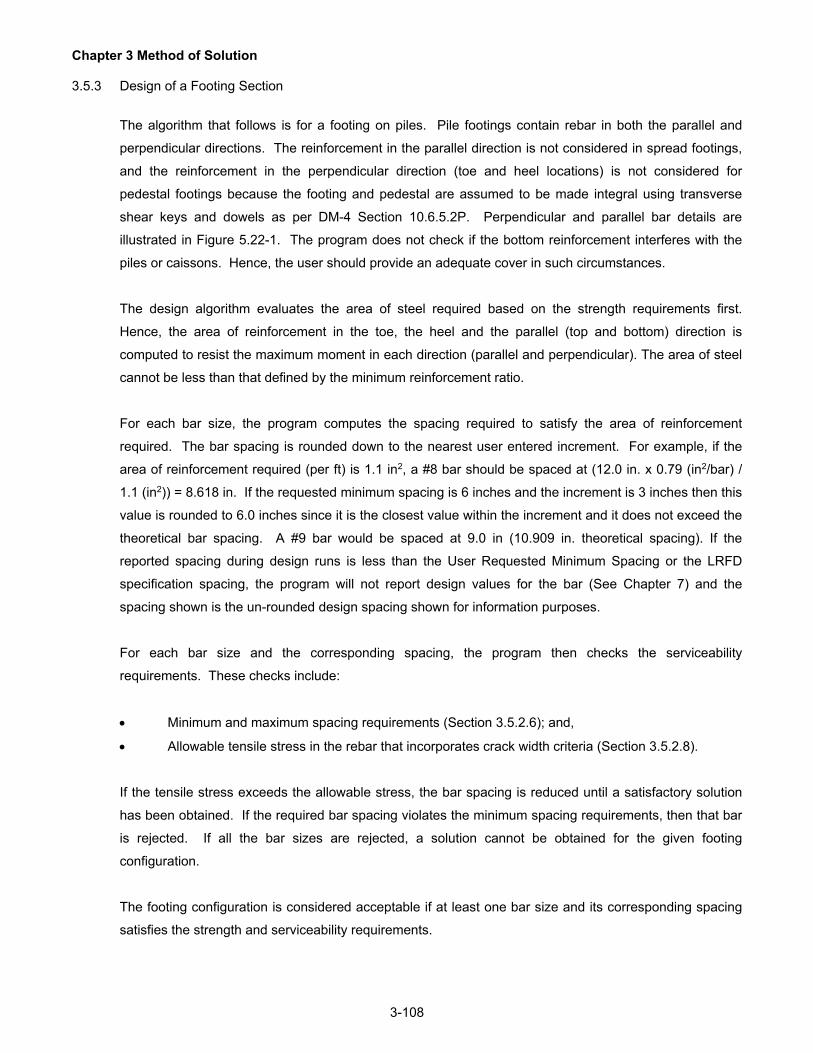
Chapter 3 Method of Solution
3-108
3.5.3 Design of a Footing Section
The algorithm that follows is for a footing on piles. Pile footings contain rebar in both the parallel and
perpendicular directions. The reinforcement in the parallel direction is not considered in spread footings,
and the reinforcement in the perpendicular direction (toe and heel locations) is not considered for
pedestal footings because the footing and pedestal are assumed to be made integral using transverse
shear keys and dowels as per DM-4 Section 10.6.5.2P. Perpendicular and parallel bar details are
illustrated in Figure 5.22-1. The program does not check if the bottom reinforcement interferes with the
piles or caissons. Hence, the user should provide an adequate cover in such circumstances.
The design algorithm evaluates the area of steel required based on the strength requirements first.
Hence, the area of reinforcement in the toe, the heel and the parallel (top and bottom) direction is
computed to resist the maximum moment in each direction (parallel and perpendicular). The area of steel
cannot be less than that defined by the minimum reinforcement ratio.
For each bar size, the program computes the spacing required to satisfy the area of reinforcement
required. The bar spacing is rounded down to the nearest user entered increment. For example, if the
area of reinforcement required (per ft) is 1.1 in2, a #8 bar should be spaced at (12.0 in. x 0.79 (in2/bar) /
1.1 (in2)) = 8.618 in. If the requested minimum spacing is 6 inches and the increment is 3 inches then this
value is rounded to 6.0 inches since it is the closest value within the increment and it does not exceed the
theoretical bar spacing. A #9 bar would be spaced at 9.0 in (10.909 in. theoretical spacing). If the
reported spacing during design runs is less than the User Requested Minimum Spacing or the LRFD
specification spacing, the program will not report design values for the bar (See Chapter 7) and the
spacing shown is the un-rounded design spacing shown for information purposes.
For each bar size and the corresponding spacing, the program then checks the serviceability
requirements. These checks include:
Minimum and maximum spacing requirements (Section 3.5.2.6); and,
Allowable tensile stress in the rebar that incorporates crack width criteria (Section 3.5.2.8).
If the tensile stress exceeds the allowable stress, the bar spacing is reduced until a satisfactory solution
has been obtained. If the required bar spacing violates the minimum spacing requirements, then that bar
is rejected. If all the bar sizes are rejected, a solution cannot be obtained for the given footing
configuration.
The footing configuration is considered acceptable if at least one bar size and its corresponding spacing
satisfies the strength and serviceability requirements.

Chapter 3 Method of Solution
3-109
The program will compute the development length for each bar size as described in Section 3.5.2.3. The
bar spacing may be further reduced to satisfy the development length criteria. This may occur for the
larger bar sizes which require longer development lengths. For example, if the actual available length for
developing a bar in the toe (toe projection - end cover) is shorter than the required development length,
then the actual steel area provided may be increased by reducing the bar spacing in order to reduce the
required development length as described in Section 3.5.2.4.
Development lengths can be computed for straight and hooked bars. Footing bars are assumed to be
straight. Stem bars are assumed to be hooked in the footing, but straight in the stem.
Note that, reducing the spacing automatically satisfies the allowable tensile stress check (serviceability
check). However, the over-reinforcement check (Section 3.5.2.5) must be evaluated each time the
spacing is reduced. Hence, the program re-evaluates the over-reinforcement check every time the
spacing is reduced in such circumstances.
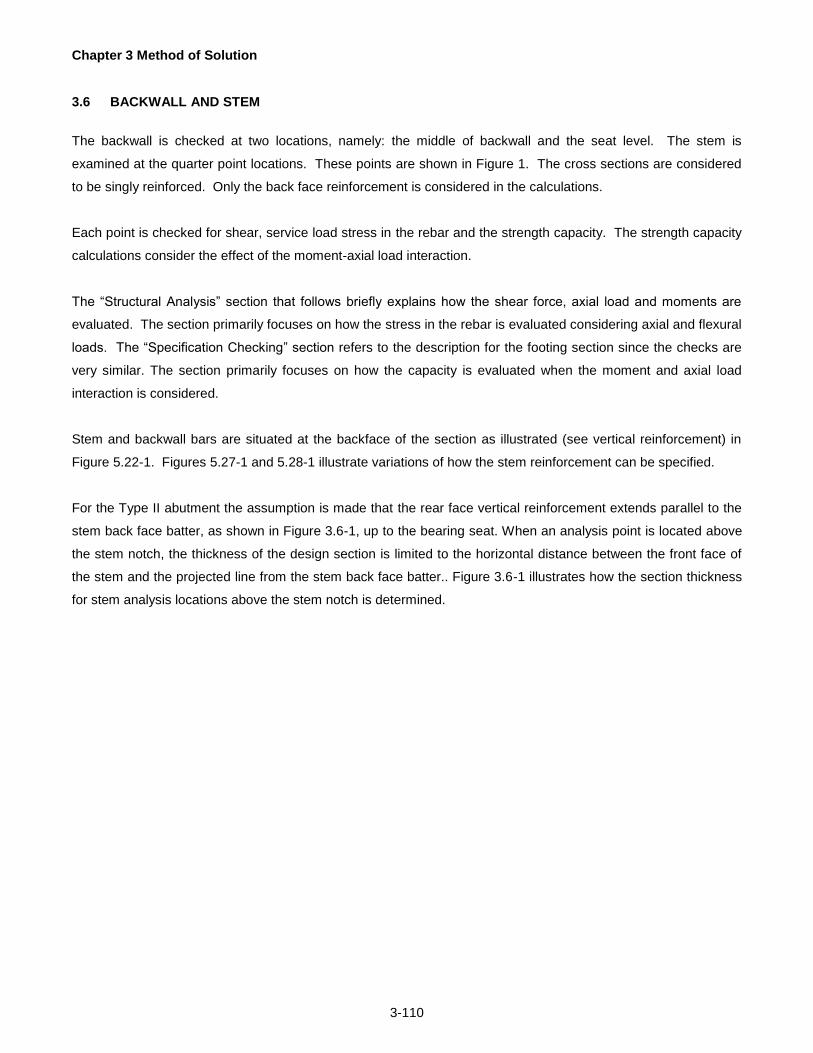
Chapter 3 Method of Solution
3-110
3.6 BACKWALL AND STEM
The backwall is checked at two locations, namely: the middle of backwall and the seat level. The stem is
examined at the quarter point locations. These points are shown in Figure 1. The cross sections are considered
to be singly reinforced. Only the back face reinforcement is considered in the calculations.
Each point is checked for shear, service load stress in the rebar and the strength capacity. The strength capacity
calculations consider the effect of the moment-axial load interaction.
The “Structural Analysis” section that follows briefly explains how the shear force, axial load and moments are
evaluated. The section primarily focuses on how the stress in the rebar is evaluated considering axial and flexural
loads. The “Specification Checking” section refers to the description for the footing section since the checks are
very similar. The section primarily focuses on how the capacity is evaluated when the moment and axial load
interaction is considered.
Stem and backwall bars are situated at the backface of the section as illustrated (see vertical reinforcement) in
Figure 5.22-1. Figures 5.27-1 and 5.28-1 illustrate variations of how the stem reinforcement can be specified.
For the Type II abutment the assumption is made that the rear face vertical reinforcement extends parallel to the
stem back face batter, as shown in Figure 3.6-1, up to the bearing seat. When an analysis point is located above
the stem notch, the thickness of the design section is limited to the horizontal distance between the front face of
the stem and the projected line from the stem back face batter.. Figure 3.6-1 illustrates how the section thickness
for stem analysis locations above the stem notch is determined.
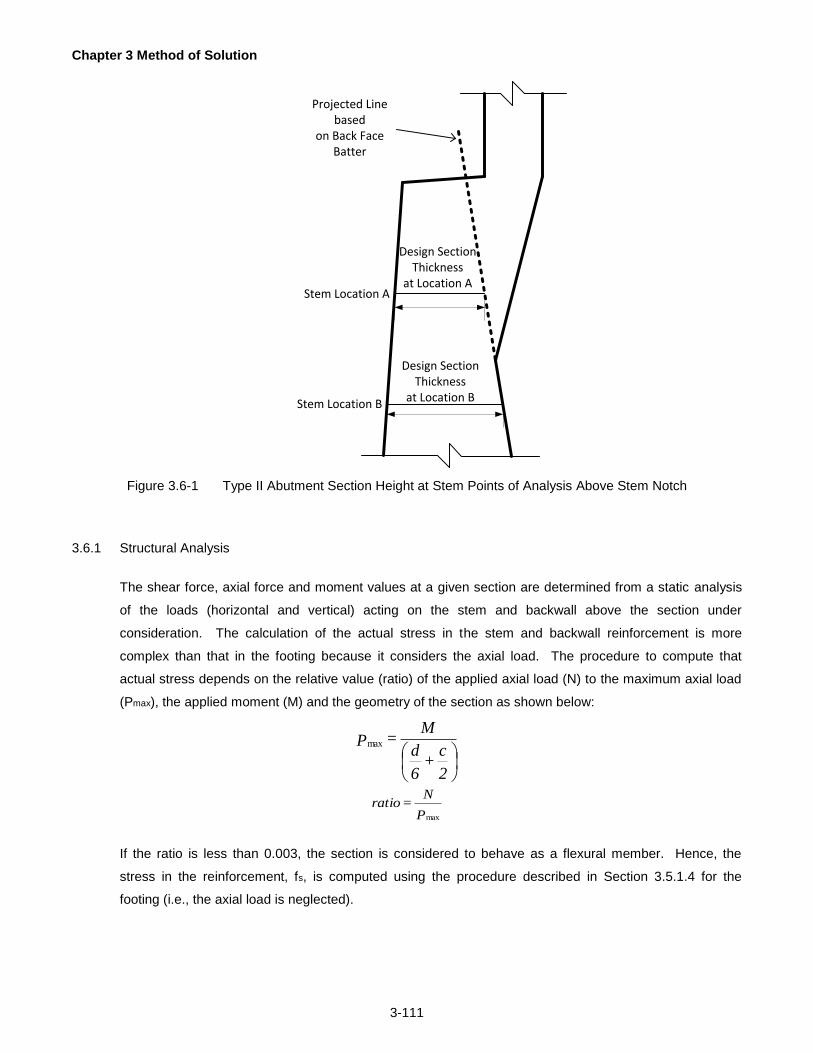
Chapter 3 Method of Solution
3-111
Projected Line based
on Back Face Batter
Stem Location A
Stem Location B
Design Section Thickness
at Location A
Design Section Thickness
at Location B
Figure 3.6-1 Type II Abutment Section Height at Stem Points of Analysis Above Stem Notch
3.6.1 Structural Analysis
The shear force, axial force and moment values at a given section are determined from a static analysis
of the loads (horizontal and vertical) acting on the stem and backwall above the section under
consideration. The calculation of the actual stress in the stem and backwall reinforcement is more
complex than that in the footing because it considers the axial load. The procedure to compute that
actual stress depends on the relative value (ratio) of the applied axial load (N) to the maximum axial load
(Pmax), the applied moment (M) and the geometry of the section as shown below:
2
c +
6
d
M = Pmax
P
N = ratio
max
If the ratio is less than 0.003, the section is considered to behave as a flexural member. Hence, the
stress in the reinforcement, fs, is computed using the procedure described in Section 3.5.1.4 for the
footing (i.e., the axial load is neglected).
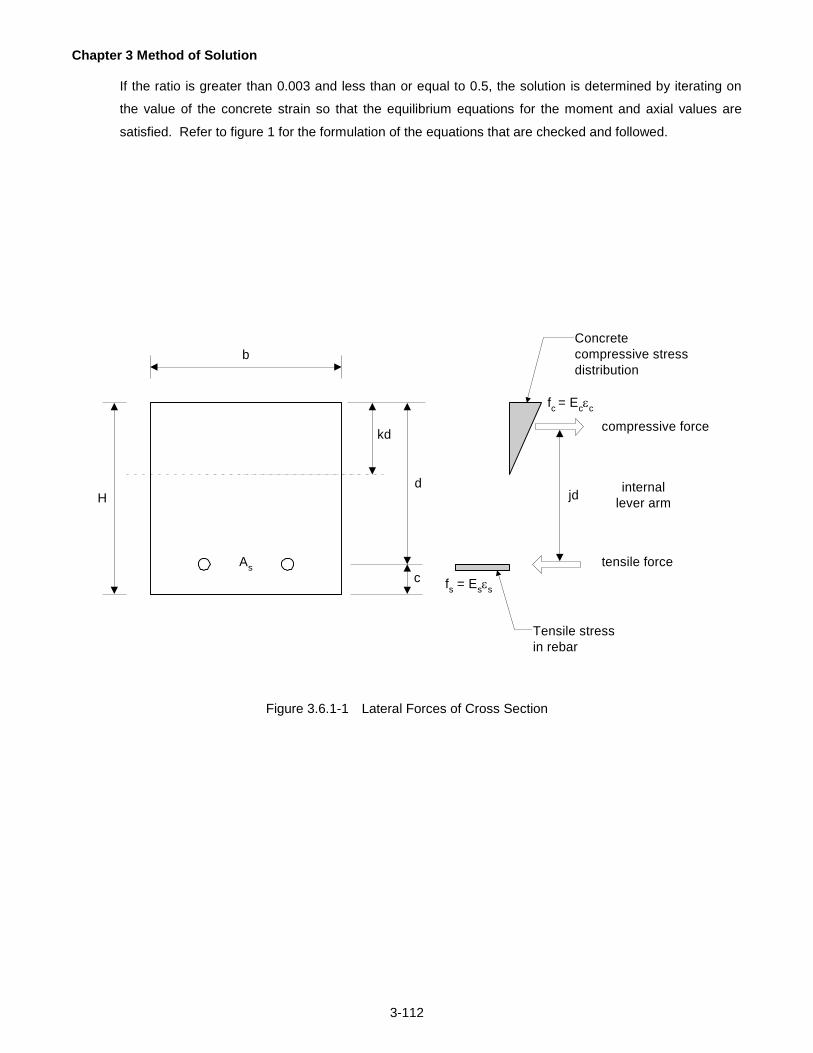
Chapter 3 Method of Solution
3-112
If the ratio is greater than 0.003 and less than or equal to 0.5, the solution is determined by iterating on
the value of the concrete strain so that the equilibrium equations for the moment and axial values are
satisfied. Refer to figure 1 for the formulation of the equations that are checked and followed.
d
As
b
kd
tensile force
compressive force
internal
lever arm
Concrete
compressive stress
distribution
Tensile stress
in rebar
fs = E
s
s
fc = E
c
c
H
c
jd
Figure 3.6.1-1 Lateral Forces of Cross Section

Chapter 3 Method of Solution
3-113
(a) Abutment Type I (b) Abutment Type II
Analysis Locations
H
H/4
H/4
H/4
H/4
B/2
B
B/2
B/2
B
B/2
(c) Abutment without backwall
H
H/4
H/4
H/4
H/4
(d) Retaining Wall
H
H/4
H/4
H/4
H/4
Backwall
Seat Level
A
Backwall
Seat Level
B
A A
A
C
B B
B
C C
C
D D
DD
H
H/4
H/4
H/4
H/4
Figure 3.6.1-2 Stem and Backwall Points of Analysis

Chapter 3 Method of Solution
3-114
From internal equilibrium of axial load and strain compatibility:
N = C - T (1)
2
bkdεE = C cc (2)
AEε k
k- 1 = AεE = T sscsss
(3)
Where: kd = depth to neutral axis from extreme compressive fiber
c = strain in concrete at extreme compressive fiber
s = strain in tensile reinforcement
N = axial load
C = concrete compressive strength
T = tensile strength of reinforcement
As = area of mild steel reinforcement
Substitute (2) and (3) into (1) and simplify for k to get:
0 = N
E)A( -1-
N
E)A( k +
2N
bdE k
sscssccc2
εεε (4)
From stain compatibility:
3
k- 1 = j and ; Eε
k
k-1 = Eε = f scsss
(5)
From moment equilibrium: (6)
c -
2
H N - Cjd = M service (7)
Solution: Initialize concrete strain c to 0.008, solve for k using equation (4), and check moment
equilibrium (7). If Mcalc is not within 0.1% of Mservice, perform new calculations with revised
strain.
The assumed concrete strain value is used to compute the neutral axis depth based on the equilibrium
equation for the axial load (equation 4). The neutral axis depth and concrete strain are used to compute
the internal moment of the section (equation 7). The moment is compared to the applied moment. If the
comparison is not within an acceptable tolerance (0.1%), the concrete strain value is revised. The
program will stop after 50 iterations if convergence has not occurred and print out an error message.

Chapter 3 Method of Solution
3-115
When the ratio is greater than 0.5, the program iterates on the depth of the neutral axis so that the
equilibrium equations for the moment and axial values are satisfied. The formulation of the equations that
are checked include:
From internal equilibrium of axial load and strain compatibility:
N = C -T (1)
2
bkdεE = C cc (2)
AEεk
k- 1 = AεE = T sscsss
(3)
Where: kd = depth to neutral axis from extreme compressive fiber
c = strain in concrete at extreme compressive fiber
s = strain in tensile reinforcement
N = axial load
C = concrete compressive strength
T = tensile strength of reinforcement
As = area of mild steel reinforcement
Substitute (2) and (3) into (1) and simplify for c to get:
k)- (1EA2- bdkE
2Nk = ε
ss2
c
c (4)
From moment equilibrium:
c -
2
H N - Cjd = M service (5)
Solution: Start iterating with k = 0.3; solve for c using equation (4); then evaluate concrete
compressive strength (2) given k and c; check moment equilibrium (5). If Mcalc is not
within 0.1% of Mservice, perform new calculations with revised neutral axis depth, k. Iterate
for a maximum of 50 iterations.
The assumed neutral axis depth is used to compute the concrete strain at the extreme compressive fiber
of the cross section (equation 4). The neutral axis depth and concrete strain are used to compute the
internal moment of the section (equation 5). The moment is compared to the applied moment. If the
comparison is not within an acceptable tolerance (0.1%), the concrete strain value is revised. The
program will stop after 50 iterations if convergence has not occurred and print out an error message.

Chapter 3 Method of Solution
3-116
3.6.2 Specification Checking
The specification checks of the stem locations are similar to those of the spread footing locations. The
difference between the two is the presence of the axial force component. The subsections below
describe the details of the checks.
3.6.2.1 Strength Considerations - Moment/Axial Capacity
The strength check consists of evaluating the Moment and Axial capacity of the section based on a singly
reinforced section where the reinforcement of the back face is considered the tensile steel. If the moment
in the section is negative the program will then calculate the capacity of the section using the front face
temperature and shrinkage steel as the tensile steel. If the temperature and shrinkage steel is being used
for capacity, a message is shown in the output. The capacity values are compared to the actual values as
determined by analysis.
Figure 1 shows the nominal capacity (dashed line) and the factored capacity (solid line) that incorporates
the phi factor ().The phi factor varies from 0.75 for compression-controlled sections to 0.90 for tension
controlled sections (See Section 3.5.2.5).

Chapter 3 Method of Solution
3-117
P (tension)
A' (M'app, P'app)
MMcap(2)
(1)
(3)
(4)
(5)
(6)
Po
P (compression)
0.8 Po
Pcap
0
A
B
(Mapp, Papp)
Legend
unfactored
factored
(7)
(8)
(9)
(10)
(13)
(12)
(11)
(14)
Figure 3.6.2.1-1 Moment-Interaction Diagram of a Singly Reinforced Section
The seven points, (1) to (7), correspond to the following unfactored conditions, as shown in Figure 1:
1. Pure axial tensile strength (based on reinforcement only)
fA Pyst)(1
01 )(M
2. Pure flexural strength (axial capacity = 0.0)
bd
Ast
02 )(P
d
0.85f
f
2 d bdf M
c
y
y ')(2

Chapter 3 Method of Solution
3-118
3. Tension controlled strain condition
𝜀𝑐𝑢 = 0.003
𝜀𝑡 = 𝜀𝑡𝑙 = 0.005 (for 𝑓𝑦 ≤ 75.0 𝑘𝑠𝑖)
𝜀𝑡 = 𝜀𝑡𝑙 = 0.005 +(𝑓𝑦−75.0)(0.003)
25.0 (for 75.0 𝑘𝑠𝑖 < 𝑓𝑦 ≤ 100.0 𝑘𝑠𝑖)
𝑑" = 𝑑 − ℎ
2
𝑐 = 𝜀𝑐𝑢𝑑
𝜀𝑡+ 𝜀𝑐𝑢
𝑎 = 𝛽1𝑐
𝐶𝑐 = 0.85𝑓𝑐′𝛽1𝑐𝑏
𝑇 = 𝐴𝑠𝑡𝑀𝐼𝑁(𝑓𝑦, 𝜀𝑡𝐸𝑠)
𝑃(3) = 𝐶𝑐 − 𝑇
𝑀(3) = 𝐶𝑐 (𝑑 − 𝑎
2− 𝑑") + 𝑇𝑑"
4. Balanced condition
𝜀𝑐𝑢 = 0.003
𝑑" = 𝑑 −ℎ
2
𝜀𝑡 = 𝑓𝑦
𝐸𝑠
𝑐 = 𝜀𝑐𝑢𝑑
𝜀𝑡+ 𝜀𝑐𝑢
𝑎 = 𝛽1𝑐
𝐶𝑐 = 0.85𝑓𝑐′𝛽1𝑐𝑏
𝑇 = 𝐴𝑠𝑡𝑀𝐼𝑁(𝑓𝑦, 𝜀𝑡𝐸𝑠)
𝑃(4) = 𝐶𝑐 − 𝑇
𝑀(4) = 𝐶𝑐 (𝑑 − 𝑎
2− 𝑑") + 𝑇𝑑"
5. Compression controlled strain condition
𝜀𝑐𝑢 = 0.003
𝜀𝑡 = 𝜀𝑐𝑙 = 0.002 (for 𝑓𝑦 ≤ 60.0 𝑘𝑠𝑖)
𝜀𝑡 = 𝜀𝑐𝑙 = 0.002 +(𝑓𝑦−60.0)(0.002)
40.0 (for 60.0 𝑘𝑠𝑖 < 𝑓𝑦 ≤ 100.0 𝑘𝑠𝑖)
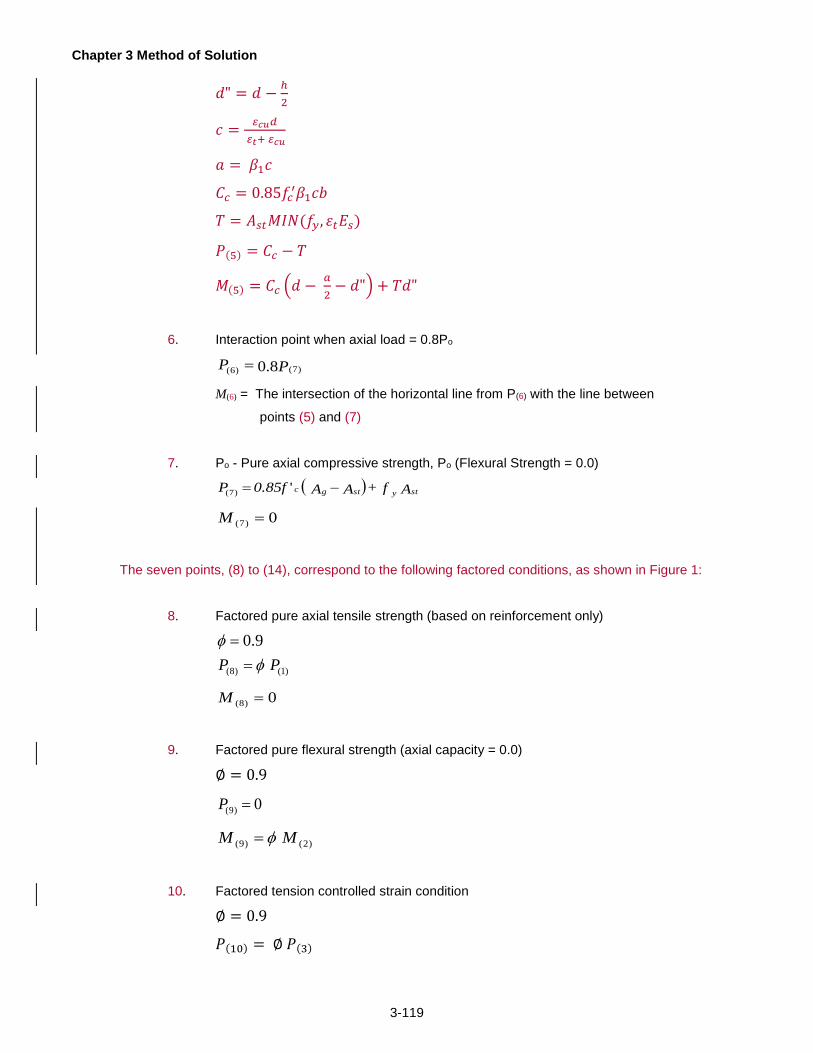
Chapter 3 Method of Solution
3-119
𝑑" = 𝑑 −ℎ
2
𝑐 =𝜀𝑐𝑢𝑑
𝜀𝑡+ 𝜀𝑐𝑢
𝑎 = 𝛽1𝑐
𝐶𝑐 = 0.85𝑓𝑐′𝛽1𝑐𝑏
𝑇 = 𝐴𝑠𝑡𝑀𝐼𝑁(𝑓𝑦, 𝜀𝑡𝐸𝑠)
𝑃(5) = 𝐶𝑐 − 𝑇
𝑀(5) = 𝐶𝑐 (𝑑 − 𝑎
2− 𝑑") + 𝑇𝑑"
6. Interaction point when axial load = 0.8Po
PP 8.0 )7()6(
M(6) = The intersection of the horizontal line from P(6) with the line between
points (5) and (7)
7. Po - Pure axial compressive strength, Po (Flexural Strength = 0.0)
A f + A A 0.85f P stystgc ')7(
0)7( M
The seven points, (8) to (14), correspond to the following factored conditions, as shown in Figure 1:
8. Factored pure axial tensile strength (based on reinforcement only)
PP )1()8(
9.0
0)8( M
9. Factored pure flexural strength (axial capacity = 0.0)
∅ = 0.9
0)9( P
MM )2()9(
10. Factored tension controlled strain condition
∅ = 0.9
𝑃(10) = ∅ 𝑃(3)
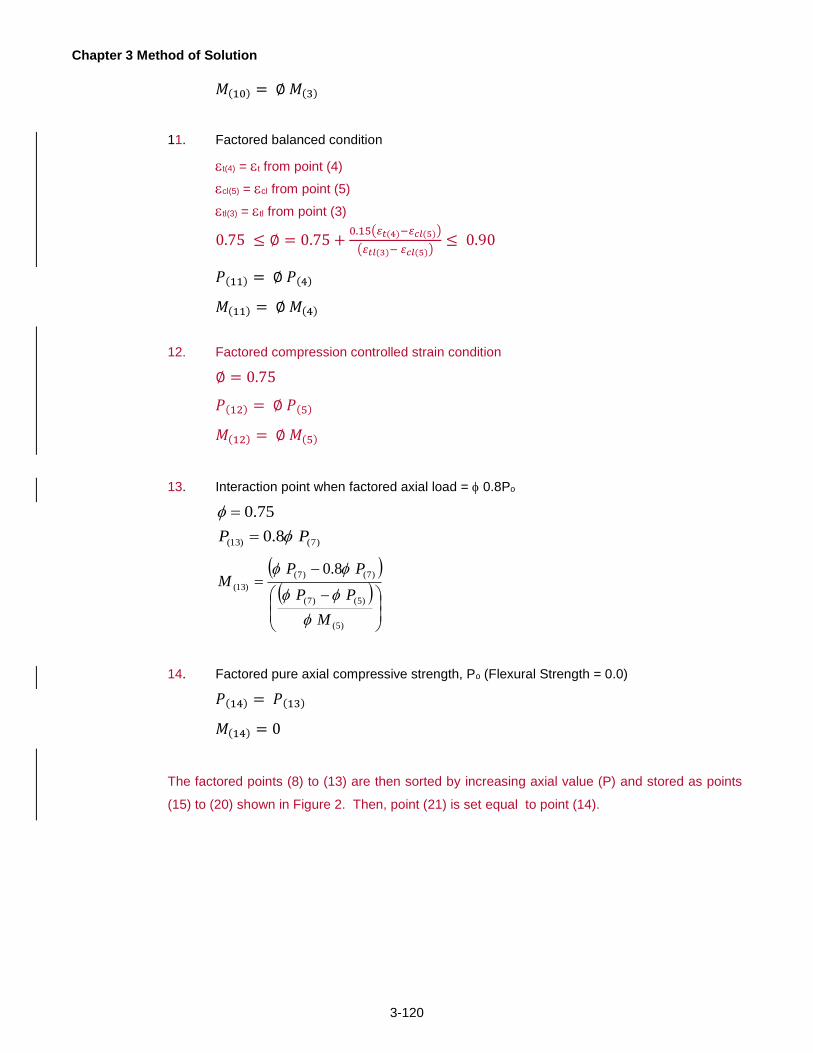
Chapter 3 Method of Solution
3-120
𝑀(10) = ∅ 𝑀(3)
11. Factored balanced condition
t(4) = t from point (4)
cl(5) = cl from point (5)
tl(3) = tl from point (3)
0.75 ≤ ∅ = 0.75 +0.15(𝜀𝑡(4)−𝜀𝑐𝑙(5))
(𝜀𝑡𝑙(3)− 𝜀𝑐𝑙(5))≤ 0.90
𝑃(11) = ∅ 𝑃(4)
𝑀(11) = ∅ 𝑀(4)
12. Factored compression controlled strain condition
∅ = 0.75
𝑃(12) = ∅ 𝑃(5)
𝑀(12) = ∅ 𝑀(5)
13. Interaction point when factored axial load = 0.8Po
)7()13( 8.0
75.0
PP
)5(
)5()7(
)7()7(
)13(
8.0
M
PP
PPM
14. Factored pure axial compressive strength, Po (Flexural Strength = 0.0)
𝑃(14) = 𝑃(13)
𝑀(14) = 0
The factored points (8) to (13) are then sorted by increasing axial value (P) and stored as points
(15) to (20) shown in Figure 2. Then, point (21) is set equal to point (14).

Chapter 3 Method of Solution
3-121
P (tension)
A' (M'app, P'app)
MMcap
P (compression)
Pcap
0
A
B
(Mapp, Papp)
Legend
CM – compression
TR – transition
TN - tension
(15)
(16)
(17)
(20)
(19)
(18)
(21)CM
CM
TR
TR
TN
TN
Figure 3.6.2.1-2 - Factored Moment-Interaction Diagram
Where:
= Resistance factor
Ast is the area of the reinforcement
1= 0.85 for f’c <= 4 ksi
1= 0.85 − 0.05 ∗ (𝑓𝑐′ − 4.0) for f’c > 4, but not less than 0.65 (A5.7.2.2)
d is the effective depth
h is the total structural depth
εcu is the crushing concrete strain (0.003)
εt is net tensile strain at nominal resistance
εtl is the tension controlled strain limit
εcl is compression-controlled strain limit
a is the depth rectangular stress distribution
b is the width of the section (1.0)
c is the distance from outer compressive fiber to neutral-axis
Cc is the concrete compressive force
T is the steel tensile force

Chapter 3 Method of Solution
3-122
For a given area of (fully developed) reinforcement, the Moment-Axial Interaction diagram is evaluated for
the geometric and material properties of the section. Seven points, (15) to (21), on the interaction
diagram are computed explicitly as shown in Figures 1 and 2.
Figure 2 illustrates how the section capacity is determined. A line extending from the origin, point O,
through point A (or A') intersects the factored interaction diagram at point B. The coordinates of point A
define a case where the applied loading lies within the interaction space. Point A' represents a case
when coordinates of the applied loading (M'app and P'app) values lie outside the interaction space. In
either case, the coordinates of point B define the axial and moment capacity for the given load case.
The applied loads from every strength limit state case are used to evaluate the capacity since the
governing values cannot be determined by inspection. The case that yields the lowest performance ratio
(capacity/demand) is considered to be the governing case.
3.6.2.2 Spacing Requirements (maximum and minimum)
The procedure used to check the spacing of reinforcement is identical to that used in the footing. Please
refer to Section 3.5.2.6 for a description of the reinforcement spacing check.
3.6.2.3 Minimum Area
The procedure used to check the minimum area of reinforcement is identical to that used in the footing.
Please refer to Section 3.5.2.7 for a description of the minimum area of reinforcement check.
3.6.2.4 Serviceability Allowable Stress
The procedure used to check allowable stress is identical to that used in the footing. Please refer to
Section 3.5.2.8 for a description of the allowable stress check.
3.6.2.5 Shear
The program evaluates the shear capacity based on the properties of the concrete section. The
procedure used is identical to that used in the footing. Please refer to Section 3.5.2.9 for a description of
the shear capacity check.
Chapter 3 Method of Solution
3-123
3.6.3 Design of a Stem Section
The stem reinforcement design follows the footing algorithm. The program will compute the area of steel
required for the applicable strength limit states. The area is determined by considering the combinations
of applied factored moment (maximum and minimum) and axial load (maximum and minimum) for a given
limit state. This is described in Section 3.6.2.1. The governing area of steel is the maximum area that
was required based on all of the applicable load combinations.
The spacing for each bar size is evaluated for the governing area of steel. The bar spacing is reduced to
the nearest user entered increment as described in Section 3.5.3.
For each bar size and spacing, the serviceability requirements are applied as described in Sections
3.6.2.2 through 3.6.2.4. They include minimum and maximum spacing requirements, minimum area of
steel and allowable stress.
Furthermore, stem bars are considered to be hooked into the footing.
After the bar spacing is determined (strength and service checks), the program will check for over-
reinforcement (Section 3.5.2.5). Bar sizes that fail this check are flagged in the output results table.
The development length of each bar is computed by the program. The development length is an
indication of the bar length that is required to develop the tensile stress. It is computed based on the
section properties at the base of the stem. Two development lengths are calculated for each bar size;
one for hooked bars and one for straight bars. Bar sizes that have hooked bar development lengths
greater than the footing thickness less the bottom cover are rejected. Typically, large bars cannot be
developed in relatively thin footings. These bars are flagged in the output results table.
The program will try to determine a theoretical cutoff point for each bar as shown in Figure 1(a). The
theoretical cutoff point is defined as that point where every other bar is no longer required in the section,
i.e., for a given bar size, twice the rebar spacing at the theoretical cutoff location must satisfy the strength,
serviceability, and shear requirements. Serviceability includes service-level crack control spacing checks
and minimum and maximum bar spacing checks. The cutoff point must be greater than or equal to the
straight bar development length of the given bar. In the figure, the rebar spacing at the base is 6 inches.
Hence, the theoretical cutoff point is located where a 12 inch spacing is acceptable.
The actual (or physical) cutoff point for a bar is determined by adding the extension length of the bar to
the theoretical cutoff point. The extension length for each bar is the larger of:

Chapter 3 Method of Solution
3-124
effective depth of the section at the theoretical cutoff point; or,
15 bar diameters; or,
12 inches.
As Figure 1(a) shows, the physical cutoff points are not permitted within 2 ft. of the top of the stem. For
each bar size, the program will identify those bar sizes that can be cutoff. In some cases (typically large
bars), the allowable bar maximum spacing controls the spacing requirement at the base of the stem.
Such bars cannot be cutoff.
The length of bars that are not cutoff will be the stem height less 3 inches. Figure 2 illustrates the stem
height for Abutment Types I and II.
The program will also compute the lap length of each bar. The lap length is the bar overlap that is
required to splice bars as shown in Figure 1(b). Typically, lapped bars can be found in very tall stems -
where it is impractical to have bar lengths that extend from the footing to the top of the stem. This
information is provided to be used at the discretion of the engineer.
The lap length is equal to the development length multiplied by the splice factor. The splice factor of 1.7
is based on a Class ‘C’ splice.
Lap = 1.7 Ld
The development length calculations are described in Sections 3.5.2.3 and 3.5.2.4.
If the lap length for a given bar exceeds the height of the stem or the height of the backwall (if applicable),
that bar will not be considered to be a valid solution.

Chapter 3 Method of Solution
3-125
footing 6"
stem
footing
5'
8'
stem
footing
12"
Theoretical cutoff
point - where
shear strength and
serviceability
requirements are
satisfied
Physical cutoff
point
(a) theoretical and physical cutoff locations in the stem
(b) lapped stem bars
bar lap length
bars are not cutoff
within 2 ft from top
of stem
spacing at base of stem
cutoff spacing
180o hook
180o hook
Figure 3.6.3-1 Stem Design Considerations

Chapter 3 Method of Solution
3-126
stem
height
stem
height
bars are not
cutoff within 2 ft
zone from top
of stem
(a) Abutment type I - zone where bars are not cutoff
(b) Abutment type II - zone where bars are not cutoff
bars are not
cutoff within 2 ft
zone from top
of stem
Figure 3.6.3-2 Cutoff Considerations for Abutment Types I and II
3.6.3.1 Optimum Reinforcement Selection
The program provides two optimum bar sizes for the stem with each design run. The first optimum bar
size is determined by calculating the weight of the reinforcement for the design width and then selecting

Chapter 3 Method of Solution
3-127
the bar size that results in the least weight per design width. The second optimum bar size is similar to
the first except the program considers if a bar can be cutoff and calculates the weight accordingly. In most
design cases the optimum bar for both will coincide but it is possible for the program to select two
optimum bars. It is left to the user to decide which bar size to use depending on the applicability of cutoff
stem bars in the final design.
3.6.4 Design of a Backwall Section
The backwall reinforcement design follows the stem algorithm. The program will compute the area of
steel required for the applicable strength limit states. The area is determined by considering the
combinations of applied factored moment (maximum and minimum) and axial load (maximum and
minimum) for a given limit state. This is described in Section 3.6.2.1. The governing area of steel is the
maximum area that was required based on all of the applicable load combinations.
The spacing for each bar size is evaluated for the governing area of steel. The program can then,
through user input, either set the bar spacing to be a multiple of the optimum stem bar spacing or set the
bar spacing independent of the optimum stem bar spacing. If the stem bars are cutoff and the user
requests the backwall bars be aligned with the stem bars, then the backwall spacing is set to either 2x the
stem bar spacing, or 4x the stem bar spacing (whichever is less than 18 inches and provides the least
amount of reinforcement required). For cases when the program cannot find a valid design at the stem
bar spacing with cutoffs, the program will reduce the backwall bar spacing to match the stem bar spacing
without cutoffs and proceed through the design algorithm once more.
For each bar size and spacing, the serviceability requirements are applied as described in Sections
3.6.2.2 through 3.6.2.4. They include minimum and maximum spacing requirements, minimum area of
steel and allowable stress. In addition, the program also calculates the splice length for each bar based
on the development length described in Section 3.5.2.3.
If the Asprov/Asreqd < 2 – Class C splice
dspt l = l *7.1
If the Asprov/Asreqd ≥ 2 – Class B splice
dspt l = l *3.1
The splice length is then compared to the available height in the backwall to develop the splice.

Chapter 3 Method of Solution
3-128
Available Height
in Backwall(BH)
Backwall Bar Cover
Available Height
in Backwall(BH)
Backwall Bar CoverPaving Notch Depth
Backwall W/O Paving NotchBackwall W/ Paving Notch
Figure 3.6.4-1 Backwall Height for Splice Check
If the splice length of a bar exceeds the backwall height, the program will solve for a new reduced bar
spacing that may allow the splice to fit within the backwall height. The new splice length is set equal to the
backwall height and a new area of steel (Asprov_new) is solved for. The new area provided is used to
determine the new bar spacing. A limit is placed on the ratio used to increase the area of steel to prevent
the development length for the new spacing from being less than the 12 in minimum. Also, the area of
steel in the Asprov_new equation is limited to be no less than the area of steel required for strength.
𝑠𝑛𝑒𝑤=
𝐴𝑏𝑎𝑟∗12𝐴𝑠𝑝𝑟𝑜𝑣_𝑛𝑒𝑤
𝐴𝑠𝑝𝑟𝑜𝑣_𝑛𝑒𝑤 = 𝑀𝐴𝑋(𝐴𝑠𝑝𝑟𝑜𝑣_𝑜𝑙𝑑 , 𝐴𝑠𝑟𝑒𝑞𝑑) ∗ 𝑅𝑎𝑡𝑖𝑜
𝑅𝑎𝑡𝑖𝑜 = 𝑀𝐼𝑁 [𝑙𝑠𝑝𝑡_𝑜𝑙𝑑
𝐵𝐻,𝑙𝑑_𝑜𝑙𝑑
12]
Where:
snew = Bar spacing needed to so the splice will fit within the backwall (in)
Asprov_new = Area of steel needed so splice will fit within the backwall (in2)
Asreqd = Area of steel required to satisfy backwall strength requirements (in2)
Asprov_old = Area of steel provided in backwall for specified bar size (in2)
Asbar = Area of the specified bar (in2)
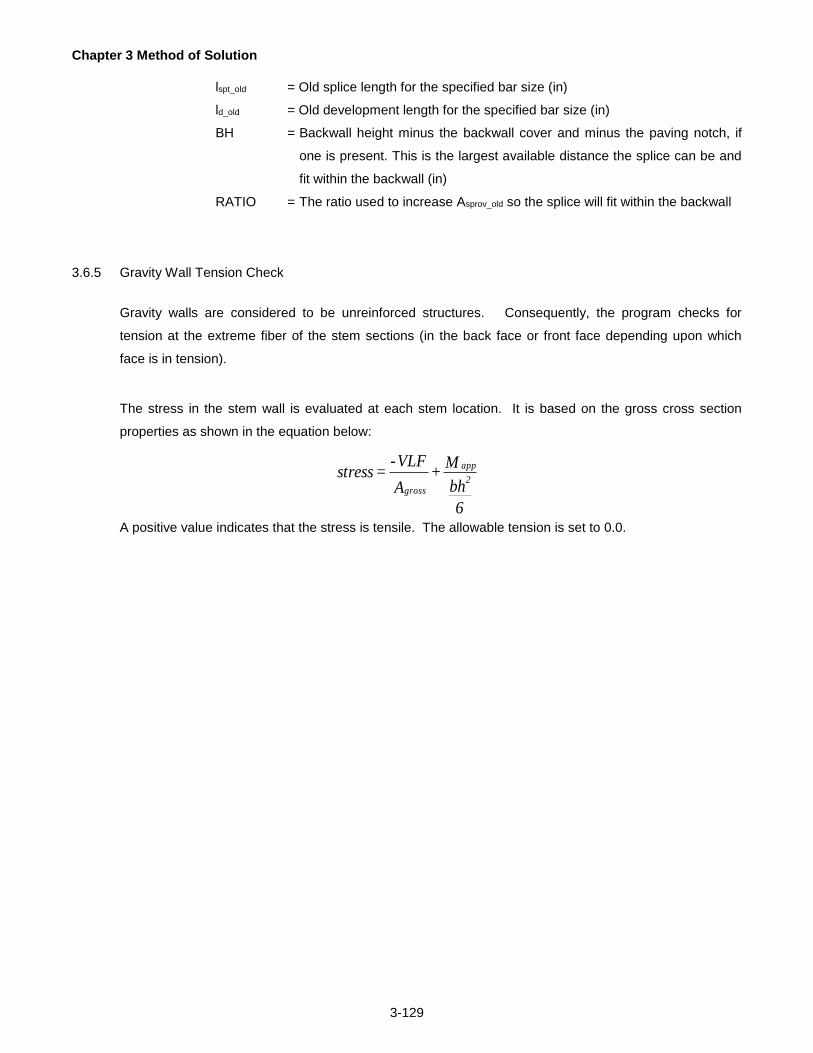
Chapter 3 Method of Solution
3-129
lspt_old = Old splice length for the specified bar size (in)
ld_old = Old development length for the specified bar size (in)
BH = Backwall height minus the backwall cover and minus the paving notch, if
one is present. This is the largest available distance the splice can be and
fit within the backwall (in)
RATIO = The ratio used to increase Asprov_old so the splice will fit within the backwall
3.6.5 Gravity Wall Tension Check
Gravity walls are considered to be unreinforced structures. Consequently, the program checks for
tension at the extreme fiber of the stem sections (in the back face or front face depending upon which
face is in tension).
The stress in the stem wall is evaluated at each stem location. It is based on the gross cross section
properties as shown in the equation below:
6
bh
M +
A
VLF - = stress
2
app
gross
A positive value indicates that the stress is tensile. The allowable tension is set to 0.0.

Chapter 3 Method of Solution
3-130
3.7 DESIGN CONSIDERATIONS
The algorithm to select the optimal design solution varies for each type of footing (spread, pile caisson, or
pedestal). The following sections describe the unique features of the design algorithm and the choice of the
optimal design solution for each footing type - spread in Section 3.7.1, pedestal in Section 3.7.2, and pile/caisson
in Section 3.7.3.
3.7.1 Spread Footings
This section addresses the special considerations that are applied to spread footings. Design algorithm
issues are addressed in Section 3.7.1.1. Design optimization issues are described in Section 3.7.1.2.
3.7.1.1 Design Algorithm
The algorithm follows the generic procedure of iterating through the footing geometry configurations that
were described in Section 3.2.1. Footing Stability and Reinforcement design checks are applied for each
footing configuration. Stability checks are described in Section 3.4.1. Reinforcement checks are
identified in Section 3.5.2.
3.7.1.2 Evaluation of Optimal Design
The program will evaluate the cost of all successful configurations (all strength and serviceability checks
were satisfied). The cost of the footing is a relative measure of optimal design. The cost function for
spread footings may be based solely on the footing volume or on the cost required for the concrete
footing and the cost of the excavation (if specified) and backfill. These procedures apply to footings
founded on either soil or rock. The choice is specified in the SPR command (Section 5.11).
The volume option only considers the footing area per unit length, i.e. the volume is the footing thickness
multiplied by the footing width multiplied by a unit length of the substructure. If two configurations have
the same volume, the program will select the configuration with the maximum toe projection.
If the cost option is selected, the user must specify if the structure is situated in a cut or in a fill. In either
case, the cost includes the cost of the volume of concrete required for the footing. The unit costs for
concrete, excavation (if specified), and backfill must be entered by the user. The costs are based on a
unit length of the substructure.
The cost of a structure (per unit length of the substructure) situated in a fill will be:
the cost of the concrete footing (footing volume times concrete cost); plus,
the cost of the backfill material (fill area times cost of backfill).

Chapter 3 Method of Solution
3-131
The cost of a structure (per unit length of the substructure) situated in a cut will be:
the cost of the concrete footing (footing volume times concrete cost); plus,
the cost of the excavation (cut area times cost of excavation); plus,
the cost of the backfill material (fill area times cost of backfill).
Costs of excavation, backfill and concrete are specified in units of $/yd3 in the SPR command (Section
5.11).
A structure is considered to be situated in a cut if part of the original ground surface must be excavated
(i.e. cut) in order to construct the structure.
If the user specifies that the structure is in a cut, the program will compute the cost for both the
excavation and backfill. If the structure is situated in a fill, the program evaluates the cost of the backfill
only. The program assumes a unit length of the substructure, hence the description is based on the cut
area and the fill area.
Figure 1 shows the cross sectional area of the material that is cut. It is applicable for footings in either
soil or rock. The area is bound: on the top by the original ground line ED; at the bottom by the elevation
of the footing base, line FC, and on the sides by lines (EF and DC) that have a slope of 1 vertical unit per
1.5 horizontal units. Point F is located 1 ft to the left of the toe. Point C is located 1 ft to the right of the
heel.
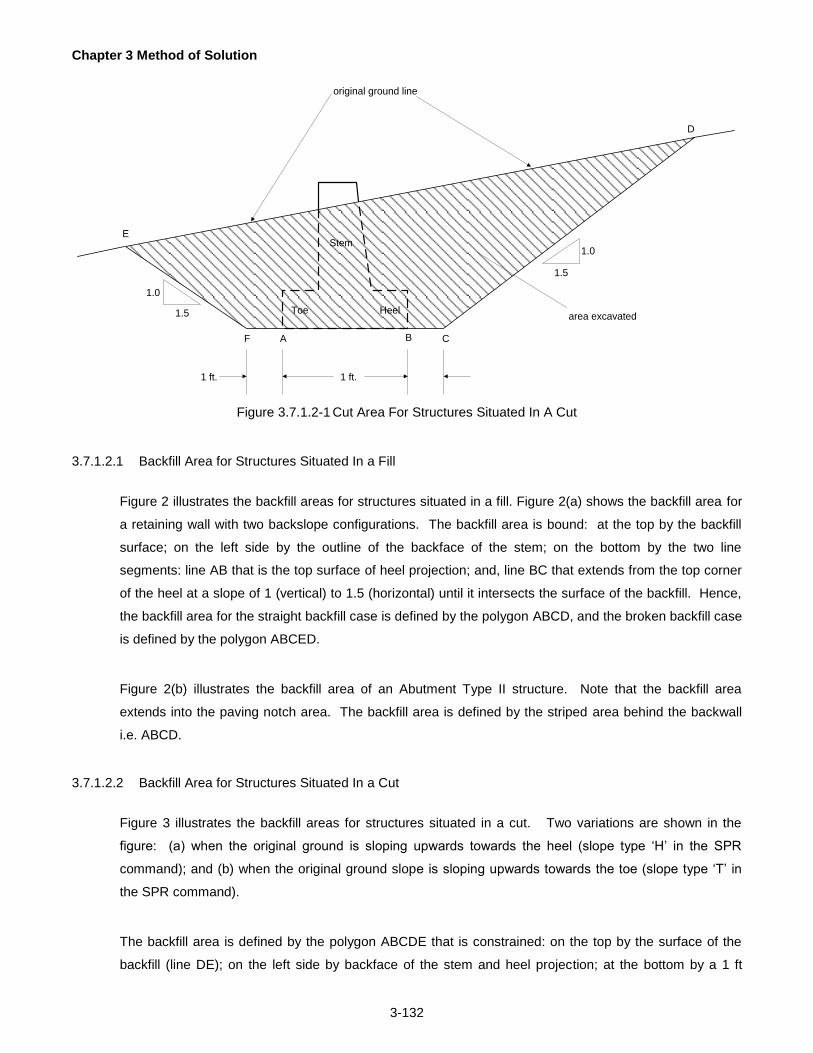
Chapter 3 Method of Solution
3-132
A B C
D
EStem
Toe Heel
F
1.5
1.0
1.5
1.0
area excavated
original ground line
1 ft. 1 ft.
Figure 3.7.1.2-1 Cut Area For Structures Situated In A Cut
3.7.1.2.1 Backfill Area for Structures Situated In a Fill
Figure 2 illustrates the backfill areas for structures situated in a fill. Figure 2(a) shows the backfill area for
a retaining wall with two backslope configurations. The backfill area is bound: at the top by the backfill
surface; on the left side by the outline of the backface of the stem; on the bottom by the two line
segments: line AB that is the top surface of heel projection; and, line BC that extends from the top corner
of the heel at a slope of 1 (vertical) to 1.5 (horizontal) until it intersects the surface of the backfill. Hence,
the backfill area for the straight backfill case is defined by the polygon ABCD, and the broken backfill case
is defined by the polygon ABCED.
Figure 2(b) illustrates the backfill area of an Abutment Type II structure. Note that the backfill area
extends into the paving notch area. The backfill area is defined by the striped area behind the backwall
i.e. ABCD.
3.7.1.2.2 Backfill Area for Structures Situated In a Cut
Figure 3 illustrates the backfill areas for structures situated in a cut. Two variations are shown in the
figure: (a) when the original ground is sloping upwards towards the heel (slope type ‘H’ in the SPR
command); and (b) when the original ground slope is sloping upwards towards the toe (slope type ‘T’ in
the SPR command).
The backfill area is defined by the polygon ABCDE that is constrained: on the top by the surface of the
backfill (line DE); on the left side by backface of the stem and heel projection; at the bottom by a 1 ft

Chapter 3 Method of Solution
3-133
horizontal line (AB) extending from the base of the heel (point A); on the right side by two line segments;
one a vertical segment BC that intersects the original ground line 1 ft to the right of the heel, and another
segment that extends from the intersection point (c) at a slope of 1 (vertical) to 1.5 (horizontal) until it
intersects the backfill at point D.
3.7.1.2.3 Special Cases of Backfill Areas for Structures Situated In a Cut
Figure 4(a) illustrates the case when the original ground is above the backfill elevation. The backfill area
is bound: on the top by the backfill surface (line CD); on the left side by the backface of the stem and heel
projection; on the bottom by a line (AB) extending 1 ft to the right from the base of the heel; on the right
side by a vertical line (BC) situated 1 ft from the right of the heel that intersects the backfill.
Figure 4(b) illustrates the case when the original ground slope (type ‘H’) is steeper than 1 (vertical) to 1.5
(horizontal). This case is a variation of that shown in Figure 3.7.1.2.2-3(a). The difference is that the line
segment CD has a steeper ground slope value instead of the 1 (vertical) to 1.5 (horizontal) slope.
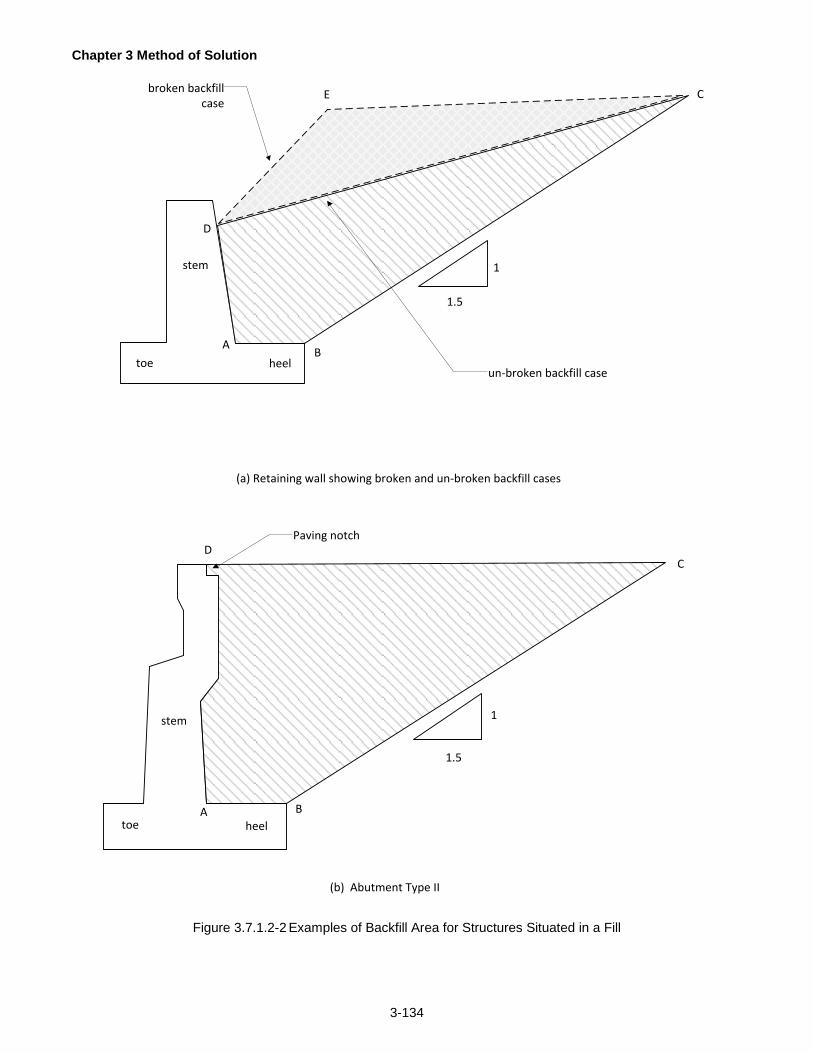
Chapter 3 Method of Solution
3-134
1
1.5
1
1.5
C
D
A B
DC
un-broken backfill case
broken backfill case
E
toe heel
stem
heeltoe
stem
(a) Retaining wall showing broken and un-broken backfill cases
(b) Abutment Type II
Paving notch
AB
Figure 3.7.1.2-2 Examples of Backfill Area for Structures Situated in a Fill

Chapter 3 Method of Solution
3-135
1 ft.
1 ft.
1.5
1.0
1.5
1.0
A B
C
D
E
A B
C
E
D
(a) Original ground with slope type 'H'
original ground (cut)
original ground (cut)
(b) Original ground with slope type 'T'
HeelToe
Stem
Stem
Toe Heel
Figure 3.7.1.2-3 Examples of Backfill Areas for Structures Situated in a Cut

Chapter 3 Method of Solution
3-136
1 ft.
A B
C
D
original ground
1 ft
A B
C
D
E
original ground
(a) Case when the original ground is above the backfill
(b) Case when the orignal ground has a slope steeper than 1.0 (vert) to 1.5 (horiz)
Stem
Toe Heel
HeelToe
Stem <1.5
1.0
Figure 3.7.1.2-4 Special Cases of Backfill Areas for Structures Situated in a Cut

Chapter 3 Method of Solution
3-137
If two configurations have the same cost, the program will select the configuration with the least footing
volume. If two configurations have the same cost and the same footing volume, the program will select
the configuration with the maximum toe projection.
3.7.2 Pedestal Footings
The program is iterating through a range of footing configurations as described in Section 3.2.1. For each
footing configuration (thickness, width, toe projection), the program will search for a pedestal
configuration that satisfies the design specifications.
Section 3.7.2.1 describes the algorithm that is used to iterate through the range of user-specified pedestal
configurations. The selection process for determining the optimal design from a set of successful
geometrical configurations is described in Section 3.7.2.2.
3.7.2.1 Pedestal Design Algorithm
As the program iterates through the set of footing configurations, another set of iterations is performed for
the pedestal geometry for each footing configuration. This section describes the pedestal design
procedure. It refers to the step entitled “evaluate footing checks and perform pedestal design ...” at the
top left hand side of Figure 3.2.1-2. The flowchart in Figure 1 is an overview the design procedure.
The pedestal design consists of three types of checks:
Footing stability on the pedestal (Sections 3.4.2.1 through 3.4.2.1.3)
Pedestal stability (Section 3.4.2.4) on the foundation
Footing flexure (strength and serviceability) and shear (Section 3.5.1.3)
The results of these checks will determine how the pedestal geometry is adjusted. The variations in
pedestal geometry are identified in Figure 2.
The set of pedestal configurations is defined by the user-specified maximum and minimum pedestal
width, and the width incremental value which is a program parameter set to 3 inches. The user also
specifies a range (minimum, maximum) of values for the pedestal thickness. The incremental value for
the pedestal thickness is a program parameter set to 1 inch. Figure 2 is an overview of the salient
features of the pedestal design.
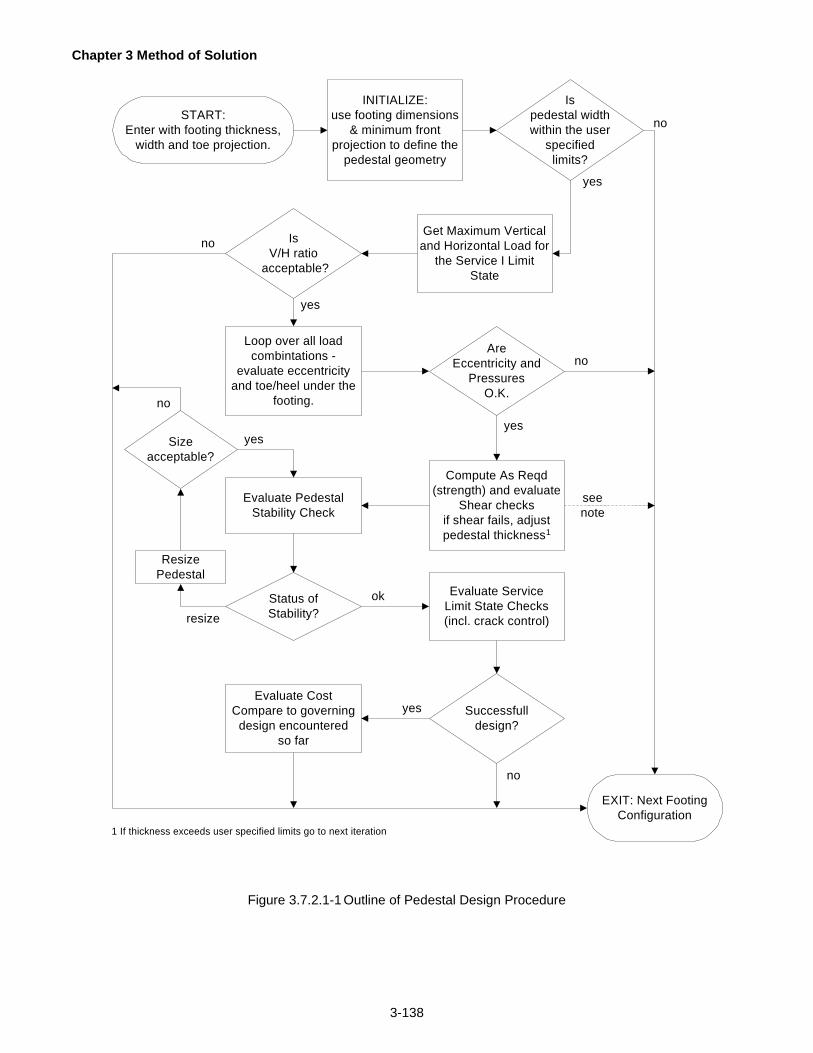
Chapter 3 Method of Solution
3-138
START:
Enter with footing thickness,
width and toe projection.
INITIALIZE:
use footing dimensions
& minimum front
projection to define the
pedestal geometry
Is
pedestal width
within the user
specified
limits?
Get Maximum Vertical
and Horizontal Load for
the Service I Limit
State
Loop over all load
combintations -
evaluate eccentricity
and toe/heel under the
footing.
Is
V/H ratio
acceptable?
Are
Eccentricity and
Pressures
O.K.
EXIT: Next Footing
Configuration
Compute As Reqd
(strength) and evaluate
Shear checks
if shear fails, adjust
pedestal thickness1
Evaluate Pedestal
Stability Check
Status of
Stability?
Resize
Pedestal
Evaluate Service
Limit State Checks
(incl. crack control)
Successfull
design?
Evaluate Cost
Compare to governing
design encountered
so far
no
yes
yes
no
no
yes
Size
acceptable?
yes
no
yes
no
1 If thickness exceeds user specified limits go to next iteration
see
note
ok
resize
Figure 3.7.2.1-1 Outline of Pedestal Design Procedure
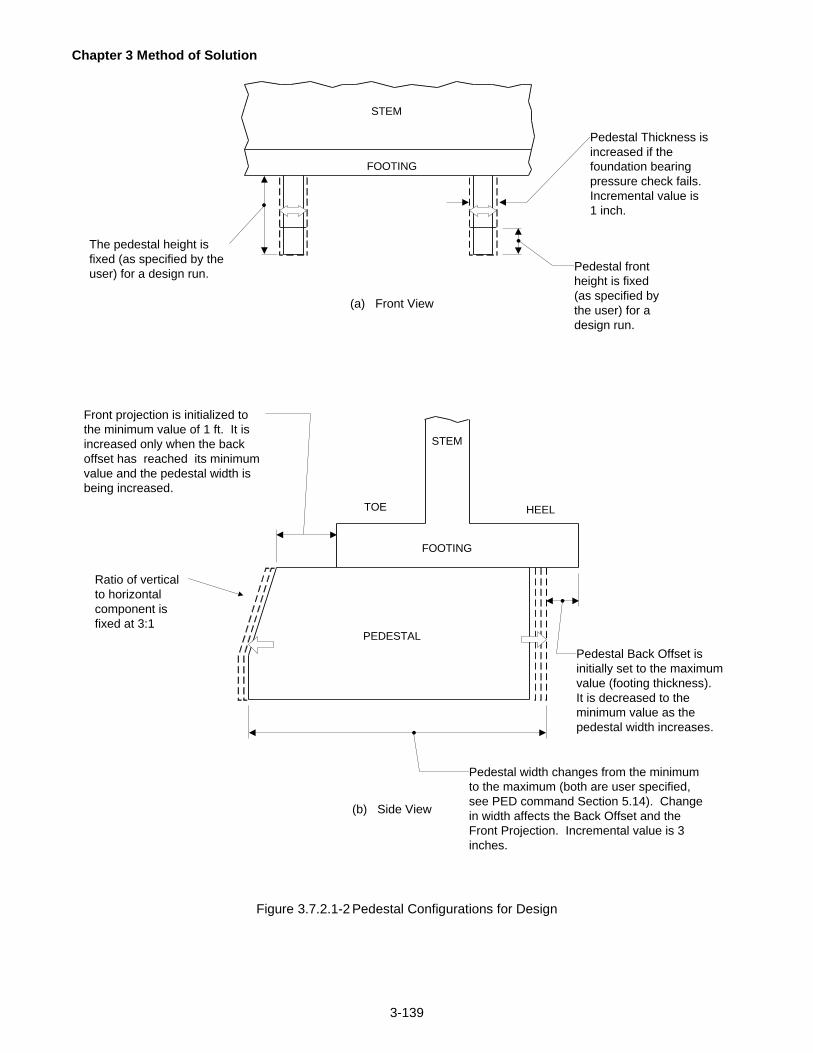
Chapter 3 Method of Solution
3-139
(a) Front View
(b) Side View
FOOTING
STEM
FOOTING
STEM
TOE HEEL
PEDESTAL
Pedestal front
height is fixed
(as specified by
the user) for a
design run.
Pedestal Thickness is
increased if the
foundation bearing
pressure check fails.
Incremental value is
1 inch.
The pedestal height is
fixed (as specified by the
user) for a design run.
Front projection is initialized to
the minimum value of 1 ft. It is
increased only when the back
offset has reached its minimum
value and the pedestal width is
being increased.
Pedestal Back Offset is
initially set to the maximum
value (footing thickness).
It is decreased to the
minimum value as the
pedestal width increases.
Pedestal width changes from the minimum
to the maximum (both are user specified,
see PED command Section 5.14). Change
in width affects the Back Offset and the
Front Projection. Incremental value is 3
inches.
Ratio of vertical
to horizontal
component is
fixed at 3:1
Figure 3.7.2.1-2 Pedestal Configurations for Design
Chapter 3 Method of Solution
3-140
The front projection as per DM-4 and the height of the pedestal as specified by the user are fixed for the
design problem. In a design run, the user should not specify the pedestal back offset nor the front
projection. The restrictions for input are described in the PED command (Section 5.14).
For a given footing configuration, the program will start with a pedestal configuration such that the front
projection is set to 1 ft., and the back offset set to the value of footing thickness. Given the footing width,
front projection, back offset and the horizontal projection of the pedestal front slope, the pedestal width
can be computed. The width must be less than the maximum width and greater than the minimum width
as specified by the user. If the maximum pedestal width is not specified, the default value is set to twice
(program parameter) the footing width.
If the pedestal width falls outside the acceptable range, that configuration is ignored by the program. The
program will skip to the next iteration in the footing iteration scheme (Section 3.2.1 through 3.4.2.3). As
the footing dimensions (width and thickness) change, new pedestal dimensions will be computed.
When the program encounters a pedestal width that satisfies the geometrical requirements described
above, the program will apply the stability (footing on pedestal) checks as described in Sections 3.4.2.1.3.
Sliding is checked by evaluating the ratio of vertical to horizontal loads. It is the first stability check to be
evaluated as shown in Figure 1. If the bearing pressure check or the eccentricity check fails, the program
will skip to the next iteration in the footing geometry.
If the footing is stable (see Section 3.4.2), the area of steel required (based on strength requirements) in
the footing in the parallel direction is evaluated. The calculation of the applied moments (strength and
service) is described in Section 3.5.1.3.1. The shear check, as described in Section 3.5.1.3.2, is also
evaluated.
If the footing shear check fails, the program will skip to the next iteration in the footing geometry.
Otherwise, the rebar spacing calculations are performed based on the area of steel required, as
described in Section 3.5.2.
In the next step, the program evaluates the pedestal stability, i.e. pedestal on foundation as described in
Section 3.4.2.4. There are three outcomes: bearing failure; eccentricity failure; or success.
If there is a bearing pressure failure, the program adjusts the pedestal thickness by an increment (by 1
inch), and the program re-evaluates the stability checks for the given width.
The pedestal thickness influences the parallel moment in the footing, because the clear spacing between
pedestals, as described in Section 3.5.1.3, changes as the pedestal thickness changes. Hence, the

Chapter 3 Method of Solution
3-141
reinforcement checks are affected by changes in the pedestal thickness. The program performs the
footing reinforcement (strength and serviceability) design only after the pedestal stability checks are
satisfied. Changes in the thickness are only applied if the foundation bearing pressure check fails. That
is, the pedestal thickness is incremented by 1 inch and the check is evaluated again if the new dimension
is within the allowable limits specified by the user.
If an eccentricity failure occurs, the pedestal is resized. As the pedestal width is increased incrementally
by 3 inches, the back offset is reduced by a corresponding decrement. When the back offset has
reached the minimum allowable value of 1 ft., further increments in the pedestal width are matched by
corresponding adjustments (increases) in the front projection.
After the pedestal width has been adjusted, the program will re-evaluate the pedestal stability. The
program will ensure that the pedestal width falls within the acceptable limits. If the limits are exceeded,
the program will skip to the next iteration of the footing geometry.
If the pedestal is stable (passes the eccentricity, bearing and settlement checks), the program will perform
serviceability (the crack control) checks for the footing rebar as described in Section 3.5.2. To ensure
that the variations in pedestal geometry have not altered the footing stability, the program will re-check
the footing and pedestal stability.
If the program can find at least one bar that satisfies the serviceability requirements, the geometry is
considered to be satisfactory and the pedestal economy (Section 3.7.2.2) is evaluated.
If the program cannot find a satisfactory solution given all of the variations in footing and pedestal
geometry, a message is printed and the program terminates.
3.7.2.2 Evaluation of Pedestal Optimal Design
If all the checks (stability, strength and serviceability) are satisfied for a given footing/pedestal
configuration, the cost of that configuration is evaluated. The cost function for pedestal footings may be
based on pedestal density or on least footing volume. It is specified in the PED command (Section 5.14).
The pedestal density is defined as the pedestal volume divided by the pedestal center-to-center spacing
(see Figure 5.14-1). The optimal design is the configuration with the least pedestal density. If two
configurations have the same density, the least footing volume is used to select the optimal design. If the
pedestal density and footing volumes are the same, the configuration with the maximum footing toe
projection is selected.

Chapter 3 Method of Solution
3-142
The footing volume is defined as the thickness times the width times the unit length of substructure. The
optimal design is the configuration with the least footing volume. If two configurations have the same
footing volume, the configuration with the least pedestal density is selected. If the footing volume and
pedestal density are the same, the configuration with the maximum footing toe projection is selected.
3.7.3 Pile/Caisson Footings
The program iterates through a range of footing configurations as described in Section 3.2.1. For each
footing configuration (thickness, width, toe projection), the program will search for an optimal pile
placement geometry. Throughout this Section, the term ‘caisson’ can be used interchangeably with the
term ‘pile’.
This section addresses the special considerations that are applied to pile footings. Design algorithm
issues are addressed in Section 3.7.3.1. Design optimization issues are described in Section 3.7.3.2.
3.7.3.1 Design Algorithm for Pile Footings
Inherent to the pile design algorithm is the use of patterns for placement of piles. This section therefore
begins by describing pile patterns used in the program. Limits on spacing between piles are then outlined
followed by a discussion of the design algorithm itself. The design algorithm is sufficiently complex as to
warrant an example found at the end of this section. The example is referred to throughout the
discussion of the design algorithm.
For each footing configuration (toe, heel, thickness and width), the program iterates through a set of pile
patterns. A pile pattern is a numeric representation of the distribution of piles throughout the footing. It
describes the number of pile rows and the number of piles in each row relative to the other rows. For
example, the ‘4-4-2-1’ pattern indicates four rows of piles. For every 1 pile in the fourth row, there are 4
piles in the first row, 4 in the second and 2 in the third. Pile patterns are identified in Table 1.
Piles and caissons may be arranged into a minimum of two rows, and a maximum of five rows. The first
digit in the pattern definition represents the relative number of piles in the row closest to the toe. The
remainder of the numbers correspond to piles in the rows that follow. Piles are positioned so that they
are aligned with piles in other rows, thus allowing easy placement of reinforcement between piles. This is
illustrated more clearly in Figures 1(a), (b) and (c) which show pile patterns ‘2-1’, ‘3-3-1’ and ‘4-4-2-1’
respectively. In this figure, the pile pattern is outlined by a dashed line. Note that the pattern is replicated
along the length of the footing.
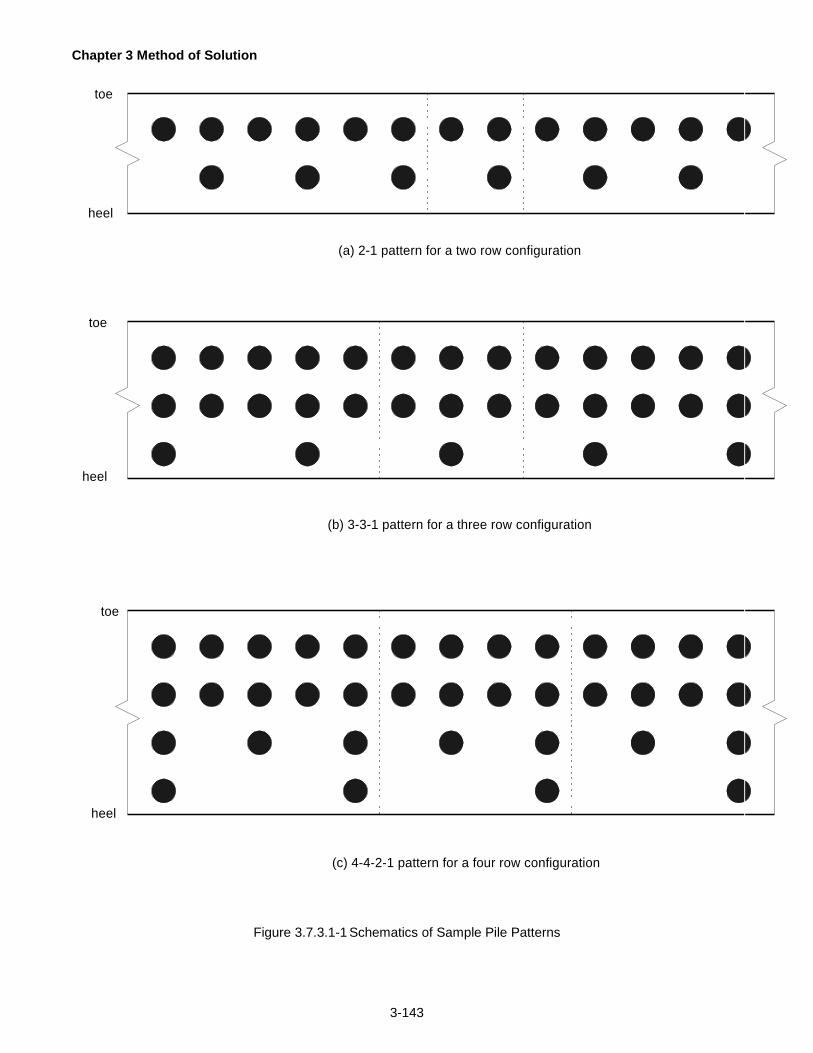
Chapter 3 Method of Solution
3-143
toe
heel
(a) 2-1 pattern for a two row configuration
toe
heel
(b) 3-3-1 pattern for a three row configuration
toe
heel
(c) 4-4-2-1 pattern for a four row configuration
Figure 3.7.3.1-1 Schematics of Sample Pile Patterns
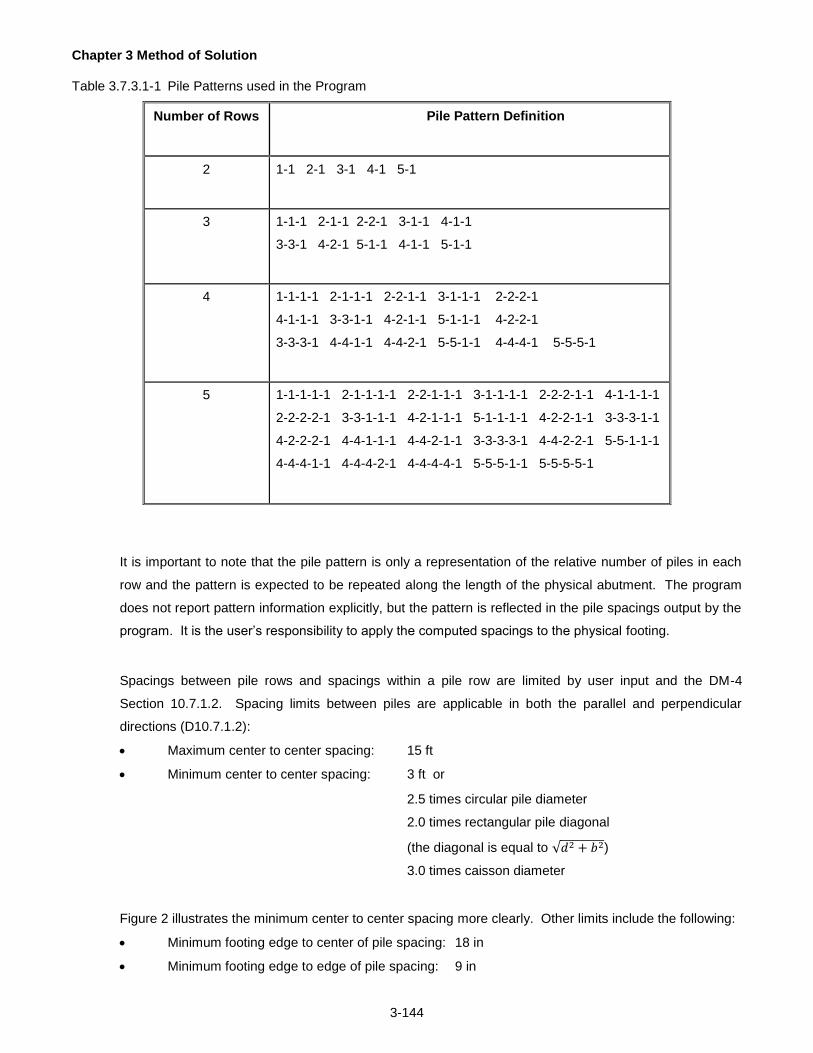
Chapter 3 Method of Solution
3-144
Table 3.7.3.1-1 Pile Patterns used in the Program
Number of Rows
Pile Pattern Definition
2
1-1 2-1 3-1 4-1 5-1
3 1-1-1 2-1-1 2-2-1 3-1-1 4-1-1
3-3-1 4-2-1 5-1-1 4-1-1 5-1-1
4
1-1-1-1 2-1-1-1 2-2-1-1 3-1-1-1 2-2-2-1
4-1-1-1 3-3-1-1 4-2-1-1 5-1-1-1 4-2-2-1
3-3-3-1 4-4-1-1 4-4-2-1 5-5-1-1 4-4-4-1 5-5-5-1
5
1-1-1-1-1 2-1-1-1-1 2-2-1-1-1 3-1-1-1-1 2-2-2-1-1 4-1-1-1-1
2-2-2-2-1 3-3-1-1-1 4-2-1-1-1 5-1-1-1-1 4-2-2-1-1 3-3-3-1-1
4-2-2-2-1 4-4-1-1-1 4-4-2-1-1 3-3-3-3-1 4-4-2-2-1 5-5-1-1-1
4-4-4-1-1 4-4-4-2-1 4-4-4-4-1 5-5-5-1-1 5-5-5-5-1
It is important to note that the pile pattern is only a representation of the relative number of piles in each
row and the pattern is expected to be repeated along the length of the physical abutment. The program
does not report pattern information explicitly, but the pattern is reflected in the pile spacings output by the
program. It is the user’s responsibility to apply the computed spacings to the physical footing.
Spacings between pile rows and spacings within a pile row are limited by user input and the DM-4
Section 10.7.1.2. Spacing limits between piles are applicable in both the parallel and perpendicular
directions (D10.7.1.2):
Maximum center to center spacing: 15 ft
Minimum center to center spacing: 3 ft or
2.5 times circular pile diameter
2.0 times rectangular pile diagonal
(the diagonal is equal to √𝑑2 + 𝑏2)
3.0 times caisson diameter
Figure 2 illustrates the minimum center to center spacing more clearly. Other limits include the following:
Minimum footing edge to center of pile spacing: 18 in
Minimum footing edge to edge of pile spacing: 9 in

Chapter 3 Method of Solution
3-145
Minimum pile footing thickness: 2.5 ft
Minimum pile embedment: 1 ft
b
d
d
Circular Piles - center to center spacing is 2.5d
(3.0d for caissons)
Rectangular Piles - center to center spacing is 2.0 times the diagonal
typical rectangular (H) pile dimenstions
2.0*diagonal
2.0*diagonal
diagonal
Figure 3.7.3.1-2 Pile Spacings - Center to Center

Chapter 3 Method of Solution
3-146
Many of the limits described above can be checked before the actual design algorithm is executed and
the program terminates if a limit is violated. Other limits are used within the design algorithm to assure
complicity with the DM-4 specifications.
The design algorithm begins by placing rows of piles and then determining the spacing of piles within the
rows. Example 1 at the end of this section represents the application of the design algorithm for a given
footing configuration and pile pattern, and is useful as a reference for the following discussion. A
convention has been adopted so that when a value is discussed, it can easily be found in the example
problem. When (#N) is found in the text, the reader is directed to line N of the example problem to see
the computed value.
For a given pattern, the program first determines whether the number of pile rows can fit within the footing
width using the minimum spacing and edge distance limits. If the number of rows will fit, the first pile row
is placed at the toe-to-first-row dimension and the last pile row is placed at the heel-to-last-row dimension.
Interior pile rows are positioned evenly across the footing width or placed close to the toe depending on
user input. Even placement results in interior pile rows placed at even intervals between the first and last
row. If rounding is desired, the interior row positions relative to the first row are rounded to the nearest
desired multiple, as input by the user. Rows placed close to the toe results in the interior rows positioned
close to the toe, spaced at the minimum rounded up spacing entered by the user. The spacing between
pile rows must conform to the minimum and maximum spacing criteria, or the pattern is rejected.
Once the pile rows have been positioned, the pile group centroid and moment of inertia are computed.
The pile group centroid is computed using this equation:
Where: CG is the centroid of the pile group relative to the toe
NPi is the number of piles in the ith row from the pattern definition
Di is the distance of the ith row from the toe of the footing
The moment of inertia used in the design algorithm is computed as if the entire pattern could fit within a
unit length of abutment. This assumption is accounted for in the design algorithm equations that
determine pile spacing within a row. Once the final layout of piles is determined, the moment of inertia is
then modified to reflect a unit length of footing.
NP
D NP =CG
i
ii

Chapter 3 Method of Solution
3-147
For the purposes of the design algorithm, the following equations are used:
Ig = ΣNPi ci 2 and ci = CG - Di
Where: Ig is the moment of inertia of the pile group
ci is the distance of the ith row to the centroid of the pile group
The program then computes vertical pile loads and lateral loads for the pile group for each limit state load
combination except for the Service limit state. Vertical pile loads are calculated using this equation:
I
c e V+
NP
V = V
g
iftg
tot
ftg
i
Where: Vi is the vertical load on a pile in the ith row
Vftg is the vertical load (per unit length) acting at the footing bottom
NPtot is the total number of piles from the pattern definition
e is the distance from the vertical load to the centroid of the pile group
The objective is now to determine the pile spacing within each row of piles. The program finds the
greatest spacing allowed by the limits previously described so as to minimize the number of piles required
to carry the load. The program batters piles if necessary to carry the load, starting with the row closest to
the toe and moving toward the heel. If the user does not specify batter information in the input, the
program will only consider an all vertical pile foundation and the references to battered piles that follow
are not applicable.
The user enters two types of pile resistance which are used to determine pile spacings within a row. The
user enters the lateral resistance of the pile assuming an all vertical pile foundation (#12). This resistance
is generally obtained from an independent analysis using a program such as COM624 and is only
applicable if all piles are vertical. The other resistance is the axial capacity of a pile (#11). For vertical
piles, the axial capacity resists vertical loads but makes no contribution for lateral resistance. For
battered piles, the axial capacity is resolved into a vertical and horizontal capacity (#16) using the batter
slope and trigonometry. If the designed pile foundation has battered piles, the horizontal resistance is
derived solely from the horizontal component of the axial capacity of piles that are battered.
The program computes pile spacings required to satisfy various conditions, such as vertical and lateral
loads on vertical and battered piles. These spacings are collected for each row and a controlling spacing
is determined. The equations consider each pile row separately, but produce a spacing for the row with
the most piles in it (typically the first row). Therefore, as seen throughout the example problem, all
computed spacings apply to the first row. After the design algorithm has found a satisfactory spacing for

Chapter 3 Method of Solution
3-148
the first row, subsequent row spacings are simply a multiple of the first row spacing, depending on the
number of piles for the row found in the pile pattern.
A corollary to the above assumption is that the maximum input pile spacing must be related to the row
with the most piles. In other words, piles in the first row must be spaced such that piles in the last row will
satisfy the maximum spacing criteria. This is accomplished with the following equation:
NP
NP IN = S
max
minmaxmax
Where: Smax is the maximum spacing of piles in the first row
INmax is the maximum input spacing of piles
NPmin is the least piles in a row (last row)
NPmax is the most piles in a row (first row)
The program begins by computing the pile spacing in each row required to carry the vertical load on the
row. The spacing is computed first by assuming all piles in the row are vertical and then assuming all
piles in the row are battered using the equations that follow:
NP V
CAP = S
maxi
AiVPVL
NP V
CAP = S
maxi
ViBPVL
Where: SiVPVL is the pile spacing in the ith row (piles are vertical)
SiBPVL is the pile spacing in the ith row (piles are battered)
CAPA is the axial capacity for a pile
CAPV is the vertical component of axial capacity for a battered pile
NPmax is the most piles in a row (first row)
The computed spacings are rounded down based on the input rounding values. If the vertical pile
spacing for any row is less than the minimum spacing (#8), the pile group is unable to support the vertical
load and a new pattern is tried.
Spacings required to resist vertical loads (computed above) are stored in a particular way that facilitates
comparisons later on. For vertical piles, the stored spacing at a given row is the minimum of the
computed spacing for the rows that follow. For battered piles on the other hand, the stored spacing at a
given row is the minimum of the computed spacing for that row and any row towards the toe. This step is
necessary when considering a partially battered pile footing, as explained below.

Chapter 3 Method of Solution
3-149
The algorithm only batters piles necessary to handle the lateral load, battering the first row and moving
towards the heel. An intermediate row might be partially battered, while rows closer to the toe are
assumed fully battered and rows closer to the heel are assumed fully vertical. Therefore, when
comparing spacings for a given row, rows closer to the toe are controlled by battered pile spacings while
rows closer to the heel are controlled by vertical pile spacings.
The program then computes the spacing required for an all vertical pile foundation to resist the lateral
load on the foundation. This equation uses the COM624 capacity:
HNP
CNP = S
ftg
624totVPHL
max
Where: SVPHL is the pile spacing
C624 is the lateral capacity of a pile in an all vertical pile foundation
Hftg is the lateral load (per unit length) applied to the pile group
NPmax is the most piles in a row (first row)
NPtot is the total number of piles from the pattern definition
The spacing required for battered piles to resist the lateral load is then computed. The equation is similar
to the previous equation, but the capacities are cumulative because the first rows of piles may be battered
while the last rows may be vertical:
HNP
CAPNP = S
ftgmax
HcumBPHL
Where: SBPHL(I) is the pile spacing in the ith row (piles are battered)
NPcum(I) is the cumulative number of battered piles for rows 1 to I
CAPH is the axial pile capacity horizontal component for a battered pile
Hftg is the lateral load (per unit length) applied to the pile group
For this step, the program batters all piles in a given row and later determines whether only a percentage
of battered piles in the row will suffice. Implicit in this method is the assumption that for a partially
battered pile row, the vertical load is resisted by fully battered piles in the row.
Now that the spacings for various configurations have been computed, the controlling spacing must be
determined. For an all vertical pile foundation, the spacing is the minimum of SVPVL(I) and SVPHL, as long
as the minimum and maximum spacing limits are not violated. These spacings are shown in the example
(#24, 25).
Chapter 3 Method of Solution
3-150
For a given row in a battered pile foundation, the spacing is the minimum of the stored values for SVPVL(I),
SBPVL(I) and SBPHL(I) (#27, 29, 31, respectively). A valid spacing conforms to the input minimum and
maximum spacing limits and is shown in the example (#32). The greatest valid spacing considering all
rows is the control (#33). After the controlling spacing has been found, the program then determines how
many piles to batter #36-39.
The above steps are performed for every applicable limit state load combination for a given pile pattern.
Once the controlling spacing is found for the row with the most piles, the spacings of piles in all rows can
be determined based on the pile pattern. A check is then made to determine if the footing and pile
geometry is optimal (Section 3.7.3.2).
If a footing and pile configuration is determined to be optimal, design of the footing reinforcement is
performed. The applied moments are obtained as described in Section 3.5.1.2. If the footing
reinforcement design has a satisfactory solution, the footing and pile configuration is saved as an optimal
design. Otherwise, the design is discarded. If a pattern is found to be unsatisfactory due to punching
shear in the footing, the program will reanalyze the same pattern with a reduced pile spacing. This
process is iterative and reduces the pile spacing until either a valid design is found, or the pile stability /
spacing checks fail.
If the pile stability or spacing check fails at any time, a new pile pattern or footing configuration is tested.
If a solution is not obtained, the program will issue a message and then terminate.
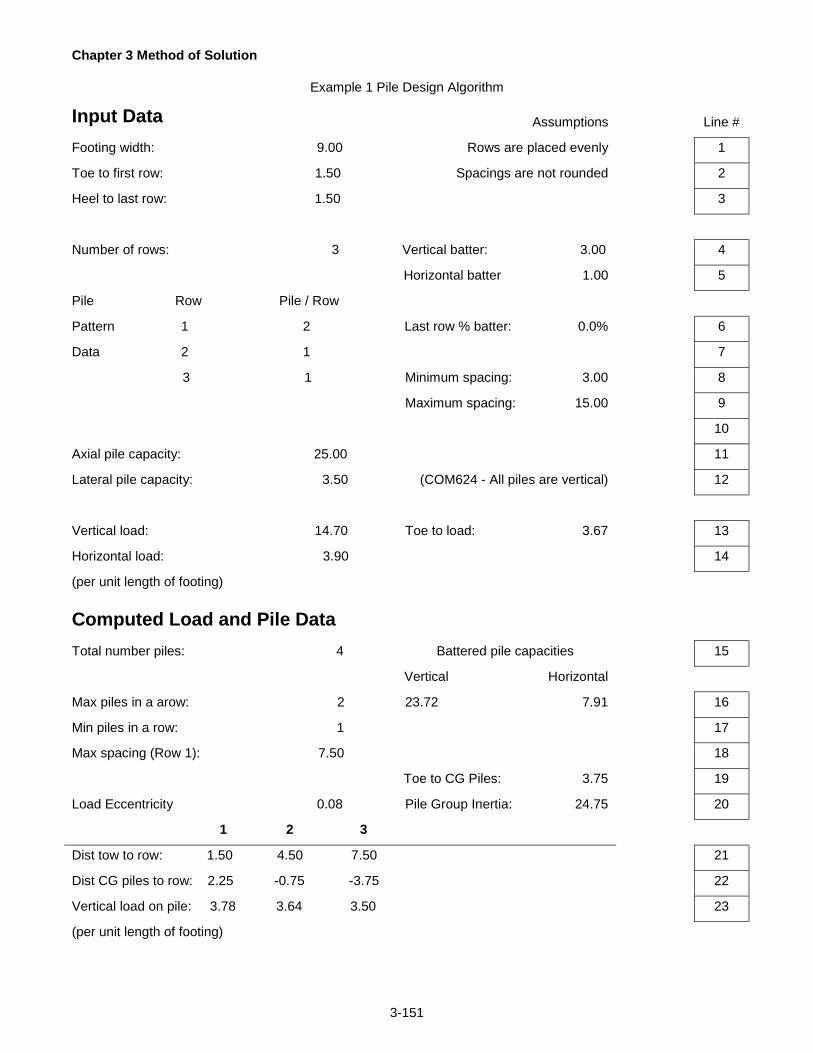
Chapter 3 Method of Solution
3-151
Example 1 Pile Design Algorithm
Input Data Assumptions Line #
Footing width: 9.00 Rows are placed evenly 1
Toe to first row: 1.50 Spacings are not rounded 2
Heel to last row: 1.50 3
Number of rows: 3 Vertical batter: 3.00 4
Horizontal batter 1.00 5
Pile Row Pile / Row
Pattern 1 2 Last row % batter: 0.0% 6
Data 2 1 7
3 1 Minimum spacing: 3.00 8
Maximum spacing: 15.00 9
10
Axial pile capacity: 25.00 11
Lateral pile capacity: 3.50 (COM624 - All piles are vertical) 12
Vertical load: 14.70 Toe to load: 3.67 13
Horizontal load: 3.90 14
(per unit length of footing)
Computed Load and Pile Data
Total number piles: 4 Battered pile capacities 15
Vertical Horizontal
Max piles in a arow: 2 23.72 7.91 16
Min piles in a row: 1 17
Max spacing (Row 1): 7.50 18
Toe to CG Piles: 3.75 19
Load Eccentricity 0.08 Pile Group Inertia: 24.75 20
1 2 3
Dist tow to row: 1.50 4.50 7.50 21
Dist CG piles to row: 2.25 -0.75 -3.75 22
Vertical load on pile: 3.78 3.64 3.50 23
(per unit length of footing)

Chapter 3 Method of Solution
3-152
Computed Spacings
Note: All spacings are computed from the row with the most piles (the first row)
All vertical pile foundation spacings
Spacing for vertical loads: 3.3052 OK 24
Spacing for lateral loads: 1.7949 NG 25
Battered pile foundation spacings
Legend: V = vertical, B = battered, L = lateral
Row: 1 2 3
V loads, V piles 3.3052 3.4347 3.5747 26
Store (for B piles) 3.4347 3.5747 3.5747 27
OK OK OK
V loads, V piles 3.1356 3.2584 3.3912 28
Store (for B piles) 3.1356 3.1356 3.1356 29
OK OK OK
# of B piles (cumul.) 2 3 3 30
L loads, B piles 2.0271 3.0407 3.0407 31
NG OK OK
Valid spacing (min) NG 3.0407 3.0407 32
Best valid spacing 3.0407 33
First Row Spacing Summary All vertical piles: 1.79 NG 34
Battered piles: 3.04 OK 35
Batter Summary # piles to batter: 3 36
Last battered row: 2 37
Actual spacing: 3.04 6.08 6.08 38
Percent batter: 100.0% 100.0% Vert 39

Chapter 3 Method of Solution
3-153
3.7.3.2 Evaluation of Pile Optimal Design
The user has the following choices for the optimizing parameter: least pile density; minimum footing
volume; and minimum foundation installation cost. The pile density is defined as the number of piles per
unit length of abutment. The footing volume is defined as the footing width multiplied by the footing
thickness per unit. The foundation installation cost. The footing and pile costs are specified in the LYD
command (see Section 5.15).
If pile density is selected as the optimizing parameter and two configurations have the same density, the
footing volume is used to determine the optimal design. If both configurations have the same footing
volume, the configuration with the maximum toe projection will be selected as optimal.
If footing volume is selected as the optimizing parameter and two configurations have the same volume,
the pile density is used to determine the optimal design. If both configurations have the same density, the
configuration with the maximum toe projection will be selected as optimal.
If the installation cost is selected as the optimizing parameter and two configurations have the same cost,
the configuration with the least toe projection will be selected as optimal.
3.7.4 Shear Design
Shear design for footings follows the analysis procedure; refer to Section 3.5.2.9 for a description of the
requirements. If the shear check is not satisfied in a design run, the footing configuration will be rejected.
The program will skip to the next iteration of the footing geometry. The shear check is a function of the
thickness of the footing.
Changes in the stem position (toe/heel projections) will alter the applied shear load. Changes in the
footing thickness will affect the shear capacity of the footing sections.
The shear check as described in Section 3.5.2.9 is evaluated at the stem quarter points and backwall and
seat level (if applicable). Stem and backwall sections are not modified by the program. Hence, the shear
capacity cannot be increased. If there is a shear failure, the program will identify the point in the output.
If a solution cannot be found because there is a shear problem in the stem, the geometry (i.e. batter or
stem thickness) may have to be revised. A larger section will provide a greater shear resistance.

Chapter 3 Method of Solution
3-154
Similarly, if there is a shear problem in the footing, the user can increase the upper limit of the footing
thickness in the FTG command. By allowing the program to consider thicker footings, an acceptable
solution may be found.
Alternatively, the user can change the strength of concrete. It is recommended that the user should
check the magnitude of the applied loads, they may be unreasonably high.
Chapter 3 Method of Solution
3-155
3.8 TOLERANCES
The following sub-sections indicate where and how tolerances are applied. An example is provided for each case.
3.8.1 Spread Footing
A 1.5% tolerance is considered in the bearing resistance check. If the applied bearing pressure, either
uniform for soil or maximum for rock, exceeds the bearing resistance, but the difference is less than 1.5%
of the bearing resistance, the bearing check will be considered satisfactory.
Example:
Applied pressure is 20.29 ksf.
Bearing resistance is 20.00 ksf.
Status: applied pressure is within acceptable tolerance of resistance.
Explanation: (20.29 - 20.00) is less than 1.5% of 20.00.
3.8.2 Pile Footing
Tolerances are not applied to pile footing checks.
3.8.3 Pedestal Footing
A 1.5% tolerance is considered in the bearing resistance check at the front and back of the pedestal. If
the percentage difference between the applied pressure and bearing resistance is less than 1.5%, the
check is considered satisfactory.
Example:
Factored rock bearing resistance is 30 ksf.
Applied pressure at the front of the pedestal is 30.45 ksf.
Status: the resistance is within an acceptable tolerance of applied pressure.
Explanation: (30.45 - 30.00)/30.00 is less than or equal to 0.015.

Chapter 3 Method of Solution
3-156
3.8.4 Rebar Calculations
The following tolerances are applied to the rebar calculations in all applicable components of the structure
i.e. stem, backwall, and footing.
Area of steel calculations: If the actual area of steel is within 1.5% of the required area of steel, the check
will be considered satisfactory.
Example:
Actual area of steel is 1.98 in2.
Required area of steel is 2.0 in2.
Status: actual area is within acceptable tolerance of required area.
Explanation: 1.98 is greater than 2.0*(1-0.015).
Service stress tolerance: If the percentage difference between the actual stress and the allowable stress
is less than or equal to 1.5%, the check will be considered satisfactory.
Example:
Allowable stress is 36.00 ksi.
Calculated stress is 36.54 ksi.
Status: calculated stress is within an acceptable tolerance of allowable stress.
Explanation: (36.54-36.00)/36.00 is less than or equal to 0.015.
Spacing for design: The tolerance is 1.5% of (0.5 inches). It is applied when the spacing is evaluated for
each bar. The tolerance determines if a smaller spacing should be used, i.e. should the program round-
down to a smaller value.
Example:
Required spacing is 8.9925 inches
Status: use a spacing of 9.0 inches instead of rounding down to 6.0 inches
Explanation: (9.0 - 8.9925) is less than or equal to 1.5% of 0.5 inches

Chapter 3 Method of Solution
3-157
3.9 NO SOLUTION FOUND
During a design run, the program iterates through a range of footing configurations (see section 3.2.1). For any
given footing configuration, if any design check fails, the program will skip to the next configuration. As the
program is evaluating the design checks for each configuration, the configuration of the smallest footing width that
was able to satisfy the most checks is saved.
If the program does not find a solution after evaluating all possible configurations, an informational message is
displayed on the screen and printed in the output file. The message indicates the status of the run and the
geometry of the footing configuration that satisfied the most design checks. The format of the message is identical
for each footing type, however, the content differs. The following sub-sections explain how the No Solution Found
message should be interpreted for each footing type.
3.9.1 Spread Footing
There are seven check points for the spread footing as illustrated in Figure 1. The list reflects the order in
which the program evaluates the checks. An acceptable solution satisfies all of the checks. For the given
example, bearing and sliding were not a problem. Since the program could not find a configuration that
satisfied the settlement check, the strength and serviceability checks at the toe and heel locations were
not evaluated.
For a footing width of 8.75 (toe proj: 5.00 / heel proj: 1.42 )
* the BEARING check PASSED
* the SLIDING check PASSED
* the SETTLEMENT check FAILED
* the TOE STRENGTH check was NOT EVALUATED
* the HEEL STRENGTH check was NOT EVALUATED
* the TOE SERVICE check was NOT EVALUATED
* the HEEL SERVICE check was NOT EVALUATED
Figure 3.9.1-1 No-Solution-Found Message For Spread Footing
The bearing check includes considerations for the footing eccentricity (overall stability). The strength
checkpoints refer to the shear and flexural strength checks in the toe and heel. The service checkpoints
refer to the serviceability checks (allowable stress, spacing and development length) in the toe and heel
locations.
If a solution is not found, the user should ensure that the loads and geometry have been correctly
specified. The following suggestions address specific types of failures:
Chapter 3 Method of Solution
3-158
Bearing: check the strength properties of the rock or soil.
The eccentricity check will typically fail when geometry (maximum footing width) is too small.
Sliding: check the strength reduction factor for sliding and the soil strength (SOI command Chapter
5).
Settlement: examine the allowable settlement and soil / rock properties, e.g. modules of elasticity,
depth
of layers, and consolidation data for soils (CNS command Chapter 5).
Shear Strength: a thicker footing may be required.
Flexure: ensure that the bars can be developed.
The results shown in Figure 1 were generated by setting the allowable settlement to 0.01 inches.
The source of error can be corroborated by running the geometry of the footing configuration that satisfied
the most design checks as an analysis problem using the footing geometry and a nominal area of steel.
Performance ratios that are less than 1.0 indicate the checks that failed.
3.9.2 Pile Footing
There are eleven checkpoints for the pile footing as illustrated in Figure 1. The list reflects the order in
which the program evaluates the checks. An acceptable solution satisfies all of the checks. For the
example shown in Figure 1, the program could not get past the ‘all loads’ check. Consequently, the
strength and service limit state checks were not evaluated for the footing (parallel and perpendicular
directions).

Chapter 3 Method of Solution
3-159
For a footing width of 4.00 (toe proj: 0.60, heel proj: 2.83)
* the Pile/Caisson Pattern check passed
* the Pile/Caisson - Vertical Load check passed
* the Pile/Caisson - All Loads check failed
* the Toe Strength check was not evaluated
* the Toe Service check was not evaluated
* the Heel Strength check was not evaluated
* the Heel Service check was not evaluated
* the Parallel Top Strength check was not evaluated
* the Parallel Top Service check was not evaluated
* the Parallel Bottom Strength check was not evaluated
* the Parallel Bottom Service check was not evaluated
Figure 3.9.2-1 No-Solution-Found Message For Pile Footings
The pile footing will check the pattern data first. Next, the vertical loads are checked considering an all
vertical-pile configuration. In the third step, the lateral and vertical loads are considered. When the pile
considerations are satisfactory, the footing strength and serviceability (rebar) checks are evaluated in the
perpendicular (toe/heel) and parallel (top/bottom) directions.
If the program does not pass the first check point (pattern check), the user should review the footing
geometry - particularly the maximum width and pile spacing constraints.
If the configuration is failing at the second checkpoint (vertical load check), check the axial capacity of the
piles.
If the configuration fails at the third checkpoint (as shown in Figure 1), there are several factors to
consider. At this stage, the piles may be battered to accommodate the lateral load. However, if the piles
are battered, the vertical load resistance of the pile group will be affected. Consequently, this check may
fail because of the vertical and/or horizontal resistance of the pile group. Check the applied loads, axial
capacity of the piles and the footing geometry.
The remaining checks concern the moment and shear capacity of the footing sections. A larger (deeper)
footing may be required to satisfy the flexural and shear loads. For the flexural strength check, the rebar
should have an adequate length to develop (applies to the perpendicular direction only).
The source of error can be corroborated by running the geometry of the footing configuration as that
satisfied the most design checks an analysis problem using the footing geometry and a nominal area of
steel. Performance ratios that are less than 1.0 indicate the checks that failed.
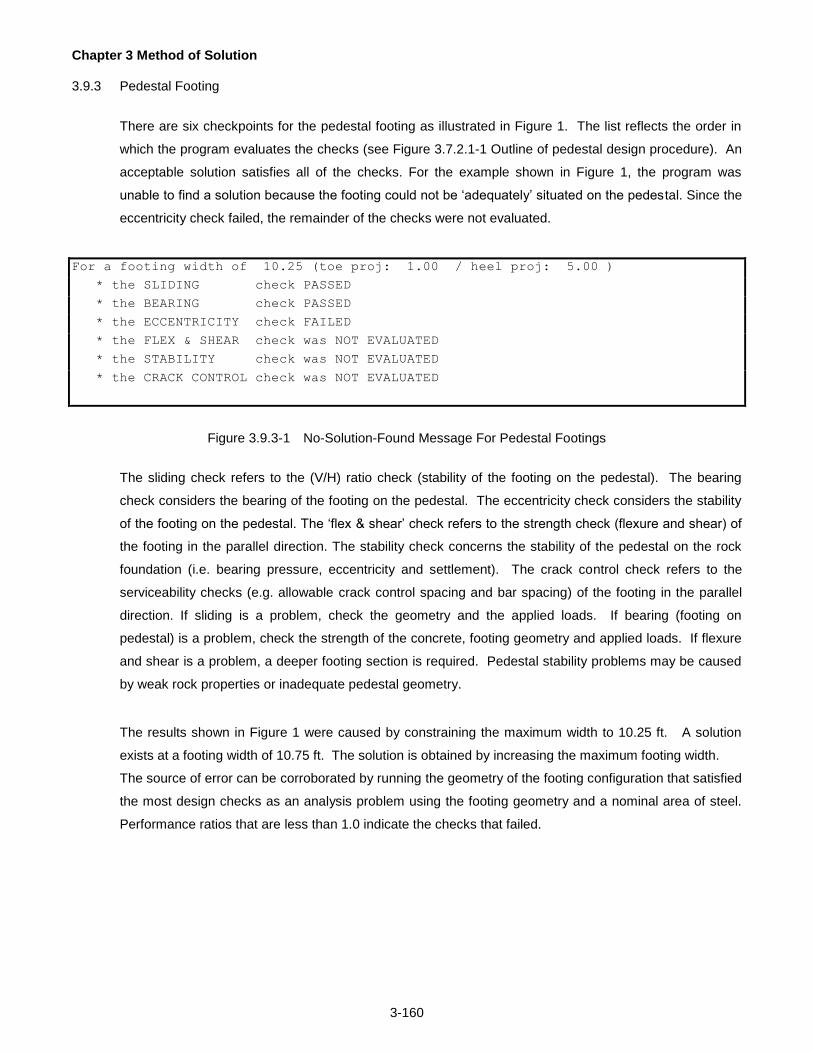
Chapter 3 Method of Solution
3-160
3.9.3 Pedestal Footing
There are six checkpoints for the pedestal footing as illustrated in Figure 1. The list reflects the order in
which the program evaluates the checks (see Figure 3.7.2.1-1 Outline of pedestal design procedure). An
acceptable solution satisfies all of the checks. For the example shown in Figure 1, the program was
unable to find a solution because the footing could not be ‘adequately’ situated on the pedestal. Since the
eccentricity check failed, the remainder of the checks were not evaluated.
For a footing width of 10.25 (toe proj: 1.00 / heel proj: 5.00 )
* the SLIDING check PASSED
* the BEARING check PASSED
* the ECCENTRICITY check FAILED
* the FLEX & SHEAR check was NOT EVALUATED
* the STABILITY check was NOT EVALUATED
* the CRACK CONTROL check was NOT EVALUATED
Figure 3.9.3-1 No-Solution-Found Message For Pedestal Footings
The sliding check refers to the (V/H) ratio check (stability of the footing on the pedestal). The bearing
check considers the bearing of the footing on the pedestal. The eccentricity check considers the stability
of the footing on the pedestal. The ‘flex & shear’ check refers to the strength check (flexure and shear) of
the footing in the parallel direction. The stability check concerns the stability of the pedestal on the rock
foundation (i.e. bearing pressure, eccentricity and settlement). The crack control check refers to the
serviceability checks (e.g. allowable crack control spacing and bar spacing) of the footing in the parallel
direction. If sliding is a problem, check the geometry and the applied loads. If bearing (footing on
pedestal) is a problem, check the strength of the concrete, footing geometry and applied loads. If flexure
and shear is a problem, a deeper footing section is required. Pedestal stability problems may be caused
by weak rock properties or inadequate pedestal geometry.
The results shown in Figure 1 were caused by constraining the maximum width to 10.25 ft. A solution
exists at a footing width of 10.75 ft. The solution is obtained by increasing the maximum footing width.
The source of error can be corroborated by running the geometry of the footing configuration that satisfied
the most design checks as an analysis problem using the footing geometry and a nominal area of steel.
Performance ratios that are less than 1.0 indicate the checks that failed.

4-1
4 GETTING STARTED
4.1 INSTALLATION
This program is delivered via download from the Department's website. Once payment has been received by
PennDOT you will receive a confirmation e-mail with instructions on how to download the software. The download
file is a self-extracting installation file for the licensed PennDOT engineering software. The engineering program
runs as a 32-bit application and is supported on Windows Vista, Windows 7 (32 and 64 bit versions), Windows 8,
and Windows 10 operating systems.
Your license number, license key and registered company name, found in the e-mail received from the
Department, are required to be entered when installing the program and must be entered exactly as shown in the
e-mail. The license number, license key and registered company name will also be needed when requesting
future versions of the program (i.e., enhancements, modifications, or error corrections), and requesting program
support. A backup copy of the program download and e-mail instructions should be made and used for future
installations. You may want to print the software license agreement, record the license number, license key and
registered company name and keep it in a safe place.
To install the program, follow the installation instructions provided with the original e-mail from the Department.
The following files will be installed in the program destination folder, which defaults to “C:\Program
Files\PennDOT\ABLRFD v<version_number>\” or "C:\Program Files (x86)\PennDOT\ABLRFD v<version
number>\" for 64-bit operating systems:
1. ABLRFD.exe, ABLRFD_DLL.dll - Executable program and Dynamic Link Library.
2. ABLRFD.pd - Parameter definition file.
3. ABLRFD Users Manual.pdf - Program User’s Manual (PDF Format).
4. ABLRFDRevReq.dotx - Revision Request form (MS Word template).
5. GettingStarted.pdf - A document describing installation and running of the program
6. LicenseAgreement.pdf - The program license agreement
7. MSVCR71.dll - Runtime Dynamic Link Library
The program example problem files (ex*.dat) will be installed in the program example folder, which defaults to
“C:\PennDOT\ABLRFD v<version_number> Examples\”. Users must have write access in order to run the input
files from this folder.

Chapter 4 Getting Started
4-2
4.2 PREPARING INPUT
The program requires an ASCII input file. The input file consists of a series of command lines. Each command
line defines a set of input parameters that are associated with that command. A description of the input
commands can be found in Chapter 5 of the User’s Manual. The input can be created using Engineering
Assistant, described below, or any text editor.

Chapter 4 Getting Started
4-3
4.3 ENGINEERING ASSISTANT
The Engineering Assistant (EngAsst) is a Windows application developed by the Pennsylvania Department of
Transportation (PENNDOT) to provide a graphical user interface (GUI) for PENNDOT’s engineering programs.
The data for the input to the engineering program is presented in a user-friendly format, reflecting the implied
structure of the data, showing each record type on a separate tab page in the display and showing each field on
each record with a defining label.
With EngAsst the user can create a new input file, modify an existing input file, import input files, run the
associated engineering program and view the output in a Windows environment. The help and documentation are
provided, including text descriptions of each field, relevant images, and extended help text at both the record/tab
level and the field level. Access to all parts of the Engineering Program User’s Manual, where available, is also
provided within EngAsst.
EngAsst is not included with this software. It requires a separate license that can be obtained through the
Department’s standard Engineering Software licensing procedures. Order forms can be obtained from program
support website at http://penndot.engrprograms.com.
Chapter 4 Getting Started
4-4
4.4 RUNNING THE PROGRAM WITHOUT ENGASST
The engineering programs are FORTRAN console application programs. They may be run from a command
window, by double-clicking on the program icon from Windows Explorer, by selecting the shortcut from the Start
menu under Programs\PennDOT, or by double-clicking the shortcut icon on the desktop. To run the program in a
command window, the user must specify the directory in which the program has been installed or change to the
directory.
The program will prompt for an input file name, and the user should then enter the appropriate input file name.
The input file must be created before running the program. The program will then prompt for whether the output
should be reviewed on the screen. The user should enter Y if the output is to be reviewed on the screen after
execution or N if the output is not to be reviewed on the screen. The program will then prompt for the name of the
output file in which the output is to be stored, and the user should then enter the desired output file name. If a file
with the specified output file name already exists, the program will ask the user whether to overwrite the existing
file. The user should enter Y if the existing file is to be overwritten or N if the existing file is not to be overwritten. If
the user enters N to specify that the existing file is not to be overwritten, the program will prompt the user for
another output file name. The program will then execute.
To cancel the program during execution, press <Ctrl C> or <Ctrl Break>, and then press <Enter>.
When the program completes execution, the user is prompted to “Press <ENTER> to exit program.” This allows
the user to view the last messages written to the screen when the program was started by double-clicking on the
program icon from Windows Explorer.
The user can view the *.OUT output file with a text editor and the *.PDF output file (for those programs that
produce it) with Adobe Acrobat.

5-1
5 INPUT DESCRIPTION
5.1 INPUT DATA REQUIREMENTS
Before running the Abutment and Retaining Wall Analysis and Design program, the user must create an input file.
The input file consists of a series of command lines. Each command line defines a set of input parameters that
are associated with that command. The program interprets each command line and checks the input parameters
to ensure that the input data is of the correct type and within the allowable ranges set by the program.
The syntax of a command line is given as:
KWD parm1, parm2, , , parm5, ,
Where, KWD is a 3 character keyword representing a command and,
parm1, parm2... are the parameter values associated with KWD.
If a command line begins with an exclamation point (!), then it is treated as a comment line that is not used by the
program. Comment lines can be inserted by the user to provide descriptions and clarifications. The following are
two examples of a comment line:
! THE FOLLOWING COMMMAND IS USED TO SPECIFY THE REINFORCEMENT IN THE FOOTING.
! NOTE THAT #6 BARS ARE ORIENTED IN THE PARALLEL DIRECTION.
To temporarily make a command line void, the user can use an exclamation point (!) to transform the command
line into a comment line. For an input line to be treated as a comment line, the exclamation point must be put in
column one of the input line. For example, in the following case, the program will use the input data on the
second line, but will not use the input data on the first line:
! BAR 8, 8, 8, 8, 8
BAR 8, 8, 6, 8, 6
A command line must not exceed 256 characters in length. Command lines can be continued on any number of
data lines in the input file by placing a hyphen (-) at the end of each data line to be continued, and by placing any
remaining parameters on the following lines starting in column 4 of each continuation line. The limit of 256
characters includes all characters and parameters on all continuation lines of a given command line. Some
Chapter 5 Input Description
5-2
commands are repeatable and some commands have parameters or groups of parameters that are repeatable.
When parameters are repeatable, the user must repeat the parameters within the command line. For example,
the LYA command (Pile/Caisson Analysis Layout) first lists the total number of pile rows, followed by parameters
that are repeatable for every row. The LYA command for 2 pile rows is input as follows:
LYA 2, 1.5, 3.0, 100.0, 3.0, 12.0, 3.0, 3.0, 50.0, 3.0, 12.0
Groups of repeatable parameters must stay together in a command line unless a continuation character (-) is
used. When a continuation character is used, the repeatable data can be separated on two lines. The program
reads all continuation lines as one command. For example,
Incorrect Input:
LYA 2, 1.5, 3.0, 100.0, 3.0, 12.0, 3.0
LYA 2, 3.0, 50.0, 3.0, 12.0
Correct Input:
LYA 2, 1.5, 3.0, 100.0, 3.0, 12.0, 3.0 -
3.0, 50.0, 3.0, 12.0
The first three columns of each command line are reserved for keywords that define the command type. Columns
4 through 256 are to be used to input the parameters associated with a command. One or more spaces are
recommended between the keyword and the input parameters to improve readability.
The parameters associated with each command must be entered in the order they appear in the command
description tables. The user must place commas to separate the parameters on the command line. Blank spaces
cannot be used to separate parameters. The parameter field width is not restricted; however, the total number of
characters cannot exceed 256.
The default value for a parameter is assigned by the program by placing a comma without any value for the
parameter. For example, in the command syntax example shown below, the default values will be assigned to
parameters parm3 and parm4.
KWD parm1, parm2, , , parm5
If the user places a comma and there is no default value, the program will return an error status. If a comma is
entered after the command keyword, the program will assign the default value to the first parameter. If the user
does not enter all the parameters for a command, the program will assign default values for those parameters not
entered. That is, the user is not required to place commas at the end of a command line. If the above example
required seven parameters, parm6 and parm7 would also be assigned default values by the program.

Chapter 5 Input Description
5-3
The default values are stored in a parameter file, which can be changed by the Department’s system manager.
The parameter file stores the parameter description, type of data, units, upper limit, lower limit, error or warning
status if the upper or lower limits are exceeded, and the default value for each parameter.
Any numerical value, within the upper and lower limits, can be entered for a parameter. The status codes, shown
in parenthesis below the lower and upper limits, indicate the status if an input item exceeds the lower or upper
limits. The status code, (E), indicates an error. The status code, (W), indicates a warning.
In the following sections, all available commands and associated parameters are described with two tables for
each command. The first table contains the keyword for a particular command along with a description of the
command. The second table gives all the parameters associated with the given command, parameter
description, units, limits and default values.
The program will process all input and will check for errors and warnings. If the number of errors exceeds 25
during input processing, the program will terminate immediately. After all input is processed, the program checks
if any errors were found. If an error was found, the program will terminate. If warnings are found, the program will
continue to process. If the number of warnings exceeds 200 during input processing for a single run, the program
will terminate immediately. The user should review all warnings in the output file to ensure that the input data is
correct. Warnings are an indication that the input value has exceeded normally acceptable limits for that
parameter.
Chapter 5 Input Description
5-4
5.2 ORDER OF COMMANDS
If the user wants to control the number of lines printed on a page or the number of lines to be left blank at the top
of each page, the CFG (configure) command should be the first command. The CFG command is optional and
the program will use default values if the CFG command is not entered. The first required command is the TTL
(title) command, which is printed in the header at the top of each output page. A maximum of ten TTL commands
are printed on the first page of the output. The second required command after the title commands is the CTL
(control) command. The CTL command is used to specify the system of units, which is required for checking the
range of the input data. The CTL command also includes other major control parameters.
The recommended order of commands is shown in Table 1. The commands are shown in alphabetical order in
Table 2. The section headings in these tables refer to the section number of this chapter where these commands
are described. Figure 1 shows the overall view of the typical input file with these commands.

Chapter 5 Input Description
5-5
CAIPIL PED
FTG
AWB RWLAT2AT1
CTL
MAT
LYD
Title
Structure Type
Footing Type
Pile / Caisson design or analysis layout.
Control
Material properties of steel and concrete.
Footing
Dimensions
CFG
LYA
SOI RCK Soil or Rock
SPA
SPD
CVR
Miscellaneous Reinforcement Data
Bar Spacings for Analysis
Design Spacings, Bar Sizes or Area per Unit WidthAREBAR
CNS
TTL
Configuration
Consolidation Settlement
SPR
MRD
Cover over reinforcement.
SRA SRBStem rebar (area or bar) for analsysis only
continue with load control (LDC)
Figure 5.2-1 Overall View of the Input File
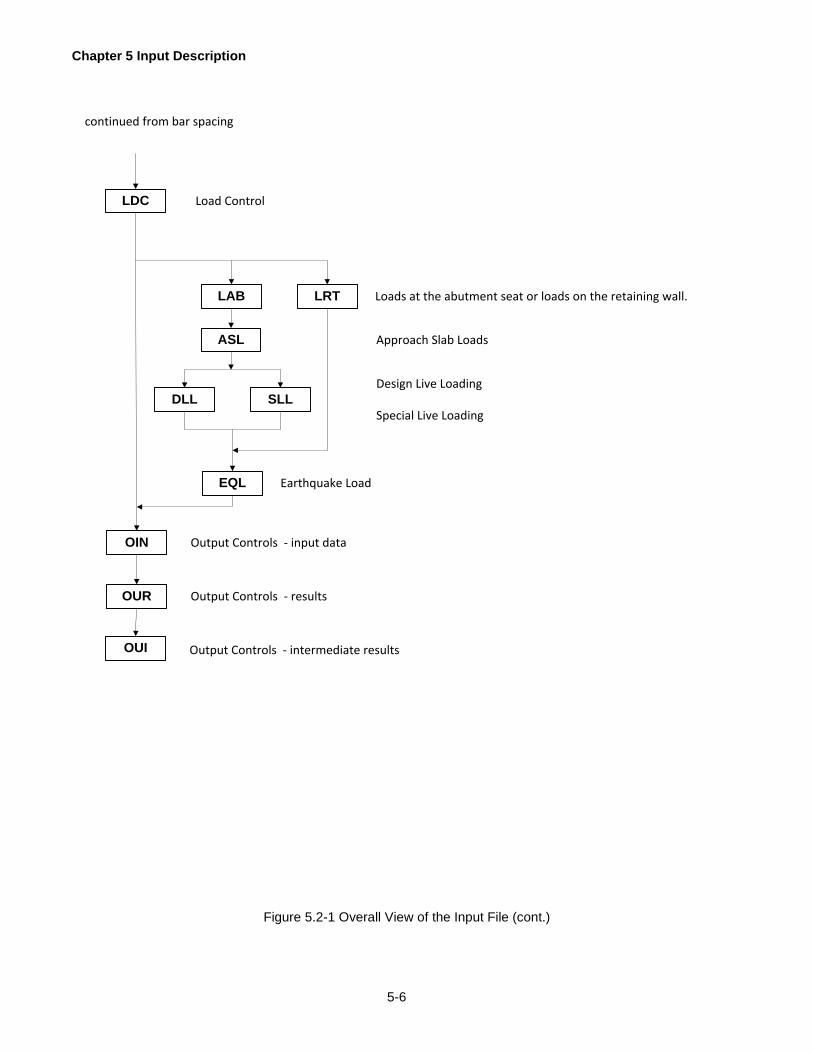
Chapter 5 Input Description
5-6
SLL
LAB LRT
LDC
EQL
Load Control
Design Live Loading
Earthquake Load
OIN Output Controls - input data
DLL
Special Live Loading
Loads at the abutment seat or loads on the retaining wall.
OUR
OUI
continued from bar spacing
Output Controls - results
Output Controls - intermediate results
ASL Approach Slab Loads
Figure 5.2-1 Overall View of the Input File (cont.)
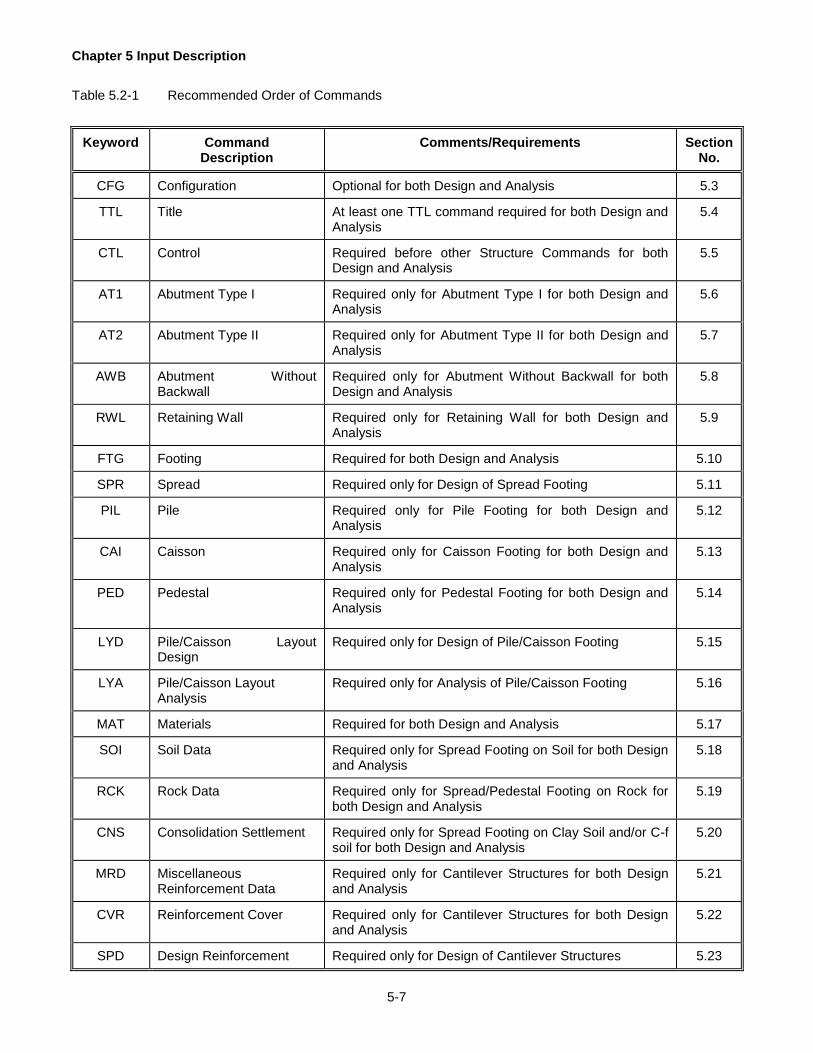
Chapter 5 Input Description
5-7
Table 5.2-1 Recommended Order of Commands
Keyword
Command
Description
Comments/Requirements
Section
No.
CFG Configuration
Optional for both Design and Analysis
5.3
TTL
Title
At least one TTL command required for both Design and Analysis
5.4
CTL
Control
Required before other Structure Commands for both Design and Analysis
5.5
AT1
Abutment Type I
Required only for Abutment Type I for both Design and Analysis
5.6
AT2
Abutment Type II
Required only for Abutment Type II for both Design and Analysis
5.7
AWB
Abutment Without Backwall
Required only for Abutment Without Backwall for both Design and Analysis
5.8
RWL
Retaining Wall
Required only for Retaining Wall for both Design and Analysis
5.9
FTG
Footing
Required for both Design and Analysis
5.10
SPR
Spread
Required only for Design of Spread Footing
5.11
PIL
Pile
Required only for Pile Footing for both Design and Analysis
5.12
CAI
Caisson
Required only for Caisson Footing for both Design and Analysis
5.13
PED
Pedestal
Required only for Pedestal Footing for both Design and Analysis
5.14
LYD
Pile/Caisson Layout Design
Required only for Design of Pile/Caisson Footing
5.15
LYA
Pile/Caisson Layout Analysis
Required only for Analysis of Pile/Caisson Footing
5.16
MAT
Materials
Required for both Design and Analysis
5.17
SOI
Soil Data
Required only for Spread Footing on Soil for both Design and Analysis
5.18
RCK
Rock Data
Required only for Spread/Pedestal Footing on Rock for both Design and Analysis
5.19
CNS
Consolidation Settlement
Required only for Spread Footing on Clay Soil and/or C-f soil for both Design and Analysis
5.20
MRD
Miscellaneous Reinforcement Data
Required only for Cantilever Structures for both Design and Analysis
5.21
CVR
Reinforcement Cover
Required only for Cantilever Structures for both Design and Analysis
5.22
SPD
Design Reinforcement
Required only for Design of Cantilever Structures
5.23

Chapter 5 Input Description
5-8
Table 5.2-1 Recommended Order of Commands (Cont.)
Keyword
Command
Description
Comments/Requirements
Section
No.
BAR
Bar Size
Required only for Analysis of Cantilever Structures - if ARE is not used
5.24
SPA Bar Spacing for Analysis
Required only for Analysis of Cantilever Structures - if ARE is not used
5.25
ARE Reinforcement Area
Required only for Analysis of Cantilever Structures - if BAR and SPA are not used
5.26
SRA
Stem Reinforcement Areas
Required only for Analysis of Cantilever Structures - if SRB is not used
5.27
SRB
Stem Reinforcement Bars
Required only for Analysis of Cantilever Structures - if SRA is not used
5.28
LDC
Load Control
Required for both Design and Analysis
5.29
LAB
Loads on Abutments
Required for Design and Analysis of Abutments
5.30
ASL
Approach Slab Loads
Optional for Design and Analysis of Abutments
5.31
LRT
Loads on Retaining Walls
Optional for Design and Analysis of Retaining Walls only
5.32
DLL
Design Live Loading
Required for Design and Analysis of Abutments
5.33
SLL
Special Live Loading
Optional for Design and Analysis of Abutments only
5.34
EQL
Earthquake Loads
Optional for both Design and Analysis
5.35
OIN
Output of Input
Optional for both Design and Analysis
5.36
OUR
Output of Results
Optional for both Design and Analysis
5.37
OUI
Output of Intermediate Data
Optional for both Design and Analysis
5.38
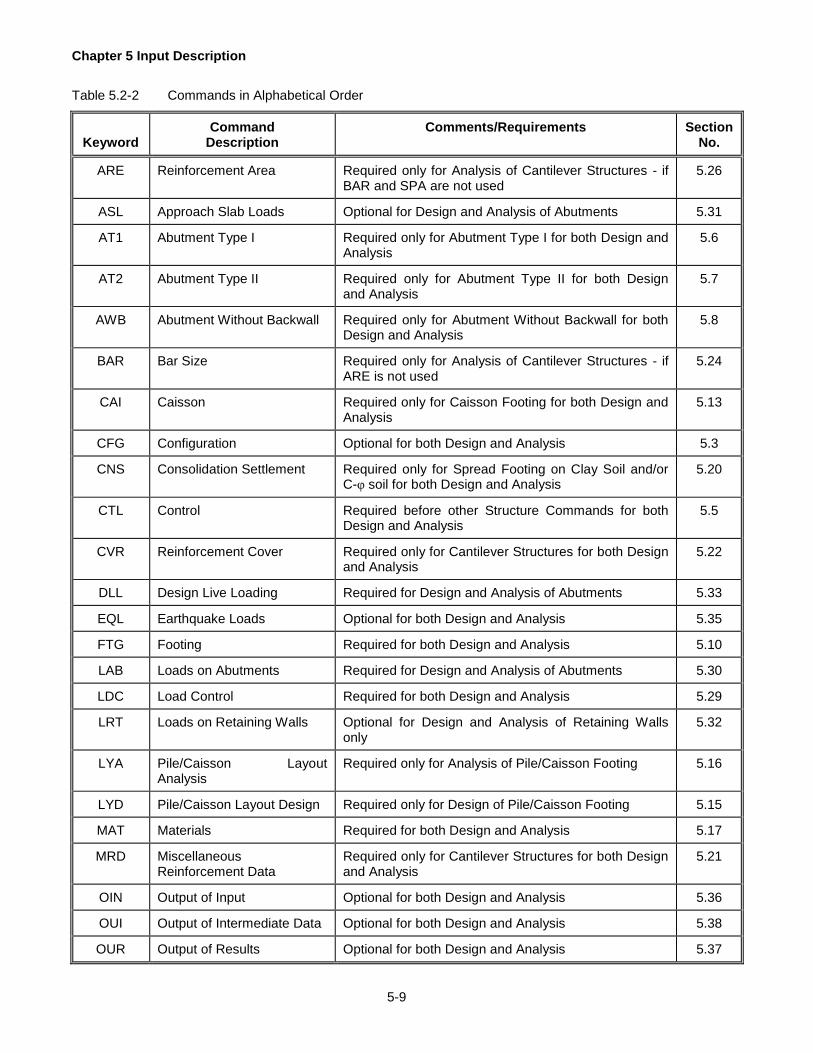
Chapter 5 Input Description
5-9
Table 5.2-2 Commands in Alphabetical Order
Keyword
Command
Description
Comments/Requirements
Section
No.
ARE Reinforcement Area
Required only for Analysis of Cantilever Structures - if BAR and SPA are not used
5.26
ASL
Approach Slab Loads
Optional for Design and Analysis of Abutments
5.31
AT1
Abutment Type I
Required only for Abutment Type I for both Design and Analysis
5.6
AT2
Abutment Type II
Required only for Abutment Type II for both Design and Analysis
5.7
AWB
Abutment Without Backwall
Required only for Abutment Without Backwall for both Design and Analysis
5.8
BAR
Bar Size
Required only for Analysis of Cantilever Structures - if ARE is not used
5.24
CAI
Caisson
Required only for Caisson Footing for both Design and Analysis
5.13
CFG
Configuration
Optional for both Design and Analysis
5.3
CNS
Consolidation Settlement
Required only for Spread Footing on Clay Soil and/or C-φ soil for both Design and Analysis
5.20
CTL
Control
Required before other Structure Commands for both Design and Analysis
5.5
CVR
Reinforcement Cover
Required only for Cantilever Structures for both Design and Analysis
5.22
DLL
Design Live Loading
Required for Design and Analysis of Abutments
5.33
EQL
Earthquake Loads
Optional for both Design and Analysis
5.35
FTG
Footing
Required for both Design and Analysis
5.10
LAB
Loads on Abutments
Required for Design and Analysis of Abutments
5.30
LDC
Load Control
Required for both Design and Analysis
5.29
LRT
Loads on Retaining Walls
Optional for Design and Analysis of Retaining Walls only
5.32
LYA
Pile/Caisson Layout Analysis
Required only for Analysis of Pile/Caisson Footing
5.16
LYD
Pile/Caisson Layout Design
Required only for Design of Pile/Caisson Footing
5.15
MAT
Materials
Required for both Design and Analysis
5.17
MRD
Miscellaneous Reinforcement Data
Required only for Cantilever Structures for both Design and Analysis
5.21
OIN
Output of Input
Optional for both Design and Analysis
5.36
OUI
Output of Intermediate Data
Optional for both Design and Analysis
5.38
OUR
Output of Results
Optional for both Design and Analysis
5.37

Chapter 5 Input Description
5-10
Table 5.2-2 Commands in Alphabetical Order (Cont.)
Keyword
Command
Description
Comments/Requirements
Section
No.
PED Pedestal
Required only for Pedestal Footing for both Design and Analysis
5.14
PIL Pile
Required only for Pile Footing for both Design and Analysis
5.12
RCK
Rock Data
Required only for Spread/Pedestal Footing on Rock for both Design and Analysis
5.19
RWL
Retaining Wall
Required only for Retaining Wall for both Design and Analysis
5.9
SLL
Special Live Loading
Optional for Design and Analysis of Abutments only
5.34
SOI
Soil Data
Required only for Spread Footing on Soil for both Design and Analysis
5.18
SPA
Bar Spacing for Analysis
Required only for Analysis of Cantilever Structures - if ARE is not used
5.25
SPD
Design Reinforcement
Required only for Design of Cantilever Structures
5.23
SPR
Spread
Required only for Design of Spread Footing
5.11
SRA
Stem Reinforcement Areas
Required only for Analysis of Cantilever Structures - if SRB is not used
5.27
SRB
Stem Reinforcement Bars
Required only for Analysis of Cantilever Structures - if SRA is not used
5.28
TTL
Title
At least one TTL command required for both Design and Analysis
5.4
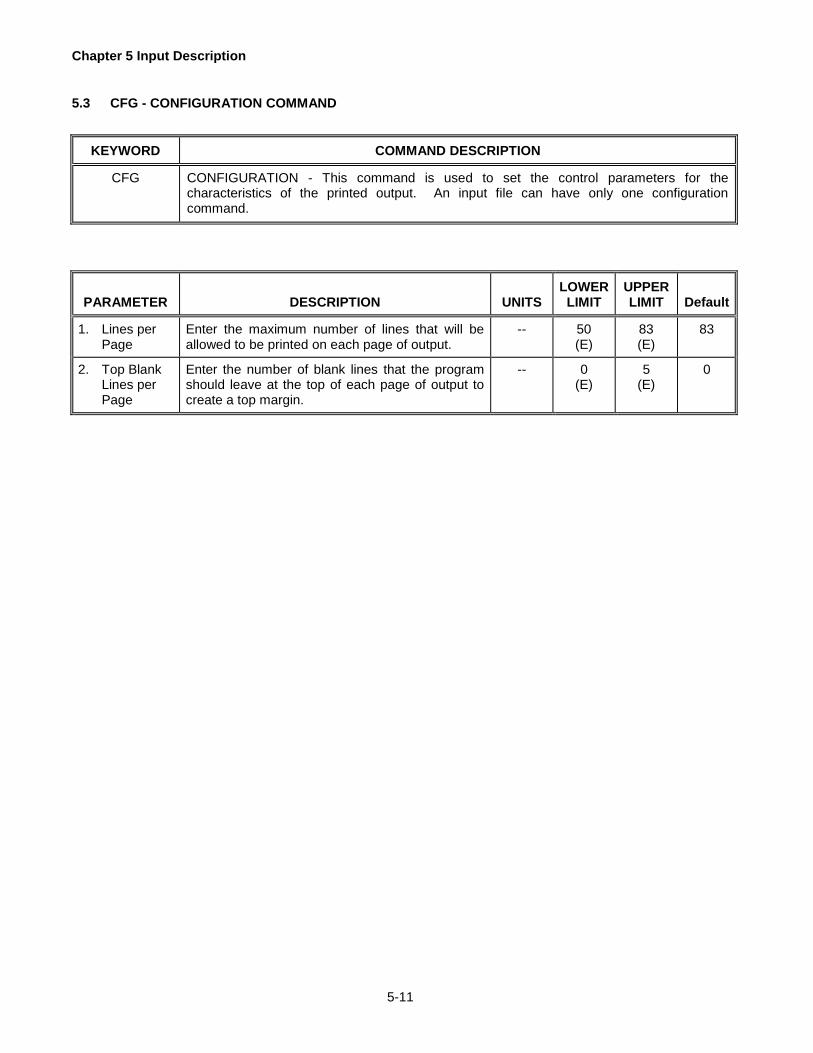
Chapter 5 Input Description
5-11
5.3 CFG - CONFIGURATION COMMAND
KEYWORD
COMMAND DESCRIPTION
CFG
CONFIGURATION - This command is used to set the control parameters for the characteristics of the printed output. An input file can have only one configuration command.
PARAMETER
DESCRIPTION
UNITS
LOWER
LIMIT
UPPER
LIMIT Default
1. Lines per
Page
Enter the maximum number of lines that will be allowed to be printed on each page of output.
--
50 (E)
83 (E)
83
2. Top Blank
Lines per Page
Enter the number of blank lines that the program should leave at the top of each page of output to create a top margin.
--
0
(E)
5
(E)
0

Chapter 5 Input Description
5-12
5.4 TTL - TITLE COMMAND
KEYWORD
COMMAND DESCRIPTION
TTL
TITLE - As many as ten TTL commands may be entered by the user. The first TTL command is printed in the header at the top of each output page. A maximum of ten TTL commands are printed on the first page of the output. If more than ten TTL commands are entered, the program will not use the TTL commands following the first ten TTL commands and a warning will be printed. The input file must have at least one TTL command.
PARAMETER
DESCRIPTION
UNITS
LOWER LIMIT
UPPER LIMIT
Default
1. Title
Enter any descriptive information about the project or structure. Title information can be specified anywhere between column 4 and column 79.
--
--
--
--

Chapter 5 Input Description
5-13
5.5 CTL - CONTROL COMMAND
KEYWORD
COMMAND DESCRIPTION
CTL
CONTROL - This command is used to set up the control parameters for the input. This command is required input, and can only be entered once. Only the TTL and CFG commands can precede this command.
PARAMETER
DESCRIPTION
UNITS
LOWER LIMIT
UPPER LIMIT
Default
1. System of
Units
The system of units to be used in the input, computations and output reports:
US - US Customary Units.
--
US (E)
--
US
2. Type of
Run
Type of Run:
D - Design the footing geometry and the reinforcing steel in both the footing and the stem.
A - Analyze the structure using given dimensions and reinforcement.
--
D, A (E)
--
--
3. Footing
Datum
For a design, indicate footing datum to be kept at a fixed elevation. Leave blank for Analysis. Refer to Figure 1.
T - Keep the top of the footing at a fixed elevation. For a design, the footing thickness is increased by lowering the footing bottom while keeping the stem height constant.
B - Keep the bottom of the footing at a fixed elevation. For a design, the footing thickness is increased by raising the footing top resulting in a decrease in the stem height.
--
T, B (E)
--
--
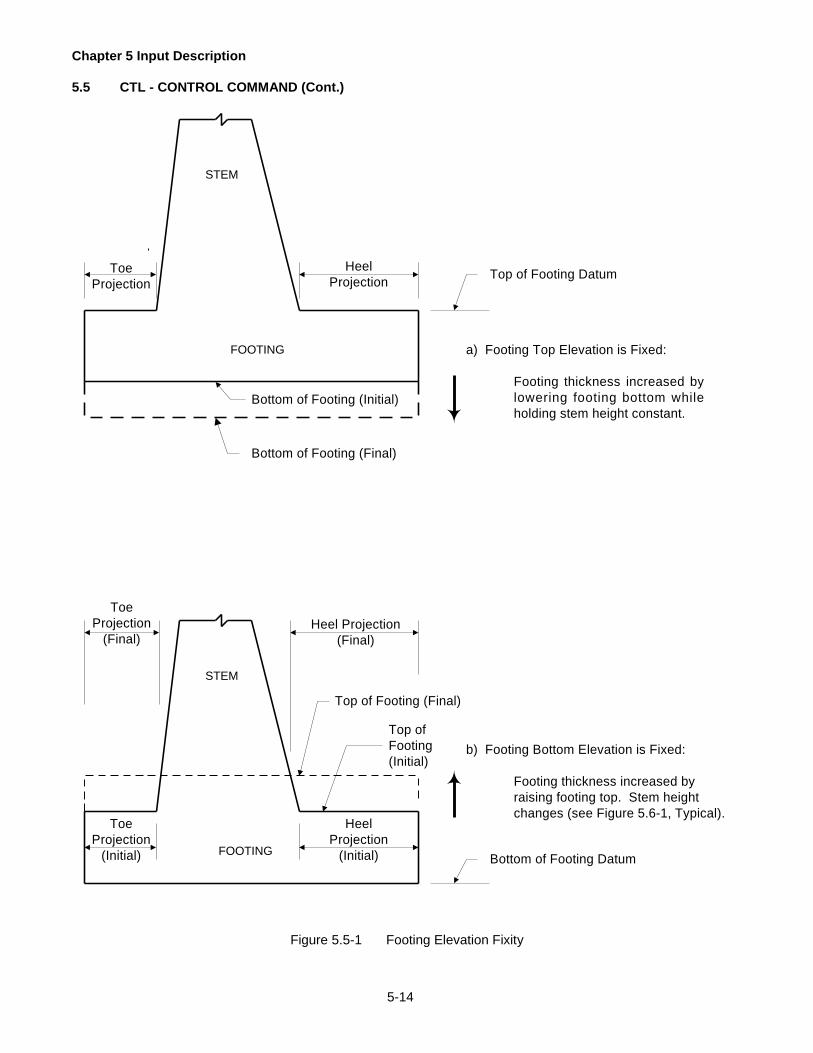
Chapter 5 Input Description
5-14
5.5 CTL - CONTROL COMMAND (Cont.)
STEM
FOOTING
FOOTING
STEM
a) Footing Top Elevation is Fixed:
Footing thickness increased by
lowering footing bottom while
holding stem height constant.
b) Footing Bottom Elevation is Fixed:
Footing thickness increased by
raising footing top. Stem height
changes (see Figure 5.6-1, Typical).
Heel
ProjectionTop of Footing Datum
Bottom of Footing (Initial)
Bottom of Footing (Final)
Toe
Projection
Top of
Footing
(Initial)
Top of Footing (Final)
Heel Projection
(Final)
Heel
Projection
(Initial)
Toe
Projection
(Initial)
Toe
Projection
(Final)
Bottom of Footing Datum
Figure 5.5-1 Footing Elevation Fixity

Chapter 5 Input Description
5-15
5.6 AT1 - ABUTMENT TYPE I COMMAND
KEYWORD
COMMAND DESCRIPTION
AT1
ABUTMENT TYPE I - This command describes the geometry of an abutment with a backwall and a straight stem. The dimensions are shown in Figure 1. This command may only be specified once.
PARAMETER
DESCRIPTION
UNITS
LOWER LIMIT
UPPER LIMIT
Default
1. Height
The structure or stem height. For design, if the footing top elevation is fixed, the height of the stem is required. If the footing bottom elevation is fixed, the total height of the structure (stem and footing) is required. For analysis, enter the stem height.
ft
0.0 (E)
40.0 (W)
--
2. Top Width
The width of the backwall at the top of the structure.
in
0.0 (E)
60.0 (W)
15.0
3. Seat Width
The horizontal dimension of the abutment seat.
in
0.0 (E)
48.0 (W)
--
4. Seat Slope
Height
If the abutment seat is sloped, the height of the slope is specified. A zero value indicates a level abutment seat.
in
0.0 (E)
6.0 (W)
--
5. Seat Face
Height
The seat face height is measured from the back of the abutment seat to the bottom of the corbel. If a corbel does not exist, the seat face height is measured to the top of the structure.
in
0.0 (E)
96.0 (W)
--
6. Corbel
Width
The corbel width is measured to the seat face of the abutment. A zero value indicates the absence of a corbel.
in
0.0 (E)
6.0 (W)
4.0
7. Corbel
Height
The height of the corbel on the front face of the backwall is measured from the top of the backwall to the seat face.
in
0.0 (E)
48.0 (W)
24.0
8. Corbel
Slope Height
The corbel slope height indicates whether the transition between the backwall and the corbel is sloped. A zero value indicates an abrupt change in backwall thickness.
in
0.0 (E)
6.0 (W)
4.0
9. Paving
Notch Width
The width of the paving notch is measured from the back face of the backwall. A zero value indicates the absence of a paving notch.
in
0.0 (E)
24.0 (W)
9.0
10. Paving
Notch Height
The height of the paving notch is measured from the top of the structure. A zero value indicates the absence of a paving notch.
in
0.0 (E)
36.0 (W)
16.0

Chapter 5 Input Description
5-16
5.6 AT1 - ABUTMENT TYPE I COMMAND (Cont.)
PARAMETER
DESCRIPTION
UNITS
LOWER LIMIT
UPPER LIMIT
Default
11. Bearing
Location X
Centerline of bearing measured from the front face of the stem.
in
0.0 (E)
36.0 (W)
--
12. Bearing
Location Y
Location of horizontal bearing seat loads measured from the top of the backwall.
in
0.0 (E)
150.0 (W)
--1
13. Front (*)
Water Level
The level of the water at the front of the structure measured from the top of the abutment. If a front water level does not exist, this parameter should be left blank. If left blank for a design, the program will calculate based on DM-4 section 3.11.3 only if back water level is entered. For analysis, if the front water level is left blank, the program places the front water level at the bottom of the footing.
ft
0.0
(E)
300.0
(W)
--2
14. Back (*) Water
Level
The level of the water at the back of the structure is measured from the top of the abutment. If a back water level does not exist, this parameter should be left blank. For spread footings on soil, this level should not be under the bottom of the lowest soil layer. The backwater level is used as the reference water level for bearing resistance and settlement calculations. For rock, the level should not be less than the bottom of the footing.
ft
0.0
(E)
300.0
(W)
--2
15. Architectural Treatment Thickness
The thickness of the architectural treatment measured from the front face of the stem. Leave blank if no architectural treatment is present.
in 0.0 (E)
6.0 (W)
0.03
16. Backwall /Stem Bar Alignment
For design, indicate if the backwall bars should be aligned with the optimum stem bar. Leave blank for Analysis runs.
Y - Backwall bar spacings will be aligned with the optimum stem bar spacing.
N - Backwall bar spacings will not be aligned with the optimum stem bar spacing.
Y, N (E)
Y
1 A blank indicates positioning loads on the bearing seat at the centerline of bearing.
2 A blank indicates the absence of a water level. 3 If no architectural treatment is present, this value can be left blank or set to zero. * A minimum water differential of 3 ft. is required as specified in DM-4 section 3.11.3. The minimum water
differential must be applied even when the back water level is below the bottom of the footing.
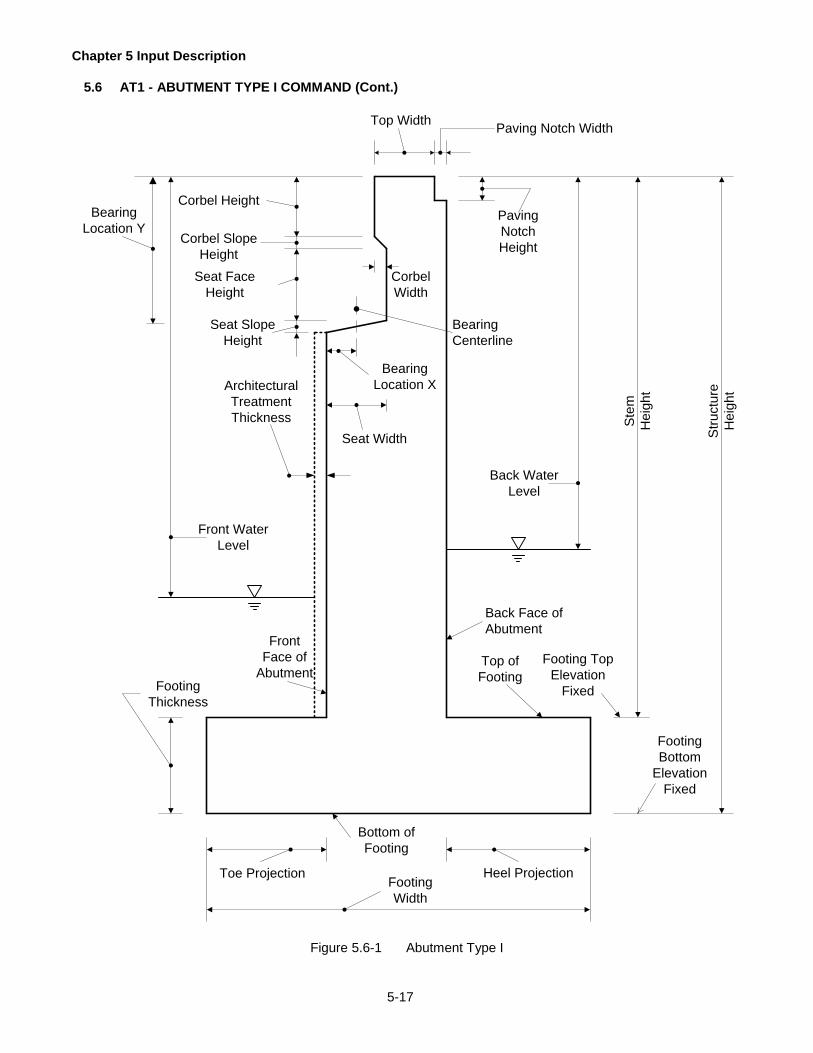
Chapter 5 Input Description
5-17
5.6 AT1 - ABUTMENT TYPE I COMMAND (Cont.)
Footing Top
Elevation
Fixed
Footing
Bottom
Elevation
Fixed
Paving
Notch
Height
Top WidthPaving Notch Width
Corbel Height
Corbel Slope
Height
Seat Face
Height
Seat Slope
Height
Corbel
Width
Seat Width
Bearing
Location X
Back Water
Level
Footing
Thickness
Heel ProjectionToe Projection
Front Water
Level
Back Face of
Abutment
Top of
Footing
Bottom of
Footing
Front
Face of
Abutment
Footing
Width
Bearing
Centerline
Ste
m
He
igh
t
Str
uctu
re
He
igh
t
Bearing
Location Y
Architectural
Treatment
Thickness
Figure 5.6-1 Abutment Type I
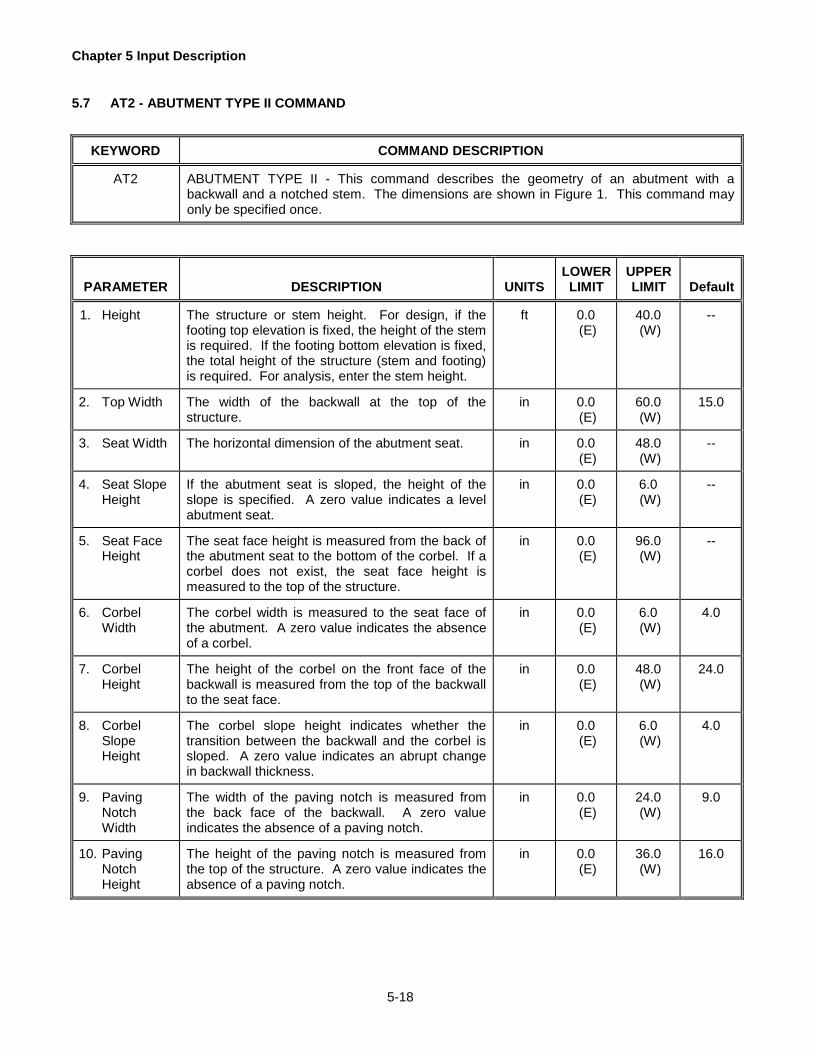
Chapter 5 Input Description
5-18
5.7 AT2 - ABUTMENT TYPE II COMMAND
KEYWORD
COMMAND DESCRIPTION
AT2
ABUTMENT TYPE II - This command describes the geometry of an abutment with a backwall and a notched stem. The dimensions are shown in Figure 1. This command may only be specified once.
PARAMETER
DESCRIPTION
UNITS
LOWER LIMIT
UPPER LIMIT
Default
1. Height
The structure or stem height. For design, if the footing top elevation is fixed, the height of the stem is required. If the footing bottom elevation is fixed, the total height of the structure (stem and footing) is required. For analysis, enter the stem height.
ft
0.0 (E)
40.0 (W)
--
2. Top Width
The width of the backwall at the top of the structure.
in
0.0 (E)
60.0 (W)
15.0
3. Seat Width
The horizontal dimension of the abutment seat.
in
0.0 (E)
48.0 (W)
--
4. Seat Slope
Height
If the abutment seat is sloped, the height of the slope is specified. A zero value indicates a level abutment seat.
in
0.0 (E)
6.0 (W)
--
5. Seat Face
Height
The seat face height is measured from the back of the abutment seat to the bottom of the corbel. If a corbel does not exist, the seat face height is measured to the top of the structure.
in
0.0 (E)
96.0 (W)
--
6. Corbel
Width
The corbel width is measured to the seat face of the abutment. A zero value indicates the absence of a corbel.
in
0.0 (E)
6.0 (W)
4.0
7. Corbel
Height
The height of the corbel on the front face of the backwall is measured from the top of the backwall to the seat face.
in
0.0 (E)
48.0 (W)
24.0
8. Corbel
Slope Height
The corbel slope height indicates whether the transition between the backwall and the corbel is sloped. A zero value indicates an abrupt change in backwall thickness.
in
0.0 (E)
6.0 (W)
4.0
9. Paving
Notch Width
The width of the paving notch is measured from the back face of the backwall. A zero value indicates the absence of a paving notch.
in
0.0 (E)
24.0 (W)
9.0
10. Paving
Notch Height
The height of the paving notch is measured from the top of the structure. A zero value indicates the absence of a paving notch.
in
0.0 (E)
36.0 (W)
16.0

Chapter 5 Input Description
5-19
5.7 AT2 - ABUTMENT TYPE II COMMAND (Cont.)
PARAMETER
DESCRIPTION
UNITS
LOWER LIMIT
UPPER LIMIT
Default
11. Backwall
Height
The height of the back face of the abutment backwall is measured from the bottom of the paving notch to the top of the stem notch.
in
0.0 (E)
160.0 (W)
--
12. Stem Notch
Width
The width of the notch in the stem, below the backwall, is measured from the back face. A zero value indicates the absence of a stem notch.
in
0.0 (E)
60.0 (W)
20.0
13. Stem Notch
Height
The stem notch height is measured from the bottom of the back face of the backwall to the notch point in the stem. If the stem notch width exists, but the stem notch height is a zero value, the stem notch overhang is level.
in
0.0 (E)
120.0 (W)
30.0
14. Front Face
Horizontal Component
The horizontal component of the front face batter. Used in conjunction with the front face vertical component to describe a battered front face. If the front face is vertical, this parameter should be left blank.
--
0.0 (E)
100.0 (W)
--1
15. Front Face
Vertical Component
The vertical component of the front face batter. Used in conjunction with the front face horizontal component to describe a battered front face. If the front face is vertical, this parameter should be left blank.
--
0.0 (E)
100.0 (W)
--1
16. Back Face
Horizontal Component
The horizontal component of the back face batter. Used in conjunction with the back face vertical component to describe a battered back face. If the back face is vertical, this parameter should be left blank.
--
0.0 (E)
100.0 (W)
--1
17. Back Face
Vertical Component
The vertical component of the back face batter. Used in conjunction with the back face horizontal component to describe a battered back face. If the back face is vertical, this parameter should be left blank.
--
0.0 (E)
100.0 (W)
--1
18. Bearing
Location X
Centerline of bearing measured from the front face of the stem.
in
0.0 (E)
36.0 (W)
--
19. Bearing
Location Y
Location of horizontal bearing seat loads measured from the top of the backwall.
in
0.0 (E)
150.0 (W)
--2
20. Front (*)
Water Level
The level of the water at the front of the structure measured from the top of the abutment. If a front water level does not exist, this parameter should be left blank. If left blank for a design, the program will calculate based on DM-4 section 3.11.3 only if back water level is entered. For analysis, if the front water level is left blank, the program places the front water level at the bottom of the footing.
ft
0.0 (E)
300.0 (W)
--3

Chapter 5 Input Description
5-20
5.7 AT2 - ABUTMENT TYPE II COMMAND (Cont.)
PARAMETER
DESCRIPTION
UNITS
LOWER LIMIT
UPPER LIMIT
Default
21. Back (*) Water
Level
The level of the water at the back of the structure measured from the top of the abutment. If a back water level does not exist, this parameter should be left blank. For spread footings on soil, this level should not be under the bottom of the lowest soil layer. The backwater level is used as the reference water level for bearing resistance and settlement calculations. For rock, the level should not be less than the bottom of the footing.
ft
0.0 (E)
300.0 (W)
--3
22. Architectural Treatment Thickness
The thickness of the architectural treatment measured from the front face of the stem. Leave blank if no architectural treatment is present.
in
0.0 (E)
6.0 (W)
0.04
23. Backwall /Stem Bar Alignment
For design, indicate if the backwall bars should be aligned with the optimum stem bar. Leave blank for Analysis runs.
Y - Backwall bar spacings will be aligned with the optimum stem bar spacing.
N - Backwall bar spacings will not be aligned with the optimum stem bar spacing.
Y, N (E)
Y
1 A blank for the horizontal and vertical batter indicate a vertical wall face. 2 A blank indicates positioning loads on the bearing seat at the centerline of bearing. 3 A blank indicates the absence of a water level. 4 If no architectural treatment is present, this value can be left blank or set to zero. * A minimum water differential of 3 ft. is required as specified in DM-4 section 3.11.3. The minimum water
differential must be applied even when the back water level is below the bottom of the footing.
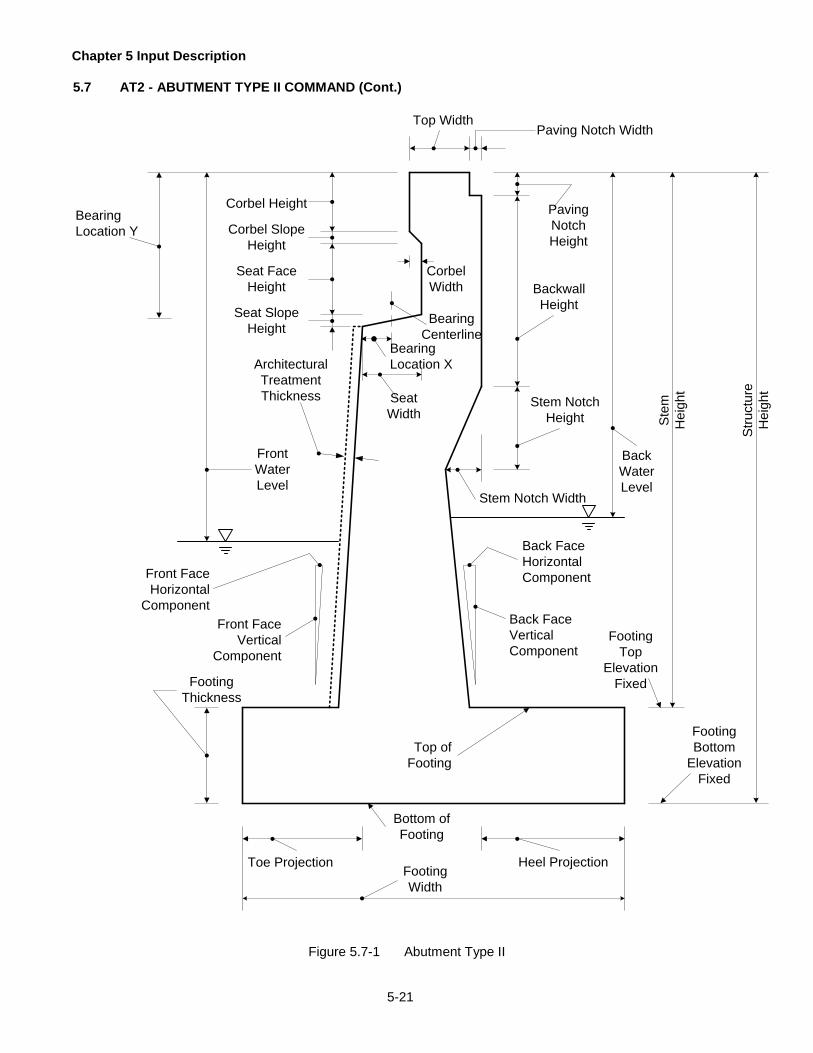
Chapter 5 Input Description
5-21
5.7 AT2 - ABUTMENT TYPE II COMMAND (Cont.)
Footing
Top
Elevation
Fixed
Footing
Bottom
Elevation
Fixed
Paving
Notch
Height
Top WidthPaving Notch Width
Corbel Height
Corbel Slope
Height
Seat Face
Height
Seat Slope
Height
Corbel
Width
Seat
Width
Bearing
Location X
Back
Water
Level
Footing
Thickness
Heel ProjectionToe Projection
Backwall
Height
Stem Notch
Height
Stem Notch Width
Back Face
Vertical
Component
Front Face
Vertical
Component
Front
Water
Level
Front Face
Horizontal
Component
Back Face
Horizontal
Component
Bottom of
Footing
Top of
Footing
Footing
Width
Bearing
Centerline
Ste
m
He
igh
t
Str
uctu
re
He
igh
t
Bearing
Location Y
Architectural
Treatment
Thickness
Figure 5.7-1 Abutment Type II

Chapter 5 Input Description
5-22
5.8 AWB - ABUTMENT WITHOUT BACKWALL COMMAND
KEYWORD
COMMAND DESCRIPTION
AWB
ABUTMENT WITHOUT BACKWALL - This command describes the geometry of an abutment without a backwall. The dimensions are shown in Figure 1. This command may only be specified once.
PARAMETER
DESCRIPTION
UNITS
LOWER LIMIT
UPPER LIMIT
Default
1. Height
The structure or stem height. For design, if the footing top elevation is fixed, the height of the stem is required. If the footing bottom elevation is fixed, the total height of the structure (stem and footing) is required. For analysis, enter the stem height.
ft
0.0 (E)
40.0 (W)
--
2. Top Width
The width of the stem at the top of the structure.
in
0.0 (E)
60.0 (W)
18.0
3. Bearing
Location
Centerline of bearing measured from the front face of the stem.
in
0.0 (E)
36.0 (W)
--
4. Front Face
Horizontal Component
The horizontal component of the front face batter. Used in conjunction with the front face vertical component to describe a battered front face. If the front face is vertical, this parameter should be left blank.
--
0.0 (E)
100.0 (W)
--1
5. Front Face
Vertical Component
The vertical component of the front face batter. Used in conjunction with the front face horizontal component to describe a battered front face. If the front face is vertical, this parameter should be left blank.
--
0.0 (E)
100.0 (W)
--1
6. Back Face
Horizontal Component
The horizontal component of the back face batter. Used in conjunction with the back face vertical component to describe a battered back face. If the back face is vertical, this parameter should be left blank.
--
0.0 (E)
100.0 (W)
--1
7. Back Face
Vertical Component
The vertical component of the back face batter. Used in conjunction with the back face horizontal component to describe a battered back face. If the back face is vertical, this parameter should be left blank.
--
0.0 (E)
100.0 (W)
--1
8. Additional
Fill Height
The additional fill height is the distance from the top of the abutment to the finished grade of the backfill after the superstructure has been constructed.
ft
0.0 (E)
20.0 (W)
--
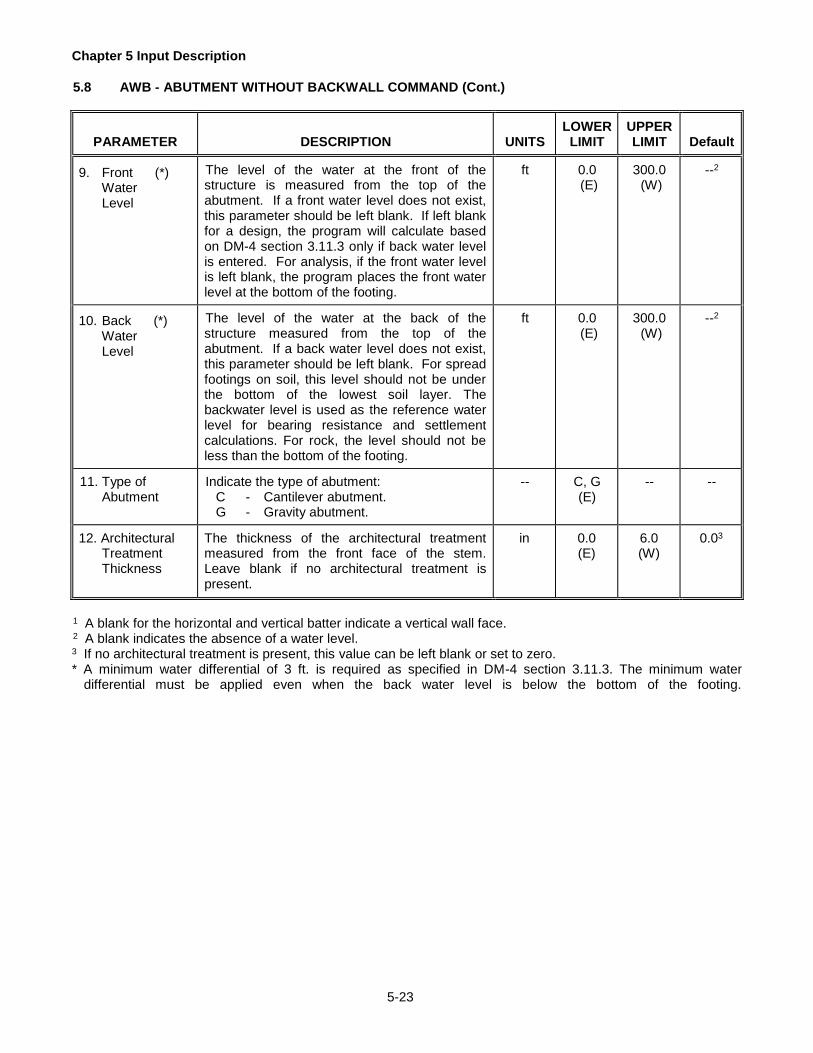
Chapter 5 Input Description
5-23
5.8 AWB - ABUTMENT WITHOUT BACKWALL COMMAND (Cont.)
PARAMETER
DESCRIPTION
UNITS
LOWER LIMIT
UPPER LIMIT
Default
9. Front (*) Water
Level
The level of the water at the front of the structure is measured from the top of the abutment. If a front water level does not exist, this parameter should be left blank. If left blank for a design, the program will calculate based on DM-4 section 3.11.3 only if back water level is entered. For analysis, if the front water level is left blank, the program places the front water level at the bottom of the footing.
ft
0.0 (E)
300.0 (W)
--2
10. Back (*) Water
Level
The level of the water at the back of the structure measured from the top of the abutment. If a back water level does not exist, this parameter should be left blank. For spread footings on soil, this level should not be under the bottom of the lowest soil layer. The backwater level is used as the reference water level for bearing resistance and settlement calculations. For rock, the level should not be less than the bottom of the footing.
ft
0.0 (E)
300.0 (W)
--2
11. Type of
Abutment
Indicate the type of abutment:
C - Cantilever abutment. G - Gravity abutment.
--
C, G (E)
--
--
12. Architectural
Treatment Thickness
The thickness of the architectural treatment measured from the front face of the stem. Leave blank if no architectural treatment is present.
in
0.0 (E)
6.0 (W)
0.03
1 A blank for the horizontal and vertical batter indicate a vertical wall face. 2 A blank indicates the absence of a water level. 3 If no architectural treatment is present, this value can be left blank or set to zero. * A minimum water differential of 3 ft. is required as specified in DM-4 section 3.11.3. The minimum water
differential must be applied even when the back water level is below the bottom of the footing.

Chapter 5 Input Description
5-24
5.8 AWB - ABUTMENT WITHOUT BACKWALL COMMAND (Cont.)
Footing
Top
Elevation
Fixed
Additional Fill Height
Footing
Bottom
Elevation
Fixed
Top Width
Back Water Level
Footing Thickness
Heel ProjectionToe Projection
Back Face
Horizontal
Component
Bearing Location
Front Face
Horizontal
Component
Front Water Level
Front Face
Vertical
Component
Back Face
Vertical
Component
Bottom of
Footing
Top of
Footing
Top of Fill (Finished Grade)
Footing Width
Bearing Centerline
Top of Abutment (Beam Seat)
Ste
m
He
igh
t
Str
uctu
re
He
igh
t
Architectural
Treatment
Thickness
Figure 5.8-1 Abutment Without Backwall

Chapter 5 Input Description
5-25
5.9 RWL - RETAINING WALL COMMAND
KEYWORD
COMMAND DESCRIPTION
RWL
RETAINING WALL - This command describes the geometry of a retaining wall. The dimensions are shown in Figure 1. This command may only be specified once.
PARAMETER
DESCRIPTION
UNITS
LOWER LIMIT
UPPER LIMIT
Default
1. Height
The structure or stem height. For design, if the footing top elevation is fixed, the height of the stem is required. If the footing bottom elevation is fixed, the total height of the structure (stem and footing) is required. For analysis, enter the stem height.
ft
0.0 (E)
40.0 (W)
--
2. Top Width
The width of the stem at the top of the structure.
in
0.0 (E)
60.0 (W)
18.0
3. Front Face
Horizontal Component
The horizontal component of the front face batter. Used in conjunction with the front face vertical component to describe a battered front face. If the front face is vertical, this parameter should be left blank.
--
0.0 (E)
100.0 (W)
--1
4. Front Face
Vertical Component
The vertical component of the front face batter. Used in conjunction with the front face horizontal component to describe a battered front face. If the front face is vertical, this parameter should be left blank.
--
0.0 (E)
100.0 (W)
--1
5. Back Face
Horizontal Component
The horizontal component of the back face. Used in conjunction with the back face vertical component to describe a battered back face. If the back face is vertical, this parameter should be left blank.
--
0.0 (E)
100.0 (W)
--1
6. Back Face
Vertical Component
The vertical component of the back face batter. Used in conjunction with the back face horizontal component to describe a battered back face. If the back face is vertical, this parameter should be left blank.
--
0.0 (E)
100.0 (W)
--1
7. Exposed
Stem Height
For retaining walls with backfill less than the full height of the stem, the exposed stem height is measured vertically from the top of the stem to the start of the backfill.
in
0.0 (E)
120.0 (W)
--
8. Backfill (+)
Horizontal Component
The horizontal component of the backfill. Used in conjunction with the backfill vertical component to describe a sloped backfill. If the backfill is flat, this parameter should be left blank.
--
0.0 (E)
100.0 (W)
--2

Chapter 5 Input Description
5-26
5.9 RWL - RETAINING WALL COMMAND (Cont.)
PARAMETER
DESCRIPTION
UNITS
LOWER LIMIT
UPPER LIMIT
Default
9. Backfill (+)
Vertical Component
The vertical component of the backfill. Used in conjunction with the backfill horizontal component to describe a sloped backfill. If the backfill is flat, this parameter should be left blank.
--
0.0 (E)
100.0 (W)
--2,3
10. Backfill
Slope Height
The height of the sloped portion of a broken backfill. If the backfill is continuously sloping, or if the backfill is flat, this parameter should be left blank.
ft
0.0 (E)
50.0
(W)
--4
11. Front (*)
Water Level
The level of the water at the front of the structure measured from the top of the structure. If a front water level does not exist, this parameter should be left blank. If left blank for a design, the program will calculate based on DM-4 section 3.11.3 only if back water level is entered. For analysis, if the front water level is left blank, the program places the front water level at the bottom of the footing.
ft
0.0 (E)
300.0 (W)
--5
12. Back (*)
Water Level
The level of the water at the back of the structure measured from the top of the structure. If a back water level does not exist, this parameter should be left blank. For spread footings on soil, this level should not be under the bottom of the lowest soil layer. The backwater level is used as the reference water level for bearing resistance and settlement calculations. For rock, the level should not be less than the bottom of the footing.
ft
0.0 (E)
300.0 (W)
--5
13. Type of Wall
Indicate the type of wall:
C - Cantilever wall. G - Gravity wall.
--
C, G (E)
--
--
14. Architectural
Treatment Thickness
The thickness of the architectural treatment measured from the front face of the stem. Leave blank if no architectural treatment is present.
in
0.0 (E)
6.0 (W)
0.06
1 A blank for the horizontal and vertical batter indicates a vertical wall face. 2 A blank for the horizontal and vertical backfill slopes indicates a flat backfill. 3 Maximum backfill slope is 1:1.5. 4 A blank for the backfill slope height indicates a continuously sloping or flat backfill. 5 A blank indicates the absence of a water level. 6 If no architectural treatment is present, this value can be left blank or set to zero. * A minimum water differential of 3 ft. is required as specified in DM-4 section 3.11.3. The minimum water
differential must be applied even when the back water level is below the bottom of the footing. + The Backfill Slope Angle (arctangent (Backfill Vertical Component/ Backfill Horizontal Component)) must be
less than the Backfill Internal Friction Angle entered on the MAT command (Parameter 8).

Chapter 5 Input Description
5-27
5.9 RWL - RETAINING WALL COMMAND (Cont.)
Footing
Top
Elevation
Fixed
Backfill Slope
Height (Broken
Backfill Only)
Footing
Bottom
Elevation
Fixed
Top Width
Back Water
Level
Heel
Projection
Toe
Projection
Front Face
Horizontal
Component
Back Face
Horizontal
Component
Exposed
Stem
Height
Backfill
Vertical
Component
Footing Thickness
Front Water
Level
Bottom of
Footing
Top of
Footing
Front Face
Vertical
Component
Back Face
Vertical
Component
Top of
Structure
Top of
StructureBackfill
Horizontal
Component
Footing
Width
Ste
m
He
igh
t
Str
uctu
re
He
igh
t
Architectural
Treatment
Thickness
Figure 5.9-1 Retaining Wall
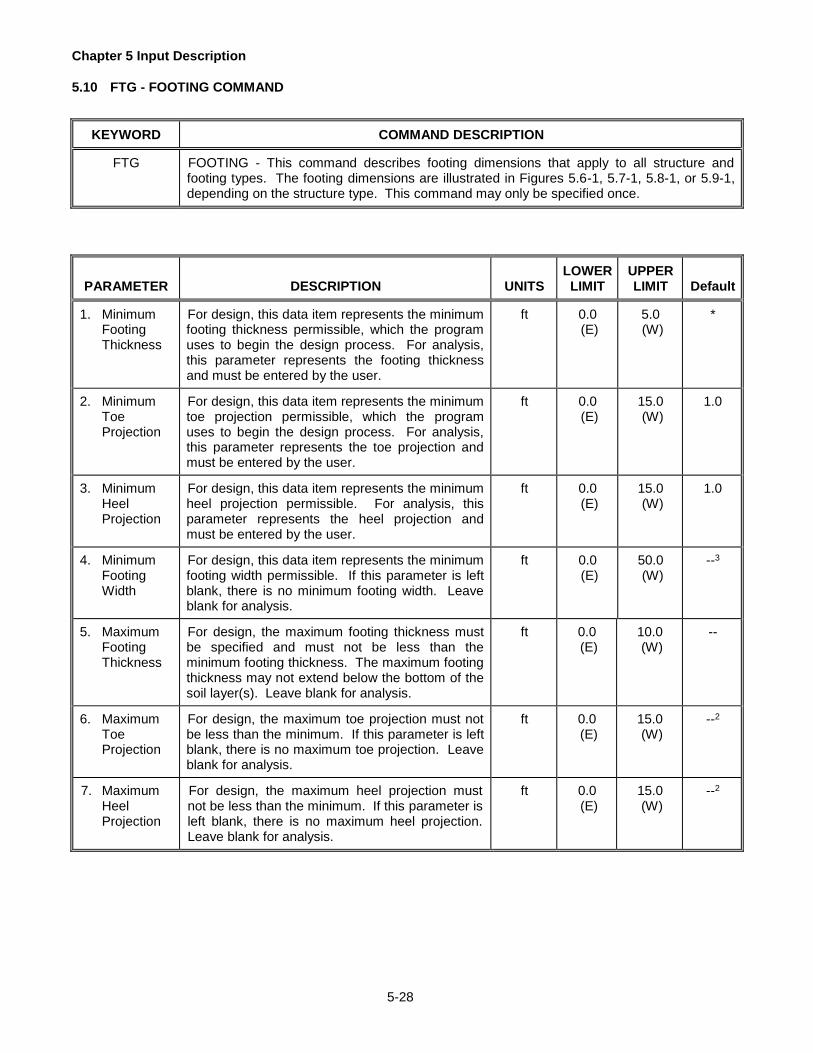
Chapter 5 Input Description
5-28
5.10 FTG - FOOTING COMMAND
KEYWORD
COMMAND DESCRIPTION
FTG
FOOTING - This command describes footing dimensions that apply to all structure and footing types. The footing dimensions are illustrated in Figures 5.6-1, 5.7-1, 5.8-1, or 5.9-1, depending on the structure type. This command may only be specified once.
PARAMETER
DESCRIPTION
UNITS
LOWER LIMIT
UPPER LIMIT
Default
1. Minimum
Footing Thickness
For design, this data item represents the minimum footing thickness permissible, which the program uses to begin the design process. For analysis, this parameter represents the footing thickness and must be entered by the user.
ft
0.0 (E)
5.0 (W)
*
2. Minimum
Toe Projection
For design, this data item represents the minimum toe projection permissible, which the program uses to begin the design process. For analysis, this parameter represents the toe projection and must be entered by the user.
ft
0.0 (E)
15.0 (W)
1.0
3. Minimum
Heel Projection
For design, this data item represents the minimum heel projection permissible. For analysis, this parameter represents the heel projection and must be entered by the user.
ft
0.0 (E)
15.0 (W)
1.0
4. Minimum
Footing Width
For design, this data item represents the minimum footing width permissible. If this parameter is left blank, there is no minimum footing width. Leave blank for analysis.
ft
0.0 (E)
50.0 (W)
--3
5. Maximum
Footing Thickness
For design, the maximum footing thickness must be specified and must not be less than the minimum footing thickness. The maximum footing thickness may not extend below the bottom of the soil layer(s). Leave blank for analysis.
ft
0.0 (E)
10.0 (W)
--
6. Maximum
Toe Projection
For design, the maximum toe projection must not be less than the minimum. If this parameter is left blank, there is no maximum toe projection. Leave blank for analysis.
ft
0.0 (E)
15.0 (W)
--2
7. Maximum
Heel Projection
For design, the maximum heel projection must not be less than the minimum. If this parameter is left blank, there is no maximum heel projection. Leave blank for analysis.
ft
0.0 (E)
15.0 (W)
--2

Chapter 5 Input Description
5-29
5.10 FTG - FOOTING COMMAND (Cont.)
PARAMETER
DESCRIPTION
UNITS
LOWER LIMIT
UPPER LIMIT
Default
8. Maximum
Footing Width
For design, the maximum footing width must not be less than the minimum. If this parameter is left blank, there is no maximum footing width. Leave blank for analysis.
ft
0.0 (E)
50.0 (W)
--2
9. Footing
Thickness Increment
The increment to add to the footing thickness to obtain the next footing size for a design run. This parameter can be used to speed up a design run (refer to Section 6.10.9 for details). Leave blank for Analysis runs.
in
1.0 (E)
12.0 (W)
2.0
10. Footing
Width Increment
The increment to add to the footing width to obtain the next footing size for a design run. This parameter can be used to speed up a design run (refer to Section 6.10.10 for details). Leave blank for Analysis runs.
in
1.0 (E)
12.0 (W)
3.0
11. Footing
Stem Increment
The increment used increase the toe projection during a design run. This parameter can be used to speed up a design run (refer to Section 6.10.11 for details). Leave blank for Analysis runs.
in
1.0 (E)
12.0 (W)
1.0
1 A blank indicates no limit on the minimum dimension. 2 A blank indicates no limit on the maximum dimension. 3 For design only, the Minimum Footing Width of Pile/Caisson foundation is the larger of:
Minimum Toe Projection + Stem Base Width + Minimum Heel Projection
Toe to First Row + Minimum Row Spacing + Minimum Heel to Last Row * For design only, spread footing = 2.0 ft; pile footing = 2.5 ft

Chapter 5 Input Description
5-30
5.11 SPR - SPREAD COMMAND
KEYWORD
COMMAND DESCRIPTION
SPR
SPREAD - This command describes the parameters used to select and perform the spread footing design optimization. This command may only be specified once. The ground slope parameters are illustrated in Figure 1. Do not specify this command for an analysis run.
PARAMETER
DESCRIPTION
UNITS
LOWER LIMIT
UPPER LIMIT
Default
1. Design
Optimizing
Optimize the design for: C - least footing cost V - least footing volume If V is selected by the user, all other parameters on this command should be left blank.
--
C, V (E)
--
--
2. Cost of
Concrete
The cost of installed footing concrete.
$/yd3
0.0 (E)
1000.0
(W)
--
3. Cut or Fill
Existing ground type:
C - Structure is situated in a cut zone. F - Structure is situated in a fill zone.
If F is selected by the user, parameters 5 through 9 should be left blank.
--
C, F (E)
--
--
4. Cost of Fill
Cost of installed structural backfill material. This parameter is applicable for structures in both a fill zone and a cut zone.
$/yd3
0.0 (E)
1000.0
(W)
--
5. Cost of Cut
Cost to cut into existing soil for structure placement. This parameter is only applicable for structures in a cut zone. If the structure is in a fill zone, leave this parameter blank.
$/yd3
0.0 (E)
1000.0
(W)
--
6. Ground
Elevation
The elevation of the original ground relative to the final structure placement. The ground elevation is measured from the top of the structure. If the original ground is higher than the top of the structure, this dimension should be negative. This parameter is only applicable for structures in a cut zone.
ft
-100.0 (W)
100.0 (W)
--
7. Ground
Slope Type
Indicate the direction of original ground slope. This parameter is only applicable for structures in a cut zone:
T - Original ground slope increases toward the toe.
H - Original ground slope increases toward the heel.
F - Original ground slope is flat.
--
T, H, F
(E)
--
--
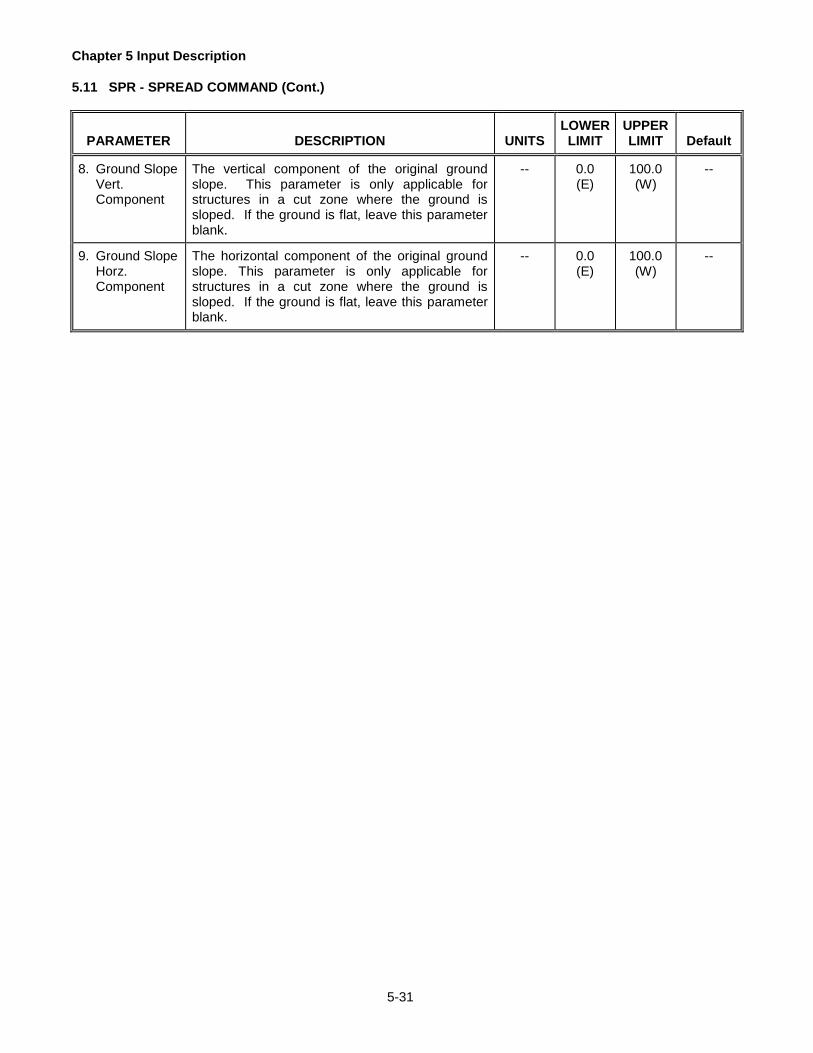
Chapter 5 Input Description
5-31
5.11 SPR - SPREAD COMMAND (Cont.)
PARAMETER
DESCRIPTION
UNITS
LOWER LIMIT
UPPER LIMIT
Default
8. Ground Slope
Vert. Component
The vertical component of the original ground slope. This parameter is only applicable for structures in a cut zone where the ground is sloped. If the ground is flat, leave this parameter blank.
--
0.0 (E)
100.0 (W)
--
9. Ground Slope
Horz. Component
The horizontal component of the original ground slope. This parameter is only applicable for structures in a cut zone where the ground is sloped. If the ground is flat, leave this parameter blank.
--
0.0 (E)
100.0 (W)
--

Chapter 5 Input Description
5-32
5.11 SPR - SPREAD COMMAND (Cont.)
Ground
Elevation
(positive)
TOE HEEL
Ground Slope
Vertical
Component
Ground Slope
Horizontal Component
Original Ground
Slope
Ground
Elevation
(positive)
TOE HEEL
Ground Slope
Vertical Component
Ground Slope
Horizontal
Component
Original Ground
Slope
(a) Slope Type 'H', Positive Ground Elevation
(b) Slope Type 'T', Positive Ground Elevation
Figure 5.11-1 SPR Command Ground Slope Orientation

Chapter 5 Input Description
5-33
5.12 PIL - PILE COMMAND
KEYWORD
COMMAND DESCRIPTION
PIL
PILE - This command describes pile properties and individual pile dimensions. Individual pile dimensions are illustrated in Figure 1. This command may only be specified once.
PARAMETER
DESCRIPTION
UNITS
LOWER LIMIT
UPPER LIMIT
Default
1. Pile
Dimension A
Diameter of a circular pile or the flange width or web depth of an H pile, measured in the perpendicular direction of the footing. A pile footing may consist of only one type of pile (circular or H).
in
0.0 (E)
24.0 (W)
--
2. Pile
Dimension B
Flange width or web depth of an H pile measured in the parallel direction of the footing. For a footing with circular piles, this dimension should be left blank.
in
0.0 (E)
24.0 (W)
--1
3. Pile
Embedment
Vertical distance from the bottom of the footing to the top of the embedded piles within the footing.
in
12.0 (E)
24.0 (W)
--
4. Service Axial
Capacity
NOTE: This parameter is no longer used and should be left blank.
--
--
--
--
5. Strength
Axial Capacity
The compressive axial capacity of a single pile for strength conditions. This capacity will also be used when evaluating Extreme Event II.
kip
0.0 (E)
1000.0
(W)
--
6. Service
Lateral Capacity
NOTE: This parameter is no longer used and should be left blank.
--
--
--
--
7. Strength
Lateral Capacity
The lateral capacity of a single pile in an all vertical pile foundation for strength conditions. This capacity will also be used when evaluating Extreme Event II. This value should be left blank when battered piles are present.
kip
0.0 (E)
100.0 (W)
--
8. Pile Uplift
Capacity
The uplift axial capacity of a single pile. Uplift is measured axially and allowed for all limit states except the service limit states.
kip
0.0 (E)
300.0 (W)
--
1 A blank indicates circular piles.

Chapter 5 Input Description
5-34
5.12 - PIL - PILE COMMAND (Cont.)
TOE HEEL
(a) Embedment
(b) Pile / Caisson Orientation
Pile or Caisson
Embedment
Back
Face of
Stem
Front
Face of
StemFront
Face of
Footing
Front
Face of
Footing
Dimension A
(Piles Only)
Dimension B
(Piles Only)
Dimension A
Pa
ralle
l
Dire
ctio
n
Perpendicular
Direction
Note: A foot ing may on ly have one type
and orientation of piles or caissons.
Front Face of
Stem
Figure 5.12-1 Pile / Caisson Dimensions

Chapter 5 Input Description
5-35
5.13 CAI - CAISSON COMMAND
KEYWORD
COMMAND DESCRIPTION
CAI
CAISSON - This command describes caisson properties and individual caisson dimensions. Individual caisson dimensions are illustrated in Figure 5.12-1. This command may only be specified once.
PARAMETER
DESCRIPTION
UNITS
LOWER LIMIT
UPPER LIMIT
Default
1. Caisson
Diameter
Diameter of a caisson.
in
0.0 (E)
60.0 (W)
--
2. Caisson
Embedment
Vertical distance from the bottom of the footing to the top of the embedded caissons in the footing.
in
0.0 (E)
24.0 (W)
--
3. Service Axial
Capacity
NOTE: This parameter is no longer used and should be left blank.
--
--
--
--
4. Strength Axial
Capacity
The compressive axial capacity of a single caisson for strength conditions. This capacity will also be used when evaluating Extreme Event II.
kip
0.0 (E)
1600.0
(W)
--
5. Service
Lateral Capacity
NOTE: This parameter is no longer used and should be left blank.
--
--
--
--
6. Strength
Lateral Capacity
The lateral capacity of a single caisson in an all vertical caisson foundation for strength conditions. This capacity will also be used when evaluating Extreme Event II. This value should be left blank when battered piles are present.
kip
0.0 (E)
160.0 (W)
--
7. Caisson Uplift
Capacity
The uplift axial capacity of a single caisson. Uplift is allowed for all limit states except the service limit states.
kip
0.0 (E)
300.0 (W)
--

Chapter 5 Input Description
5-36
5.14 PED - PEDESTAL COMMAND
KEYWORD
COMMAND DESCRIPTION
PED
PEDESTAL - This command describes pedestal properties and dimensions. Pedestal dimensions are illustrated in Figures 1 and 2. This command may be specified only once.
PARAMETER
DESCRIPTION
UNITS
LOWER LIMIT
UPPER LIMIT
Default
1. Pedestal
Spacing
Center to center spacing of pedestals in the parallel direction of the footing.
ft
0.0 (E)
30.0 (W)
-- 2. Pedestal
Height
The height of the pedestal measured from the bottom of the pedestal to the bottom of the footing.
ft
0.0 (E)
30.0 (W)
--
3. Pedestal
Front Height
The height of the front part of the pedestal measured from the bottom of the pedestal to the beginning of the front slope. If the pedestal front has no slope, the total pedestal height should be used.
ft
*
(E)
30.0 (W)
--
4. Minimum
Pedestal Width
For design, this parameter represents the minimum pedestal width allowed, and the value, which the program uses to begin the design process. For analysis, this parameter is the pedestal width.
ft
0.0 (E)
30.0 (W)
--
5. Minimum
Pedestal Thickness
For design, this parameter represents the minimum pedestal thickness allowed, and the value, which the program uses to begin the design process. For analysis, this parameter is the pedestal thickness.
in
*
(E)
36.0 (W)
--
6. Pedestal
Front Projection
For analysis only, this parameter is the pedestal front projection. Leave blank for design. This parameter is set by the program to 1 ft. as per DM-4 Section 10.6.5.2 for design.
ft
0.0 (E)
10.0 (W)
--
7. Pedestal
Back Offset
For analysis only, specify the pedestal back offset. Leave blank for design. In design problems, the back offset is set by the program, with a maximum value equal to the footing thickness and a minimum value of 1 ft. as per DM-4 Section 10.6.5.2.
ft
0.0 (E)
10.0 (W)
1.0
8. Maximum
Pedestal Width
For design, this parameter represents the maximum pedestal width allowed. Leave blank for analysis.
ft
0.0 (E)
30.0 (W)
--
9. Maximum
Pedestal Thickness
For design, this parameter represents the maximum pedestal thickness allowed. Leave blank for analysis.
in
24.0 (E)
36.0 (W)
--

Chapter 5 Input Description
5-37
5.14 PED - PEDESTAL COMMAND (Cont.)
PARAMETER
DESCRIPTION
UNITS
LOWER LIMIT
UPPER LIMIT
Default
10. Design
Optimization
Optimize the design for: D - least pedestal density V - least footing volume Leave Blank for Analysis.
--
D, V (W)
--
--
* For analysis, the lower limit is equal to 0.0 and is processed as an error check. For design, the lower limit is
equal to the value specified in DM-4 and is processed as an error check.

Chapter 5 Input Description
5-38
5.14 PED - PEDESTAL COMMAND (Cont.)
Pedestal
Thickness
Pedestal
Height
Pedestal
Back
Offset
Pedestal WidthPedestal
Spacing
(center to
center)
Pedestal
Front
Height
Pedestal
Front
Projection
FOOTING
PEDESTAL
STEM
HEEL
TOE
Figure 5.14-1 Pedestal Dimensions

Chapter 5 Input Description
5-39
5.14 PED - PEDESTAL COMMAND (Cont.)
Pedestal Height Pedestal Thickness
Pedestal Spacing
(center to center)
Pedestal Front Height
(a) Front View
Pedestal
Front
Projection
Pedestal Height
Pedestal Front Height Pedestal Width
Pedestal Back Offset
(b) Side View
FOOTING TOE
STEM
FOOTING
STEM
TOE HEEL
PEDESTAL
Figure 5.14-2 Pedestal Dimensions

Chapter 5 Input Description
5-40
5.15 LYD - PILE/CAISSON LAYOUT DESIGN COMMAND
KEYWORD
COMMAND DESCRIPTION
LYD
PILE / CAISSON LAYOUT DESIGN - This command is used to describe dimensions and criteria necessary for the design of a pile or caisson footing. Dimensions are illustrated in Figure 1. This command may only be specified once.
PARAMETER
DESCRIPTION
UNITS
LOWER LIMIT
UPPER LIMIT
Default
1. Toe to First
Row
The distance from the toe edge of the footing to the centerline of the first pile or caisson row.
ft
1.52
(E)
6.0 (W)
-
2. Minimum
Heel to Last Row
The minimum distance from the heel edge of the footing to the centerline of the last pile or caisson row. The last pile or caisson row may not be placed at this dimension, depending on the row placement and rounding.
ft
1.52 (E)
6.0 (W)
-
3. Minimum
Spacing
The minimum spacing from centerline to centerline of piles or caissons for both piles in a row and distances between rows.
ft
3.02
(E)
10.0 (W)
-
4. Maximum
Spacing
The maximum spacing from centerline to centerline of piles or caissons for both piles in a row and distances between rows.
ft
3.02 (E)
15.0 (E)
-
5. Row
Placement
Indicate how the pile/caisson rows will be placed:
T - Rows will be placed as close to the toe as allowed.
E - Rows will be placed evenly throughout the footing.
--
T, E (E)
--
T
6. Pile Spacing
Rounding
Pile or caisson spacings within a row will be rounded to the nearest multiple of this number. If rounding is not desired, use a zero value.
ft
0.0 (E)
1.0 (W)
0.25
7. Row
Distances Rounding
Distance between pile or caisson rows will be rounded to the nearest multiple of this number while maintaining at least the minimum spacing. If rounding is not desired, use a zero value.
ft
0.0 (E)
1.0 (W)
0.25
8. Pile Batter
Horizontal Component
The horizontal component of pile or caisson batter. Used in conjunction with the pile batter vertical component to describe the amount of batter that may be applied during a design. If battering is not allowed, leave this parameter blank.
--
0.0 (E)
100.0 (W)
--1
9. Pile Batter
Vertical Component
The vertical component of pile or caisson batter. Used in conjunction with the pile batter horizontal component to describe the amount of batter that may be applied during a design. If battering is not allowed, leave this parameter blank.
--
0.0 (E)
100.0 (W)
--1

Chapter 5 Input Description
5-41
5.15 - LYD - PILE/CAISSON LAYOUT DESIGN COMMAND (Cont.)
PARAMETER
DESCRIPTION
UNITS
LOWER LIMIT
UPPER LIMIT
Default
10. Last Row %
Batter
Maximum percentage of piles or caissons that are allowed to be battered on the last row for a design.
%
0.0 (E)
50.0 (E)
--
11. Optimize
Optimize the design according to:
P - Least pile or caisson density. F - Least footing size (by volume). C - Least installed foundation (pile/caisson
and footing) cost.
--
P, F, C
(E)
--
--
12. Pile /
Caisson Cost
The cost of a single installed pile or caisson. This parameter is only applicable when designing a footing according to cost.
$
0.00 (E)
1000.00
(W)
--
13. Footing
Cost
The cost of an installed unit volume (cubic yard) of footing concrete. This parameter is only applicable when designing a footing according to cost.
$/yd3
0.00 (E)
1000.00
(W)
--
1 A blank for the horizontal and vertical batter indicates a vertical pile/caisson. 2 The actual lower limit is a function of the pile diameter/dimensions. However, the minimum lower limit as per DM4 10.7.1.2 is the value shown in this table.

Chapter 5 Input Description
5-42
5.15 - LYD - PILE/CAISSON LAYOUT DESIGN COMMAND (Cont.)
Toe to
First Row
TOE HEEL
Equal
Distance
Minimum
Heel to
Last Row
Pile Batter
Vertical
Component
(a) Equal Row Placement
Pile Batter
Horizontal
Component
Equal
Distance
Front
Face of
Stem
Back
Face of
Stem
Toe to
First
Row
TOE HEEL
Minimum
Spacing
Minimum
Heel to
Last Row
Pile Batter
Vertical
Component
(b) Row Placement toward Toe
Pile Batter
Horizontal
Component
Front
Face of
Stem
Back
Face of
Stem
Minimum
Spacing
Note: Horizontal and
vertical components
apply to all battered
rows.
Note: Horizontal and
vertical components
apply to all battered rows.
Note: Last row may not be
placed as close as
possible to the heel,
but it will not violate
this minimum limit.
Figure 5.15-1 Pile / Caisson Design Layouts

Chapter 5 Input Description
5-43
5.16 LYA - PILE/CAISSON LAYOUT ANALYSIS COMMAND
KEYWORD
COMMAND DESCRIPTION
LYA
PILE / CAISSON LAYOUT ANALYSIS - This command is used to describe the pile or caisson layout of an existing footing. Parameters 2 through 6 may be repeated to enter up to 5 rows of piles or caissons. The dimensions are shown in Figure 1. This command may only be specified once.
PARAMETER
DESCRIPTION
UNITS
LOWER LIMIT
UPPER LIMIT
Default
1. Number of
Rows
The number of pile or caisson rows in the footing.
--
2
(E)
5
(E)
--
2. Row
Distance
The distance between rows of piles or caissons measured from the centerline of the current row to the centerline of the previous row. In the case of the first row, the distance is measured to the toe edge of the footing.
ft
*
(E)
15.0 (W)
--
3. Spacing
Within a Row
The typical spacing between piles or caissons within a row measured from centerline to centerline of the piles or caissons.
ft
*
(E)
15.0 (W)
--
4. Percent
Battered
The number of battered piles or caissons within a row expressed as a percentage of the total piles or caissons in the row. If all piles or caissons in the row are completely vertical, enter a zero value.
Note: Typically, the percentage of piles battered in the last row should not exceed 50%.
%
0.0 (E)
100.0
(E)
--
5. Horizontal
Component
The horizontal component of the pile or caisson batter. Used in connection with the vertical component to fully describe the batter for a row of piles or caissons. Different rows may have different batters. This parameter should be left blank for an all vertical row.
--
0.0 (E)
100.0 (W)
--1
6. Vertical
Component
The vertical component of the pile or caisson batter. Used in connection with the horizontal component to fully describe the batter for a row of piles or caissons. Different rows may have different batters. This parameter should be left blank for an all vertical row.
--
0.0 (E)
100.0 (W)
--1
* Lower limit values are computed as per DM-4 10.7.1.2. 1 A blank for the horizontal and vertical batter indicates a vertical pile/caisson.

Chapter 5 Input Description
5-44
5.16 LYA - PILE/CAISSON LAYOUT ANALYSIS COMMAND (Cont.)
Distance
to Row 1
TOE HEEL
Distance
to Row 2
Distance
to Row 3
Spacing
for
Row 1
(typical)
Spacing
for
Row 1
(typical)
Spacing for
Row 2
(typical)
67% of Piles
Battered in
Row 1 50% of Piles
Battered in
Row 2
Spacing
for
Row 3
(typical)
Vertical
Component
Row 1
Horizontal
Component
Row 1
Vertical
Component
Row 2
Horizontal
Component
Row 2
Row 3 is
vertical
Front
Face of
Footing
Front
Face of
Stem Back
Face of
Stem
Note:
A footing may only
have one type and
orientation of piles
or caissons.
Front
Face of
Footing
Para
llel
Direction
Perpendicular
Direction
Front
Face of
Stem
Back
Face of
Stem
Figure 5.16-1 Pile / Caisson Analysis Layout
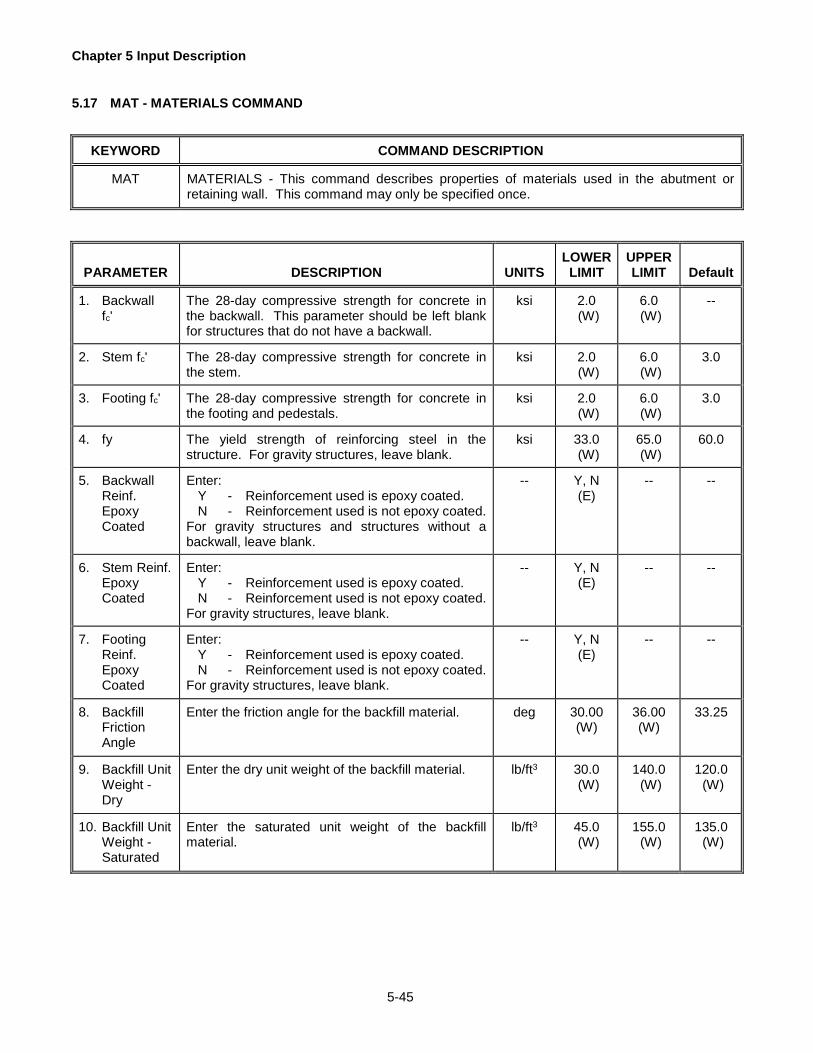
Chapter 5 Input Description
5-45
5.17 MAT - MATERIALS COMMAND
KEYWORD
COMMAND DESCRIPTION
MAT
MATERIALS - This command describes properties of materials used in the abutment or retaining wall. This command may only be specified once.
PARAMETER
DESCRIPTION
UNITS
LOWER LIMIT
UPPER LIMIT
Default
1. Backwall
fc'
The 28-day compressive strength for concrete in the backwall. This parameter should be left blank for structures that do not have a backwall.
ksi
2.0 (W)
6.0 (W)
--
2. Stem fc'
The 28-day compressive strength for concrete in the stem.
ksi
2.0 (W)
6.0 (W)
3.0
3. Footing fc'
The 28-day compressive strength for concrete in the footing and pedestals.
ksi
2.0 (W)
6.0 (W)
3.0
4. fy
The yield strength of reinforcing steel in the structure. For gravity structures, leave blank.
ksi
33.0 (W)
65.0 (W)
60.0
5. Backwall
Reinf. Epoxy Coated
Enter:
Y - Reinforcement used is epoxy coated. N - Reinforcement used is not epoxy coated.
For gravity structures and structures without a backwall, leave blank.
--
Y, N (E)
--
--
6. Stem Reinf.
Epoxy Coated
Enter:
Y - Reinforcement used is epoxy coated. N - Reinforcement used is not epoxy coated.
For gravity structures, leave blank.
--
Y, N (E)
--
--
7. Footing
Reinf. Epoxy Coated
Enter:
Y - Reinforcement used is epoxy coated. N - Reinforcement used is not epoxy coated.
For gravity structures, leave blank.
--
Y, N (E)
--
--
8. Backfill
Friction Angle
Enter the friction angle for the backfill material.
deg
30.00 (W)
36.00 (W)
33.25
9. Backfill Unit
Weight - Dry
Enter the dry unit weight of the backfill material.
lb/ft3
30.0 (W)
140.0 (W)
120.0 (W)
10. Backfill Unit
Weight - Saturated
Enter the saturated unit weight of the backfill material.
lb/ft3
45.0 (W)
155.0 (W)
135.0 (W)

Chapter 5 Input Description
5-46
5.17 MAT - MATERIALS COMMAND (Cont.)
PARAMETER
DESCRIPTION
UNITS
LOWER LIMIT
UPPER LIMIT
Default
11. Minimum
Equivalent Fluid Pressure - Backfill
Enter the minimum equivalent fluid pressure for the backfill.
lb/ft3
30.0 (W)
45.0 (W)
35.0 (W)
12. Concrete Unit
Weight for DL
Enter the concrete unit weight/density for computing the dead load of the abutment.
lb/ft3
100. (W)
180. (W)
150.
13. Concrete Unit
Weight for E
Enter the beam concrete unit weight/density for computing the concrete modulus of elasticity.
lb/ft3
100. (W)
180. (W)
145.
14. Unit Weight of
Architectural Treatment
Enter the unit weight/density for the architectural treatment on the front face of stem.
lb/ft 3
100. (W)
180. (W)
150.
15. fu
The ultimate tensile strength of reinforcing steel in the structure. For gravity structures, leave blank.
ksi
50.0 (W)
100.0 (W)
--1
1 Defaults to 90 ksi when fy is 60ksi; otherwise no default value.

Chapter 5 Input Description
5-47
5.18 SOI - SOIL DATA COMMAND
KEYWORD
COMMAND DESCRIPTION
SOI
SOIL DATA - This command describes properties of soil below the footing. This command may not be used if the RCK command has been specified and is not applicable for pile, caisson, or pedestal footings. Figure 1 illustrates the dimensions described in this command. This command may only be specified once.
PARAMETER
DESCRIPTION
UNITS
LOWER LIMIT
UPPER LIMIT
Default
Soil
Type* 1. Stem Top
to Soil Layer
This dimension is measured from the top of the structure to the top of the first soil layer.
ft
0.0 (E)
300.0 (W)
-- All
2. Footing
Length (Parallel)
The length of the footing is measured in the parallel direction, see Figure 2.1-1.
ft
0.0 (E)
100.0 (W)
-- All
3. Footing
Near Slope
Enter:
Y - Footing is on or near a slope (see Figures 2 and 3)
N - Footing is not on or near a slope.
--
Y, N (E)
--
-- All
4. Soil Level
At Toe
Height of soil above the front face of the toe of the footing. For design, this value is used for all footing toe sizes. This parameter is used to calculate Df when determining the bearing resistance. Note: For footings without a toe, the Soil Level shall be measured from the top of the footing.
ft
0.0 (E)
40.0 (W)
-- All
5. Allowable
Settlement
Allowable total settlement of the structure.
in
0.0 (E)
1.0 (W)
1.0
All
6. Bearing
Capacity Phi Factor
Strength reduction factor applied to bearing capacity.
--
0.35 (W)
0.75 (W)
-- c-φ
Sand
7. Sliding Phi
Factor
Strength reduction factor applied to sliding resistance.
--
0.80 (W)
1.0 (E)
-- c-φ
Sand 8. Number of
Soil Layers
The foundation may consist of one or two layers of soil.
--
1
(E)
2
(E)
-- All
9. Layer 1 Soil
Layer Thickness
The thickness of the soil layer. The first soil layer must be sufficiently thick so that the footing does not punch through the layer i.e. the bottom elevation of the first soil layer must be situated below the bottom footing elevation.
ft
0.0 (E)
300.0 (W)
-- All
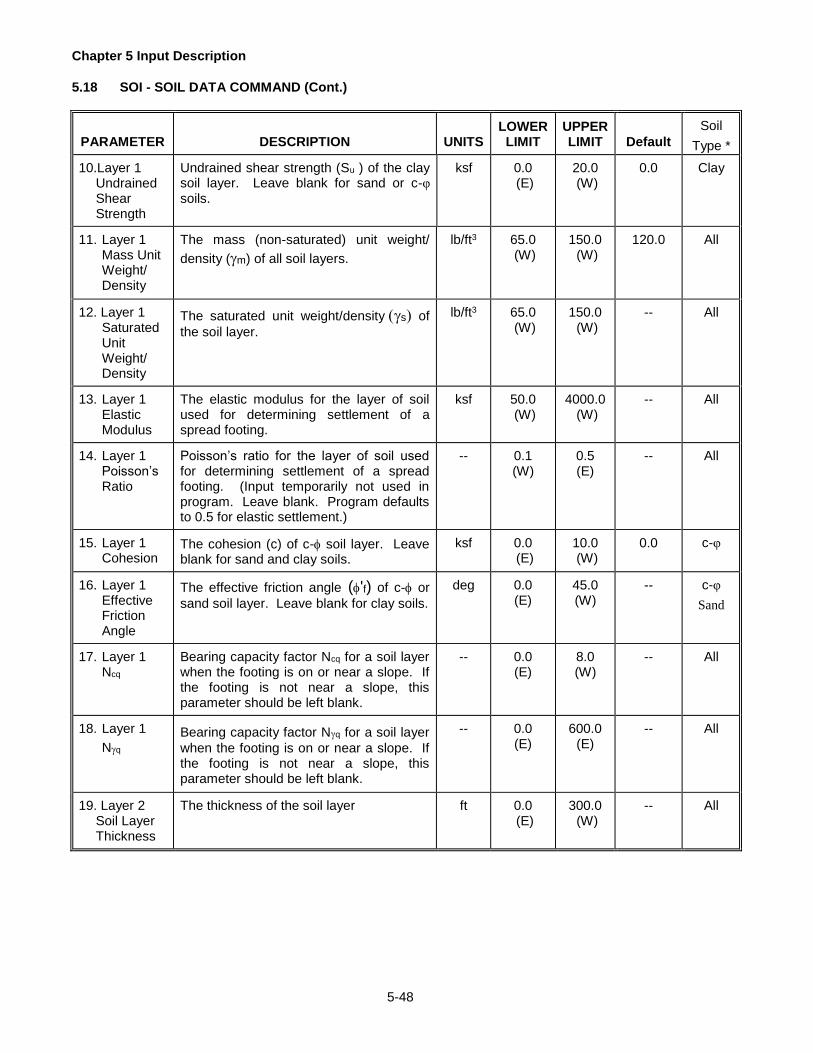
Chapter 5 Input Description
5-48
5.18 SOI - SOIL DATA COMMAND (Cont.)
PARAMETER
DESCRIPTION
UNITS
LOWER LIMIT
UPPER LIMIT
Default
Soil
Type * 10.Layer 1
Undrained Shear Strength
Undrained shear strength (Su ) of the clay soil layer. Leave blank for sand or c-φ soils.
ksf
0.0 (E)
20.0 (W)
0.0
Clay
11. Layer 1
Mass Unit Weight/ Density
The mass (non-saturated) unit weight/
density (m) of all soil layers.
lb/ft3
65.0 (W)
150.0 (W)
120.0
All
12. Layer 1
Saturated Unit Weight/ Density
The saturated unit weight/densitys of
the soil layer.
lb/ft3
65.0 (W)
150.0 (W)
-- All
13. Layer 1
Elastic Modulus
The elastic modulus for the layer of soil used for determining settlement of a spread footing.
ksf
50.0 (W)
4000.0
(W)
-- All
14. Layer 1
Poisson’s Ratio
Poisson’s ratio for the layer of soil used for determining settlement of a spread footing. (Input temporarily not used in program. Leave blank. Program defaults to 0.5 for elastic settlement.)
--
0.1 (W)
0.5 (E)
-- All
15. Layer 1
Cohesion
The cohesion (c) of c- soil layer. Leave blank for sand and clay soils.
ksf
0.0 (E)
10.0 (W)
0.0
c-φ
16. Layer 1
Effective Friction Angle
The effective friction angle ('f) of c- or
sand soil layer. Leave blank for clay soils.
deg
0.0 (E)
45.0 (W)
-- c-φ
Sand
17. Layer 1
Ncq
Bearing capacity factor Ncq for a soil layer when the footing is on or near a slope. If the footing is not near a slope, this parameter should be left blank.
--
0.0 (E)
8.0 (W)
-- All
18. Layer 1
Nq
Bearing capacity factor Nq for a soil layer
when the footing is on or near a slope. If the footing is not near a slope, this parameter should be left blank.
--
0.0 (E)
600.0
(E)
-- All
19. Layer 2
Soil Layer Thickness
The thickness of the soil layer
ft
0.0 (E)
300.0 (W)
-- All

Chapter 5 Input Description
5-49
5.18 SOI - SOIL DATA COMMAND (Cont.)
PARAMETER
DESCRIPTION
UNITS
LOWER LIMIT
UPPER LIMIT
Default
Soil
Type * 20. Layer 2
Undrained Shear Strength
Undrained shear strength (Su ) of the clay soil layer. Leave blank for sand or c-φ soils.
ksf
0.0 (E)
20.0 (W)
0.0
Clay
21. Layer 2
Mass Unit Weight/ Density
The mass (non-saturated) unit weight/
density (m) of all soil layers.
lb/ft3
65.0 (W)
150.0 (W)
120.0
All
22. Layer 2
Saturated Unit Weight/ Density
The saturated unit weight/densitys of
the soil layer.
lb/ft3
65.0 (W)
150.0 (W)
-- All
23. Layer 2
Elastic Modulus
The elastic modulus for the layer of soil used for determining settlement of a spread footing.
ksf
50.0 (W)
4000.0
(W)
-- All
24. Layer 2
Poisson’s Ratio
Poisson’s ratio for the layer of soil used for determining settlement of a spread footing. (Input temporarily not used in program. Leave blank. Program defaults to 0.5 for elastic settlement.)
--
0.1 (W)
0.5 (E)
-- All
25. Layer 2
Cohesion
The cohesion (c) of c- soil layer. Leave blank for sand and clay soils.
ksf
0.0 (E)
10.0 (W)
0.0
c-φ
26. Layer 2
Effective Friction Angle
The effective friction angle ('f) of c- or
sand soil layer. Leave blank for clay soils.
deg
0.0 (E)
45.0 (W)
-- c-φ
Sand
27. Layer 2
Ncq
Bearing capacity factor Ncq for a soil layer when the footing is on or near a slope. If the footing is not near a slope, this parameter should be left blank.
--
0.0 (E)
8.0 (W)
-- All
28. Layer 2
Nq
Bearing capacity factor Nq for a soil
layer when the footing is on or near a slope. If the footing is not near a slope, this parameter should be left blank.
--
0.0 (E)
600.0
(E)
-- All

Chapter 5 Input Description
5-50
5.18 SOI - SOIL DATA COMMAND (Cont.)
PARAMETER
DESCRIPTION
UNITS
LOWER LIMIT
UPPER LIMIT
Default
Soil
Type * 29. Apply
Inclination Factor
Enter whether the inclination factor should be applied when computing the bearing resistance:
Y - Include inclination factors N - Do not include inclination
factors.
--
Y, N (E)
--
Y All
30. Precast or
Cast-in-Place
Indicate if the structure is precast or cast-in-place:
P - Precast Abutment, or Precast Retaining Wall
C - Cast-in-Place Abutment/or Retaining Wall
--
P, C (E)
--
C c-φ
Sand
* The Soil Type column indicates which parameters are required for the three possible soil types; Clay, c-φ, or
Sand. A parameter should be left blank if the soil type does not appear in the column. Refer to Section 6.18 for more details.
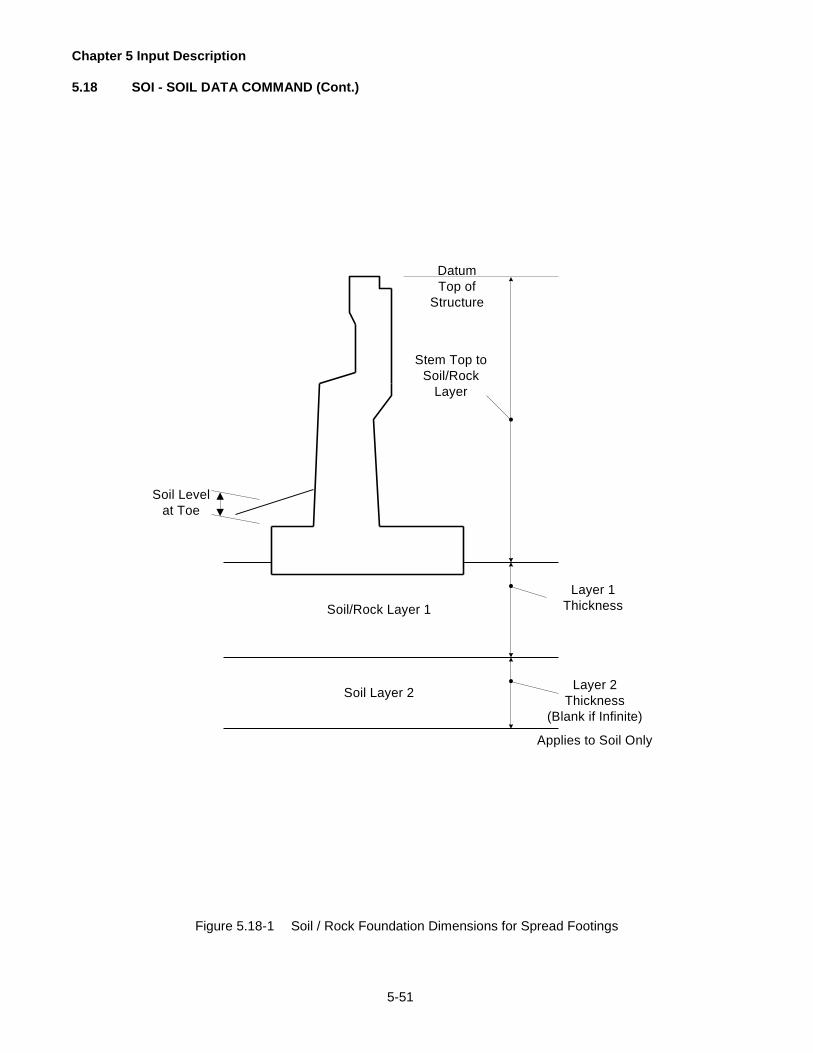
Chapter 5 Input Description
5-51
5.18 SOI - SOIL DATA COMMAND (Cont.)
Top of
Structure
Datum
Stem Top to
Soil/Rock
Layer
Layer 1
ThicknessSoil/Rock Layer 1
Soil Layer 2Layer 2
Thickness
(Blank if Infinite)
Soil Level
at Toe
Applies to Soil Only
Figure 5.18-1 Soil / Rock Foundation Dimensions for Spread Footings

Chapter 5 Input Description
5-52
5.18 SOI - SOIL DATA COMMAND (Cont.)
Footing is considered to be on a slope if the front face of the toe of the footing is
located within the limit of slope, as shown below, for all values of soil level at toe.
Front Face of
the Toe of the
Footing
Limit of Slope
Top of Slope
Base of Slope
Ground Line
(Typical)
Soil Level at Toe
Figure 5.18-2 Footing on a Slope Criteria

Chapter 5 Input Description
5-53
5.18 SOI - SOIL DATA COMMAND (Cont.)
Footing is considered to be near slope if the front face of the toe of the footing is
located within the distance of the limit of slope at the top of slope as shown
below.
Front Face of
the Toe of the
Footing
Limit of Slope
Top of Slope
Base of Slope
Ground Line
(Typical)
Soil Level
at Toe
b=3B B
Footing Width
Figure 5.18-3 Footing Near a Slope

Chapter 5 Input Description
5-54
5.19 RCK - ROCK DATA COMMAND
KEYWORD
COMMAND DESCRIPTION
RCK
ROCK DATA - This command describes properties of rock below the footing. This command may not be used if the SOI command has been specified and is not applicable for pile or caisson footings. This command must be specified for pedestal footing problems. Only one rock layer can be described. Figures 5.18-1 and 2 illustrate the dimensions described in this command. This command may only be specified once.
PARAMETER
DESCRIPTION
UNITS
LOWER LIMIT
UPPER LIMIT
Default
1. Empirical
Bearing Capacity
The ultimate bearing capacity (qult) of the rock based on the empirical method as outlined in the DM-4.
ksf
0.0 (E)
200.0 (W)
--
2. Stem Top to
Rock Layer
The elevation of the rock layer is specified as a distance from the top of the structure. For spread footings, the top of the rock layer must be situated within the elevation of the footing. If the footing is embedded in the rock layer, the EH load will be affected as described in section 3.3.2.4. For pedestal footings, the top of the rock layer must be situated within the elevation of the pedestal (i.e. below the bottom of the footing and above the bottom of the pedestal).
ft
0.0 (E)
300.0 (W)
--
3. Footing
Length (Parallel)
The length of the footing measured in the parallel direction, see Figure 2.1-1.
ft
0.0 (E)
100.0 (W)
--
4. Sliding
Resistance
Sliding resistance on rock:
Y - Perform check. N - Do not perform check.
--
Y, N (E)
--
--
5. Allowable
Settlement
Allowable total settlement of the structure.
in
0.0 (E)
1.0 (W)
1.0
6. Bearing
Capacity Phi Factor
Strength reduction factor applied to bearing capacity.
--
0.35 (W)
0.75 (W)
--
7. Sliding Phi
Factor
Strength reduction factor applied to sliding resistance. Leave blank if sliding resistance is not to be checked.
--
0.80 (W)
1.0 (W)
--

Chapter 5 Input Description
5-55
5.19 RCK - ROCK DATA COMMAND (Cont.)
PARAMETER
DESCRIPTION
UNITS
LOWER LIMIT
UPPER LIMIT
Default
8. RQD
NOTE: This parameter is no longer used and should be left blank.
--
--
--
--
9. Concrete /
Rock Friction
The friction angle between the footing concrete and the layer of rock below it. This value is used when checking the sliding resistance of the foundation on rock.
deg
0.0 (E)
60.0 (W)
--
10. Intact
Elastic Modulus
The intact elastic modulus for the layer of rock used for determining settlement of a spread footing.
ksi
0.1 (E)
16250.0
(W)
--
11. Poisson’s
Ratio
Poisson’s ratio for the layer of rock used for determining settlement of a spread footing.
--
0.1 (W)
0.5 (E)
--
12. Rock Mass
Rating
NOTE: This parameter is no longer used and should be left blank.
--
--
--
--
13. Elastic
Modulus Reduction Factor
NOTE: This parameter is no longer used and should be left blank.
--
--
--
--
14. Rock Mass
Modulus
The rock mass modulus as determined by AASHTO Section 10.4.6.5 used for calculating settlement of a spread footing on rock.
--
0.1 (E)
16250.0
(W)
--
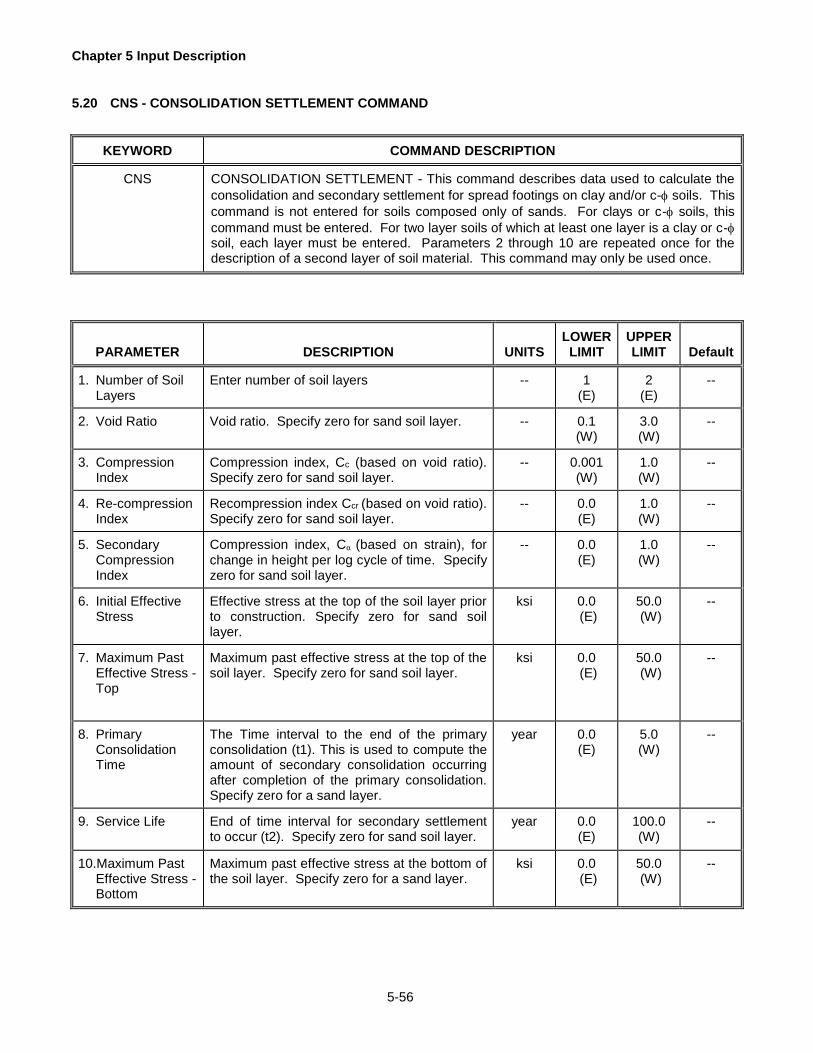
Chapter 5 Input Description
5-56
5.20 CNS - CONSOLIDATION SETTLEMENT COMMAND
KEYWORD
COMMAND DESCRIPTION
CNS
CONSOLIDATION SETTLEMENT - This command describes data used to calculate the
consolidation and secondary settlement for spread footings on clay and/or c- soils. This
command is not entered for soils composed only of sands. For clays or c- soils, this
command must be entered. For two layer soils of which at least one layer is a clay or c- soil, each layer must be entered. Parameters 2 through 10 are repeated once for the description of a second layer of soil material. This command may only be used once.
PARAMETER
DESCRIPTION
UNITS
LOWER LIMIT
UPPER LIMIT
Default
1. Number of Soil
Layers
Enter number of soil layers
--
1
(E)
2
(E)
--
2. Void Ratio
Void ratio. Specify zero for sand soil layer.
--
0.1 (W)
3.0 (W)
--
3. Compression
Index
Compression index, Cc (based on void ratio). Specify zero for sand soil layer.
--
0.001 (W)
1.0 (W)
--
4. Re-compression
Index
Recompression index Ccr (based on void ratio). Specify zero for sand soil layer.
--
0.0 (E)
1.0 (W)
--
5. Secondary
Compression Index
Compression index, Cα (based on strain), for change in height per log cycle of time. Specify zero for sand soil layer.
--
0.0 (E)
1.0 (W)
--
6. Initial Effective
Stress
Effective stress at the top of the soil layer prior to construction. Specify zero for sand soil layer.
ksi
0.0 (E)
50.0 (W)
--
7. Maximum Past
Effective Stress - Top
Maximum past effective stress at the top of the soil layer. Specify zero for sand soil layer.
ksi
0.0 (E)
50.0 (W)
--
8. Primary
Consolidation Time
The Time interval to the end of the primary consolidation (t1). This is used to compute the amount of secondary consolidation occurring after completion of the primary consolidation. Specify zero for a sand layer.
year
0.0 (E)
5.0 (W)
--
9. Service Life
End of time interval for secondary settlement to occur (t2). Specify zero for sand soil layer.
year
0.0 (E)
100.0 (W)
--
10.Maximum Past
Effective Stress - Bottom
Maximum past effective stress at the bottom of the soil layer. Specify zero for a sand layer.
ksi
0.0 (E)
50.0 (W)
--
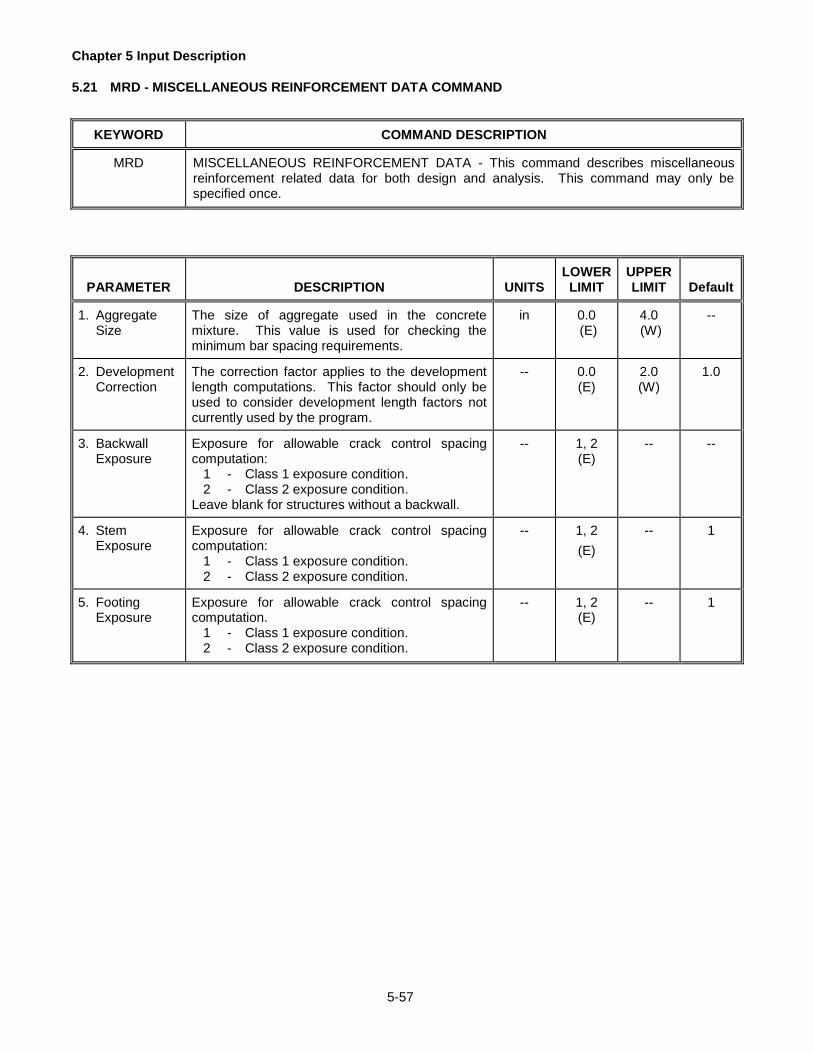
Chapter 5 Input Description
5-57
5.21 MRD - MISCELLANEOUS REINFORCEMENT DATA COMMAND
KEYWORD
COMMAND DESCRIPTION
MRD
MISCELLANEOUS REINFORCEMENT DATA - This command describes miscellaneous reinforcement related data for both design and analysis. This command may only be specified once.
PARAMETER
DESCRIPTION
UNITS
LOWER LIMIT
UPPER LIMIT
Default
1. Aggregate
Size
The size of aggregate used in the concrete mixture. This value is used for checking the minimum bar spacing requirements.
in
0.0 (E)
4.0 (W)
--
2. Development
Correction
The correction factor applies to the development length computations. This factor should only be used to consider development length factors not currently used by the program.
--
0.0 (E)
2.0 (W)
1.0
3. Backwall
Exposure
Exposure for allowable crack control spacing computation:
1 - Class 1 exposure condition. 2 - Class 2 exposure condition.
Leave blank for structures without a backwall.
--
1, 2 (E)
--
--
4. Stem
Exposure
Exposure for allowable crack control spacing computation:
1 - Class 1 exposure condition. 2 - Class 2 exposure condition.
--
1, 2
(E)
--
1
5. Footing
Exposure
Exposure for allowable crack control spacing computation.
1 - Class 1 exposure condition. 2 - Class 2 exposure condition.
--
1, 2 (E)
--
1

Chapter 5 Input Description
5-58
5.22 CVR - REINFORCEMENT COVER COMMAND
KEYWORD
COMMAND DESCRIPTION
CVR
REINFORCEMENT COVER - This command describes the clear concrete cover for reinforcement at various locations in the backwall, stem, and footing. Cover is illustrated in Figure 1. Exposure conditions for the backwall, stem, and footing are also described on MRD. This command may only be specified once.
PARAMETER
DESCRIPTION
UNITS
LOWER LIMIT
UPPER LIMIT
Default
1. Backwall
Cover Back, Ver.
The cover measured from the back face of the backwall to the outside edge of the vertical reinforcement in the backwall. Leave blank for structures without a backwall.
in
2.0 (W)
6.0 (W)
--
2. Stem Cover
Back, Ver.
The cover measured perpendicular from the back face of the stem to the outside edge of the vertical reinforcement in the stem.
in
2.0 (W)
6.0 (W)
3.0
3. Footing
Cover Top, Perpend.
The cover measured from the top of the footing to the outside edge of the perpendicular reinforcement in the footing.
in
2.0 (W)
6.0 (W)
3.0
4. Footing
Cover Top, Parallel
The cover measured from the top of the footing to the outside edge of the parallel reinforcement in the footing.
in
2.0 (W)
6.0 (W)
--1
5. Footing
Cover Bot, Perpend.
The cover measured from the bottom of the footing to the outside edge of the perpendicular reinforcement in the footing.
in
3.0 (W)
6.0 (W)
4.0
6. Footing
Cover Bot, Parallel
The cover measured from the bottom of the footing to the outside edge of the parallel reinforcement in the footing.
in
3.0 (W)
6.0 (W)
--1
7. Toe End
Cover
The cover measured from the toe face of the footing to the end of the perpendicular reinforcement.
in
2.0 (W)
6.0 (W)
2.0
8. Heel End
Cover
The cover measured from the heel face of the footing to the end of the perpendicular reinforcement.
in
2.0 (W)
6.0 (W)
2.0
1 For Analysis runs of Pile/Caisson Foundations, the default cover is the perpendicular reinforcement cover +
the perpendicular reinforcement bar diameter. The perpendicular reinforcement bar diameter is determined from either the bar size entered on the BAR command or the maximum bar diameter entered on the ARE command.
For Design runs of Pile/Caisson Foundations, the default cover is the perpendicular reinforcement cover + the perpendicular reinforcement maximum bar diameter. The perpendicular reinforcement maximum bar diameter is the “Footing Maximum Diameter” parameter from the SPD command.
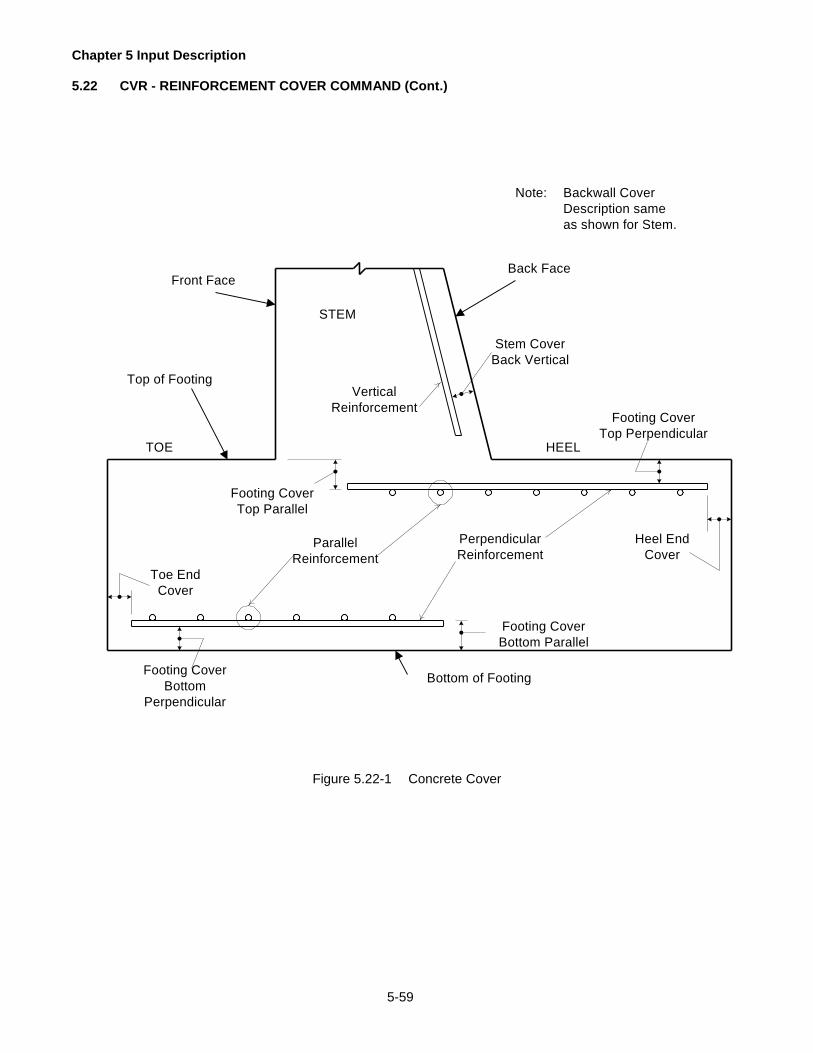
Chapter 5 Input Description
5-59
5.22 CVR - REINFORCEMENT COVER COMMAND (Cont.)
Footing Cover
Bottom Parallel
Footing Cover
Bottom
Perpendicular
Footing Cover
Top Parallel
Footing Cover
Top Perpendicular
Stem Cover
Back Vertical
Parallel
Reinforcement
Perpendicular
Reinforcement
Vertical
Reinforcement
TOE HEEL
Heel End
Cover
Toe End
Cover
Bottom of Footing
STEM
Front Face
Top of Footing
Back Face
Note: Backwall Cover
Description same
as shown for Stem.
Figure 5.22-1 Concrete Cover

Chapter 5 Input Description
5-60
5.23 SPD - REINFORCEMENT DESIGN COMMAND
KEYWORD
COMMAND DESCRIPTION
SPD
DESIGN REINFORCEMENT - This command identifies the maximum bar diameter for the reinforcement in the backwall, stem and footing. These values are used for the purposes of computing the effective section depth. Footing reinforcement locations are illustrated in Figure 5.22-1. Backwall vertical reinforcement is situated like the stem back vertical reinforcement shown in Figure 5.22-1.
PARAMETER
DESCRIPTION
UNITS
LOWER LIMIT
UPPER LIMIT
Default
1. Backwall
Maximum Diameter
The maximum diameter of the bar in the backwall used to compute the effective section depth. Leave blank if structure does not have a backwall.
in
0.0 (E)
1.41 (E)
-
2. Stem
Maximum Diameter
The maximum diameter of the bar in the stem used to compute the effective section depth.
in
0.0 (E)
1.41 (E)
-
3. Footing
Maximum Diameter
The maximum diameter of the bar in the footing used to compute the effective section depth.
in
0.0 (E)
1.41 (E)
-
4. Hooked
Perpendicular Footing Bar
Consider hooked bars for perpendicular footing reinforcement development during design runs. (Only enter for Spread & Pile\Caisson footings)
Y - Consider hooked bars
N - Do not consider hooked bars.
--
Y,N (E)
--
N
5. User
Requested Minimum Bar Spacing
The minimum bar spacing the program will consider during a design run.
in
**
(E)
12.0 (W)
6.0
6. Bar Spacing
Increment
The value of the increment that the program will round bar spacings to during design runs.
in
0.5 (E)
6.0 (W)
3.0
** The lower limit is calculated based on the greater of the following: 1.5 * aggregate size (MRD card, Parameter 1) 1.5 * the maximum rebar diameter 2.5"

Chapter 5 Input Description
5-61
5.24 BAR - BAR SIZE COMMAND
KEYWORD
COMMAND DESCRIPTION
BAR
BAR SIZE - This command describes reinforcing bar sizes at various locations in the backwall and footing for an analysis problem. Reinforcement can be specified by using the BAR and SPA commands together, or by using the ARE command. This command may only be specified once. Footing reinforcement locations are illustrated in Figure 5.22-1. Backwall back face vertical reinforcement is situated similar to the stem back vertical reinforcement shown in Figure 5.22-1.
PARAMETER
DESCRIPTION
UNITS
LOWER LIMIT
UPPER LIMIT
Default
1. Backwall
Back Vertical
The size of a single vertical reinforcing bar in the back face at the backwall level. Leave blank for structures without a backwall.
US bar
4
(E)
18 (E)
--
2. Footing Top,
Perpend.
The size of a single reinforcing bar in the top of the footing running in the perpendicular direction. Leave blank for pedestal footings.
US bar
4
(E)
18 (E)
--
3. Footing Top,
Parallel
The size of a single reinforcing bar in the top of the footing running in the parallel direction. Leave blank for spread footings.
US bar
4
(E)
18 (E)
--
4. Footing
Bottom, Perpend.
The size of a single reinforcing bar in the bottom of the footing running in the perpendicular direction. Leave blank for pedestal footings.
US bar
4
(E)
18 (E)
--
5. Footing
Bottom, Parallel
The size of a single reinforcing bar in the bottom of the footing running in the parallel direction. Leave blank for spread footings.
US bar
4
(E)
18 (E)
--
6. Footing Top,
Perpend. Bar Type
The bar type (Straight or Hooked) of the reinforcing bar in the top of the footing running in the perpendicular direction. Leave blank for pedestal footings.
--
H,S (E)
--
--*
7. Footing
Bottom, Perpend. Bar Type
The bar type (Straight or Hooked) of the reinforcing bar in the bottom of the footing running in the perpendicular direction. Leave blank for pedestal footings.
--
H,S (E)
--
--*
* For non-pedestal footings, the program will default to Straight Bars if input value is left blank

Chapter 5 Input Description
5-62
5.25 SPA - BAR SPACING FOR ANALYSIS COMMAND
KEYWORD
COMMAND DESCRIPTION
SPA
BAR SPACING FOR ANALYSIS - This command describes the reinforcement bar spacings at various locations in the backwall and footing for an analysis problem. Reinforcement can be specified by using the SPA and BAR commands together, or by using the ARE command. This command may only be specified once. Figure 1 illustrates the spacing values to be specified.
PARAMETER
DESCRIPTION
UNITS
LOWER LIMIT
UPPER LIMIT
Default
1. Backwall
Back Vertical
The spacing between vertical reinforcing bars in the back face of the backwall. Leave blank for structures without a backwall.
in
3.0 (W)
24.0 (W)
--
2. Footing Top,
Perpend.
The spacing between reinforcing bars in the top of the footing that are running in the perpendicular direction. Leave blank for pedestal footings.
in
3.0 (W)
24.0 (W)
--
3. Footing Top,
Parallel
The spacing between reinforcing bars in the top of the footing that are running in the parallel direction. Leave blank for spread footings.
in
3.0 (W)
24.0 (W)
--
4. Footing
Bottom Perpend.
The spacing between reinforcing bars in the bottom of the footing that are running in the perpendicular direction. Leave blank for pedestal footings.
in
3.0 (W)
24.0 (W)
--
5. Footing
Bottom, Parallel
The spacing between reinforcing bars in the bottom of the footing that are running in the parallel direction. Leave blank for spread footings.
in
3.0 (W)
24.0 (W)
--

Chapter 5 Input Description
5-63
5.25 SPA - BAR SPACING FOR ANALYSIS COMMAND (Cont.)
FOOTING
STEM
BACKWALL
Perpendicular Direction
Backwall Rebar Spacing
A
A
BB
spacing of parallel
footing rebar
Parallel Direction
Perpendicular
Direction
spacing of perpendicular
footing rebar
Section B-B
STEM
Section A-A
Figure 5.25-1 Rebar Spacing for SPA Command

Chapter 5 Input Description
5-64
5.26 ARE - REINFORCEMENT AREA COMMAND
KEYWORD
COMMAND DESCRIPTION
ARE
REINFORCEMENT AREA - This command describes reinforcement areas per unit width at various locations in the backwall and footing for an analysis problem. Reinforcement can be specified by using the ARE command or by using the BAR and SPA commands together. This command may only be specified once. Footing reinforcement locations are illustrated in Figure 5.22-1. Backwall vertical reinforcement is situated like the stem back vertical reinforcement shown in Figure 5.22-1.
PARAMETER
DESCRIPTION
UNITS
LOWER LIMIT
UPPER LIMIT
Default
1. Backwall
Back Vertical
The area per width of vertical reinforcing bars in the back face of the backwall. Leave blank for structures without a backwall.
in2/ft
0.0 (E)
4.0 (W)
--
2. Footing
Top, Perpend.
The area per width of reinforcing bars in the top of the footing running in the perpendicular direction. Leave blank for pedestal footings.
in2/ft
0.0 (E)
4.0 (W)
--
3. Footing
Top, Parallel
The area per width of reinforcing bars in the top of the footing running in the parallel direction. Leave blank for spread footings.
in2/ft
0.0 (E)
4.0 (W)
--
4. Footing
Bottom, Perpend.
The area per width of reinforcing bars in the bottom of the footing running in the perpendicular direction. Leave blank for pedestal footings.
in2/ft
0.0 (E)
4.0 (W)
--
5. Footing
Bottom, Parallel
The area per width of reinforcing bars in the bottom of the footing running in the parallel direction. Leave blank for spread footings.
in2/ft
0.0 (E)
4.0 (W)
--
6. Backwall
Maximum Diameter
The maximum diameter in the backwall used to compute the effective section depth.
in
0.0 (E)
2.257 (E)
--
7. Footing Top
Perpend. Maximum Diameter
The maximum diameter of the footing reinforcement -- top face / perpendicular direction -- used to compute the effective section depth and serviceability checks. Leave blank for pedestal footings.
in
0.0 (E)
2.257 (E)
--

Chapter 5 Input Description
5-65
5.26 ARE - REINFORCEMENT AREA COMMAND (Cont.)
PARAMETER
DESCRIPTION
UNITS
LOWER LIMIT
UPPER LIMIT
Default
8. Footing
Top Parallel Maximum Diameter
The maximum diameter of the footing reinforcement -- top face / parallel direction -- used to compute the effective section depth and serviceability checks. Leave blank for spread footings.
in
0.0 (E)
2.257 (E)
--
9. Footing
Bottom Perpend. Maximum Diameter
The maximum diameter of the footing reinforcement -- bottom face / perpendicular direction -- used to compute the effective section depth and serviceability checks. Leave blank for pedestal footings.
in
0.0 (E)
2.257 (E)
--
10. Footing
Bottom Parallel Maximum Diameter
The maximum diameter of the footing reinforcement -- bottom face / parallel direction -- that is used to compute the effective section depth and serviceability checks. Leave blank for spread footings.
in
0.0 (E)
2.257 (E)
--
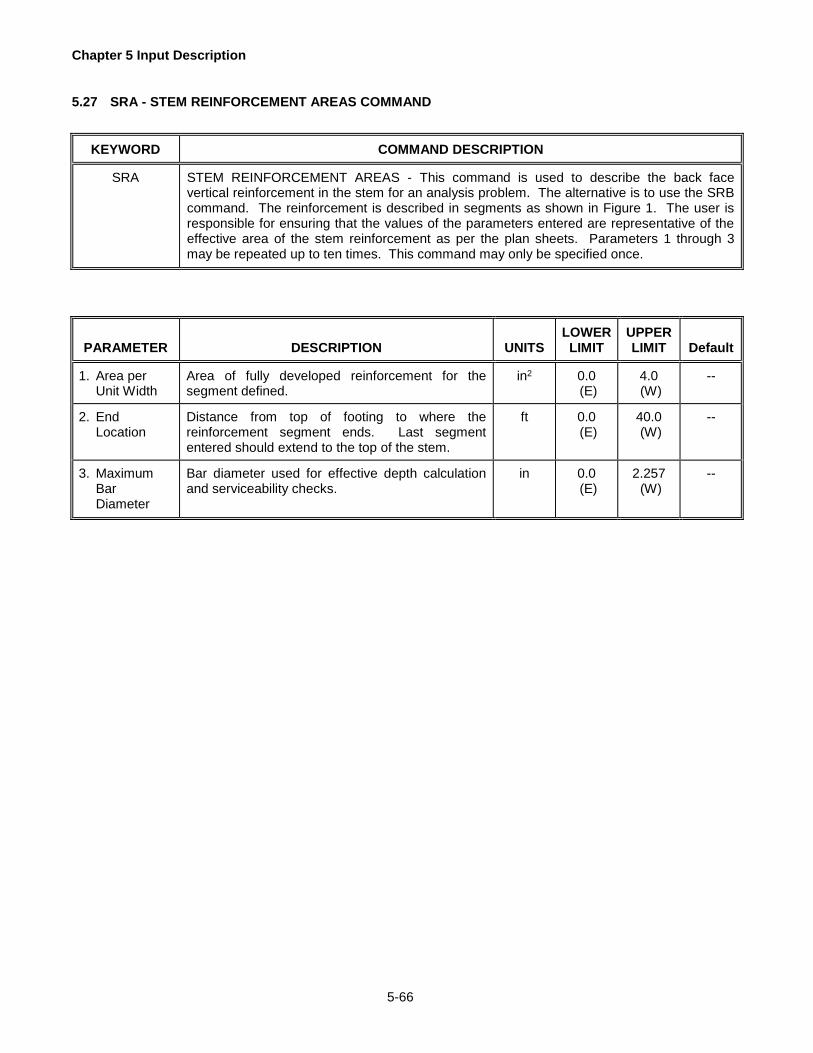
Chapter 5 Input Description
5-66
5.27 SRA - STEM REINFORCEMENT AREAS COMMAND
KEYWORD
COMMAND DESCRIPTION
SRA
STEM REINFORCEMENT AREAS - This command is used to describe the back face vertical reinforcement in the stem for an analysis problem. The alternative is to use the SRB command. The reinforcement is described in segments as shown in Figure 1. The user is responsible for ensuring that the values of the parameters entered are representative of the effective area of the stem reinforcement as per the plan sheets. Parameters 1 through 3 may be repeated up to ten times. This command may only be specified once.
PARAMETER
DESCRIPTION
UNITS
LOWER LIMIT
UPPER LIMIT
Default
1. Area per
Unit Width
Area of fully developed reinforcement for the segment defined.
in2
0.0 (E)
4.0 (W)
--
2. End
Location
Distance from top of footing to where the reinforcement segment ends. Last segment entered should extend to the top of the stem.
ft
0.0 (E)
40.0 (W)
--
3. Maximum
Bar Diameter
Bar diameter used for effective depth calculation and serviceability checks.
in
0.0 (E)
2.257 (W)
--
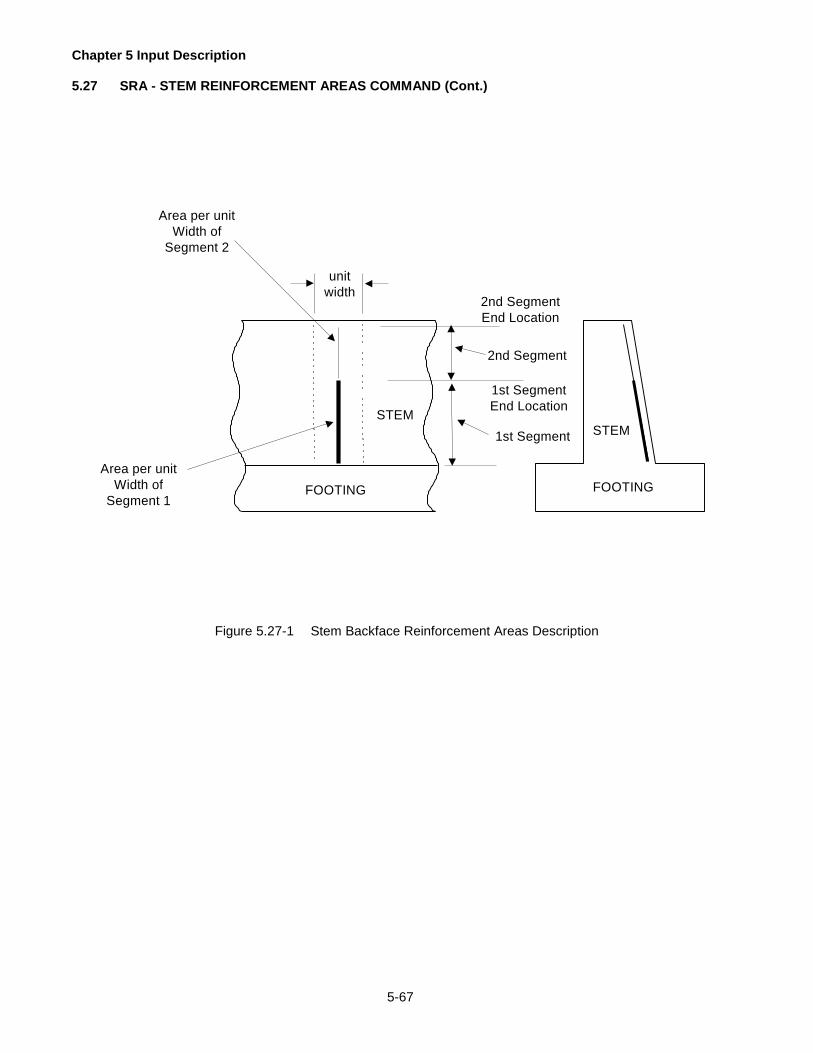
Chapter 5 Input Description
5-67
5.27 SRA - STEM REINFORCEMENT AREAS COMMAND (Cont.)
STEM
FOOTING FOOTING
STEM
unit
width
Area per unit
Width of
Segment 1
Area per unit
Width of
Segment 2
2nd Segment
End Location
2nd Segment
1st Segment
End Location
1st Segment
Figure 5.27-1 Stem Backface Reinforcement Areas Description

Chapter 5 Input Description
5-68
5.28 SRB - STEM REINFORCEMENT BARS COMMAND
KEYWORD
COMMAND DESCRIPTION
SRB
STEM REINFORCEMENT BARS - This command is used to describe the back face vertical reinforcement in terms of bar sizes and spacings in the stem for an analysis problem. Alternatively, the SRA command may be used. The effective reinforcement is identified by the bar size, spacing, and end location relative to the base of the stem, as shown in Figure 1. The program does not adjust the input data to account for the development length or extension length; thus, the end location of the bar entered is assumed to be the end location of the fully effective bar. Parameters 1 through 4 may be repeated up to ten times. This command may only be specified once.
PARAMETER
DESCRIPTION
UNITS
LOWER LIMIT
UPPER LIMIT
Default
1. Bar Size
The Bar size designation.
US Bar
4
(E)
18
(W)
--
2. Bar Spacing
The spacing of the bar.
in
3. (E)
24. (W)
--
3. Group Offset
Offset (horizontal distance of the bar group) relative to the location of the first bar defined. Leave blank for the first occurrence of this parameter.
in
0. (E)
24. (W)
--
4. End Location
Location where the effective and fully developed rebar terminates relative to the base of the stem. Bars, which extend to the top of the stem, should be entered with no reduction in length.
ft
0.0 (E)
40.0 (W)
--
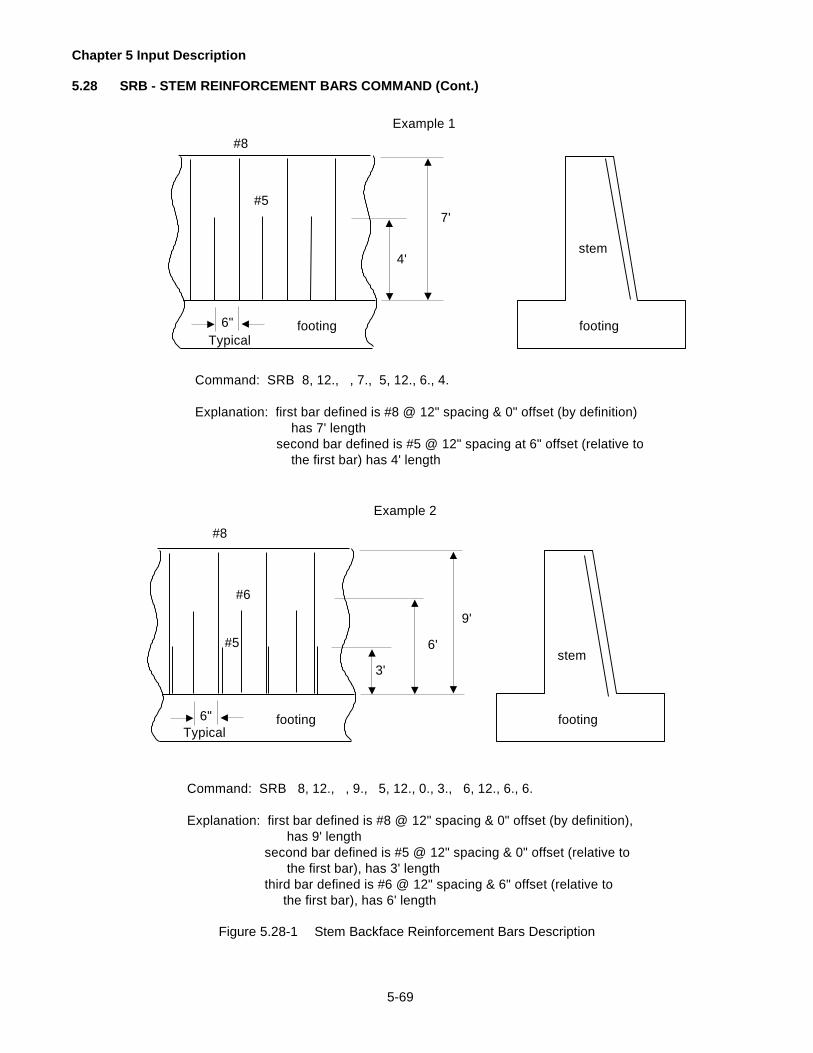
Chapter 5 Input Description
5-69
5.28 SRB - STEM REINFORCEMENT BARS COMMAND (Cont.)
Command: SRB 8, 12., , 7., 5, 12., 6., 4.
Explanation: first bar defined is #8 @ 12" spacing & 0" offset (by definition)
has 7' length
second bar defined is #5 @ 12" spacing at 6" offset (relative to
the first bar) has 4' length
footing6"
stem
footing
4'
7'
#8
#5
Command: SRB 8, 12., , 9., 5, 12., 0., 3., 6, 12., 6., 6.
Explanation: first bar defined is #8 @ 12" spacing & 0" offset (by definition),
has 9' length
second bar defined is #5 @ 12" spacing & 0" offset (relative to
the first bar), has 3' length
third bar defined is #6 @ 12" spacing & 6" offset (relative to
the first bar), has 6' length
footing6"
stem
footing
6'
9'
#8
#5
#6
3'
Example 1
Example 2
Typical
Typical
Figure 5.28-1 Stem Backface Reinforcement Bars Description

Chapter 5 Input Description
5-70
5.29 LDC - LOAD CONTROL COMMAND
KEYWORD
COMMAND DESCRIPTION
LDC
LOAD CONTROL - This command describes force effect factors and surcharges which are common to all structure types. Construction stages are illustrated in Figure 1. This command may only be specified once.
In order to implement BD-628-M, Sheet 2, Note 14 two separate runs of ABLRFD are required. One run with the ASL command entered and Final Stage Surcharge Loads entered as zero. And, the second run with no ASL command and the Final Stage Surcharge Loads entered.
PARAMETER
DESCRIPTION
UNITS
LOWER LIMIT
UPPER LIMIT
Default
1. Ductility
Factor
The factor relating to ductility (D).1
Using a value other than 1.0 requires Chief Bridge Engineer approval. See Section 3.3.5.
--
0.95 (E)
1.05 (E)
1.00
2. Redundancy
Factor
The factor relating to redundancy (R).1
Using a value other than 1.0 requires Chief Bridge Engineer approval. See Section 3.3.5.
--
0.95 (E)
1.05 (E)
1.00
3. Importance
Factor
The factor relating to operational importance (I).1
Using a value other than 1.0 requires Chief Bridge Engineer approval. See Section 3.3.5.
--
1.0 (E)
2.0 (E)
1.00
4. Temp. LS
The live load surcharge applied to the temporary construction stage expressed as height of fill.
ft
0.0 (E)
5.5 (W)
--
5. Final LS
The live load surcharge applied to the final construction stage expressed as height of fill. Enter zero if approach slab loads are entered on the ASL command.
ft
0.0 (E)
5.5 (W)
--
6. Temp. ES
The earth surcharge applied to the temporary construction stage expressed as height of fill.
ft
0.0 (E)
15.5
(W)
--
7. Final ES
The earth surcharge applied to the final construction stage expressed as height of fill. Enter zero if approach slab loads are entered on the ASL command.
ft
0.0 (E)
5.5 (W)
--
1 Product of ductility, redundancy and importance factors should not be less than 1.0 nor greater than 1.16.

Chapter 5 Input Description
5-71
5.29 LDC - LOAD CONTROL COMMAND (Cont.)
Temporary
Temporary
Final
Final
(a) Abutment Type I
(b) Abutment Type II
Figure 5.29-1 Construction Stages

Chapter 5 Input Description
5-72
5.29 LDC - LOAD CONTROL COMMAND (Cont.)
Temporary
Temporary
Final
Final
(c) Retaining Wall
(d) Abutment without Backwall
Figure 5.29-1 Construction Stages (cont.)
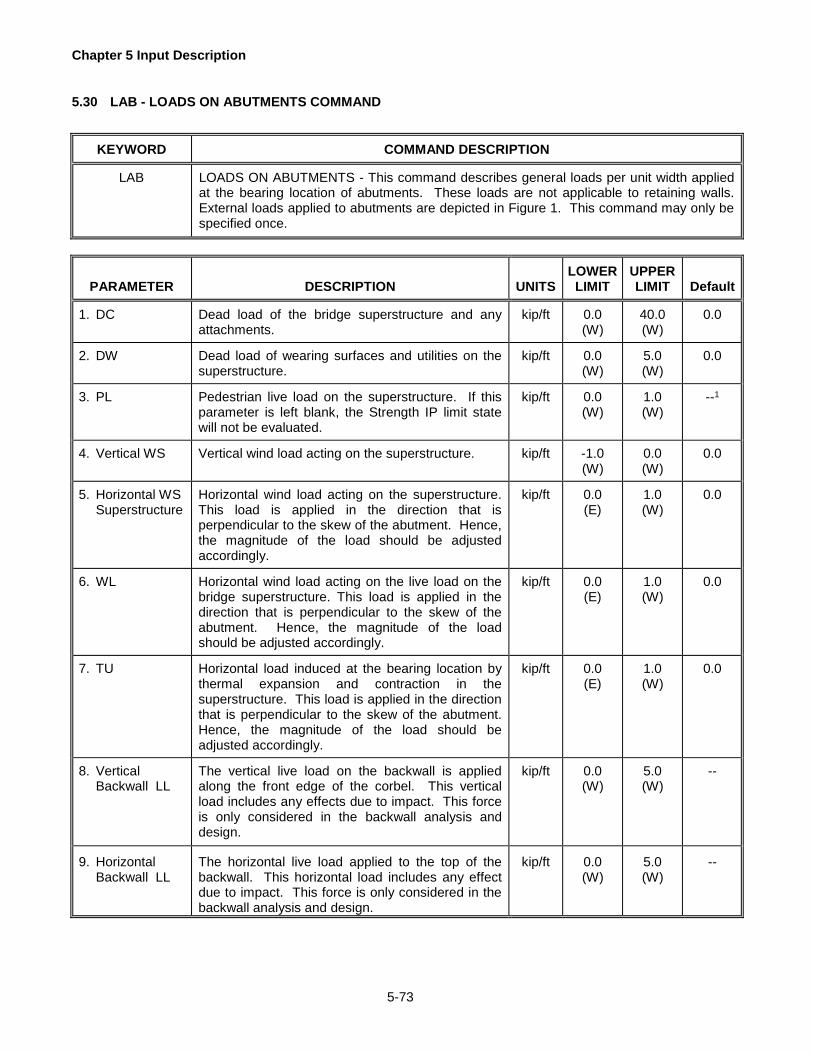
Chapter 5 Input Description
5-73
5.30 LAB - LOADS ON ABUTMENTS COMMAND
KEYWORD
COMMAND DESCRIPTION
LAB
LOADS ON ABUTMENTS - This command describes general loads per unit width applied at the bearing location of abutments. These loads are not applicable to retaining walls. External loads applied to abutments are depicted in Figure 1. This command may only be specified once.
PARAMETER
DESCRIPTION
UNITS
LOWER LIMIT
UPPER LIMIT
Default
1. DC
Dead load of the bridge superstructure and any attachments.
kip/ft
0.0 (W)
40.0 (W)
0.0
2. DW
Dead load of wearing surfaces and utilities on the superstructure.
kip/ft
0.0 (W)
5.0 (W)
0.0
3. PL
Pedestrian live load on the superstructure. If this parameter is left blank, the Strength IP limit state will not be evaluated.
kip/ft
0.0 (W)
1.0 (W)
--1
4. Vertical WS
Vertical wind load acting on the superstructure.
kip/ft
-1.0 (W)
0.0 (W)
0.0
5. Horizontal WS
Superstructure
Horizontal wind load acting on the superstructure. This load is applied in the direction that is perpendicular to the skew of the abutment. Hence, the magnitude of the load should be adjusted accordingly.
kip/ft
0.0 (E)
1.0 (W)
0.0
6. WL
Horizontal wind load acting on the live load on the bridge superstructure. This load is applied in the direction that is perpendicular to the skew of the abutment. Hence, the magnitude of the load should be adjusted accordingly.
kip/ft
0.0 (E)
1.0 (W)
0.0
7. TU
Horizontal load induced at the bearing location by thermal expansion and contraction in the superstructure. This load is applied in the direction that is perpendicular to the skew of the abutment. Hence, the magnitude of the load should be adjusted accordingly.
kip/ft
0.0 (E)
1.0 (W)
0.0
8. Vertical
Backwall LL
The vertical live load on the backwall is applied along the front edge of the corbel. This vertical load includes any effects due to impact. This force is only considered in the backwall analysis and design.
kip/ft
0.0 (W)
5.0 (W)
--
9. Horizontal
Backwall LL
The horizontal live load applied to the top of the backwall. This horizontal load includes any effect due to impact. This force is only considered in the backwall analysis and design.
kip/ft
0.0 (W)
5.0 (W)
--
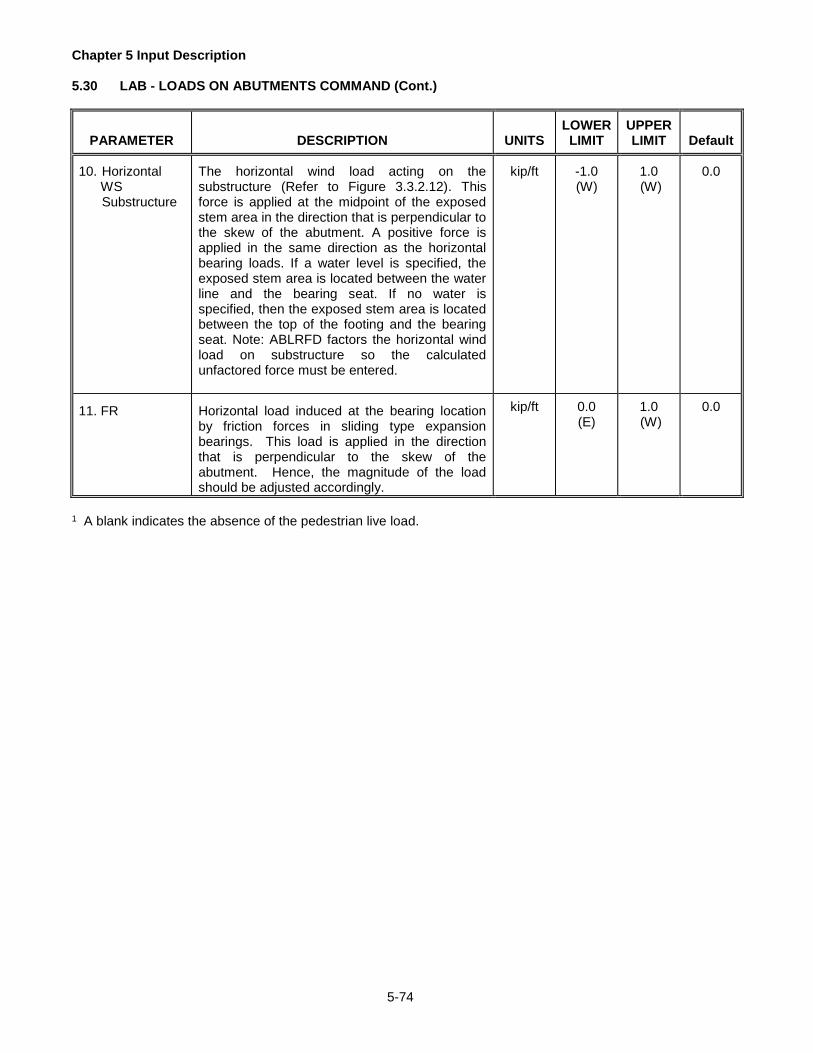
Chapter 5 Input Description
5-74
5.30 LAB - LOADS ON ABUTMENTS COMMAND (Cont.)
PARAMETER
DESCRIPTION
UNITS
LOWER LIMIT
UPPER LIMIT
Default
10. Horizontal WS
Substructure
The horizontal wind load acting on the substructure (Refer to Figure 3.3.2.12). This force is applied at the midpoint of the exposed stem area in the direction that is perpendicular to the skew of the abutment. A positive force is applied in the same direction as the horizontal bearing loads. If a water level is specified, the exposed stem area is located between the water line and the bearing seat. If no water is specified, then the exposed stem area is located between the top of the footing and the bearing seat. Note: ABLRFD factors the horizontal wind load on substructure so the calculated unfactored force must be entered.
kip/ft
-1.0 (W)
1.0 (W)
0.0
11. FR
Horizontal load induced at the bearing location by friction forces in sliding type expansion bearings. This load is applied in the direction that is perpendicular to the skew of the abutment. Hence, the magnitude of the load should be adjusted accordingly.
kip/ft
0.0 (E)
1.0 (W)
0.0
1 A blank indicates the absence of the pedestrian live load.

Chapter 5 Input Description
5-75
Backwall Vertical Live Load
Vertical Loads
DC
DW
PL
WSUP1
LL1Horizontal Loads
WSUP
WL
TU
FR
BR
CE
EQ
Note: Positive directions are shown1
Front Face
of StemBearing
Centerline
Bearing Location X
Bearing Location Y
STEM
BACKWALL
1Exceptions for LL and WSUP loads
2 WSUB load is applied at center of wind area on exposed stem
Backwall Horizontal
Live Load
WSUB2
(+) (-)
Figure 5.30-1 Loads on Abutments

Chapter 5 Input Description
5-76
5.31 ASL – APPROACH SLAB LOAD COMMAND
KEYWORD
COMMAND DESCRIPTION
ASL APPROACH SLAB LOAD - This command describes approach slab load magnitudes, locations, and application for approach slab Types 1, 2, 3 & 4 shown in Standard Drawings BD 628M. This command implements BD-628M, Sheet 2, Note 14 where the approach slab is modeled as a simple span beam between the abutment and the sleeper slab. In order to implement Note 14 two separate runs of ABLRFD are required. One run with the ASL command entered and Final Stage Surcharge Loads on the LDC command entered as zero. And, the second run with no ASL command and the Final Stage Surcharge Loads entered on the LDC command. The approach slab loads should be entered per unit width of the abutment. This command may only be specified once.
PARAMETER
DESCRIPTION
UNITS
LOWER
LIMIT
UPPER
LIMIT
Default
1. Approach Slab DC
The dead load reaction due to the approach slab and barriers (if present) on an abutment. Refer to BD-628M, Sheet 2, Note 14. This applies to approach slab Types 1, 2, 3 & 4. Note: If the approach slab DC load is entered for this parameter then it should not be included in parameter 1 of the LAB command.
kip/ft
0.0
(E)
5.0
(W)
--
2. Approach Slab LL
The live load reaction due to the approach slab on an abutment. Refer to BD-628M, Sheet 2, Note 14. This applies to approach slab Types 1, 2, 3 & 4. Note: If the approach slab LL load is entered for this parameter then it should not be included in parameter 1 of the DLL command.
kip/ft
0.0
(E)
1.0
(W)
--
3. X Distance to Approach Slab
The X distance to the approach slab DC and LL loads measured from the top front edge of the bearing seat on an abutment Leave this parameter blank when Approach Slab on Beam Notch parameter is set to “Y”
in
0.0
(E)
132.0
(W)
--
4. Approach Slab on Beam Notch
Enter:
Y – Approach slab load is applied through the beam notch as depicted in Figures 2 and 4
N – Approach slab load is not applied through the beam notch as depicted in Figures 1 and 3. If this parameter is answered 'Y' then the 'Vertical Backwall LL' parameter on the LAB command should be left blank.
--
Y,N
(E)
--
--
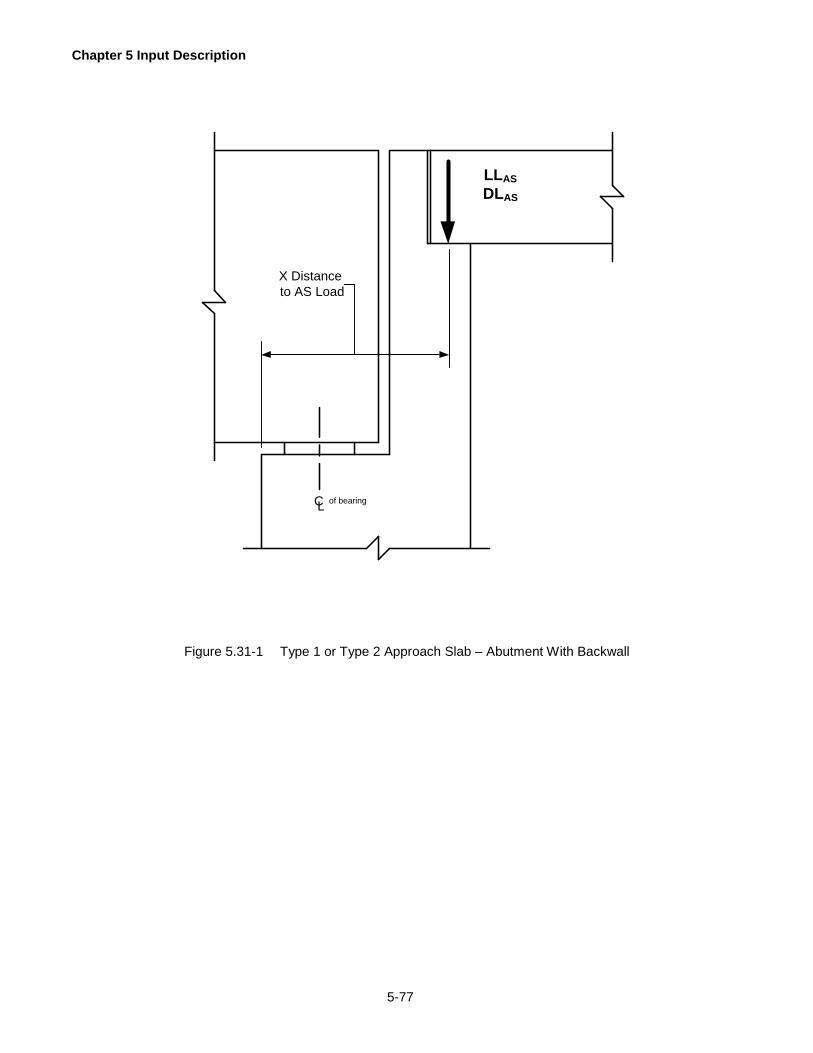
Chapter 5 Input Description
5-77
LLAS
DLAS
X Distance
to AS Load
CLof bearing
Figure 5.31-1 Type 1 or Type 2 Approach Slab – Abutment With Backwall
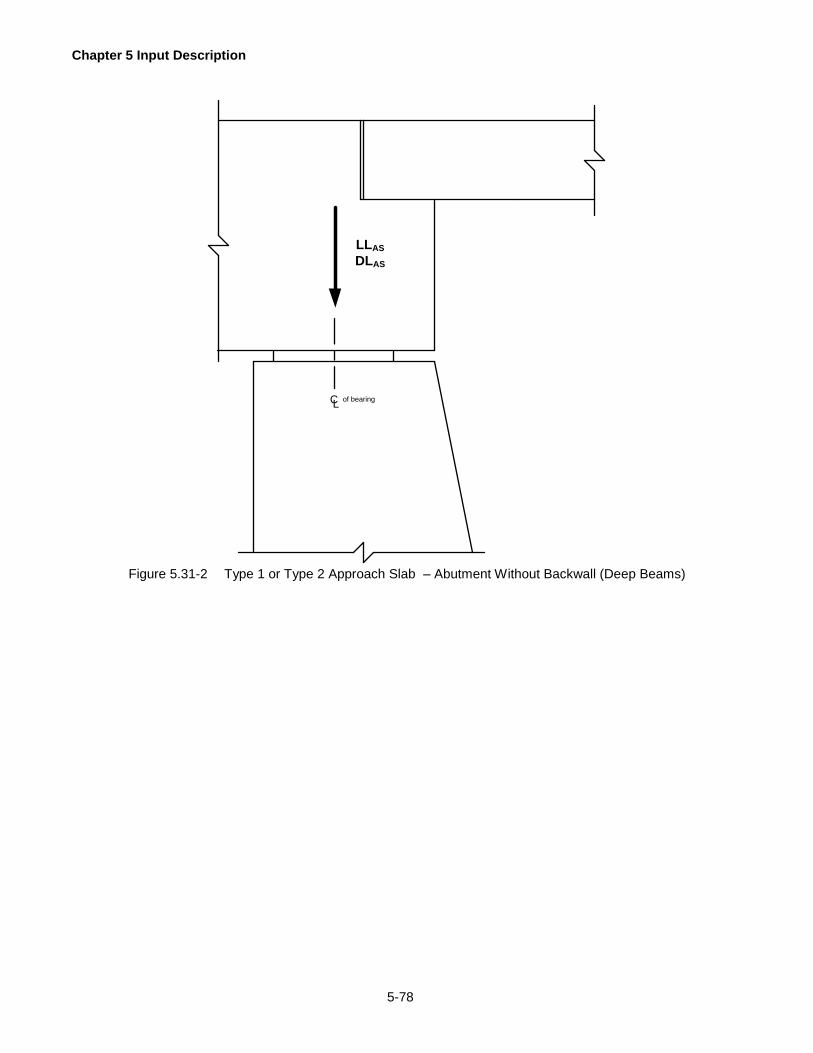
Chapter 5 Input Description
5-78
LLAS
DLAS
CLof bearing
Figure 5.31-2 Type 1 or Type 2 Approach Slab – Abutment Without Backwall (Deep Beams)

Chapter 5 Input Description
5-79
LLAS
DLAS
X Distance to AS Load
CLof bearing
Figure 5.31-3 Type 1 or Type 2 Approach Slab – Abutment Without Backwall (Shallow Beams With Abutment Corbel)

Chapter 5 Input Description
5-80
LLAS
DLAS
CLof bearing
Figure 5.31-4 Type 3 and 4 Approach Slab – Abutment With Backwall (Approach Slab Connected to Superstructure)
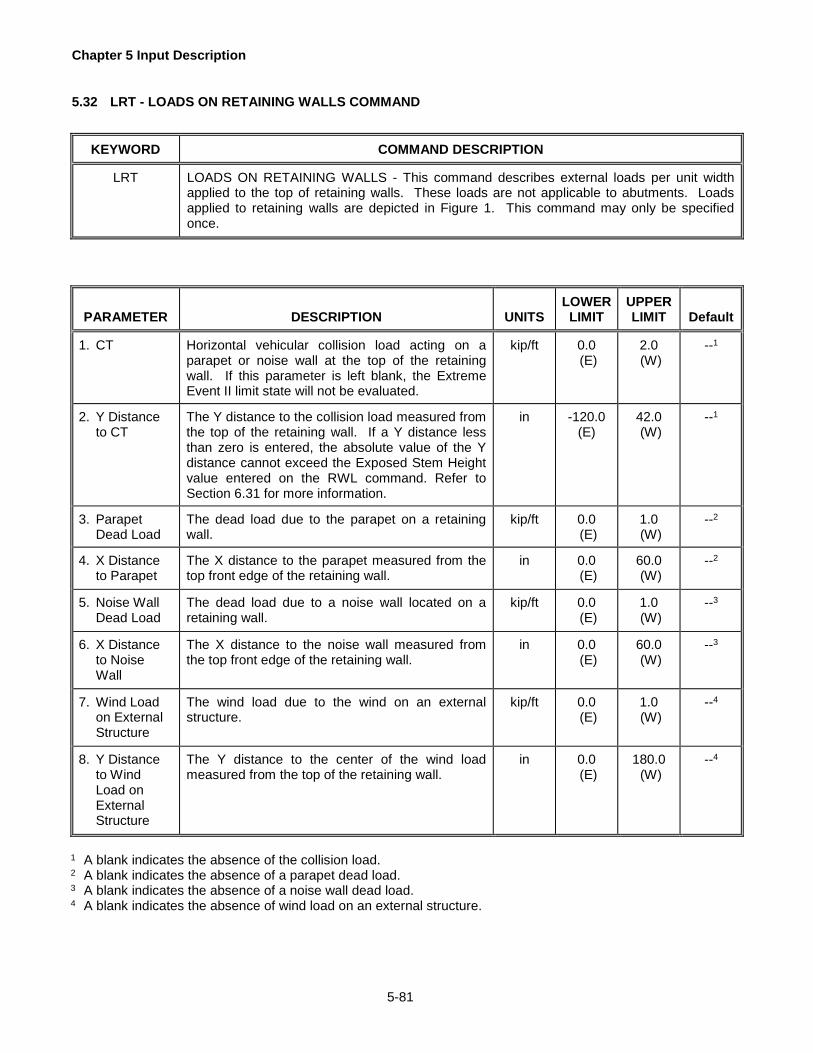
Chapter 5 Input Description
5-81
5.32 LRT - LOADS ON RETAINING WALLS COMMAND
KEYWORD
COMMAND DESCRIPTION
LRT
LOADS ON RETAINING WALLS - This command describes external loads per unit width applied to the top of retaining walls. These loads are not applicable to abutments. Loads applied to retaining walls are depicted in Figure 1. This command may only be specified once.
PARAMETER
DESCRIPTION
UNITS
LOWER LIMIT
UPPER LIMIT
Default
1. CT
Horizontal vehicular collision load acting on a parapet or noise wall at the top of the retaining wall. If this parameter is left blank, the Extreme Event II limit state will not be evaluated.
kip/ft
0.0 (E)
2.0 (W)
--1
2. Y Distance
to CT
The Y distance to the collision load measured from the top of the retaining wall. If a Y distance less than zero is entered, the absolute value of the Y distance cannot exceed the Exposed Stem Height value entered on the RWL command. Refer to Section 6.31 for more information.
in
-120.0
(E)
42.0 (W)
--1
3. Parapet
Dead Load
The dead load due to the parapet on a retaining wall.
kip/ft
0.0 (E)
1.0 (W)
--2
4. X Distance
to Parapet
The X distance to the parapet measured from the top front edge of the retaining wall.
in
0.0 (E)
60.0 (W)
--2
5. Noise Wall
Dead Load
The dead load due to a noise wall located on a retaining wall.
kip/ft
0.0 (E)
1.0 (W)
--3
6. X Distance
to Noise Wall
The X distance to the noise wall measured from the top front edge of the retaining wall.
in
0.0 (E)
60.0 (W)
--3
7. Wind Load
on External Structure
The wind load due to the wind on an external structure.
kip/ft
0.0 (E)
1.0 (W)
--4
8. Y Distance
to Wind Load on External Structure
The Y distance to the center of the wind load measured from the top of the retaining wall.
in
0.0 (E)
180.0 (W)
--4
1 A blank indicates the absence of the collision load. 2 A blank indicates the absence of a parapet dead load. 3 A blank indicates the absence of a noise wall dead load. 4 A blank indicates the absence of wind load on an external structure.
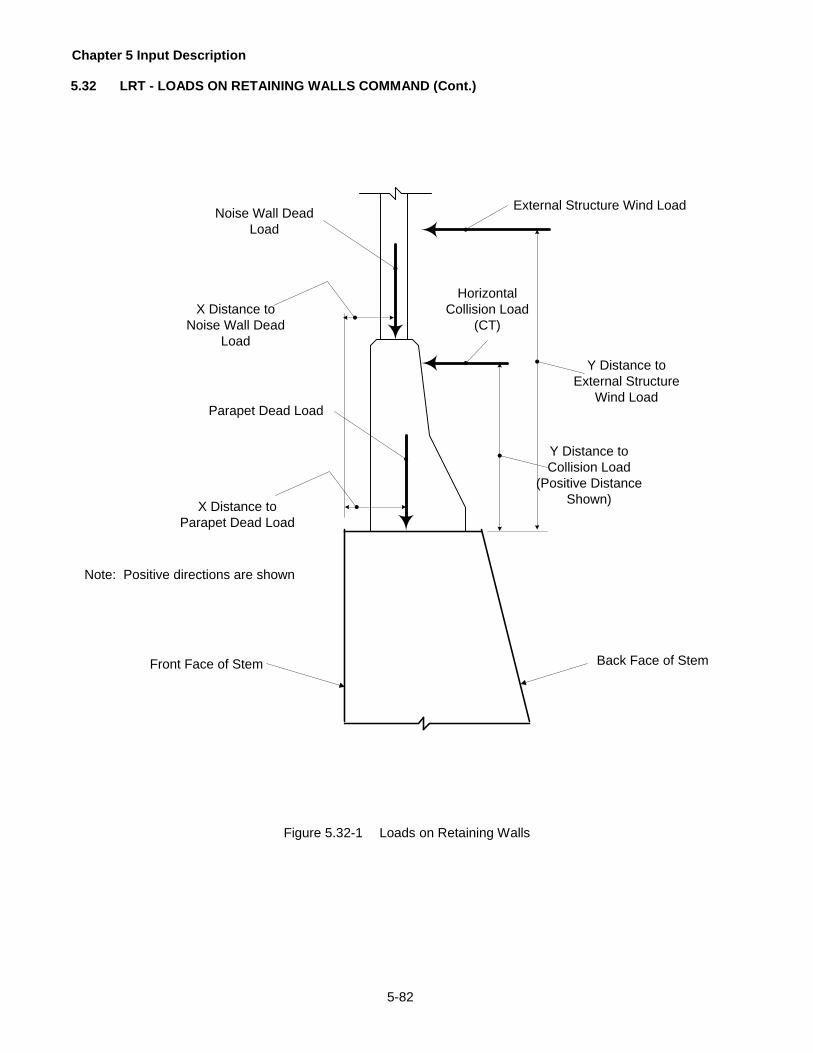
Chapter 5 Input Description
5-82
5.32 LRT - LOADS ON RETAINING WALLS COMMAND (Cont.)
Horizontal
Collision Load
(CT)
Parapet Dead Load
X Distance to
Parapet Dead Load
Y Distance to
Collision Load
(Positive Distance
Shown)
Note: Positive directions are shown
Front Face of Stem Back Face of Stem
Noise Wall Dead
Load
X Distance to
Noise Wall Dead
Load
External Structure Wind Load
Y Distance to
External Structure
Wind Load
Figure 5.32-1 Loads on Retaining Walls

Chapter 5 Input Description
5-83
5.33 DLL - DESIGN LIVE LOADING COMMAND
KEYWORD
COMMAND DESCRIPTION
DLL
DESIGN LIVE LOADING - This command describes design live loadings per unit width from the bridge superstructure applied to abutments due to the design loading. These loads are not applicable to retaining walls. Live loads from the bridge superstructure applied to abutments are depicted in Figure 5.30-1. This command may only be specified once. If DLL is specified SLL should not be used and the Strength II limit state is not evaluated.
PARAMETER
DESCRIPTION
UNITS
LOWER LIMIT
UPPER LIMIT
Default
1. Downward
LL
Design live loading reaction applied in a downward direction and does not include effects due to impact.
kip/ft
0.0 (E)
10.0 (W)
0.0
2. Upward LL
Design live loading reaction applied in an upward direction and does not include effects due to impact.
kip/ft
-2.0 (W)
0.0 (E)
0.0
3. BR
Design horizontal live loading braking force. This load is applied in the direction that is perpendicular to the skew of the abutment. Hence, the magnitude of the load should be adjusted accordingly.
kip/ft
0.0 (E)
1.0 (W)
0.0
4. CE
Design horizontal live loading centrifugal force. This load is applied in the direction that is perpendicular to the skew of the abutment. Hence, the magnitude of the load should be adjusted accordingly.
kip/ft
0.0 (E)
1.0 (W)
0.0

Chapter 5 Input Description
5-84
5.34 SLL - SPECIAL LIVE LOADING COMMAND
KEYWORD
COMMAND DESCRIPTION
SLL
SPECIAL LIVE LOADING - This command describes a special (or permit P-82) live loading per unit width from the bridge superstructure applied to abutments. The Strength II limit state is only evaluated if the SLL command is specified. These loads are not applicable to retaining walls. Live loads from the bridge superstructure applied to abutments are depicted in Figure 5.30-1. This command may only be specified once.
PARAMETER
DESCRIPTION
UNITS
LOWER LIMIT
UPPER LIMIT
Default
1. Downward
LL
Special live loading reaction applied in a downward direction and does not include effects due to impact.
kip/ft
0.0 (E)
5.0 (W)
0.0
2. Upward LL
Special live loading reaction applied in an upward direction and does not include effects due to impact.
kip/ft
-2.0 (W)
0.0 (E)
0.0 0.0
3. BR
Special horizontal live loading braking force. This load is applied in the direction that is perpendicular to the skew of the abutment. Hence, the magnitude of the load should be adjusted accordingly.
kip/ft
0.0 (E)
1.0 (W)
0.0
4. CE
Special horizontal live loading centrifugal force. This load is applied in the direction that is perpendicular to the skew of the abutment. Hence, the magnitude of the load should be adjusted accordingly.
kip/ft
0.0 (E)
1.0 (W)
0.0
5. Strength I
Factor
The Strength I limit state load factor applied to the special live loads described above.
--
0.0 (E)
2.0 (E)
--
6. Strength IP
Factor
The Strength IP limit state load factor applied to the special live loads described above.
--
0.0 (E)
2.0 (E)
--
7. Strength II
Factor
The Strength II limit state load factor applied to the special live loads described above.
--
0.0 (E)
2.0 (E)
--
8. Strength III
Factor
The Strength III limit state load factor applied to the special live loads described above.
--
0.0 (E)
2.0 (E)
--
9. Strength V
Factor
The Strength V limit state load factor applied to the special live loads described above.
--
0.0 (E)
2.0 (E)
--
10. Extreme I
Factor
The Extreme I limit state load factor applied to the special live loads described above.
--
0.0 (E)
2.0 (E)
--
11. Service I
Factor
The Service I limit state load factor applied to the special live loads described above.
--
0.0 (E)
2.0 (E)
--

Chapter 5 Input Description
5-85
5.35 EQL - EARTHQUAKE LOADS COMMAND
KEYWORD
COMMAND DESCRIPTION
EQL
EARTHQUAKE LOADS - This command describes earthquake criterion for all structures and loads per unit width applicable to abutments. The Extreme Event I limit state is only evaluated if the EQL command is specified. External earthquake loads are depicted in Figure 5.30-1. This command may only be specified once.
PARAMETER
DESCRIPTION
UNITS
LOWER LIMIT
UPPER LIMIT
Default
1. Response
Modification
The response modification factor applied to the earthquake design loads.
--
0.0 (E)
5.0 (W)
1.0
2. Soil Pressure
Factor
The factor by which the soil pressure load, EH, is to be multiplied to obtain earthquake effects.
--
1.0 (E)
2.5 (W)
1.0
3. Phi Factor
Foundation
For spread footings and pedestal footings, strength reduction factor applied to the bearing capacity for the Extreme Event I limit state. For piles and caissons, factor applied to the strength axial capacity and strength lateral capacity entered on the PIL and CAI commands to determine the axial capacity and lateral capacity for the Extreme Event I limit state.
--
*
**
--
4. Vertical EQ Soil
NOTE: This parameter is no longer used and should be left blank.
--
--
--
--
5. Horizontal Superstructure
Force
The horizontal force at the abutment bearing location due to earthquake effect on the superstructure. Leave blank for retaining walls. This load is applied in the direction that is perpendicular to the skew of the abutment. Hence, the magnitude of the load should be adjusted accordingly.
kip/ft
0.0 (E)
4.0 (W)
0.0
6. Horizontal External
Structure Force
The horizontal force at the top of the retaining wall due to earthquake effect on an external structure. Leave blank for abutments. This load is applied in the direction that is perpendicular to the retaining wall.
kip/ft
0.0 (E)
4.0 (W)
0.0
* For spread and pedestal footings, must be greater than 0.0 (E). For piles and caissons, 1.0(E). ** For spread and pedestal footings, 1.0(W). For piles and caissons, 2.0(W).

Chapter 5 Input Description
5-86
5.36 OIN - OUTPUT OF INPUT COMMAND
KEYWORD
COMMAND DESCRIPTION
OIN
OUTPUT OF INPUT - This command is used to control the type of input data reports which can be requested by the user. This command may only be specified once.
PARAMETER
DESCRIPTION
UNITS
LOWER LIMIT
UPPER LIMIT
Default
1. Input File
Echo
An input file echo may be generated in the output.
0 - Do not print input file echo. 1 - Print input file echo.
--
0
(E)
1
(E)
0
2. Input
Commands
The input data may be organized according to the command, with a short description for each data item.
0 - Do not print input commands. 1 - Print input commands.
--
0
(E)
1
(E)
0
3. Input
Summary
A summary of the input data may be printed.
0 - Do not print input summary. 1 - Print input summary.
--
0
(E)
1
(E)
1

Chapter 5 Input Description
5-87
5.37 OUR - OUTPUT OF RESULTS COMMAND
KEYWORD
COMMAND DESCRIPTION
OUR
OUTPUT OF RESULTS - This command is used to control the type of result reports, which can be requested by the user. Each report is applicable for both design and analysis. This command may only be specified once.
PARAMETER
DESCRIPTION
UNITS
LOWER LIMIT
UPPER LIMIT
Default
1. Footing
Geometry
The geometry of the footing may be printed.
0 - Do not print footing geometry. 1 - Print footing geometry.
--
0
(E)
1
(E)
*
2. Output
Legend
The output legend lists abbreviations found throughout the reports.
0 - Do not print output legend. 1 - Print output legend.
--
0
(E)
1
(E)
*
3. Factored
Forces
Factored forces for the backwall, stem and footing may be printed.
0 - Do not print factored forces. 1 - Print factored forces.
--
0
(E)
1
(E)
*
4. Footing
Stability
Footing stability reports depend on the footing type. For spread footings, bearing capacity, sliding and settlement are reported. For pile or caisson footings, the pile pattern, axial loads and lateral loads are reported.
0 - Do not print footing stability. 1 - Print footing stability.
--
0
(E)
1
(E)
*
5. Footing
Controlling Forces
Controlling forces used to analyze or design reinforcement in the footing may be printed.
0 - Do not print controlling forces. 1 - Print controlling forces.
--
0
(E)
1
(E)
*
6. Footing
Flexure
The flexural capacity of the footing may be printed.
0 - Do not print footing flexure. 1 - Print footing flexure.
--
0
(E)
1
(E)
*
7. Reinforce-
ment Summary
For a design run, two types of data are reported. The first type identifies the bar spacing (for all bar sizes) required for strength and serviceability requirements at all stem, footing and backwall (if applicable) locations. The second type of information is reported in a separate table; the optimal bar in each component (stem - location d, footing, backwall) is identified. The format follows the design details report - see parameter 10. A summary of status checks is reported for the backwall, stem and footing.
0 - Do not print reinforcement summary. 1 - Print reinforcement summary.
--
0
(E)
1
(E)
*
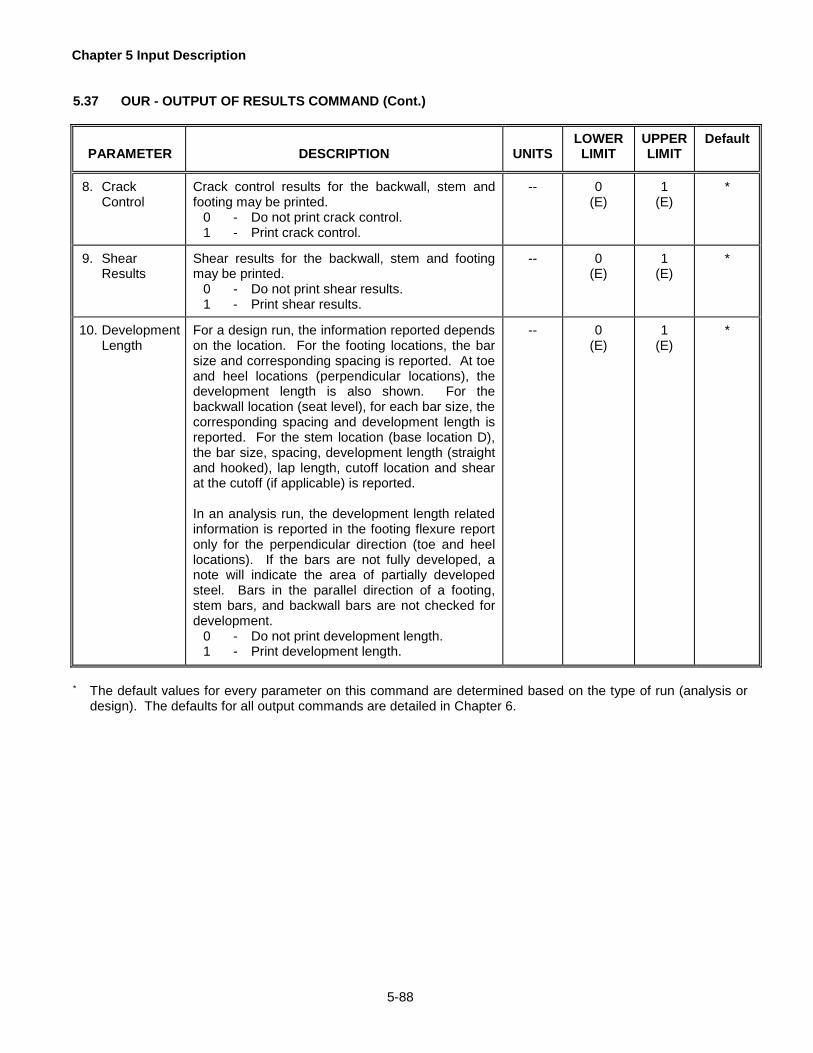
Chapter 5 Input Description
5-88
5.37 OUR - OUTPUT OF RESULTS COMMAND (Cont.)
PARAMETER
DESCRIPTION
UNITS
LOWER LIMIT
UPPER LIMIT
Default
8. Crack
Control
Crack control results for the backwall, stem and footing may be printed.
0 - Do not print crack control. 1 - Print crack control.
--
0
(E)
1
(E)
*
9. Shear
Results
Shear results for the backwall, stem and footing may be printed.
0 - Do not print shear results. 1 - Print shear results.
--
0
(E)
1
(E)
*
10. Development
Length
For a design run, the information reported depends on the location. For the footing locations, the bar size and corresponding spacing is reported. At toe and heel locations (perpendicular locations), the development length is also shown. For the backwall location (seat level), for each bar size, the corresponding spacing and development length is reported. For the stem location (base location D), the bar size, spacing, development length (straight and hooked), lap length, cutoff location and shear at the cutoff (if applicable) is reported. In an analysis run, the development length related information is reported in the footing flexure report only for the perpendicular direction (toe and heel locations). If the bars are not fully developed, a note will indicate the area of partially developed steel. Bars in the parallel direction of a footing, stem bars, and backwall bars are not checked for development.
0 - Do not print development length. 1 - Print development length.
--
0
(E)
1
(E)
*
* The default values for every parameter on this command are determined based on the type of run (analysis or
design). The defaults for all output commands are detailed in Chapter 6.
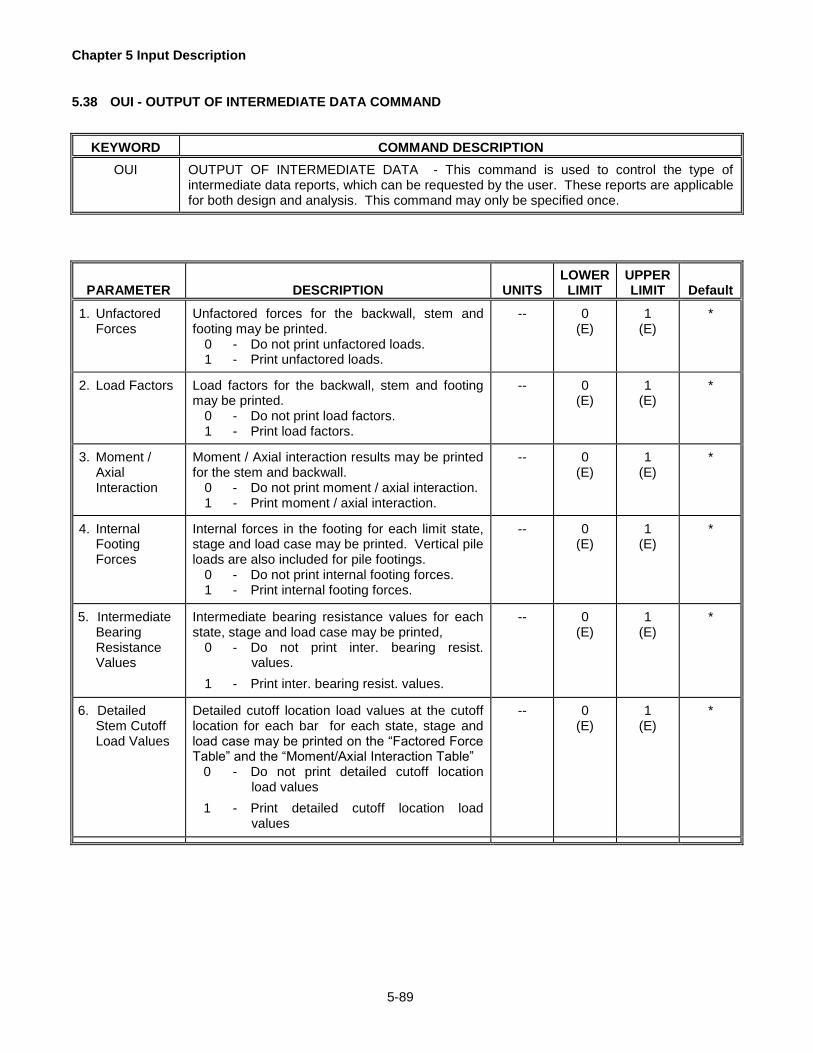
Chapter 5 Input Description
5-89
5.38 OUI - OUTPUT OF INTERMEDIATE DATA COMMAND
KEYWORD
COMMAND DESCRIPTION
OUI
OUTPUT OF INTERMEDIATE DATA - This command is used to control the type of intermediate data reports, which can be requested by the user. These reports are applicable for both design and analysis. This command may only be specified once.
PARAMETER
DESCRIPTION
UNITS
LOWER LIMIT
UPPER LIMIT
Default
1. Unfactored Forces
Unfactored forces for the backwall, stem and footing may be printed.
0 - Do not print unfactored loads. 1 - Print unfactored loads.
--
0
(E)
1
(E)
*
2. Load Factors
Load factors for the backwall, stem and footing may be printed.
0 - Do not print load factors. 1 - Print load factors.
--
0
(E)
1
(E)
*
3. Moment /
Axial Interaction
Moment / Axial interaction results may be printed for the stem and backwall.
0 - Do not print moment / axial interaction. 1 - Print moment / axial interaction.
--
0
(E)
1
(E)
*
4. Internal
Footing Forces
Internal forces in the footing for each limit state, stage and load case may be printed. Vertical pile loads are also included for pile footings.
0 - Do not print internal footing forces. 1 - Print internal footing forces.
--
0
(E)
1
(E)
*
5. Intermediate
Bearing Resistance Values
Intermediate bearing resistance values for each state, stage and load case may be printed,
0 - Do not print inter. bearing resist. values.
1 - Print inter. bearing resist. values.
--
0
(E)
1
(E)
*
6. Detailed
Stem Cutoff Load Values
Detailed cutoff location load values at the cutoff location for each bar for each state, stage and load case may be printed on the “Factored Force Table” and the “Moment/Axial Interaction Table”
0 - Do not print detailed cutoff location load values
1 - Print detailed cutoff location load values
--
0
(E)
1
(E)
*

Chapter 5 Input Description
5-90
5.38 OUI - OUTPUT OF INTERMEDIATE DATA COMMAND (Cont.)
PARAMETER
DESCRIPTION
UNITS
LOWER
LIMIT
UPPER LIMIT
Default
7. Minimum
Reinforcement Check
For an analysis run, detailed minimum reinforcement calculation values for the backwall, stem and footing are reported.
0 - Do not print minimum reinforcement check values
1 - Print minimum reinforcement check values
--
0
(E)
1
(E)
*
* The default values for every parameter on this command are determined based on the type of run (analysis or
design). The defaults for all output commands are detailed in Chapter 6.
.

6-1
6 DETAILED INPUT DESCRIPTION
This chapter provides a detailed description of some of the input parameters, which were described in Chapter 5,
but may need further explanation or commentary. The numbering scheme used in this chapter is as follows. The
section number for a command corresponds to the same section number in Chapter 5. The parameter being
described is preceded by a section number, whose last extension number refers to the parameter number in the
corresponding command in Chapter 5. For example, 6.5.3 Footing Datum corresponds to Section 5.5 CTL -
Control Command, Parameter 3.
Only the commands and parameters for which detailed description is given are included here. For parameters,
which are not presented in this chapter, sufficient description and explanation is provided in Chapter 5.
6.5 CTL - CONTROL COMMAND
6.5.3 Footing Datum
The footing datum can only be set for a design run. The footing datum determines how the footing
thickness will be changed. This is explained in Figure 5.5-1.
For an analysis run, the datum is set to the top of the footing, and should be left blank.
The footing datum defines how the height parameter that is specified in commands AT1, AT2, AWB, and
RWL is interpreted by the program. If the footing datum is set to the top of the footing, the height is
interpreted as the stem height. If the footing datum is set to the bottom of the footing, the height is
interpreted as the structure height. Refer to Figure 1.
6.6 AT1 - ABUTMENT TYPE 1 COMMAND
6.6.13 Front Water Level
The depth is specified from the top of the structure. Leave this parameter blank if the front water is not
present. A value of 0 implies that the front water level is at the top of the structure. The back water level
must be entered if a front water level is entered. If the front water level is left blank and a back water level
is entered for a design run, the program will calculate the front water level based on DM-4 section 3.11.3.
For analysis, if the front water level is left blank, the program places the front water level at the bottom of
the footing

Chapter 6 Detailed Input Description
6-2
stem
footing
h
(a) height definition when footing datum = 'B'
stem
footing
h
(b) height definition when footing datum = 'T'
Figure 6.6.13-1 Height and Footing Datum
The weight of the water above the toe is considered in the calculation for the WA load. WA also includes
the uplift pressure due to buoyancy as shown in Figure 1.

Chapter 6 Detailed Input Description
6-3
6.6.14 Back Water Level
The depth is specified from the top of the structure. Leave this parameter blank if the back water is not
present. A value of 0 implies that the back water level is at the top of the structure.
STEM
FOOTINGTOE HEEL
Back Water Level
Front Water Level
x
y
uplift pressure wy
wx
Figure 6.6.14-1 Water Level and Uplift Pressure
The backfill soil below the back water level is considered to be saturated. The soil above the back water
level is considered to be dry (or moist).

Chapter 6 Detailed Input Description
6-4
6.7 AT2 - ABUTMENT TYPE 2 COMMAND
6.7.20 Front Water Level
See description in Section 6.6.13.
6.7.21 Back Water Level
See description in Section 6.6.14.
6.8 AWB - ABUTMENT WITHOUT BACKWALL COMMAND
6.8.9 Front Water Level
See description in Section 6.6.13.
6.8.10 Back Water Level
See description in Section 6.6.14.
6.8.11 Type of Abutment
Gravity type abutments or retaining walls should be described without any reinforcement; i.e. the use of
SRA, SRB, SPA, BAR, ARE command will result in an error. Do not use these commands. The program
will check the stem wall quarter points for tensile stresses. Flexure and Shear Checks are not performed
in the footing. The user can distinguish between gravity and cantilever structures. There is a variation in
the calculation of ka, the effective depth and soil pressure. See Chapter 3 for further details.
A gravity wall depends on its self-weight for stability. Usually it does not have a significant toe or heel. It
is usually unreinforced. A cantilever wall has a distinct footing heel and stem. It depends on the soil over
the toe and footing for stability and it is reinforced.
6.9 RWL - RETAINING WALL COMMAND
6.9.11 Front Water Level
See description in Section 6.6.13.

Chapter 6 Detailed Input Description
6-5
6.9.12 Back Water Level
See description in Section 6.6.14.
6.9.13 Type of Wall
See section 6.8.11.

Chapter 6 Detailed Input Description
6-6
6.10 FTG - FOOTING COMMAND
For a design run, the footing command controls the search for the solution. Hence, the choice and values
selected for the parameters play a critical role in determining the length of the run and the optimal solution. The
special notes for this command (applicable for a design run only) are organized into five sections as follows:
An overview of the issues concerning conflicting input data.
Description of specific rules and guidelines, this includes samples of common error messages
and how to resolve them.
Recommended choices for input data.
Considerations for efficiency.
Suggested strategies for running a design problem.
Conflicting Input Data
The footing command has been developed to provide the user with a variety of ways in which to describe the
range of abutment configuration that should be considered for design. The drawback to providing this flexibility is
the potential conflicts that may arise from the choice and values specified for the input parameters.
The user has the option of constraining the thickness, width, toe projection and heel projection by specifying
maximum and minimum values for each variable type. Errors typically occur when the user has inadvertently
“over-constrained” the scope of configurations, i.e., there is an inconsistency in the input data.
The program will stop when a footing dimension limit that is specified by the user cannot be evaluated because of
constraints imposed by other limiting values. For example, if the user specifies a value of 1 for the minimum
width, minimum toe projection and minimum heel projection, the program will stop because a width of 1 cannot
possibly exist when the toe and heel projections of 1 are also required.
Typically, most conflicts occur between the projections and width. Since the footing thickness is not “coupled” to
the width and projections, it is not discussed in much detail in the examples that follow.
Rules and Guidelines
Each rule has an example that illustrates how the rule was violated. An explanation and some guidelines are also
provided.
In the first four examples, the stem thickness is assumed to be 2.5 ft. In the last example, the stem thickness is
1.5 ft.

Chapter 6 Detailed Input Description
6-7
Rule 1: A ‘minimum’ parameter cannot exceed ‘maximum’ parameter
Input example: FTG 2, , , 12, 2, , , 10
Error message: “ftg - min > max”
Explanation: Program encountered minimum width (12) that is greater than maximum
width (10)
Solution: Switch the values.
Guideline: Review the input for typographic errors, or data in the incorrect field.
Rule 2: Maximum specified width cannot be less than the sum of the toe
projection, heel projection and stem width.
Input example: FTG 2, 7, , , 2, , , 9.
Error message: “width greater than max”
Explanation: The calculated width exceeds the maximum user-defined width as
illustrated in Figure 1(a), where 7' + 2.5' + 1' > 9'.
Solution: Do not specify minimum toe projection or maximum width.
Guidelines: If toe and/or heel projections are specified, ensure that there is no
conflict with the maximum width. The program assumes a default value
of 1 ft for the toe and heel projections.
Rule 3: Maximum specified width cannot be greater than the sum of the toe
projection, heel projection and stem width.
Input example: FTG 2, , , , 2, 5, 7.5, 16
Error message: “maximum width is too big”
Explanation: The maximum user-specified width is greater than calculated-width as
illustrated in Figure 1(b) where 16'> 5' + 2.5' + 7.5'
Solution: Do not specify one of the following: maximum toe, heel or width
Guidelines: See guidelines for rule 2.
Rule 4: Minimum width (if specified) cannot be less than the sum of the minimum
toe projection, minimum heel projection and stem width.
Input example: FTG 2, 3, 4, 8, 2, , ,
Error message: “minimum width too small”
Explanation: Minimum width is less than calculated minimum as illustrated in Figure
1(c) where 8' < 3' + 2.5' + 4.0'
Solution: Do not specify minimum width, or revise the projections accordingly
Guidelines: See guidelines for rule 2.

Chapter 6 Detailed Input Description
6-8
5.0'(max)
7.5'(max)
(a) FTG error type: width greater than max
7.0'(min)
1.0'(default)
(b) FTG error type: maximum footing width is too big
9.0' (max)
calculated minimum width
2.5'
2.5'
calculated maximum width
user specified max width 16'
Figure 6.10-1 Conflicting Input

Chapter 6 Detailed Input Description
6-9
(c) FTG error type: minimum width is too small
3'(min)
4'(min)
1'(default)
1'(default)
(d) footing width too small to accomodate pile layout
0.5'
not enough room for 3' spacing
calculated minimum width
8' (min)
1.5'
1.5' 1.5'
2.5'
Figure 6.10-1 Conflicting Input (cont.)

Chapter 6 Detailed Input Description
6-10
Rule 5: For pile footings, the width should be sufficiently wide to accommodate
the pile layout (minimum).
Input example: FTG 2, , , , 2.5, ,
LYD 1.5, 1.5, 3, ....
Error message: first footing width too small for 2 pile rows
Explanation: The minimum width and projections were not specified; hence, the
default projections were used. Consequently, the first footing size was
3.5'. According to the LYD command, the distance from: the toe to first
row is 1.5 ft; and, heel to last row is 1.5 ft. There is no room for a
minimum spacing of 3 ft. as shown in Figure 1(d).
Solution: Specify a minimum footing width of at least 6 ft.
Guidelines: Check the LYD command, particularly the distance to first and last pile
rows from the edge of the footing. Also, check the minimum footing
width.
Rule 6: The heel projection of the footing is controlled either by the maximum
heel projection or maximum footing width can not be less than the stem
notch width minus the back batter.
Input example: FTG 750, , , , ,250
AT2 4000, , , , , , , , ,400,1250,300,1000, ,2,10 ....
Error message: Backwall completely overhangs heel
Explanation: The calculated overhang extends beyond the limit of the heel.
Solution: Increase maximum heel
Guidelines: Check to ensure maximum heel width is not too small

Chapter 6 Detailed Input Description
6-11
Recommended Choices for Input Data
The table below provides suggestions on combinations of input data. Since the thickness is independent of the
horizontal geometry, it has been omitted.
Case minimum maximum
toe
proj
heel
proj
width toe proj heel
proj
width
1
o - x x - x
1a - - x o - x
2 - o x - - x
2a - - x - o x
3 x x - - - o
4 - - o x x -
5 x x - x x -
Legend: ‘x’=value specified; ‘-’ value not specified; ‘o’ - optional, check for conflict
Notes:
Case 1 and 1a, avoid conflict for footing widths if the toe projections are specified.
Case 2 and 2a, avoid conflict for footing widths if the heel projections are specified.
Case 3, ensure that the maximum width is large enough.
Case 4, ensure that the minimum width is small enough.
Case 5, ensure that minimum parameters are less than maximum parameters.
Efficiency Considerations
If the maximum width is not specified, the program will use a value of three times the structure height, which is the
height from the top of abutment including backwall or retaining wall to the bottom of the footing. This structure
height is based on the initial footing thickness established during the programs first trial run. During the run, if a
solution is found, the upper limit of the width will be revised to the lesser of the original computed maximum width;
or, the width for the first valued design plus 3.5 ft. It would be more efficient to select a reasonable footing width
based on engineering judgment.
Footing thickness should be considered for shear. Shear is usually not a problem for spread and pedestal
footings - use 2 ft for both minimum and maximum. For pile footings, ensure that there is enough depth
for pile embedment. Use that value for both minimum and maximum (see note that follows).
The design algorithm uses a triple nested loop with built-in optimization. The program starts with the
maximum footing thickness and determines a valid design width. The thickness is then reduced to the
minimum and the footing width is reduced by 1/2 the maximum footing thickness. The thickness is then
incremented up to the lesser of the maximum footing thickness of the last designed footing thickness. For
each thickness and width combination, all possible stem positions are checked.
Consequently:

Chapter 6 Detailed Input Description
6-12
As the width increases, so does the number of stem positions. Expect the width to change slowly
as the program approaches the maximum width.
Strategies and Other Considerations
Based on the user’s level of confidence concerning a solution, pick a tolerance value to define the maximum and
minimum footing widths. Use smaller tolerances with higher confidence limits. For example, if the user is
confident that a solution should exist for a 12 ft width, constrain the problem to check a range of 11.5 ft to 12.5 ft.
Otherwise, try something from 10 ft. to 14 ft.
If a solution is not found, the program will indicate where the problem might exist (See Section 3.9). To
corroborate this, run an analysis problem. Performance factors that are less than 1.0 will identify the sources of
error.
6.10.9 Footing Thickness Increment & 6.10.10 Footing Width Increment
The footing thickness increment, the footing width increment and the stem increment values can be used
to speed up a design run by using the following process.
Make the first design run with no limits on the footing size, and with a footing thickness increment and
width increment set to 12".
Review the output file to determine the footing size and change the input file to set the min/max
footing thickness to the thickness from the first run.
Set the min/max footing width within a 1 or 2 foot range of the footing size from the first run.
Set the thickness and width increments to 2" and make a second run.
Set the stem increment to 1” and make a second run.
6.10.10 Footing Width Increment
See section 6.10.9
6.10.11 Footing Stem Increment
See section 6.10.9

Chapter 6 Detailed Input Description
6-13
6.12 PIL - PILE COMMAND
6.12.3 Pile Embedment
Pile embedment is used when evaluating the punching shear requirements. The program compares the
pile embedment to the minimum acceptable value as per DM-4 specifications. The user may describe
footing rebar over the piles or alongside the piles (see CVR command).
6.12.5 Strength Axial Capacity
The Strength Axial Capacity is equal to the smaller of (a) factored geotechnical capacity or (b) the
factored strength axial structural capacity as indicated below.
For steel piles driven to bedrock, the factored strength axial capacity should be in accordance with DM-4
D6.15.2.
For concrete filled steel pipe piles, determine the factored strength axial structural capacity in accordance
with DM-4 D5.13.4.7P. The resistance factor, φ, to use for concrete piles is given in DM-4 D5.5.4.2.1.
The strength axial capacity for friction piles is equal to the factored geotechnical resistance at Strength
Limit State, and is to be computed in accordance with DM-4 D10.7.3.
6.12.7 Strength Lateral Capacity
The Strength Lateral Capacity depends on the type of pile group.
For a pile group with all vertical piles, the Strength Lateral Capacity is to be determined using either the
COM624P or LPILE Program. Strength Lateral Capacity is based on a lateral deflection of 1.0 inch, at a
strength limit state as discussed in DM-4 D10.7.2.2. The procedure that must be followed is iterative and
is described in DM-4 D10.7.3.12.2.
For a pile group with battered and vertical piles, the lateral capacity is equal to the horizontal component
of strength axial capacity of the battered piles. Lateral capacities are assigned to battered piles only.

Chapter 6 Detailed Input Description
6-14
6.12.8 Pile Uplift Capacity
The uplift capacity must be based on geotechnical analysis with or without pullout testing, refer to DM-4
10.7.1.6.3. Alternately, in the absence of analysis or testing, the uplift capacity may be taken as 10% of
the axial structural capacity for steel piles, 0.1 fy As.
No uplift is permitted under a service limit state.

Chapter 6 Detailed Input Description
6-15
6.13 CAI - CAISSON COMMAND
6.13.2 Caisson Embedment
Please refer to Section 6.12.3.
6.13.4 Strength Axial Capacity
Refer to DM4 10.8.3 for factored geotechnical capacity and DM4 Section 5 for factored structural
capacity.
6.13.6 Strength Lateral Capacity
For designs in which all the caissons are vertical (which is almost always the case in Pennsylvania), the
Strength Lateral Capacity is to be determined using either the COM624P or LPILE Program. Strength
Lateral Capacity is based on limiting the lateral deflection to 1.0 inch at the strength limit state in
accordance with, AASHTO 10.8.2.2, DM-4 D10.7.2.2 and D10.8.3.8. The procedure that must be
followed is iterative and is described in DM-4 D10.7.3.12.2.
6.13.7 Caisson Uplift Capacity
The uplift capacity must be based on geotechnical analysis with or without pullout testing, refer to DM4
10.8.3.7.
No uplift is permitted under a service limit state.
6.14 PED - PEDESTAL COMMAND
6.14.4 Minimum Pedestal Width
The minimum pedestal width is used as the pedestal width for an analysis run. For a design run, the
program will test all pedestal variations using a width that varies incrementally from minimum to the
maximum value specified by the user.
The pedestal must be sufficiently wide enough to support the footing and have acceptable front, back and
sloped projections as shown in Figure 5.14-2.

Chapter 6 Detailed Input Description
6-16
6.14.5 Minimum Pedestal Thickness
The minimum pedestal thickness is used as the pedestal thickness for an analysis run. For a design run,
the program will test all pedestal variations using a thickness that varies incrementally from minimum to
the maximum value specified by the user.
The pedestal thickness will determine the clear spacing between pedestals. The clear spacing is used to
compute the moments in the footing (parallel direction).
6.14.8 Maximum Pedestal Width
The maximum pedestal width should be left blank for an analysis run. For a design run, the program will
test all pedestal variations using a width that varies incrementally from minimum to the maximum value
specified by the user.
The pedestal must be sufficiently wide enough to support the footing and have acceptable front, back and
sloped projections as shown in Figure 5.14-2. If the maximum pedestal width is not specified for a design
run, the program will use a value equal to two times the current footing width under consideration for
design (see Section 5.10). Hence, the maximum footing width will vary during the design run.
6.14.9 Maximum Pedestal Thickness
The maximum pedestal thickness should be left blank for an analysis run. For a design run, the program
will test all pedestal variations using a thickness that varies incrementally from minimum to the maximum
value specified by the user.
The pedestal thickness will determine the clear spacing between pedestals. The clear spacing is used to
compute the moments in the footing (parallel direction).
6.15 LYD - PILE/CAISSON LAYOUT DESIGN COMMAND
6.15.6 Pile Spacing Rounding
The program will ensure that the pile spacing within a row is rounded to the lowest multiple of this
parameter as follows. For example, if this parameter is set to 0.25 ft, a required pile spacing of 3.9 ft will
be rounded to a design value of 3.75 ft, and a required pile spacing of 3.55 ft will be rounded to 3.5 ft.
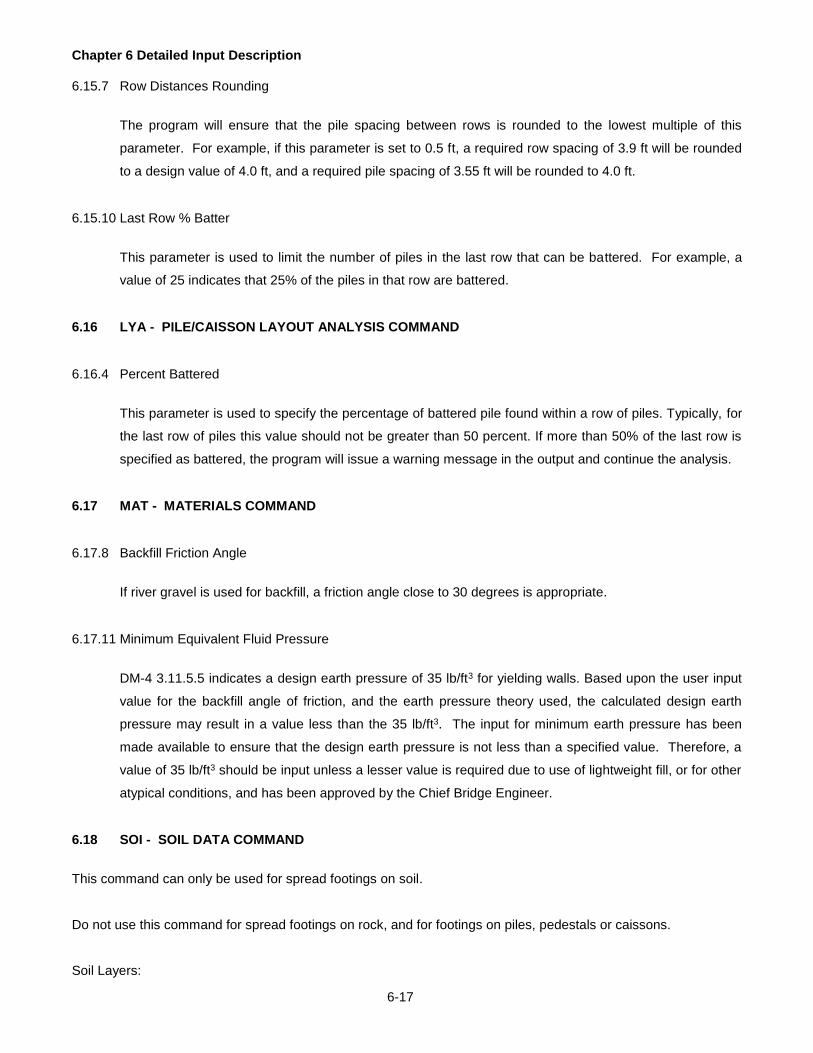
Chapter 6 Detailed Input Description
6-17
6.15.7 Row Distances Rounding
The program will ensure that the pile spacing between rows is rounded to the lowest multiple of this
parameter. For example, if this parameter is set to 0.5 ft, a required row spacing of 3.9 ft will be rounded
to a design value of 4.0 ft, and a required pile spacing of 3.55 ft will be rounded to 4.0 ft.
6.15.10 Last Row % Batter
This parameter is used to limit the number of piles in the last row that can be battered. For example, a
value of 25 indicates that 25% of the piles in that row are battered.
6.16 LYA - PILE/CAISSON LAYOUT ANALYSIS COMMAND
6.16.4 Percent Battered
This parameter is used to specify the percentage of battered pile found within a row of piles. Typically, for
the last row of piles this value should not be greater than 50 percent. If more than 50% of the last row is
specified as battered, the program will issue a warning message in the output and continue the analysis.
6.17 MAT - MATERIALS COMMAND
6.17.8 Backfill Friction Angle
If river gravel is used for backfill, a friction angle close to 30 degrees is appropriate.
6.17.11 Minimum Equivalent Fluid Pressure
DM-4 3.11.5.5 indicates a design earth pressure of 35 lb/ft3 for yielding walls. Based upon the user input
value for the backfill angle of friction, and the earth pressure theory used, the calculated design earth
pressure may result in a value less than the 35 lb/ft3. The input for minimum earth pressure has been
made available to ensure that the design earth pressure is not less than a specified value. Therefore, a
value of 35 lb/ft3 should be input unless a lesser value is required due to use of lightweight fill, or for other
atypical conditions, and has been approved by the Chief Bridge Engineer.
6.18 SOI - SOIL DATA COMMAND
This command can only be used for spread footings on soil.
Do not use this command for spread footings on rock, and for footings on piles, pedestals or caissons.
Soil Layers:

Chapter 6 Detailed Input Description
6-18
The program can handle one or two layers of soil. If multiple layers are present, they must be modeled
as one or two layers.
(a) Single Soil Layer: In this case, the soil parameters for the single soil layer are input under “SOI”
command. The program assumes that a very stiff layer exists under this one layer of soil. The soil layer
thickness is input to indicate where the soil layer ends and the stiff layer begins.
(b) Two Soil Layers: When there are two soil layers, properties and thicknesses for each layer must be
input under the “SOI” command. The program assumes a very stiff layer under the two soil layers.
Normal input values for soils are as follows:
Clay Soils: Input “Su” (3.1 notations) value only. Leave c (3.1 notations) and Phi values blank.
Typical values for Su are 2.1 to 12.5 ksf for supporting footings (also refer to BC-795M).
C-Phi Soils: Input both c-value and Phi value. Leave Su - value blank.
Typical c values are 1.0 to 2.1 ksf and typical Phi values from 25 to 40 degrees
Sand Soils: Input Phi-value only. Leave Su and C-values blank.
Soft Soil: When there is a “soft layer” of soil below the footing, the program terminates due to the soft layer.
In practice, we do not construct bridge substructures on very soft soils; instead, pile, pedestal or
caisson foundations are used. Therefore, limiting values of soil parameters are used to define
what a “soft soil” is and the spread footing design is terminated when these low values of soil
parameters are present. These limiting soil values are:
Clay Soils (Su only) Su 0.626 ksf
C-Phi Soils (Mixed) c 0.626 ksf AND Phi 20
Sand Soils Phi 20
6.18.3 Footing Near Slope
A footing is considered to be near a slope when any portion of the footing is located within a distance of
three times the footing width of the crest of slope. A sloping ground surface in front of a footing will
reduce the bearing resistance. Please refer to DM-4 Section 10.6.3.1.2c.

Chapter 6 Detailed Input Description
6-19
If the footing is near the slope or on a slope the values of Ncq and Ngq must be specified by the user.
Otherwise, leave these parameters blank.
Ncq and Ngq values:
These are bearing capacity factors used in calculating the bearing capacity of a footing on or near
a soil slope. These parameters are input only when the footing is to be designed or analyzed on
or near a slope. Refer to DM-4 Section 10.6.3.1.2c. For cohesive soils, typical values of Ncq are
in the range of 2 to 6. For cohesionless soils, typical values for Nγq are in the range of 15 to 60.
6.18.5 Allowable Settlement
The computed settlement is compared to the value of this parameter. For clay and c-phi soil, the
computed settlement is the sum of the elastic, consolidation and secondary settlement. For a sand
foundation, only the elastic settlement is considered. The temporary stage settlement is reported but is
not deducted from the total settlement. The allowable settlement should be selected using engineering
judgment either to include the temporary stage settlement or not to include it.
6.18.6 Bearing Capacity Phi Factor
The value of this parameter is applied to the unfactored bearing resistance of the soil foundation to
evaluate the factored bearing resistance. The factored bearing resistance is compared to the applied
factored loads.
Values for the bearing capacity resistance factors at the strength limit state range from 0.35 to 0.55
depending on the foundation analytical method, soil type and test method. See DM-4 Table D10.5.5.2.2-
1.
6.18.7 Sliding Phi Factor
The value of this parameter is applied to the unfactored sliding resistance of the soil foundation to
evaluate the factored sliding resistance. The factored sliding resistance is compared to the applied
factored horizontal loads.
Typical values for the sliding resistance factor range from 0.80 to 1.0. See DM-4 Table D10.5.5.2.2-1

Chapter 6 Detailed Input Description
6-20
6.18.10 Layer 1 Undrained Shear Strength
This value is only applicable to clay foundations. The bearing capacity of clay foundations is similar to
that of c-phi soils. The Su value is substituted for all values of the cohesive strength (c) in the equations
of Chapter 3 with the friction angle inputted as 0.
Typical values of Su are in the range of 0.5 to 3.0 ksf.
6.18.12 Layer 1 Saturated Unit Weight / Density
Enter the saturated unit weight / density of the soil layer. This value must be greater than the mass (non-
saturated) unit weight /density of the soil.
𝛾𝑠𝑎𝑡 = 𝛾𝑑𝑟𝑦 + [𝑒
1 + 𝑒] 𝛾𝑤𝑎𝑡
Where:
γdry = mass (non-saturated) unit weight/density of soil
γwat = density of water, 62.5 lbs/ft3
γsat = saturated unit weight/density of soil
e = void ratio
The saturated unit weight / density can be calculated using the following equation if the void ratio is
known.
6.18.14 Layer 1 Poisson's Ratio
This input item is temporarily not used. The program computes elastic settlement using the elastic effects
of a Poisson's ratio of 0.5.
6.18.15 Layer 1 Cohesion
The cohesion value (c) of the soil must be specified for c-phi soils. Leave this parameter blank for clays
and sands. The cohesion value of the soil is used in the bearing capacity computations. See Chapter 3
for further details.
Typical values of c are in the range of 1.0 to 3.0 ksf.
6.18.16 Layer 1 Effective Friction Angle
This value must be specified for c-phi soils and sands.

Chapter 6 Detailed Input Description
6-21
Typical values of soil friction angles are in the range of 20 to 40 degrees.
6.18.17 Layer 1 Ncq
This is a bearing capacity factor for footings on or near a slope. See description of Footing Near Slope
Section 6.18.3.
Typical values are in the range of 2 to 6.
6.18.18 Layer 1 Nq
This is a bearing capacity factor for footing on or near a slope. See description of Footing Near Slope
Section 6.18.3.
Typical values are in the range of 15 to 60.
6.18.20 Layer 2 Undrained Shear Strength
See Section 6.18.10.
6.18.22 Layer 2 Saturated Unit Weight / Density
See Section 6.18.12.
6.18.24 Layer 2 Poisson's Ratio
See Section 6.18.14.
6.18.25 Layer 2 Cohesion
See Section 6.18.15.
6.18.26 Layer 2 Effective Friction Angle
See Section 6.18.16.
6.18.27 Layer 2 Ncq
See Section 6.18.17.

Chapter 6 Detailed Input Description
6-22
6.18.28 Layer 2 Nq
See Section 6.18.18.
6.18.29 Apply Inclination Factors
The inclination factors are used when computing the bearing resistance to account for a resultant force
formed by shear and axial load components from a wall or column applied to a footing. AC10.6.3.1.2
states that using inclination factors in conjunction with shape factors can result in overly-conservative
bearing capacities. The inclination factors were originally developed without consideration of footing
embedment. When footings with an embedment of Df/B = 1 or greater, the effects of inclination on bearing
resistance is relatively small. As such, this input allows the user to determine whether to apply inclination
factors.
The program defaults to Y for inclusion of the inclination factors.
6.18.30 Precast or Cast-in-Place
This value is used to specify whether the footing is precast (with a smooth base) or concrete cast against
soil (with a rough footing base). This parameter is applicable only for structures with spread footings on
Sand or Clayey-Sandy “C-Phi” soils. If precast is selected then a 0.8 factor is applied when computing the
nominal resistance for sliding between the soil and the foundation.
The program defaults to C for cast-in-place spread footings.
6.19 RCK - ROCK DATA COMMAND
Rock foundations must be specified for pedestal footings and may be described for spread footings. Rock
foundations may not be specified for pile footings.
Only one rock layer may be specified. The material below the rock layer is assumed to be very stiff. RCK and
SOI commands are mutually exclusive.
6.19.1 Empirical Bearing Capacity
The program does not calculate the capacity of rock foundations; this value must be specified. Refer to
DM-4 Section 10.6.3.2 for a detailed description of evaluating the rock bearing capacity.
Chapter 6 Detailed Input Description
6-23
Typical values of allowable bearing capacity of rock are in the range to 4 to 40 ksf.
6.19.4 Sliding Resistance
The user has the option of checking the sliding between the spread footing and rock foundation. If the
value of this parameter is N, the sliding phi factor (parameter 7) should be left blank. Per DM-4 10.6.3.4,
failure by sliding shall be investigated for footings that support inclined loads and/or are found on slopes.
Please note that this does not apply to the sliding check of footings on pedestals. Footings on pedestals
have special considerations as described in Chapter 3.
6.19.5 Allowable Settlement
The computed settlement is compared to the value of this parameter. For a rock foundation, only the
elastic settlement is considered. The temporary stage settlement is reported but not deducted from the
total settlement. The allowable settlement should be selected using engineering judgment. The total
allowable settlement may or may not include the temporary stage settlement. The maximum allowable
settlement is 1.0 inch. Typically, settlement in rock is between 0 and 0.5 inch.
Temporary Stage Settlement:
This refers to the settlement, which occurs during the substructure construction. The user may want to
know the temporary stage settlement to decide whether to include this in the amount of tolerable
settlement for the structure.
The program calculates temporary stage settlement using the “Consolidation, Secondary Settlement”
Load Combination without any superstructure loads or live loads.
6.19.6 Bearing Capacity Phi Factor
The value of this parameter is applied to the unfactored bearing resistance of the rock foundation to
evaluate the factored bearing resistance. The factored bearing resistance is compared to the applied
factored loads.
Typical values are 0.35 to 0.55.

Chapter 6 Detailed Input Description
6-24
6.19.7 Sliding Phi Factor
The value of this parameter is applied to the unfactored sliding resistance of the rock foundation to
evaluate the factored sliding resistance. The factored sliding resistance is compared to the applied
factored horizontal loads.
Typical values are 0.8 to 0.85.
6.19.9 Concrete / Rock Friction
This value is used to evaluate the sliding capacity of the footing as described in Section 3.4.1.2.1.
This value represents the friction angle between the base of the concrete footing and the underlying rock
foundation material. For mass concrete cast directly on various materials, AASHTO Table 3.11.5.3-1 is
often used. This table provides an angle of friction for concrete on clean sound rock of 35 degrees. The
values to be used should be provided as part of the geotechnical reccomendations for design of the
foundation.
Typical values are in the range of 30 deg to 45 deg.
6.19.10 Intact Rock Modulus
This value is used to calculate the rock modulus used in the elastic settlement of rock equations as
described in Section 3.4.1.3.1. The intact modulus of rock is determined though unilateral compression
testing of rock material.

Chapter 6 Detailed Input Description
6-25
6.20 CNS - CONSOLIDATION SETTLEMENT COMMAND
This command should only be specified for clay and c-phi soils (see SOI command 5.18). It is used to describe
the data that will evaluate the consolidation and secondary settlement.
Consolidation Settlement is calculated for clay soils when water is present in the soil layer(s). This settlement is a
result of the excess water being forced out of the layer, allowing the soil to increase in density. The program,
however, always assumes the soil layer(s) are saturated and will consider the entire layer for consolidation
regardless of water presence.
Program Limitation
As currently configured, the program only computes settlement from the loads imposed by the spread footing. It
is possible to manipulate the inputs for each layer to get the program to compute settlement due to the weight of
fill placed beneath the footing. However, the program does not account for settlement produced by the weight of
fill placed behind the footing to the top of the wall. In many cases, settlement induced by the wall backfill or
weight of the bridge approach embankment (See Figure 6.20-1) contributes significantly to the settlement of the
wall or abutment (and of course to settlement of the embankment itself). If consideration of the effects of adjacent
fills is important, the settlement must be computed by hand.
Structural Fill
Finished Grade
Embankment
Effective
Footing Load
Point of Interest
Equivalent
Line Loads
Representing
Embankment
Load
Existing
Grade
v
v =
v FOOTING +
v LINE LOADS
Figure 6.20 -1 Embankment Effects on Settlement
6.20.1 Number of soil layers
The number of soil layers must match the number of soil layers specified in the SOI command. A
maximum of 2 layers is allowed.

Chapter 6 Detailed Input Description
6-26
6.20.2 Void Ratio
The void ratio is the ratio of the volume of voids to the volume of solids. Void ratios are based on test
data.
Typical values are in the range of 0.4 to 1.5.
6.20.3 Compression Index
Input should be based on test data and based on the void ratio definition.
Typical values of compression index are 0.1 to 0.4. If the compression index and re-compression index
are set to 0.0, consolidation settlement will not be computed for this layer.
6.20.4 Re-compression Index
Input should be based on test data and based on the void ratio definition.
Typical values of Re-compression index are 0.01 to 0.04. If the compression index and re-compression
index are set to 0.0, consolidation settlement will not be computed for this layer.
6.20.5 Secondary Compression Index
Input should be based on test data and be based on the strain definition.
Typical values of secondary compression index are in the range of 0.001 to 0.002
6.20.6 Initial Effective Stress
Typical values are in the range of 0.07 ksi to 0.28 ksi.
If the value of this parameter is greater than the maximum past effective stress, the soil is considered
under consolidated. The program will not compute settlement for this condition. Hand calculations must
be performed and then approved by the Chief Bridge Engineer. See Section 3.4.1.3.2.
In most cases, the initial effective stress at the top of layer 1 will be zero and the initial effective stress at
the top of layer 2 is the effective stress at the bottom of layer 1. This can be calculated as:
'01 = 0
'02 = '01 + H11 - Hw1 w

Chapter 6 Detailed Input Description
6-27
Where Hw1 is the height of water above the bottom of layer 1 and cannot exceed the height of layer 1. If
the water level is below the bottom of layer 1, then Hw1 = 0.
Refer to the figures below for definition of the remaining variables
Excavation per RC-12
Original Grade
H0
H1
H2
Hw0
Hw1
Hw2
Layer 1
Layer 2
Original Ground Above
Footing Elevation
Limit of structural fill per RC-12
Original Grade
H1
H2
Hw1 = 0
Hw2
Layer 1 (Embankment Fill)
Layer 2
Original Ground Below
Footing Elevation
Figure 6.20.6 -1 Initial Effective Stress
There are two special cases in which the above does not apply. These are discussed in more detail
below:
Special Case 1: Footing Excavated below grade, short construction period
This case occurs when excavation is performed below original grade to reach footing elevation and the
time between excavation and establishment of final footing load is short enough so that equalization of
pore pressure due to loss of overburden stress does not occur. This would be the case if the clay layer
has very low permeability or if construction is very rapid. Equalization of pore pressure under rebound
conditions is usually fairly rapid. Evaluation of void ratio vs. time relationships during the rebound portion
of a consolidation test can help determine if this will be the case. For this case, the initial effective stress
would be that which existed prior to excavation or:
'01 = H0 0 - Hwo w
'02 = '01 + H1 1 - Hw1 w
Refer to the left half of the figures above for explanation of the variables.
Note that there are some instances when '02 cannot be calculated as indicated above. Such a case
might include the case of a deep shored excavation where the first layer might have reached equilibrium

Chapter 6 Detailed Input Description
6-28
due to the stress relief of the excavation but deeper layers either have not equalized or do not see the full
effect of removing a small block of overburden material near the surface.
Special Case 2: Embankment fill placed to raise grade to footing elevation, excess pore pressure
in original ground not allowed to dissipate prior to construction of footing.
In this case the computed primary settlement would include the settlement induced in the original soil by
the weight of the embankment fill placed above it plus the settlement due to the weight of the structure.
Note that if the embankment is not saturated, it will not undergo primary consolidation and Ccr , Cc for
layer 1 should be set to zero to reflect this. In this case, the initial effective stress at the top of the first
and the second layer is set to zero.
'01 = 0
'02 = 0
6.20.7 Maximum Past Effective Stress
Typical values are in the range of 0.28 ksi to 0.7 ksi.
Case 1 Normally consolidated soil
By definition, a normally consolidated soil is one where the initial effective stress is equal to the maximum
past effective stress. Thus, to specify a pure normally consolidated case, preconsolidation pressure is set
equal to the initial pressure at the top and bottom of the layer. This would mean:
'p1 TOP = '01
'p1 BOTTOM = 'p2 TOP = '02
'p2 BOTTOM = '02 + H2 2 - Hw2 w
Layer 1
Layer 2
H1
H2 Hw2
Limit of structural fill Per RC-12
Hw1 = 0
STRESS
DEPTH
p1 TOP = 01 = 0
p1 BOTTOM = p2 TOP = 02
p2 BOTTOM = 02 + H2 2 - Hw2 w
Figure 6.20.7-1 Case 1 - Normal Consolidation

Chapter 6 Detailed Input Description
6-29
Note that if the water table occurs in the middle of a layer, an under consolidated condition will be
detected and the program print a warning message (see figure below). To resolve this, the individual
layer thickness should be selected such that the water elevation is coincident with one of the layer
boundaries as shown above.
Layer 1
Layer 2
H1
H2 Hw2
Limit of structural fill Per RC-12
Hw1
STRESS
DEPTH
'0
'p
Under-consolidated
Figure 6.20.7-2 Case 1 - Underconsolidation
Case 2 Soil Overconsolidated due to Past Regional Stress
This could be due to regional glaciation, erosion of overlying soil and rock layers (the case for most
residual soils), regional ground water fluctuations, excavation of a large area to reach proposed grade, or
other reasons. This type of overconsolidation tends to produce a preconsolidation pressure that is higher
than the existing stress by a constant value with respect to depth. To specify this condition, the user
would first compute the initial effective stress at the top of each layer and at the bottom of the second
layer. The constant value of stress that represents the regional stress that has been since removed
would then be added to each of the initial effective stress values and specified as p1 TOP, p1 BOTTOM, p2
TOP, p2 BOTTOM in the program. This would be calculated as:
'p1 TOP = '01 + R
'p1 BOTTOM = 'p2 TOP = '02 + R
'p2 BOTTOM = '02 + H2 2 - Hw2 w + R
Where R = the past regional stress
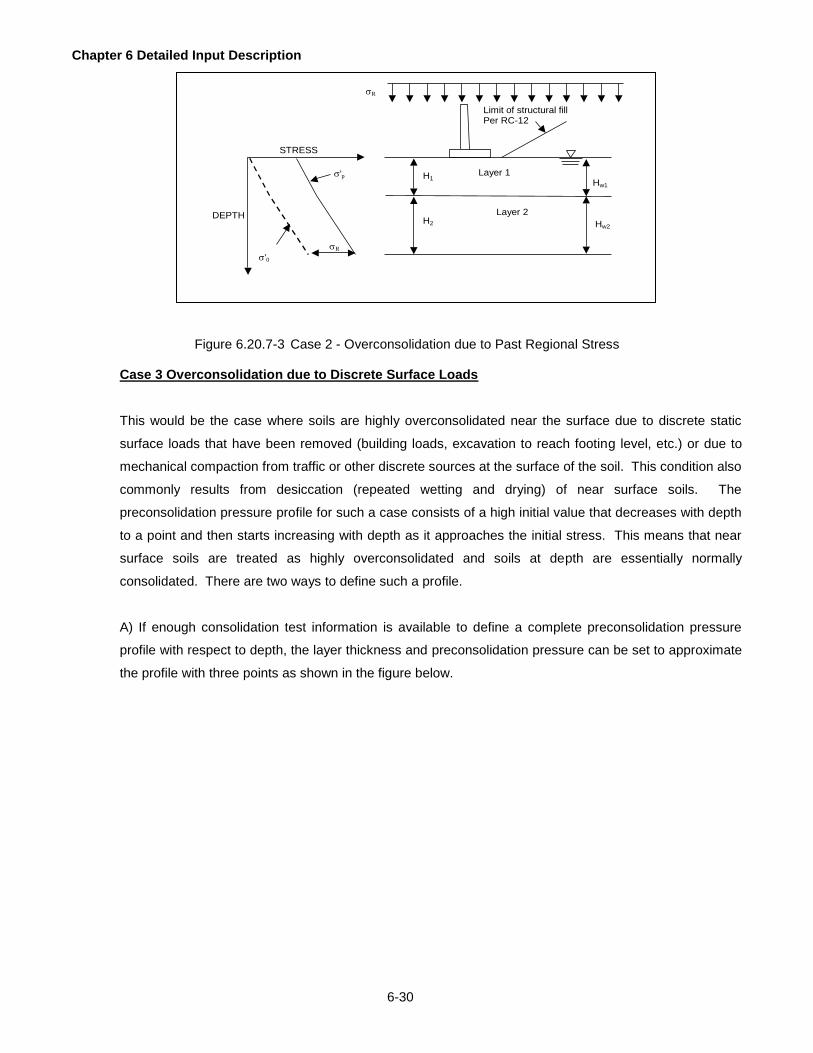
Chapter 6 Detailed Input Description
6-30
Layer 1
Layer 2
H1
H2 Hw2
Limit of structural fill Per RC-12
Hw1
STRESS
DEPTH
'0
'p
R
R
Figure 6.20.7-3 Case 2 - Overconsolidation due to Past Regional Stress
Case 3 Overconsolidation due to Discrete Surface Loads
This would be the case where soils are highly overconsolidated near the surface due to discrete static
surface loads that have been removed (building loads, excavation to reach footing level, etc.) or due to
mechanical compaction from traffic or other discrete sources at the surface of the soil. This condition also
commonly results from desiccation (repeated wetting and drying) of near surface soils. The
preconsolidation pressure profile for such a case consists of a high initial value that decreases with depth
to a point and then starts increasing with depth as it approaches the initial stress. This means that near
surface soils are treated as highly overconsolidated and soils at depth are essentially normally
consolidated. There are two ways to define such a profile.
A) If enough consolidation test information is available to define a complete preconsolidation pressure
profile with respect to depth, the layer thickness and preconsolidation pressure can be set to approximate
the profile with three points as shown in the figure below.

Chapter 6 Detailed Input Description
6-31
Layer 1
Layer 2
H1
H2 Hw2
Limit of structural fill Per RC-12
Hw1
STRESS
DEPTH
'0
'p
'p From consolidation tests
'p1 TOP
'p1 BOTTOM = 'p2 TOP
'p2 BOTTOM
Figure 6.20.7-4 Case 3 - Overconsolidation due to Discrete Surface Loads-A
B) If the magnitude, location and extent of the discrete load that caused the overconsolidation is known
(such as in the case of a soil surcharge placed to preconsolidate the foundation soils or the case of
excavation of a discrete block of soil to reach foundation elevation), the stress increase with respect to
depth due to that load can be computed by various forms of the Bousinesq equation and added to the
initial stress. This presumes that the soil was fully consolidated under the applied load. The resulting
preconsolidation stress profile can then be approximated by three points as described above. An
example of this is provided below.
Layer 1
Theoretical preconsolidation pressure
H1
H2 Hw2
Hw1
STRESS
DEPTH '0
Approximated 'p
S
S
Computed stress due to discrete load
Previous discrete load
’p1 TOP
’p1 BOTTOM =
p2 TOP
’p2 BOTTOM
Figure 6.20.7-5 Case 3 - Overconsolidation due to Discrete Surface Loads-B

Chapter 6 Detailed Input Description
6-32
Case 4 Soil overconsolidated due to mechanical compaction of the soil
This would be the rare case in which the soil has been mechanically densified by some means. Such a
case would be a compacted embankment that has since become saturated or a soil that has been subject
to in-situ densification techniques. For these soils, the preconsolidation pressure is relatively constant
with depth and is a function of the amount of energy that was used to densify the soil. This would be
specified by setting
'p1 TOP, 'p1 BOTTOM, 'p2 TOP, and 'p2 BOTTOM to a constant value.
'p1 TOP = M
'p1 BOTTOM = M
'p2 TOP = M
'p2 BOTTOM = M
Where M = the amount of preconsolidation achieved by mechanical means.
Layer 1 H1
H2 Hw2
Hw1
STRESS
DEPTH
'0
'p
M
'p1 TOP
'p1 BOTTOM =
'p2 TOP
p2 BOTTOM
Layer 2
Figure 6.20.7-6 Case 4 - Overconsolidated due to Mechanical Compaction of the soil
Note: At some depth the existing stress will exceed the constant value of prestress and the soil will
consolidate under its own weight to a normally consolidated state. The program will detect this as an
underconsolidated condition and print a warning message.
Case 5 Underconsolidated soil )''( op
The ABLRFD program does not consider settlement for Under-Consolidated soil. If Under-consolidation is
encountered, the input file should be checked for errors. Hand calculations are required along with
approval from the Chief Bridge Engineer. If Under-Consolidation is detected during a design run, a
Chapter 6 Detailed Input Description
6-33
warning will be issued and primary consolidation settlement will be calculated assuming a normal
consolidation condition.
6.20.8 Primary Consolidation Time
This value is based on consolation test data.
Typical values are 0.5 to 3.0 years.
6.20.9 Service Life
Depends on the type of structure. Usually 5 to 10 years is used for the computation of secondary
compression, although theoretically it goes forever.
6.21 MRD - MISCELLANEOUS REINFORCEMENT DATA COMMAND
6.21.1 Aggregate Size
The aggregate size is used to check the minimum acceptable spacing between bars that are used for
flexural reinforcement.
6.21.2 Development Correction Factor
The development correction factor input parameter is used to account for development length correction
factors that are not currently considered by the program. Development length correction factors that are
considered by the program are described in Section 3.5.2.3. This factor is applied to all reinforcement in
all components. As such, multiple runs may be required to accurately apply a factor to the correct
component.
The factor is applied in the calculations for the development length as described in Section 3.5.2.3.
6.21.3 Backwall Exposure
The exposure is used in the serviceability check. The allowable spacing for the crack control check
depends on the exposure. The allowable spacing under Class 1 is greater than the allowable spacing
under Class 2. This parameter will determine the Z value to be used to determine the allowable stress.
Please refer to Section 3.5.2.8 for further details.

Chapter 6 Detailed Input Description
6-34
6.21.4 Stem Exposure
See 6.21.3
6.21.5 Footing Exposure
See 6.21.3
6.23 SPD - REINFORCEMENT DESIGN COMMAND
6.23.5 User Requested Minimum Bar Spacing & 6.23.6 Bar Spacing Increment
The User Requested Minimum Bar Spacing and the Bar Spacing Increment are used to control what bar
spacings are allowable during a design run. The following table shows how different combinations of
these two parameters will affect bar spacing during design runs.
User Requested Minimum Bar
Spacing (in.)
Bar Spacing Increment
(in.)
Resulting Bar Spacings (in.)
6.0 3.0 6, 9, 12, 15, 18
6.0 2.0 6, 8, 10, 12, 14, 16, 18
2.5 3.0 2.5, 5.5, 8.5, 11.5, 14.5, 17.5
4.0 5.0 4, 9, 14
Because the maximum allowable spacing permitted by DM-4 is 18 in, the spacings computed by the
program are limited to 18 in or less.
6.24 BAR - BAR SIZE COMMAND
Valid US bar sizes are 4, 5, 6, 7, 8, 9, 10, 11, 14 and 18.

Chapter 6 Detailed Input Description
6-35
6.27 SRA - STEM REINFORCEMENT AREAS COMMAND
Figure 1 is an illustrated example of how the stem rebar layout is described in terms of the SRA command syntax.
Figure 6.27-1 SRA Example
Description:
* #8 @ 12" spacing at 0" offset (by definition) has 7' length
* #5 @ 12" spacing at 6" offset (relative to #8) has 4' length
SRA Input:
#8 -- Area of bar = 0.79 in2; Diameter of bar = 1.0 in.
#5 -- Area of bar = 0.31 in2; Diameter of bar = 0.625 in.
From footing top to 4' - Total area per unit width is 1.10 in2 (#8 + #5)
From 4' to 7' - Total area per unit width is 0.79 in2 (#5)
Consequently: SRA 1.10, 4, 1.0, 0.79, 4, 1.0
(Equivalent SRB Command syntax: SRB 8, 12., ,7., 5, 12., 6., 4. )
footing6"
stem
footing
4'
7'
#8
#5
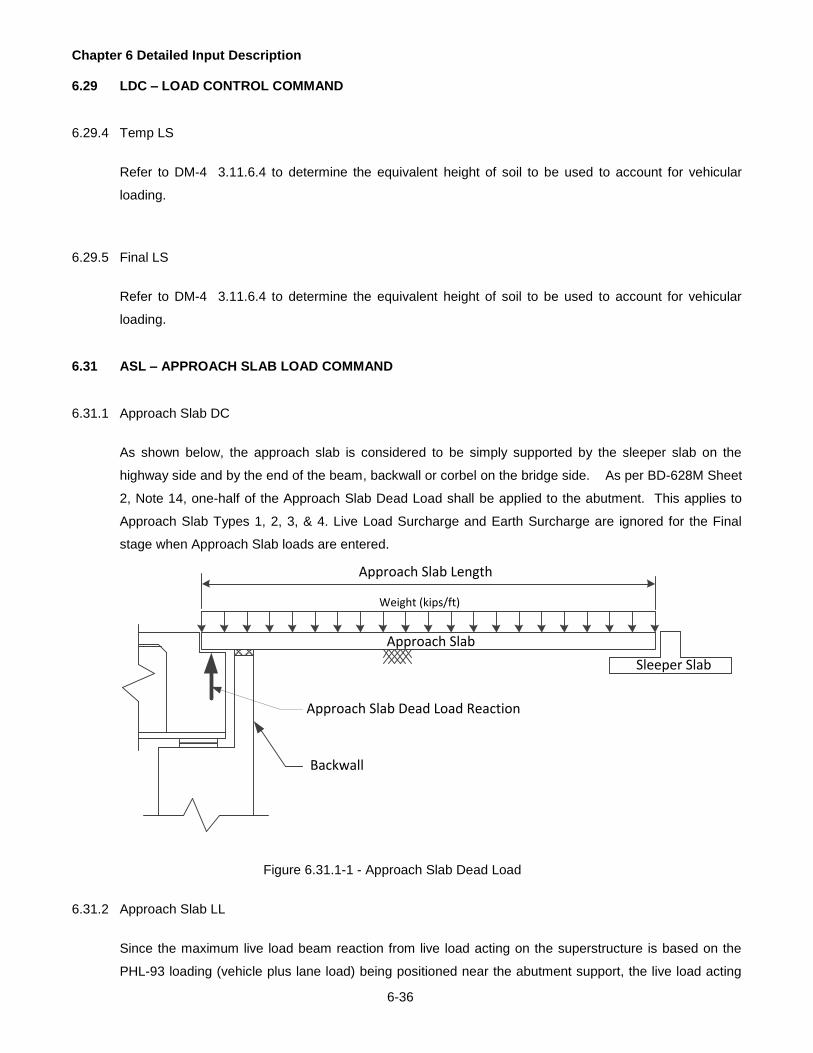
Chapter 6 Detailed Input Description
6-36
6.29 LDC – LOAD CONTROL COMMAND
6.29.4 Temp LS
Refer to DM-4 3.11.6.4 to determine the equivalent height of soil to be used to account for vehicular
loading.
6.29.5 Final LS
Refer to DM-4 3.11.6.4 to determine the equivalent height of soil to be used to account for vehicular
loading.
6.31 ASL – APPROACH SLAB LOAD COMMAND
6.31.1 Approach Slab DC
As shown below, the approach slab is considered to be simply supported by the sleeper slab on the
highway side and by the end of the beam, backwall or corbel on the bridge side. As per BD-628M Sheet
2, Note 14, one-half of the Approach Slab Dead Load shall be applied to the abutment. This applies to
Approach Slab Types 1, 2, 3, & 4. Live Load Surcharge and Earth Surcharge are ignored for the Final
stage when Approach Slab loads are entered.
Approach Slab Length
Weight (kips/ft)
Approach Slab
Sleeper Slab
Backwall
Approach Slab Dead Load Reaction
Figure 6.31.1-1 - Approach Slab Dead Load
6.31.2 Approach Slab LL
Since the maximum live load beam reaction from live load acting on the superstructure is based on the
PHL-93 loading (vehicle plus lane load) being positioned near the abutment support, the live load acting

Chapter 6 Detailed Input Description
6-37
on the approach slab shall consist of the lane load only (0.64 kips/ft). As shown below, the approach slab
is considered to be simply supported by the sleeper slab on the highway side and by the end of the beam,
backwall or corbel on the bridge side. As per BD-628M Sheet 2, Note 14, one-half of the Approach Slab
Live Load shall be applied to the abutment. This applies to Approach Slab Types 1, 2, 3, & 4. Live Load
Surcharge and Earth Surcharge are ignored for the Final stage when Approach Slab loads are entered.
Approach Slab Length
0.64 (kips/ft)
Approach Slab
Sleeper Slab
Backwall
Approach Slab Live Load Reaction
Figure 6.31.2-1 - Approach Slab Live Load

Chapter 6 Detailed Input Description
6-38
6.32 LRT – LOADS ON RETAINING WALL COMMAND
6.32.2 Y Distance to CT
The Y distance to the collision force is applicable to locations above and below the top of the stem. When
the Y distance is negative in relation to the top of the stem, the program will ensure that the entered value
does not extend below the Exposed stem Height behind the stem as defined on the RWL command.
Figure 6.31-1 depicts a retaining wall scenario where the collision force would be applied to the stem and
is based on Standard Drawing BD-679.
CT force applied below top
of stem
Negative Y
distance to CT
forceExposed Stem
Height
Figure 6.32-1 Y Distance to CT
6.35 EQL - EARTHQUAKE LOADS COMMAND
The earthquake loads applied to the abutment emanate from three sources: the abutment mass-inertia effect; the
inertia effect of the soil; and, the forces transmitted from the superstructure.
It is typically acceptable to ignore the mass-inertia effect of the abutment (assuming that it is not important). This
effect is ignored in ABLRFD.

Chapter 6 Detailed Input Description
6-39
6.35.1 Response Modification
Please refer to Section 3.10.7 of the LRFD specifications for information concerning the value of the
response modification factor.
The modification factor will be applied to the soil (horizontal and vertical) pressure and superstructure
force (see Section 6.34.5), i.e., the earthquake loads are divided by the response modification factor.
6.35.2 Soil Pressure Factor
The inertia effect of the soil is also assumed to be unimportant in most cases. If considered, it is common
to include this effect as an increased horizontal static pressure from the soil. If it is determined that this
effect needs to be included, its magnitude should be determined by a geotechnical engineer.
The soil pressure factor is applied to the horizontal and vertical components of the soil pressure loads.
The user has the option of including or neglecting the vertical component (see 6.34.4).
6.35.3 Phi Factor Foundation
This parameter is interpreted as follows:
For Spread and Pedestal Footing Problems: It is the bearing resistance reduction factor for the
EXTREME-I limit state only. The acceptable range of values is from 0. to 1.0.
For Pile and Caisson Footing Problems: This factor is applied to the strength (axial and lateral) of the
pile/caisson. The axial and lateral capacity of the pile/caisson is specified in the PIL/CAI command.
Typical values range from 1.0 to 2.0.
6.35.5 Horizontal Superstructure Force
The superstructure effects should be determined from a seismic analysis of the bridge. Such an analysis
is independent of ABLRFD. The superstructure force in the longitudinal direction of the bridge is specified
here. ABLRFD will apply this force as a static horizontal force in the direction “away from the
embankment”, at the superstructure elevation location. This value cannot be specified for retaining walls.
6.35.6 Horizontal External Structure Force
The external structure effects should be determined from a seismic analysis of the structure atop the
retaining wall. Such an analysis is independent of ABLRFD. The external structure force in the
perpendicular direction of the retaining wall is specified here. ABLRFD will apply this force as a static

Chapter 6 Detailed Input Description
6-40
horizontal force in the direction “away from the embankment”, at the top of the stem. This value cannot
be specified for abutments.
6.36 OIN - OUTPUT OF INPUT COMMAND
This command is used to specify reports that are variations of the input data. The table below identifies the
output tables that are associated with each parameter. The defaults for the type of run (analysis and design) are
also shown; 0 indicates that the table is not reported.
PARAMETER
OUTPUT TABLES INCLUDED
DEFAULTS ANALYSIS
RUN
DESIGN
RUN
Input File Echo
Input File Echo - Applicable to all footing and structure types
0
0
Input Commands
Input Data for each command - Applicable to all footing and structure types
0
0
Input Summary
Input Data Summary- Applicable to all footing and structure types
1
1

Chapter 6 Detailed Input Description
6-41
6.37 OUR - OUTPUT OF RESULTS COMMAND
This command is used to specify reports of the results. The table below identifies the output tables that are
associated with each parameter. The defaults for the type of run (analysis and design) are also shown; 0
indicates that the table is not reported.
PARAMETER
OUTPUT TABLES INCLUDED
DEFAULTS
ANALYSIS
RUN
DESIGN
RUN
Footing Geometry
Pedestal / Pile or Caisson/ Spread: Footing Thickness, Width, Projections Pedestal: Pedestal Thickness, Width, Offsets, Projections
1
1
Output Legend
Abbreviation used in output - Applicable to all footing and structure types
1
1
Factored Forces
Pedestal / Pile or Caisson/ Spread: Backwall forces (if applicable) - axial and moment Stem Forces at Critical Points - axial and moment Footing - shear and moment (internal toe & heel locations) Foundation - vertical and horizontal components of forces and
moments (taken about toe). Pedestal Forces - shear and moment (unique to Pedestal Ftg)
1
1
Footing Stability
Pedestal: Bearing; Sliding; Settlement; and, Overturning. Pile or Caisson: Pile Pattern Data; Axial Forces; and, Lateral Forces Spread: Bearing; Sliding; Settlement; and, Overturning.
1
1
Footing Controlling Forces
Pedestal: Parallel (top/bot) Shear and Moments Pile or Caisson: Toe/Heel and Parallel (top/bot) Shear and Moments Spread: Toe/ Heel Shear and Moments
1
1
Footing Flexure
Controlling Load Combination, Applied Moment, Moment Resistance, and Performance Ratio reported at the following footing locations: Pedestal: Parallel (top and bot) Pile or Caisson: Parallel (top / bottom) and Perpendicular (toe / heel) Spread: Perpendicular (toe / heel)
1
1
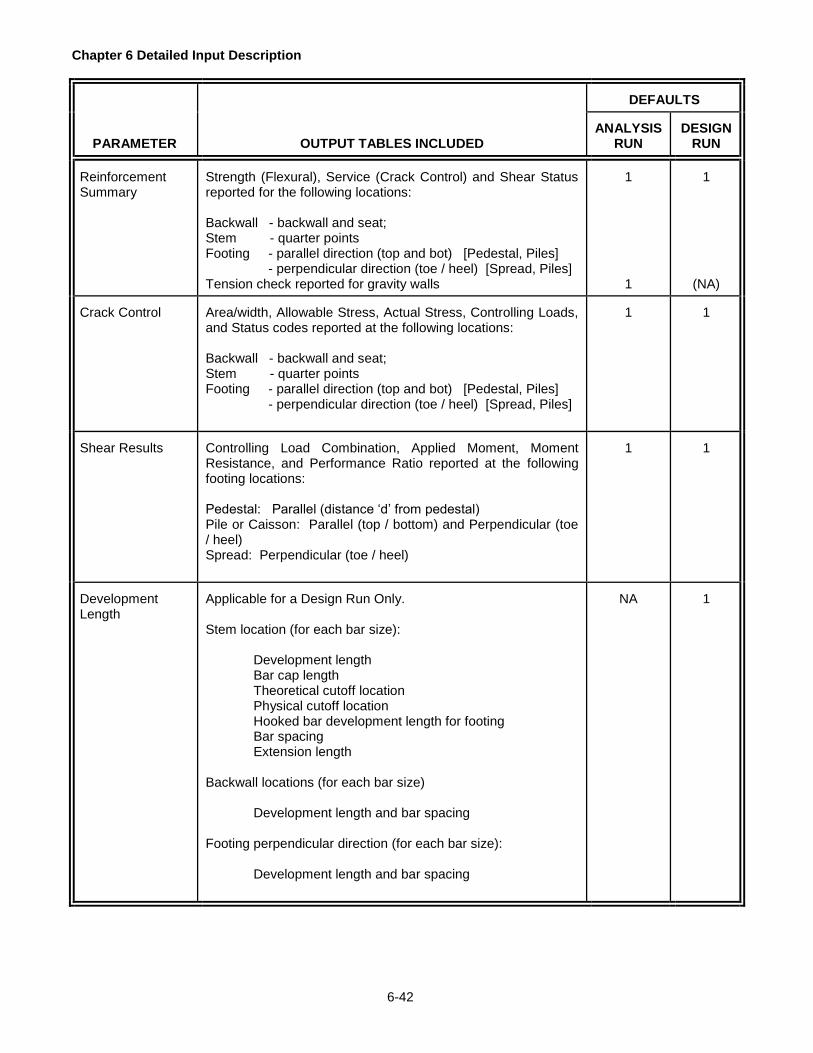
Chapter 6 Detailed Input Description
6-42
PARAMETER
OUTPUT TABLES INCLUDED
DEFAULTS
ANALYSIS
RUN
DESIGN
RUN
Reinforcement Summary
Strength (Flexural), Service (Crack Control) and Shear Status reported for the following locations: Backwall - backwall and seat; Stem - quarter points Footing - parallel direction (top and bot) [Pedestal, Piles] - perpendicular direction (toe / heel) [Spread, Piles] Tension check reported for gravity walls
1 1
1
(NA) Crack Control
Area/width, Allowable Stress, Actual Stress, Controlling Loads, and Status codes reported at the following locations: Backwall - backwall and seat; Stem - quarter points Footing - parallel direction (top and bot) [Pedestal, Piles] - perpendicular direction (toe / heel) [Spread, Piles]
1
1
Shear Results
Controlling Load Combination, Applied Moment, Moment Resistance, and Performance Ratio reported at the following footing locations: Pedestal: Parallel (distance ‘d’ from pedestal) Pile or Caisson: Parallel (top / bottom) and Perpendicular (toe / heel) Spread: Perpendicular (toe / heel)
1
1
Development Length
Applicable for a Design Run Only. Stem location (for each bar size):
Development length Bar cap length Theoretical cutoff location Physical cutoff location Hooked bar development length for footing Bar spacing Extension length
Backwall locations (for each bar size)
Development length and bar spacing Footing perpendicular direction (for each bar size):
Development length and bar spacing
NA
1

Chapter 6 Detailed Input Description
6-43
6.38 OUI - OUTPUT OF INTERMEDIATE DATA COMMAND
This command is used to specify reports of data that were used to generate the final results (data listed in the
tables that were identified in section 6.36). The table below identifies the output tables that are associated with
each parameter. The defaults for the type of run (analysis and design) are also shown; 0 indicates that the table
is not reported.
PARAMETER
OUTPUT TABLES INCLUDED
DEFAULTS
ANALYSIS
RUN
DESIGN
RUN
Unfactored Forces
Forces and Moments for each load case (vertical and horizontal components // temporary and final construction stages) evaluated at the: foundation, backwall (if applicable) and stem locations. Pile or Caisson Footings: Vertical and Lateral Pile forces.
0
0
Load Factors
Load Factor and Eta factor reported for each limit state combination for each load case (vertical and horizontal component) applicable.
0
0
Moment / Axial Interaction
Applied Moment and Axial loads, Moment and Axial Resistance and the corresponding performance ratio is reported for each load combination.
1
1
Internal Footing Forces
Internal shear and moment for each load case (temporary and final construction stage) evaluated at the toe and heel locations of the Pile and Spread footings only.
0
0
Intermediate Bearing Resistance Values
Intermediate bearing resistance values for each load case (temporary and final construction stage) for Soil foundation runs only.
0
0
Detailed Stem Cutoff Values
Loads at the cutoff location for each bar for each load case on the Factored Forces Table and the Moment Axial Interaction Table. The cutoff loads will only be displayed if the associated table is select for display in the output
0
0
Minimum Reinforcement Check Values
Minimum reinforcement calculation values for backall, stem and footing locations.
1
N/A

Chapter 6 Detailed Input Description
6-44
This page intentionally left blank.

7-1
7 OUTPUT DESCRIPTION
This chapter describes the reports that are generated by the program. Section 7.1 addresses the general
information about the output. The cover page is described in section 7.2. Sections 7.3, 7.4 and 7.5 describe the
reports associated with the OIN (section 5.35), OUR (section 5.36), and OUI (section 5.37) commands
respectively. Section 7.6 contains the formats for all of the tables used by the program. The chapter concludes
with some remarks about the error reporting in section 7.7.
The reports are output in the following order (section identified in parenthesis): Input Summary (7.3); Footing
Additional Information (7.4.1); Pile Pattern (7.4.2); Output Legend (7.4.3); Unfactored Loads (7.5.1); Load Factors
(7.5.2); Factored Forces (7.4.4); Footing Stability (7.4.5); Internal Footing Forces (7.5.5); Controlling Footing
Forces (7.4.6); Moment/Axial Interaction (7.5.4); Footing Flexure (7.4.7); Crack Control (7.4.8); Reinforcement
Summary (7.4.9); Shear Results (7.4.10); Reinforcement Design Details (7.4.11); and, Optimum Design Details
(7.4.12).
7.1 GENERAL OUTPUT INFORMATION
Information is provided for describing output table controls, page format, page numbering, and page header. In
general, the page format is built into the program and can not be changed by the user for either the .OUT output
file or the .PDF output file. The one exception is that the user can specify the number of blank lines to be printed
at the top of each page before the page header is printed. This formatting change will be reflected in both the
.OUT and .PDF output files accordingly.
7.1.1 Output Table Controls
The output table controls are specified using a number of input commands and parameters to control the
output reports to be printed. The commands and their defaults are discussed in Section 6.35 through
6.37.
7.1.2 Page Format
There is a maximum of 102 columns in the output file. Columns 1,2,3, and 4 have been left blank to
provide a margin on the left side of the page. This has been done to make the output file less dependent
on the output device capabilities. The output is therefore limited to 98 characters; column 5 through 102

Chapter 7 Output Description
7-2
inclusive. The user can specify the number of lines to be left blank at the top of the page with the CFG
command.
7.1.3 Page Numbering
The program assigns page numbers and determines when a new page should begin.
7.1.4 Page Header
The header information is printed for all pages except for the cover page. The header is shown in Figure
1.
The following items are identified in the header:
1. Program Name, Version Number - located at the top left hand corner of the header;
2. Page Number - located on the top right hand corner of the header;
3. Input file - the name and path of the directory of the data file used to create this output is shown
on the left side of the second line;
4. Date and Time - the date and time when the program was executed is displayed on the right side
of the second line.
5. A separator line is printed between program specific header information and the user specified
header information.
6. The next header line contains the first title line input by the user via the TTL command. The title
should be a general descriptive line used to describe the problem to be run.
7. The next header line identifies the type of output that is being displayed; and,
8. The final header line is a separator line.
***************************************************************************
LRFD Abutment and Retaining Wall, Version 1.0a PAGE 2
Input File: EX11.IN 03/11/96 14:01
---------------------------------------------------------------------------
Example Problem 11 - Analysis of Abutment Type I on Pile Footing
ECHO OF INPUT FILE
Figure 7.1.4-1 Page Header
7.1.5 Units
For each value presented in the output, the corresponding units are identified. The units are displayed in
the column headings directly below the column description. Table 7.1-1 identifies the typical set of units
corresponding to the given variable type.
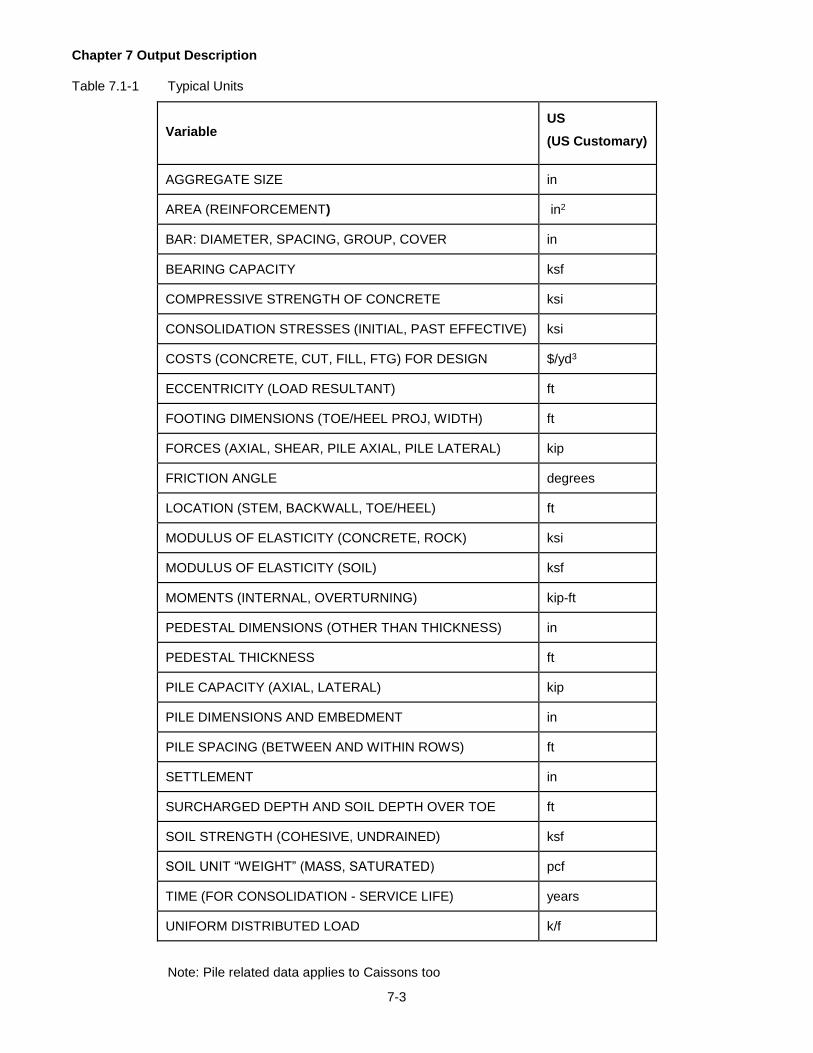
Chapter 7 Output Description
7-3
Table 7.1-1 Typical Units
Variable
US
(US Customary)
AGGREGATE SIZE in
AREA (REINFORCEMENT) in2
BAR: DIAMETER, SPACING, GROUP, COVER in
BEARING CAPACITY ksf
COMPRESSIVE STRENGTH OF CONCRETE ksi
CONSOLIDATION STRESSES (INITIAL, PAST EFFECTIVE) ksi
COSTS (CONCRETE, CUT, FILL, FTG) FOR DESIGN $/yd3
ECCENTRICITY (LOAD RESULTANT) ft
FOOTING DIMENSIONS (TOE/HEEL PROJ, WIDTH) ft
FORCES (AXIAL, SHEAR, PILE AXIAL, PILE LATERAL) kip
FRICTION ANGLE degrees
LOCATION (STEM, BACKWALL, TOE/HEEL) ft
MODULUS OF ELASTICITY (CONCRETE, ROCK) ksi
MODULUS OF ELASTICITY (SOIL) ksf
MOMENTS (INTERNAL, OVERTURNING) kip-ft
PEDESTAL DIMENSIONS (OTHER THAN THICKNESS) in
PEDESTAL THICKNESS ft
PILE CAPACITY (AXIAL, LATERAL) kip
PILE DIMENSIONS AND EMBEDMENT in
PILE SPACING (BETWEEN AND WITHIN ROWS) ft
SETTLEMENT in
SURCHARGED DEPTH AND SOIL DEPTH OVER TOE ft
SOIL STRENGTH (COHESIVE, UNDRAINED) ksf
SOIL UNIT “WEIGHT” (MASS, SATURATED) pcf
TIME (FOR CONSOLIDATION - SERVICE LIFE) years
UNIFORM DISTRIBUTED LOAD k/f
Note: Pile related data applies to Caissons too

Chapter 7 Output Description
7-4
7.1.6 Sign Conventions
Table 7.1-2 identifies the sign convention that is used by the program. Notes are also used to identify the
sign convention for some reports (see for example Figure 7.9-1; Internal footing forces at the toe).
Table 7.1-2 Sign Conventions
Variable
Sign Convention
MOMENT
Footing Internal: Causes tension on bottom face of footing
Overturning: Clockwise (toe on right and heel on the left of stem)
REACTION
Upward reaction is positive
LOAD
Downward, Left (toe on the right and heel on the left of stem)
SHEAR
In the Unfactored Loads Report (see Section 7.5.1), the sign convention
for shear is consistent with the sign convention for moment. In
Specification Checks (see Section 7.7) the absolute value of shear is
used.
DEFLECTION
A downward deflection is positive
FORCE
A force causing tension is positive
STRESS
Compressive

Chapter 7 Output Description
7-5
7.2 COVER PAGE
The first page of the output is the cover page. The cover page has three distinct regions. The following
information is identified at the top region of the cover page.
1. Program Title - LRFD Abutment and Retaining Wall.
2. Program Name – ABLRFD.
3. Version ii.nn - where ii represents the numeric designation for major revisions and enhancements to the
program and nn represents the numeric designation for minor revisions.
5. Date of Last Update - this is the date of the program was last revised.
6. Date of Corresponding Documentation - this is the date the User’s Manual was last revised.
7. License Number - this is a unique number assigned to all licensees per the License Agreement.
The second region is reserved for the first four lines of the TTL command specified by the user. This information
should be used to describe the bridge, location, stationing, span length and any other relevant information.
The copyright notice and disclaimer are displayed in the third region. This is the standard copyright notice and
warranty disclaimer that is printed by all PennDOT programs. Per the license agreement, any duplications,
alterations, or unauthorized use of these materials is strictly prohibited.

Chapter 7 Output Description
7-6
7.3 INPUT DATA
The input data may be reported in three formats identified as: an echo of the input file; input commands; and,
input summary tables. Each variation may be turned off -- please refer to the OIN command described in section
5.35, and the summary of output tables given in section 6.35.
7.3.1 Echo of Input Data
The echo of the input file is a listing of the input commands and comments that were specified by the
user. The user can refer to this section to trace input errors and warnings by comparing the input data to
the appropriate command syntax described in chapter 5.

Chapter 7 Output Description
7-7
***************************************************************************
* *
* Program Title LRFD Abutment and Retaining Wall *
* Program Name ABLRFD *
* Version 1.8.0.0 *
* Last Updated 12/12/2008 *
* Documentation 12/2008 *
* License No. 111111 *
* *
***************************************************************************
* *
* Example Problem 4 - Analysis of Abutment without Backwall on Pedestal *
* *
* This example corresponds to example problem 4 in the LFD program Menu *
* *
***************************************************************************
* *
* COPYRIGHT © 1998-2004 *
* COMMONWEALTH OF PENNSYLVANIA *
* DEPARTMENT OF TRANSPORTATION *
* *
* ALL RIGHTS RESERVED *
* *
* *
* DUPLICATION, ALTERATION, OR OTHER UNAUTHORIZED *
* USE OF THESE MATERIALS IS STRICTLY PROHIBITED. *
* *
* THE COMMONWEALTH EXCLUDES ANY AND ALL IMPLIED WARRANTIES, *
* INCLUDING WARRANTIES OF MERCHANTABILITY AND FITNESS FOR A *
* PARTICULAR PURPOSE, AND LIMITS THE USER'S REMEDY TO *
* RETURN OF THE SOFTWARE AND DOCUMENTATION TO THE COMMONWEALTH *
* FOR REPLACEMENT. *
* *
* THE COMMONWEALTH MAKES NO WARRANTY OR REPRESENTATION, EITHER *
* EXPRESS OR IMPLIED, WITH RESPECT TO THIS SOFTWARE OR *
* ACCOMPANYING DOCUMENTATION, INCLUDING THEIR QUALITY, *
* PERFORMANCE, MERCHANTABILITY, OR FITNESS FOR A PARTICULAR *
* PURPOSE. THIS SOFTWARE AND DOCUMENTATION ARE PROVIDED *
* "AS IS" AND THE USER ASSUMES THE ENTIRE RISK AS TO *
* THEIR QUALITY AND PERFORMANCE. *
* *
* THE COMMONWEALTH WILL NOT BE LIABLE FOR ANY DIRECT, INDIRECT, *
* SPECIAL, INCIDENTAL, OR CONSEQUENTIAL DAMAGES ARISING OUT *
* OF ANY DEFECT IN THE SOFTWARE OR ANY ACCOMPANYING DOCUMENTATION. *
* *
***************************************************************************
Figure 7.3.1-1 Cover Page

Chapter 7 Output Description
7-8
The input file may contain up to 256 characters in a single line. However, the output is limited to 102
characters per line. If the input consists of more than 102 characters, the characters will be wrapped to
the next row.
7.3.2 Input Commands
The input commands report includes a detailed description of each input parameter for each command
that was specified by the user. The report is formatted as a two column table. The left column of the
table identifies the input parameter for the command, and the right column identifies the value of the
parameter. A sample of this report is shown in Figure 1.
The following information is identified in the input command report:
1. Command Keyword.
2. Input Parameter description.
3. Value of the input parameter as entered or the default value. The value displayed has the same
number of significant digits as specified by the user or as stored in the input parameter file. Default
items are identified by the (default) symbol on the right side of the number. An asterisk (*) implies
that the input value is optional and that it was not entered.
4. Applicable units.
5. Any warnings or errors encountered with respect to the input data.
Input values may be optional or required. Required input may be specified by the user or defaulted to the
value recommended by the program. Default values are identified by the term (default) on the right side
of the value. If the user does not specify a required input item and the default value does not exist, an
error will occur and the program will identify the fault.
Optional input data does not have to be specified by the user. An asterisk (*) is printed beside the
command parameter of such items. Further details are described in chapter five.
Warning and error messages concerning input data will be displayed in the output file even when the
parameters in the OIN command are not selected.
7.3.3 Input Summary Tables
The input summary tables identify all of the input parameters in a horizontal tabular format. This report
also includes all processed input. Processed input is defined as input data that is computed by the
program based on user specified input data. Chapters five and six provide a detailed explanation of the
input data. Please refer to them for further information about the input data

Chapter 7 Output Description
7-9
COMMAND: MRD
AGGREGATE SIZE 1.00 in
DEVELOPMENT CORRECTION 1.0 (default)
BACKWALL EXPOSURE 1
STEM EXPOSURE 1
FOOTING EXPOSURE 1
COMMAND: DLL
LL - LIVE LOAD - DOWNWARD 11.25 kip
LL - LIVE LOAD - UPWARD 0.0 kip
BR - BRAKING FORCE 0.67 kip
CE - CENTRIFUGAL FORCE 0.33 kip
COMMAND: EQL
RESPONSE MODIFICATION 1.0
SOIL PRESSURE FACTOR 1.0 (default)
PHI (SOIL BEARING. CAP.) *
IGNORE VERTICAL EQ SOIL? Y (default)
SUPERSTRUCTURE FORCE 11.25 kip
Figure 7.3.3-1 Sample Input Command Report - illustrating the MRD, DLL and EQL commands
A portion of the input summary table is shown in Figure 1. The figure illustrates the following points:
1. A description/name of the data item.
2. Input parameter header containing an abbreviated parameter description and corresponding set
of units.
3. Input parameter value. The input values are shown to a fixed number of decimal places because
of the tabular format. The actual value may be rounded to fit the output format description.
Please refer to the input command report (section 7.3.2) to see the actual value that was input by
the user.

Chapter 7 Output Description
7-10
7.4 RESULTS
This section describes the reports associated with parameters from the OUR command (see section 5.36).
7.4.1 Additional Information
The additional information report identifies the dimensions of the footing and the effective depth at the toe
and heel locations. Also if the front water elevation is computed, it is displayed in this section. For a
pedestal footing, the geometry of the pedestal follows the footing table as shown in Figure 1.
ABUTMENT TYPE I
Seat Seat Corbel
Top Seat Slope Face Corbel Corbel Slope
Height Width Width Height Height Width Height Height
(ft) (in) (in) (in) (in) (in) (in) (in)
39.33 36.0 37.5 4.5 54.0 4.0 24.0 4.0
Paving Paving Front Back Architectural Backwall/
Notch Notch Bearing Bearing Water Water Treatment Stem Bar
Width Height X Locn Y Locn Level Level Thickness Alignment
(in) (in) (in) (in) (ft) (ft) (in)
10.0 16.0 19.5 82.5 none 17.75 0.0 Y
FOOTING
Min Min Min Min Max Max Max Max
Footing Toe Heel Footing Footing Toe Heel Footing
Thick Proj Proj Width Thick Proj Proj Width
(ft) (ft) (ft) (ft) (ft) (ft) (ft) (ft)
4.25 6.50 11.50 none none none none none
Figure 7.4.1-1 Sample Summary Input Command Description of the AT1 and FTG command

Chapter 7 Output Description
7-11
FOOTING GEOMETRY
Footing Footing Projection Effective Depth
Thick Width Toe Heel Toe Heel
(ft) (ft) (ft) (ft) (ft) (ft)
2.50 7.42 1.67 1.58 1.12 2.21
Moments are assumed to cause tension on the bottom face of the
footing at the toe and on the top face of the footing at the heel.
Effective depths are based on this assumption.
Note: The acceptable range of toe projections for this design
footing size are from: 1.67 ft to 1.75 ft.
COMPUTED VALUES
Front
Water
Level
(ft)
14.20
Note: The computed value complies with DM-4 section 3.11.3.
PEDESTAL GEOMETRY
Slope
Back Front Front Clear Horiz
Offset Width Height Height Proj Spacing Thick Proj Density
(ft) (ft) (ft) (ft) (ft) (ft) (ft) (ft) (ft^3/ft)
1.00 9.67 8.50 1.50 1.00 7.17 2.50 2.67 18.83
Figure 7.4.1-2 Footing and Pedestal Geometry The following information is reported for all footing types:
1. Footing Thick - footing thickness; final design value (design run) or user input (analysis run).
2. Footing Width - width of footing; final design value (design run) or user input (analysis run).
3. Projection - toe and heel projections based on given footing width.
4. Effective Depth - effective depths at toe and heel locations based on given footing thickness and note
in figure 1.
The following information is reported for a design:
1. The acceptable range of toe projections for which a design will work for the footing size.
The following information is reported for a design with no front water level entered:
1. Calculated Front Water Level - distance from top of stem to front water elevation computed based on
the back water elevation and the minimum allowable water differential as stated in DM-4 section
3.11.3.
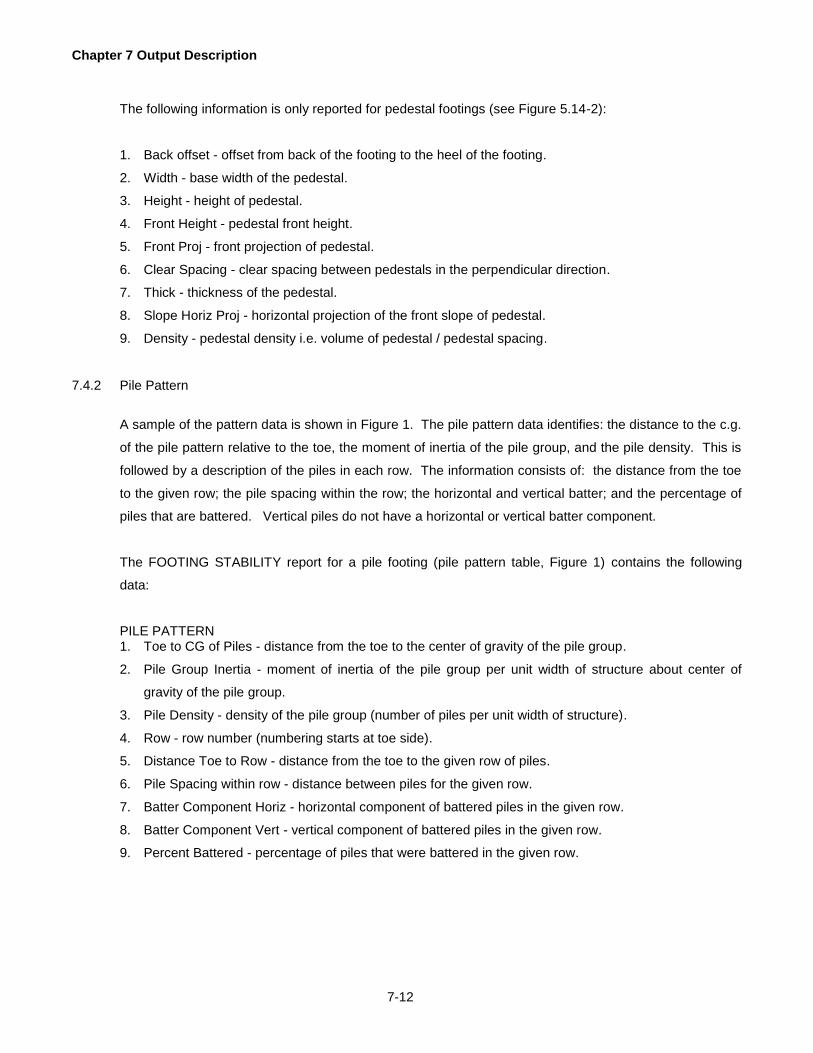
Chapter 7 Output Description
7-12
The following information is only reported for pedestal footings (see Figure 5.14-2):
1. Back offset - offset from back of the footing to the heel of the footing.
2. Width - base width of the pedestal.
3. Height - height of pedestal.
4. Front Height - pedestal front height.
5. Front Proj - front projection of pedestal.
6. Clear Spacing - clear spacing between pedestals in the perpendicular direction.
7. Thick - thickness of the pedestal.
8. Slope Horiz Proj - horizontal projection of the front slope of pedestal.
9. Density - pedestal density i.e. volume of pedestal / pedestal spacing.
7.4.2 Pile Pattern
A sample of the pattern data is shown in Figure 1. The pile pattern data identifies: the distance to the c.g.
of the pile pattern relative to the toe, the moment of inertia of the pile group, and the pile density. This is
followed by a description of the piles in each row. The information consists of: the distance from the toe
to the given row; the pile spacing within the row; the horizontal and vertical batter; and the percentage of
piles that are battered. Vertical piles do not have a horizontal or vertical batter component.
The FOOTING STABILITY report for a pile footing (pile pattern table, Figure 1) contains the following
data:
PILE PATTERN 1. Toe to CG of Piles - distance from the toe to the center of gravity of the pile group.
2. Pile Group Inertia - moment of inertia of the pile group per unit width of structure about center of
gravity of the pile group.
3. Pile Density - density of the pile group (number of piles per unit width of structure).
4. Row - row number (numbering starts at toe side).
5. Distance Toe to Row - distance from the toe to the given row of piles.
6. Pile Spacing within row - distance between piles for the given row.
7. Batter Component Horiz - horizontal component of battered piles in the given row.
8. Batter Component Vert - vertical component of battered piles in the given row.
9. Percent Battered - percentage of piles that were battered in the given row.

Chapter 7 Output Description
7-13
PILE PATTERN
Toe to CG of Piles Pile Group Inertia Pile Density
2.52 (ft) 0.834 (ft^4) 0.267 (pile/ft)
Distance Pile Spacing Batter Component Percent
Row Toe to Row within Row Horiz Vert Battered
(ft) (ft) (%)
1 1.50 5.00 3.00 12.00 100.0
2 5.58 15.00 Vertical Piles
Figure 7.4.2-1 Pile Pattern Component of the Stability Report
7.4.3 Output Legend
This report identifies the description of each abbreviation and status code that is used in the remainder of
the output. A sample is shown in Figure 7.4.4-1
7.4.4 Factored Forces
This report identifies the loads that were generated for each load combination. A load combination
consists of three parts, namely: the limit state, the load case (maximum or minimum) and the stage
(temporary or final). The abbreviations for each part can be found in the Legend (see Figure 7.4.4-1).
The loads are reported for the following components (where applicable): foundation, pedestal, backwall,
stem, and footing. There are variations in the tabular format for each component.
The foundations report identifies the distance from the toe to the resultant of the loads. The definition of
the resultant was presented in Section 3.4. The force and moment values are reported in terms of the
vertical and horizontal directions. The moment is defined about the toe at the bottom of the footing. For
pile and caisson footings, the Service Limit State V/H Ratio check is added to this table. Figure 1
illustrates part of this report.

Chapter 7 Output Description
7-14
Abbrev Load Case Description
Max Maximum - Maximum downward vertical force,
maximized moment, maximum shear
Min Minimum - Minimum downward vertical force,
maximized moment, maximum shear
Abbrev Stage Description
Tmp Temporary - Temporary Construction Condition
Fin Final - Final Construction Condition
Abbrev Loads Description
DC-A DC - Dead Load of Concrete, Parapet
DC-S DC - Dead Load of Superstructure
DW-A DW - FWS on Abutment
DW-S DW - Wearing Surface / Utilities
EV EV - Dead Load of Earth
...
Status Code Description
OK - Check was satisfied
NG - Check failed
NC - Not checked
NA - Not applicable
Figure 7.4.4-1 Output Legend
The following information is reported for the foundation in the FACTORED FORCES report (for all
footing types):
FOUNDATION FORCES AT FOOTING TOE (Spread and Pedestal Foundation Types) 1. Load combination description - abbreviated description of the limit state, load case and stage.
2. Toe to Result - distance from the toe to the resultant of the applied force (see Figure 3.4.1.2.3-1).
3. Vertical Force - resultant of all forces applied in the vertical direction.
4. Vertical Moment - resultant of all moments produced by vertical forces about the toe of the footing.
5. Horizontal Force - resultant of all forces applied in the horizontal direction.
6. Horizontal Moment - resultant of all moments produced by horizontal forces about the toe of the
footing.
FOUNDATION FORCES AT FOOTING TOE (Pile and Caisson Foundation Types) 1. Load combination description - abbreviated description of the limit state, load case and stage.
2. Toe to Result - distance from the toe to the resultant of the applied force
(see Figure 3.4.1.2.3-1).
3. Vertical Force - resultant of all forces applied in the vertical direction.
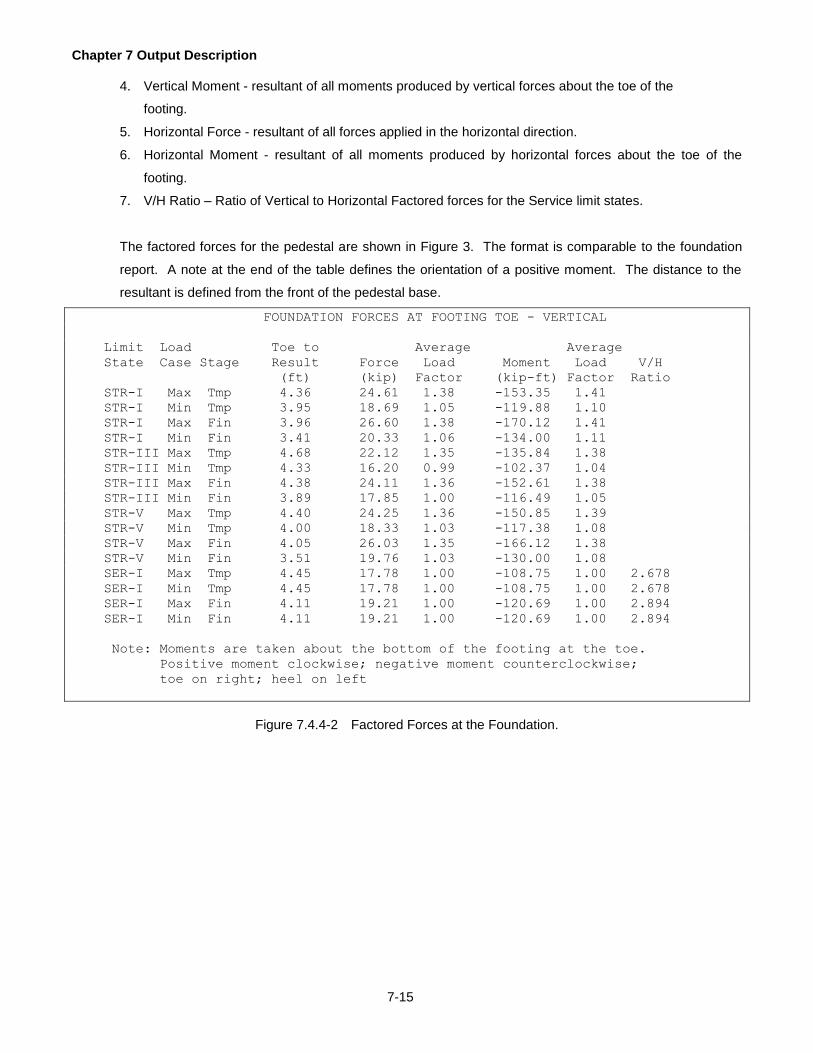
Chapter 7 Output Description
7-15
4. Vertical Moment - resultant of all moments produced by vertical forces about the toe of the
footing.
5. Horizontal Force - resultant of all forces applied in the horizontal direction.
6. Horizontal Moment - resultant of all moments produced by horizontal forces about the toe of the
footing.
7. V/H Ratio – Ratio of Vertical to Horizontal Factored forces for the Service limit states.
The factored forces for the pedestal are shown in Figure 3. The format is comparable to the foundation
report. A note at the end of the table defines the orientation of a positive moment. The distance to the
resultant is defined from the front of the pedestal base.
FOUNDATION FORCES AT FOOTING TOE - VERTICAL
Limit Load Toe to Average Average
State Case Stage Result Force Load Moment Load V/H
(ft) (kip) Factor (kip-ft) Factor Ratio
STR-I Max Tmp 4.36 24.61 1.38 -153.35 1.41
STR-I Min Tmp 3.95 18.69 1.05 -119.88 1.10
STR-I Max Fin 3.96 26.60 1.38 -170.12 1.41
STR-I Min Fin 3.41 20.33 1.06 -134.00 1.11
STR-III Max Tmp 4.68 22.12 1.35 -135.84 1.38
STR-III Min Tmp 4.33 16.20 0.99 -102.37 1.04
STR-III Max Fin 4.38 24.11 1.36 -152.61 1.38
STR-III Min Fin 3.89 17.85 1.00 -116.49 1.05
STR-V Max Tmp 4.40 24.25 1.36 -150.85 1.39
STR-V Min Tmp 4.00 18.33 1.03 -117.38 1.08
STR-V Max Fin 4.05 26.03 1.35 -166.12 1.38
STR-V Min Fin 3.51 19.76 1.03 -130.00 1.08
SER-I Max Tmp 4.45 17.78 1.00 -108.75 1.00 2.678
SER-I Min Tmp 4.45 17.78 1.00 -108.75 1.00 2.678
SER-I Max Fin 4.11 19.21 1.00 -120.69 1.00 2.894
SER-I Min Fin 4.11 19.21 1.00 -120.69 1.00 2.894
Note: Moments are taken about the bottom of the footing at the toe.
Positive moment clockwise; negative moment counterclockwise;
toe on right; heel on left
Figure 7.4.4-2 Factored Forces at the Foundation.

Chapter 7 Output Description
7-16
FOUNDATION FORCES AT BOTTOM OF PEDESTAL
Limit Load Front to Vertical Horizontal
State Case Stage Result Force Moment Force Moment
(ft) (kip) (kip-ft) (kip) (kip-ft)
STR-I Max Tmp 4.30 149.49 -1117.42 37.50 474.10
STR-I Min Tmp 3.49 115.28 -876.68 37.50 474.10
STR-I Max Fin 3.49 261.07 -1899.11 68.73 986.91
STR-I Min Fin 1.60 162.92 -1247.48 68.73 986.91
...
SER-I Min Fin 2.94 160.13 -1188.92 48.90 718.50
Notes:
Vertical Force and Moment values include the factored pedestal self
weight.
All forces and moments include the footing forces and moments (see
Foundation Forces at Footing Toe) multiplied by the pedestal center-
to-center spacing.
Figure 7.4.4-3 Factored Forces at the Pedestal Base
The following information is reported for the pedestal in the FACTORED FORCES report:
FOUNDATION FORCES AT BOTTOM OF PEDESTAL
1. Load combination description - abbreviated description of the limit state, load case and stage.
2. Front to Result - distance from the front of the pedestal to the resultant of the applied loads (see xresp
Figure 3.4.2.1-1).
3. Vertical Force - resultant of all forces applied in the vertical direction.
4. Vertical Moment - resultant of all moments about the front of the pedestal, produced by vertical
forces.
5. Horizontal Force - resultant of all forces applied in the horizontal direction.
6. Horizontal Moment - resultant of all moments about the front of the pedestal, produced by horizontal
forces.
7. Notes concerning forces and moments.
The factored forces in the stem are reported at the quarter-point locations. The axial force, moment and
shear force is reported for all applicable load combinations. A sample of this report is shown in Figure 4.
For a design run in which bars can be cutoff, the factored forces are reported at the theoretical cutoff
location of the largest bar that can be cutoff. These results are provided so that the user can corroborate
the moment axial load check (see Section 7.5.3) at the cutoff location. The moment axial load check
provides the engineer with information about the margin of safety (i.e. performance factor) for the strength
limit states at the cutoff location.

Chapter 7 Output Description
7-17
STEM LOCATION A 3.25 (ft) FROM TOP OF STRUCTURE
Limit Load
State Case Stage Axial Moment Shear
(kip) (kip-ft) (kip)
STR-I Max Tmp 1.26 0.40 0.41
STR-I Min Tmp 0.93 0.39 0.41
STR-I Max Fin 1.33 0.48 0.46
STR-I Min Fin 0.98 0.46 0.46
STR-III Max Tmp 1.18 0.16 0.13
STR-III Min Tmp 0.85 0.15 0.13
STR-III Max Fin 1.25 0.20 0.15
STR-III Min Fin 0.90 0.18 0.15
Figure 7.4.4-4 Factored Loads in the Stem
The following information is reported for backwall and stem locations in the FACTORED FORCES
report:
ABUTMENT BACKWALL (if applicable) xxx.xx ( ) FROM TOP OF STRUCTURE ABUTMENT BACKWALL SEAT LEVEL (if applicable) xxx.xx ( ) FROM TOP OF STRUCTURE STEM LOCATION a xxx.xx ( ) FROM TOP OF STRUCTURE
(Shown for all bar cutoff locations when selected on the OUI command)
1. Load combination description - abbreviated description of the limit state, load case and stage.
2. Axial - axial load applied to the section at the given stem location.
3. Moment - applied moment acting on the section at the given stem location.
4. Shear - shear forces applied to the section at the given stem location.
The factored forces in the footing are reported at the toe and heel critical locations. The critical location
for flexure is at the face (front and back) of the wall. The shear force critical location is situated at a
distance “d” from the face of the stem wall for the toe section, and at the face of the stem wall for the heel
section. Further details about the footing critical location can be found in section 2.9.1. A sample of the
footing factored forces report is shown in Figure 5.

Chapter 7 Output Description
7-18
FOOTING - W/O FOUNDATION PRESSURE
Limit Load Toe Shear Toe Heel Shear Heel
State Case Stage Eff D at Face Moment Eff D at Face Moment
(kip) (kip) (kip-ft) (kip) (kip) (kip-ft)
STR-I Max Tmp 0.00 0.97 1.11 7.12 14.52 38.43
STR-I Min Tmp 0.00 0.62 0.71 5.64 11.22 30.31
STR-I Max Fin 0.00 0.97 1.11 8.04 15.95 42.98
STR-I Min Fin 0.00 0.62 0.71 6.37 12.33 33.95
STR-III Max Tmp 0.00 0.97 1.11 6.19 12.45 33.35
STR-III Min Tmp 0.00 0.62 0.71 4.71 9.15 25.23
STR-III Max Fin 0.00 0.97 1.11 7.11 13.89 37.90
STR-III Min Fin 0.00 0.62 0.71 5.44 10.27 28.86
Figure 7.4.4-5 Factored Forces in the Footing
The following information is reported for all footing types in the FACTORED FORCES report:
FOOTING – W/O FOUNDATION PRESSURE
1. Load combination description - abbreviated description of the limit state, load case and stage.
2. Toe Shear Eff D - shear in the footing at a distance “d” (effective depth) from the stem towards the
toe.
3. Toe Shear at Face - shear in the footing at the face of the stem (toe side).
4. Toe Moment - applied moment at the toe section (at face of stem).
5. Heel Shear Eff D - shear in the footing at a distance “d” (effective depth) from the stem towards the
heel.
6. Heel Shear at Face - shear in the footing at the face of the stem (heel side).
7. Heel Moment - applied moment at the heel section (at face of stem).
7.4.5 Footing Stability
The stability reports are unique to each type of footing. The pile, spread and pedestal footing variations
are described in sub-sections 1, 2 and 3 respectively.
7.4.5.1 Pile Footing
This pile footing report is composed of two parts, namely: pile axial loads, and pile lateral loads.
The first part of the pile stability report is shown in Figure 1. It describes how the factored axial loads are
distributed to each row of piles. The program can accommodate up to five rows of piles. The axial load is
identified for every applicable load combination (limit state / load type / stage). The axial resistance and
the performance ratio are also shown. Each row of piles is identified as being battered or vertical (see
previous component).

Chapter 7 Output Description
7-19
Typically, the compressive strength of a pile is reported. If a pile is in tension, and it was the governing
case, the tensile capacity will be reported. Note: The EXTREME-I limit state (earthquake load) may have
a non-zero tensile resistance. Tensile values are reported as negative numbers.
PILE FACTORED AXIAL LOADS / PILE FACTORED AXIAL RESISTANCE
Factored Axial Loads Factored
Limit Load Row 1 Row 2 Axial Perform
State Case Stage Batter Vert Resist Ratio
(kip) (kip) (kip)
STR-I Max Tmp 89.94 100.64 280.80 2.790
STR-I Min Tmp 75.07 65.50 280.80 3.740
STR-I Max Fin 106.60 93.59 280.80 2.634
STR-I Min Fin 91.47 55.42 280.80 3.070
STR-III Max Tmp 74.56 100.64 280.80 2.790
STR-III Min Tmp 59.70 65.50 280.80 4.287
STR-III Max Fin 87.77 99.19 280.80 2.831
STR-III Min Fin 72.63 61.02 280.80 3.866
Performance Ratio = Pile Factored Axial Resistance / Maximum Factored Pile
Axial Load
Figure 7.4.5.1-1 Pile Axial Loads and Resistance in Footing Stability Report
The FOOTING STABILITY report for a pile footing (pile axial loads / resistance, Figure 2) contains the
following data:
PILE FACTORED AXIAL LOADS / PILE FACTORED AXIAL RESISTANCE
1. Load combination description - abbreviated description of the limit state, load case and stage.
2. Factored Axial force data, where each column (representing a pile row) in the table identifies:
Pile row number.
Orientation of piles: battered or vert (vertical).
Factored Axial force in each pile of the given pile row for the given load combination.
3. Factored Axial Resist – factored axial resistance of each pile.
4. Perform Ratio - ratio of axial resistance to largest pile force for the given load combination.
The second part of the pile stability report is shown in Figure 2. It consists of a comparison between the
applied factored lateral loads and the lateral resistance of the pile group. The lateral loads are reported
for every applicable load combination (limit state / load type / stage). The performance ratio of the lateral
capacity is also displayed.

Chapter 7 Output Description
7-20
FACTORED LATERAL LOADS / PILE FACTORED GROUP LATERAL RESISTANCE
Resistance based on battered piles only
Factored Factored
Limit Load Lateral Lateral Performance
State Case Stage Load Resist Ratio
(kips/unit length) (kips/unit length)
STR-I Max Tmp 8.12 11.35 1.398
STR-I Min Tmp 8.12 11.35 1.398
STR-I Max Fin 10.04 11.35 1.130
STR-I Min Fin 10.04 11.35 1.130
...
SER-I Max Tmp 5.44 N/A N/A
SER-I Min Tmp 5.44 N/A N/A
SER-I Max Fin 6.70 N/A N/A
SER-I Min Fin 6.70 N/A N/A
Performance Ratio = Pile Group Factored Lateral Resistance / Factored Lateral
Load
Warning: A performance ratio less than 1 was found
Figure 7.4.5.1-2 Pile Lateral Resistance in Footing Stability Report
The FOOTING STABILITY report for a pile footing (lateral loads / resistance) contains the following data:
FACTORED LATERAL LOADS / PILE GROUP FACTORED LATERAL RESISTANCE
1. Load combination description - abbreviated description of the limit state, load case and stage.
2. Factored Lateral Load - total applied factored lateral load per unit length of structure.
3. Factored Lateral Resist – factored lateral resistance of pile group per unit length of structure.
4. Performance Ratio - ratio of lateral resistance to applied lateral load.

Chapter 7 Output Description
7-21
Unit Length is defined in Figure 3:
toe
heel
Diagram showing Unit Length
Unit Length
Figure 7.4.5.1-3 Unit Length Diagram
7.4.5.2 Spread Footing
The footing stability report for the spread footing consists of the overturning and bearing, the sliding, and
the settlement checks.
The overturning and bearing check are reported in one table, as shown in Figure 1. If the location of the
load resultant lies outside the kern, the eccentricity value is flagged with an asterisk (*) and the
eccentricity performance ratio will be less than 1.0. A footnote will be printed explaining that the
eccentricity check has failed (i.e., the resultant is outside the kern).
The bearing pressure at the toe and the heel are identified. The applied pressure depends on the
characteristics of the foundation (soil, hard rock). For soil foundations, the Uniform Bearing pressure is
reported as the actual bearing pressure. Otherwise, the maximum bearing pressure is reported as the
actual bearing pressure.
The FOOTING STABILITY report for a spread footing (bearing, Figure 1) contains the following data:
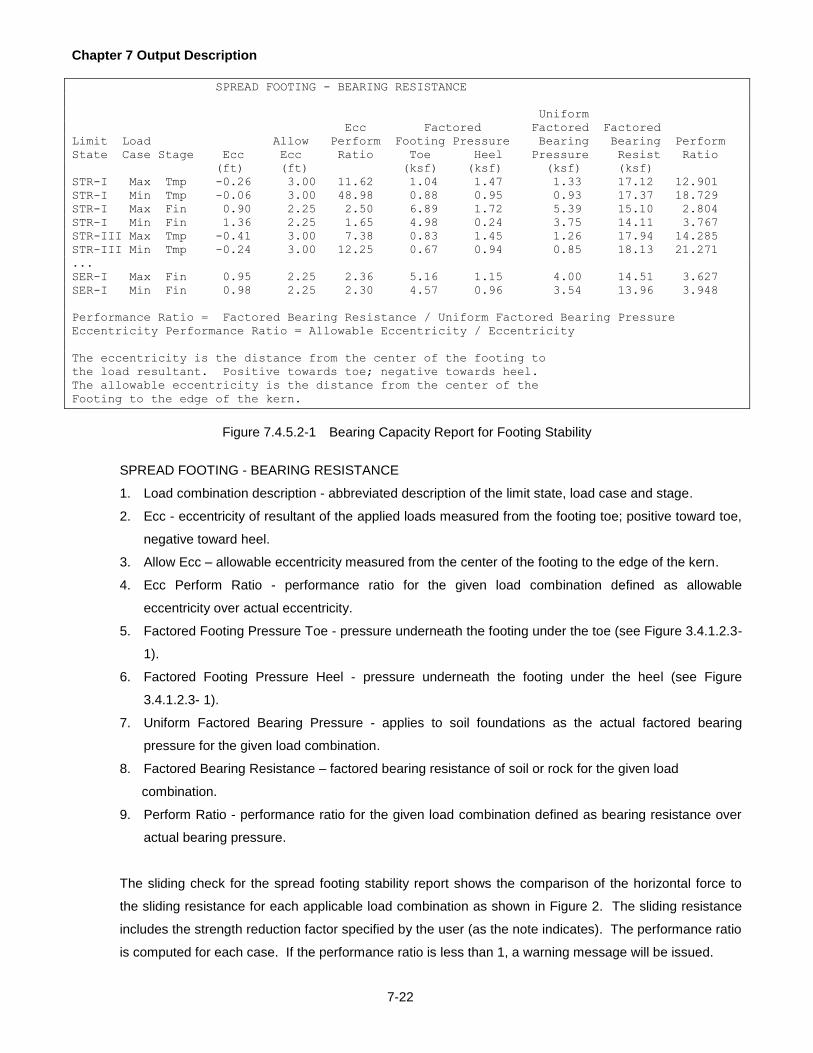
Chapter 7 Output Description
7-22
SPREAD FOOTING - BEARING RESISTANCE
Uniform
Ecc Factored Factored Factored
Limit Load Allow Perform Footing Pressure Bearing Bearing Perform
State Case Stage Ecc Ecc Ratio Toe Heel Pressure Resist Ratio
(ft) (ft) (ksf) (ksf) (ksf) (ksf)
STR-I Max Tmp -0.26 3.00 11.62 1.04 1.47 1.33 17.12 12.901
STR-I Min Tmp -0.06 3.00 48.98 0.88 0.95 0.93 17.37 18.729
STR-I Max Fin 0.90 2.25 2.50 6.89 1.72 5.39 15.10 2.804
STR-I Min Fin 1.36 2.25 1.65 4.98 0.24 3.75 14.11 3.767
STR-III Max Tmp -0.41 3.00 7.38 0.83 1.45 1.26 17.94 14.285
STR-III Min Tmp -0.24 3.00 12.25 0.67 0.94 0.85 18.13 21.271
...
SER-I Max Fin 0.95 2.25 2.36 5.16 1.15 4.00 14.51 3.627
SER-I Min Fin 0.98 2.25 2.30 4.57 0.96 3.54 13.96 3.948
Performance Ratio = Factored Bearing Resistance / Uniform Factored Bearing Pressure
Eccentricity Performance Ratio = Allowable Eccentricity / Eccentricity
The eccentricity is the distance from the center of the footing to
the load resultant. Positive towards toe; negative towards heel.
The allowable eccentricity is the distance from the center of the
Footing to the edge of the kern.
Figure 7.4.5.2-1 Bearing Capacity Report for Footing Stability
SPREAD FOOTING - BEARING RESISTANCE
1. Load combination description - abbreviated description of the limit state, load case and stage.
2. Ecc - eccentricity of resultant of the applied loads measured from the footing toe; positive toward toe,
negative toward heel.
3. Allow Ecc – allowable eccentricity measured from the center of the footing to the edge of the kern.
4. Ecc Perform Ratio - performance ratio for the given load combination defined as allowable
eccentricity over actual eccentricity.
5. Factored Footing Pressure Toe - pressure underneath the footing under the toe (see Figure 3.4.1.2.3-
1).
6. Factored Footing Pressure Heel - pressure underneath the footing under the heel (see Figure
3.4.1.2.3- 1).
7. Uniform Factored Bearing Pressure - applies to soil foundations as the actual factored bearing
pressure for the given load combination.
8. Factored Bearing Resistance – factored bearing resistance of soil or rock for the given load
combination.
9. Perform Ratio - performance ratio for the given load combination defined as bearing resistance over
actual bearing pressure.
The sliding check for the spread footing stability report shows the comparison of the horizontal force to
the sliding resistance for each applicable load combination as shown in Figure 2. The sliding resistance
includes the strength reduction factor specified by the user (as the note indicates). The performance ratio
is computed for each case. If the performance ratio is less than 1, a warning message will be issued.

Chapter 7 Output Description
7-23
The FOOTING STABILITY report for a spread footing (sliding, Figure 2) contains the following data:
SPREAD FOOTING – SLIDING
1. Load combination description - abbreviated description of the limit state, load case and stage.
2. Factored Horizontal Force - applied factored horizontal force per unit width of structure.
3. Factored Sliding Resistance – factored lateral load resistance per unit width of structure.
4. Perform Ratio - performance ratio for the given load combination (defined by note).
SPREAD FOOTING - SLIDING
Factored Factored
Limit Load Horizontal Sliding Performance
State Case Stage Force Resistance Ratio
(kip) (kip)
STR-I Min Tmp 3.50 9.67 2.762
STR-I Min Fin 8.44 15.30 1.813
STR-III Min Tmp 2.45 9.34 3.813
STR-III Min Fin 6.91 15.17 2.196
STR-V Min Tmp 3.35 9.63 2.872
STR-V Min Fin 8.20 15.21 1.855
EXT-I Min Fin 6.21 14.16 2.280
Note: Only the Min Load Cases are checked for sliding.
Sliding resistance is based on a phi factor of 0.85
Performance Ratio = Factored Sliding Resistance / Factored Horizontal Force
Figure 7.4.5.2-2 Sliding Resistance
The settlement table of the spread footing stability report is shown in Figure 3. There are several
variations of this table. If the foundation is a rock, the consolidation and secondary settlements are not
applicable (see the pedestal settlement 7.4.5.3). If the consolidation and secondary settlement values
are negative, a second line is displayed. The new line replaces the negative components of settlement
with a zero. The table shows the governing load combination, i.e., the case that generated the largest
total settlement.
The notes include references to the effective width of footing so that the uniform bearing pressures can
be determined. The bearing pressure is computed by dividing the vertical force by the effective width.

Chapter 7 Output Description
7-24
SETTLEMENT
Primary and Secondary Consolidation Values
Layer No. 1
Sub
Layer Sigma Sigma Sigma Settlement
Depth Z O P F Consol Second Condition
(ft) (ft) (psf) (psf) (psf) (in) (in)
4.59 2.297 967. 1608. 1861. 1.23 0.77 OC f>p
4.59 6.890 1232. 1482. 1751. 0.85 0.77 OC f>p
4.59 11.483 1496. 1357. 1833. 1.06 0.77 UC
4.59 16.076 1761. 1232. 2005. 1.71 0.77 UC
4.59 20.669 Sub-Layer depth exceeded 6 x Footing width
Note: Sub-Layer depth exceeded 6 x Footing width.
Remaining sub-layers will not be displayed.
Legend : Condition Codes
OC f>p : Over-Consolidation - Sigma F > than Sigma P
OC f<=p : Over-Consolidation - Sigma P >= Sigma F
NC : Normal-Consolidation
UC : Under-Consolidation
Note: Primary Consolidation Reduction Factor is not included in the
Consolidation values shown above.
SETTLEMENT SUMMARY
Settlement Perform Temp Stage
Elastic Consol Second Total Allow Ratio Settlement
(in) (in) (in) (in) (in) (in)
0.30 1.07 0.41 1.78 2.00 1.126 0.07
Notes:
Elastic settlement is based on:
effective width of 6.98 (ft) from SER-I Max Fin
Consolidation and Secondary settlement are based on:
effective width of 7.83 (ft) from CSS Max Fin
Temporary Stage settlement is based on:
effective width of 8.72 (ft) from SER-I Max Tmp
Uniform pressures (Vertical Force/Effective Width)
are used for settlement calculations.
Performance Ratio = Allowable Settlement / Total Settlement
Figure 7.4.5.2-3 Settlement - Spread Footing Stability Report

Chapter 7 Output Description
7-25
The FOOTING STABILITY report for a spread footing (settlement, Figure 3) contains the following data:
SETTLEMENT
1. Sub-layer Depth - depth of sub-layer.
2. Z - depth to sub-layer from top of soil layer.
3. Sigma O - Initial Effective Stress at the center of the sub-layer.
4. Sigma P - Maximum Past Effective Stress at the center of the sub-layer.
5. Sigma F - Final Effective Stress at the center of the sub-layer.
6. Settlement Consol - consolidation settlement for sub-layer.
7. Settlement Second - secondary settlement for sub-layer.
8. Condition - Indicates which consolidation condition is present in the sub-layer.
SETTLEMENT SUMMARY
1. Elastic - elastic settlement.
2. Settlement Consol - consolidation settlement (applies to soil foundations only).
3. Settlement Second - secondary consolidation settlement (applies to soil foundations only).
4. Settlement Total - sum of elastic, consolidation and secondary settlement.
5. Settlement Allow - allowable settlement.
6. Perform Ratio - settlement performance ratio (allowable/total).
7. Temp Stage Settlement - settlement due to temporary (construction) stage loads.
8. Width and load combination used to compute elastic, consolidation and secondary settlement.
7.4.5.3 Pedestal Footing
This report is a variation of the report that is used for the spread footing.
There are two overturning and bearing tables. The first overturning and bearing table is based on the
footing bearing on the pedestal. The pedestal concrete is considered as a hard rock, hence the
maximum uniform pressure is used in the computation of the performance ratio as shown in Fig. 1.

Chapter 7 Output Description
7-26
FOOTING BEARING RESULTS
Maximum Factored Actual Pressure : 7.35 (ksf) from: STR-I Max Fin
Pedestal Factored Bearing Resistance: 257.04 (ksf)
Performance Ratio : 34.98
FOOTING BEARING RESISTANCE
Maximum
Factored Factored Factored
Limit Load Footing Pressure Bearing Bearing Perform
State Case Stage Ecc Toe Heel Pressure Resist Ratio
(ft) (ksf) (ksf) (ksf) (ksf)
STR-I Max Tmp -0.09 1.81 2.17 2.17 257.04 118.568
STR-I Min Tmp 0.16 1.82 1.31 1.82 257.04 141.368
STR-I Max Fin 0.88 7.35 0.47 7.35 257.04 34.983
STR-I Min Fin 1.51 6.41 0.00 6.41 257.04 40.118
STR-III Max Tmp -0.37 1.09 2.36 2.36 257.04 108.864
STR-III Min Tmp -0.15 1.10 1.50 1.50 257.04 171.283
...
SER-I Max Tmp -0.20 1.18 1.76 1.76 257.04 146.066
SER-I Min Tmp -0.20 1.18 1.76 1.76 257.04 146.066
SER-I Max Fin 0.99 5.52 0.02 5.52 257.04 46.535
SER-I Min Fin 1.10 4.81 0.00 4.81 257.04 53.456
Performance Ratio = Factored Bearing Resistance / Maximum Factored Bearing
Pressure
The eccentricity is the distance from the center of the footing contact
length with the pedestal to the load resultant. Positive towards toe;
negative towards heel.
Figure 7.4.5.3-1 Overturning and Bearing - Pedestal on Foundation
The FOOTING STABILITY report for a pedestal footing (footing on pedestal - bearing, Figure 1) contains
the following data:
FOOTING BEARING RESULTS
1. Governing Load Combination:
Maximum Factored Actual Pressure - maximum factored applied pressure from all load
combinations followed by the abbreviated description of the limit state, load case and stage.
Pedestal Factored Bearing Resistance – factored resisting pressure of the pedestal, based on
concrete strength of the pedestal concrete.
Performance Ratio - Resistance/Actual Pressure.
FOOTING BEARING RESISTANCE
1 Load combination description - abbreviated description of the limit state, load case and stage.
2. Ecc - eccentricity of resultant of the applied loads measured from the footing toe; positive toward toe
negative toward heel.
3. Factored Footing Pressure Toe - pressure underneath the footing under the toe (see
Figure 3.4.2.1-1).

Chapter 7 Output Description
7-27
4. Factored Footing Pressure Heel - pressure underneath the footing under the heel (see
Figure 3.4.2.1-1).
5. Maximum Factored Bearing Pressure - larger of toe or heel pressure.
6. Factored Bearing Resistance – factored bearing resistance of pedestal, based on concrete strength
of pedestal.
7. Perform Ratio - performance ratio for the given load combination (defined by note).
The second overturning and bearing report is based on the pedestal bearing on the rock, as shown in
Figure 2. The governing bearing case is reported separately from the table that identifies the eccentricity
and bearing values for each load case. The bearing capacity of rock foundations is specified by the user.
Hence, the same value is used for all load combinations. The bearing resistance is not considered for the
temporary stage, hence “NA” is reported. The note at the end of the table defines the orientation of the
eccentricity. For both reports, if the location of the load resultant lies outside the kern, the eccentricity
value is flagged with an asterisk (*) and the eccentricity performance ratio will be less than 1.0. A
footnote will be printed explaining that the eccentricity check has failed (i.e., the resultant is outside the
kern).
The FOOTING STABILITY report for a pedestal footing (bearing, Figure 2) contains the following data:
PEDESTAL BEARING RESISTANCE
1. Load combination description - abbreviated description of the limit state, load case and stage.
2. Ecc - eccentricity of resultant of the applied loads measured from the front of the pedestal; positive
toward front, negative toward back.
3. Allow Ecc – allowable eccentricity measured from the center of the footing to the edge of the kern.
4. Ecc Perform Ratio - performance ratio for the given load combination defined as allowable
eccentricity over actual eccentricity.
5. Factored Footing Pressure Front - pressure underneath the pedestal at the front corner (see Figure
3.4.2.1-1).
6. Factored Footing Pressure Back - pressure underneath the pedestal under the back corner (see
Figure 3.4.2.1-1) .
7. Factored Uniform Bearing Pressure - applies to final stage only.
8. Factored Bearing Resistance - bearing resistance of soil or rock for the given load combination as
input by the user.
9. Perform Ratio - performance ratio for the given load combination (defined by note).
The sliding of the footing on the pedestal is checked by comparing the ratio of the vertical (V) and
horizontal (H) components of the overturning forces. If the V/H ratio is less than the minimum allowable
value, sliding is a problem. Figure 3 shows the sliding results in the table named “Footing Stability on
Pedestal”.

Chapter 7 Output Description
7-28
PEDESTAL BEARING RESISTANCE
Uniform
Ecc Factored Factored Factored
Limit Load Allow Perform Pedestal Pressure Bearing Bearing Perform
State Case Stage Ecc Ecc Ratio Front Back Pressure Resist Ratio
(ft) (ft) (ksf) (ksf) (ksf) (ksf)
STR-I Max Tmp 0.28 2.00 10.15 6.57 6.57 NA NA NA
STR-I Min Tmp 1.02 2.00 71.33 6.05 6.05 NA NA NA
STR-I Max Fin 1.07 2.25 2.98 13.88 13.88 13.88 110.00 7.926
STR-I Min Fin 2.80 2.25 1.72 16.04 16.04 16.04 110.00 6.857
STR-III Max Tmp -0.36 2.00 4.49 6.00 6.00 NA NA NA
STR-III Min Tmp 0.27 2.00 7.81 4.39 4.39 NA NA NA
STR-III Max Fin 0.89 2.25 4.58 10.01 10.01 10.01 110.00 10.992
STR-III Min Fin 1.99 2.25 2.41 10.25 10.25 10.25 110.00 10.726
STR-V Max Tmp 0.20 2.00 8.75 6.36 6.36 NA NA NA
STR-V Min Tmp 0.93 2.00 305.32 5.79 5.79 NA NA NA
STR-V Max Fin 1.10 2.25 3.00 13.22 13.22 13.22 110.00 8.323
STR-V Min Fin 2.74 2.25 1.74 15.15 15.15 15.15 110.00 7.260
SER-I Max Tmp -0.07 2.00 6.90 4.72 4.72 NA NA NA
SER-I Min Tmp -0.07 2.00 6.90 4.72 4.72 NA NA NA
SER-I Max Fin 1.23 2.25 2.46 10.44 10.44 10.44 110.00 10.538
SER-I Min Fin 1.68 2.25 2.25 10.14 10.14 10.14 110.00 10.844
Performance Ratio = Factored Bearing Resistance / Uniform Factored Bearing Pressure
Eccentricity Performance Ratio = Allowable Eccentricity / Eccentricity
The eccentricity is the distance from the center of the pedestal at
the base to the load resultant. Positive towards front; negative
towards back. The allowable eccentricity is the distance from the
center of the footing to the edge of the kern.
Figure 7.4.5.3-2 Overturning and Bearing - Pedestal on Footing
FOOTING STABILITY ON PEDESTAL
Min
Limit Load Vertical Horiz V/H Allow Perform
State Case Stage Force Force Ratio Ratio Ratio
(kip) (kip)
SER-I Max Fin 16.64 5.06 3.29 2.00 1.65
Notes:
Forces are based on a unit width thickness of the footing.
Performance Ratio = (V/H Ratio) / (Min Allow Ratio)
Figure 7.4.5.3-3 Pedestal Sliding (Footing Stability)

Chapter 7 Output Description
7-29
The FOOTING STABILITY report for a pedestal footing (footing on pedestal - v/h ratio, Figure 3) contains the
following data:
FOOTING STABILITY ON PEDESTAL
1. Load combination description - abbreviated description of the limit state, load case and stage that
produces the smallest performance ratio.
2. Vertical Force - applied vertical force on the pedestal tap of the pedestal from the given load
combination.
3. Horizontal Force - total applied horizontal force about the top of the pedestal from the given load
combination.
4. Min Allow Ratio - minimum allowable v/h ratio program defined.
5. Perform Ratio - performance ratio for the given load combination (defined by note).
The settlement of the pedestal on the foundation is shown in Figure 4. It resembles the settlement report
for spread footings. Consolidation and secondary settlement are not applicable for rock foundations.
SETTLEMENT
Settlement Perform Temp Stage
Elastic Consol Second Total Allow Ratio Settlement
(in) (in) (in) (in) (in) (in)
0.01 NA NA 0.01 1.00 197.985 0.00
Notes:
Elastic settlement is based on:
effective width of 6.84 (ft) from SER-I Max Fin
Temporary Stage settlement is based on:
effective width of 9.39 (ft) from SER-I Max Tmp
Uniform pressures (Vertical Force/Effective Width)
are used for settlement calculations.
Performance Ratio = Allowable Settlement / Total Settlement
Figure 7.4.5.3-4 Pedestal Settlement
The FOOTING STABILITY report for a pedestal footing (settlement, Figure 4) contains the following data:
SETTLEMENT
1. Elastic - elastic settlement.
2. Settlement Consol - consolidation settlement (not applicable).
3. Settlement Second - secondary consolidation settlement (not applicable).
4. Settlement Total - elastic settlement only.

Chapter 7 Output Description
7-30
5. Settlement Allow - allowable settlement.
6. Perform Ratio - settlement performance ratio (allowable/total).
7. Temp Stage Settlement - settlement for temporary construction stage.
8. Width and load combination used to compute elastic, consolidation and secondary settlement.
7.4.6 Controlling Footing Forces
This report is only available for the pile foundations and spread footings. For pedestal foundations, the
controlling shear and moment values are referenced by special notes in the crack control, shear and
flexural strength tables.
This report identifies the forces and moments that were used for the flexural and shear calculations. The
maximum moment is used for the strength check. The service moment is used for the crack control
check and the shear force is used for the shear check. For each value, the load combination (limit state /
load type / stage) that generated the value is reported along with a flag indicating the origin of the
controlling moment in the footing. The critical shear location (at the face or effective depth or at the X
distance for heel only) in the footing is also identified. Figure 1 shows the results from a pile footing
analysis. Pile footings are distinguished from the spread footing by the summary forces in the parallel
direction. Note that shear is not checked in the parallel direction hence only the moments are reported.
The CONTROLLING FOOTING FORCES report contains the following data:
TOE – WITH FOUNDATION PRESSURE (bottom perpendicular) for spread and pile footings HEEL – WITH FOUNDATION PRESSURE (top perpendicular) for spread and pile footing
1. Load combination description - abbreviated description of the limit state, load case and stage.
2. Moment - largest strength and service limit state moments followed by a “T” or “H” which indicates
which side of the footing the moment originates.
3. Shear - largest shear force and location (stem face or distance‘d’ from face) at toe and heel, or X
distance from back face) at toe and heel of the stem at the heel.
PARALLEL MOMENT for pedestal and pile footings
1. Load combination description - abbreviated description of the limit state, load case and stage.
2. Moment - largest strength and service limit state moments.

Chapter 7 Output Description
7-31
TOE - WITH FOUNDATION PRESSURE
Limit Load Limit Load
State Case Stage Moment State Case Stage Shear
(Controlling) (kip-ft) (Controlling) (kip)
STR-I Max Fin 11.82T (Strength) Sec. beyond ftg. 0.00
SER-I Max Fin 8.21T (Crack Control)
Note: A "T" following the moment value indicates that the controlling
moment for the bottom perpendicular reinforcement was found in the
Toe. An "H" indicates the controlling moment was found in the Heel.
Note: Sec. beyond ftg. indicates that the controlling limit state is not
applicable because the section is beyond the footing dimensions.
HEEL - WITH FOUNDATION PRESSURE
Limit Load Limit Load
State Case Stage Moment State Case Stage Shear
(Controlling) (kip-ft) (Controlling) (kip)
STR-I Min Fin 15.01H (Strength) STR-I Min Fin 6.79
SER-I Max Fin 5.61H (Crack Control) (Face)
Note: An "H" following the moment value indicates that the controlling
moment for the top perpendicular reinforcement was found in the
Heel. A "T" indicates the controlling moment was found in the Toe.
Note: A moment direction of "2" in the heel has been detected. The
critical shear location of limit states that caused the moment
direction to be "2" in the heel are set to the Eff D location as
documented in the User Manual Section 3.5.1. Limit Case Stage
Max moment in direction "2": -1.04 (kp-ft) STR-III Max Tmp
PARALLEL MOMENT
Limit Load Parallel
State Case Stage Moment
(Controlling) (kip-ft)
Strength: STR-I Max Fin 13.29
Crack Control: SER-I Max Fin 9.60
Figure 7.4.6-1 Controlling Forces
7.4.7 Footing Flexure
The footing flexural strength report identifies the maximum applied moment from the analysis and the
corresponding load combination (limit state / load case / stage) along with a flag indicating origin of the
moment value. The moment resistance is shown in the adjacent column. It includes a strength reduction
factor. The values reported are based on a unit width of structure.
The procedure that evaluates the nominal resistance (see Section 3.5.2) in the perpendicular direction is
also used for the parallel direction. Pile footings have flexural reinforcement in both directions, as shown
in Figure 1. Spread footings are analyzed in the perpendicular direction only. Hence, the report for a
spread footing will only show the results at the toe and heel locations. Pedestal footings are analyzed in

Chapter 7 Output Description
7-32
the parallel direction only because the footing and pedestal are assumed to be made integral using
tranverse shear keys and dowels as per DM-4 Section 10.6.5.2P. Hence, the report for a pedestal footing
will only show the results for the parallel direction.
If the bars at the toe and heel locations do not have a sufficient development length, they are not
considered in the strength calculations. Hence, the Performance Ratio may be zero even though the user
has described some reinforcement at those locations.
The procedure for evaluating parallel moments for pile footing is described in Section 3.5.1.2. The
equation that evaluates the parallel moment and its corresponding variable values is shown after the table
of results.
Development length is checked only when the reinforcement is specified in terms of bar and spacing. If
the reinforcement is specified in terms of area, the program does not check for development length; it is
assumed that the area specified is fully developed. The format shown in Figure 1 also applies to this
case. The program classifies the moment in the footing that causes tensile stresses at the bottom face of
the toe and at the top face of the heel as Condition “1”. When the moment is negative, this is Condition
“2”. See Section 3.5.1 for more information on the Moment Direction Condition.
7.4.7.1 Footing Flexure – Analysis
FLEXURAL STRENGTH
Limit Load Applied Moment Phi Perform Area
Location State Case Stage Moment Resist Factor Ratio Prov
(Controlling) (kip-ft) (kip-ft) (in^2)
Toe STR-I Max Fin 6.80T 9.06 0.900 1.333 0.095
Heel STR-I Max Fin 2.88H 3.84 0.900 1.333 0.039
Top Parallel STR-I Max Fin 57.30 74.82 0.900 1.306 0.817
Bot Parallel STR-I Max Fin 57.30 74.82 0.900 1.306 0.853
NOTE: A "T" following the applied moment indicates that the controlling
moment is found in the Toe for the current location.
An "H" following the applied moment indicates that the controlling
moment is found in the Heel for the current location
Notes:
Applied moments are based on:
vertical force = 36.08 (kip)
footing width = 7.08 (ft)
uniform distrib load (udl) = 5.09 (klf)
maximum pile spacing (s) = 15.00 (ft)
Parallel moment = 0.5*udl*s*s/10
Performance Ratio = Moment Resistance / Applied Moment
Figure 7.4.7-1 Flexural Strength Report for a Pile Footing Analysis

Chapter 7 Output Description
7-33
The FOOTING FLEXURAL - ANALYSIS report contains the following data:
FLEXURAL STRENGTH (spread footing)
1. Location - toe (bottom perpendicular) and heel (top perpendicular).
2. Load combination description - abbreviated description of the limit state, load case and stage.
3. Applied Moment - maximum applied moment at the given location and load combination followed by a
“T” or “H” which indicates which side of the footing the controlling moment originates.
4. Moment Resist - resisting moment at the given location based on developed area of steel.
5. Phi Factor – the flexural resistance factor
6. Perform Ratio - performance ratio for the given load combination (defined by note).
7. Area Prov - area of steel provided at the given location.
FLEXURAL STRENGTH (pedestal footing)
1. Location - top and bottom parallel.
2. Load combination description - abbreviated description of the limit state, load case and stage.
3. Applied Moment - maximum applied moment at the given location and load combination.
4. Moment Resist - resisting moment at the given location.
5. Phi Factor – the flexural resistance factor
6. Perform Ratio - performance ratio for the given load combination (defined by note).
7. Area Prov - area of steel provided at the given location.
8. Notes that indicate how the parallel moment (if applicable) was evaluated - it consists of:
vertical force - largest applied vertical force
footing width
uniform distrib load (udl) - uniform dead load (force/width)
pedestal spacing
equation to compute the moment
Note explaining why pedestal footings do not design the footing reinforcement in the
perpendicular direction (toe and heel locations).
FLEXURAL STRENGTH (pile footing)
1. Location - toe (bottom perpendicular), heel (top perpendicular), top and bottom parallel.
2. Load combination description - abbreviated description of the limit state, load case and stage.
3. Applied Moment - maximum applied moment at the given location and load combination followed by a
“T” or “H” which indicates which side of the footing the controlling moment originates.
4. Moment Resist - resisting moment at the given location; perpendicular direction is based on
developed area of steel, parallel direction is based on total area.
5. Phi Factor – the flexural resistance factor
6. Perform Ratio - performance ratio for the given load combination (defined by note).
7. Area Prov - area of steel provided at the given location.

Chapter 7 Output Description
7-34
8. Notes that indicate how the parallel moment (if applicable) was evaluated - it consists of:
vertical force - largest applied vertical force
footing width
uniform distrib load (udl) - uniform dead load (force/width)
maximum pile spacing
equation to compute the moment
7.4.7.2 Footing Flexure – Design
FLEXURAL STRENGTH
Limit Load Applied Moment Phi Perform 4/3 Mu Area Status
Location State Case Stage Moment Resist Factor Ratio Reqd Codes
(Controlling) (kip-ft) (kip-ft) (kip-ft) (in^2)
Toe STR-I Max Fin 6.80T 9.06 0.900 1.333 9.07 0.095 A
Heel STR-I Max Fin 2.88H 3.84 0.900 1.333 3.84 0.039 A
Top Parallel STR-I Max Fin 57.30 74.82 0.900 1.306 76.40 0.817 B
Bot Parallel STR-I Max Fin 57.30 74.82 0.900 1.306 76.40 0.853 B
NOTE: A "T" following the applied moment indicates that the controlling
moment is found in the Toe for the current location.
An "H" following the applied moment indicates that the controlling
moment is found in the Heel for the current location.
Cracking Moment M(cr): 88.15 (kip-ft)
Status Code Descriptions
A - 4/3*Mu Minimum Criteria Controlled Moment Resistance
B - Mcr Minimum Criteria Controlled Moment Resistance
Notes:
Applied moments are based on:
vertical force = 36.08 (kip)
footing width = 7.08 (ft)
uniform distrib load (udl) = 5.09 (klf)
maximum pile spacing (s) = 15.00 (ft)
Parallel moment = 0.5*udl*s*s/10
Performance Ratio = Moment Resistance / Applied Moment
Figure 7.4.7-2 Flexural Strength Report for a Pile Footing Design
The FOOTING FLEXURAL - DESIGN report contains the following data:
FLEXURAL STRENGTH (spread footing)
1. Location - toe (bottom perpendicular) and heel (top perpendicular).
2. Load combination description - abbreviated description of the limit state, load case and stage.
3. Applied Moment - maximum applied moment at the given location and load combination followed by a
“T” or “H” which indicates which side of the footing the controlling moment originates.
4. Moment Resist - resisting moment at the given location based on developed area of steel.
5. Phi Factor – the flexural resistance factor

Chapter 7 Output Description
7-35
6. Perform Ratio - performance ratio for the given load combination (defined by note).
7. 4/3 Mu – 4 / 3 * Applied Moment.
8. Area Reqd - area of steel required at the given location.
9. Status Codes – indicates which minimum criteria controls the design if applicable.
FLEXURAL STRENGTH (pedestal footing)
1. Location - top and bottom parallel.
2. Load combination description - abbreviated description of the limit state, load case and stage.
3. Applied Moment - maximum applied moment at the given location and load combination.
4. Moment Resist - resisting moment at the given location.
5. Phi Factor – the flexural resistance factor
6. Perform Ratio - performance ratio for the given load combination (defined by note).
7. Area Reqd - area of steel required at the given location.
8. Status Codes – indicates which minimum criteria controls the design if applicable.
9. Notes that indicate how the parallel moment (if applicable) was evaluated - it consists of:
vertical force - largest applied vertical force
footing width
uniform distrib load (udl) - uniform dead load (force/width)
pedestal spacing
equation to compute the moment
Note explaining why pedestal footings do not design the footing reinforcement in the
perpendicular direction (toe and heel locations).
FLEXURAL STRENGTH (pile footing)
1. Location - toe (bottom perpendicular), heel (top perpendicular), top and bottom parallel.
2. Load combination description - abbreviated description of the limit state, load case and stage.
3. Applied Moment - maximum applied moment at the given location and load combination followed by a
“T” or “H” which indicates which side of the footing the controlling moment originates.
4. Moment Resist - resisting moment at the given location; perpendicular direction is based on
developed area of steel, parallel direction is based on total area.
5. Phi Factor – the flexural resistance factor
6. Perform Ratio - performance ratio for the given load combination (defined by note).
7. Area Reqd - area of steel required at the given location.
8. Status Codes – indicates which minimum criteria controls the design if applicable.
9. Notes that indicate how the parallel moment (if applicable) was evaluated - it consists of:
vertical force - largest applied vertical force
footing width
uniform distrib load (udl) - uniform dead load (force/width)
maximum pile spacing

Chapter 7 Output Description
7-36
equation to compute the moment
Cracking Moment – moment used in determining the minimum area of steel needed to prevent concrete
cracking in the footing section.
7.4.8 Crack Control
The type of crack control check that is evaluated depends on the component. A special case applies to
gravity wall stem locations.
7.4.8.1 Crack Control in Footings and Cantilever Stems
The crack control analysis report identifies the allowable tensile reinforcement spacing, and, the
computed serviceability stress in the tensile reinforcement. For stem and backwall locations, the
controlling moment and axial load is printed as shown in Figure 1. For the footing locations, only the
governing moment value is displayed (the axial load is zero), as shown in Figure 2. The status codes
indicate which crack control checks failed. The codes are identified at the bottom of the Figure 2. Both
reports have the same set of codes. If the applied loads do not crack the section, the stress is 0 and
status code E is flagged. If a negative moment is detected, the program will issue a warning which
requires further user attention. The location of the negative moment will be indicated in the table with a
asterisk following the location.
BACKWALL AND STEM
Dist from Area/ Actual Allow Controlling Status
Location Struc Top Width Stress Spacing Moment Axial Codes
(ft) (in^2) (ksi) (in) (kip-ft) (kip)
Backwall 3.05 0.79 0.00 999.99 0.64 0.89 E
Seat 6.10 0.79 0.00 999.99 3.01 1.65 E
Stem A 7.75 0.79 0.00 999.99 21.46 18.56 E
Stem B 9.40 0.79 0.00 999.99 26.42 19.57 E
Stem C 11.05 0.79 0.00 999.99 32.60 20.58 E
Stem D 12.70 0.79 0.00 999.99 39.52 21.59 E
Figure 7.4.8.1-1 Crack Control in Backwall and Stem (Analysis Run)
The CRACK CONTROL - ANALYSIS (backwall and stem / analysis run, Figure 1) report contains the
following data:
BACKWALL AND STEM STEM (no backwall)
1. Location - list of locations in backwall (if applicable) and stem locations (A-D).
2. Distance from Struc Top - distance from the top of the structure to given location.
3. Area / Width - area per unit width of structure.
4. Actual Stress - stress due to applied loads.

Chapter 7 Output Description
7-37
5. Allow Spacing - allowable spacing determined according to Section 3.5.2.8.
6. Controlling Moment - moment from combination that generates the largest stress.
7. Controlling Axial - axial load from combination that generates the largest stress.
8. Status Codes - status codes that apply.
FOOTING
Area/ Actual Allow Control Status
Location Width Stress Spacing Moment Codes
(in^2) (ksi) (in) (kip-ft)
Toe 0.79 0.00 999.99 15.10T E
Heel 0.79 0.00 999.99 2.53H E
NOTE: A "T" following the moment indicates that the controlling
moment is found in the Toe for the current location.
An "H" following the moment indicates that the controlling
moment is found in the Heel for the current location
Status Code Descriptions (Blank indicates an OK status)
A - area smaller than that required for shrinkage/temperature
control or rho min
B - actual spacing is greater than maximum allowed
C - actual stress calculation did not converge
D - actual spacing is greater than allowable crack control spacing
E - applied loads did not crack the cross section. Rebar tensile
stress is set to zero.
F - spacing is less than the minimum allowed
G - Actual stress limited to 0.6*fy in allowable spacing calculation
Figure 7.4.8.1-2 Footing Crack Control Report (Analysis Run)
The CRACK CONTROL ANALYSIS (footing / analysis run, Figure 2) report contains the following data:
FOOTING (spread)
1. Location - toe (bottom perpendicular) and heel (top perpendicular).
2. Area / Width - area per unit width of structure.
3. Actual Stress - stress due to applied loads.
4. Allow Spacing - allowable spacing determined according to Section 3.5.2.8.
5. Controlling Moment - moment from combination that generates the largest stress followed by a “T” or
“H” which indicates which side of the footing the controlling moment originates.
6. Status Codes - status codes that apply.
7. Status Codes Descriptions for codes A-G (see Figure 2).
FOOTING (pedestal)
1. Location - top and bottom parallel.
2. Area / Width - area per unit width of structure.
3. Actual Stress - stress due to applied loads.

Chapter 7 Output Description
7-38
4. Allow Spacing - allowable spacing determined according to Section 3.5.2.8.
5. Controlling Moment - moment from combination that generates the largest stress.
6. Status Codes - status codes that apply.
7. Notes that indicate what the stresses (parallel direction) are based on - it consists of:
vertical force - largest applied vertical force
footing width
uniform distrib load (udl) - uniform dead load (force/width)
pedestal spacing
equation to compute the parallel moment
8. Status Codes Descriptions for codes A-G (see Figure 2).
FOOTING (pile)
1. Location - toe (bottom perpendicular), heel (top perpendicular), top and bottom parallel.
2. Area / Width - area per unit width of structure.
3. Actual Stress - stress due to applied loads.
4. Allow Spacing - allowable spacing determined according to Section 3.5.2.8.
5. Controlling Moment - moment from combination that generates the largest stress followed by a “T” or
“H” which indicates which side of the footing the controlling moment originates.
6. Status Codes - status codes that apply.
7. Notes that indicate what the stresses (parallel direction) are based on - it consists of:
vertical force - largest applied vertical force
footing width
uniform distrib load (udl) - uniform dead load (force/width)
maximum pile spacing
equation to compute the parallel moment
8. Status Codes Descriptions for codes A-G (see Figure 2).
In a design run, at each location, the results are reported for each bar size, as shown in Figure 3. The
status code differ between an analysis and design run. Hence, code F is flagged if the section was
uncracked in a design run. If a negative moment is detected, the program will issue a warning footnote
which requires further user attention immediately following the table for the location. The results for a
footing are shown in Figure 4.
The CRACK CONTROL DESIGN (backwall and stem - design run, Figure 3) report contains the following
data for each applicable location:
ABUTMENT BACKWALL (if applicable) ABUTMENT BACKWALL AT SEAT LEVEL (if applicable) STEM LOCATION A-D STEM CUTOFF LOCATION - SHOWN FOR EACH BAR CUTOFF (if applicable)

Chapter 7 Output Description
7-39
1. Bar Size - list of applicable bar sizes.
2. Bar Spacing - spacing for a given bar size.
3. Area / Width - area per unit width of structure.
4. Actual Stress - stress due to applied loads.
5. Allow Spacing - allowable spacing determined according to Section 3.5.2.8.
6. Controlling Moment - moment from combination that generates the largest stress.
7. Controlling Axial - axial force from combination that generates the largest stress.
8. Status Codes - status codes that apply.
STEM LOCATION D 10.00 (ft) FROM TOP OF STRUCTURE
Back Face Vertical Reinforcement
Bar Bar Area/ Actual Allow Controlling Status
Size Spacing Width Stress Spacing Moment Axial Codes
(in) (in^2) (ksi) (in) (kip-ft) (kip)
4 3.50 0.69 0.00 999.99 33.56 12.62 F
5 5.50 0.68 0.00 999.99 33.56 12.62 F
6 8.00 0.66 0.00 999.99 33.56 12.62 F
7 11.00 0.65 0.00 999.99 33.56 12.62 F
8 13.50 0.70 0.00 999.99 33.56 12.62 EF
9 15.00 0.80 0.00 999.99 33.56 12.62 EF
10 24.00 0.63 0.00 999.99 33.56 12.62 F
11 24.00 0.78 0.00 999.99 33.56 12.62 F
Warning: An applied moment was negative (See Moment Axial Interaction
Table) and may have cracked the section in the front face.
User should determine if the front face has cracked. If so
compute an allowable crack control spacing and compare it to
the temp/shrinkage reinforcement spacing.
Figure 7.4.8.1-3 Crack Control in Backwall and Stem (Design Run)

Chapter 7 Output Description
7-40
FOOTING PARALLEL BOTTOM REINFORCEMENT
Bar Bar Area/ Actual Allow Control Status
Size Spacing Width Stress Spacing Moment Codes
(in) (in^2) (ksi) (in) (kip-ft)
4 1.00 0.96 0.00 999.99 41.04 B F
5 2.00 0.93 0.00 999.99 41.04 B F
... ... ... .... ... ...
11 10.00 1.87 0.00 999.99 41.04 F
Status Code Descriptions (Blank indicates an OK status)
A - min area & max spacing governed by shrinkage/temp requirements
B - spacing is less than minimum allowed, actual stress not computed
C - actual stress calculation did not converge
D - service load requirements result in an over reinforced section
E - development length controlled spacing
F - applied loads did not crack the cross section. Rebar tensile
stress is set to 0.
G - Actual stress limited to 0.6*fy in allowable spacing calculation
Figure 7.4.8.1-4 Footing Crack Control Report (Design Run)

Chapter 7 Output Description
7-41
The CRACK CONTROL DESIGN (footing - parallel direction / design run, Figure 4) report contains the
following data for each applicable location in the footing:
FOOTING PARALLEL BOTTOM REINFORCEMENT (pile and pedestal) FOOTING PARALLEL TOP REINFORCEMENT (pile and pedestal) FOOTING TOE (pile and spread) FOOTING HEEL (pile and spread)
1. Bar Size - list of applicable bar sizes.
2. Bar Spacing - spacing for a given bar size.
3. Area / Width - area per unit width of structure.
4. Actual Stress - stress due to applied loads.
5. Allow Spacing - allowable spacing determined according to Section 3.5.2.8.
6. Controlling Moment - moment from combination that generates the largest stress followed by a “T” or
“H” which indicates which side of the footing the controlling moment originates (For perpendicular
reinforcement in Pile and Spread Footings Only).
7. Status Codes - status codes that apply.
7.4.8.2 Crack Control Check for Gravity Walls
Gravity wall structures (see AWB or RWL command) are only checked for tension in the stem wall.
Tensile stresses are reported as negative values. No reinforcement can be specified for such problems.
A sample of the results is shown in Figure 1. The results are reported for the stem quarter points. Cases
that fail are flagged with an asterisk (*).
The GRAVITY WALL STRESS CHECK (stem) report contains the following data at a given stem location:
STEM LOCATION (A-D) FROM TOP OF STRUCTURE
1. Load combination description - abbreviated description of the limit state, load case and stage .
2. Applied Moment - applied moment at the given location and load combination.
3. Applied Axial - applied axial force the given location and load combination.
4. Actual Stress - stress caused by applied loads for the given load combination.
5. Status - status code for the given load combination.
6. Note about calculating the tensile stress and the applied moment.

Chapter 7 Output Description
7-42
STEM LOCATION D 7.75 (ft) FROM TOP OF STRUCTURE
Stress is based on a stem thickness of 4.73 (ft)
Limit Load Applied Applied Actual
State Case Stage Moment Axial Stress Status
(kip-ft) (kip) (ksf)
STR-I Max Tmp 9.55 9.55 0.54 NG
STR-I Min Tmp 9.68 7.86 0.93 NG
STR-I Max Fin 35.18 21.97 4.79 NG
STR-I Min Fin 27.54 12.89 4.66 NG
...
SER-I Min Fin 23.41 12.15 3.71 NG
Warning: A negative applied moment was encountered.
Note: Positive applied axial loads produce compressive stress.
Actual stress is evaluated on the face where moment produces tensile
stress. A positive applied moment generates a flexural tensile stress
on backface of stem. A negative applied moment generates a flexural
tensile stress on frontface of stem. Positive actual stress indicates
that the combined stresses (axial and flexure) produced a tensile stress
at the extreme fiber of the section.
Figure 7.4.8.2-1 Gravity Wall - Tension Check
7.4.9 Reinforcement Summary
This report shows the flexural reinforcement at each location that was checked in the structure. Backwall
and stem sections are identified by the distance from the top of structure to the location being considered.
Toe and heel locations are examined in pile and spread footings. In pedestal and pile footings, the top
and bottom locations are checked in the parallel direction.
In an analysis run, for each location that is examined in the backwall (if applicable) and stem, the status of
the flexural strength check, the serviceability (crack-control) check and the shear check is reported as
shown in Figure 1. In a design run, the program will report the bar spacing required for strength and
serviceability conditions, as shown in Figure 2.
The REINFORCEMENT SUMMARY - ANALYSIS (backwall and stem / analysis run, Figure 1) report
contains the following data:
ABUTMENT BACKWALL AT SEAT LEVEL (bar size and spacing only)
1. Bar Size - Bar size at the given location.
2. Bar Spacing - Bar spacing at given location.
3. Development Length - Development length of bar at location.
6. Area of Steel Required - Area of steel required for capacity.
7. Area of Steel Provided - Area of steel provided by bar size and spacing.

Chapter 7 Output Description
7-43
4. Splice Length – Length of splice required by the bar size and spacing.
5. Status Codes – Status codes that apply
FOOTING REINFORCEMENT DETAILS (spread - bar size and spacing only)
1. Bar Size - Bar size at the given location.
2. Bar Spacing - Bar spacing at given location.
3. Development Length - Development length of bar at location.
4. Actual Length - Available Length to develop the bar within the geometry of the component.
5. Bar Type - Straight or Hooked bar.
6. Area of Steel Required - Area of steel required for capacity.
7. Area of Steel Provided - Area of steel provided by bar size and spacing.
ABUTMENT BACKWALL AT SEAT LEVEL
Bar Bar Develop Area Area Splice Status
Size Spacing Length Reqd Prov Length Codes
(in) (in) (in^2) (in^2) (in)
5 18.0 12.4 0.204 0.207 21.0
Backwall Height = 26.2 (in)
Status Code Descriptions
A - Splice length exceeds backwall height
FOOTING REINFORCEMENT DETAILS
FOOTING TOE (BOTTOM)
Bar Bar Develop Actual Bar Area Area
Size Spacing Length Length Type Reqd Prov
(in) (in) (in) (in^2) (in^2)
5 9.0 14.4 18.4 S 0.16 0.41
FOOTING HEEL (TOP)
Bar Bar Develop Actual Bar Area Area
Size Spacing Length Length Type Reqd Prov
(in) (in) (in) (in^2) (in^2)
5 9.0 14.4 + 13.0 S 0.27 0.41
+ Indicates bar cannot be developed.
Bar Type Description
S - Straight Bar
H - Hooked Bar
Figure 7.4.9-1 Summary of Reinforcement Perpendicular Footing Bar Development (Analysis Run)
The REINFORCEMENT SUMMARY - ANALYSIS (backwall and stem / analysis run, Figure 2) report contains the
following data:
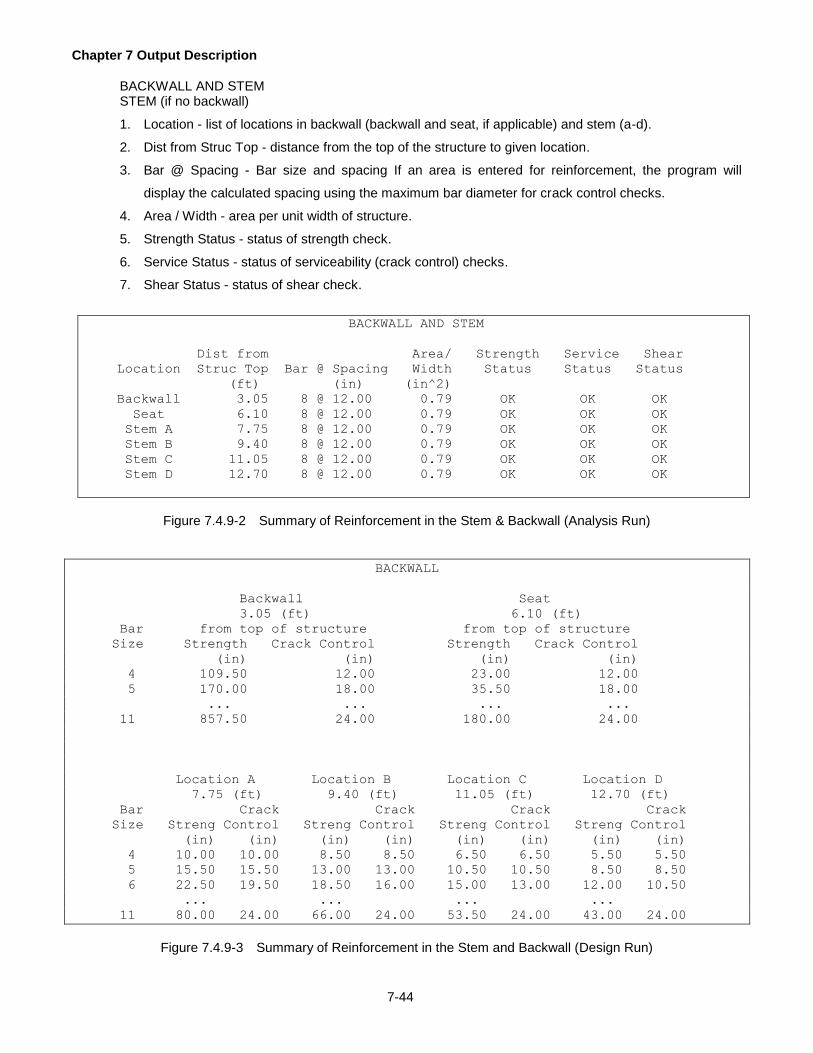
Chapter 7 Output Description
7-44
BACKWALL AND STEM STEM (if no backwall)
1. Location - list of locations in backwall (backwall and seat, if applicable) and stem (a-d).
2. Dist from Struc Top - distance from the top of the structure to given location.
3. Bar @ Spacing - Bar size and spacing If an area is entered for reinforcement, the program will
display the calculated spacing using the maximum bar diameter for crack control checks.
4. Area / Width - area per unit width of structure.
5. Strength Status - status of strength check.
6. Service Status - status of serviceability (crack control) checks.
7. Shear Status - status of shear check.
BACKWALL AND STEM
Dist from Area/ Strength Service Shear
Location Struc Top Bar @ Spacing Width Status Status Status
(ft) (in) (in^2)
Backwall 3.05 8 @ 12.00 0.79 OK OK OK
Seat 6.10 8 @ 12.00 0.79 OK OK OK
Stem A 7.75 8 @ 12.00 0.79 OK OK OK
Stem B 9.40 8 @ 12.00 0.79 OK OK OK
Stem C 11.05 8 @ 12.00 0.79 OK OK OK
Stem D 12.70 8 @ 12.00 0.79 OK OK OK
Figure 7.4.9-2 Summary of Reinforcement in the Stem & Backwall (Analysis Run)
BACKWALL
Backwall Seat
3.05 (ft) 6.10 (ft)
Bar from top of structure from top of structure
Size Strength Crack Control Strength Crack Control
(in) (in) (in) (in)
4 109.50 12.00 23.00 12.00
5 170.00 18.00 35.50 18.00
... ... ... ...
11 857.50 24.00 180.00 24.00
Location A Location B Location C Location D
7.75 (ft) 9.40 (ft) 11.05 (ft) 12.70 (ft)
Bar Crack Crack Crack Crack
Size Streng Control Streng Control Streng Control Streng Control
(in) (in) (in) (in) (in) (in) (in) (in)
4 10.00 10.00 8.50 8.50 6.50 6.50 5.50 5.50
5 15.50 15.50 13.00 13.00 10.50 10.50 8.50 8.50
6 22.50 19.50 18.50 16.00 15.00 13.00 12.00 10.50
... ... ... ...
11 80.00 24.00 66.00 24.00 53.50 24.00 43.00 24.00
Figure 7.4.9-3 Summary of Reinforcement in the Stem and Backwall (Design Run)

Chapter 7 Output Description
7-45
The REINFORCEMENT SUMMARY - DESIGN (backwall and stem / design run, Figure 3) report contains
the following data:
BACKWALL (if applicable) STEM
1. Location - list of locations in backwall (backwall and seat, if applicable) and stem (a-d).
2. Distance from top of structure - distance from the top of the structure to given location.
3. Bar Size - list of applicable bar sizes.
4. Strength - Spacing to the nearest user entered increment for given bar size based on strength
checks.
5. Crack Control - Spacing to the nearest user entered increment for given bar size based on service
checks.
If the reported spacing is less than the User Requested Minimum spacing or the LRFD specified minimum
spacing the program will show the unrounded spacing for information purposes.
The locations checked in a footing depend on the type of footing. In pile footings, the parallel
reinforcement at the top and bottom faces of the footing are reported, see Figure 3. The punching shear
results are reported too. Shear is not checked in the parallel direction in the pile footing - hence the “NA”.
In a design run, the program will report the bar spacing required for strength and serviceability conditions,
as shown in Figure 4. For spread footings, only the toe and heel locations are checked. In pedestal
footings, only the parallel direction is checked. The results of an analysis run are shown in Figure 5, it
has a slight variation from the pile and spread results. The strength and service results for flexure are
output for the two (top and bottom) locations. Only one shear check applies. It is reported on a separate
line.
FOOTING
Area/ Strength Service Shear
Location Bar @ Spacing Width Status Status Status
(in) (in^2)
Toe 5 @ 9.00 0.41 OK OK OK
Heel 5 @ 9.00 0.41 OK OK OK
Top Parallel 6 @ 12.00 0.44 OK OK NA
Bot Parallel 6 @ 12.00 0.44 OK OK NA
Punching shear status is OK
Figure 7.4.9-4 Summary of Reinforcement in the Pile Footing (Analysis Run)
The REINFORCEMENT SUMMARY - ANALYSIS (footing / analysis run, Figure 4) report contains the
following data:
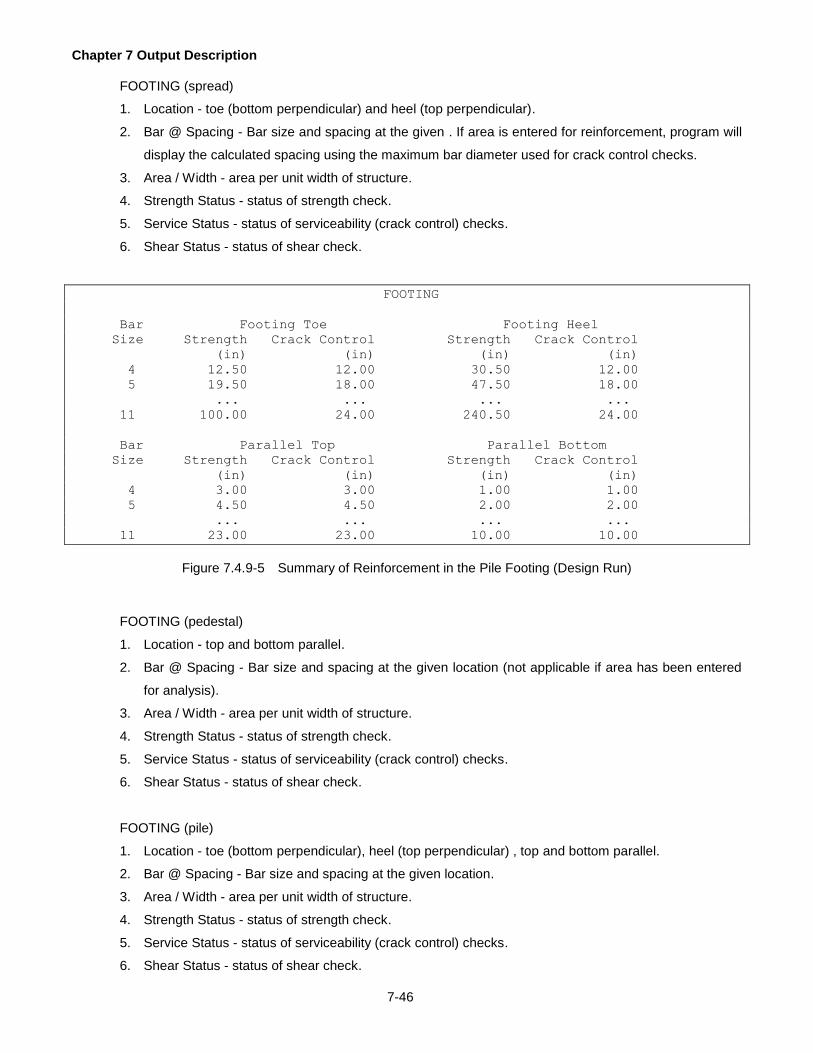
Chapter 7 Output Description
7-46
FOOTING (spread)
1. Location - toe (bottom perpendicular) and heel (top perpendicular).
2. Bar @ Spacing - Bar size and spacing at the given . If area is entered for reinforcement, program will
display the calculated spacing using the maximum bar diameter used for crack control checks.
3. Area / Width - area per unit width of structure.
4. Strength Status - status of strength check.
5. Service Status - status of serviceability (crack control) checks.
6. Shear Status - status of shear check.
FOOTING
Bar Footing Toe Footing Heel
Size Strength Crack Control Strength Crack Control
(in) (in) (in) (in)
4 12.50 12.00 30.50 12.00
5 19.50 18.00 47.50 18.00
... ... ... ...
11 100.00 24.00 240.50 24.00
Bar Parallel Top Parallel Bottom
Size Strength Crack Control Strength Crack Control
(in) (in) (in) (in)
4 3.00 3.00 1.00 1.00
5 4.50 4.50 2.00 2.00
... ... ... ...
11 23.00 23.00 10.00 10.00
Figure 7.4.9-5 Summary of Reinforcement in the Pile Footing (Design Run)
FOOTING (pedestal)
1. Location - top and bottom parallel.
2. Bar @ Spacing - Bar size and spacing at the given location (not applicable if area has been entered
for analysis).
3. Area / Width - area per unit width of structure.
4. Strength Status - status of strength check.
5. Service Status - status of serviceability (crack control) checks.
6. Shear Status - status of shear check.
FOOTING (pile)
1. Location - toe (bottom perpendicular), heel (top perpendicular) , top and bottom parallel.
2. Bar @ Spacing - Bar size and spacing at the given location.
3. Area / Width - area per unit width of structure.
4. Strength Status - status of strength check.
5. Service Status - status of serviceability (crack control) checks.
6. Shear Status - status of shear check.

Chapter 7 Output Description
7-47
7. Punching Shear status.
The REINFORCEMENT SUMMARY - DESIGN (footing / design run, Figure 5) report contains the
following data for each applicable location in the footing:
FOOTING TOE (pile and spread) FOOTING HEEL (pile and spread) PARALLEL TOP (pile) PARALLEL BOTTOM (pile) FOOTING PARALLEL TOP (pedestal) FOOTING PARALLEL BOTTOM (Pedestal)
1. Bar Size - list of applicable bar sizes.
2. Strength - Spacing to the nearest user entered increment for given bar size based on strength
checks.
3. Crack Control - Spacing to the nearest user entered increment for given bar size based on service
checks.
If the reported spacing is less than the User Requested Minimum spacing or the LRFD specified minimum
spacing the program will show the unrounded spacing for information purposes.
The shear capacity is evaluated based on the properties of the concrete section only. Hence, there is no
shear reinforcement reported. A detailed shear report is also generated, it is described in Section 7.4.9.
7.4.10 Shear Results
Backwall and stem are grouped together in one table. Footing results are displayed in a separate table
with a similar format. Refer to Figures 1 and 2 for the explanation that follows.
BACKWALL AND STEM
Dist from Limit Load Applied Shear Perform
Location Struc Top State Case Stage Shear Resist Ratio
(ft) (Controlling) (kip) (kip)
Backwall 3.05 STR-I Max Fin 0.62 20.36 32.960
Seat 6.10 STR-I Max Fin 1.72 20.36 11.812
Stem A 7.75 EXT-I Max Fin 3.09 53.03 17.141
Stem B 9.40 STR-V Max Fin 3.97 53.03 13.341
Stem C 11.05 STR-I Max Fin 5.02 53.03 10.555
Stem D 12.70 STR-I Max Fin 6.32 53.03 8.393
Note: Shear resistance is based on a phi factor of 0.90
Figure 7.4.10-1 Shear Results in the Backwall and Stem
Backwall and stem positions are identified by their location from the top of the structure. At each location,
the maximum shear force that is reported is preceded by the governing load combination. The
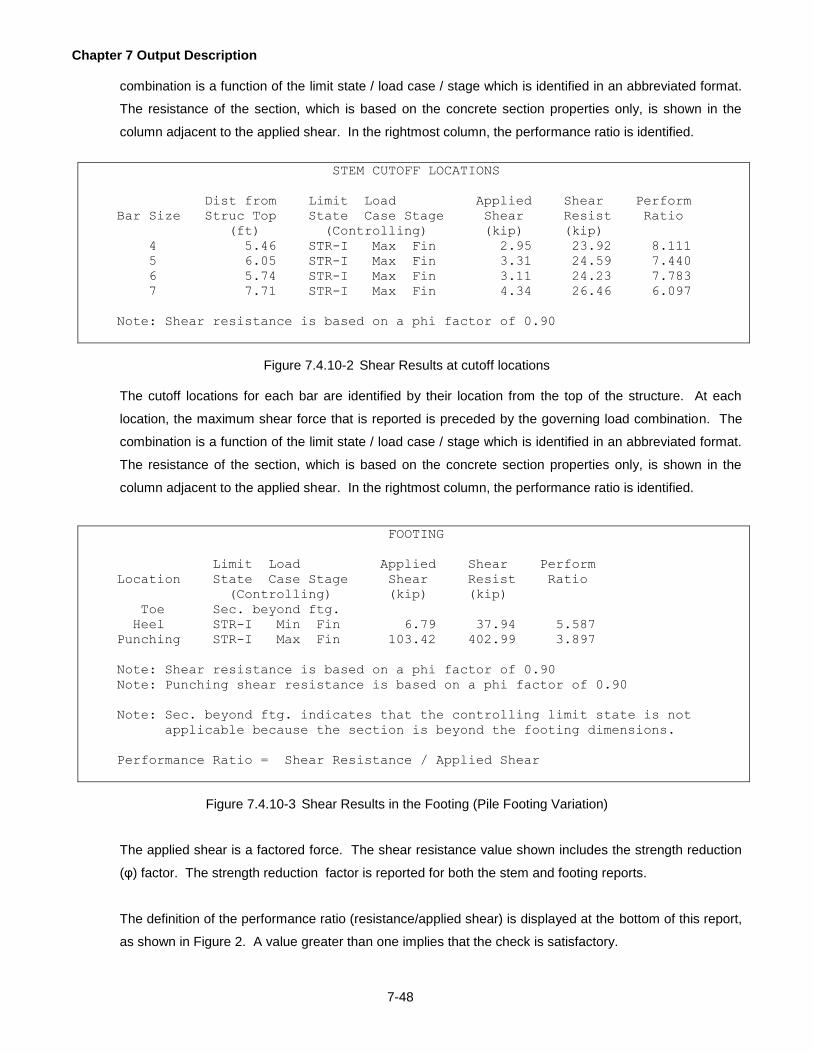
Chapter 7 Output Description
7-48
combination is a function of the limit state / load case / stage which is identified in an abbreviated format.
The resistance of the section, which is based on the concrete section properties only, is shown in the
column adjacent to the applied shear. In the rightmost column, the performance ratio is identified.
STEM CUTOFF LOCATIONS
Dist from Limit Load Applied Shear Perform
Bar Size Struc Top State Case Stage Shear Resist Ratio
(ft) (Controlling) (kip) (kip)
4 5.46 STR-I Max Fin 2.95 23.92 8.111
5 6.05 STR-I Max Fin 3.31 24.59 7.440
6 5.74 STR-I Max Fin 3.11 24.23 7.783
7 7.71 STR-I Max Fin 4.34 26.46 6.097
Note: Shear resistance is based on a phi factor of 0.90
Figure 7.4.10-2 Shear Results at cutoff locations
The cutoff locations for each bar are identified by their location from the top of the structure. At each
location, the maximum shear force that is reported is preceded by the governing load combination. The
combination is a function of the limit state / load case / stage which is identified in an abbreviated format.
The resistance of the section, which is based on the concrete section properties only, is shown in the
column adjacent to the applied shear. In the rightmost column, the performance ratio is identified.
FOOTING
Limit Load Applied Shear Perform
Location State Case Stage Shear Resist Ratio
(Controlling) (kip) (kip)
Toe Sec. beyond ftg.
Heel STR-I Min Fin 6.79 37.94 5.587
Punching STR-I Max Fin 103.42 402.99 3.897
Note: Shear resistance is based on a phi factor of 0.90
Note: Punching shear resistance is based on a phi factor of 0.90
Note: Sec. beyond ftg. indicates that the controlling limit state is not
applicable because the section is beyond the footing dimensions.
Performance Ratio = Shear Resistance / Applied Shear
Figure 7.4.10-3 Shear Results in the Footing (Pile Footing Variation)
The applied shear is a factored force. The shear resistance value shown includes the strength reduction
(φ) factor. The strength reduction factor is reported for both the stem and footing reports.
The definition of the performance ratio (resistance/applied shear) is displayed at the bottom of this report,
as shown in Figure 2. A value greater than one implies that the check is satisfactory.

Chapter 7 Output Description
7-49
The footing portion of the shear report shows the results obtained from the toe and heel critical sections.
Further details concerning the calculation of the shear capacity are described in Section 3.5.2.9.
Punching Shear for piles is described in Section 3.5.2.10.
The SHEAR RESULTS (backwall and stem, Figure 1) report contains the following data:
BACKWALL AND STEM STEM (no backwall case)
1. Location - list of locations in backwall (if applicable) and stem (a-d).
2. Distance from Struc Top - distance from the top of the structure to given location.
3. Load combination description - abbreviated description of the limit state, load case and stage.
4. Applied Shear - shear from the controlling load combination at the given location.
5. Shear Resist - shear resistance at the given location.
6. Perform Ratio - performance ratio.
7. Note about the phi factor for shear.
The SHEAR RESULTS (footing, Figure 2) report contains the following data:
FOOTING (spread)
1. Location - toe (bottom perpendicular) and heel (top perpendicular).
2. Load combination description - abbreviated description of the limit state, load case and stage.
3. Applied Shear - shear from the controlling load combination at the given location.
4. Shear Resist - shear resistance at the given location.
5. Perform Ratio - performance ratio.
6. Note about the phi factor for shear.
FOOTING - parallel direction (pedestal)
1. Location - parallel direction.
2. Load combination description - abbreviated description of the limit state, load case and stage.
3. Applied Shear - shear from the controlling load combination at the given location.
4. Shear Resist - shear resistance at the given location.
5. Perform Ratio - performance ratio.
6. Note about the phi factor for shear.
7. Description of governing applied shear force:
vertical force - largest applied vertical force
footing width
uniform distrib load (udl) - uniform dead load (force/width)
pedestal clear spacing
effective depth near pedestal
equation to compute the applied shear force in the parallel direction

Chapter 7 Output Description
7-50
FOOTING (pile)
1. Location - toe (bottom perpendicular), heel (top perpendicular) and punching case.
2. Load combination description - abbreviated description of the limit state, load case and stage.
3. Applied Shear - shear from the controlling load combination at the given location.
4. Shear Resist - shear resistance at the given location.
5. Perform Ratio - performance ratio.
6. Notes about the phi factor for shear (toe and heel) and punching case.
7.4.11 Reinforcement Design Details
This reinforcement design details has a unique format for each component. For the backwall component,
the program will report the bar spacing and development length for each bar at the seat level, as shown in
Figure 1. The optimal solution (least area per unit width of structure) is identified by an asterisk (*) on the
right of optimal bar size. Status codes are used to indicate if the development length of the bar exceeds
the backwall or stem heights.
ABUTMENT BACKWALL AT SEAT LEVEL
(with optimum stem bar alignment option)
Bar Bar Develop Area Splice Status Reqd Bar Spacing
Size Spacing Length Prov Length Codes for Splice
(in) (in) (in^2) (in) (in)
4 6.1 ++ N/A N/A N/A
5 6.9 ++ N/A N/A N/A
6 * 9.0 12.0 0.587 20.4
7 12.0 13.0 0.600 22.2
8 15.0 16.3 0.632 27.7 C 14.2
9 18.0 19.6 0.667 33.3 C 14.2
10 18.0 19.6 0.847 33.3 C 14.2
11 18.0 19.6 1.040 33.3 C 16.7
Area Reqd = 0.125 (in^2) **
Backwall Height = 26.2 (in)
** Indicates area required was governed by the minimum temperature
and shrinkage reinforcement criteria.
* Indicates bar size and spacing with the least area of steel per unit
width of the structure in the backwall.
Status Code Descriptions
A - Development length exceeds stem height
B - Development length exceeds backwall
C - Splice length exceeds backwall height
D - Area provided is less than area required
Figure 7.4.11-1 Design Details for Abutment Backwall

Chapter 7 Output Description
7-51
The REINFORCEMENT DESIGN DETAILS report (backwall tables, Figure 1) contains the following data:
ABUTMENT BACKWALL AT SEAT LEVEL
1. Location - backwall results are reported at the seat level.
2. Bar Size - list of bar sizes that were considered.
3. Indicator - an asterisk “*” is used to flag the bar/spacing with the least area.
4. Bar Spacing - spacing to the nearest user entered increment for the given bar size.
5. Develop Length - length required to develop the given bar (straight) at the given location.
6. Area Provided - area of steel provided based on bar size and spacing for design width.
7. Splice Length - length required to develop the splice given bar (straight) at the given location.
8. Status Codes - applicable status codes applicable for the given bar.
9. Required Bar Spacing for Splice – provides the calculated bar spacing that may work when the
splice length for the bar size and spacing do not. (Only appears in output if applicable)
10. Area Required - area of steel required.
11. Backwall Height – available height in the backwall to accommodate the splice.
12. Note defining "**", area of steel required by temperature and shrinkage minimum.
13. Note defining “*”, optimal bar.
14. Description of Status codes (see Figure 1).
Figure 2 identifies the bar spacing and development length for each bar at all applicable footing locations,
The optimal solution (least area per unit width of structure) is identified by an asterisk (‘*’) on the right of
optimal bar size. Bars that cannot be developed in the footing are identified by the ‘+’ symbol next to the
development length. The development length check only applies to rebar in the perpendicular direction.

Chapter 7 Output Description
7-52
FOOTING TOE (BOTTOM) FOOTING HEEL (TOP)
Bar Bar Develop Bar Area Bar Bar Develop Bar Area
Size Spacing Length Type Prov Size Spacing Length Type Prov
(in) (in) (in^2) (in) (in) (in^2)
4 7.5 13.6 S 0.320 4 2.0 18.4 S 1.200
5 * 12.0 17.6 S 0.310 5 3.0 22.3 S 1.240
6 17.0 22.3 S 0.311 6 * 4.5 29.9 S 1.173
...
10 18.0 23.6 S 0.847 10 11.0 79.8 S 1.385
11 17.5 28.7 S 1.070 11 13.0 113.0 + S 1.440
Area Reqd = 0.303 (in^2) Area Reqd = 1.084 (in^2)
Actual Length = 29.0 (in) Actual Length = 83.0 (in)
+ Indicates bar cannot be developed.
* Indicates bar size and spacing with the least area of steel per unit
width of the structure in the footing.
Bar Type Description
S - Straight Bar
H - Hooked Bar
Figure 7.4.11-2 Design Details for a Footing (Perpendicular Direction)
The REINFORCEMENT DESIGN DETAILS report (footing tables, Figure 2) contains the following data:
FOOTING TOE (BOTTOM) - pile and spread footings FOOTING HEEL (TOP) - pile and spread footings
1. Location - toe (bottom perpendicular) and heel (top perpendicular).
2. Bar Size - list of bar sizes that were considered.
3. Indicator - an asterisk “*” is used to flag the bar spacing with the least area.
4. Bar Spacing - spacing to the nearest user entered increment for the given bar size.
5. Develop Length - length required to develop the given bar at the given location.
6. Indication if the given bar cannot be developed - a “+” sign is used.
7. Bar Type - indicates whether a straight or hooked bar development length is used.
8. Area Provided - area of steel provided based on bar size and spacing for design width.
9. Area Required - area of steel required.
10. Actual Length - Available geometric length available in component to develop the bar.
11. Note defining "**", area of steel required by temperature ands shrinkage minimum.
12. Notes for definition of “+” (bar cannot be developed) and “*” (optimal bar).
FOOTING PARALLEL TOP - pile and pedestal footings FOOTING PARALLEL BOTTOM - pile and pedestal footings
1. Location - top and bottom parallel locations.
2. Bar Size - list of bar sizes that were considered.
3. Indicator - an asterisk “*” is used to flag the bar spacing with the least area .

Chapter 7 Output Description
7-53
4. Bar Spacing - spacing to the nearest user entered increment for the given bar size.
5. Develop Length - length required to develop the given bar at the given location; bars in the parallel
direction are not checked for development - this is provided as detailing information only.
6. Area Provided - area of steel provided based on bar size and spacing for design width.
7. Area Required - area of steel required.
8. Note defining "**", area of steel required by temperature ands shrinkage minimum.
9. Notes for definition of “+” (bar cannot be developed) and “*” (optimal bar).
10. Note explaining why pedestal footings do not design the footing reinforcement in the perpendicular
direction (toe and heel locations).
In the stem component, the rebar details are reported for location D (base of stem), as shown in Figure 3.
If the reported spacing is less than the User Requested Minimum spacing or the LRFD specified minimum
spacing the program will not report any development length information and will show the unrounded
spacing for information purposes.

Chapter 7 Output Description
7-54
STEM Location D
Hooked Straight
Bar Bar Weight Weight
Bar Bar Bar Lap Develop Develop Area with without Status
Size Space Length Length Length Prov Cutoffs Cutoffs Codes
(in) (in) (in) (in) (in^2) (lbs) (lbs)
4 4.0 20.4 12.2 12.0 0.600 16.16 20.42
5 *+ 6.5 24.9 16.0 14.6 0.572 15.65 19.47
...
10 18.0 77.0 22.0 45.3 0.847 28.81 28.81 F
11 18.0 77.0 19.9 45.3 1.040 35.39 35.39
Area Reqd = 0.422 (in^2)
Actual Length in Footing = 26.2 (in)
Bar Bar Theoret Extension Physical Status
Size Space Cutoff Length Code Cutoff Codes
(in) (in) (in) (in)
4 4.0 49.7 20.4 A 70.0
5 *+ 6.5 52.8 20.1 A 72.9
...
10 18.0 N/A N/A A N/A C
11 18.0 N/A N/A A N/A C
Status Code Descriptions
A - Cutoff location controlled by strength check at cutoff
B - Cutoff location controlled by service load check at cutoff
C - Bars could not be cut off because the resulting bar spacing would
be greater than the maximum allowable bar spacing.
D - Physical cutoff is at the top of wall/stem because the calculated
value is within 2 feet of the top of wall/stem
E - Physical cutoff is at top of wall/stem because the calculated value
is above the actual top of wall/stem.
F - Could not develop the bar into the footing due to insufficient
footing thickness
G - Development length exceeds stem height
* - Indicates bar size and spacing with the least weight of steel per
unit width of the structure at the base of stem when bars are
NOT cutoff
+ - Indicates bar size and spacing with the least weight per
unit width of the structure for the whole height of the stem
when bars are both cutoff and full height
**- Indicates area required was governed by the minimum temperature
and shrinkage reinforcement criteria
++ - Design Spacing is less than the minimum spacing. Bar size is not
applicable.
Extension Length Code
A - Effective Depth Controlled
B - Fifteen Bar Diameters Controlled
C - 12 inch Minimum Controlled
Note: The theoretical cutoff point is where every other
bar is no longer required in the stem.
Note: Stem Bars at Location D are always epoxy coated as per
DM4-2000 Section 5.4.3.6P
Figure 7.4.11-3 Design Details for Stem Location

Chapter 7 Output Description
7-55
For sake of brevity, Figure 3 only shows the results for the first (#4) and last bar (#11). The
REINFORCEMENT DESIGN DETAILS report (stem tables, Figure 3) contains the following data:
STEM Location D 1. Bar Size - bar sizes considered at the given location.
2. Optimum Full Height Bar Size - an asterisk “*” is used to flag the bar/spacing with the least weight
when considering full height stem bars.
3. Optimum Bar Size – a plus sign “+” is used to flag the bar/spacing with the least weight when
considering full height stem bars and cutoff stem bars.
4. Spacing - spacing to the nearest user entered increment for the given bar size at the given location.
5. Bar Lap Length - lap length for the given bar size; provided as detailing information only.
6. Hooked Bar Development Length - length required to develop hooked bar in footing.
7. Develop Length - length required to develop the given bar (straight) in the stem; provided as detailing
information only.
8. Area Provided - area of steel provided based on bar size and spacing for design width.
9. Weight with Cutoffs – weight of reinforcement considering cutoff stem bars for the design section of
the structure.
10. Weight without Cutoffs – weight of reinforcement considering only full height stem bars for the design
section of the structure.
11. Status Codes - various informational and failure codes regarding development length.
12. Area Required - area of steel required.
13. Actual Length in Footing - Available geometric length available in footing to develop the stem bar.
14. Theoret Cutoff - location where the given bar can be cutoff; based on area of required steel at that
location.
15. Extension Length - extension length beyond theoretical cutoff for the given bar size.
16. Extension Code – indicates which criteria controlled the extension length.
17. Physical Cutoff - calculated location where the given bar can be cutoff; based on extension length
and theoretical cutoff location.
18. Status Codes - various informational and failure codes regarding development length and cutoff
locations.
19. Status Code Descriptions - definitions associated with status code A-G (see Figure 3).
If the reported spacing is less than the User Requested Minimum spacing or the LRFD specified minimum
spacing the program will not report any development length information and will show the unrounded
spacing for information purposes.

Chapter 7 Output Description
7-56
7.4.12 Optimal Design Details
The tables shown in Figure 1 identify the optimal rebar solution for each applicable location. The optimal
solution (least area per unit width of structure) is identified by an asterisk (*) on the right of optimal bar
size in the design details report (Section 7.4.10). This format is identical to the design details format. An
explanation of the format can be found in Section 7.4.10.
The OPTIMUM DESIGN DETAILS report (footing and backwall tables, Figure 1) contains the following
data:
ABUTMENT BACKWALL AT SEAT LEVEL 1. Bar Size - optimal bar size for design at the given location.
2. Spacing - optimal bar spacing for the optimum bar size.
3. Develop Length - length required to develop the optimal bar (straight) at the given location.
4. Area Provided - area of steel provided based on bar size and spacing for design width.
5. Splice Length - length required to develop the splice of a given bar (straight).
ABUTMENT BACKWALL AT SEAT LEVEL
Bar Bar Develop Area Splice
Size Spacing Length Prov Length
(in) (in) (in^2) (in)
6 9.0 12.0 0.587 20.4
Figure 7.4.12-1 Optimal Design Results (Backwall)

Chapter 7 Output Description
7-57
FOOTING TOE (BOTTOM) FOOTING HEEL (TOP)
Bar Bar Develop Bar Bar Bar Develop Bar
Size Spacing Length Type Size Spacing Length Type
(in) (in) (in) (in)
5 6.5 12.2 S 4 12.0 12.0 S
Bar Type Description
S - Straight Bar
H - Hooked Bar
STEM Location D
Hooked Straight
Bar Bar Weight Weight
Bar Bar Bar Lap Develop Develop with without Status
Size Space Length Length Length Cutoffs Cutoffs Codes
(in) (in) (in) (in) (lbs) (lbs)
6 * 9.5 32.4 19.7 19.1 18.91 18.91
5 + 6.5 24.9 16.0 14.6 15.65 19.47
Bar Bar Theoret Extension Physical Status
Size Space Cutoff Length Cutoff Codes
(in) (in) (in) (in)
6 * 9.5 N/A N/A N/A C
5 + 6.5 52.8 20.1 72.9
Status Code Descriptions
A - Cutoff location controlled by strength check at cutoff
B - Cutoff location controlled by service load check at cutoff
C - Bars could not be cut off because the resulting bar spacing would
be greater than the maximum allowable bar spacing.
D - Physical cutoff is at the top of wall/stem because the calculated
value is within 2 feet of the top of wall/stem
E - Physical cutoff is at top of wall/stem because the calculated value
is above the actual top of wall/stem.
F - Could not develop the bar into the footing due to insufficient
footing thickness
G - Development length exceeds stem height
* - Indicates bar size and spacing with the least weight of steel per
unit width of the structure at the base of stem when bars are
NOT cutoff
+ - Indicates bar size and spacing with the least weight per
unit width of the structure for the whole height of the stem
when bars are both cutoff and full height
Note: The theoretical cutoff point is where every other
bar is no longer required in the stem.
Note: Stem Bars at Location D are always epoxy coated as per
DM4-2000 Section 5.4.3.6P
Figure 7.4.12-2 Optimal Design Results (Footing and Stem)
The OPTIMUM DESIGN DETAILS report (footing, Figure 2) contains the following data:
FOOTING TOE (BOTTOM) - reported for pile and spread footings FOOTING HEEL (TOP) - reported for pile and spread footings
1. Bar Size - optimal bar size for design at the given location.
2. Spacing - optimum bar spacing for the optimal bar size.

Chapter 7 Output Description
7-58
3. Develop Length - length required to develop the optimal bar as a straight bar.
4. Bar Type - indicates whether a straight or hooked bar development length is used.
FOOTING PARALLEL TOP - reported for pile and pedestal footings FOOTING PARALLEL BOTTOM - reported for pile and pedestal footings
1. Bar Size - optimal bar size for design at the given location.
2. Spacing - optimal bar spacing for the optimal bar size.
3. Develop Length - length required to develop the bar as a straight bar (provided for
information only to assist the engineer in detailing the reinforcement).
The OPTIMUM DESIGN DETAILS report (stem tables, Figure 2) contains the following data:
STEM Location D 1. Bar Size - optimal bar size for design.
2. Optimum Full Height Bar Size - an asterisk “*” is used to flag the bar/spacing with the least weight
when considering full height stem bars.
3. Optimum Bar Size – a plus sign “+” is used to flag the bar/spacing with the least weight when
considering full height stem bars and cutoff stem bars.
4. Spacing - optimal spacing for the optimal bar size.
5. Bar Lap Length - lap length for the optimal bar size; provided for information only to assist the
engineer in detailing the reinforcement.
6. Hooked Bar Development Length - length required to develop optimal bar as a hooked bar in footing.
7. Develop Length - length required to develop the optimal bar as a straight bar in the stem; provided for
information only to assist the engineer in detailing the reinforcement .
8. Weight with Cutoffs – weight of reinforcement considering cutoff stem bars for the design section of
the structure.
9. Weight without Cutoffs – weight of reinforcement considering only full height stem bars for the design
section of the structure.
10. Status Codes - various informational and failure codes regarding development length.
11. Theoret Cutoff - calculated location where given optimal bar size can be cutoff based on the design
area of steel required at that location.
12. Extension Length - extension length required beyond the theoretical cutoff location for the optimal bar
size.
13. Physical Cutoff - calculated location where the given optimal bar can be cutoff (terminated) based on
the combination of the cutoff and extension length.
14. Status Codes - various informational and failure codes regarding development length and cutoff
locations.
15. Status Code Descriptions - definitions associated with status code A-G (see Figure 3) .

Chapter 7 Output Description
7-59
7.5 INTERMEDIATE RESULTS
7.5.1 Unfactored Loads
The first section of this report provides intermediate information about the equivalent fluid pressure (Ka)
used in the lateral earth pressure loads. The table provides the failure method type and all relevant values
used in calculation of the Ka. A sample report is shown in figure 1
LATERAL EARTH PRESSURE (EH) INTERMEDIATE VALUES
Temporary Stage
Failure Soil Height Phi-
Locn Method Ka Kah Kav Height Ratio Alpha Theta Prime Beta
(ft) (deg) (deg) (deg) (deg)
Found Brok -- 0.32 0.06 10.57 0.50 -- -- 37.00 23.59
Stem Brok -- 0.32 0.06 8.57 0.50 -- -- 37.00 23.59
Final Stage
Failure Soil Height Phi-
Locn Method Ka Kah Kav Height Ratio Alpha Theta Prime Beta
(ft) (deg) (deg) (deg) (deg)
Found Brok -- 0.32 0.06 13.70 0.50 -- -- 37.00 23.59
Stem Brok -- 0.32 0.06 8.57 0.50 -- -- 37.00 23.59
Legend
Alpha - Angle of soil wedge measured from the vertical
Theta - Stem back face batter angle
Phi-Prime - Backfill internal friction angle
Beta - Backfill slope measured from the horizontal
Figure 7.5.1-1 Sample Unfactored Loads Report for Stem Location A
The next section of the report identifies the unfactored loads that are applied to the foundation, backwall
(if applicable), stem, footing and pedestal. The foundation report identifies the force and moment from
the horizontal and vertical load components. A similar format is used for the backwall and stem
components. However, when the vertical bearing loads are present, the stem report will show two sets of
vertical moments. The 2 inch positive eccentricity (towards the toe) moment is used for the maximum
load case, while a 2 inch negative eccentricity (towards the heel) moment is used for the minimum load
case. If there are no vertical bearing loads present, the program will output a single moment. The footing
report identifies the shear (at the face and at the effective depth) and the moment at the toe and heel
locations.
The loads are reported for each applicable load type. Both vertical and horizontal load values are
identified where applicable.

Chapter 7 Output Description
7-60
The unfactored loads are divided into those loads applied during the temporary construction stage and
the final construction stage. A sample report of the backwall unfactored loads is shown in Figure 2. A
sample report of the stem with vertical bearing loads is shown in Figure 3.
BACKWALL
Final Stage 3.05 (ft) from top of structure
Applied Vertical Applied Horizontal
Load Force Moment Load Force Moment
(kip) (kip-ft) (kip) (kip-ft)
DC-A 0.71 0.16 EH 0.16 0.20
DW-A 0.06 0.01 ES 0.00 0.00
EV 0.12 -0.06 LS 0.21 0.33
LLBW 0.00 0.00 LLBH 0.00 0.00
BACKWALL (cont.)
Final Stage 6.10 (ft) from top of structure
Applied Vertical Applied Horizontal
Load Force Moment Load Force Moment
(kip) (kip-ft) (kip) (kip-ft)
DC-A 1.47 0.16 EH 0.65 1.59
DW-A 0.06 0.01 ES 0.00 0.00
EV 0.12 -0.06 LS 0.43 1.30
LLBW 0.00 0.00 LLBH 0.00 0.00
Figure 7.5.1-2 Sample Unfactored Loads Report for the Backwall
The UNFACTORED LOADS report (backwall tables, Figure 2) contains the following data:
BACKWALL 1. Stage - construction stage for which loads are reported; Temporary or Final.
2. Location - backwall or stem location distance from top of structure.
3. Applied Load - abbreviated description of the load case.
4. Vertical Force - applied force due to loads applied vertically.
5. Vertical Moment - applied moment due to loads applied vertically.
6. Horizontal Force - applied force due to loads applied horizontal.
7. Horizontal Moment - applied moment due to loads applied horizontally.

Chapter 7 Output Description
7-61
STEM
Temporary Stage Location A 1.94 (ft) from top of structure
Applied Vertical Applied Horizontal
Load Force Moment Load Force Moment
(kip) (kip-ft) (kip) (kip-ft)
LS 0.30 -0.25 WSUB 0.00 0.00
DCAT 0.00 0.00 WA-E 0.00 0.00
STEM (cont.)
Final Stage Location A 1.94 (ft) from top of structure
Vertical Horizontal
------------------------------------- -----------------------------
Applied 2" +ecc 2" -ecc Applied
Load Force Moment Moment Load Force Moment
(kip) (kip-ft) (kip-ft) (kip) (kip-ft)
DC-A* 0.55 0.06 EH 0.32 0.51
DC-S 3.75 1.53 0.28 ES 0.00 0.00
DW-A* 0.02 -0.02 LS 0.63 1.24
DW-S 0.35 0.14 0.03 WA 0.00 0.00
EV * 0.23 -0.20 WL 0.10 0.19
EH-V* 0.23 -0.14 WSUP 0.12 0.23
ES * 0.00 0.00 TU 0.70 1.36
LS * 0.30 -0.25 BR-D 0.12 0.23
WSUP -0.16 -0.07 -0.01 CE-D 0.00 0.00
PL 0.00 0.00 0.00 WSUB 0.00 0.00
LLDD 3.14 1.28 0.24 FR 0.00 0.00
LLDU 0.00 0.00 0.00 WA-E 0.00 0.00
DCAT* 0.00 0.00
Note: An asterisk (*) indicates that the vertical load
does not act through the bearings.
Figure 7.5.1-3 Sample Unfactored Loads Report for Stem Location A
The UNFACTORED LOADS report (backwall and stem tables, Figure 3) contains the following data:
BACKWALL STEM
1. Stage - construction stage for which loads are reported; Temporary or Final.
2. Location - backwall or stem location distance from top of structure.
3. Applied Load - abbreviated description of the load case.
4. Vertical Force - applied force due to loads applied vertically.
5. Vertical 2”+ecc Moment - applied moment due to loads applied vertically. This column contains
the single moment for non-bearing loads and the maximum load case moment with a 2 inch
offset towards the toe for bearing loads.
6. Vertical 2”-ecc Moment - applied moment due to loads applied vertically . The minimum load case
moment with a 2 inch offset towards the heel for bearing loads only.
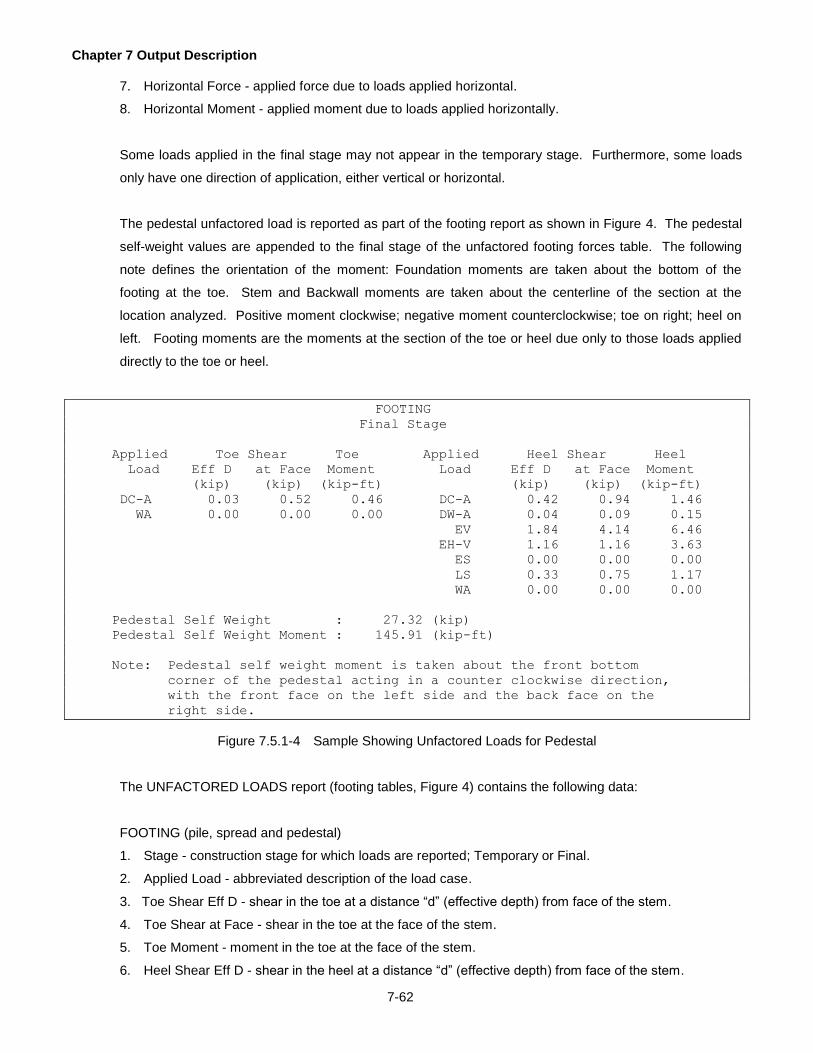
Chapter 7 Output Description
7-62
7. Horizontal Force - applied force due to loads applied horizontal.
8. Horizontal Moment - applied moment due to loads applied horizontally.
Some loads applied in the final stage may not appear in the temporary stage. Furthermore, some loads
only have one direction of application, either vertical or horizontal.
The pedestal unfactored load is reported as part of the footing report as shown in Figure 4. The pedestal
self-weight values are appended to the final stage of the unfactored footing forces table. The following
note defines the orientation of the moment: Foundation moments are taken about the bottom of the
footing at the toe. Stem and Backwall moments are taken about the centerline of the section at the
location analyzed. Positive moment clockwise; negative moment counterclockwise; toe on right; heel on
left. Footing moments are the moments at the section of the toe or heel due only to those loads applied
directly to the toe or heel.
FOOTING
Final Stage
Applied Toe Shear Toe Applied Heel Shear Heel
Load Eff D at Face Moment Load Eff D at Face Moment
(kip) (kip) (kip-ft) (kip) (kip) (kip-ft)
DC-A 0.03 0.52 0.46 DC-A 0.42 0.94 1.46
WA 0.00 0.00 0.00 DW-A 0.04 0.09 0.15
EV 1.84 4.14 6.46
EH-V 1.16 1.16 3.63
ES 0.00 0.00 0.00
LS 0.33 0.75 1.17
WA 0.00 0.00 0.00
Pedestal Self Weight : 27.32 (kip)
Pedestal Self Weight Moment : 145.91 (kip-ft)
Note: Pedestal self weight moment is taken about the front bottom
corner of the pedestal acting in a counter clockwise direction,
with the front face on the left side and the back face on the
right side.
Figure 7.5.1-4 Sample Showing Unfactored Loads for Pedestal
The UNFACTORED LOADS report (footing tables, Figure 4) contains the following data:
FOOTING (pile, spread and pedestal)
1. Stage - construction stage for which loads are reported; Temporary or Final.
2. Applied Load - abbreviated description of the load case.
3. Toe Shear Eff D - shear in the toe at a distance “d” (effective depth) from face of the stem.
4. Toe Shear at Face - shear in the toe at the face of the stem.
5. Toe Moment - moment in the toe at the face of the stem.
6. Heel Shear Eff D - shear in the heel at a distance “d” (effective depth) from face of the stem.

Chapter 7 Output Description
7-63
7. Heel Shear at Face - shear in the heel at the face of the stem.
8. Heel Moment - moment in the heel at the face of the stem.
Foundation moments are taken about the bottom of the footing at the toe. Stem and Backwall moments
are taken about the centerline of the section at the location analyzed. Positive moment clockwise;
negative moment counterclockwise; toe on right; heel on left. Footing moments are the moments at the
section of the toe or heel due only to those loads applied directly to the toe or heel.
The following information is appended for pedestal footings only:
1. Pedestal Self Weight - the self weight of the pedestal.
2. Pedestal Self Weight Moment - the moment (about the front bottom corner of the pedestal) generated
by the self weight of the pedestal.
3. Note defining the pedestal self weight moment.
7.5.2 Load Factors
This report identifies the load factors that are applied for each load combination. A load combination is
defined by three parts, namely: the limit state, the load case (maximum or minimum) and the construction
stage (temporary or final). Refer to the legend for the abbreviations.
The report is grouped by the applicable components, which are the foundation, the backwall (if
applicable), the stem, the footing, and the pedestal (if applicable). The factors are applied to the
unfactored loads that were described in the previous section.
For each load combination entry, a load factor is reported for each applicable load type in the vertical
and/or horizontal direction. In addition, the value of the Eta factor is reported with the appropriate
application symbol: “*” or “/”. The asterisk symbol indicates that the load factor is multiplied by the Eta
factor. The slash symbol indicates that the load factor is divided by the Eta factor. Refer to Section 3.3.5
for further details concerning the application of the Eta factor.
Sample reports are shown in Figure 1 (backwall) and Figure 2 (footing).

Chapter 7 Output Description
7-64
BACKWALL
Vertical Horizontal
Limit Load Applied Load Eta Applied Load Eta
State Case Stage Load Factor Factor Load Factor Factor
STR-I Min Fin DC-A * 0.90 / 1.01 EH * 1.50 * 1.01
DW-A * 0.65 / 1.01 ES * 1.50 * 1.01
EV * 1.00 / 1.01 LS * 1.75 * 1.01
LLBW * 0.00 / 1.01
STR-IP Max Fin DC-A * 1.25 * 1.01 EH * 1.50 * 1.01
DW-A * 1.50 * 1.01 ES * 1.50 * 1.01
EV * 1.35 * 1.01 LS * 1.35 * 1.01
LLBW * 1.35 * 1.01
Figure 7.5.2-1 Load Factors Applied to the Backwall Loads
FOOTING
Toe Heel
Limit Load Applied Load Eta Applied Load Eta
State Case Stage Load Factor Factor Load Factor Factor
STR-I Max Tmp DC-A * 1.25 * 1.01 DC-A * 1.25 * 1.01
WA * 1.00 / 1.01 EV * 1.35 * 1.01
EH-V * 1.50 * 1.01
ES * 1.50 * 1.01
LS * 1.75 * 1.01
WA * 1.00 / 1.01
STR-I Min Tmp DC-A * 0.90 / 1.01 DC-A * 0.90 / 1.01
WA * 1.00 * 1.01 EV * 1.00 / 1.01
EH-V * 1.50 * 1.01
ES * 1.50 * 1.01
LS * 1.75 * 1.01
WA * 1.00 * 1.01
Figure 7.5.2-2 Load Factors in the Footing
Some loads applied in the final stage may not be applied in the temporary stage. Furthermore, some
loads only have one orientation of application, vertical or horizontal. Hence, the only the applicable load
factors are reported.
The LOAD FACTORS report (foundation, backwall and stem tables, Figure 1) contains the following data:
BACKWALL STEM FOUNDATION
1. Location - abutment component (stem, footing or backwall).
2. Load combination description - abbreviated description of the limit state, load case and stage.
3. Vertical Applied Load - abbreviated description of the load case for vertical loads.

Chapter 7 Output Description
7-65
4. Vertical Load Factor - load factor value applied to the vertical load case for the given load
combination. It is preceded by the arithmetic operator (“*” multiplication or “/” division).
5. Vertical Eta Factor - eta factor value applied to the vertical load case for the given load combination. It
is preceded by the applicable arithmetic operator (“*” multiplication or “/” division).
6. Horizontal Applied Load - abbreviated description of the horizontal load case for Horizontal loads.
7. Horizontal Load Factor - load factor value applied to the horizontal load case for the given load
combination. It is preceded by the arithmetic operator (“*” multiplication or “/” division).
8. Horizontal Eta Factor - eta factor value applied to the horizontal load case for the given load
combination. It is preceded by the applicable arithmetic operator (“*” multiplication or “/” division).
The LOAD FACTORS report (footing tables, Figure 2) contains the following data:
FOOTING 1. Load combination description - abbreviated description of the limit state, load case and stage.
2. Toe Applied Load - abbreviated description of the load case applied to the toe.
3. Toe Load Factor - load factor value applied to the load case for the given load combination. It is
preceded by the arithmetic operator (“*” multiplication or “/” division).
4. Toe Eta Factor - eta factor value applied to the load case for the given load combination. It is
preceded by the applicable arithmetic operator (“*” multiplication or “/” division).
5. Heel Applied Load - abbreviated description of the load case applied to the heel.
6. Heel Load Factor - load factor value applied to the load case for the given load combination. It is
preceded by the arithmetic operator (“*” multiplication or “/” division).
7. Heel Eta Factor - eta factor value applied to the load case for the given load combination. It is
preceded by the applicable arithmetic operator (“*” multiplication or “/” division).
7.5.3 Intermediate Bearing Resistance Values
This report provides intermediate values used in the calculation of the bearing resistance of soil
foundations. Intermediate values are shown for each load combination (limit state / load case / stage).
The list of data is for all possible values that can be shown in this report. The reports will be shown based
on the soil condition and will only show values that are pertinent for that soil condition.
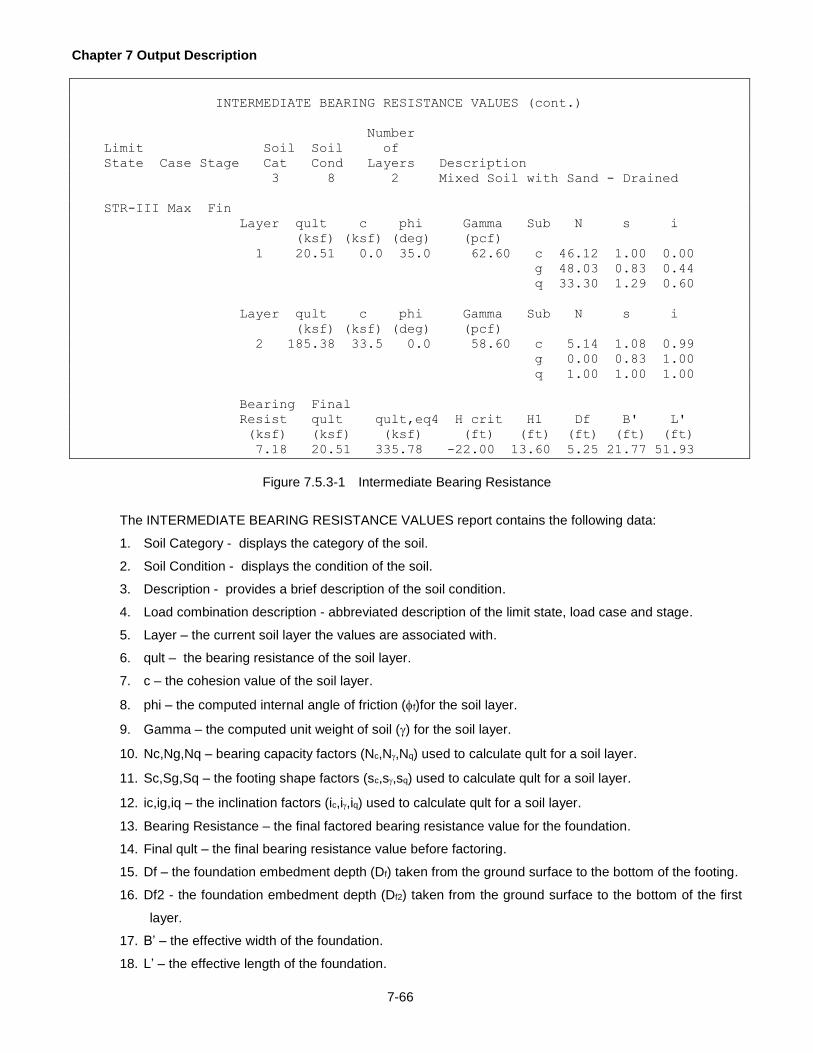
Chapter 7 Output Description
7-66
INTERMEDIATE BEARING RESISTANCE VALUES (cont.)
Number
Limit Soil Soil of
State Case Stage Cat Cond Layers Description
3 8 2 Mixed Soil with Sand - Drained
STR-III Max Fin
Layer qult c phi Gamma Sub N s i
(ksf) (ksf) (deg) (pcf)
1 20.51 0.0 35.0 62.60 c 46.12 1.00 0.00
g 48.03 0.83 0.44
q 33.30 1.29 0.60
Layer qult c phi Gamma Sub N s i
(ksf) (ksf) (deg) (pcf)
2 185.38 33.5 0.0 58.60 c 5.14 1.08 0.99
g 0.00 0.83 1.00
q 1.00 1.00 1.00
Bearing Final
Resist qult qult,eq4 H crit H1 Df B' L'
(ksf) (ksf) (ksf) (ft) (ft) (ft) (ft) (ft)
7.18 20.51 335.78 -22.00 13.60 5.25 21.77 51.93
Figure 7.5.3-1 Intermediate Bearing Resistance
The INTERMEDIATE BEARING RESISTANCE VALUES report contains the following data:
1. Soil Category - displays the category of the soil.
2. Soil Condition - displays the condition of the soil.
3. Description - provides a brief description of the soil condition.
4. Load combination description - abbreviated description of the limit state, load case and stage.
5. Layer – the current soil layer the values are associated with.
6. qult – the bearing resistance of the soil layer.
7. c – the cohesion value of the soil layer.
8. phi – the computed internal angle of friction (f)for the soil layer.
9. Gamma – the computed unit weight of soil () for the soil layer.
10. Nc,Ng,Nq – bearing capacity factors (Nc,N,Nq) used to calculate qult for a soil layer.
11. Sc,Sg,Sq – the footing shape factors (sc,s,sq) used to calculate qult for a soil layer.
12. ic,ig,iq – the inclination factors (ic,i,iq) used to calculate qult for a soil layer.
13. Bearing Resistance – the final factored bearing resistance value for the foundation.
14. Final qult – the final bearing resistance value before factoring.
15. Df – the foundation embedment depth (Df) taken from the ground surface to the bottom of the footing.
16. Df2 - the foundation embedment depth (Df2) taken from the ground surface to the bottom of the first
layer.
17. B’ – the effective width of the foundation.
18. L’ – the effective length of the foundation.

Chapter 7 Output Description
7-67
19. Nm – a bearing capacity factor (Nm).
20. phi f – the final average phi value (f) of soil friction for two layers, computed for Conditions 2,3, and
9.
21. Kappa – the ratio of the cohesion values for two soil layers ().
22. Bm – the punching index (m).
23. H1 – the distance between the bottom of the footing and bottom of the first layer (H1).
24. Delta H – the difference (h) between the maximum effective bearing depth (D) and the depth of the
first layer (H1).
25. H crit – The critical height of soil (Hcrit) where a two layer soil system may be considered a single layer
system.
26. qult2 – the bearing resistance value (qult2)for the second layer for soil condition 6.
27. Ks – the punching shear coefficient (Ks).
28. qult,eq4 – bearing resistance value (qult,eq4) calculated for soil condition 8.
7.5.4 Moment/Axial Interaction
The moment axial report is generated for sections in the backwall and stem. At each section, the applied
moment and axial force from each load combination (limit state / load case / stage) are compared to the
resistance values of the section that is being checked based on either the area of steel provided (analysis
run or area of steel required (design run). This table is not applicable for gravity wall structures.
The reinforcement in the section can be determined by examining the summary reinforcement report.
The capacity of the section is determined from the interaction diagram based on the section properties
and reinforcement. Further details about the section capacity are described in Section 3.6.2.
In a design run, the area required for each load combination is reported. The area required to satisfy rho-
min considerations is reported at the end of the table, as shown in Figure 1. In an analysis run, the area
provided (specified by the user) is reported.
For a design run in which bars can be cutoff, the results of the moment-axial interaction check are
reported at the theoretical cutoff location of the largest bar that can be cutoff. These results provide the
engineer with information about the margin of safety (i.e. performance factor) for strength limit states at
the cutoff location. The user can corroborate the applied loads by referring to the factored forces report
(see Section 7.4.4)

Chapter 7 Output Description
7-68
STEM LOCATION D 12.70 (ft) FROM TOP OF STRUCTURE
Limit Load Applied Moment Applied Axial Perform Area Phi
State Case Stage Moment Resist Axial Resist Ratio Reqd Factor
(kip-ft) (kip-ft) (kip) (kip) (in^2)
STR-I Max Tmp 6.10 6.10 5.36 5.37 1.001 0.01 TR
STR-I Min Tmp 5.91 5.93 3.86 3.88 1.004 0.02 TN
STR-I Max Fin 54.29 54.34 29.33 29.36 1.001 0.19 TN
STR-I Min Fin 43.37 43.40 16.25 16.27 1.001 0.19 TN
STR-III Max Tmp 3.43 442.51 5.36 692.14 129.070 0.00 CM
STR-III Min Tmp 3.24 3.41 3.86 4.06 1.051 0.00 CM
STR-III Max Fin 39.78 39.79 23.20 23.21 1.000 0.13 TN
STR-III Min Fin 35.24 35.25 16.25 16.26 1.000 0.14 TN
STR-V Max Tmp 5.72 5.80 5.36 5.44 1.015 0.01 TR
STR-V Min Tmp 5.53 5.53 3.86 3.86 1.001 0.02 TR
STR-V Max Fin 52.57 52.61 27.93 27.95 1.001 0.19 TN
STR-V Min Fin 43.10 43.10 16.25 16.25 1.000 0.18 TN
SER-I Max Tmp 3.92 3.92 4.29 4.29 1.000 0.00 CM
SER-I Min Tmp 3.92 3.92 4.29 4.29 1.000 0.00 CM
SER-I Max Fin 40.05 40.06 21.84 21.84 1.000 0.14 TN
SER-I Min Fin 36.41 36.41 18.34 18.34 1.000 0.13 TN
Section Thickness = 28.00 (in)
Effective Depth = 24.50 (in)
Area required based on rho-min: 0.43 (in^2) **
Cracking Moment M(cr): 186.85 (kip-ft)
4/3 Mu: 69.30 (kip-ft)
** Indicates governing area of steel for the stem location
Phi Factor Code Descriptions
TN - Tension controlled section
TR - Transition section
CM - Compression controlled section
Performance Ratio = Axial Resistance / Applied Axial Force
Notes:
A positive applied moment produces tensile stress on the backface
reinforcement. A positive applied axial force produces a compressive
stress on the entire cross section. Applied loads are assumed to be
positive. The resistance is based on backface reinforcement only.
Figure 7.5.4-1 Moment Axial Interaction
The MOMENT AXIAL INTERACTION report contains the following data:
ABUTMENT BACKWALL STEM LOCATION (Shown for all bar cutoff locations when selected on the OUI command) 1. Location - backwall (backwall, seat) and stem locations (A-D) followed by distance from top of
structure.
2. Load combination description - abbreviated description of the limit state, load case and stage. The
results at cutoff location, if applicable, are reported at the theoretical cutoff location for the largest bar
that can be cutoff.
3. Applied Moment - factored moment acting on the section for the given load combination.

Chapter 7 Output Description
7-69
4. Moment Resist - resisting moment of the section.
5. Applied Axial - factored axial load acting on the section for the given load combination.
6. Axial Resist - axial load resistance of the section.
7. Perform Ratio - performance ratio (is the same for moment and axial values).
8. Area Prov - for an analysis run the provided area of steel is reported or; Area Reqd - for a design run
the required area of steel is reported.
9. Section Thickness – the thickness of the section at the current location is reported.
10. Effective Depth – the effective depth of the section at the current location is reported.
11. For a design run, the following are also reported:
area required to satisfy rho-min
the cracking moment of concrete at the given location, M(cr)
4/3 * M(u) – 4/3 times the controlling moment at the given location, Mu
12. Phi Factor – indicates which strain region the phi factor is based on (see Section 3.5.2.5)
13. Note defining the performance ratio.
7.5.5 Internal Footing Forces
Internal footing forces are only reported for pile and spread footings.
The internal moment reports identify the net moment that is applied at the face of the stem wall for the toe
and heel sections. The net moment is the difference between the footing moment and the moment
generated by the soil pressure. The moment direction condition is provided to indicate where the moment
in the footing creates tension in the perpendicular reinforcement. The heel internal moments are shown
in Figure 1.
The internal shear report identifies the net shear in the footing at the critical section location. Typically, it
is a distance “d” from the face of the stem in the toe and at the face of the stem for the heel. The format of
this table resembles the internal moment report. Figure 2 for a sample report at the heel shear location.
The vertical pile loads table identifies the vertical load on a given pile within each row (maximum of five
rows). The pile load is determined for every applicable load case. A sample is shown in Figure 3.
The INTERNAL FOOTING FORCES - (spread footing tables, Figures 1,2) report contains the following
data:
HEEL MOMENT (spread footing)
TOE MOMENT (spread footing)
1. Load combination description - abbreviated description of the limit state, load case and stage.
2. Moment due to Soil Pressure - factored moment for the given load combination due to uniform soil
pressure.

Chapter 7 Output Description
7-70
3. Moment due to Footing - factored moment from loads above footing for the given load combination.
4. Total Moment (or Total Shear) - net resultant of the applied moments or shears.
5. Moment Direction(or Shear Location) - provides the direction of moment to indicate whether the top or
bottom face of the footing is in tension.
6. Definitions of total moment.
HEEL MOMENT
Critical section at stem back face
Moment Moment
Limit Load due to due to Total Moment
State Case Stage Soil Pressure Footing Moment Direction
(kip-ft) (kip-ft) (kip-ft)
STR-V Min Tmp 2.33 4.47 2.14 1
STR-V Max Fin 4.97 10.56 5.60 1
STR-V Min Fin 1.09 8.74 7.65 1
EXT-I Max Fin 4.09 6.57 2.48 1
EXT-I Min Fin 0.77 4.74 3.97 1
SER-I Max Tmp 2.75 3.85 1.10 1
SER-I Min Tmp 2.75 3.85 1.10 1
SER-I Max Fin 3.83 7.47 3.65 1
SER-I Min Fin 3.21 7.47 4.26 1
CSS Max Fin 5.00 6.82 1.82 1
CSS Min Fin 5.00 6.82 1.82 1
Note: Moment direction “1” indicates that tension occurs in the top
perpendicular reinforcement. Moment direction “2” indicates that
tension occurs in the bottom perpendicular reinforcement.
Total Heel Moment = Moment due to Footing - Moment due to Soil Pressure
Moments are assumed to cause tension on the bottom face of the
footing at the toe and on the top face of the footing at the heel.
Figure 7.5.5-1 Heel Internal Moment
HEEL SHEAR (spread footing) TOE SHEAR (spread footing)
1. Load combination description - abbreviated description of the limit state, load case and stage
2. Shear due to Soil Pressure - factored shear for the given load combination due to uniform soil
pressure
3. Shear due to Footing - factored shear from loads above footing for the given load combination
4. Total Shear - net resultant of the applied shears
5. Shear Location - this indicates if the shear applies to the section at the face of the stem, at a distance
“d” from the stem, or at an X distance from the back face of the stem
6. Definitions of total shear
7. The effective depth, “d”, for the cross section is reported
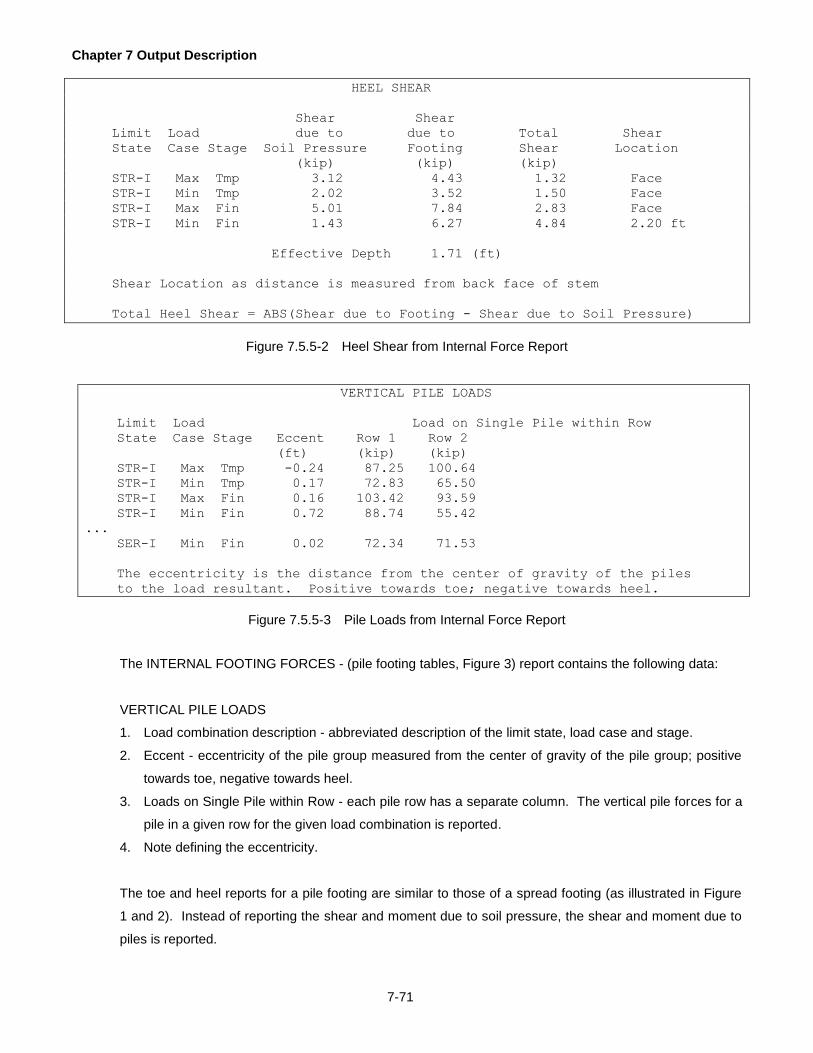
Chapter 7 Output Description
7-71
HEEL SHEAR
Shear Shear
Limit Load due to due to Total Shear
State Case Stage Soil Pressure Footing Shear Location
(kip) (kip) (kip)
STR-I Max Tmp 3.12 4.43 1.32 Face
STR-I Min Tmp 2.02 3.52 1.50 Face
STR-I Max Fin 5.01 7.84 2.83 Face
STR-I Min Fin 1.43 6.27 4.84 2.20 ft
Effective Depth 1.71 (ft)
Shear Location as distance is measured from back face of stem
Total Heel Shear = ABS(Shear due to Footing - Shear due to Soil Pressure)
Figure 7.5.5-2 Heel Shear from Internal Force Report
VERTICAL PILE LOADS
Limit Load Load on Single Pile within Row
State Case Stage Eccent Row 1 Row 2
(ft) (kip) (kip)
STR-I Max Tmp -0.24 87.25 100.64
STR-I Min Tmp 0.17 72.83 65.50
STR-I Max Fin 0.16 103.42 93.59
STR-I Min Fin 0.72 88.74 55.42
...
SER-I Min Fin 0.02 72.34 71.53
The eccentricity is the distance from the center of gravity of the piles
to the load resultant. Positive towards toe; negative towards heel.
Figure 7.5.5-3 Pile Loads from Internal Force Report
The INTERNAL FOOTING FORCES - (pile footing tables, Figure 3) report contains the following data:
VERTICAL PILE LOADS
1. Load combination description - abbreviated description of the limit state, load case and stage.
2. Eccent - eccentricity of the pile group measured from the center of gravity of the pile group; positive
towards toe, negative towards heel.
3. Loads on Single Pile within Row - each pile row has a separate column. The vertical pile forces for a
pile in a given row for the given load combination is reported.
4. Note defining the eccentricity.
The toe and heel reports for a pile footing are similar to those of a spread footing (as illustrated in Figure
1 and 2). Instead of reporting the shear and moment due to soil pressure, the shear and moment due to
piles is reported.

Chapter 7 Output Description
7-72
HEEL MOMENT (pile footing)
TOE MOMENT (pile footing)
1. Load combination description - abbreviated description of the limit state, load case and stage.
2. Moment due to Piles - factored moment for the given load combination due to piles.
3. Moment due to Footing - factored moment from loads above footing for the given load combination.
4. Total Moment - net resultant of the applied moments.
5. Moment Direction - provides the direction of moment to indicate whether the top or bottom face of the
footing is in tension.
6. Definitions of total moment.
HEEL SHEAR (pile footing)
TOE SHEAR (pile footing)
1. Load combination description - abbreviated description of the limit state, load case and stage.
2. Shear due to Piles - factored shear for the given load combination due to piles.
3. Shear due to Footing - factored shear from loads above footing for the given load combination.
4. Total Shear - net resultant of the applied moments or shears.
5. Shear Location - this indicates if the shear applies to the section at the face of the stem, at a distance
“d” from the stem, or at an X distance from the back face of the stem.
6. Definitions of total shear.
7. The effective depth for the cross section is reported.
7.5.6 Minimum Reinforcement Check
The Minimum Reinforcement Check table is only reported for analysis runs.
The Minimum Reinforcment Check table reports relevant intermediate values used in determining the
minimum reinforcement area of steel for each design location.

Chapter 7 Output Description
7-73
BACKWALL AND STEM
Cracking Temp Area
Dist from Moment Rho Min Shrink Prov/ Status
Location Struc Top M(cr) 4/3*M(u) Area Area Width Code
(ft) (kip-ft) (kip-ft) (in^2) (in^2) (in^2)
Backwall 2.50 42.34 -2.64+ 0.03 0.20* 0.20
Seat 5.00 42.34 -1.36+ 0.02 0.20* 0.20
Stem A 7.38 80.04 11.41+ 0.10 0.27* 1.20
Stem B 9.58 120.98 30.62+ 0.21 0.27* 1.20
Stem C 11.79 170.35 54.19+ 0.31* 0.27 1.20
Stem D 14.00 228.15 81.70+ 0.40* 0.27 1.20
FOOTING
Cracking Temp Area
Moment Rho Min Shrink Prov/ Status
Location M(cr) 4/3*M(u) Area Area Width Code
(kip-ft) (kip-ft) (in^2) (in^2) (in^2)
Toe 74.82 34.68+ 0.31* 0.27 0.59
Heel 74.82 14.43+ 0.12 0.27* 0.59
Top Parallel 74.82 56.04+ 0.50* 0.27 0.59
Bot Parallel 74.82 56.04+ 0.52* 0.27 0.59
Status Code Descriptions
+ - Controlling moment for Rho Min Area calculation
* - Controlling minimum area of steel
A - Area provided smaller than required minimum area of steel
Figure 7.5.6-1 Minimum Reinforcement Check Report
BACKWALL AND STEM
1. Location - backwall (backwall, seat) and stem locations (A-D).
2. Distance from Struc Top - distance from the top of the structure to given location.
3. Cracking Moment M(cr) – cracking moment of concrete at the given location.
4. 4/3*M(u) – 4/3 times the controlling moment at the given location.
5. Rho Min Area – controlling minimum area of steel based on M(cr) and 4/3*M(u).
6. Temp Shrink Area – minimum area of steel based on temperature and shrinkage requirements.
7. Area Prov/ Width –the provided area of steel per design width is reported.
8. Status Code – indicates in the area provided is less than the minimum area required.
FOOTING
1. Location - backwall (backwall, seat) and stem locations (A-D) followed by distance from top of
structure.
2. Cracking Moment M(cr) – cracking moment of concrete at the given location.
3. 4/3*M(u) – 4/3 times the controlling moment at the given location.
4. Rho Min Area – controlling minimum area of steel based on M(cr) and 4/3*M(u).
5. Temp Shrink Area – minimum area of steel based on temperature and shrinkage requirements.

Chapter 7 Output Description
7-74
6. Area Prov/ Width –the provided area of steel per location is reported.
7. Status Code – indicates in the area provided is less than the minimum area required.

Chapter 7 Output Description
7-75
7.6 FORMATTED OUTPUT TABLES
The following pages contain the format (i.e. the title, output parameters, units, field width and decimal locations
and legends) for each output table described in this chapter in the order listed in this chapter. On each table, the
character “a” represents a character value for that column and the number of “a” characters shows the number of
characters possible there. The character “i” represents an integer value for that column and the character “x”
represents a real value for that column with the decimal location indicated. The output available for every run of
the program may not include all of the output tables shown. Depending on such items as the live loadings, type of
run, specifications checked, and output commands and parameters chosen, the program will print different
combinations of these output reports.
7.6.1 INPUT ECHO Report Format - Using Spread Footing Input
EX14.DAT
--------
TTL Example Problem 14 - Analysis of Abutment Type I on spread footing
TTL
TTL
TTL This problem is based on Example 1
!
CFG 83,0
!
! Control Data
!
CTL US, A,
!
!
! Abutment Type 1
!
AT1 12.7, 15.0, 29.0, 0.0, 48.2, 4.0, 21.0, 4.0, 9.0, 16.0, 14.0, , ,-
10.95
!
!
! Footing
!
FTG 2.0, 2.58, 2.33, , , , ,
!
!
! Spread Footing - analysis case: don't specify anything
!
!
! Materials
!
MAT 3.5, 3.0, 3.0, 50.0, N, N, N
!
!
! Soil Layer
!
SOI 14.7, 50.2, N, 2.0, 1.0, 0.5, 0.85, 1, 10., , 120., 135., 500., 0.3,-
1.0, 30., ,
!
!
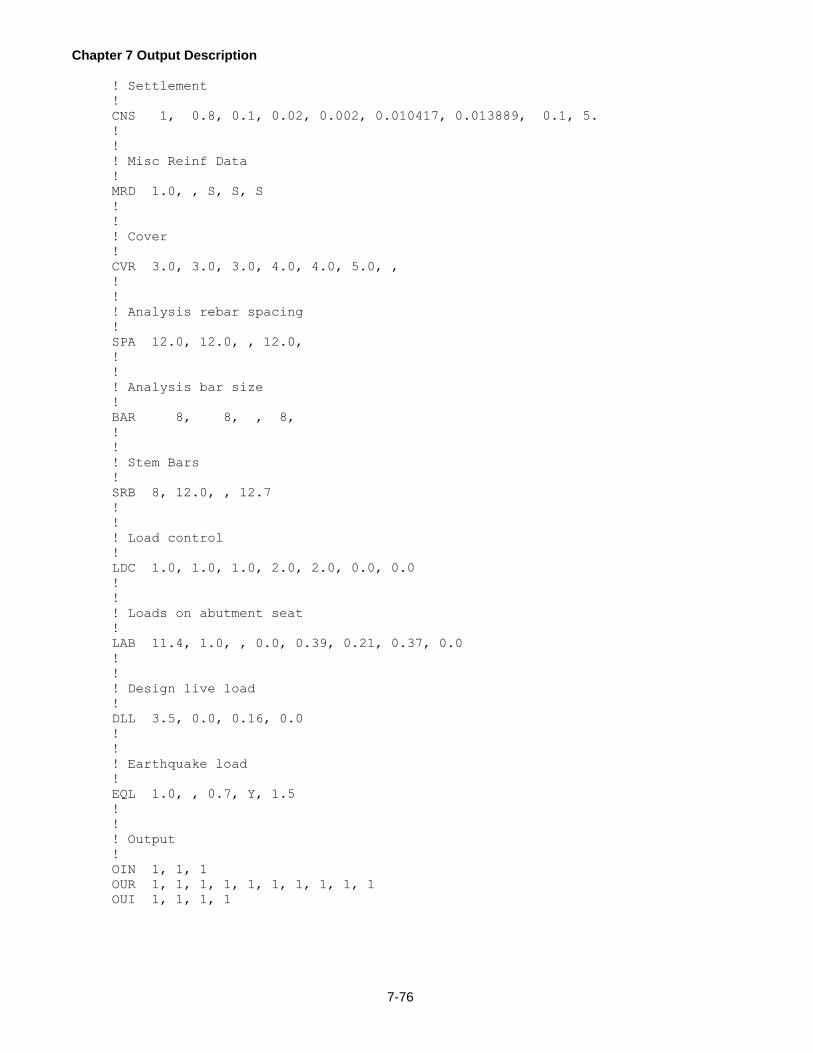
Chapter 7 Output Description
7-76
! Settlement
!
CNS 1, 0.8, 0.1, 0.02, 0.002, 0.010417, 0.013889, 0.1, 5.
!
!
! Misc Reinf Data
!
MRD 1.0, , S, S, S
!
!
! Cover
!
CVR 3.0, 3.0, 3.0, 4.0, 4.0, 5.0, ,
!
!
! Analysis rebar spacing
!
SPA 12.0, 12.0, , 12.0,
!
!
! Analysis bar size
!
BAR 8, 8, , 8,
!
!
! Stem Bars
!
SRB 8, 12.0, , 12.7
!
!
! Load control
!
LDC 1.0, 1.0, 1.0, 2.0, 2.0, 0.0, 0.0
!
!
! Loads on abutment seat
!
LAB 11.4, 1.0, , 0.0, 0.39, 0.21, 0.37, 0.0
!
!
! Design live load
!
DLL 3.5, 0.0, 0.16, 0.0
!
!
! Earthquake load
!
EQL 1.0, , 0.7, Y, 1.5
!
!
! Output
!
OIN 1, 1, 1
OUR 1, 1, 1, 1, 1, 1, 1, 1, 1, 1
OUI 1, 1, 1, 1

Chapter 7 Output Description
7-77
7.6.2 INPUT COMMANDS Report Format - Using Spread Footing Input
COMMAND: CFG
MAXIMUM LINES PER PAGE 83
TOP BLANK LINES PER PAGE 0
COMMAND: CTL
SYSTEM OF UNITS US
TYPE OF RUN A
FOOTING DATUM * (computed, if necessary)
COMMAND: AT1
HEIGHT 12.7 ft
TOP WIDTH 15.0 in
SEAT WIDTH 29.0 in
SEAT SLOPE HEIGHT 0.0 in
SEAT FACE HEIGHT 48.2 in
CORBEL WIDTH 4.0 in
CORBEL HEIGHT 21.0 in
CORBEL SLOPE HEIGHT 4.0 in
PAVING NOTCH WIDTH 9.0 in
PAVING NOTCH HEIGHT 16.0 in
BEARING LOCATION - X DIR 14.0 in
BEARING LOCATION - Y DIR * in (computed, if necessary)
FRONT WATER LEVEL * ft (computed, if necessary)
BACK WATER LEVEL 10.95 ft
COMMAND: FTG
MINIMUM FOOTING THICKNESS 2.0 ft
MINIMUM TOE PROJECTION 2.58 ft
MINIMUM HEEL PROJECTION 2.33 ft
MINIMUM FOOTING WIDTH * ft (computed, if necessary)
MAXIMUM FOOTING THICKNESS * ft (computed, if necessary)
MAXIMUM TOE PROJECTION * ft (computed, if necessary)
MAXIMUM HEEL PROJECTION * ft (computed, if necessary)
MAXIMUM FOOTING WIDTH * ft (computed, if necessary)
COMMAND: MAT
BACKWALL CONC. STRENGTH 3.5 ksi
STEM CONC. STRENGTH 3.0 ksi
FOOTING CONC. STRENGTH 3.0 ksi
REINF. YIELD STRENGTH 50.0 ksi
EPOXY COAT BARS - BACK N
EPOXY COAT BARS - STEM N
EPOXY COAT BARS - FOOT N
BACKFILL FRICTION ANGLE 33.25 deg (default)
BACKFILL UNIT WEIGHT DRY 120.0 lb/ft^3 (default)
BACKFILL UNIT WEIGHT SAT 135.0 lb/ft^3 (default)
MIN EQUIV EARTH PRESSURE 35.0 lb/ft^3 (default)
COMMAND: SOI
STEM TOP TO SOIL LAYER 14.7 ft
FOOTING LENGTH (PARALLEL) 50.2 ft
FOOTING NEAR SLOPE? N
SOIL LEVEL OVER TOE 2.0 ft
ALLOWABLE SETTLEMENT 1.0 in
BEARING CAPACITY PHI 0.5
SLIDING PHI FACTOR 0.85
NUMBER OF SOIL LAYERS 1

Chapter 7 Output Description
7-78
SOIL LAYER THICKNESS 10. ft
UNDRAINED SHEAR STRENGTH * ksf (computed, if necessary)
MASS UNIT WEIGHT 120. lb/ft^3
SATURATED UNIT WEIGHT 135. lb/ft^3
ELASTIC MODULUS 500. ksf
POISSONS RATIO 0.3
COHESION 1.0 ksf
FRICTION ANGLE (EFFECT) 30. deg
NCQ (NEAR SLOPE) * (computed, if necessary)
N_GAMMA_Q (NEAR SLOPE) * (computed, if necessary)
APPLY INCLINATION FACTOR Y (default)
PRECAST OR CAST-IN-PLACE C (default)
COMMAND: CNS
NUMBER OF LAYERS 1
VOID RATIO 0.8
COMPRESSION INDEX 0.1
RECOMPRESSION INDEX 0.02
SECONDARY COMP. INDEX 0.002
EFF. STRESS (INITIAL) 0.010417 ksi
EFF. STRESS (MAX PAST) 0.013889 ksi
PRIMARY CONSOLID. (T1) 0.1 year
SERVICE LIFE (T2) 5. year
COMMAND: MRD
AGGREGATE SIZE 1.0 in
DEVELOPMENT CORRECTION 1.0 (default)
BACKWALL EXPOSURE S
STEM EXPOSURE S
FOOTING EXPOSURE S
COMMAND: CVR
BACKWALL BACK - VERT. 3.0 in
STEM BACK - VERTICAL 3.0 in
FOOTING TOP PERPEND. 3.0 in
FOOTING TOP PARALLEL 4.0 in
FOOTING BOTTOM PERPEND. 4.0 in
FOOTING BOTTOM PARALLEL 5.0 in
TOE END COVER 4.0 in (default)
HEEL END COVER 4.0 in (default)
COMMAND: SPA
BACKWALL BACK - VERT. 12.0 in
FOOTING TOP PERPEND. 12.0 in
FOOTING TOP PARALLEL * in (computed, if necessary)
FOOTING BOTTOM PERPEND. 12.0 in
FOOTING BOTTOM PARALLEL * in (computed, if necessary)
COMMAND: BAR
BACKWALL BACK - VERT. 8 US bar
FOOTING TOP PERPEND. 8 US bar
FOOTING TOP PARALLEL * US bar (computed, if necessary)
FOOTING BOTTOM PERPEND. 8 US bar
FOOTING BOTTOM PARALLEL * US bar (computed, if necessary)
COMMAND: SRB
BAR SIZE 8 US bar
BAR SPACING 12.0 in
GROUP OFFSET * in (computed, if necessary)
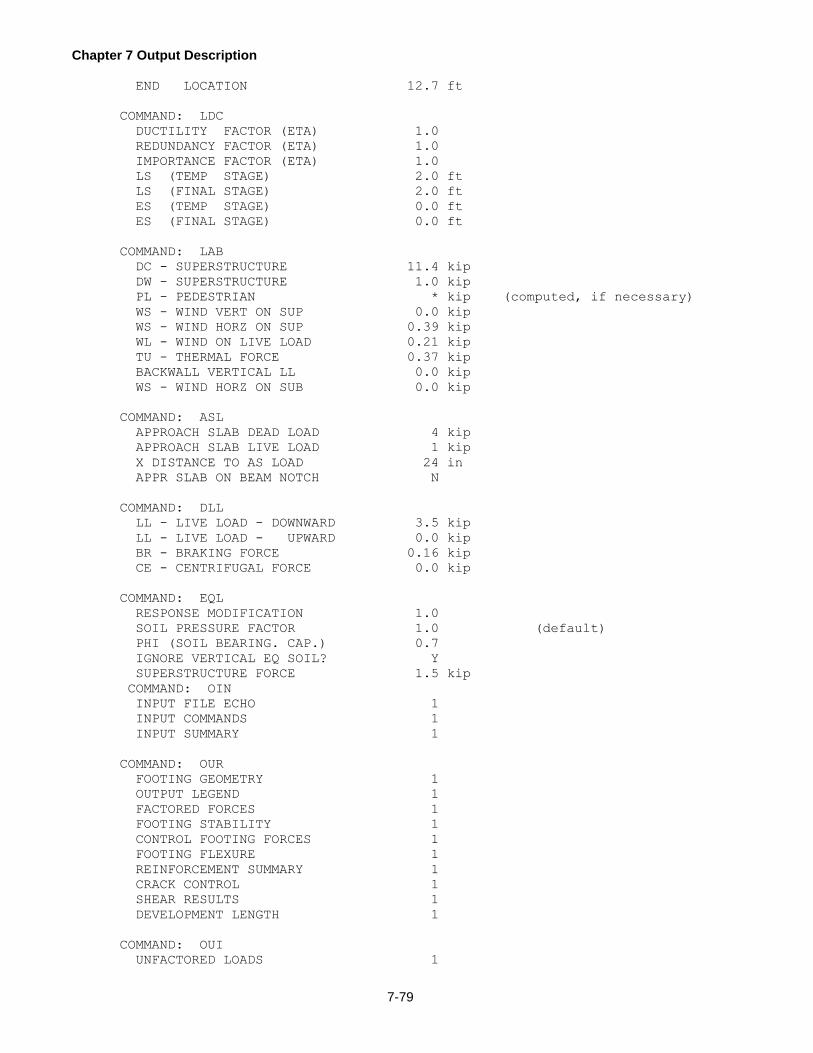
Chapter 7 Output Description
7-79
END LOCATION 12.7 ft
COMMAND: LDC
DUCTILITY FACTOR (ETA) 1.0
REDUNDANCY FACTOR (ETA) 1.0
IMPORTANCE FACTOR (ETA) 1.0
LS (TEMP STAGE) 2.0 ft
LS (FINAL STAGE) 2.0 ft
ES (TEMP STAGE) 0.0 ft
ES (FINAL STAGE) 0.0 ft
COMMAND: LAB
DC - SUPERSTRUCTURE 11.4 kip
DW - SUPERSTRUCTURE 1.0 kip
PL - PEDESTRIAN * kip (computed, if necessary)
WS - WIND VERT ON SUP 0.0 kip
WS - WIND HORZ ON SUP 0.39 kip
WL - WIND ON LIVE LOAD 0.21 kip
TU - THERMAL FORCE 0.37 kip
BACKWALL VERTICAL LL 0.0 kip
WS - WIND HORZ ON SUB 0.0 kip
COMMAND: ASL
APPROACH SLAB DEAD LOAD 4 kip
APPROACH SLAB LIVE LOAD 1 kip
X DISTANCE TO AS LOAD 24 in
APPR SLAB ON BEAM NOTCH N
COMMAND: DLL
LL - LIVE LOAD - DOWNWARD 3.5 kip
LL - LIVE LOAD - UPWARD 0.0 kip
BR - BRAKING FORCE 0.16 kip
CE - CENTRIFUGAL FORCE 0.0 kip
COMMAND: EQL
RESPONSE MODIFICATION 1.0
SOIL PRESSURE FACTOR 1.0 (default)
PHI (SOIL BEARING. CAP.) 0.7
IGNORE VERTICAL EQ SOIL? Y
SUPERSTRUCTURE FORCE 1.5 kip
COMMAND: OIN
INPUT FILE ECHO 1
INPUT COMMANDS 1
INPUT SUMMARY 1
COMMAND: OUR
FOOTING GEOMETRY 1
OUTPUT LEGEND 1
FACTORED FORCES 1
FOOTING STABILITY 1
CONTROL FOOTING FORCES 1
FOOTING FLEXURE 1
REINFORCEMENT SUMMARY 1
CRACK CONTROL 1
SHEAR RESULTS 1
DEVELOPMENT LENGTH 1
COMMAND: OUI
UNFACTORED LOADS 1

Chapter 7 Output Description
7-80
LOAD FACTORS 1
MOMENT AXIAL INTERACTION 1
INTERNAL FOOTING FORCES 1
7.6.3 INPUT SUMMARY Report Format
CONFIGURATION
Lines Blank
per Lines
Page on Top
ii ii
CONTROL
Sys of Type Footing
Units of Run Datum
aa a a
ABUTMENT TYPE I
Seat Seat Corbel
Top Seat Slope Face Corbel Corbel Slope
Height Width Width Height Height Width Height Height
(ft) (in) (in) (in) (in) (in) (in) (in)
xxx.xx xxx.x xxx.x xx.x xxx.x xx.x xxx.x xx.x
Paving Paving Front Back Architectural Backwall/
Notch Notch Bearing Bearing Water Water Treatment Stem Bar
Width Height X Locn Y Locn Level Level Thickness Alignment
(in) (in) (in) (in) (ft) (ft) (in)
xx.x xx.x xx.x xxx.x xxx.xx xxx.xx xx.x aaa
ABUTMENT TYPE II
Seat Seat Corbel Paving Paving
Top Seat Slope Face Corbel Corbel Slope Notch Notch
Height Width Width Height Height Width Height Height Width Height
(ft) (in) (in) (in) (in) (in) (in) (in) (in) (in)
xxx.xx xxx.x xxx.x xx.x xxx.x xx.x xxx.x xx.x xx.x xx.x
Stem Stem Front Face Front Face Back Face Back Face
Backwall Notch Notch Horizontal Vertical Horizontal Vertical
Height Width Height Component Component Component Component
(in) (in) (in)
xxx.x xxx.x xxx.x xxx.xx xxx.xx xxx.xx xxx.xx
Front Back Architectural Backwall/
Bearing Bearing Water Water Treatment Stem Bar
X Locn Y Locn Level Level Thickness Alignment
(in) (in) (ft) (ft) (in)
xx.x xxx.x xxx.xx xxx.xx xx.x aaa
ABUTMENT WITHOUT BACKWALL
Front Face Front Face Back Face Back Face
Top Bearing Horizontal Vertical Horizontal Vertical
Height Width Location Component Component Component Component
(ft) (in) (in)
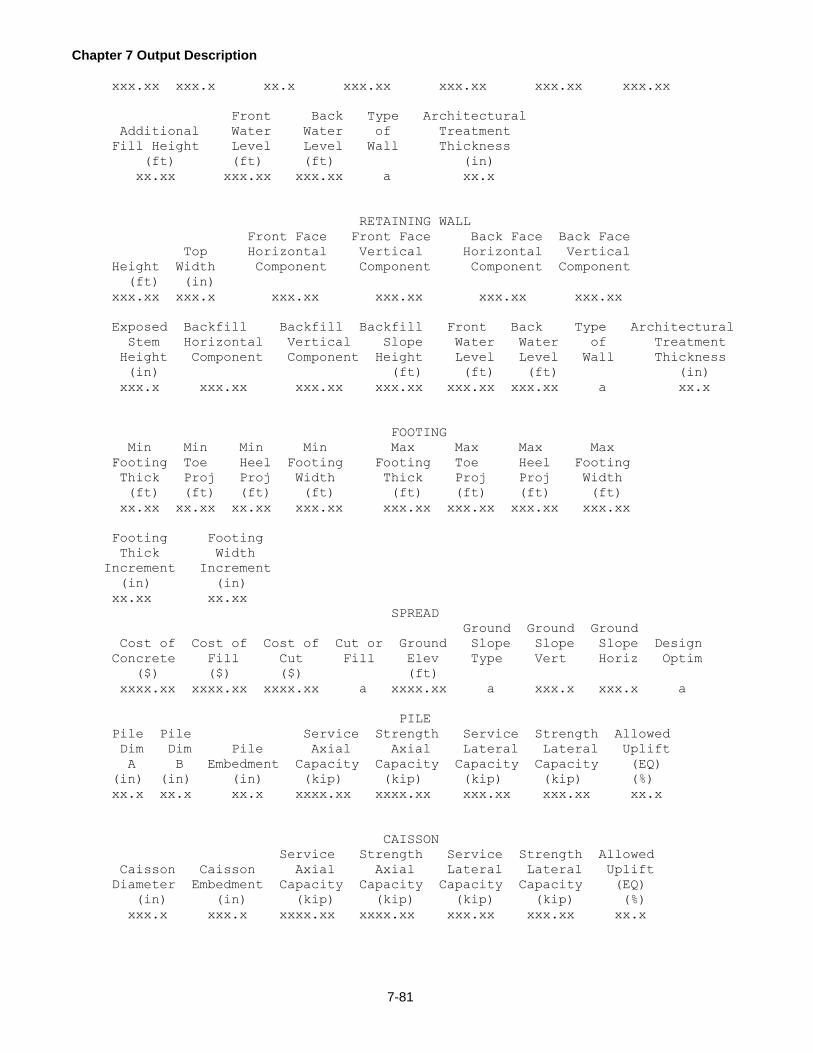
Chapter 7 Output Description
7-81
xxx.xx xxx.x xx.x xxx.xx xxx.xx xxx.xx xxx.xx
Front Back Type Architectural
Additional Water Water of Treatment
Fill Height Level Level Wall Thickness
(ft) (ft) (ft) (in)
xx.xx xxx.xx xxx.xx a xx.x
RETAINING WALL
Front Face Front Face Back Face Back Face
Top Horizontal Vertical Horizontal Vertical
Height Width Component Component Component Component
(ft) (in)
xxx.xx xxx.x xxx.xx xxx.xx xxx.xx xxx.xx
Exposed Backfill Backfill Backfill Front Back Type Architectural
Stem Horizontal Vertical Slope Water Water of Treatment
Height Component Component Height Level Level Wall Thickness
(in) (ft) (ft) (ft) (in)
xxx.x xxx.xx xxx.xx xxx.xx xxx.xx xxx.xx a xx.x
FOOTING
Min Min Min Min Max Max Max Max
Footing Toe Heel Footing Footing Toe Heel Footing
Thick Proj Proj Width Thick Proj Proj Width
(ft) (ft) (ft) (ft) (ft) (ft) (ft) (ft)
xx.xx xx.xx xx.xx xxx.xx xxx.xx xxx.xx xxx.xx xxx.xx
Footing Footing
Thick Width
Increment Increment
(in) (in)
xx.xx xx.xx
SPREAD
Ground Ground Ground
Cost of Cost of Cost of Cut or Ground Slope Slope Slope Design
Concrete Fill Cut Fill Elev Type Vert Horiz Optim
($) ($) ($) (ft)
xxxx.xx xxxx.xx xxxx.xx a xxxx.xx a xxx.x xxx.x a
PILE
Pile Pile Service Strength Service Strength Allowed
Dim Dim Pile Axial Axial Lateral Lateral Uplift
A B Embedment Capacity Capacity Capacity Capacity (EQ)
(in) (in) (in) (kip) (kip) (kip) (kip) (%)
xx.x xx.x xx.x xxxx.xx xxxx.xx xxx.xx xxx.xx xx.x
CAISSON
Service Strength Service Strength Allowed
Caisson Caisson Axial Axial Lateral Lateral Uplift
Diameter Embedment Capacity Capacity Capacity Capacity (EQ)
(in) (in) (kip) (kip) (kip) (kip) (%)
xxx.x xxx.x xxxx.xx xxxx.xx xxx.xx xxx.xx xx.x

Chapter 7 Output Description
7-82
PEDESTAL FOOTING
Pedestal Overall Front Min Min Front Back Max Max
Spacing Height Height Width Thick Proj Offset Width Thick
(ft) (ft) (ft) (ft) (in) (ft) (ft) (ft) (in)
xx.xx xx.xx xx.xx xx.xx xx.xx xx.xx xx.xx xx.xx xx.xx
PILE/CAISSON LAYOUT DESIGN
Toe to Minimum Pile Row
First Heel to Minimum Maximum Row Spacing Distances
Row Last Row Spacing Spacing Placement Rounding Rounding
(ft) (ft) (ft) (ft) (ft) (ft)
xx.xx xx.xx xx.xx xx.xx a xx.xx xx.xx
Design Batt Design Batt Pile/
Horizontal Vertical Last Row Caisson Footing
Component Component % Batter Optimize Cost Cost
(%) ($) ($)
xxx.xx xxx.xx xx.x a xxxxx.xx xxxx.xx
PILE/CAISSON LAYOUT ANALYSIS
Spacing
Row Row within Percent Horizontal Vertical
Number Distance a Row Battered Component Component
(ft) (ft) (%)
ii xx.xx xx.xx xxx.x xxx.xx xxx.xx
ii xx.xx xx.xx xxx.x xxx.xx xxx.xx
MATERIALS
Backwall Stem Footing Reinforcement Epoxy Coated
f'c f'c f'c fy Backwall Stem Footing
(ksi) (ksi) (ksi) (ksi)
x.xxx x.xxx x.xxx xx.xxx aa aa aa
Backfill Backfill Backfill Minimum
Friction Dry Saturated Equivalent Concrete Density
Angle Density Density Fluid Press For DL For Ec
(deg) (lb/ft^3) (lb/ft^3) (lb/ft^3) (lb/ft^3) (lb/ft^3)
xx.xx xxxx.x xxxx.x xxxx.x xxx.x xxx.x
Architectural
Treatment
Density fu
(lb/ft^3) (ksi)
xxx.x xxx.xx
SOIL
Stem Top Footing Footing Soil Bearing Cap Sliding
to Soil Length Near Level Allow Resistance Resist
Layer (Parallel) Slope Over Toe Settle Factor Factor
(ft) (ft) (ft) (in)
xxx.xx xxx.xx a xxx.xx xx.xx x.xx x.xx

Chapter 7 Output Description
7-83
Soil Soil Undrained Mass Unit Saturated
Layer Layer Shear Weight/ Unit Weight/
Number Thick Strength Cohesion Density Density
(ft) (ksf) (ksf) (lb/ft^3) (lb/ft^3)
i xxx.xx xxxx.xx xxx.xx xxxx.xx xxxx.xx
Soil Effective Apply
Layer Friction Elastic Poissons Inclination
Number Angle Modulus Ratio Ncq N Gamma q Factors
(deg) (ksi)
i xx.xx xxxxx.xx x.xx x.xx xxx.xx a
i xx.xx xxxxx.xx x.xx x.xx xxx.xx a
Precast or
Cast-in-
Place
a
ROCK
Empirical Stem Top Footing Bear Cap Sliding
Bearing to Rock Length Sliding Allow Resist Resist
Capacity Layer Parallel Resistance Settle Factor Factor
(ksf) (ft) (ft) (in)
xxxxx.xx xxx.xx xxx.xx a xx.xx x.xx x.xx
Concrete Intact Rock Elastic Rock
/Rock Elastic Poissons Mass Modulus Mass
RQD Friction Modulus Ratio Rating Reduction Modulus
(%) (deg) (ksi) (ksi)
aaaaa xx.xx xxxxx.xx x.xx aaaaa aaaaa xxxxx.xx
CONSOLIDATION SETTLEMENT
Second Initial Max Past
Layer Void Compr Recompr Compr Effective Effective Prim Serv
Number Ratio Index Index Index Stress Stress Consol Life
(ksi) (ksi) (year) (year)
i x.xx x.xx x.xx x.xxx xxx.xx xxx.xx xxx.x xxx.x
i x.xx x.xx x.xx x.xxx xxx.xx xxx.xx xxx.x xxx.x
MISCELLANEOUS REINFORCEMENT DATA
Aggregate Development Backwall Stem Footing
Size Correction Exposure Exposure Exposure
(in)
x.xx x.xx a a a
REINFORCEMENT COVER
Backwall Stem Footing Footing Footing Footing
Back Back Top Top Bottom Bottom Toe Heel
Vertical Vertical Perpend Parallel Perpend Parallel End End
(in) (in) (in) (in) (in) (in) (in) (in)
xx.x xx.x xx.x xx.xa xx.x xx.xa xx.x xx.x
* - Calculated minimum parallel cover controlled for design

Chapter 7 Output Description
7-84
BAR SPACING FOR DESIGN
Backwall Stem Footing Hooked
Maximum Maximum Maximum Footing
Bar Diam Bar Diam Bar Diam Bars
(in) (in) (in)
x.xx x.xx x.xx aaa
BAR SIZE
Backwall Footing Footing Footing Footing Footing Footing
Back Perpend Parallel Perpend Parallel Perp Top Perp Bot
Vertical Top Top Bottom Bottom Bar Type Bar Type
(US bar) (US bar) (US bar) (US bar) (US bar)
ii ii ii ii ii aaaaaaaa aaaaaaaa
BAR SPACING FOR ANALYSIS
Backwall Footing Footing Footing Footing
Back Top Top Bottom Bottom
Vertical Perpend Parallel Perpend Parallel
(in) (in) (in) (in) (in)
xx.x xx.x xx.x xx.x xx.x
REINFORCEMENT AREA
Backwall Footing Footing Footing Footing
Back Top Top Bottom Bottom
Vertical Perpend Parallel Perpend Parallel
(in^2) (in^2) (in^2) (in^2) (in^2)
xx.xx xx.xx xx.xx xx.xx xx.xx
Effective Eff Diam Eff Diam Eff Diam Eff Diam
Diam in Ftg Top Ftg Top Ftg Bot Ftg Bot
Backwall Perpend Parallel Perpend Parallel
(in) (in^2) (in^2) (in^2) (in^2)
x.xx x.xx x.xx x.xx x.xx
STEM REINFORCING AREA
Range Area/ End Max Bar
Number Width Location Diameter
(in^2) (ft) (in)
ii xx.xx xxx.xx x.xxx
ii xx.xx xxx.xx x.xxx
STEM REINFORCING BARS
Range Bar Bar Group End
Number Size Spacing Offset Location
(US bar) (in) (in) (ft)
ii ii xx.xx xx.xx xxx.xx
ii ii xx.xx xx.xx xxx.xx
LOAD CONTROL
Ductility Redundancy Importance Temp Final Temp Final
Factor Factor Factor LS LS ES ES
(ft) (ft) (ft) (ft)
x.xx x.xx x.xx xx.xx xx.xx xx.xx xx.xx
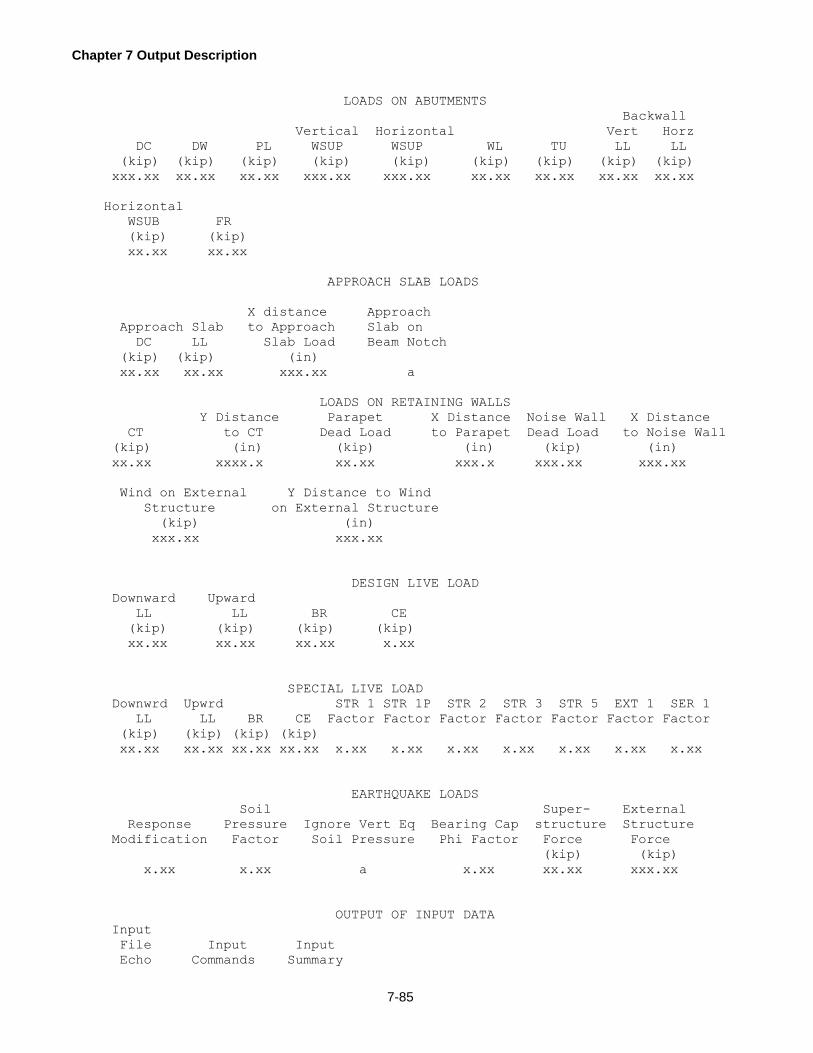
Chapter 7 Output Description
7-85
LOADS ON ABUTMENTS
Backwall
Vertical Horizontal Vert Horz
DC DW PL WSUP WSUP WL TU LL LL
(kip) (kip) (kip) (kip) (kip) (kip) (kip) (kip) (kip)
xxx.xx xx.xx xx.xx xxx.xx xxx.xx xx.xx xx.xx xx.xx xx.xx
Horizontal
WSUB FR
(kip) (kip)
xx.xx xx.xx
APPROACH SLAB LOADS
X distance Approach
Approach Slab to Approach Slab on
DC LL Slab Load Beam Notch
(kip) (kip) (in)
xx.xx xx.xx xxx.xx a
LOADS ON RETAINING WALLS
Y Distance Parapet X Distance Noise Wall X Distance
CT to CT Dead Load to Parapet Dead Load to Noise Wall
(kip) (in) (kip) (in) (kip) (in)
xx.xx xxxx.x xx.xx xxx.x xxx.xx xxx.xx
Wind on External Y Distance to Wind
Structure on External Structure
(kip) (in)
xxx.xx xxx.xx
DESIGN LIVE LOAD
Downward Upward
LL LL BR CE
(kip) (kip) (kip) (kip)
xx.xx xx.xx xx.xx x.xx
SPECIAL LIVE LOAD
Downwrd Upwrd STR 1 STR 1P STR 2 STR 3 STR 5 EXT 1 SER 1
LL LL BR CE Factor Factor Factor Factor Factor Factor Factor
(kip) (kip) (kip) (kip)
xx.xx xx.xx xx.xx xx.xx x.xx x.xx x.xx x.xx x.xx x.xx x.xx
EARTHQUAKE LOADS
Soil Super- External
Response Pressure Ignore Vert Eq Bearing Cap structure Structure
Modification Factor Soil Pressure Phi Factor Force Force
(kip) (kip)
x.xx x.xx a x.xx xx.xx xxx.xx
OUTPUT OF INPUT DATA
Input
File Input Input
Echo Commands Summary

Chapter 7 Output Description
7-86
I I I
OUTPUT OF RESULTS
Footing
Footing Output Factored Footing Control Reinf Footing
Geometry Legend Forces Stability Forces Summary Flexure
I I I I I I I
Crack Shear Development
Control Results Length
I I I
OUTPUT OF INTERMEDIATE DATA
Internal Intermediate Detailed
Unfactored Load Moment/Axial Footing Bearing Resist Stem Cutoff
Loads Factors Interaction Forces Values Load Values
I I I I I I
7.6.4 ADDITIONAL INFORMATION Report Summary
FOOTING GEOMETRY
Footing Footing Projection Effective Depth
Thick Width Toe Heel Toe Heel
(ft) (ft) (ft) (ft) (ft) (ft)
xxx.xx xxx.xx xxx.xx xxx.xx xxx.xx xxx.xx
Note: The acceptable range of toe projections for this design
footing size are from: xx.xx ft to xx.xx ft.
COMPUTED VALUES
Front
Water
Level
(ft)
xx.xx
PEDESTAL GEOMETRY
Slope
Back Front Front Clear Horiz
Offset Width Height Height Proj Spacing Thick Proj Density
(ft) (ft) (ft) (ft) (ft) (ft) (ft) (ft) (ft^3/ft)
xx.xxx xx.xxx xx.xxx xx.xxx xx.xxx xx.xxx xx.xxx xx.xxx xxx.xxx
Moments are assumed to cause tension on the bottom face of the
footing at the toe and on the top face of the footing at the heel.
Effective depths are based on this assumption.

Chapter 7 Output Description
7-87
7.6.5 OUTPUT LEGEND Report Summary
Abrev Limit State Description
aaaaa aaaaaaaaaa - aaaaaaaaaaaaaaaaaaaaaaaaaaaaaaaaaaaaaaaaaaaaaaaa
Status Code Description
aa - aaaaaaaaaaaaaaaaaaaaaaaaaaaaaaaaaaaaaaaaaaaaaaaa
Symbol Explanation
a - aaaaaaaaaaaaaaaaaaaaaaaaaaaaaaaaaaaaaaaaaaaaaaaa
7.6.6 FACTORED FORCES Report Format
ABUTMENT BACKWALL xxx.xx (ft) FROM TOP OF STRUCTURE
ABUTMENT BACKWALL AT SEAT LEVEL xxx.xx (ft) FROM TOP OF STRUCTURE
Limit Load
State Case Stage Axial Moment Shear
(kip) (kip-ft) (kip)
aaaaaaaaaaaaaaaa xxxxx.xx xxxxx.xx xxxxx.xx
STEM LOCATION a xx.xxx (ft) FROM TOP OF STRUCTURE
STEM CUTOFF LOCATION - #II @ xxx.xx (ft) FROM TOP OF STRUCTURE
Limit Load
State Case Stage Axial Moment Shear
(kip) (kip-ft) (kip)
aaaaaaaaaaaaaaaa xxxxx.xx xxxxx.xx xxxxx.xx
FOOTING – W/O FOUNDATION PRESSURE
Limit Load Toe Shear Toe Heel Shear Heel
State Case Stage Eff D at Face Moment Eff D at Face Moment
(kip) (kip) (kip-ft) (kip) (kip) (kip-ft)
aaaaaaaaaaaaaaaa xxxxx.xx xxxxx.xx xxxxx.xx xxxxx.xx xxxxx.xx xxxxx.xx
FOUNDATION FORCES AT FOOTING TOE - VERTICAL
FOUNDATION FORCES AT FOOTING TOE - HORIZONTAL
(Spread and Pedestal foundations)
Limit Load Toe to Average Average
State Case Stage Result Force Load Moment Load
(ft) (kip) Factor (kip-ft) Factor
aaaaaaaaaaaaaaaaa xx.xxx xxxx.xxa x.xx xxxx.xx x.xx
(Pile and Caisson foundations)
Limit Load Toe to Average Average
State Case Stage Result Force Load Moment Load V/H
(ft) (kip) Factor (kip-ft) Factor Ratio
aaaaaaaaaaaaaaaaa xx.xxx xxxx.xxa x.xx xxxx.xx x.xx xx.xxxa
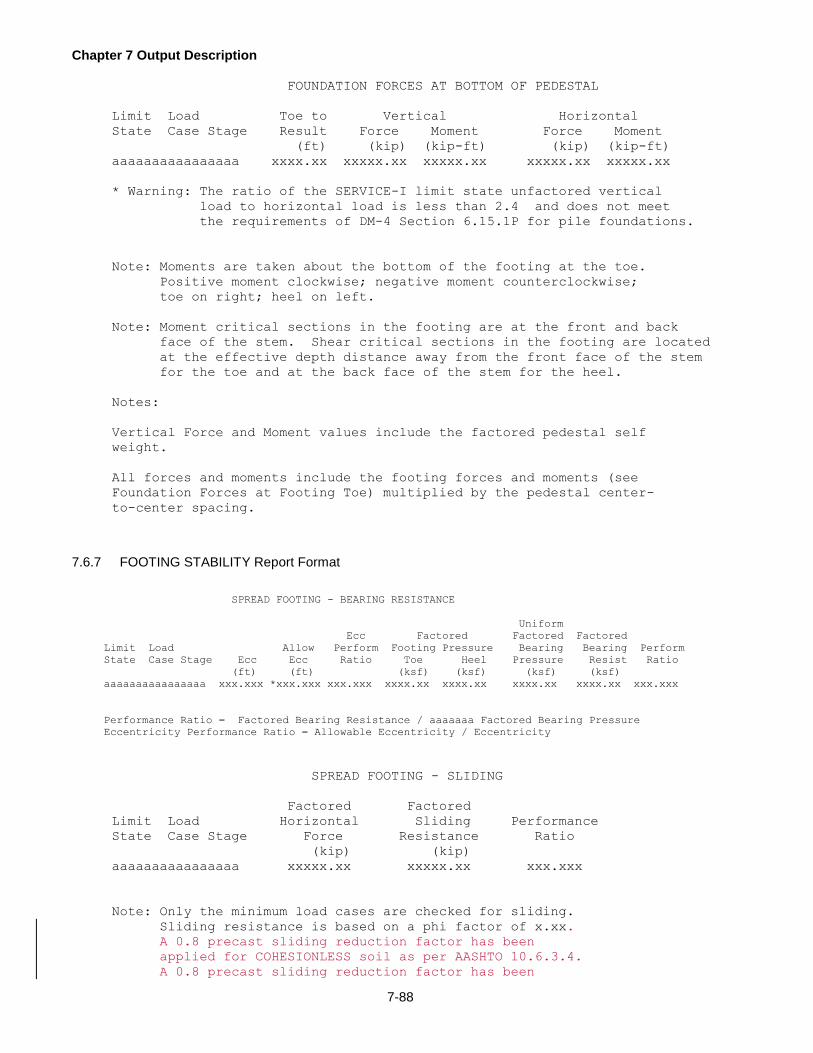
Chapter 7 Output Description
7-88
FOUNDATION FORCES AT BOTTOM OF PEDESTAL
Limit Load Toe to Vertical Horizontal
State Case Stage Result Force Moment Force Moment
(ft) (kip) (kip-ft) (kip) (kip-ft)
aaaaaaaaaaaaaaaa xxxx.xx xxxxx.xx xxxxx.xx xxxxx.xx xxxxx.xx
* Warning: The ratio of the SERVICE-I limit state unfactored vertical
load to horizontal load is less than 2.4 and does not meet
the requirements of DM-4 Section 6.15.1P for pile foundations.
Note: Moments are taken about the bottom of the footing at the toe.
Positive moment clockwise; negative moment counterclockwise;
toe on right; heel on left.
Note: Moment critical sections in the footing are at the front and back
face of the stem. Shear critical sections in the footing are located
at the effective depth distance away from the front face of the stem
for the toe and at the back face of the stem for the heel.
Notes:
Vertical Force and Moment values include the factored pedestal self
weight.
All forces and moments include the footing forces and moments (see
Foundation Forces at Footing Toe) multiplied by the pedestal center-
to-center spacing.
7.6.7 FOOTING STABILITY Report Format
SPREAD FOOTING - BEARING RESISTANCE
Uniform
Ecc Factored Factored Factored
Limit Load Allow Perform Footing Pressure Bearing Bearing Perform
State Case Stage Ecc Ecc Ratio Toe Heel Pressure Resist Ratio
(ft) (ft) (ksf) (ksf) (ksf) (ksf)
aaaaaaaaaaaaaaaa xxx.xxx *xxx.xxx xxx.xxx xxxx.xx xxxx.xx xxxx.xx xxxx.xx xxx.xxx
Performance Ratio = Factored Bearing Resistance / aaaaaaa Factored Bearing Pressure
Eccentricity Performance Ratio = Allowable Eccentricity / Eccentricity
SPREAD FOOTING - SLIDING
Factored Factored
Limit Load Horizontal Sliding Performance
State Case Stage Force Resistance Ratio
(kip) (kip)
aaaaaaaaaaaaaaaa xxxxx.xx xxxxx.xx xxx.xxx
Note: Only the minimum load cases are checked for sliding.
Sliding resistance is based on a phi factor of x.xx.
A 0.8 precast sliding reduction factor has been
applied for COHESIONLESS soil as per AASHTO 10.6.3.4.
A 0.8 precast sliding reduction factor has been

Chapter 7 Output Description
7-89
applied for C-PHI soil as per DM-4 10.6.3.4.
SETTLEMENT
Primary and Secondary Consolidation Values
Layer No. x
Sub
Layer Sigma Sigma Sigma Settlement
Depth Z O P F Consol Second Conditon
(ft) (ft) (psf) (psf) (psf) (in) (in)
xx.xxx x.xxx xxxxxxx. xxxxxxx. xxxxxxxx. xxx. xxx. aaaaaaaa
Legend: Condition Codes
OC f>p : Over-Consolidation - Sigma F > than Sigma P
OC f<=p : Over-Consolidation - Sigma P >= Sigma F
NC : Normal-Consolidation
UC : Under-Consolidation
Note: Primary Consolidation Reduction Factor is not included in the
Consolidation values shown above.
SETTLEMENT SUMMARY
Settlement Perform Temp Stage
Elastic Consol Second Total Allow Ratio Settlement
(in) (in) (in) (in) (in) (in)
xx.xx xx.xx xx.xx xx.xx xx.xx xxx.xxx xx.xx
Notes:
Elastic settlement is based on:
effective width of xx.xx (ft) from aaaaaaaaaaaaaaaaa
Temporary Stage settlement is based on:
effective width of xx.xx (ft) from aaaaaaaaaaaaaaaaa
Maximum pressures from Bearing Resistance Report
are used for settlement calculations.
The Elastic Modulus of Rock is calculated using
the minimum value of AASHTO Equation 10.4.6.5-a
and the Intact Rock Modulus. Em = xxxxx. ksi.
Performance Ratio = Allowable Settlement / Total Settlement
Warning: total settlement exceeds xx aaaa
PILE PATTERN
CAISSON PATTERN
Toe to CG of Piles Pile Group Inertia Pile Density
Toe to CG of Caissons Caisson Group Inertia Caisson Density
xxxx.xx (ft) xxxxx.xxx (ft^4) xxxxx.xxx (pile/ft)
Toe to CG of Piles Pile Group Inertia Footing Size
Toe to CG of Caissons Caisson Group Inertia Footing Size

Chapter 7 Output Description
7-90
xxxx.xx (ft) xxxxx.xxx (ft^4) xxxxx.xxx (ft^3)
Toe to CG of Piles Pile Group Inertia Footing Cost
Toe to CG of Caissons Caisson Group Inertia Footing Cost
xxxx.xx (ft) xxxxx.xxx (ft^4) xxxxx.xxx ($/ft)
Distance Pile Spacing Batter Component Percent
Row Toe to Row within Row Horiz Vert Battered
(ft) (ft) (%)
xx xxx.xx xxx.xx xxx.xx xxx.xx xxx.x
xx xxx.xx xxx.xx Vertical Piles
xx xxx.xx xxx.xx Vertical Caisson
CAISSON FACTORED AXIAL LOADS / CAISSON FACTORED AXIAL RESISTANCE
PILE FACTORED AXIAL LOADS / PILE FACTORED AXIAL RESISTANCE
Factored Axial Loads Factored
Limit Load Row 1 Row 2 Row 3 Row 4 Row 5 Axial Perform
State Case Stage Batter Batter Vert Vert Vert Resist Ratio
(kip) (kip) (kip) (kip) (kip) (kip)
aaaaaaaaaaaaaaaa xxxx.xx xxxx.xx xxxx.xx xxxx.xx xxxx.xx xxxx.xxTxxx.xxx
aaaaaaaaaaaaaaaa xxxx.xx xxxx.xx xxxx.xx xxxx.xx xxxx.xx xxxx.xx xxx.xxx
Performance Ratio = Factored Pile Axial Resistance / Maximum Factored Pile Axial Load
Performance Ratio = Factored Caisson Axial Resistance / Max Factored Caisson Axial Load
FACTORED LATERAL LOADS / PILE GROUP FACTORED LATERAL RESISTANCE
FACTORED LATERAL LOADS / CAISSON GROUP FACTORED LATERAL RESISTANCE
Resistance based on battered piles only
Resistance based on vertical piles only
Resistance based on vertical caissons only
Factored Factored
Limit Load Lateral Lateral Performance
State Case Stage Load Resist Ratio
(kip/unit length) (kip/unit length)
aaaaaaaaaaaaaaaa xxxxx.xx xxxxx.xx xxx.xxx
Performance Ratio = Pile Group Factored Lateral Resistance / Factored Lateral Load
Performance Ratio = Caisson Group Factored Lateral Resistance / Factored Lateral Load
PEDESTAL BEARING RESISTANCE
Uniform
Ecc Factored Factored Factored
Limit Load Allow Perform Pedestal Pressure Bearing Bearing Perform
State Case Stage Ecc Ecc Ratio Front Back Pressure Resist Ratio
(ft) (ft) (ksf) (ksf) (ksf) (ksf)
aaaaaaaaaaaaaaaa xxx.xxx *xxx.xxx xxx.xxx xxxx.xx xxxx.xx xxxx.xx xxxx.xx xxx.xxx
aaaaaaaaaaaaaaaa xxx.xxx *xxx.xxx xxx.xxx xxxx.xx xxxx.xx xxxx.xx xxxx.xx xxx.xxx
FOOTING BEARING RESULTS
Maximum Factored Actual Pressure : xxx.xx (ksf) from: aaaaaaaaaaaaaaaa
Pedestal Factored Bearing Resistance : xxx.xx (ksf)
Peformance Ratio : xxx.xx
FOOTING BEARING RESISTANCE

Chapter 7 Output Description
7-91
Maximum
Ecc Factored Factored Factored
Limit Load Allow Perform Footing Pressure Bearing Bearing Perform
State Case Stage Ecc Ecc Ratio Toe Heel Pressure Resist Ratio
(ft) (ft) (ksf) (ksf) (ksf) (ksf)
aaaaaaaaaaaaaaaa xxx.xx *xxx.xxx xxx.xxx xxxx.xx xxxx.xx xxxx.xx xxxx.xx xxx.xxx
aaaaaaaaaaaaaaaa xx.xxx *xxx.xxx xxx.xxx xxxx.xx xxxx.xx xxxx.xx xxxx.xx xxx.xxx
The eccentricity is the distance from the center of the footing to
the load resultant. Positive towards toe; negative towards heel.
The allowable eccentricity is the distance from the center of the
footing to the edge of the kern.
The eccentricity is the distance from the center of the pedestal at
the base to the load resultant. Positive towards front; negative
towards back. The allowable eccentricity is the distance from the
center of the footing to the edge of the kern.
The eccentricity is the distance from the center of the footing contact
length with the pedestal to the load resultant. Positive towards toe
negative towards heel.
Modulus of elasticity of rock is less than modulus of elasticity
of footing concrete, thus rock is treated as soil.
FOOTING STABILITY ON PEDESTAL
Min
Limit Load Vertical Horiz V/H Allow Perform
State Case Stage Force Force Ratio Ratio Ratio
(kip) (kip)
aaaaaaaaaaaaaaaa xxxx.xx xxxx.xx xxx.xx xxx.xx xxx.xx
Notes:
Forces are based on a unit width thickness of the footing.
Performance Ratio = (V/H Ratio) / (Min Allow Ratio)
Notes:
Elastic settlement is based on:
effective width of xx.xxx (aa) from aaaaaaaaaaaaaaaa
Consolidation and Secondary settlement are based on:
effective width of xx.xxx (aa) from aaaaaaaaaaaaaaaa
Temporary Stage settlement is based on:
effective width of xx.xxx (aa) from aaaaaaaaaaaaaaaa
Uniform pressures (Vertical Force/Effective Width)
are used for settlement calculations.
Maximum pressures from Bearing Resistance Report
are used for settlement calculations.
Warning: A performance ratio less than 1 was found

Chapter 7 Output Description
7-92
* Indicates an eccentricity outside the kern.
T indicates tensile resistance controlled and is reported
Warning: Tension in piles is unacceptable

Chapter 7 Output Description
7-93
7.6.8 CONTROLLING FOOTING FORCES Report Format
TOE – WITH FOUNDATION PRESSURE
HEEL – WITH FOUNDATION PRESSURE
Limit Load Limit Load
State Case Stage Moment State Case Stage Shear
(Controlling) (kip-ft) (Controlling) (kip)
aaaaaaaaaaaaaaaa xxxxx.xxa (Strength) aaaaaaaaaaaaaaaa xxxxx.xx
aaaaaaaaaaaaaaaa xxxxx.xxa (Crack Control) (aaaaa)
Note: A “T” following the moment value indicates that the controlling
moment for the bottom perpendicular reinforcement was found in the
Toe. An “H” indicates the controlling moment was found in the Heel.
The Maximum shear in Heel is located at Xdist from the back face
of stem, where Xdist is (xxx.xx)ft
Note: The assumed moment direction in the aaaa has been violated. The
critical shear location of limit states that violate the assumed
moment direction in the aaaa are set to the aaaaa location as
documented in the User Manual Section 3.5.1. Limit Case Stage
Max moment in violation: xxx.xx (kp-ft) aaaaaaa aaa aaa
PARALLEL MOMENT
Limit Load Parallel
State Case Stage Moment
(Controlling) (kip-ft)
Strength: aaaaaaaaaaaaaaaa xxxxx.xx
Crack Control: aaaaaaaaaaaaaaaa xxxxx.xx
Note: Sec. beyond ftg. indicates that the controlling limit state is not
applicable because the section is beyond the footing dimensions.
7.6.9 FOOTING FLEXURE – ANALYSIS Report Format
FLEXURAL STRENGTH
Limit Load Applied Moment Phi Perform Area
Location State Case Stage Moment Resist Factor Ratio Prov
(Controlling) (kip-ft) (kip-ft) (in^2)
Toe aaaaaaaaaaaaaaaa xxxxx.xxa xxxxx.xx x.xxx xxx.xxx a xx.xxx a
Heel aaaaaaaaaaaaaaaa xxxxx.xxa xxxxx.xx x.xxx xxx.xxx a xx.xxx a
Top Parallel aaaaaaaaaaaaaaaa xxxxx.xx xxxxx.xx x.xxx xxx.xxx a xx.xxx a
Bot Parallel aaaaaaaaaaaaaaaa xxxxx.xx xxxxx.xx x.xxx xxx.xxx a xx.xxx a
NOTE: A “T” following the applied moment indicates that the controlling
Moment is found in the Toe for the current location.
An “H” following the applied moment indicates that the controlling
moment is found in the Heel for the current location.

Chapter 7 Output Description
7-94
* Section is over-reinforced
+ Reinforcement could not develop in the aaaa.
+ Reinforcement could not develop in the aaaa. A bar spacing
of xxx.xx in. or less is required to develop the bar.
Performance Ratio = Moment Resistance / Applied Moment
Notes:
Applied moments are based on:
vertical force = xxx.xxx (kip)
footing width = xxx.xxx (ft)
uniform distrib load (udl) = xxx.xxx (kip/ft)
pedestal clear spacing (s) = xxx.xxx (ft)
Bottom moment (between pedestals) = 3*udl*s*s/40
Top moment (over pedestals) = udl*s*s/10
Performance Ratio = Moment Resistance / Applied Moment
Note: Pedestal footing reinforcement is not analyzed in the perpendicular direction
(toe and heel locations) because the footing and pedestal are assumed to be made
integral using transverse shear keys and dowels as per DM-4 Section 10.6.5.2P.
Notes:
Applied moments are based on:
vertical force = xxxx.xx (kip)
footing width = xxx.xxx (ft)
uniform distrib load (udl) = xxxx.xx (kip/ft)
maximum pile spacing (s) = xxx.xxx (ft)
Parallel moment = 0.5*udl*s*s/10
Performance Ratio = Moment Resistance / Applied Moment
Warning: A performance ratio less than 1 was found
7.6.10 FOOTING FLEXURE - DESIGN Report Format
FLEXURAL STRENGTH
Limit Load Applied Moment Phi Perform 4/3 Mu Area Status
Location State Case Stage Moment Resist Factor Ratio Reqd Codes
(Controlling) kip-ft) (kip-ft) (kip-ft) (in^2)
Toe aaaaaaaaaaaaaaaa xxxxx.xxa xxxxx.xx x.xxx xxx.xxxa xxxxx.xx xx.xxxa aa
Heel aaaaaaaaaaaaaaaa xxxxx.xxa xxxxx.xx x.xxx xxx.xxxa xxxxx.xx xx.xxxa aa
Top Parallel aaaaaaaaaaaaaaaa xxxxx.xx xxxxx.xx x.xxx xxx.xxxa xxxxx.xx xx.xxxa aa
Bot Parallel aaaaaaaaaaaaaaaa xxxxx.xx xxxxx.xx x.xxx xxx.xxxa xxxxx.xx xx.xxxa aa
NOTE: A “T” following the applied moment indicates that the controlling
Moment is found in the Toe for the current location.
An “H” following the applied moment indicates that the controlling
moment is found in the Heel for the current location.
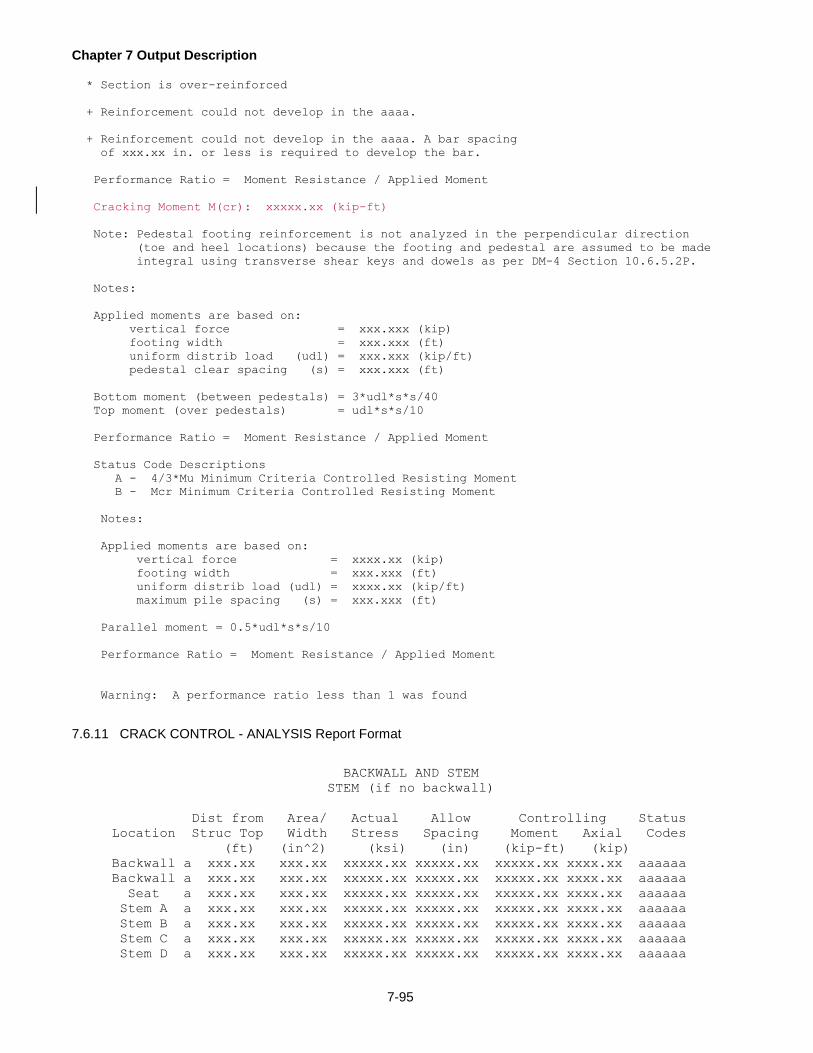
Chapter 7 Output Description
7-95
* Section is over-reinforced
+ Reinforcement could not develop in the aaaa.
+ Reinforcement could not develop in the aaaa. A bar spacing
of xxx.xx in. or less is required to develop the bar.
Performance Ratio = Moment Resistance / Applied Moment
Cracking Moment M(cr): xxxxx.xx (kip-ft)
Note: Pedestal footing reinforcement is not analyzed in the perpendicular direction
(toe and heel locations) because the footing and pedestal are assumed to be made
integral using transverse shear keys and dowels as per DM-4 Section 10.6.5.2P.
Notes:
Applied moments are based on:
vertical force = xxx.xxx (kip)
footing width = xxx.xxx (ft)
uniform distrib load (udl) = xxx.xxx (kip/ft)
pedestal clear spacing (s) = xxx.xxx (ft)
Bottom moment (between pedestals) = 3*udl*s*s/40
Top moment (over pedestals) = udl*s*s/10
Performance Ratio = Moment Resistance / Applied Moment
Status Code Descriptions
A - 4/3*Mu Minimum Criteria Controlled Resisting Moment
B - Mcr Minimum Criteria Controlled Resisting Moment
Notes:
Applied moments are based on:
vertical force = xxxx.xx (kip)
footing width = xxx.xxx (ft)
uniform distrib load (udl) = xxxx.xx (kip/ft)
maximum pile spacing (s) = xxx.xxx (ft)
Parallel moment = 0.5*udl*s*s/10
Performance Ratio = Moment Resistance / Applied Moment
Warning: A performance ratio less than 1 was found
7.6.11 CRACK CONTROL - ANALYSIS Report Format
BACKWALL AND STEM
STEM (if no backwall)
Dist from Area/ Actual Allow Controlling Status
Location Struc Top Width Stress Spacing Moment Axial Codes
(ft) (in^2) (ksi) (in) (kip-ft) (kip)
Backwall a xxx.xx xxx.xx xxxxx.xx xxxxx.xx xxxxx.xx xxxx.xx aaaaaa
Backwall a xxx.xx xxx.xx xxxxx.xx xxxxx.xx xxxxx.xx xxxx.xx aaaaaa
Seat a xxx.xx xxx.xx xxxxx.xx xxxxx.xx xxxxx.xx xxxx.xx aaaaaa
Stem A a xxx.xx xxx.xx xxxxx.xx xxxxx.xx xxxxx.xx xxxx.xx aaaaaa
Stem B a xxx.xx xxx.xx xxxxx.xx xxxxx.xx xxxxx.xx xxxx.xx aaaaaa
Stem C a xxx.xx xxx.xx xxxxx.xx xxxxx.xx xxxxx.xx xxxx.xx aaaaaa
Stem D a xxx.xx xxx.xx xxxxx.xx xxxxx.xx xxxxx.xx xxxx.xx aaaaaa

Chapter 7 Output Description
7-96
* Warning: An applied moment was negative (See Moment Axial Interaction
Table) and may have cracked the section in the front face.
User should determine if the front face has cracked. If so
compute an allowable crack control spacing and compare it to
the temp/shrinkage reinforcement spacing.
FOOTING
Area/ Actual Allow Control Status
Location Width Stress Spacing Moment Codes
(in^2) (ksi) (in) (kip-ft)
Toe xxx.xx xxxxx.xx xxxxx.xx xxxxx.xxa aaaaaaa
Toe xxxxx. xxxxx.xx xxxxx.xx xxxxx.xxa aaaaaaa
Heel xxxxx. xxxxx.xx xxxxx.xx xxxxx.xxa aaaaaaa
Top Parallel xxxxx. xxxxx.xx xxxxx.xx xxxxx.xx aaaaaaa
NOTE: A “T” following the applied moment indicates that the controlling
Moment is found in the Toe for the current location.
An “H” following the applied moment indicates that the controlling
moment is found in the Heel for the current location.
Status Code Descriptions (Blank indicates an OK status)
A - area smaller than that required for shrinkage/temperature control
or rho min
B - actual spacing is greater than maximum allowed
C - actual stress calculation did not converge
D - actual spacing is greater than allowable crack control spacing
E - applied loads did not crack the cross section. Rebar tensile
stress is set to zero.
F - spacing is less than the minimum allowed
G - Actual stress limited to 0.6*fy in allowable spacing calculation
Stresses in footing are based on:
vertical force = xxx.xxx (kip)
footing width = xxx.xxx (ft)
uniform distrib load (udl) = xxx.xxx (kip/ft)
pedestal clear spacing (s) = xxx.xxx (ft)
Bottom moment (between pedestals) = 3*udl*s*s/40
Top moment (over pedestals) = udl*s*s/10
Stresses in footing are based on:
vertical force = xxxx.xx (kip)
footing width = xxx.xxx (ft)
uniform distrib load (udl) = xxxx.xx (kip/ft)
maximum pile spacing (s) = xxx.xxx (ft)
Parallel moment = 0.5*udl*s*s/10
Warning: Applied moment was negative; section cracked in front face. Actual
Stress set to 0, crack control check was not evaluated.

Chapter 7 Output Description
7-97
7.6.12 CRACK CONTROL - DESIGN Report Format
ABUTMENT BACKWALL xxx.xx (ft) FROM TOP OF STRUCTURE
ABUTMENT BACKWALL AT SEAT LEVEL xxx.xx (ft) FROM TOP OF STRUCTURE
STEM LOCATION a xxx.xx (ft) FROM TOP OF STRUCTURE
STEM CUTOFF LOCATION - SHOWN FOR EACH BAR CUTOFF
Back Face Vertical Reinforcement
Bar Bar Area/ Actual Allow Controlling Status
Size Spacing Width Stress Spacing Moment Axial Codes
(in) (in^2) (ksi) (in) (kip-ft) (kip)
ii xxx.xx aaxxx.xx xxxxx.xx xxxxx.xx xxxxx.xx xxxxx.xx aaaaaaa
ii xxx.xx aaxxx.xx xxxxx.xx xxxxx.xx xxxxx.xx xxxxx.xx aaaaaaa
Warning: An applied moment was negative (See Moment Axial Interaction
Table) and may have cracked the section in the front face.
User should determine if the front face has cracked. If so
compute an allowable crack control spacing and compare it to
the temp/shrinkage reinforcement spacing.
FOOTING TOE
FOOTING HEEL
FOOTING PARALLEL TOP REINFORCEMENT
FOOTING PARALLEL BOTTOM REINFORCEMENT
Bar Bar Area/ Actual Allow Control Status
Size Spacing Width Stress Spacing Moment Codes
(in) (in^2) (ksi) (in) (kip-ft)
ii xxx.xx aaxxx.xx xxxxx.xx xxxxx.xx xxxxx.xxa aaaaaaa
ii xxx.xx aaxxx.xx xxxxx.xx xxxxx.xx xxxxx.xxa aaaaaaa
Note: Controlling moment was found in the toe
Note: Controlling moment was found in the heel
Status Code Descriptions (Blank indicates an OK status)
A - min area & max spacing governed by shrinkage/temp requirements
B - spacing is less than minimum allowed, actual stress not computed
C - actual stress calculation did not converge
D - service load requirements result in an over reinforced section
E – spacing modified by development length ratio reduction
F - applied loads did not crack the cross section. Rebar tensile
stress is set to 0.
G - Actual stress limited to 0.6*fy in allowable spacing calculation
++ - Design spacing is less than minimum spacing. Bar size is not
applicable

Chapter 7 Output Description
7-98
7.6.13 GRAVITY WALL STRESS CHECK Report Format
The status codes reported for each load combination (shown below as “aa”) may be
“ok” or “NG”.
STEM LOCATION A xxx.xx (ft) FROM TOP OF STRUCTURE
Stress is based on a stem thickness of xxx.xx (ft)
Limit Load Applied Applied Actual
State Case Stage Moment Axial Stress Status
(kip-ft) (kip) (ksf)
aaaaaaaaaaaaaaaa xxxxx.xx xxxxx.xx xxxxx.xx aa
aaaaaaaaaaaaaaaa xxxxx.xx xxxxx.xx xxxxx.xx aa
Note: Positive axial loads produce compressive stress.
Actual stress is evaluated on the face where moment produces tensile
stress. A positive applied moment generates a tensile stress on backface
of stem. A negative applied moment generates a tensile stress on frontface
of stem. Positive actual stress indicates that the combined stresses (axial
and flexure) produced a tensile stress at the extreme fiber of the section.
Warning: a negative applied load was encountered.
7.6.14 REINFORCEMENT SUMMARY - ANALYSIS Report Format
FOOTING REINFORCEMENT DETAILS
FOOTING TOE (BOTTOM)
Bar Bar Develop Acutal Bar Area Area
Size Spacing Length Length Type Reqd Prov
(in) (in) (in) (in^2) (in^2)
ii xxx.x xxx.x a xxx.x a xx.xx a xx.xx
FOOTING HEEL (TOP)
Bar Bar Develop Acutal Bar Area Area
Size Spacing Length Length Type Reqd Prov
(in) (in) (in) (in^2) (in^2)
ii xxx.x xxx.x a xxx.x a xx.xx a xx.xx
Development Length information is not available when area per width
is specified for footing reinforcement during an analysis run.
* Indicates area required was governed by the minimum temperature
and shrinkage reinforcment criteria.
+ Indicates bar cannot be developed.
Bar Type Description
S - Straight Bar
H - Hooked Bar
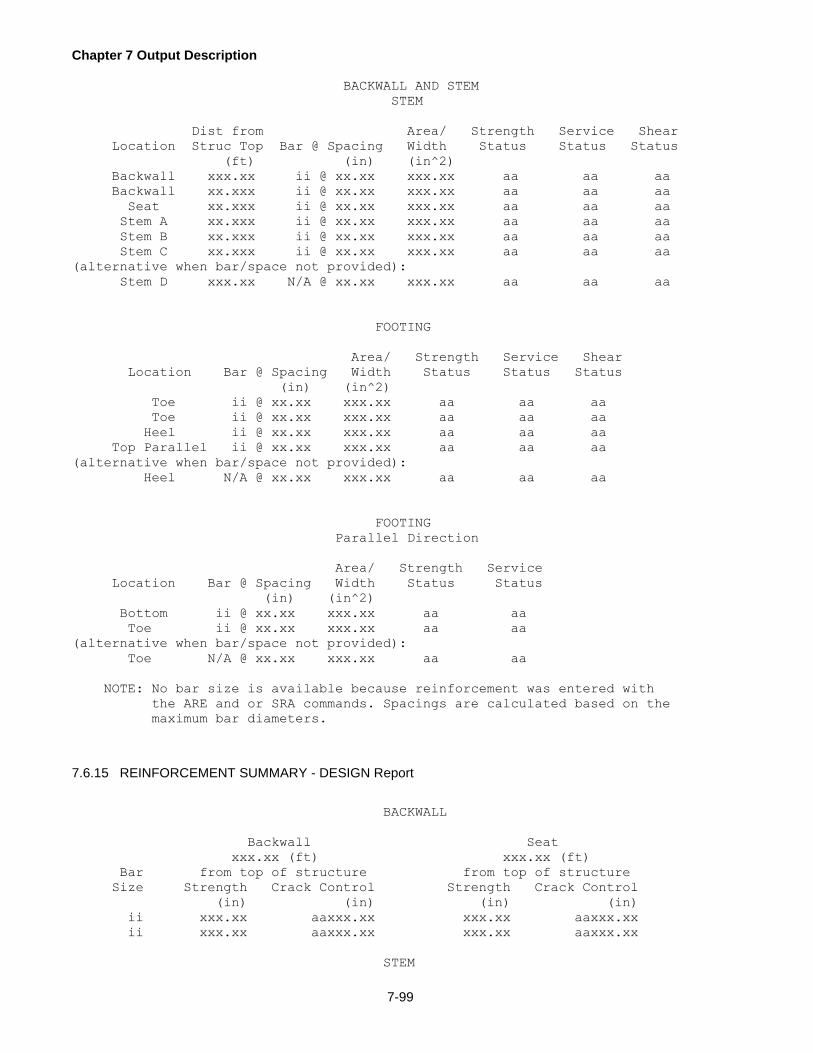
Chapter 7 Output Description
7-99
BACKWALL AND STEM
STEM
Dist from Area/ Strength Service Shear
Location Struc Top Bar @ Spacing Width Status Status Status
(ft) (in) (in^2)
Backwall xxx.xx ii @ xx.xx xxx.xx aa aa aa
Backwall xx.xxx ii @ xx.xx xxx.xx aa aa aa
Seat xx.xxx ii @ xx.xx xxx.xx aa aa aa
Stem A xx.xxx ii @ xx.xx xxx.xx aa aa aa
Stem B xx.xxx ii @ xx.xx xxx.xx aa aa aa
Stem C xx.xxx ii @ xx.xx xxx.xx aa aa aa
(alternative when bar/space not provided):
Stem D xxx.xx N/A @ xx.xx xxx.xx aa aa aa
FOOTING
Area/ Strength Service Shear
Location Bar @ Spacing Width Status Status Status
(in) (in^2)
Toe ii @ xx.xx xxx.xx aa aa aa
Toe ii @ xx.xx xxx.xx aa aa aa
Heel ii @ xx.xx xxx.xx aa aa aa
Top Parallel ii @ xx.xx xxx.xx aa aa aa
(alternative when bar/space not provided):
Heel N/A @ xx.xx xxx.xx aa aa aa
FOOTING
Parallel Direction
Area/ Strength Service
Location Bar @ Spacing Width Status Status
(in) (in^2)
Bottom ii @ xx.xx xxx.xx aa aa
Toe ii @ xx.xx xxx.xx aa aa
(alternative when bar/space not provided):
Toe N/A @ xx.xx xxx.xx aa aa
NOTE: No bar size is available because reinforcement was entered with
the ARE and or SRA commands. Spacings are calculated based on the
maximum bar diameters.
7.6.15 REINFORCEMENT SUMMARY - DESIGN Report
BACKWALL
Backwall Seat
xxx.xx (ft) xxx.xx (ft)
Bar from top of structure from top of structure
Size Strength Crack Control Strength Crack Control
(in) (in) (in) (in)
ii xxx.xx aaxxx.xx xxx.xx aaxxx.xx
ii xxx.xx aaxxx.xx xxx.xx aaxxx.xx
STEM

Chapter 7 Output Description
7-100
Location A Location B Location C Location D
xxx.xx (ft) xxx.xx (ft) xxx.xx (ft) xxx.xx (ft)
Bar Crack Crack Crack Crack
Size Streng Control Streng Control Streng Control Streng Control
(in) (in) (in) (in) (in) (in) (in) (in)
ii xx.xx aaxx.xx aaxx.xx aaxx.xx aaxx.xx aaxx.xx aaxx.xx aaxx.xx
ii xx.xx aaxx.xx aaxx.xx aaxx.xx aaxx.xx aaxx.xx aaxx.xx aaxx.xx
++ - Design Spacing is less than the minimum spacing. Bar size is not
applicable.
FOOTING
Bar Footing Toe Footing Heel
Size Strength Crack Control Strength Crack Control
(in) (in) (in) (in)
ii xx.xx aaxx.xx xx.xx aaxx.xx
ii xx.xx aaxx.xx xx.xx aaxx.xx
Bar Parallel Top Parallel Bottom
Size Strength Crack Control Strength Crack Control
(in) (in) (in) (in)
ii xx.xx aaxx.xx xx.xx aaxx.xx
ii xx.xx aaxx.xx xx.xx aaxx.xx
++ - Design Spacing is less than the minimum spacing. Bar size is not
applicable.

Chapter 7 Output Description
7-101
7.6.16 SHEAR RESULTS Report Format
BACKWALL AND STEM
STEM
Dist from Limit Load Applied Shear Perform
Location Struc Top State Case Stage Shear Resist Ratio
(ft) (Controlling) (kip) (kip)
Backwall xxx.xx aaaaaaaaaaaaaaaa xxxx.xx xxxx.xx xxx.xxx
Backwall xx.xxx aaaaaaaaaaaaaaaa xxxx.xx xxxx.xx xxx.xxx
Seat xx.xxx aaaaaaaaaaaaaaaa xxxx.xx xxxx.xx xxx.xxx
Stem A xx.xxx aaaaaaaaaaaaaaaa xxxx.xx xxxx.xx xxx.xxx
Stem B xx.xxx aaaaaaaaaaaaaaaa xxxx.xx xxxx.xx xxx.xxx
Stem C xx.xxx aaaaaaaaaaaaaaaa xxxx.xx xxxx.xx xxx.xxx
Stem D xx.xxx aaaaaaaaaaaaaaaa xxxx.xx xxxx.xx xxx.xxx
STEM CUTOFF LOCATIONS
Dist from Limit Load Applied Shear Perform
Bar Size Struc Top State Case Stage Shear Resist Ratio
(ft) (Controlling) (kip) (kip)
xx xx.xxx aaaaaaaaaaaaaaaa xxxx.xx xxxx.xx xxx.xxx
FOOTING
Limit Load Applied Shear Perform
Location State Case Stage Shear Resist Ratio
(Controlling) (kip) (kip)
Toe aaaaaaaaaaaaaaaa xxxx.xx xxxx.xx xxx.xxx
Heel aaaaaaaaaaaaaaaa xxxx.xx xxxx.xx xxx.xxx
Punching aaaaaaaaaaaaaaaa xxxx.xx xxxx.xx xxx.xxx
Performance Ratio = Shear Resistance / Applied Shear
FOOTING
Parallel Direction
Limit Load Applied Shear Perform
State Case Stage Shear Resist Ratio
(Controlling) (kip) (kip)
aaaaaaaaaaaaaaaa xxxx.xx xxxx.xx xxx.xxx
Note: Shear resistance is based on a phi factor of 0.90
Applied Footing Shear is based on:
vertical force = xxx.xxx (kip)
footing width = xxx.xxx (ft)
uniform distrib load (udl) = xxx.xxx (kip/ft)
pedestal clear spacing (s) = xxx.xxx (ft)
eff depth near pedestal (d) = xx.xxx (ft)
Shear = udl*(s/2 - d)

Chapter 7 Output Description
7-102
Note: Sec. beyond ftg. indicates that the controlling limit state is not
applicable because the section is beyond the footing dimensions.
Warning: A performance ratio less than 1 was found
7.6.17 REINFORCEMENT AND OPTIMUM DESIGN DETAILS Report Formats
The optimum report only shows the optimal solution (that satisfies all of the checks) at each applicable
location and component. The reinforcement design report shows the spacing for all bar sizes and
identifies the optimal bar. Furthermore, the reinforcement design report will identify bars that cannot be
developed.
7.6.17.1 Reinforcement Design Details
ABUTMENT BACKWALL AT SEAT LEVEL
(with optimum stem bar alignment option)
Bar Bar Develop Area Splice Status Reqd Bar Spacing
Size Spacing Length Prov Length Codes for Splice
(in) (in) (in^2) (in) (in)
ii a xxx.x aaxxx.x x.xxx xxx.xx aaa xxxx.x
Area Reqd = x.xxx (in^2) aa
Backwall Height = xxx.xx (in)
** Indicates area required was governed by the minimum temperature
and shrinkage reinforcment criteria.
* Indicates bar size and spacing with the least area of steel per unit
width of the structure in the backwall.
Status Code Descriptions
A - Development length exceeds stem height
B - Development exceeds backwall height
C - Splice length exceeds backwall height
D - Area provided is less than area required
FOOTING TOE (BOTTOM) FOOTING HEEL (TOP)
Bar Bar Develop Bar Area Bar Bar Develop Bar Area
Size Spacing Length Type Prov Size Spacing Length Type Prov
(in) (in) (in^2) (in) (in) (in^2)
ii a xxx.x aa aaxxx.x a x.xxx ii a xxx.x aa xxx.x a x.xxx
Area Reqd = x.xxx (in^2) Area Reqd = x.xxx (in^2)
FOOTING PARALLEL BOTTOM FOOTING PARALLEL TOP
Bar Bar Develop Bar Area Bar Bar Develop Bar Area
Size Spacing Length Type Prov Size Spacing Length Type Prov
(in) (in) (in^2) (in) (in) (in^2)
ii a xxx.x aa xxx.x a x.xxx ii a xxx.x aa xxx.x a x.xxx
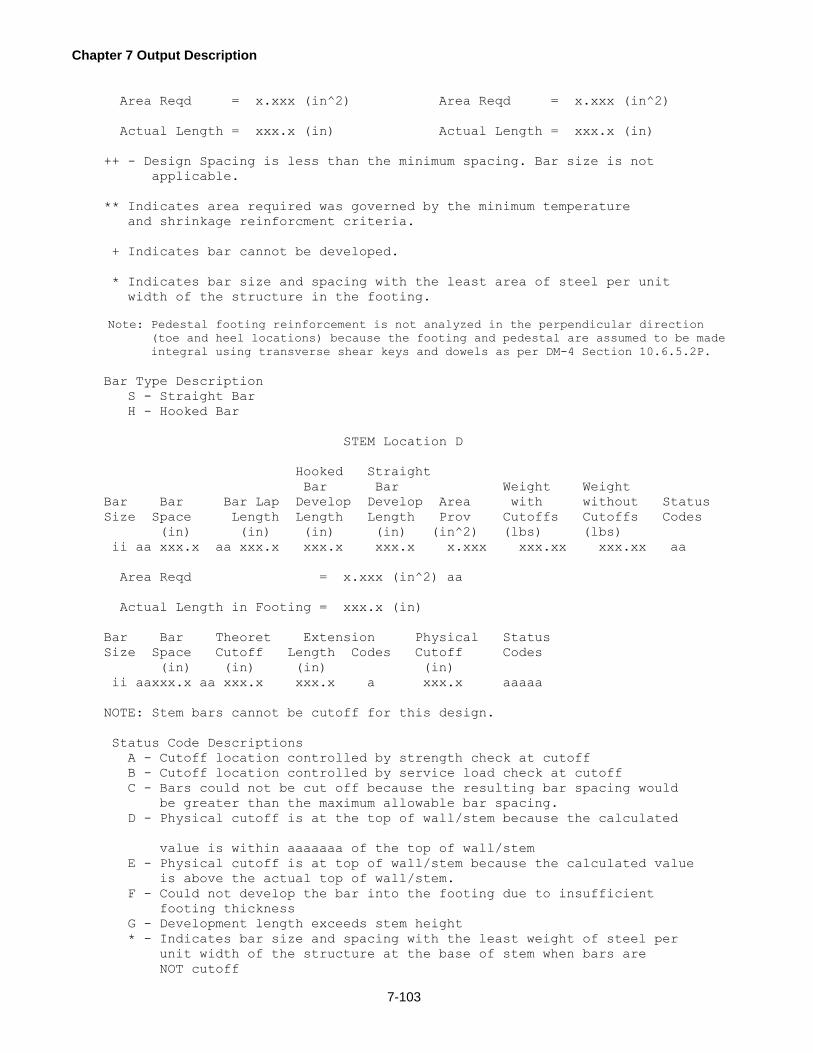
Chapter 7 Output Description
7-103
Area Reqd = x.xxx (in^2) Area Reqd = x.xxx (in^2)
Actual Length = xxx.x (in) Actual Length = xxx.x (in)
++ - Design Spacing is less than the minimum spacing. Bar size is not
applicable.
** Indicates area required was governed by the minimum temperature
and shrinkage reinforcment criteria.
+ Indicates bar cannot be developed.
* Indicates bar size and spacing with the least area of steel per unit
width of the structure in the footing.
Note: Pedestal footing reinforcement is not analyzed in the perpendicular direction
(toe and heel locations) because the footing and pedestal are assumed to be made
integral using transverse shear keys and dowels as per DM-4 Section 10.6.5.2P.
Bar Type Description
S - Straight Bar
H - Hooked Bar
STEM Location D
Hooked Straight
Bar Bar Weight Weight
Bar Bar Bar Lap Develop Develop Area with without Status
Size Space Length Length Length Prov Cutoffs Cutoffs Codes
(in) (in) (in) (in) (in^2) (lbs) (lbs)
ii aa xxx.x aa xxx.x xxx.x xxx.x x.xxx xxx.xx xxx.xx aa
Area Reqd = x.xxx (in^2) aa
Actual Length in Footing = xxx.x (in)
Bar Bar Theoret Extension Physical Status
Size Space Cutoff Length Codes Cutoff Codes
(in) (in) (in) (in)
ii aaxxx.x aa xxx.x xxx.x a xxx.x aaaaa
NOTE: Stem bars cannot be cutoff for this design.
Status Code Descriptions
A - Cutoff location controlled by strength check at cutoff
B - Cutoff location controlled by service load check at cutoff
C - Bars could not be cut off because the resulting bar spacing would
be greater than the maximum allowable bar spacing.
D - Physical cutoff is at the top of wall/stem because the calculated
value is within aaaaaaa of the top of wall/stem
E - Physical cutoff is at top of wall/stem because the calculated value
is above the actual top of wall/stem.
F - Could not develop the bar into the footing due to insufficient
footing thickness
G - Development length exceeds stem height
* - Indicates bar size and spacing with the least weight of steel per
unit width of the structure at the base of stem when bars are
NOT cutoff

Chapter 7 Output Description
7-104
+ - Indicates bar size and spacing with the least weight per
unit width of the structure for the whole height of the stem
when bars are both cutoff and full height.
** - Indicates area required was governed by the minimum temperature
and shrinkage reinforcement criteria
++ - Design Spacing is less than the minimum spacing. Bar size is not
applicable.
Extension Length Code
A - Effective Depth Controlled
B - Fifteen Bar Diameters Controlled
C - 12 inch Minimum Controlled
Note: The theoretical cutoff point is where every other
bar is no longer required in the stem.
Note: Stem Bars at Location D are always epoxy coated as per
DM4-2000 Section 5.4.3.6P
7.6.17.2 Optimum Design Details
ABUTMENT BACKWALL AT SEAT LEVEL
Bar Bar Develop Area Splice
Size Spacing Length Prov Length
(in) (in) (in^2) (in)
ii a xxx.x xxxx.x x.xxx xxx.x
No bar design found for the backwall. Refer to the
REINFORCEMENT DESIGN DETAILS output for further information.
FOOTING TOE (BOTTOM) FOOTING HEEL (TOP)
FOOTING PARALLEL BOTTOM FOOTING PARALLEL TOP
Bar Bar Develop Bar Bar Bar Develop Bar
Size Spacing Length Type Size Spacing Length Type
(in) (in) (in) (in)
ii a xxx.x xxx.x a ii a xxx.x xxx.x a
Bar Type Description
S - Straight Bar
H - Hooked Bar
STEM Location D
Hooked Straight
Bar Bar Weight Weight
Bar Bar Bar Lap Develop Develop with without Status
Size Space Length Length Length Cutoffs Cutoffs Codes
(in) (in) (in) (in) (lbs) (lbs)
ii aa xxx.x xxx.x xxx.x xxx.x xxx.xx xxx.xx aa
Bar Bar Theoret Extension Physical Status
Size Space Cutoff Length Cutoff Codes
(in) (in) (in) (in)
ii aa xxx.x xxx.x xxx.x xxx.x aaaaa
NOTE: Stem bars cannot be cutoff for this design.

Chapter 7 Output Description
7-105
Status Code Descriptions
A - Cutoff location controlled by strength check at cutoff
B - Cutoff location controlled by service load check at cutoff
C - Bars could not be cut off because the resulting bar spacing would
be greater than the maximum allowable bar spacing.
D - Physical cutoff is at the top of wall/stem because the calculated
value is within aaaaaaa of the top of wall/stem
E - Physical cutoff is at top of wall/stem because the calculated value
is above the actual top of wall/stem.
F - Could not develop the bar into the footing due to insufficient
footing thickness
G - Development length exceeds stem height
* - Indicates bar size and spacing with the least area of steel per
unit width of the structure at the base of stem when bars are
NOT cutoff
+ - Indicates bar size and spacing with the least weight per
unit width of the structure for the whole height of the stem
when bars are both cutoff and full height
Note: The theoretical cutoff point is where every other
bar is no longer required in the stem.
Note: Stem Bars at Location D are always epoxy coated as per
DM4-2000 Section 5.4.3.6P
7.6.18 UNFACTORED LOADS Report Summary
LATERAL EARTH PRESSURE (EH) INTERMEDIATE VALUES
Temporary Stage
Failure Soil Height Phi-
Locn Method Ka Kah Kav Height Ratio Alpha Theta Prime Beta
(ft) (deg) (deg) (deg) (deg)
aaaaa aaaa x.xxx x.xxx x.xxx xx.xx xxxx xx.xx xx.xx xx.xx xx.xx
aaaaa aaaa x.xxx*x.xxx*x.xxx* xx.xx xxxx xx.xx xx.xx xx.xx xx.xx
Legend
Alpha - Angle of soil wedge measured from the vertical
Theta - Stem back face batter angle
Phi-Prime - Backfill internal friction angle
Beta - Backfill slope measured from the horizontal
* Note: The Minimum Equivalent Fluid Pressure (MEFP) controlled
the Kah calculation. Ka, Kah and Kav are based on
the Minimum Equivalent Fluid Pressure.

Chapter 7 Output Description
7-106
FOUNDATION
Temporary Stage (footing bottom at toe)
Final Stage (Footing bottom at toe)
Applied Vertical Applied Horizontal
Load Force Moment Load Force Moment
(kip) (kip-ft) (kip) (kip-ft)
aaaa xxxxx.xx xxxxxx.xx aaaa xxxxx.xx xxxxxx.xx
aaaa xxxxx.xx xxxxxx.xx aaaa xxxxx.xx xxxxxx.xx
aaaa xxxxx.xx xxxxxx.xx aaaa xxxxx.xx xxxxxx.xx
BACKWALL
Final Stage xxx.xx (ft) from top of structure
Applied Vertical Applied Horizontal
Load Force Moment Load Force Moment
(kip) (kip-ft) (kip) (kip-ft)
aaaa xxxxx.xx xxxxxx.xx aaaa xxxxx.xx xxxxxx.xx
aaaa xxxxx.xx xxxxxx.xx aaaa xxxxx.xx xxxxxx.xx
aaaa xxxxx.xx xxxxxx.xx aaaa xxxxx.xx xxxxxx.xx
STEM
Temporary Stage Location a xxx.xx (ft) from top of structure
Final Stage Location a xxx.xx (ft) from top of structure
Applied Vertical Applied Horizontal
Load Force Moment Load Force Moment
(kip) (kip-ft) (kip) (kip-ft)
aaaa xxxxx.xx xxxxxx.xx aaaa xxxxx.xx xxxxxx.xx
aaaa xxxxx.xx xxxxxx.xx aaaa xxxxx.xx xxxxxx.xx
aaaa xxxxx.xx xxxxxx.xx aaaa xxxxx.xx xxxxxx.xx
STEM
Final Stage Location a xxx.xx (ft) from top of structure
Vertical Horizontal
------------------------------------- -----------------------------
Applied 2" +ecc 2" -ecc Applied
Load Force Moment Moment Load Force Moment
(kip) (kip-ft) (kip-ft) (kip) (kip-ft)
aaaaa xxxxx.xx xxxxx.xx xxxxx.xx aaaa xxxxx.xx xxxxx.xx
Note: An asterisk (*) indicates that the vertical load
does not act through the bearings.
FOOTING
Temporary Stage
Final Stage
Applied Toe Shear Toe Applied Heel Shear Heel
Load Eff D at Face Moment Load Eff D at Face Moment
(kip) (kip) (kip-ft) (kip) (kip) (kip-ft)
aaaa xxxxx.xx xxxxx.xx xxxxx.xx aaaa xxxxx.xx xxxxx.xx xxxxx.xx
aaaa xxxxx.xx xxxxx.xx xxxxx.xx

Chapter 7 Output Description
7-107
Pedestal Self Weight : xxxxxx.xx (kip)
Pedestal Self Weight Moment : xxxxxx.xx (kip-ft)
Note: Pedestal self weight moment is taken about the front bottom
corner of the pedestal acting in a counter clockwise direction,
with the front face on the left side and the back face on the
right side.
Foundation moments are taken about the bottom of the footing at the
toe. Stem and Backwall moments are taken about the centerline of the
section at the location analyzed. Positive moment clockwise; negative
moment counterclockwise; toe on right; heel on left. Footing moments
are the moments at the section of the toe or heel due only to those
loads applied directly to the toe or heel.
7.6.19 LOAD FACTORS Report Summary
FOUNDATION
Vertical Horizontal
Limit Load Applied Load Eta Applied Load Eta
State Case Stage Load Factor Factor Load Factor Factor
aaaaaaaaaaaaaaaa aaaa a xxxx a xxxx aaaa a xxxx a xxxx
STEM
Vertical Horizontal
Limit Load Applied Load Eta Applied Load Eta
State Case Stage Load Factor Factor Load Factor Factor
aaaaaaaaaaaaaaaa aaaa a xxxx a xxxx aaaa a xxxx a xxxx
BACKWALL
Vertical Horizontal
Limit Load Applied Load Eta Applied Load Eta
State Case Stage Load Factor Factor Load Factor Factor
aaaaaaaaaaaaaaaa aaaa a xxxx a xxxx aaaa a xxxx a xxxx
FOOTING
Toe Heel
Limit Load Applied Load Eta Applied Load Eta
State Case Stage Load Factor Factor Load Factor Factor
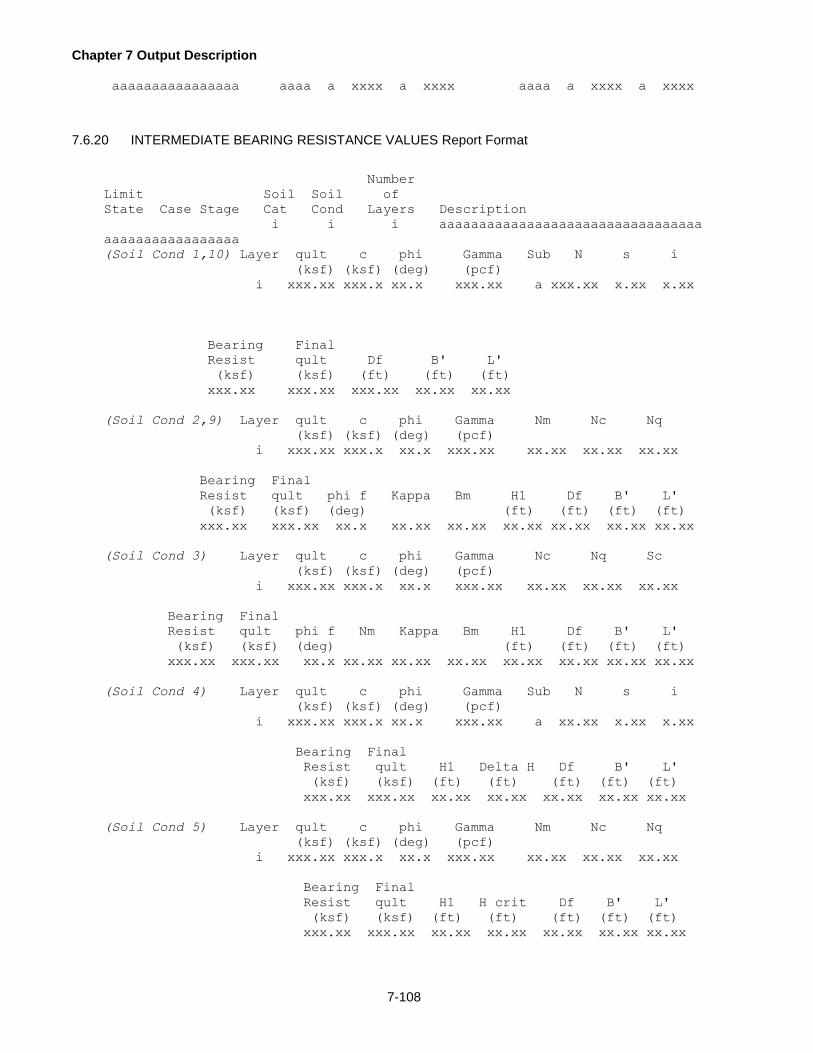
Chapter 7 Output Description
7-108
aaaaaaaaaaaaaaaa aaaa a xxxx a xxxx aaaa a xxxx a xxxx
7.6.20 INTERMEDIATE BEARING RESISTANCE VALUES Report Format
Number
Limit Soil Soil of
State Case Stage Cat Cond Layers Description
i i i aaaaaaaaaaaaaaaaaaaaaaaaaaaaaaaaa
aaaaaaaaaaaaaaaaa
(Soil Cond 1,10) Layer qult c phi Gamma Sub N s i
(ksf) (ksf) (deg) (pcf)
i xxx.xx xxx.x xx.x xxx.xx a xxx.xx x.xx x.xx
Bearing Final
Resist qult Df B' L'
(ksf) (ksf) (ft) (ft) (ft)
xxx.xx xxx.xx xxx.xx xx.xx xx.xx
(Soil Cond 2,9) Layer qult c phi Gamma Nm Nc Nq
(ksf) (ksf) (deg) (pcf)
i xxx.xx xxx.x xx.x xxx.xx xx.xx xx.xx xx.xx
Bearing Final
Resist qult phi f Kappa Bm H1 Df B' L'
(ksf) (ksf) (deg) (ft) (ft) (ft) (ft)
xxx.xx xxx.xx xx.x xx.xx xx.xx xx.xx xx.xx xx.xx xx.xx
(Soil Cond 3) Layer qult c phi Gamma Nc Nq Sc
(ksf) (ksf) (deg) (pcf)
i xxx.xx xxx.x xx.x xxx.xx xx.xx xx.xx xx.xx
Bearing Final
Resist qult phi f Nm Kappa Bm H1 Df B' L'
(ksf) (ksf) (deg) (ft) (ft) (ft) (ft)
xxx.xx xxx.xx xx.x xx.xx xx.xx xx.xx xx.xx xx.xx xx.xx xx.xx
(Soil Cond 4) Layer qult c phi Gamma Sub N s i
(ksf) (ksf) (deg) (pcf)
i xxx.xx xxx.x xx.x xxx.xx a xx.xx x.xx x.xx
Bearing Final
Resist qult H1 Delta H Df B' L'
(ksf) (ksf) (ft) (ft) (ft) (ft) (ft)
xxx.xx xxx.xx xx.xx xx.xx xx.xx xx.xx xx.xx
(Soil Cond 5) Layer qult c phi Gamma Nm Nc Nq
(ksf) (ksf) (deg) (pcf)
i xxx.xx xxx.x xx.x xxx.xx xx.xx xx.xx xx.xx
Bearing Final
Resist qult H1 H crit Df B' L'
(ksf) (ksf) (ft) (ft) (ft) (ft) (ft)
xxx.xx xxx.xx xx.xx xx.xx xx.xx xx.xx xx.xx

Chapter 7 Output Description
7-109
(Soil Cond 6) Layer qult c phi Gamma Nm Nc Nq
(ksf) (ksf) (deg) (pcf)
i xxx.xx xxx.x xx.x xxx.xx xx.xx xx.xx xx.xx
Bearing Final
Resist qult H1 Ks Df1 B' L'
(ksf) (ksf) (ft) (ft) (ft) (ft)
xxx.xx xxx.xx xx.xx xx.xx xx.xx xx.xx xx.xx
(Soil Cond 7) Layer qult c phi Gamma Nm Nc Nq
(ksf) (ksf) (deg) (pcf)
i xxx.xx xxx.x xx.x xxx.xx xx.xx xx.xx xx.xx
Bearing Final
Resist qult H1 Df1 B' L'
(ksf) (ksf) (ft) (ft) (ft) (ft)
xxx.xx xxx.xx xx.xx xx.xx xx.xx xx.xx
(Soil Cond 8) Layer qult c phi Gamma Nm Nc Nq
(ksf) (ksf) (deg) (pcf)
i xxx.xx xxx.x xx.x xxx.xx xx.xx xx.xx xx.xx
Bearing Final
Resist qult qult,eq4 H crit H1 Df B' L'
(ksf) (ksf) (ksf) (ft) (ft) (ft) (ft) (ft)
xxx.xx xxx.xx xxx.xx xx.xx xx.xx xx.xx xx.xx xx.xx
NOTE: The Bearing Resistance values are based on a Bearing Capacity
Resistance Factor (Phi) of x.xx times the Final qult value
for all limit states except the Service limit state. The
Service limit state uses a Phi of 1.0 times the Final qult value.
7.6.21 MOMENT AXIAL INTERACTION Report Format
ABUTMENT BACKWALL xxx.xx (ft) FROM TOP OF STRUCTURE
ABUTMENT BACKWALL AT SEAT LEVEL xxx.xx (ft) FROM TOP OF STRUCTURE
Limit Load Applied Moment Applied Axial Perform Area Phi
State Case Stage Moment Resist Axial Resist Ratio Reqd Factor
(kip-ft) (kip-ft) (kip) (kip) (in^2)
aaaaaaaaaaaaaaaa xxxxx.xxa xxxxx.xx xxxxx.xx xxxxx.xx xxx.xxx xx.xxxaa aaaa
aaaaaaaaaaaaaaaa xxxxx.xxa xxxxx.xx xxxxx.xx xxxxx.xx xxx.xxx xx.xxxaa aaaa
STEM LOCATION A xxx.xx (ft) FROM TOP OF STRUCTURE
Limit Load Applied Moment Applied Axial Perform Area Phi
State Case Stage Moment Resist Axial Resist Ratio Reqd Factor
(kip-ft) (kip-ft) (kip) (kip) (in^2)
aaaaaaaaaaaaaaaa xxxxx.xxa xxxxx.xx xxxxx.xx xxxxx.xx xxx.xxx xx.xxxaa aaaa
aaaaaaaaaaaaaaaa xxxxx.xxa xxxxx.xx xxxxx.xx xxxxx.xx xxx.xxx xx.xxxaa aaaa
STEM CUTOFF LOCATION - #II @ xx.xxx (ft) FROM TOP OF STRUCTURE
Limit Load Applied Moment Applied Axial Perform Area Phi
State Case Stage Moment Resist Axial Resist Ratio Reqd Factor
(kip-ft) (kip-ft) (kip) (kip) (in^2)
aaaaaaaaaaaaaaaa xxxxx.xxa xxxxx.xx xxxxx.xx xxxxx.xx xxx.xxx xx.xxxaa aaaa
aaaaaaaaaaaaaaaa xxxxx.xxa xxxxx.xx xxxxx.xx xxxxx.xx xxx.xxx xx.xxxaa aaaa

Chapter 7 Output Description
7-110
Performance Ratio = Axial Resistance / Applied Axial Force
Section Thickness =xxx.xx (in)
Effective Depth =xxx.xx (in)
Area required based on rho-min: xxx.xx (in^2) a
Cracking Moment M(cr): xxxxx.xx (kip-ft)
4/3 Mu: xxxxx.xx (kip-ft)
** Indicates governing area of steel for the stem location
++ Indicates the section is over-reinforced
Phi Factor Code Descriptions
TN - Tension controlled section
TR - Transition section
CM - Compression controlled section
Warning: A performance ratio less than 1 was found
+ Warning: Negative applied load encountered in the stem, Temp/Shrink
steel in front face of stem does not meet capacity requirements.
This message will result in a specification check warning.
+ Note: Negative applied load encountered in the backwall. Temp/Shrink
steel in front face of backwall provides adequate capacity.
This message will result in a specification check warning.
+ Warning: Negative applied load encountered in the backwall, Temp/Shrink
steel in front face of backwall does not meet capacity requirements.
+ Note: Negative applied load encountered in the stem. Temp/Shrink
steel in front face of stem provides adequate capacity.
This message will result in a specification check warning.
+ Warning: Negative applied load encountered in the stem. Temp/Shrink
steel in front face of stem does not meet capacity requirments.
A positive applied moment produces tensile stress on the backface
reinforcement. A positive axial force produces a compressive stress in the
section. Applied loads are assumed to be positive. The resistance is based on
backface reinforcement for positive loads. When negative applied loads are
detected the capacity is checked using the standard temperature and shrinkage
steel(#4 @ 12in) found in the front face of the stem.
Warning: negative applied load encountered in backwall, assumptions for
moment axial load interaction are violated.
Warning: negative applied load encountered in stem, assumptions for moment
axial load interaction are violated.
7.6.22 INTERNAL FOOTING FORCES Report Format
TOE SHEAR
HEEL SHEAR
Shear Shear
Limit Load due to due to Total Shear
State Case Stage Piles Footing Shear Location
(kip) (kip) (kip)
aaaaaaaaaaaaaaaa xxxxxx.xx xxxxxx.xx xxxxxx.xx aaaaaaaa
aaaaaaaaaaaaaaaa xxxxxx.xx xxxxxx.xx xxxxxx.xx aaaaaaaa
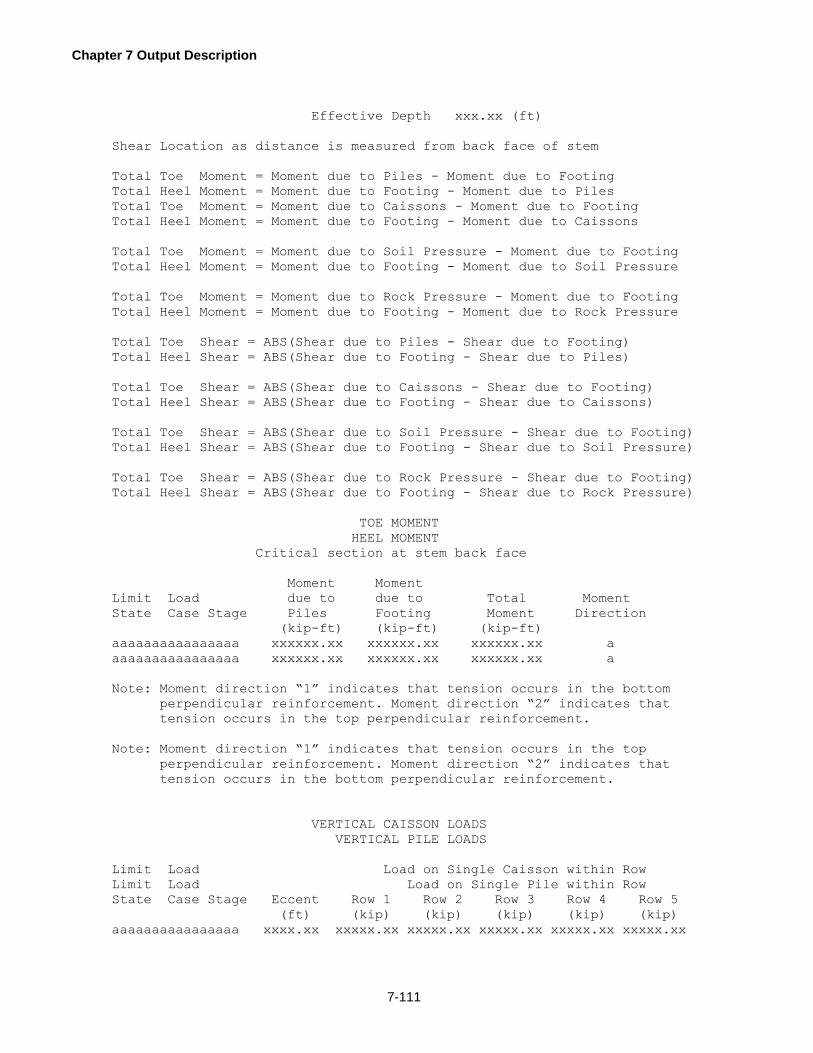
Chapter 7 Output Description
7-111
Effective Depth xxx.xx (ft)
Shear Location as distance is measured from back face of stem
Total Toe Moment = Moment due to Piles - Moment due to Footing
Total Heel Moment = Moment due to Footing - Moment due to Piles
Total Toe Moment = Moment due to Caissons - Moment due to Footing
Total Heel Moment = Moment due to Footing - Moment due to Caissons
Total Toe Moment = Moment due to Soil Pressure - Moment due to Footing
Total Heel Moment = Moment due to Footing - Moment due to Soil Pressure
Total Toe Moment = Moment due to Rock Pressure - Moment due to Footing
Total Heel Moment = Moment due to Footing - Moment due to Rock Pressure
Total Toe Shear = ABS(Shear due to Piles - Shear due to Footing)
Total Heel Shear = ABS(Shear due to Footing - Shear due to Piles)
Total Toe Shear = ABS(Shear due to Caissons - Shear due to Footing)
Total Heel Shear = ABS(Shear due to Footing - Shear due to Caissons)
Total Toe Shear = ABS(Shear due to Soil Pressure - Shear due to Footing)
Total Heel Shear = ABS(Shear due to Footing - Shear due to Soil Pressure)
Total Toe Shear = ABS(Shear due to Rock Pressure - Shear due to Footing)
Total Heel Shear = ABS(Shear due to Footing - Shear due to Rock Pressure)
TOE MOMENT
HEEL MOMENT
Critical section at stem back face
Moment Moment
Limit Load due to due to Total Moment
State Case Stage Piles Footing Moment Direction
(kip-ft) (kip-ft) (kip-ft)
aaaaaaaaaaaaaaaa xxxxxx.xx xxxxxx.xx xxxxxx.xx a
aaaaaaaaaaaaaaaa xxxxxx.xx xxxxxx.xx xxxxxx.xx a
Note: Moment direction “1” indicates that tension occurs in the bottom
perpendicular reinforcement. Moment direction “2” indicates that
tension occurs in the top perpendicular reinforcement.
Note: Moment direction “1” indicates that tension occurs in the top
perpendicular reinforcement. Moment direction “2” indicates that
tension occurs in the bottom perpendicular reinforcement.
VERTICAL CAISSON LOADS
VERTICAL PILE LOADS
Limit Load Load on Single Caisson within Row
Limit Load Load on Single Pile within Row
State Case Stage Eccent Row 1 Row 2 Row 3 Row 4 Row 5
(ft) (kip) (kip) (kip) (kip) (kip)
aaaaaaaaaaaaaaaa xxxx.xx xxxxx.xx xxxxx.xx xxxxx.xx xxxxx.xx xxxxx.xx
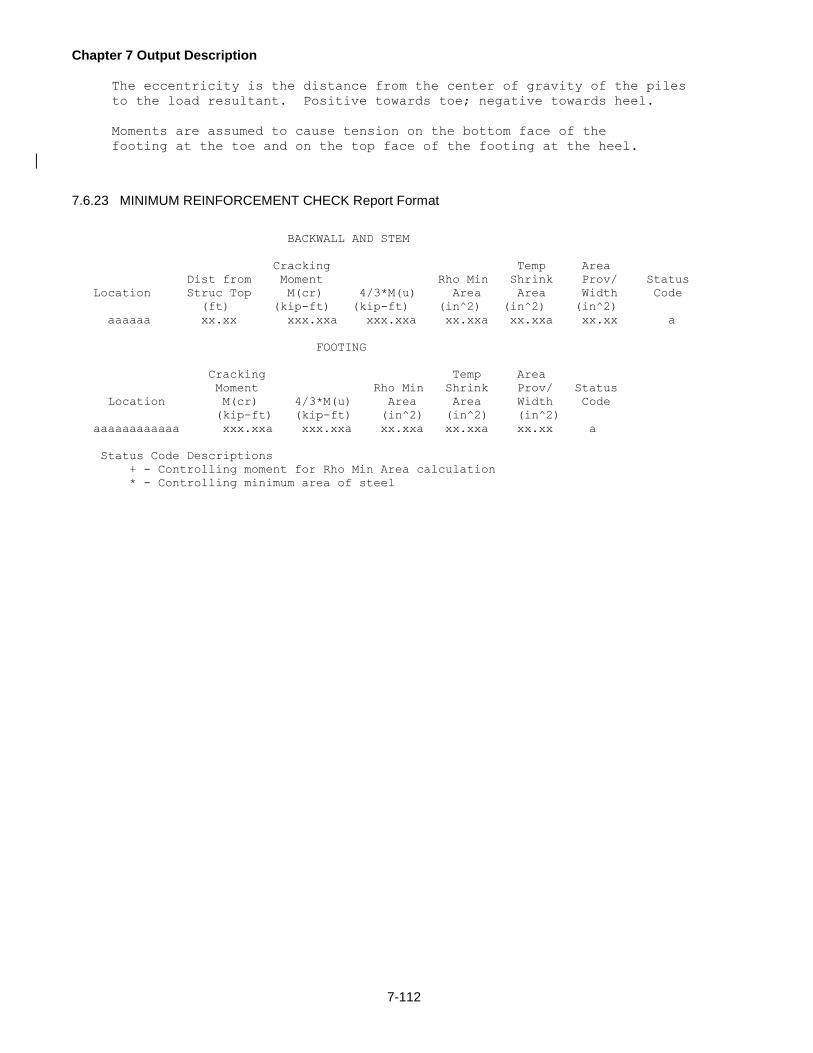
Chapter 7 Output Description
7-112
The eccentricity is the distance from the center of gravity of the piles
to the load resultant. Positive towards toe; negative towards heel.
Moments are assumed to cause tension on the bottom face of the
footing at the toe and on the top face of the footing at the heel.
7.6.23 MINIMUM REINFORCEMENT CHECK Report Format
BACKWALL AND STEM
Cracking Temp Area
Dist from Moment Rho Min Shrink Prov/ Status
Location Struc Top M(cr) 4/3*M(u) Area Area Width Code
(ft) (kip-ft) (kip-ft) (in^2) (in^2) (in^2)
aaaaaa xx.xx xxx.xxa xxx.xxa xx.xxa xx.xxa xx.xx a
FOOTING
Cracking Temp Area
Moment Rho Min Shrink Prov/ Status
Location M(cr) 4/3*M(u) Area Area Width Code
(kip-ft) (kip-ft) (in^2) (in^2) (in^2)
aaaaaaaaaaaa xxx.xxa xxx.xxa xx.xxa xx.xxa xx.xx a
Status Code Descriptions
+ - Controlling moment for Rho Min Area calculation
* - Controlling minimum area of steel

Chapter 7 Output Description
7-113
7.7 SPECIFICATION CHECK WARNINGS
This output table gives a summary of the titles of all of the output tables, which contain a specification check
warning. Even if a specification checking output table and/or an analysis point is not printed the specification
check is done. If a warning occurs, the output table title will appear on this report with a page number if the table
is printed or an asterisk if the table is not printed. This table prints for both design and analysis runs, and will still
print, even if all other output is turned off.
A sample specification check warning table is shown in Figure 1.
LRFD Abutment and Retaining Wall, Version 1.6.1.0(TEST) PAGE 47
Input File: tnab1B.dat 08/03/2007 08:35:48
---------------------------------------------------------------------------
S.R. 0219 - C10 S102 ALT. 1 NEAR ABUTMENT DESIGN W/HP 14X117
SUMMARY - SPECIFICATION CHECKS
---------------------------------------------------------------------------
SPECIFICATION CHECK WARNINGS
For the live loadings input by the user, the program did not
encounter any specification check warnings for any of the
applicable limit states. It should be noted that the program
does not perform the specification checking corresponding to
commands that have not been input by the user.
THE FOLLOWING TABLES HAVE SPEC CHECK WARNINGS PAGE NO.
--------------------------------------------- --------
MOMENT AXIAL INTERACTION
STEM LOCATION D 36.00 (ft) FROM TOP OF STRUCTURE.......... 42
STEM CUTOFF LOCATION - SHOWN FOR LARGEST BAR CUTOFF......... 42
CRACK CONTROL – ANALYSIS*
FOOTING*
* - An asterisk indicates the table was not printed
Figure 7.7-1 Specification Check Warnings Page

Chapter 7 Output Description
7-114
7.8 SPECIFICATION CHECK FAILURES
This output table gives a summary of the titles of all of the output tables, which contain a specification check
failure. Even if a specification checking output table and/or an analysis point is not printed the specification check
is done. If a warning occurs, the output table title will appear on this report with a page number if the table is
printed or an asterisk if the table is not printed. This table prints for both design and analysis runs, and will still
print, even if all other output is turned off.
A sample specification check failure table is shown in Figure 1.
LRFD Abutment and Retaining Wall, Version 1.6.1.0(TEST) PAGE 48
Input File: tnab1B.dat 08/03/2007 08:35:48
---------------------------------------------------------------------------
S.R. 0219 - C10 S102 ALT. 1 NEAR ABUTMENT DESIGN W/HP 14X117
SUMMARY - SPECIFICATION CHECKS (cont.)
---------------------------------------------------------------------------
SPECIFICATION CHECK ERRORS
For the live loadings input by the user, the program encountered
one or more specification check failures. The following is a
list of output table headings for which failures have occurred.
It should be noted that the program does not perform
specification checking corresponding to commands that have
not been input by the user.
THE FOLLOWING TABLES HAVE SPEC CHECK ERRORS PAGE NO.
--------------------------------------------- --------
FOOTING FLEXURE*
FLEXURAL STRENGTH*
CRACK CONTROL - ANALYSIS
FOOTING..................................................... 44
REINFORCEMENT SUMMARY - ANALYSIS
FOOTING..................................................... 45
SHEAR RESULTS
FOOTING..................................................... 46
* - An asterisk indicates the table was not printed
Figure 7.8-1 Specification Check Failures Page

8-1
8 EXAMPLE PROBLEMS
8.1 EXAMPLE PROBLEMS
This chapter contains the example problems used to test and verify this program. Table 1 shows the example
problem matrix, which lists each example problem and the key input items used to differentiate the problems. For
each example problem, the following information is given: a brief narrative description of the problem; the input
items from the example problem matrix; additional assumptions and input items required to create the input data
file; and a sketch which shows the abutment geometry. The actual input data file for each example problem is not
listed in this manual, but is included electronically. along with the executable program.

Chapter 8 Example Problems
8-2
Table 8.1-1 Example Problem Matrix
Example Problem
Input Item
1*
2*
3*
4*
6
7
Solution Type
DSGN
DSGN
ANAL
ANAL
DSGN
ANAL
Structure Type (1)
AT1
AWB
RWL
AWB
AT2
RWL-g
Footing Type (2)
PIL
SPR
PIL
PED
SPR
SPR
Units
US
US
US
US
US
US
Footing Elv. Fixity
TOP
TOP
def
def
BOT
def
Footing Near Slope?
N.A.
YES
N.A.
N.A.
N.A.
NO
Input Height
12.7 ft
10.0 ft
13.0 ft
7.57 ft
34.5 ft
8.67 ft
Stem Batter (3)
N.A.
BACK
BACK
BACK
BOTH
BOTH
Front Water Level
NONE
NONE
14.25 ft
NONE
13.0 ft
6.5 ft
Back Water Level
10.95 ft
4.85 ft
11.25 ft
NONE
10.0 ft
3.5 ft
Backfill Slope y:x
N.A.
N.A.
1:2
N.A.
N.A.
3:12
Min. Footing Thickness
2.5 ft
2.0 ft
3.0 ft
2.0 ft
2.25 ft
1.33 ft
Minimum Toe Projection
1.0 ft
1.0 ft
2.25 ft
1.75 ft
1.5 ft
0.83 ft
Minimum Heel Projection
1.0 ft
1.0 ft
4.92 ft
3.12 ft
1.5 ft
1.33 ft
Max. Footing Thickness
5.0 ft
2.5 ft
N.A.
N.A.
3.0 ft
N.A.
Maximum Toe Projection
1.75 ft
def
N.A.
N.A.
def
N.A.
Maximum Heel Projection
def
def
N.A.
N.A.
def
N.A.
Pile/Cai Batter x:y
3:12
N.A.
varies
N.A.
N.A.
N.A.
Batter Piles per Row
0%
N.A.
varies
N.A.
N.A.
N.A.
Pile/Cai Optimization
DENS
N.A.
N.A.
N.A.
N.A.
N.A.
# of Pile/Cai Rows
N.A.
N.A.
2
N.A.
N.A.
N.A.
Epoxy Coated Rebar
N
N
N
N
Y
N.A.
Rock or Soil-# Layers
N.A.
Soil-1
N.A.
Rock-1
Rock-1
Soil-1
Live Load Surcharge
Y
Y
Y
Y-Temp
N
N
Earth Surcharge
N
N
N
N
Y
N
(1) AT1 = Abutment Type I, AT2 = Abutment Type II, RWL = Retaining Wall, AWB = Abutment w/o backwall, “-g” = Gravity Wall
(2) SPR = Spread Footing, PIL = Pile Footing, CAI = Caisson Footing, PED = Pedestal Footing (3) Back = Stem has back batter, Front = Stem has front batter, Both = Stem has front and back batter * Example problem taken from existing Abutment and Retaining Wall manual

Chapter 8 Example Problems
8-3
Table 8.1-1 Example Problem Matrix (cont.)
Example Problem
Input Item
8
9
10
11
12
13
14
Solution Type
ANAL
DSGN
ANAL
ANAL
DSGN
DSGN
ANAL
Structure Type (1)
AT2
RWL
AWB-g
AT1
AT2
RWL
AT1
Footing Type (2)
PIL
PED
SPR
PIL
CAI
SPR
SPR
Units
US
US
US
US
US
US
US
Footing Elv. Fixity
def
BOT
def
def
BOT
TOP
def
Footing Near Slope?
N.A.
N.A.
N.A.
N.A.
N.A.
NO
NO
Input Height
14.0 ft
12.0 ft
7.75 ft
39.5 ft
14.75 ft
25.0 ft
12.7 ft
Stem Batter (3)
BOTH
BACK
BOTH
N.A.
BOTH
BACK
N.A.
Front Water Level
10.0 ft
7.2 ft
11.0 ft
21.0 ft
9.0 ft
21.0 ft
13.95 ft
Back Water Level
7.0 ft
4.2 ft
8.0 ft
17.0 ft
6.0 ft
18.0 ft
10.95 ft
Backfill Slope y:x
N.A.
2:12
N.A.
N.A.
N.A.
Def
N.A.
Min. Footing Thickness
2.5 ft
1.5 ft
1.25 ft
4.25 ft
2.5 ft
def
2.0 ft
Minimum Toe Projection
2.75 ft
def
0.4 ft
6.5 ft
10.0 ft
def
2.58 ft
Minimum Heel Projection
5.19 ft
def
2.12 ft
11.5 ft
def
def
2.33 ft
Max. Footing Thickness
N.A.
2.5 ft
N.A.
N.A.
6.0 ft
4.0 ft
N.A.
Maximum Toe Projection
N.A.
def
N.A.
N.A.
def
6.0 ft
N.A.
Maximum Heel Projection
N.A.
def
N.A.
N.A.
def
4.0 ft
N.A.
Pile/Cai Batter x:y
varies
N.A.
N.A.
varies
3:12
N.A.
N.A.
Batter Piles per Row
varies
N.A.
N.A.
varies
0%
N.A.
N.A.
Pile/Cai Optimization
N.A.
N.A.
N.A.
N.A.
COST
N.A.
N.A.
# of Pile/Cai Rows
4
N.A.
N.A.
5
N.A.
N.A.
N.A.
Epoxy Coated Rebar
N
Y
N.A.
Y
Y
Y
N
Rock or Soil-# Layers
N.A.
Rock-1
Rock-1
N.A.
N.A.
Soil-2
Soil-1
Live Load Surcharge
Y-Temp
Y
Y
N
Y
Y
Y
Earth Surcharge
Y-Temp
Y
N
Y
Y
Y
N

Chapter 8 Example Problems
8-4
8.2 EXAMPLE 1 (DESIGN)
Example 1 is a type I abutment on a pile footing. The structure geometry is shown in the following figure.
Earthquake loads are not considered in this problem.
15"
21"16"
48.2"
10.95'
12.70'
6.60'
1.75'
max.
2.50' (Min.)
D=12"
circular pile
4"
4"
29"
14"
9"
1.00'
min.
3"
Figure 8.2-1 Example 1 Abutment Geometry

Chapter 8 Example Problems
8-5
CONFIGURATION
Lines Blank
per Lines
Page on Top
83 0
CONTROL
Sys of Type Footing
Units of Run Datum
US D T
ABUTMENT TYPE I
Seat Seat Corbel
Top Seat Slope Face Corbel Corbel Slope
Height Width Width Height Height Width Height Height
(ft) (in) (in) (in) (in) (in) (in) (in)
12.70 15.0 29.0 0.0 48.2 4.0 21.0 4.0
Paving Paving Front Back Architectural Backwall/
Notch Notch Bearing Bearing Water Water Treatment Stem Bar
Width Height X Locn Y Locn Level Level Thickness Alignment
(in) (in) (in) (in) (ft) (ft) (in)
9.0 16.0 14.0 none none 10.95 3.0 Y
NOTE: An architectural treatment has been specified. All structure dimensions
shown do not account for the architectural treatment. For drafting
purposes the architectural treatment thickness is used to dimension the
architectural treatment along the front face of the stem.
FOOTING
Min Min Min Min Max Max Max Max
Footing Toe Heel Footing Footing Toe Heel Footing
Thick Proj Proj Width Thick Proj Proj Width
(ft) (ft) (ft) (ft) (ft) (ft) (ft) (ft)
2.50 1.00 1.00 6.08 5.00 1.75 none none
Footing Footing Stem
Thick Width Shift
Increment Increment Increment
(in) (in) (in)
2.00 3.00 1.00
PILE
Pile Pile Service Strength Service Strength
Dim Dim Pile Axial Axial Lateral Lateral Allowed
A B Embedment Capacity Capacity Capacity Capacity Uplift
(in) (in) (in) (kip) (kip) (kip) (kip) (kip)
12.0 0.0 12.0 N/A 280.00 N/A 0.00 0.00
PILE/CAISSON LAYOUT DESIGN
Toe to Minimum Pile Row
First Heel to Minimum Maximum Row Spacing Distances
Row Last Row Spacing Spacing Placement Rounding Rounding
(ft) (ft) (ft) (ft) (ft) (ft)
1.50 1.50 3.00 15.00 E 0.25 0.25
Design Batt Design Batt Pile/
Horizontal Vertical Last Row Caisson Footing
Component Component % Batter Optimize Cost Cost
(%) ($/pile) ($/yd^3)
3.00 12.00 0.0 P none none

Chapter 8 Example Problems
8-6
MATERIALS
Backwall Stem Footing Reinforcement Epoxy Coated
f'c f'c f'c fy Backwall Stem Footing
(ksi) (ksi) (ksi) (ksi)
3.500 3.000 3.000 50.000 N N N
Backfill Backfill Backfill Minimum
Friction Dry Saturated Equivalent Concrete Density
Angle Density Density Fluid Press For DL For Ec
(deg) (lb/ft^3) (lb/ft^3) (lb/ft^3) (lb/ft^3) (lb/ft^3)
33.25 120.0 135.0 35.0 150.0 145.0
Architectural
Treatment
Density fu
(lb/ft^3) (ksi)
150.0 65.000
MISCELLANEOUS REINFORCEMENT DATA
Aggregate Development Backwall Stem Footing
Size Correction Exposure Exposure Exposure
(in) Class Class Class
1.00 1.00 2 2 1
REINFORCEMENT COVER
Backwall Stem Footing Footing Footing Footing
Back Back Top Top Bottom Bottom Toe Heel
Vertical Vertical Perpend Parallel Perpend Parallel End End
(in) (in) (in) (in) (in) (in) (in) (in)
3.0 3.0 2.8 4.2 3.8 5.2 2.0 2.0
BAR SPACING FOR DESIGN
Backwall Stem Footing Hooked User Requested Bar
Maximum Maximum Maximum Footing Minimum Spacing
Bar Diam Bar Diam Bar Diam Bars Bar Spacing Increment
(in) (in) (in) (in) (in)
1.00 1.00 1.41 N 6.00 3.00
LOAD CONTROL
Ductility Redundancy Importance Temp Final Temp Final
Factor Factor Factor LS LS ES ES
(ft) (ft) (ft) (ft)
1.00 1.00 1.00 2.00 2.00 0.00 0.00
LOADS ON ABUTMENTS
Backwall
Vertical Horizontal Vert Horiz
DC DW PL WSUP WSUP WL TU LL LL
(kip) (kip) (kip) (kip) (kip) (kip) (kip) (kip) (kip)
11.40 1.00 none 0.00 0.39 0.21 0.37 0.00 none
Horizontal
WSUB FR
(kip) (kip)
0.0 0.00
DESIGN LIVE LOAD
Downward Upward
LL LL BR CE
(kip) (kip) (kip) (kip)
3.50 0.00 0.16 0.00

Chapter 8 Example Problems
8-7
OUTPUT OF INPUT DATA
Input
File Input Input
Echo Commands Summary
1 0 1
OUTPUT OF RESULTS
Footing
Footing Output Factored Footing Control Reinf Footing
Geometry Legend Forces Stability Forces Summary Flexure
1 1 1 1 1 1 1
Crack Shear Development
Control Results Length
1 1 1
OUTPUT OF INTERMEDIATE DATA
Internal Intermediate Detailed
Unfactored Load Moment/Axial Footing Bearing Resist Stem Cutoff
Loads Factors Interaction Forces Values Load Values
1 1 1 1 0 0
Minimum Reinf
Check
0

Chapter 8 Example Problems
8-8
8.3 EXAMPLE 2 (DESIGN)
Example 2 is an abutment without backwall on a spread footing. The structure geometry is shown in the following
figure. Earthquake loads are not considered in this problem.
live load
surcharge2.0 ft
9"
18"
1 4.85'
10.00' 1211.80'
2.00' (min)
8.00' min
10.00' max
1.00'
min
1.00'
min
Figure 8.3-1 Example 2 Abutment Geometry

Chapter 8 Example Problems
8-9
CONFIGURATION
Lines Blank
per Lines
Page on Top
83 0
CONTROL
Sys of Type Footing
Units of Run Datum
US D T
ABUTMENT WITHOUT BACKWALL
Front Face Front Face Back Face Back Face
Top Bearing Horizontal Vertical Horizontal Vertical
Height Width Location Component Component Component Component
(ft) (in) (in)
10.00 18.0 9.0 none none 1.00 12.00
Front Back Type Architectural
Additional Water Water of Treatment
Fill Height Level Level Wall Thickness
(ft) (ft) (ft) (in)
1.80 none 4.85 C 0.0
FOOTING
Min Min Min Min Max Max Max Max
Footing Toe Heel Footing Footing Toe Heel Footing
Thick Proj Proj Width Thick Proj Proj Width
(ft) (ft) (ft) (ft) (ft) (ft) (ft) (ft)
2.00 1.00 1.00 8.00 2.50 none none 10.00
Footing Footing Stem
Thick Width Shift
Increment Increment Increment
(in) (in) (in)
2.00 3.00 1.00
SPREAD
Ground Ground Ground
Cost of Cost of Cost of Cut or Ground Slope Slope Slope Design
Concrete Fill Cut Fill Elev Type Vert Horiz Optim
($/yd^3) ($/yd^3) ($/yd^3) (ft)
400.00 150.00 none F none none none none C
MATERIALS
Backwall Stem Footing Reinforcement Epoxy Coated
f'c f'c f'c fy Backwall Stem Footing
(ksi) (ksi) (ksi) (ksi)
NA 3.000 3.000 50.000 NA N N
Backfill Backfill Backfill Minimum
Friction Dry Saturated Equivalent Concrete Density
Angle Density Density Fluid Press For DL For Ec
(deg) (lb/ft^3) (lb/ft^3) (lb/ft^3) (lb/ft^3) (lb/ft^3)
33.25 120.0 135.0 35.0 150.0 145.0
Architectural
Treatment
Density fu
(lb/ft^3) (ksi)
150.0 65.000

Chapter 8 Example Problems
8-10
SOIL
Stem Top Footing Footing Soil Bearing Cap Sliding
to Soil Length Near Level Allow Resistance Resist
Layer (Parallel) Slope Over Toe Settle Factor Factor
(ft) (ft) (ft) (in)
12.00 30.00 Y 0.00 1.00 0.50 1.00
Soil Soil Undrained Mass Unit Saturated
Layer Layer Shear Weight/ Unit Weight/
Number Thick Strength Cohesion Density Density
(ft) (ksf) (ksf) (lb/ft^3) (lb/ft^3)
1 7.50 0.00 1.50 120.00 135.00
Soil Effective Apply
Layer Friction Elastic Poissons Inclination
Number Angle Modulus Ratio Ncq N Gamma q Factors
(deg) (ksf)
1 30.00 500.00 0.25 4.00 40.00 Y
Precast or
Cast-in-
Place
C
CONSOLIDATION SETTLEMENT
Max Past Max Past
Second Init Effect Effect
Layer Void Compr Recomp Comp Effect Stress Prim Serv Stress
Number Ratio Index Index Index Stress Top Consol Life Bottom
(ksi) (ksi) (year) (year) (ksi)
1 0.80 0.10 0.02 0.002 0.01 0.02 1.0 10.0 0.01
MISCELLANEOUS REINFORCEMENT DATA
Aggregate Development Backwall Stem Footing
Size Correction Exposure Exposure Exposure
(in) Class Class Class
1.00 1.00 none 2 1
REINFORCEMENT COVER
Backwall Stem Footing Footing Footing Footing
Back Back Top Top Bottom Bottom Toe Heel
Vertical Vertical Perpend Parallel Perpend Parallel End End
(in) (in) (in) (in) (in) (in) (in) (in)
none 3.0 2.8 3.8 3.8 4.8 2.0 2.0
BAR SPACING FOR DESIGN
Backwall Stem Footing Hooked User Requested Bar
Maximum Maximum Maximum Footing Minimum Spacing
Bar Diam Bar Diam Bar Diam Bars Bar Spacing Increment
(in) (in) (in) (in) (in)
none 1.00 1.41 N 6.00 3.00
LOAD CONTROL
Ductility Redundancy Importance Temp Final Temp Final
Factor Factor Factor LS LS ES ES
(ft) (ft) (ft) (ft)
1.00 1.00 1.00 2.00 2.00 0.00 0.00
LOADS ON ABUTMENTS
Backwall
Vertical Horizontal Vert Horiz
DC DW PL WSUP WSUP WL TU LL LL
(kip) (kip) (kip) (kip) (kip) (kip) (kip) (kip) (kip)
4.84 0.54 none -0.17 0.12 0.10 0.79 none none
Horizontal

Chapter 8 Example Problems
8-11
WSUB FR
(kip) (kip)
0.0 0.00
DESIGN LIVE LOAD
Downward Upward
LL LL BR CE
(kip) (kip) (kip) (kip)
3.44 0.00 0.13 0.00
OUTPUT OF INPUT DATA
Input
File Input Input
Echo Commands Summary
1 0 1
OUTPUT OF RESULTS
Footing
Footing Output Factored Footing Control Reinf Footing
Geometry Legend Forces Stability Forces Summary Flexure
1 1 1 1 1 1 1
Crack Shear Development
Control Results Length
1 1 1
OUTPUT OF INTERMEDIATE DATA
Internal Intermediate Detailed
Unfactored Load Moment/Axial Footing Bearing Resist Stem Cutoff
Loads Factors Interaction Forces Values Load Values
1 1 1 1 0 0
Minimum Reinf
Check
0

Chapter 8 Example Problems
8-12
8.4 EXAMPLE 3
Example 3 is a cantilever retaining wall on pile footing. The structure geometry is shown in the following figure.
This is an analysis problem for a retaining wall. Earthquake is not considered for this problem.
6.0'
6.0'
10.0'
row 1
1.5' 7.0' 1.5'
3.0'
14.0'11.25'
4.92' 1.75'2.25'
12.0'
1.0'
0.05 k
1
2
1
12
2.0'
live load
surcharge
2.83'
Rebar Layout:
Stem: #6 @ 9" for entire height
Footing Parallel Direction: top and bottom: #6 @ 12"
Footing Perpendicular Direction: top and bottom: #5 @ 9"
8"
row 2
14.25'
Figure 8.4-1 Example 3 Wall Geometry

Chapter 8 Example Problems
8-13
CONFIGURATION
Lines Blank
per Lines
Page on Top
83 0
CONTROL
Sys of Type Footing
Units of Run Datum
US A T
RETAINING WALL
Front Face Front Face Back Face Back Face
Top Horizontal Vertical Horizontal Vertical
Height Width Component Component Component Component
(ft) (in)
13.00 21.0 none none 1.00 12.00
Exposed Backfill Backfill Backfill Front Back Type Architectural
Stem Horizontal Vertical Slope Water Water of Treatment
Height Component Component Height Level Level Wall Thickness
(in) (ft) (ft) (ft) (in)
12.0 2.00 1.00 2.00 14.25 11.25 C 0.0
FOOTING
Min Min Min Min Max Max Max Max
Footing Toe Heel Footing Footing Toe Heel Footing
Thick Proj Proj Width Thick Proj Proj Width
(ft) (ft) (ft) (ft) (ft) (ft) (ft) (ft)
3.00 2.25 4.92 none none none none none
Footing Footing Stem
Thick Width Shift
Increment Increment Increment
(in) (in) (in)
2.00 3.00 1.00
PILE
Pile Pile Service Strength Service Strength
Dim Dim Pile Axial Axial Lateral Lateral Allowed
A B Embedment Capacity Capacity Capacity Capacity Uplift
(in) (in) (in) (kip) (kip) (kip) (kip) (kip)
12.0 0.0 12.0 N/A 280.80 N/A 0.00 0.00
PILE/CAISSON LAYOUT ANALYSIS
Spacing
Row Row within Percent Horizontal Vertical
Number Distance a Row Battered Component Component
(ft) (ft) (%)
1 1.50 6.00 100.0 3.00 12.00
2 7.00 10.00 0.0 none none
MATERIALS
Backwall Stem Footing Reinforcement Epoxy Coated
f'c f'c f'c fy Backwall Stem Footing
(ksi) (ksi) (ksi) (ksi)
NA 3.000 3.000 60.000 NA N N
Backfill Backfill Backfill Minimum
Friction Dry Saturated Equivalent Concrete Density
Angle Density Density Fluid Press For DL For Ec
(deg) (lb/ft^3) (lb/ft^3) (lb/ft^3) (lb/ft^3) (lb/ft^3)
33.25 120.0 135.0 35.0 150.0 145.0

Chapter 8 Example Problems
8-14
Architectural
Treatment
Density fu
(lb/ft^3) (ksi)
150.0 90.000
MISCELLANEOUS REINFORCEMENT DATA
Aggregate Development Backwall Stem Footing
Size Correction Exposure Exposure Exposure
(in) Class Class Class
1.00 1.00 none 2 1
REINFORCEMENT COVER
Backwall Stem Footing Footing Footing Footing
Back Back Top Top Bottom Bottom Toe Heel
Vertical Vertical Perpend Parallel Perpend Parallel End End
(in) (in) (in) (in) (in) (in) (in) (in)
none 3.2 3.2 4.2 3.2 4.2 2.0 2.0
BAR SIZE
Backwall Footing Footing Footing Footing Footing Footing
Back Perpend Parallel Perpend Parallel Perp Top Perp Bot
Vertical Top Top Bottom Bottom Bar Type Bar Type
(US bar) (US bar) (US bar) (US bar) (US bar)
none 5 6 5 6 Straight Straight
BAR SPACING FOR ANALYSIS
Backwall Footing Footing Footing Footing
Back Top Top Bottom Bottom
Vertical Perpend Parallel Perpend Parallel
(in) (in) (in) (in) (in)
none 9.0 12.0 9.0 12.0
STEM REINFORCING BARS
Range Bar Bar Group End
Number Size Spacing Offset Location
(US bar) (in) (in) (ft)
1 6 9.00 0.00 13.00
LOAD CONTROL
Ductility Redundancy Importance Temp Final Temp Final
Factor Factor Factor LS LS ES ES
(ft) (ft) (ft) (ft)
1.00 1.00 1.00 2.00 2.00 0.00 0.00
LOADS ON RETAINING WALLS
Y Distance Parapet X Distance Noise Wall X Distance
CT to CT Dead Load to Parapet Dead Load to Noise Wall
(kip) (in) (kip) (in) (kip) (in)
none none 0.05 8.0 0.00 0.0
Wind on External Y Distance to Wind
Structure on External Structure
(kip) (in)
0.00 0.0
OUTPUT OF INPUT DATA
Input
File Input Input
Echo Commands Summary
1 0 1

Chapter 8 Example Problems
8-15
OUTPUT OF RESULTS
Footing
Footing Output Factored Footing Control Reinf Footing
Geometry Legend Forces Stability Forces Summary Flexure
1 1 1 1 1 1 1
Crack Shear Development
Control Results Length
1 1 1
OUTPUT OF INTERMEDIATE DATA
Internal Intermediate Detailed
Unfactored Load Moment/Axial Footing Bearing Resist Stem Cutoff
Loads Factors Interaction Forces Values Load Values
1 1 1 1 0 0
Minimum Reinf
Check
1

Chapter 8 Example Problems
8-16
8.5 EXAMPLE 4
Example 4 is an analysis problem for an abutment w/o backwall on pedestal footing. The structure geometry is
shown in the following figure. The abutment is to be analyzed. Earthquake was not considered for this problem.
There is an assumed 30’ approach slab resting on a beam notch. This Analysis run will consider the approach
slab to act as a simple span per standard drawing BD-628M, Sheet 2, Note 14. A second run of the program
applying the Final Stage Surcharge Loads is needed to satisfy Note 14.
1.0'
2.0'
8.50'
1.50'
1.0'
18"
1
9.67'
11.06'
1.75'
7.57'
12
2.0'
temp stage
live load
surcharge
3.12'
Rebar Layout:
Stem: #6 @ 12" for entire height
Footing Parallel Direction: top and bottom: #5 @ 9"
1.0' 2.13'
Approach Slab
Figure 8.5-1 Example 4 Abutment and Pedestal Geometry

Chapter 8 Example Problems
8-17
CONFIGURATION
Lines Blank
per Lines
Page on Top
83 0
CONTROL
Sys of Type Footing
Units of Run Datum
US A T
ABUTMENT WITHOUT BACKWALL
Front Face Front Face Back Face Back Face
Top Bearing Horizontal Vertical Horizontal Vertical
Height Width Location Component Component Component Component
(ft) (in) (in)
7.57 18.0 9.0 none none 1.00 12.00
Front Back Type Architectural
Additional Water Water of Treatment
Fill Height Level Level Wall Thickness
(ft) (ft) (ft) (in)
3.49 none none C 0.0
FOOTING
Min Min Min Min Max Max Max Max
Footing Toe Heel Footing Footing Toe Heel Footing
Thick Proj Proj Width Thick Proj Proj Width
(ft) (ft) (ft) (ft) (ft) (ft) (ft) (ft)
2.00 1.75 3.12 none none none none none
Footing Footing Stem
Thick Width Shift
Increment Increment Increment
(in) (in) (in)
2.00 3.00 1.00
PEDESTAL FOOTING
Pedestal Overall Front Min Min Front Back Max Max
Spacing Height Height Width Thick Proj Offset Width Thick
(ft) (ft) (ft) (ft) (in) (ft) (ft) (ft) (in)
9.67 8.50 1.50 9.67 30.00 1.00 1.00 none none
MATERIALS
Backwall Stem Footing Reinforcement Epoxy Coated
f'c f'c f'c fy Backwall Stem Footing
(ksi) (ksi) (ksi) (ksi)
NA 3.000 3.000 50.000 NA N N
Backfill Backfill Backfill Minimum
Friction Dry Saturated Equivalent Concrete Density
Angle Density Density Fluid Press For DL For Ec
(deg) (lb/ft^3) (lb/ft^3) (lb/ft^3) (lb/ft^3) (lb/ft^3)
33.25 120.0 135.0 35.0 150.0 145.0
Architectural
Treatment
Density fu
(lb/ft^3) (ksi)
150.0 65.000
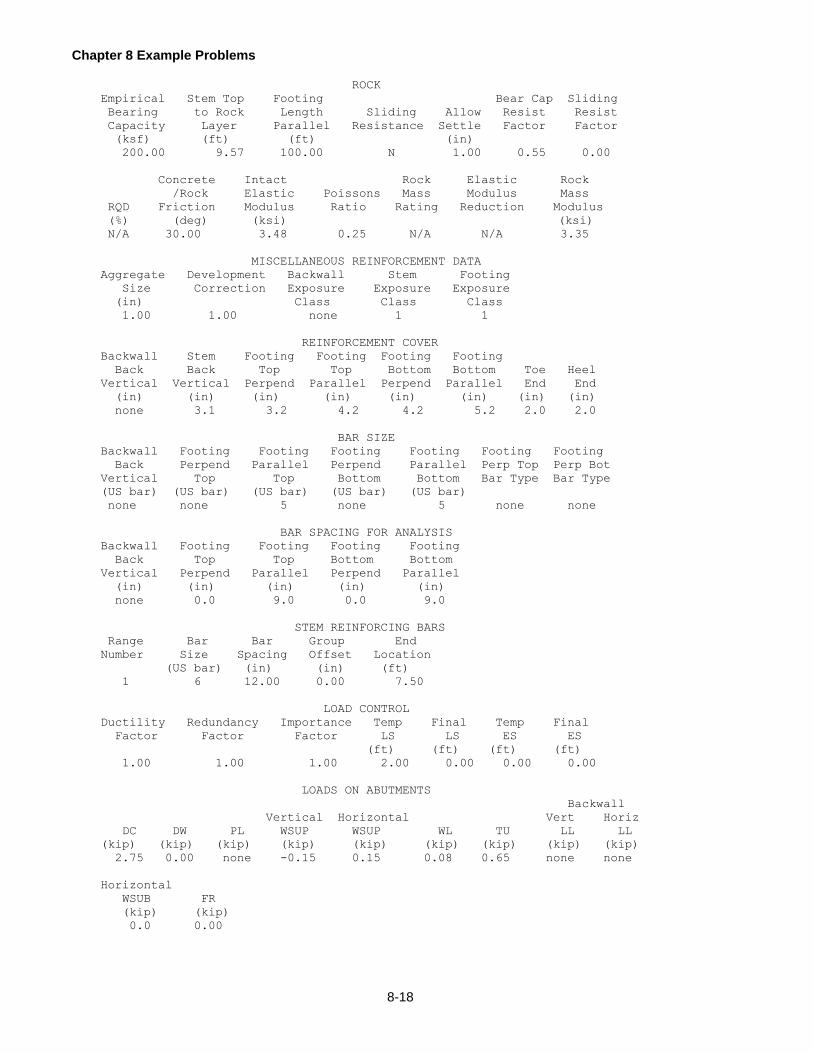
Chapter 8 Example Problems
8-18
ROCK
Empirical Stem Top Footing Bear Cap Sliding
Bearing to Rock Length Sliding Allow Resist Resist
Capacity Layer Parallel Resistance Settle Factor Factor
(ksf) (ft) (ft) (in)
200.00 9.57 100.00 N 1.00 0.55 0.00
Concrete Intact Rock Elastic Rock
/Rock Elastic Poissons Mass Modulus Mass
RQD Friction Modulus Ratio Rating Reduction Modulus
(%) (deg) (ksi) (ksi)
N/A 30.00 3.48 0.25 N/A N/A 3.35
MISCELLANEOUS REINFORCEMENT DATA
Aggregate Development Backwall Stem Footing
Size Correction Exposure Exposure Exposure
(in) Class Class Class
1.00 1.00 none 1 1
REINFORCEMENT COVER
Backwall Stem Footing Footing Footing Footing
Back Back Top Top Bottom Bottom Toe Heel
Vertical Vertical Perpend Parallel Perpend Parallel End End
(in) (in) (in) (in) (in) (in) (in) (in)
none 3.1 3.2 4.2 4.2 5.2 2.0 2.0
BAR SIZE
Backwall Footing Footing Footing Footing Footing Footing
Back Perpend Parallel Perpend Parallel Perp Top Perp Bot
Vertical Top Top Bottom Bottom Bar Type Bar Type
(US bar) (US bar) (US bar) (US bar) (US bar)
none none 5 none 5 none none
BAR SPACING FOR ANALYSIS
Backwall Footing Footing Footing Footing
Back Top Top Bottom Bottom
Vertical Perpend Parallel Perpend Parallel
(in) (in) (in) (in) (in)
none 0.0 9.0 0.0 9.0
STEM REINFORCING BARS
Range Bar Bar Group End
Number Size Spacing Offset Location
(US bar) (in) (in) (ft)
1 6 12.00 0.00 7.50
LOAD CONTROL
Ductility Redundancy Importance Temp Final Temp Final
Factor Factor Factor LS LS ES ES
(ft) (ft) (ft) (ft)
1.00 1.00 1.00 2.00 0.00 0.00 0.00
LOADS ON ABUTMENTS
Backwall
Vertical Horizontal Vert Horiz
DC DW PL WSUP WSUP WL TU LL LL
(kip) (kip) (kip) (kip) (kip) (kip) (kip) (kip) (kip)
2.75 0.00 none -0.15 0.15 0.08 0.65 none none
Horizontal
WSUB FR
(kip) (kip)
0.0 0.00
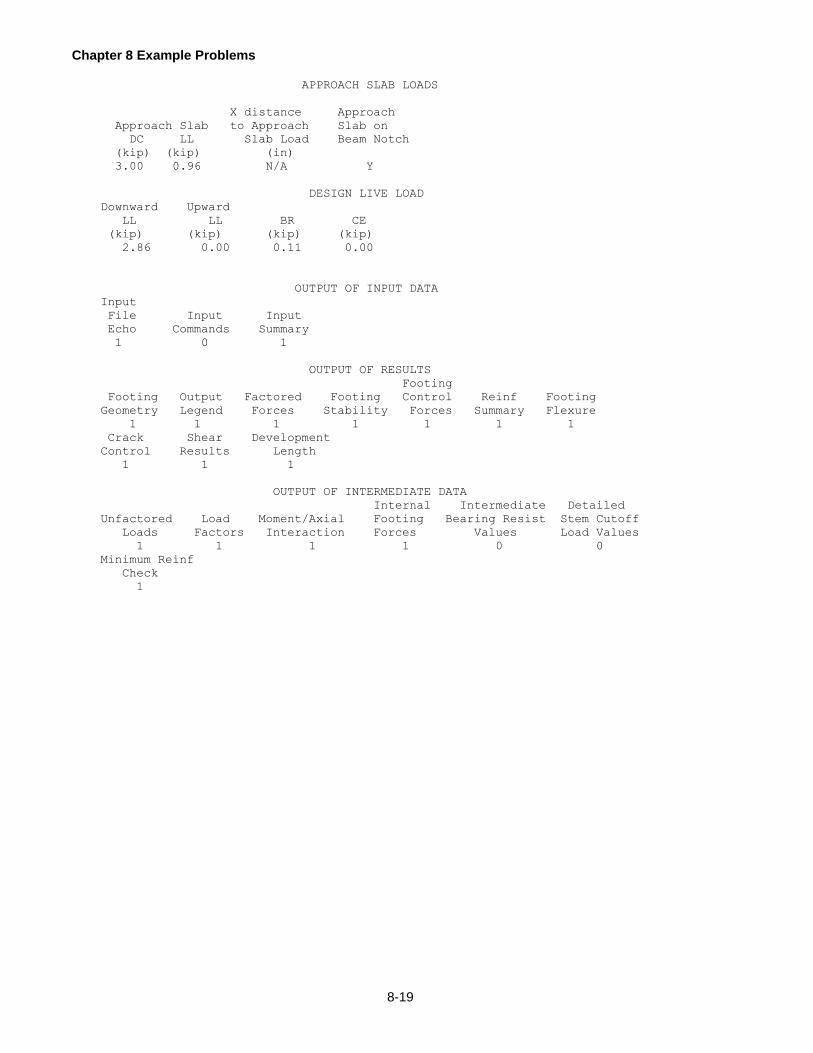
Chapter 8 Example Problems
8-19
APPROACH SLAB LOADS
X distance Approach
Approach Slab to Approach Slab on
DC LL Slab Load Beam Notch
(kip) (kip) (in)
3.00 0.96 N/A Y
DESIGN LIVE LOAD
Downward Upward
LL LL BR CE
(kip) (kip) (kip) (kip)
2.86 0.00 0.11 0.00
OUTPUT OF INPUT DATA
Input
File Input Input
Echo Commands Summary
1 0 1
OUTPUT OF RESULTS
Footing
Footing Output Factored Footing Control Reinf Footing
Geometry Legend Forces Stability Forces Summary Flexure
1 1 1 1 1 1 1
Crack Shear Development
Control Results Length
1 1 1
OUTPUT OF INTERMEDIATE DATA
Internal Intermediate Detailed
Unfactored Load Moment/Axial Footing Bearing Resist Stem Cutoff
Loads Factors Interaction Forces Values Load Values
1 1 1 1 0 0
Minimum Reinf
Check
1

Chapter 8 Example Problems
8-20
8.6 EXAMPLE 5 (DESIGN)
In previous versions of ABLRFD, Example 5 was the metric version of Example 1. Since SI units are no longer
available, Example 5 was eliminated.

Chapter 8 Example Problems
8-21
8.7 EXAMPLE 6 (DESIGN)
Example 6 is a type II abutment on a spread footing. The structure geometry is shown in the following figure.
Earthquake loads are considered in this problem.
24"8"
24"16"
4"
4"
13.0'48"
48"83"
10'
4"
24"
32"
40"
34.5'
1
1.5
12
12
1.5' Min.
Max. = 3.0'
Min. = 2.25'
Min. = 20.0', Max. = 25.0'
1.5' Min.
Figure 8.7-1 Example 6 Abutment Geometry

Chapter 8 Example Problems
8-22
CONFIGURATION
Lines Blank
per Lines
Page on Top
83 0
CONTROL
Sys of Type Footing
Units of Run Datum
US D B
ABUTMENT TYPE II
Seat Seat Corbel Paving Paving
Top Seat Slope Face Corbel Corbel Slope Notch Notch
Height Width Width Height Height Width Height Height Width Height
(ft) (in) (in) (in) (in) (in) (in) (in) (in) (in)
34.50 24.0 48.0 4.0 48.0 4.0 24.0 4.0 8.0 16.0
Stem Stem Front Face Front Face Back Face Back Face
Backwall Notch Notch Horizontal Vertical Horizontal Vertical
Height Width Height Component Component Component Component
(in) (in) (in)
83.0 32.0 40.0 1.00 12.00 1.50 12.00
Front Back Architectural Backwall/
Bearing Bearing Water Water Treatment Stem Bar
X Locn Y Locn Level Level Thickness Alignment
(in) (in) (ft) (ft) (in)
24.0 none 13.00 10.00 0.0 Y
FOOTING
Min Min Min Min Max Max Max Max
Footing Toe Heel Footing Footing Toe Heel Footing
Thick Proj Proj Width Thick Proj Proj Width
(ft) (ft) (ft) (ft) (ft) (ft) (ft) (ft)
2.25 1.50 1.50 20.00 3.00 none none 25.00
Footing Footing Stem
Thick Width Shift
Increment Increment Increment
(in) (in) (in)
2.00 3.00 1.00
SPREAD
Ground Ground Ground
Cost of Cost of Cost of Cut or Ground Slope Slope Slope Design
Concrete Fill Cut Fill Elev Type Vert Horiz Optim
($/yd^3) ($/yd^3) ($/yd^3) (ft)
18.73 8.56 1.02 C 8.25 H 2.0 12.0 C
MATERIALS
Backwall Stem Footing Reinforcement Epoxy Coated
f'c f'c f'c fy Backwall Stem Footing
(ksi) (ksi) (ksi) (ksi)
4.000 4.000 3.500 50.000 Y Y Y
Backfill Backfill Backfill Minimum
Friction Dry Saturated Equivalent Concrete Density
Angle Density Density Fluid Press For DL For Ec
(deg) (lb/ft^3) (lb/ft^3) (lb/ft^3) (lb/ft^3) (lb/ft^3)
33.25 120.0 135.0 35.0 150.0 145.0

Chapter 8 Example Problems
8-23
Architectural
Treatment
Density fu
(lb/ft^3) (ksi)
150.0 65.000
ROCK
Empirical Stem Top Footing Bear Cap Sliding
Bearing to Rock Length Sliding Allow Resist Resist
Capacity Layer Parallel Resistance Settle Factor Factor
(ksf) (ft) (ft) (in)
20.88 34.25 82.00 Y 1.00 0.55 0.90
Concrete Intact Rock Elastic Rock
/Rock Elastic Poissons Mass Modulus Mass
RQD Friction Modulus Ratio Rating Reduction Modulus
(%) (deg) (ksi) (ksi)
N/A 30.00 2900.00 0.25 N/A N/A 2000.00
MISCELLANEOUS REINFORCEMENT DATA
Aggregate Development Backwall Stem Footing
Size Correction Exposure Exposure Exposure
(in) Class Class Class
1.00 1.00 2 2 1
REINFORCEMENT COVER
Backwall Stem Footing Footing Footing Footing
Back Back Top Top Bottom Bottom Toe Heel
Vertical Vertical Perpend Parallel Perpend Parallel End End
(in) (in) (in) (in) (in) (in) (in) (in)
3.0 3.0 3.0 0.0 4.0 0.0 2.0 2.0
BAR SPACING FOR DESIGN
Backwall Stem Footing Hooked User Requested Bar
Maximum Maximum Maximum Footing Minimum Spacing
Bar Diam Bar Diam Bar Diam Bars Bar Spacing Increment
(in) (in) (in) (in) (in)
1.41 1.41 1.41 N 6.00 3.00
LOAD CONTROL
Ductility Redundancy Importance Temp Final Temp Final
Factor Factor Factor LS LS ES ES
(ft) (ft) (ft) (ft)
0.98 1.02 1.07 0.00 0.00 1.65 0.00
LOADS ON ABUTMENTS
Backwall
Vertical Horizontal Vert Horiz
DC DW PL WSUP WSUP WL TU LL LL
(kip) (kip) (kip) (kip) (kip) (kip) (kip) (kip) (kip)
0.85 0.40 0.02 -0.05 0.03 0.01 0.03 0.23 none
Horizontal
WSUB FR
(kip) (kip)
0.0 0.00
SPECIAL LIVE LOAD
Downwrd Upwrd STR 1 STR 1P STR 2 STR 3 STR 5 EXT 1 SER 1
LL LL BR CE Factor Factor Factor Factor Factor Factor Factor
(kip) (kip) (kip) (kip)
0.31 -0.17 0.08 0.09 1.75 1.35 1.35 0.00 1.35 0.50 1.00

Chapter 8 Example Problems
8-24
EARTHQUAKE LOADS
Soil Super- External
Response Pressure Vertical Eq Bearing Cap structure Structure
Modification Factor Soil Pressure Phi Factor Force Force
(kip) (kip)
2.30 1.00 N 0.70 1.82 none
OUTPUT OF INPUT DATA
Input
File Input Input
Echo Commands Summary
1 0 1
OUTPUT OF RESULTS
Footing
Footing Output Factored Footing Control Reinf Footing
Geometry Legend Forces Stability Forces Summary Flexure
1 1 1 1 1 1 1
Crack Shear Development
Control Results Length
1 1 1
OUTPUT OF INTERMEDIATE DATA
Internal Intermediate Detailed
Unfactored Load Moment/Axial Footing Bearing Resist Stem Cutoff
Loads Factors Interaction Forces Values Load Values
1 1 1 1 0 0
Minimum Reinf
Check
0
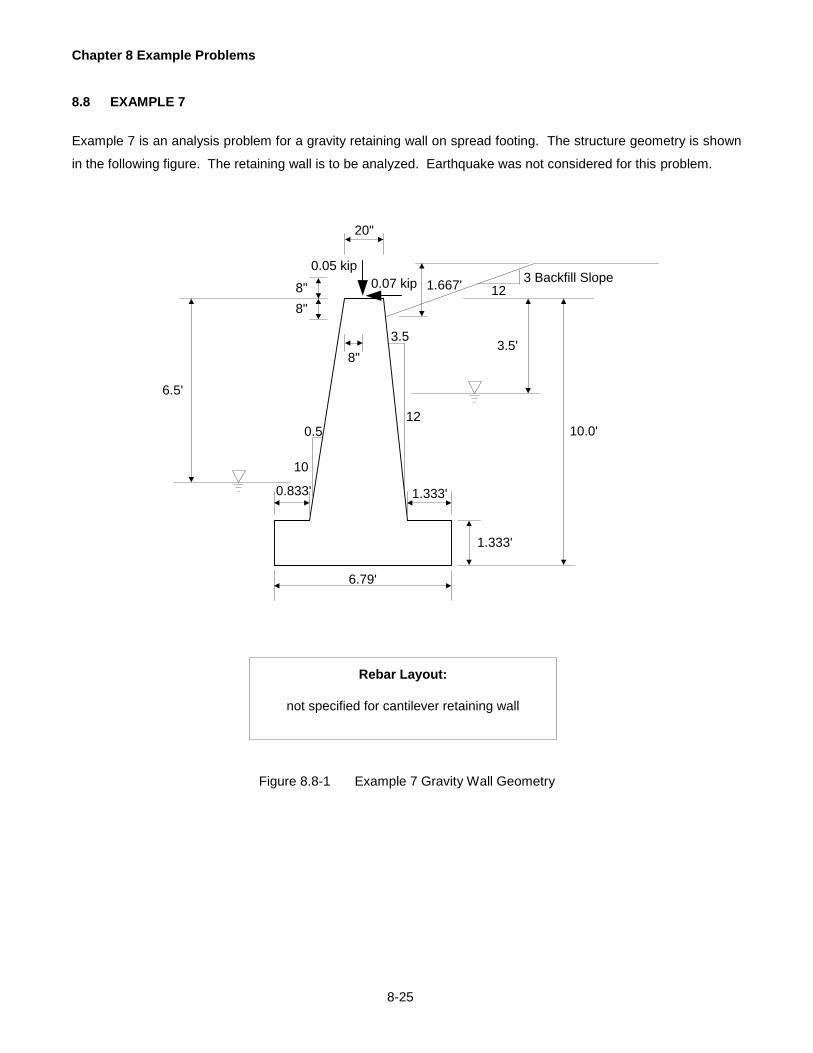
Chapter 8 Example Problems
8-25
8.8 EXAMPLE 7
Example 7 is an analysis problem for a gravity retaining wall on spread footing. The structure geometry is shown
in the following figure. The retaining wall is to be analyzed. Earthquake was not considered for this problem.
6.5'
0.5
10
0.833' 1.333'
6.79'
1.333'
10.0'
3.5'
12
3.5
1.667' 123 Backfill Slope
20"
8"
8"
8"
Rebar Layout:
not specified for cantilever retaining wall
0.07 kip
0.05 kip
Figure 8.8-1 Example 7 Gravity Wall Geometry

Chapter 8 Example Problems
8-26
CONFIGURATION
Lines Blank
per Lines
Page on Top
83 0
CONTROL
Sys of Type Footing
Units of Run Datum
US A T
RETAINING WALL
Front Face Front Face Back Face Back Face
Top Horizontal Vertical Horizontal Vertical
Height Width Component Component Component Component
(ft) (in)
8.67 20.0 0.50 10.00 3.50 12.00
Exposed Backfill Backfill Backfill Front Back Type Architectural
Stem Horizontal Vertical Slope Water Water of Treatment
Height Component Component Height Level Level Wall Thickness
(in) (ft) (ft) (ft) (in)
8.0 12.00 3.00 1.67 6.50 3.50 G 0.0
FOOTING
Min Min Min Min Max Max Max Max
Footing Toe Heel Footing Footing Toe Heel Footing
Thick Proj Proj Width Thick Proj Proj Width
(ft) (ft) (ft) (ft) (ft) (ft) (ft) (ft)
1.33 0.83 1.33 none none none none none
Footing Footing Stem
Thick Width Shift
Increment Increment Increment
(in) (in) (in)
2.00 3.00 1.00
MATERIALS
Backwall Stem Footing Reinforcement Epoxy Coated
f'c f'c f'c fy Backwall Stem Footing
(ksi) (ksi) (ksi) (ksi)
NA 4.000 3.000 60.000 NA NA NA
Backfill Backfill Backfill Minimum
Friction Dry Saturated Equivalent Concrete Density
Angle Density Density Fluid Press For DL For Ec
(deg) (lb/ft^3) (lb/ft^3) (lb/ft^3) (lb/ft^3) (lb/ft^3)
33.25 120.0 135.0 35.0 150.0 145.0
Architectural
Treatment
Density fu
(lb/ft^3) (ksi)
150.0 90.000

Chapter 8 Example Problems
8-27
SOIL
Stem Top Footing Footing Soil Bearing Cap Sliding
to Soil Length Near Level Allow Resistance Resist
Layer (Parallel) Slope Over Toe Settle Factor Factor
(ft) (ft) (ft) (in)
10.00 65.50 N 1.00 1.00 0.50 1.00
Soil Soil Undrained Mass Unit Saturated
Layer Layer Shear Weight/ Unit Weight/
Number Thick Strength Cohesion Density Density
(ft) (ksf) (ksf) (lb/ft^3) (lb/ft^3)
1 40.00 0.00 1.00 120.00 150.00
Soil Effective Apply
Layer Friction Elastic Poissons Inclination
Number Angle Modulus Ratio Ncq N Gamma q Factors
(deg) (ksf)
1 30.00 315.00 0.50 none none Y
Precast or
Cast-in-
Place
C
CONSOLIDATION SETTLEMENT
Max Past Max Past
Second Init Effect Effect
Layer Void Compr Recomp Comp Effect Stress Prim Serv Stress
Number Ratio Index Index Index Stress Top Consol Life Bottom
(ksi) (ksi) (year) (year) (ksi)
1 0.50 0.25 0.06 0.002 0.01 0.01 1.0 5.0 0.01
LOAD CONTROL
Ductility Redundancy Importance Temp Final Temp Final
Factor Factor Factor LS LS ES ES
(ft) (ft) (ft) (ft)
1.00 1.00 1.00 0.00 0.00 0.00 0.00
LOADS ON RETAINING WALLS
Y Distance Parapet X Distance Noise Wall X Distance
CT to CT Dead Load to Parapet Dead Load to Noise Wall
(kip) (in) (kip) (in) (kip) (in)
0.07 8.0 0.05 8.0 0.00 0.0
Wind on External Y Distance to Wind
Structure on External Structure
(kip) (in)
0.00 0.0
OUTPUT OF INPUT DATA
Input
File Input Input
Echo Commands Summary
1 0 1
OUTPUT OF RESULTS
Footing
Footing Output Factored Footing Control Reinf Footing
Geometry Legend Forces Stability Forces Summary Flexure
1 1 1 1 1 1 1
Crack Shear Development
Control Results Length
1 1 1

Chapter 8 Example Problems
8-28
OUTPUT OF INTERMEDIATE DATA
Internal Intermediate Detailed
Unfactored Load Moment/Axial Footing Bearing Resist Stem Cutoff
Loads Factors Interaction Forces Values Load Values
1 1 1 1 0 0
Minimum Reinf
Check
1

Chapter 8 Example Problems
8-29
8.9 EXAMPLE 8
Example 8 is a type II abutment on pile footing. The structure geometry is shown in the following figure. The
abutment is to be analyzed. The earthquake consideration was neglected for this example. There is an assumed
25’ approach slab resting in the paving notch of the backwall. This Analysis run will consider the approach slab to
act as a simple span per standard drawing BD-628M, Sheet 2, Note 14. A second run of the program applying the
Final Stage Surcharge Loads is needed to satisfy Note 14.
2.75' 5.19'
2.5'
row 1 row 2 row 3 row 4
1.5' 3.0' 3.0' 3.0' 1.5'
13.0'
12'
12
2.5
12
0.516.5'
10'
36"
2"
10" 12"39"
7'49"
16"
9"16"
20"
22"
4"4"
Rebar Layout:
Stem: #9 @ 9" for entire height
Footing Parallel Direction: top and bottom: #6 @ 9"
Footing Perpendicular Direction: top and bottom: #6 @ 9"
Approach
Slab
Figure 8.9-1 Example 8 Abutment and Footing Geometry

Chapter 8 Example Problems
8-30
CONFIGURATION
Lines Blank
per Lines
Page on Top
83 0
CONTROL
Sys of Type Footing
Units of Run Datum
US A T
ABUTMENT TYPE II
Seat Seat Corbel Paving Paving
Top Seat Slope Face Corbel Corbel Slope Notch Notch
Height Width Width Height Height Width Height Height Width Height
(ft) (in) (in) (in) (in) (in) (in) (in) (in) (in)
14.00 16.0 22.0 2.0 36.0 4.0 20.0 4.0 9.0 16.0
Stem Stem Front Face Front Face Back Face Back Face
Backwall Notch Notch Horizontal Vertical Horizontal Vertical
Height Width Height Component Component Component Component
(in) (in) (in)
49.0 12.0 39.0 0.50 12.00 2.50 12.00
Front Back Architectural Backwall/
Bearing Bearing Water Water Treatment Stem Bar
X Locn Y Locn Level Level Thickness Alignment
(in) (in) (ft) (ft) (in)
10.0 none 10.00 7.00 0.0 N/A
FOOTING
Min Min Min Min Max Max Max Max
Footing Toe Heel Footing Footing Toe Heel Footing
Thick Proj Proj Width Thick Proj Proj Width
(ft) (ft) (ft) (ft) (ft) (ft) (ft) (ft)
2.50 2.75 5.19 none none none none none
Footing Footing Stem
Thick Width Shift
Increment Increment Increment
(in) (in) (in)
2.00 3.00 1.00
PILE
Pile Pile Service Strength Service Strength
Dim Dim Pile Axial Axial Lateral Lateral Allowed
A B Embedment Capacity Capacity Capacity Capacity Uplift
(in) (in) (in) (kip) (kip) (kip) (kip) (kip)
10.0 0.0 12.0 N/A 180.00 N/A 0.00 0.00
PILE/CAISSON LAYOUT ANALYSIS
Spacing
Row Row within Percent Horizontal Vertical
Number Distance a Row Battered Component Component
(ft) (ft) (%)
1 1.50 6.50 100.0 3.00 10.00
2 3.00 6.50 100.0 3.00 10.00
3 3.00 13.00 0.0 none none
4 3.00 13.00 0.0 none none
MATERIALS
Backwall Stem Footing Reinforcement Epoxy Coated
f'c f'c f'c fy Backwall Stem Footing
(ksi) (ksi) (ksi) (ksi)
4.000 4.000 3.000 60.000 N N N
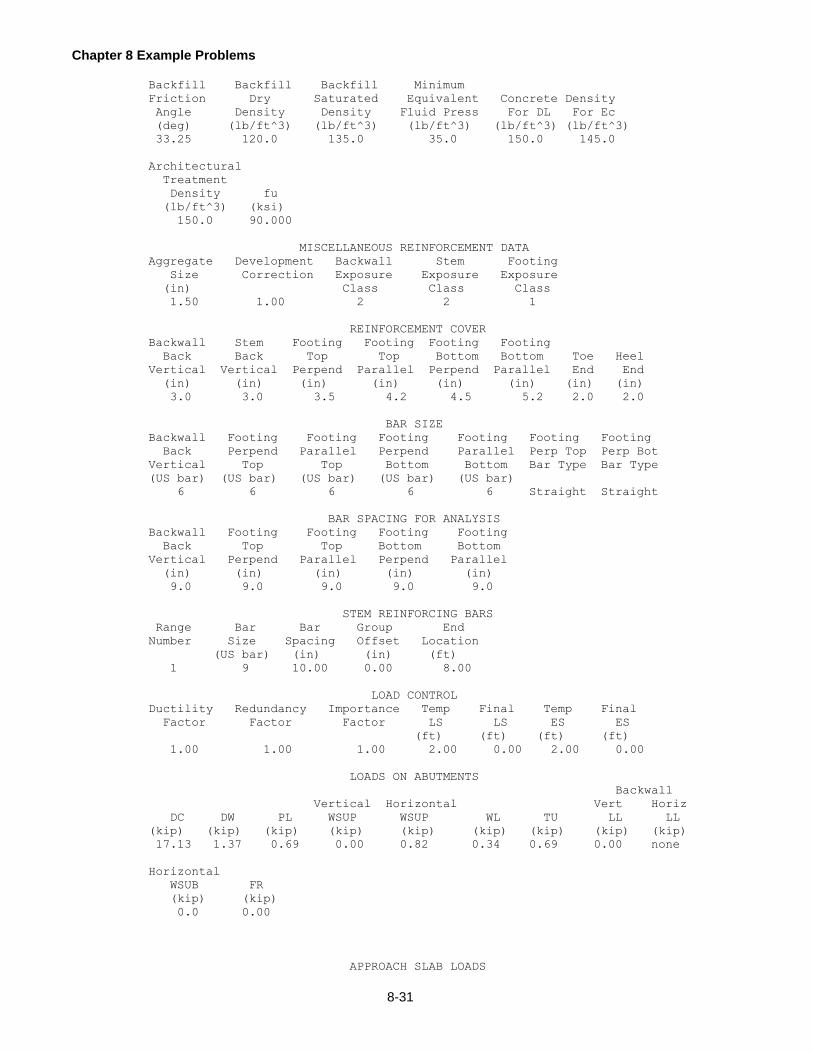
Chapter 8 Example Problems
8-31
Backfill Backfill Backfill Minimum
Friction Dry Saturated Equivalent Concrete Density
Angle Density Density Fluid Press For DL For Ec
(deg) (lb/ft^3) (lb/ft^3) (lb/ft^3) (lb/ft^3) (lb/ft^3)
33.25 120.0 135.0 35.0 150.0 145.0
Architectural
Treatment
Density fu
(lb/ft^3) (ksi)
150.0 90.000
MISCELLANEOUS REINFORCEMENT DATA
Aggregate Development Backwall Stem Footing
Size Correction Exposure Exposure Exposure
(in) Class Class Class
1.50 1.00 2 2 1
REINFORCEMENT COVER
Backwall Stem Footing Footing Footing Footing
Back Back Top Top Bottom Bottom Toe Heel
Vertical Vertical Perpend Parallel Perpend Parallel End End
(in) (in) (in) (in) (in) (in) (in) (in)
3.0 3.0 3.5 4.2 4.5 5.2 2.0 2.0
BAR SIZE
Backwall Footing Footing Footing Footing Footing Footing
Back Perpend Parallel Perpend Parallel Perp Top Perp Bot
Vertical Top Top Bottom Bottom Bar Type Bar Type
(US bar) (US bar) (US bar) (US bar) (US bar)
6 6 6 6 6 Straight Straight
BAR SPACING FOR ANALYSIS
Backwall Footing Footing Footing Footing
Back Top Top Bottom Bottom
Vertical Perpend Parallel Perpend Parallel
(in) (in) (in) (in) (in)
9.0 9.0 9.0 9.0 9.0
STEM REINFORCING BARS
Range Bar Bar Group End
Number Size Spacing Offset Location
(US bar) (in) (in) (ft)
1 9 10.00 0.00 8.00
LOAD CONTROL
Ductility Redundancy Importance Temp Final Temp Final
Factor Factor Factor LS LS ES ES
(ft) (ft) (ft) (ft)
1.00 1.00 1.00 2.00 0.00 2.00 0.00
LOADS ON ABUTMENTS
Backwall
Vertical Horizontal Vert Horiz
DC DW PL WSUP WSUP WL TU LL LL
(kip) (kip) (kip) (kip) (kip) (kip) (kip) (kip) (kip)
17.13 1.37 0.69 0.00 0.82 0.34 0.69 0.00 none
Horizontal
WSUB FR
(kip) (kip)
0.0 0.00
APPROACH SLAB LOADS

Chapter 8 Example Problems
8-32
X distance Approach
Approach Slab to Approach Slab on
DC LL Slab Load Beam Notch
(kip) (kip) (in)
2.50 0.80 38.50 N
DESIGN LIVE LOAD
Downward Upward
LL LL BR CE
(kip) (kip) (kip) (kip)
4.80 0.00 0.34 0.00
OUTPUT OF INPUT DATA
Input
File Input Input
Echo Commands Summary
1 0 1
OUTPUT OF RESULTS
Footing
Footing Output Factored Footing Control Reinf Footing
Geometry Legend Forces Stability Forces Summary Flexure
1 1 1 1 1 1 1
Crack Shear Development
Control Results Length
1 1 1
OUTPUT OF INTERMEDIATE DATA
Internal Intermediate Detailed
Unfactored Load Moment/Axial Footing Bearing Resist Stem Cutoff
Loads Factors Interaction Forces Values Load Values
1 1 1 1 0 0
Minimum Reinf
Check
1
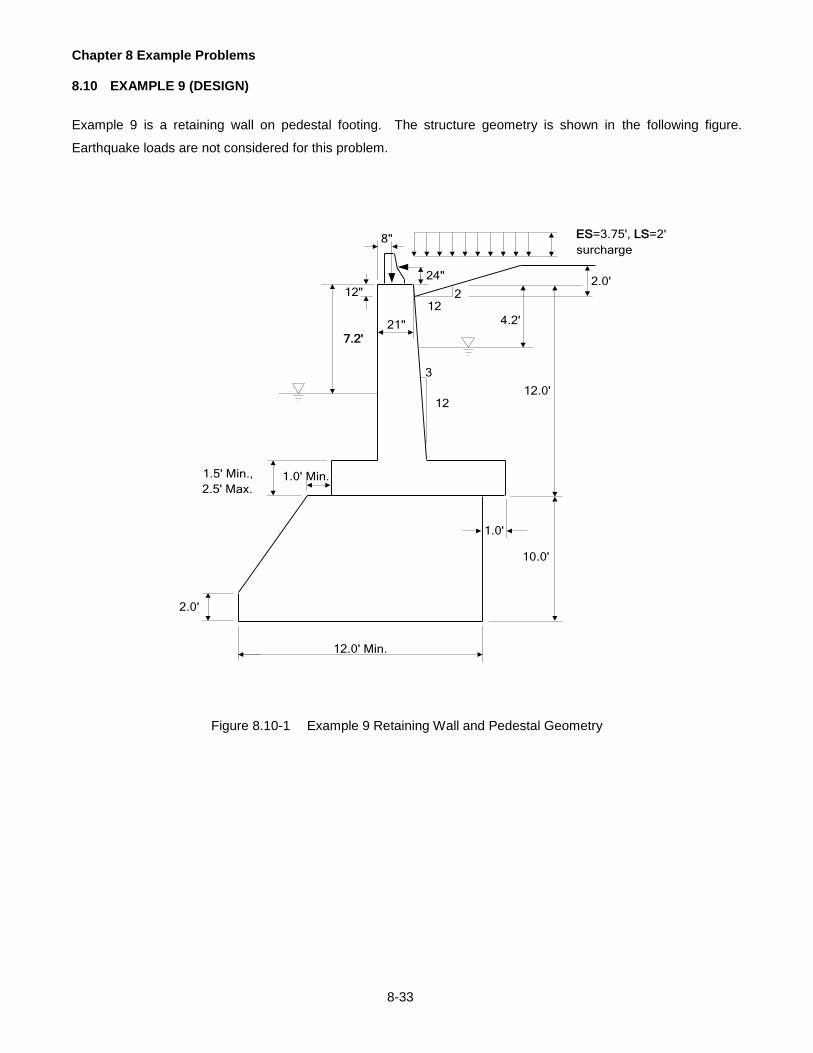
Chapter 8 Example Problems
8-33
8.10 EXAMPLE 9 (DESIGN)
Example 9 is a retaining wall on pedestal footing. The structure geometry is shown in the following figure.
Earthquake loads are not considered for this problem.
ES=3.75', LS=2'8"surcharge
2.0'
3
12.0'12
10.0'
12.0' Min.
12"
24"
2.0'
1.0' Min.
1.0'
122
21"
7.2'
4.2'
1.5' Min.,
2.5' Max.
Figure 8.10-1 Example 9 Retaining Wall and Pedestal Geometry

Chapter 8 Example Problems
8-34
CONFIGURATION
Lines Blank
per Lines
Page on Top
83 0
CONTROL
Sys of Type Footing
Units of Run Datum
US D B
RETAINING WALL
Front Face Front Face Back Face Back Face
Top Horizontal Vertical Horizontal Vertical
Height Width Component Component Component Component
(ft) (in)
12.00 21.0 none none 3.00 12.00
Exposed Backfill Backfill Backfill Front Back Type Architectural
Stem Horizontal Vertical Slope Water Water of Treatment
Height Component Component Height Level Level Wall Thickness
(in) (ft) (ft) (ft) (in)
12.0 12.00 2.00 2.00 7.20 4.20 C 0.0
FOOTING
Min Min Min Min Max Max Max Max
Footing Toe Heel Footing Footing Toe Heel Footing
Thick Proj Proj Width Thick Proj Proj Width
(ft) (ft) (ft) (ft) (ft) (ft) (ft) (ft)
1.50 0.00 0.00 10.00 2.50 none none 11.00
Footing Footing Stem
Thick Width Shift
Increment Increment Increment
(in) (in) (in)
2.00 3.00 1.00
PEDESTAL FOOTING
Pedestal Overall Front Min Min Front Back Max Max
Spacing Height Height Width Thick Proj Offset Width Thick
(ft) (ft) (ft) (ft) (in) (ft) (ft) (ft) (in)
10.00 10.00 2.00 12.00 30.00 1.00 1.00 none none
MATERIALS
Backwall Stem Footing Reinforcement Epoxy Coated
f'c f'c f'c fy Backwall Stem Footing
(ksi) (ksi) (ksi) (ksi)
NA 3.000 3.000 60.000 NA Y Y
Backfill Backfill Backfill Minimum
Friction Dry Saturated Equivalent Concrete Density
Angle Density Density Fluid Press For DL For Ec
(deg) (lb/ft^3) (lb/ft^3) (lb/ft^3) (lb/ft^3) (lb/ft^3)
33.25 120.0 135.0 35.0 150.0 145.0
Architectural
Treatment
Density fu
(lb/ft^3) (ksi)
150.0 90.000

Chapter 8 Example Problems
8-35
ROCK
Empirical Stem Top Footing Bear Cap Sliding
Bearing to Rock Length Sliding Allow Resist Resist
Capacity Layer Parallel Resistance Settle Factor Factor
(ksf) (ft) (ft) (in)
30.00 12.00 75.00 Y 1.00 0.55 0.90
Concrete Intact Rock Elastic Rock
/Rock Elastic Poissons Mass Modulus Mass
RQD Friction Modulus Ratio Rating Reduction Modulus
(%) (deg) (ksi) (ksi)
N/A 30.00 1400.00 0.25 N/A N/A 1200.00
MISCELLANEOUS REINFORCEMENT DATA
Aggregate Development Backwall Stem Footing
Size Correction Exposure Exposure Exposure
(in) Class Class Class
0.75 0.95 none 2 1
REINFORCEMENT COVER
Backwall Stem Footing Footing Footing Footing
Back Back Top Top Bottom Bottom Toe Heel
Vertical Vertical Perpend Parallel Perpend Parallel End End
(in) (in) (in) (in) (in) (in) (in) (in)
none 3.0 2.8 3.8 4.8 5.8 2.0 2.0
BAR SPACING FOR DESIGN
Backwall Stem Footing Hooked User Requested Bar
Maximum Maximum Maximum Footing Minimum Spacing
Bar Diam Bar Diam Bar Diam Bars Bar Spacing Increment
(in) (in) (in) (in) (in)
none 1.41 1.41 N/A 6.00 3.00
LOAD CONTROL
Ductility Redundancy Importance Temp Final Temp Final
Factor Factor Factor LS LS ES ES
(ft) (ft) (ft) (ft)
1.00 1.00 1.00 2.00 2.00 3.75 3.75
LOADS ON RETAINING WALLS
Y Distance Parapet X Distance Noise Wall X Distance
CT to CT Dead Load to Parapet Dead Load to Noise Wall
(kip) (in) (kip) (in) (kip) (in)
2.00 24.0 0.05 8.0 0.00 0.0
Wind on External Y Distance to Wind
Structure on External Structure
(kip) (in)
0.00 0.0
OUTPUT OF INPUT DATA
Input
File Input Input
Echo Commands Summary
1 0 1
OUTPUT OF RESULTS
Footing
Footing Output Factored Footing Control Reinf Footing
Geometry Legend Forces Stability Forces Summary Flexure
1 1 1 1 1 1 1
Crack Shear Development
Control Results Length
1 1 1

Chapter 8 Example Problems
8-36
OUTPUT OF INTERMEDIATE DATA
Internal Intermediate Detailed
Unfactored Load Moment/Axial Footing Bearing Resist Stem Cutoff
Loads Factors Interaction Forces Values Load Values
1 1 1 1 0 0
Minimum Reinf
Check
0

Chapter 8 Example Problems
8-37
8.11 EXAMPLE 10
Example 10 is an abutment w/o backwall (gravity type) on spread footing. The structure geometry is shown in the
following figure. The abutment is to be analyzed. The earthquake was not considered for this problem.
3.85ft
2.0
18"
4
12
1
127.75
1.25
0.4 4.73 2.12
9.0
live load
surcharge
(Dimensions: ft., unless
marked otherwise)
Rebar Layout:
not specified for cantilever retaining wall
Figure 8.11-1 Example 10 Gravity Wall Geometry

Chapter 8 Example Problems
8-38
CONFIGURATION
Lines Blank
per Lines
Page on Top
83 0
CONTROL
Sys of Type Footing
Units of Run Datum
US A T
ABUTMENT WITHOUT BACKWALL
Front Face Front Face Back Face Back Face
Top Bearing Horizontal Vertical Horizontal Vertical
Height Width Location Component Component Component Component
(ft) (in) (in)
7.75 18.0 9.0 1.00 12.00 4.00 12.00
Front Back Type Architectural
Additional Water Water of Treatment
Fill Height Level Level Wall Thickness
(ft) (ft) (ft) (in)
2.00 11.00 8.00 G 0.0
FOOTING
Min Min Min Min Max Max Max Max
Footing Toe Heel Footing Footing Toe Heel Footing
Thick Proj Proj Width Thick Proj Proj Width
(ft) (ft) (ft) (ft) (ft) (ft) (ft) (ft)
1.25 0.40 2.12 none none none none none
Footing Footing Stem
Thick Width Shift
Increment Increment Increment
(in) (in) (in)
2.00 3.00 1.00
MATERIALS
Backwall Stem Footing Reinforcement Epoxy Coated
f'c f'c f'c fy Backwall Stem Footing
(ksi) (ksi) (ksi) (ksi)
NA 3.000 3.000 50.000 NA NA NA
Backfill Backfill Backfill Minimum
Friction Dry Saturated Equivalent Concrete Density
Angle Density Density Fluid Press For DL For Ec
(deg) (lb/ft^3) (lb/ft^3) (lb/ft^3) (lb/ft^3) (lb/ft^3)
33.25 120.0 135.0 35.0 150.0 145.0
Architectural
Treatment
Density fu
(lb/ft^3) (ksi)
150.0 65.000
ROCK
Empirical Stem Top Footing Bear Cap Sliding
Bearing to Rock Length Sliding Allow Resist Resist
Capacity Layer Parallel Resistance Settle Factor Factor
(ksf) (ft) (ft) (in)
26.30 9.00 42.00 Y 1.00 0.55 1.00

Chapter 8 Example Problems
8-39
Concrete Intact Rock Elastic Rock
/Rock Elastic Poissons Mass Modulus Mass
RQD Friction Modulus Ratio Rating Reduction Modulus
(%) (deg) (ksi) (ksi)
N/A 35.00 1420.00 0.10 N/A N/A 1350.00
LOAD CONTROL
Ductility Redundancy Importance Temp Final Temp Final
Factor Factor Factor LS LS ES ES
(ft) (ft) (ft) (ft)
1.00 1.00 1.00 3.85 3.85 0.00 0.00
LOADS ON ABUTMENTS
Backwall
Vertical Horizontal Vert Horiz
DC DW PL WSUP WSUP WL TU LL LL
(kip) (kip) (kip) (kip) (kip) (kip) (kip) (kip) (kip)
3.75 0.35 0.00 -0.16 0.12 0.10 0.70 none none
Horizontal
WSUB FR
(kip) (kip)
0.0 0.00
DESIGN LIVE LOAD
Downward Upward
LL LL BR CE
(kip) (kip) (kip) (kip)
3.14 0.00 0.12 0.00
OUTPUT OF INPUT DATA
Input
File Input Input
Echo Commands Summary
1 0 1
OUTPUT OF RESULTS
Footing
Footing Output Factored Footing Control Reinf Footing
Geometry Legend Forces Stability Forces Summary Flexure
1 1 1 1 1 1 1
Crack Shear Development
Control Results Length
1 1 1
OUTPUT OF INTERMEDIATE DATA
Internal Intermediate Detailed
Unfactored Load Moment/Axial Footing Bearing Resist Stem Cutoff
Loads Factors Interaction Forces Values Load Values
1 1 1 1 0 0
Minimum Reinf
Check
1

Chapter 8 Example Problems
8-40
8.12 EXAMPLE 11
Example 11 is an analysis problem for a type I abutment on a pile footing. The structure geometry is shown in the
following figure. The abutment and the pile footing is to be analyzed. The earthquake consideration was
performed.
6.75'4'4'4'4'1.75'
3@4' = 12'
11.5'6.5'
4.25'
39.5'
17'
36"
20"4.75"
53"
4"
24"
36"10"
18"4"
Rebar Layout:
Stem: #11 @ 6" for entire height
Footing Parallel Direction: top and bottom: #9 @ 12"
Footing Perpendicular Direction: top #11 @ 6" bottom: #9 @ 6"
21'
Figure 8.12-1 Example 11 Abutment Geometry

Chapter 8 Example Problems
8-41
CONFIGURATION
Lines Blank
per Lines
Page on Top
83 0
CONTROL
Sys of Type Footing
Units of Run Datum
US A T
ABUTMENT TYPE I
Seat Seat Corbel
Top Seat Slope Face Corbel Corbel Slope
Height Width Width Height Height Width Height Height
(ft) (in) (in) (in) (in) (in) (in) (in)
39.50 36.0 36.0 4.8 53.0 4.0 24.0 4.0
Paving Paving Front Back Architectural Backwall/
Notch Notch Bearing Bearing Water Water Treatment Stem Bar
Width Height X Locn Y Locn Level Level Thickness Alignment
(in) (in) (in) (in) (ft) (ft) (in)
10.0 18.0 20.0 82.5 21.00 18.00 0.0 N/A
FOOTING
Min Min Min Min Max Max Max Max
Footing Toe Heel Footing Footing Toe Heel Footing
Thick Proj Proj Width Thick Proj Proj Width
(ft) (ft) (ft) (ft) (ft) (ft) (ft) (ft)
4.25 6.50 11.50 none none none none none
Footing Footing Stem
Thick Width Shift
Increment Increment Increment
(in) (in) (in)
2.00 3.00 1.00
PILE
Pile Pile Service Strength Service Strength
Dim Dim Pile Axial Axial Lateral Lateral Allowed
A B Embedment Capacity Capacity Capacity Capacity Uplift
(in) (in) (in) (kip) (kip) (kip) (kip) (kip)
10.0 10.0 12.0 N/A 270.00 N/A 0.00 0.00
PILE/CAISSON LAYOUT ANALYSIS
Spacing
Row Row within Percent Horizontal Vertical
Number Distance a Row Battered Component Component
(ft) (ft) (%)
1 1.75 4.00 100.0 4.00 10.00
2 4.00 4.00 100.0 3.00 10.00
3 4.00 4.00 100.0 3.00 10.00
4 4.00 12.00 0.0 none none
5 4.00 12.00 0.0 none none
MATERIALS
Backwall Stem Footing Reinforcement Epoxy Coated
f'c f'c f'c fy Backwall Stem Footing
(ksi) (ksi) (ksi) (ksi)
4.000 4.000 3.000 60.000 Y Y Y
Backfill Backfill Backfill Minimum
Friction Dry Saturated Equivalent Concrete Density
Angle Density Density Fluid Press For DL For Ec
(deg) (lb/ft^3) (lb/ft^3) (lb/ft^3) (lb/ft^3) (lb/ft^3)
33.25 120.0 135.0 35.0 150.0 145.0

Chapter 8 Example Problems
8-42
Architectural
Treatment
Density fu
(lb/ft^3) (ksi)
150.0 90.000
MISCELLANEOUS REINFORCEMENT DATA
Aggregate Development Backwall Stem Footing
Size Correction Exposure Exposure Exposure
(in) Class Class Class
1.00 1.00 1 1 1
REINFORCEMENT COVER
Backwall Stem Footing Footing Footing Footing
Back Back Top Top Bottom Bottom Toe Heel
Vertical Vertical Perpend Parallel Perpend Parallel End End
(in) (in) (in) (in) (in) (in) (in) (in)
3.0 3.0 2.5 3.9 3.2 4.5 2.0 2.0
BAR SIZE
Backwall Footing Footing Footing Footing Footing Footing
Back Perpend Parallel Perpend Parallel Perp Top Perp Bot
Vertical Top Top Bottom Bottom Bar Type Bar Type
(US bar) (US bar) (US bar) (US bar) (US bar)
8 11 6 9 9 Straight Straight
BAR SPACING FOR ANALYSIS
Backwall Footing Footing Footing Footing
Back Top Top Bottom Bottom
Vertical Perpend Parallel Perpend Parallel
(in) (in) (in) (in) (in)
12.0 6.0 12.0 6.0 12.0
STEM REINFORCING BARS
Range Bar Bar Group End
Number Size Spacing Offset Location
(US bar) (in) (in) (ft)
1 11 6.00 0.00 39.50
LOAD CONTROL
Ductility Redundancy Importance Temp Final Temp Final
Factor Factor Factor LS LS ES ES
(ft) (ft) (ft) (ft)
0.95 1.05 1.01 0.00 0.00 3.00 3.00
LOADS ON ABUTMENTS
Backwall
Vertical Horizontal Vert Horiz
DC DW PL WSUP WSUP WL TU LL LL
(kip) (kip) (kip) (kip) (kip) (kip) (kip) (kip) (kip)
13.70 2.06 0.21 0.00 0.41 0.21 0.34 0.14 none
Horizontal
WSUB FR
(kip) (kip)
0.0 0.00
DESIGN LIVE LOAD
Downward Upward
LL LL BR CE
(kip) (kip) (kip) (kip)
3.43 0.00 0.21 0.10
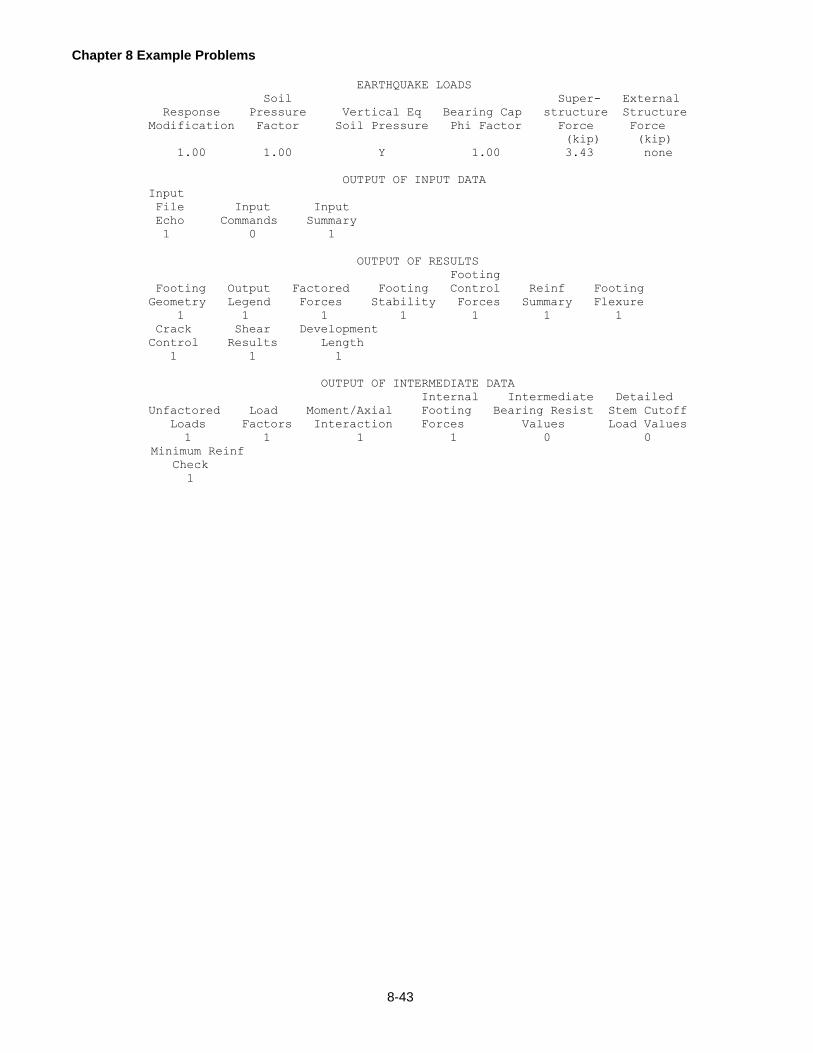
Chapter 8 Example Problems
8-43
EARTHQUAKE LOADS
Soil Super- External
Response Pressure Vertical Eq Bearing Cap structure Structure
Modification Factor Soil Pressure Phi Factor Force Force
(kip) (kip)
1.00 1.00 Y 1.00 3.43 none
OUTPUT OF INPUT DATA
Input
File Input Input
Echo Commands Summary
1 0 1
OUTPUT OF RESULTS
Footing
Footing Output Factored Footing Control Reinf Footing
Geometry Legend Forces Stability Forces Summary Flexure
1 1 1 1 1 1 1
Crack Shear Development
Control Results Length
1 1 1
OUTPUT OF INTERMEDIATE DATA
Internal Intermediate Detailed
Unfactored Load Moment/Axial Footing Bearing Resist Stem Cutoff
Loads Factors Interaction Forces Values Load Values
1 1 1 1 0 0
Minimum Reinf
Check
1

Chapter 8 Example Problems
8-44
8.13 EXAMPLE 12 (DESIGN)
Example 12 is a type II abutment on a caisson footing. The structure geometry is shown in the following figure.
Earthquake loads were not considered in this problem.
16" 9"
19.5"16"
4"
4"
9'36"
21.5"
49" 6'
2"12"
10"
39"14.75'
0.5
2
10
10
1' Min.
2.5' Min.
6' Max.
Caisson Dia. = 32"
15' Maximum
Figure 8.13-1 Example 12 Abutment Geometry

Chapter 8 Example Problems
8-45
CONFIGURATION
Lines Blank
per Lines
Page on Top
83 0
CONTROL
Sys of Type Footing
Units of Run Datum
US D B
ABUTMENT TYPE II
Seat Seat Corbel Paving Paving
Top Seat Slope Face Corbel Corbel Slope Notch Notch
Height Width Width Height Height Width Height Height Width Height
(ft) (in) (in) (in) (in) (in) (in) (in) (in) (in)
14.75 16.0 21.5 2.0 36.0 4.0 19.5 4.0 9.0 16.0
Stem Stem Front Face Front Face Back Face Back Face
Backwall Notch Notch Horizontal Vertical Horizontal Vertical
Height Width Height Component Component Component Component
(in) (in) (in)
49.0 12.0 39.0 0.50 10.00 2.00 10.00
Front Back Architectural Backwall/
Bearing Bearing Water Water Treatment Stem Bar
X Locn Y Locn Level Level Thickness Alignment
(in) (in) (ft) (ft) (in)
10.0 none 9.00 6.00 0.0 Y
FOOTING
Min Min Min Min Max Max Max Max
Footing Toe Heel Footing Footing Toe Heel Footing
Thick Proj Proj Width Thick Proj Proj Width
(ft) (ft) (ft) (ft) (ft) (ft) (ft) (ft)
2.50 1.00 0.00 12.34 6.00 none none 15.00
Footing Footing Stem
Thick Width Shift
Increment Increment Increment
(in) (in) (in)
2.00 3.00 1.00
CAISSON
Service Strength Service Strength
Caisson Caisson Axial Axial Lateral Lateral Allowed
Diameter Embedment Capacity Capacity Capacity Capacity Uplift
(in) (in) (kip) (kip) (kip) (kip) (kip)
32.0 12.0 N/A 382.00 N/A 0.00 0.00
PILE/CAISSON LAYOUT DESIGN
Toe to Minimum Pile Row
First Heel to Minimum Maximum Row Spacing Distances
Row Last Row Spacing Spacing Placement Rounding Rounding
(ft) (ft) (ft) (ft) (ft) (ft)
2.17 2.17 8.00 15.00 E 0.00 0.00
Design Batt Design Batt Pile/
Horizontal Vertical Last Row Caisson Footing
Component Component % Batter Optimize Cost Cost
(%) ($/pile) ($/yd^3)
3.00 12.00 0.0 C 1000.00 460.00

Chapter 8 Example Problems
8-46
MATERIALS
Backwall Stem Footing Reinforcement Epoxy Coated
f'c f'c f'c fy Backwall Stem Footing
(ksi) (ksi) (ksi) (ksi)
3.000 3.000 3.000 60.000 N N N
Backfill Backfill Backfill Minimum
Friction Dry Saturated Equivalent Concrete Density
Angle Density Density Fluid Press For DL For Ec
(deg) (lb/ft^3) (lb/ft^3) (lb/ft^3) (lb/ft^3) (lb/ft^3)
33.25 120.0 135.0 35.0 150.0 145.0
Architectural
Treatment
Density fu
(lb/ft^3) (ksi)
150.0 90.000
MISCELLANEOUS REINFORCEMENT DATA
Aggregate Development Backwall Stem Footing
Size Correction Exposure Exposure Exposure
(in) Class Class Class
0.50 0.95 2 2 1
REINFORCEMENT COVER
Backwall Stem Footing Footing Footing Footing
Back Back Top Top Bottom Bottom Toe Heel
Vertical Vertical Perpend Parallel Perpend Parallel End End
(in) (in) (in) (in) (in) (in) (in) (in)
3.0 3.0 3.0 4.4 3.0 4.4 2.0 2.0
BAR SPACING FOR DESIGN
Backwall Stem Footing Hooked User Requested Bar
Maximum Maximum Maximum Footing Minimum Spacing
Bar Diam Bar Diam Bar Diam Bars Bar Spacing Increment
(in) (in) (in) (in) (in)
1.41 1.41 1.41 N 6.00 3.00
LOAD CONTROL
Ductility Redundancy Importance Temp Final Temp Final
Factor Factor Factor LS LS ES ES
(ft) (ft) (ft) (ft)
0.98 1.02 1.07 2.50 2.50 1.60 0.00
LOADS ON ABUTMENTS
Backwall
Vertical Horizontal Vert Horiz
DC DW PL WSUP WSUP WL TU LL LL
(kip) (kip) (kip) (kip) (kip) (kip) (kip) (kip) (kip)
4.80 3.08 0.51 -0.34 0.31 0.00 0.68 0.23 none
Horizontal
WSUB FR
(kip) (kip)
0.0 0.00
SPECIAL LIVE LOAD
Downwrd Upwrd STR 1 STR 1P STR 2 STR 3 STR 5 EXT 1 SER 1
LL LL BR CE Factor Factor Factor Factor Factor Factor Factor
(kip) (kip) (kip) (kip)
0.31 -0.17 0.08 0.09 1.75 1.35 1.35 0.00 1.35 0.50 1.00
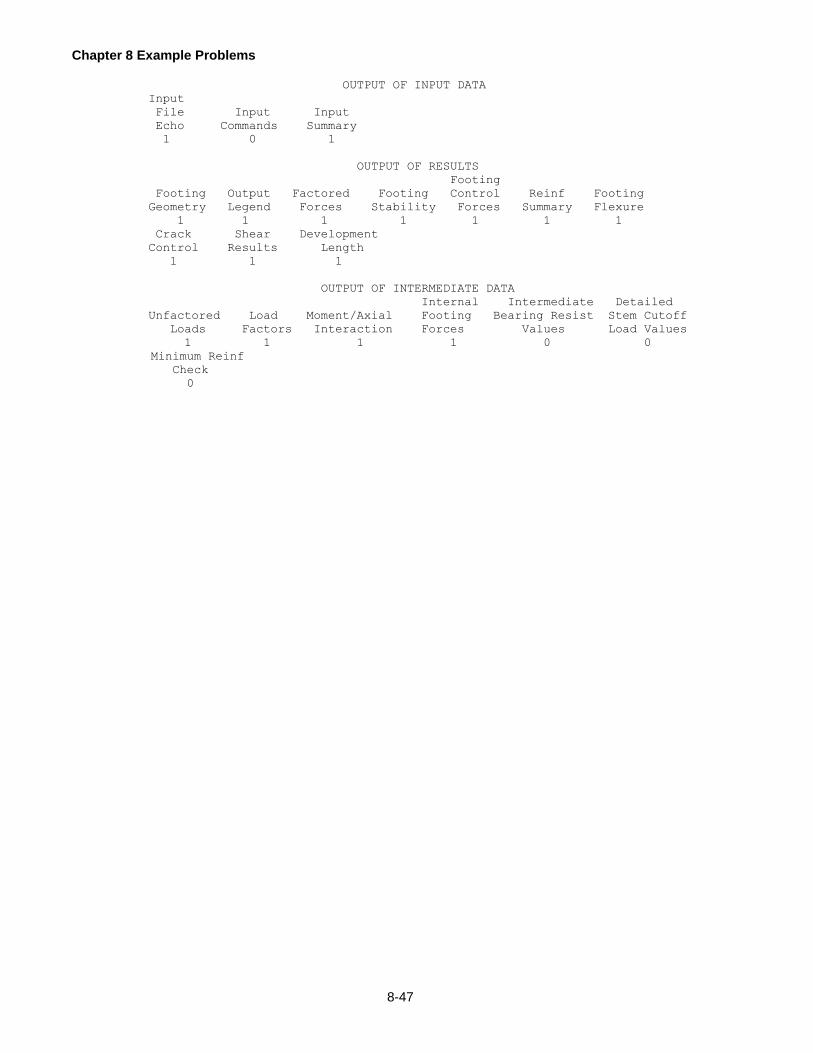
Chapter 8 Example Problems
8-47
OUTPUT OF INPUT DATA
Input
File Input Input
Echo Commands Summary
1 0 1
OUTPUT OF RESULTS
Footing
Footing Output Factored Footing Control Reinf Footing
Geometry Legend Forces Stability Forces Summary Flexure
1 1 1 1 1 1 1
Crack Shear Development
Control Results Length
1 1 1
OUTPUT OF INTERMEDIATE DATA
Internal Intermediate Detailed
Unfactored Load Moment/Axial Footing Bearing Resist Stem Cutoff
Loads Factors Interaction Forces Values Load Values
1 1 1 1 0 0
Minimum Reinf
Check
0

Chapter 8 Example Problems
8-48
8.14 EXAMPLE 13 (DESIGN)
Example 13 is a retaining wall on a spread footing. The geometry is shown in the following figure. Earthquake
loads were considered in this problem. The footing is founded on two layers of soil.
36"
18" ES &LS=2.25'
24"
6"3
1018.0'
25.0'
Max.=6.0' Max.=4.0'
Max=4.0'
21.0'
Figure 8.14-1 Example 13 Retaining Wall Geometry
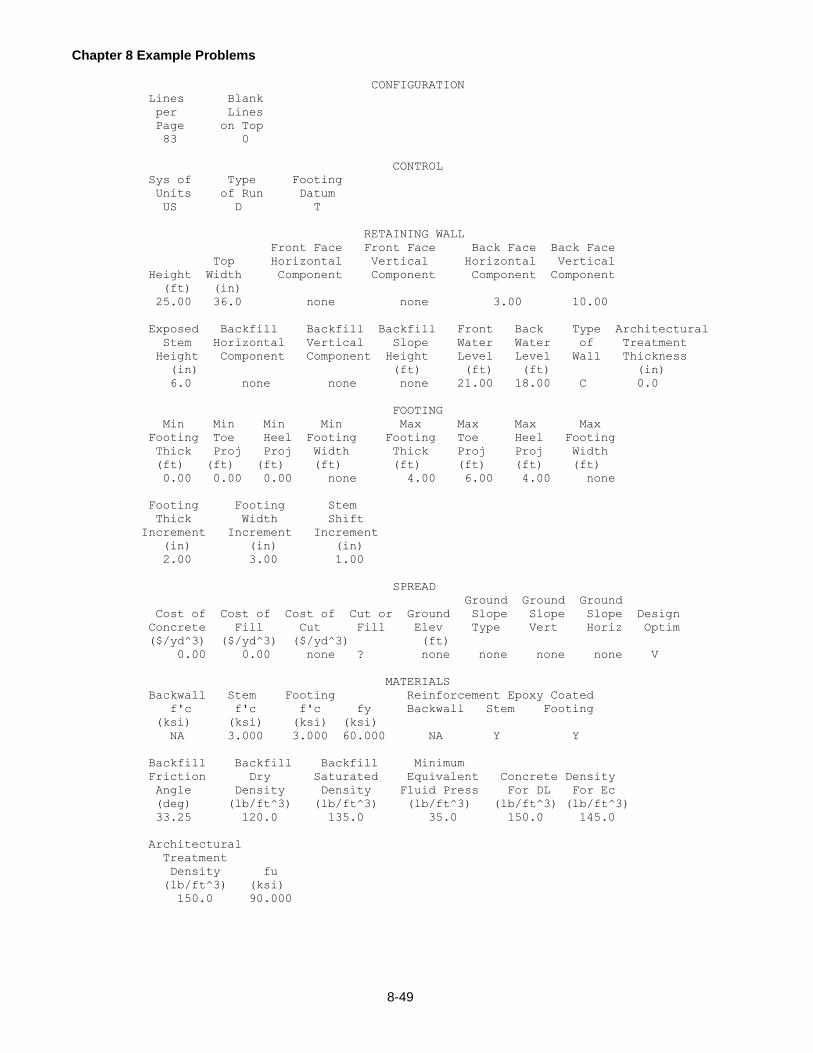
Chapter 8 Example Problems
8-49
CONFIGURATION
Lines Blank
per Lines
Page on Top
83 0
CONTROL
Sys of Type Footing
Units of Run Datum
US D T
RETAINING WALL
Front Face Front Face Back Face Back Face
Top Horizontal Vertical Horizontal Vertical
Height Width Component Component Component Component
(ft) (in)
25.00 36.0 none none 3.00 10.00
Exposed Backfill Backfill Backfill Front Back Type Architectural
Stem Horizontal Vertical Slope Water Water of Treatment
Height Component Component Height Level Level Wall Thickness
(in) (ft) (ft) (ft) (in)
6.0 none none none 21.00 18.00 C 0.0
FOOTING
Min Min Min Min Max Max Max Max
Footing Toe Heel Footing Footing Toe Heel Footing
Thick Proj Proj Width Thick Proj Proj Width
(ft) (ft) (ft) (ft) (ft) (ft) (ft) (ft)
0.00 0.00 0.00 none 4.00 6.00 4.00 none
Footing Footing Stem
Thick Width Shift
Increment Increment Increment
(in) (in) (in)
2.00 3.00 1.00
SPREAD
Ground Ground Ground
Cost of Cost of Cost of Cut or Ground Slope Slope Slope Design
Concrete Fill Cut Fill Elev Type Vert Horiz Optim
($/yd^3) ($/yd^3) ($/yd^3) (ft)
0.00 0.00 none ? none none none none V
MATERIALS
Backwall Stem Footing Reinforcement Epoxy Coated
f'c f'c f'c fy Backwall Stem Footing
(ksi) (ksi) (ksi) (ksi)
NA 3.000 3.000 60.000 NA Y Y
Backfill Backfill Backfill Minimum
Friction Dry Saturated Equivalent Concrete Density
Angle Density Density Fluid Press For DL For Ec
(deg) (lb/ft^3) (lb/ft^3) (lb/ft^3) (lb/ft^3) (lb/ft^3)
33.25 120.0 135.0 35.0 150.0 145.0
Architectural
Treatment
Density fu
(lb/ft^3) (ksi)
150.0 90.000

Chapter 8 Example Problems
8-50
SOIL
Stem Top Footing Footing Soil Bearing Cap Sliding
to Soil Length Near Level Allow Resistance Resist
Layer (Parallel) Slope Over Toe Settle Factor Factor
(ft) (ft) (ft) (in)
25.00 100.00 N 2.50 1.00 0.50 1.00
Soil Soil Undrained Mass Unit Saturated
Layer Layer Shear Weight/ Unit Weight/
Number Thick Strength Cohesion Density Density
(ft) (ksf) (ksf) (lb/ft^3) (lb/ft^3)
1 5.00 0.00 2.10 120.00 135.00
2 5.00 0.00 3.20 120.00 135.00
Soil Effective Apply
Layer Friction Elastic Poissons Inclination
Number Angle Modulus Ratio Ncq N Gamma q Factors
(deg) (ksf)
1 30.00 775.00 0.30 none none Y
2 35.00 850.00 0.33 none none
Precast or
Cast-in-
Place
C
CONSOLIDATION SETTLEMENT
Max Past Max Past
Second Init Effect Effect
Layer Void Compr Recomp Comp Effect Stress Prim Serv Stress
Number Ratio Index Index Index Stress Top Consol Life Bottom
(ksi) (ksi) (year) (year) (ksi)
1 0.30 0.00 0.00 0.000 0.01 0.02 1.0 10.0 0.04
2 0.70 0.10 0.01 0.001 0.02 0.04 1.0 10.0 0.06
MISCELLANEOUS REINFORCEMENT DATA
Aggregate Development Backwall Stem Footing
Size Correction Exposure Exposure Exposure
(in) Class Class Class
0.75 1.00 none 2 1
REINFORCEMENT COVER
Backwall Stem Footing Footing Footing Footing
Back Back Top Top Bottom Bottom Toe Heel
Vertical Vertical Perpend Parallel Perpend Parallel End End
(in) (in) (in) (in) (in) (in) (in) (in)
none 3.0 3.0 4.0 4.0 5.0 2.0 2.0
BAR SPACING FOR DESIGN
Backwall Stem Footing Hooked User Requested Bar
Maximum Maximum Maximum Footing Minimum Spacing
Bar Diam Bar Diam Bar Diam Bars Bar Spacing Increment
(in) (in) (in) (in) (in)
none 1.41 1.41 N 6.00 3.00
LOAD CONTROL
Ductility Redundancy Importance Temp Final Temp Final
Factor Factor Factor LS LS ES ES
(ft) (ft) (ft) (ft)
1.00 1.00 1.00 2.25 2.25 2.25 2.25
LOADS ON RETAINING WALLS
Y Distance Parapet X Distance Noise Wall X Distance
CT to CT Dead Load to Parapet Dead Load to Noise Wall
(kip) (in) (kip) (in) (kip) (in)
1.50 24.0 0.10 18.0 0.00 0.0
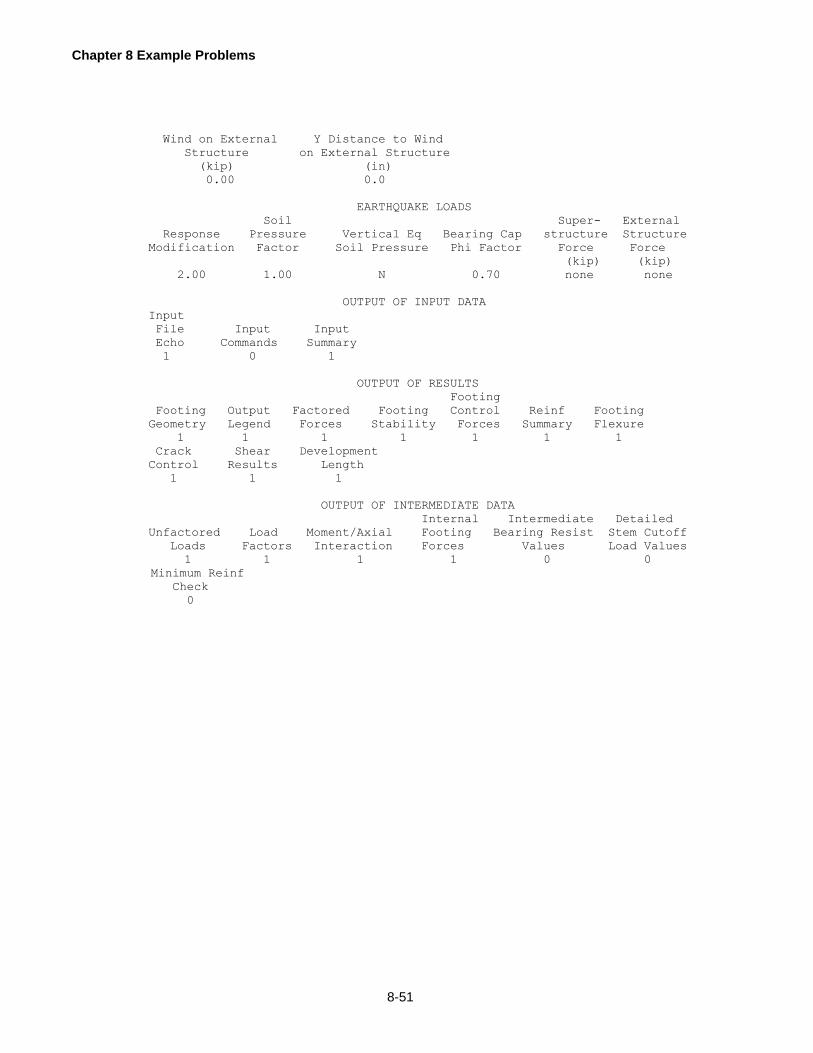
Chapter 8 Example Problems
8-51
Wind on External Y Distance to Wind
Structure on External Structure
(kip) (in)
0.00 0.0
EARTHQUAKE LOADS
Soil Super- External
Response Pressure Vertical Eq Bearing Cap structure Structure
Modification Factor Soil Pressure Phi Factor Force Force
(kip) (kip)
2.00 1.00 N 0.70 none none
OUTPUT OF INPUT DATA
Input
File Input Input
Echo Commands Summary
1 0 1
OUTPUT OF RESULTS
Footing
Footing Output Factored Footing Control Reinf Footing
Geometry Legend Forces Stability Forces Summary Flexure
1 1 1 1 1 1 1
Crack Shear Development
Control Results Length
1 1 1
OUTPUT OF INTERMEDIATE DATA
Internal Intermediate Detailed
Unfactored Load Moment/Axial Footing Bearing Resist Stem Cutoff
Loads Factors Interaction Forces Values Load Values
1 1 1 1 0 0
Minimum Reinf
Check
0

Chapter 8 Example Problems
8-52
8.15 EXAMPLE 14
Example 14 is a type 1 abutment on spread footing. The structure geometry is shown in the following figure. The
abutment is to be analyzed. The earthquake is considered for this problem.
9.0'
2.0'
12.70'
48.2"
14"
29"
4"
4"
21"
15" 9"
16"
10.95'
2.33'2.58'
Rebar Layout :
Stem: #8 @ 12" for entire height
Footing Perpendicular Direction: top and bottom: #8 @ 12"
13.95'
Figure 8.15-1 Example 14 Abutment Geometry

Chapter 8 Example Problems
8-53
CONFIGURATION
Lines Blank
per Lines
Page on Top
83 0
CONTROL
Sys of Type Footing
Units of Run Datum
US A T
ABUTMENT TYPE I
Seat Seat Corbel
Top Seat Slope Face Corbel Corbel Slope
Height Width Width Height Height Width Height Height
(ft) (in) (in) (in) (in) (in) (in) (in)
12.70 15.0 29.0 0.0 48.2 4.0 21.0 4.0
Paving Paving Front Back Architectural Backwall/
Notch Notch Bearing Bearing Water Water Treatment Stem Bar
Width Height X Locn Y Locn Level Level Thickness Alignment
(in) (in) (in) (in) (ft) (ft) (in)
9.0 16.0 14.0 none 13.95 10.95 0.0 N/A
FOOTING
Min Min Min Min Max Max Max Max
Footing Toe Heel Footing Footing Toe Heel Footing
Thick Proj Proj Width Thick Proj Proj Width
(ft) (ft) (ft) (ft) (ft) (ft) (ft) (ft)
2.00 2.58 2.33 none none none none none
Footing Footing Stem
Thick Width Shift
Increment Increment Increment
(in) (in) (in)
2.00 3.00 1.00
MATERIALS
Backwall Stem Footing Reinforcement Epoxy Coated
f'c f'c f'c fy Backwall Stem Footing
(ksi) (ksi) (ksi) (ksi)
3.500 3.000 3.000 50.000 N N N
Backfill Backfill Backfill Minimum
Friction Dry Saturated Equivalent Concrete Density
Angle Density Density Fluid Press For DL For Ec
(deg) (lb/ft^3) (lb/ft^3) (lb/ft^3) (lb/ft^3) (lb/ft^3)
33.25 120.0 135.0 35.0 150.0 145.0
Architectural
Treatment
Density fu
(lb/ft^3) (ksi)
150.0 65.000
SOIL
Stem Top Footing Footing Soil Bearing Cap Sliding
to Soil Length Near Level Allow Resistance Resist
Layer (Parallel) Slope Over Toe Settle Factor Factor
(ft) (ft) (ft) (in)
14.70 50.20 N 2.00 1.00 0.50 0.85

Chapter 8 Example Problems
8-54
Soil Soil Undrained Mass Unit Saturated
Layer Layer Shear Weight/ Unit Weight/
Number Thick Strength Cohesion Density Density
(ft) (ksf) (ksf) (lb/ft^3) (lb/ft^3)
1 10.00 0.00 1.00 120.00 135.00
Soil Effective Apply
Layer Friction Elastic Poissons Inclination
Number Angle Modulus Ratio Ncq N Gamma q Factors
(deg) (ksf)
1 30.00 500.00 0.30 none none Y
Precast or
Cast-in-
Place
C
CONSOLIDATION SETTLEMENT
Max Past Max Past
Second Init Effect Effect
Layer Void Compr Recomp Comp Effect Stress Prim Serv Stress
Number Ratio Index Index Index Stress Top Consol Life Bottom
(ksi) (ksi) (year) (year) (ksi)
1 0.80 0.10 0.02 0.002 0.01 0.01 0.1 5.0 0.01
MISCELLANEOUS REINFORCEMENT DATA
Aggregate Development Backwall Stem Footing
Size Correction Exposure Exposure Exposure
(in) Class Class Class
1.00 1.00 2 2 2
REINFORCEMENT COVER
Backwall Stem Footing Footing Footing Footing
Back Back Top Top Bottom Bottom Toe Heel
Vertical Vertical Perpend Parallel Perpend Parallel End End
(in) (in) (in) (in) (in) (in) (in) (in)
3.0 3.0 3.0 4.0 4.0 5.0 2.0 2.0
BAR SIZE
Backwall Footing Footing Footing Footing Footing Footing
Back Perpend Parallel Perpend Parallel Perp Top Perp Bot
Vertical Top Top Bottom Bottom Bar Type Bar Type
(US bar) (US bar) (US bar) (US bar) (US bar)
8 8 none 8 none Straight Straight
BAR SPACING FOR ANALYSIS
Backwall Footing Footing Footing Footing
Back Top Top Bottom Bottom
Vertical Perpend Parallel Perpend Parallel
(in) (in) (in) (in) (in)
12.0 12.0 0.0 12.0 0.0
STEM REINFORCING BARS
Range Bar Bar Group End
Number Size Spacing Offset Location
(US bar) (in) (in) (ft)
1 8 12.00 0.00 12.70
LOAD CONTROL
Ductility Redundancy Importance Temp Final Temp Final
Factor Factor Factor LS LS ES ES
(ft) (ft) (ft) (ft)
1.00 1.00 1.00 2.00 2.00 0.00 0.00
LOADS ON ABUTMENTS
Backwall
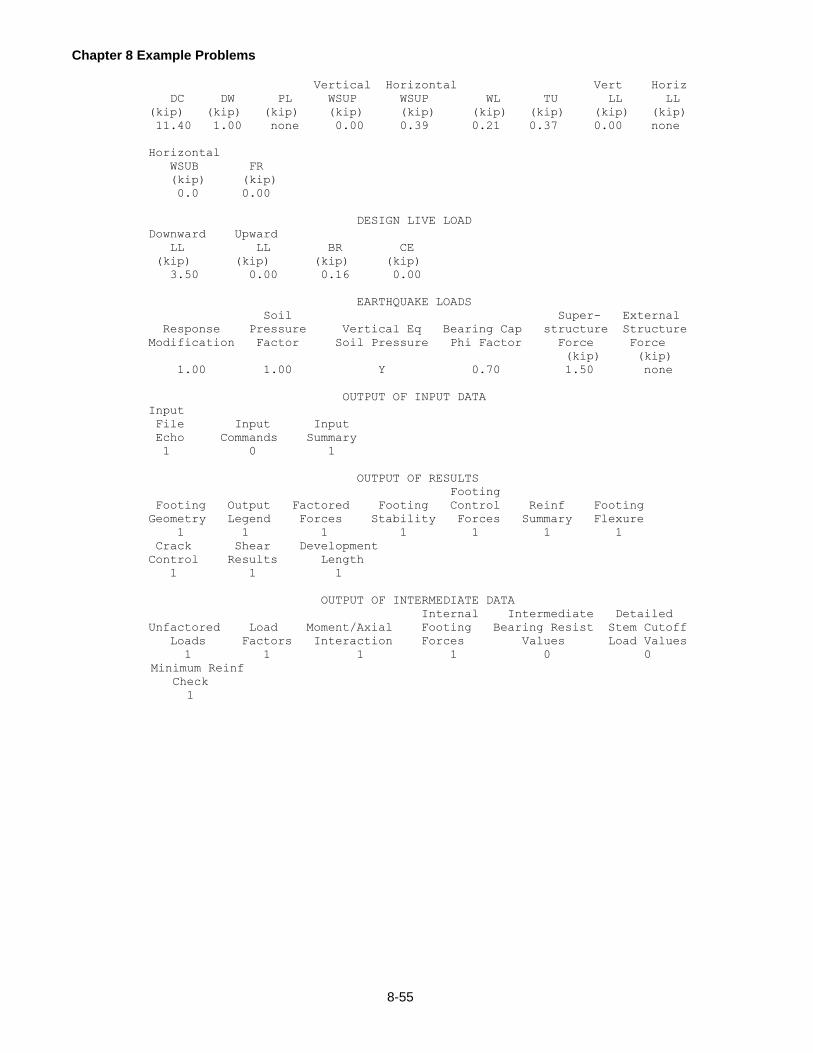
Chapter 8 Example Problems
8-55
Vertical Horizontal Vert Horiz
DC DW PL WSUP WSUP WL TU LL LL
(kip) (kip) (kip) (kip) (kip) (kip) (kip) (kip) (kip)
11.40 1.00 none 0.00 0.39 0.21 0.37 0.00 none
Horizontal
WSUB FR
(kip) (kip)
0.0 0.00
DESIGN LIVE LOAD
Downward Upward
LL LL BR CE
(kip) (kip) (kip) (kip)
3.50 0.00 0.16 0.00
EARTHQUAKE LOADS
Soil Super- External
Response Pressure Vertical Eq Bearing Cap structure Structure
Modification Factor Soil Pressure Phi Factor Force Force
(kip) (kip)
1.00 1.00 Y 0.70 1.50 none
OUTPUT OF INPUT DATA
Input
File Input Input
Echo Commands Summary
1 0 1
OUTPUT OF RESULTS
Footing
Footing Output Factored Footing Control Reinf Footing
Geometry Legend Forces Stability Forces Summary Flexure
1 1 1 1 1 1 1
Crack Shear Development
Control Results Length
1 1 1
OUTPUT OF INTERMEDIATE DATA
Internal Intermediate Detailed
Unfactored Load Moment/Axial Footing Bearing Resist Stem Cutoff
Loads Factors Interaction Forces Values Load Values
1 1 1 1 0 0
Minimum Reinf
Check
1

Chapter 8 Example Problems
8-56
This page is intentionally left blank
9-1
9 TECHNICAL QUESTIONS AND REVISION REQUEST
This chapter contains reply forms to make it easier for users to convey their questions, problems or comments to
the proper unit within the Department. General procedures for using these forms are given. Users should keep
the forms in the manual as master copies which can be reproduced as needed. They are also included as a Word
template on the disk that has been provided for the program.
9.1 TECHNICAL QUESTIONS
Technical questions related to the interpretations of the design specifications as implemented in this program,
why certain assumptions are made, applicability and limitations of this program, and other questions not related to
the operation of this program can be directed to the appropriate person in PennDOT using this form or the
information provided on this form. Please review the information provided in this User's Manual and the
references given in Chapter 1 before submitting this form for processing or calling for assistance. The completed
form should be sent to the Bridge Design and Technology Division (see form for complete address).
9.2 REVISION REQUEST
This form is to be used to report suspected program malfunctions that may require revisions to the program. It can
also be used to request revisions that may be required due to changes in specifications and for the enhancement
of the program. Unexpected or incorrect output, rejection of input data, endless program cycling, and program
abortion are examples of program malfunctions. Users are requested to review their input data and the program
User’s Manual before submitting this form for processing.
This form may also be used to submit suggestions for improving the User’s Manual for this program. Suggestions
might include typographical error correction, clarification of confusing sections, expansion of certain sections,
changes in format, and the inclusion of additional information, diagrams, or examples.
The completed form should be sent to the Engineering Software Section via mail, fax, or e-mail.

9-2
This page is intentionally left blank.

9-3
ABLRFD TECHNICAL QUESTIONS
This form is to be used to ask questions on technical issues related to this engineering program. Questions on the interpretations of the design specifications as implemented in this program, why certain assumptions are made by the program and other questions not related to the operation of this program may be submitted using this form or by calling the telephone number listed in this form. Users are requested to read the User’s Manual, LRFD Specifications and DM-4 before submitting this form or calling to ask questions.
CONTACT PERSON: _______________________________________ DATE: ____________________ ORGANIZATION: ______________________________________ PHONE: ____________________ E-MAIL ADDRESS: ______________________________________ FAX: ____________________
PROGRAM VERSION: _________
Clearly state your question(s) and attach documentation you feel would be helpful in answering your question(s). If you require more space, use additional 8½ x 11 sheets of plain paper.
FORWARD COMPLETED FORM TO: Bridge Design and Technology Division
Pennsylvania Dept. Of Transportation P.O. Box 3560, Harrisburg, PA 17105-3560 PHONE: (717) 787-2881 FAX: (717) 787-2882
FOR DEPARTMENT USE ONLY
RECEIVED BY: ________________ ASSIGNED TO: ___________________ DATE: _____________

9-4
This page is intentionally left blank.

9-5
ABLRFD REVISION REQUEST
This form is to be used to report suspected program malfunctions, or to request revisions to the program or its documentation. Users are requested to review their input data and the program User’s Manual before submitting this form.
CONTACT PERSON: _______________________________________ DATE: ____________________ ORGANIZATION: ______________________________________ PHONE: ____________________ E-MAIL ADDRESS: ______________________________________ FAX: ____________________
PROGRAM VERSION: _________
Define your problem and attach samples and/or documentation you feel would be helpful in correcting the problem. If the input data is more than 4 or 5 lines, Licensees should provide the input data file on a diskette. If you require more space, use additional 8½ x 11 sheets of plain paper.
FORWARD COMPLETED FORM TO: Pennsylvania Department of Transportation Bureau of Business Solutions and Services,
Highway/Engineering Applications Division, Engineering Software Section P. O. Box 8213, Harrisburg, PA 17105-8213 PHONE: (717) 783-8822 FAX: (717) 705-5529 E-MAIL: [email protected]
FOR DEPARTMENT USE ONLY
RECEIVED BY: ________________ ASSIGNED TO: ___________________ DATE: _____________

9-6
This page is intentionally left blank.