lqxqghugrshg %d [ )h $v filethe open access journal for physics new jou rnal of ph ys ics...
TRANSCRIPT

Competition of magnetism and superconductivityin underdoped (Ba1- xKx)Fe2As2
To cite this article: Marianne Rotter et al 2009 New J. Phys. 11 025014
View the article online for updates and enhancements.
Related contentSynthesis, crystal structure and SDWanomaly of the iron arsenide-fluorideSrFeAsFM. Tegel, S. Johansson, V. Weiß et al.
-
Local structure and hyperfine interactionsof 57Fe in NaFeAs studied by MössbauerspectroscopyI Presniakov, I Morozov, A Sobolev et al.
-
Structural and magnetic phase transitionsin the ternary iron arsenides SrFe2As2andEuFe2As2Marcus Tegel, Marianne Rotter, VeronikaWeiß et al.
-
Recent citationsEvidence for negative thermal expansionin the superconducting precursor phaseSmFeAsOH D Zhou et al
-
Specific Heat of Ba0.59K0.41Fe2As2, anFe-Pnictide Superconductor with Tc = 36.9K, and a New Method for Identifying theElectron ContributionCostel R. Rotundu et al
-
Effect of spin-density wave fluctuations onthe specific heat jump in iron pnictides atthe superconducting transitionD. Kuzmanovski et al
-
This content was downloaded from IP address 137.250.100.48 on 17/05/2018 at 17:39

T h e o p e n – a c c e s s j o u r n a l f o r p h y s i c s
New Journal of Physics
Competition of magnetism and superconductivityin underdoped (Ba1−xKx)Fe2As2
Marianne Rotter1, Marcus Tegel1, Inga Schellenberg2,Falko M Schappacher2, Rainer Pöttgen2, Joachim Deisenhofer3,Axel Günther3, Florian Schrettle3, Alois Loidl3
and Dirk Johrendt1,4
1 Department Chemie und Biochemie der Ludwig-Maximilians-UniversitätMünchen, Butenandtstr.-5-13 (Haus D), 81377 München, Germany2 Institut für Anorganische und Analytische Chemie, Universität Münster,Corrensstrasse 30, D-48149 Münster, Germany3 Experimentalphysik V, Center for Electronic Correlations and Magnetism,Institute for Physics, Augsburg University, D-86135 Augsburg, GermanyE-mail: [email protected]
New Journal of Physics 11 (2009) 025014 (18pp)Received 14 December 2008Published 27 February 2009Online at http://www.njp.org/doi:10.1088/1367-2630/11/2/025014
Abstract. Polycrystalline samples of underdoped (Ba1−xKx)Fe2As2 (x 6 0.4)were synthesized and studied by x-ray powder diffraction, magneticsusceptibility, specific heat and 57Fe-Mößbauer spectroscopy. The structuralphase transition from tetragonal to orthorhombic lattice symmetry shifts towardslower temperatures, becomes less pronounced at x = 0.1–0.2 and is no longerpresent at x = 0.3. Bulk superconductivity is observed in all samples except(Ba0.9K0.1)Fe2As2 by resistivity and magnetic susceptibility measurements.Specific heat data show a broad spin-density-wave (SDW) phase transition in(Ba0.9K0.1)Fe2As2, which is hardly discernible in (Ba0.8K0.2)Fe2As2. No SDWanomaly is found in the specific heat of optimally doped (Ba0.6K0.4)Fe2As2,where C changes by 0.1 J K−1 at Tc = 37.3 K. 57Fe-Mößbauer spectra showfull magnetic hyperfine field splitting, indicative of antiferromagnetic (AF)ordering at 4.2 K in samples with x = 0–0.2, but zero magnetic hyperfine field insamples with x = 0.3. The spectra of (Ba0.9K0.1)Fe2As2 and (Ba0.8K0.2)Fe2As2
in the phase transition regions are temperature-dependent superpositions ofmagnetic and non-magnetic components, caused by inhomogeneous potassiumdistribution. Our results suggest the co-existence of AF ordering and
4 Author to whom any correspondence should be addressed.
New Journal of Physics 11 (2009) 0250141367-2630/09/025014+18$30.00 © IOP Publishing Ltd and Deutsche Physikalische Gesellschaft

2
superconductivity without mesoscopic phase separation in the underdopedregion and show unambiguously homogeneous superconducting phases closeto optimal doping. This is in contrast to recently reported results about single-crystal (Ba1−xKx)Fe2As2.
Contents
1. Introduction 22. Experimental 3
2.1. Sample preparation . . . . . . . . . . . . . . . . . . . . . . . . . . . . . . . . 32.2. X-ray structure determination . . . . . . . . . . . . . . . . . . . . . . . . . . . 42.3. Magnetic susceptibility and specific heat . . . . . . . . . . . . . . . . . . . . . 42.4. Mößbauer spectroscopy . . . . . . . . . . . . . . . . . . . . . . . . . . . . . . 4
3. Results and discussion 43.1. Crystal structures and phase transitions . . . . . . . . . . . . . . . . . . . . . . 43.2. dc resistivity . . . . . . . . . . . . . . . . . . . . . . . . . . . . . . . . . . . . 53.3. Magnetic susceptibility . . . . . . . . . . . . . . . . . . . . . . . . . . . . . . 63.4. Specific heat . . . . . . . . . . . . . . . . . . . . . . . . . . . . . . . . . . . . 83.5. 57Fe-Mößbauer spectroscopy . . . . . . . . . . . . . . . . . . . . . . . . . . . 10
4. Conclusion 15Acknowledgments 17References 17
1. Introduction
The discovery of superconductivity (SC) in iron arsenides [1, 2] with transition temperatures(Tc) up to 55 K [3] has attracted enormous interest in the scientific community [4]. Besides theoutstanding physical properties of this new class of superconducting materials, scientists foundnew hope that iron arsenides may help to finally solve the mystery of high-Tc SC. But priorto this long-term objective, many fundamental issues of the iron arsenides need to be clarified.Among them, the structural and magnetic phase diagrams with respect to doping, reflecting theinterplay between SC and magnetism, are discussed controversially.
In both the LaFeAsO (1111) and BaFe2As2 (122) families, SC evolves from poormetallic parent compounds with quasi two-dimensional tetragonal crystal structures, whichare subject to orthorhombic lattice distortions below certain temperatures (To). Static long-range antiferromagnetic (AF) ordering emerges with Néel temperatures (TN) well below To inLaFeAsO [5], but very close to To in BaFe2As2 [6]. The structural and magnetic transitions ofthe parent compounds are strongly affected by doping of the FeAs layers either with electronsor holes, and SC appears at certain doping levels. For the underdoped phases in the transitionzone, it has been reported that SC and AF ordering is either separated or co-existing. Also, theoverlap of the orthorhombic distortion with the SC and AF areas in the phase diagrams is stillnot clear, neither in the 1111 nor in the 122 systems.
The first phase diagram of LaFeAsO1−xFx , constructed by µSR data, showed a sharp-cutvertical border between the SC and the orthorhombic AF phases at x = 0.045 [7]. But neutrondiffraction experiments showed that although the magnetic ordering vanishes around x ≈ 0.04,
New Journal of Physics 11 (2009) 025014 (http://www.njp.org/)

3
the orthorhombic lattice still exists at least to x = 0.05, where SC has already emerged [8].This is in line with the recently published neutron study of CeFeAsO1−xFx , where AF orderingdisappears exactly before SC emerges, but the orthorhombic lattice persists extensively intothe SC dome up to x ≈ 0.1 [9]. Similar results have been reported for SmFeAsO1−xFx fromµSR experiments [10] and structural investigations using synchrotron radiation [11]. Thus at themoment all signs are that in the case of the 1111-family, static AF order is completely suppressedbefore SC emerges, but the orthorhombic lattice co-exists with SC and the temperaturedifference between To and TN increases with the doping level. This behavior of the 1111-superconductors is strongly reminiscent of the monolayer high-Tc cuprates. For instance inLa2−xSrxCuO4, the AF order is well separated from the SC state, but the orthorhombic phaseexists largely in the superconducting dome [12].
In the 122-family, co-existence of the orthorhombic structure with SC was first publishedfor (Ba1−xKx)Fe2As2 up to x ≈ 0.2 (Tc ≈ 26 K) by x-ray powder diffraction [13]. The followingneutron diffraction experiments also showed orthorhombic symmetry and long-range AFordering co-existing up to x = 0.3 (Tc < 15 K) [14]. The different shapes of the superconductingdomes Tc(x) of (Ba1−xKx)Fe2As2 may be due to different synthesis conditions. However, thex values in [13] are determined from x-ray data by Rietveld refinements, whereas only thenominal compositions are given in [14]. Since diffraction methods provide the mean structuralinformation on a rather long spatial scale, short-range phase inhomogeneities are averaged. Thusone may understand the observed co-existence of SC with AF ordering in (Ba1−xKx)Fe2As2
by phase separation in magnetic non-superconducting and non-magnetic superconductingmesoscopic domains. Local probes such as µSR and 57Fe-Mößbauer spectroscopy can providemore accurate information. Recently, three reports about µSR experiments, each conductedwith almost optimally doped superconducting (Ba1−xKx)Fe2As2 single crystals, concludedconsistently phase separations into SC and AF domains. The non-magnetic superconductingvolume fractions were found to be ≈30% [15], 40% [16] and 25% [17]. In the latter report, thelateral scale of the inhomogeneities was estimated to 65 ± 10 nm by magnetic force microscopy(MFM) imaging. However, the onset of AF ordering in the superconducting crystals wasdetected at ≈70–80 K, irrespective of different doping levels.
In the present paper, we report on a detailed study of the structural and magnetic transitionsof polycrystalline underdoped (Ba1−xKx)Fe2As2 (x 6 0.4). The samples were characterized bymagnetic susceptibility and specific heat measurements. The crystal structures and chemicalcompositions were determined by Rietveld refinements of x-ray powder patterns. Detailedtemperature-dependent 57Fe-Mößbauer spectra were recorded in order to detect the evolutionof magnetic ordering on a local spatial scale.
2. Experimental
2.1. Sample preparation
Samples of (Ba1−xKx)Fe2As2 with x = 0.1, 0.2 and 0.3 were prepared by heating stoichiometricmixtures of the elements (all purities >99.9%) in alumina crucibles enclosed in silica tubesunder an atmosphere of purified argon. In order to minimize the loss of potassium by evaporationat elevated temperatures, the gas volume in the crucibles was reduced by alumina inlays. Themixtures were heated slowly (50 K h−1) to 873 K, kept at this temperature for 15 h and cooleddown to room temperature. The reaction products were homogenized in an agate mortar and
New Journal of Physics 11 (2009) 025014 (http://www.njp.org/)

4
annealed at 923 K for 15 h. After cooling, the samples were homogenized again, pressed intopellets and sintered at 1023 K for 15 h. The obtained black crystalline powders are stable in airfor weeks. The Ba : K ratios were checked by EDX and chemical analysis (ICP-AAS), whichresulted in the nominal composition within 5%.
2.2. X-ray structure determination
Phase purity was checked by x-ray powder diffraction using a Huber G670 Guinier imagingplate diffractometer (Cu-Kα1 radiation, Ge-111 monochromator), equipped with a closed-cycle He-cryostat. Rietveld refinements of all diffractograms were performed with the TOPASpackage [18] using the fundamental parameters approach as reflection profiles (convolutionof appropriate source emission profiles with equatorial and axial instrument contributions aswell as crystallite microstructure effects). In order to obtain crystal structures inclusive of theBa : K ratios, all profile contributions were refined freely, but in order to obtain accurate latticeparameter changes, all profile contributions were refined at room temperature and held constantfor all other temperatures (except for the Lorentzian strain contribution). All diffractogramswere measured without an internal standard, so the absolute lattice parameters might be slightlyoffset. In all cases, an empirical 2θ -dependent intensity correction for different absorptionlengths arising from the Guinier geometry setup was applied.
2.3. Magnetic susceptibility and specific heat
The magnetic properties were studied using a commercial SQUID magnetometer (QuantumDesign MPMS-5). The heat capacity was measured in a Quantum Design Physical PropertyMeasurement System for temperatures from 1.8 to 300 K and magnetic fields up to 9 T.
2.4. Mößbauer spectroscopy
A 57Co/Rh source was available for the 57Fe-Mößbauer spectroscopy investigations. Thesamples were placed in thin-walled PVC containers at a thickness of about 10 mg Fe cm−2. Themeasurements were run in the usual transmission geometry in the temperature range from roomtemperature to 4.2 K. The source was kept at room temperature. The total counting times perspectrum ranged between 5 h and 1 day.
3. Results and discussion
3.1. Crystal structures and phase transitions
The crystal structures were determined by x-ray powder diffraction. Figure 1 shows thex-ray powder patterns of (Ba1−xKx)Fe2As2 (x = 0.1, 0.2, 0.3) at 300 K with Rietveld-fits andthe difference lines. Crystallographic data and selected bond lengths and angles at 300 and10 K, respectively, are compiled in table 1. The temperature dependences of the a and blattice parameters are shown in figure 2. In line with [13], the parameter a of the tetragonalphase decreases with the doping level x , while c increases (not shown). The tetragonal-to-orthorhombic phase transition is strongly affected by the potassium content. The transitiontemperature To decreases to ≈100 K at x = 0.2 and is no longer visible at x = 0.3. Also themagnitude of the distortion, expressed by the differences between a and b at 10 K, decreases
New Journal of Physics 11 (2009) 025014 (http://www.njp.org/)

5
20 40 60 80 100
0
1
2
3
4
5
0
1
2
3
4
0
1
2
2 (deg)
Inte
nsity
(10
4 cou
nts)
100% Ba0.9
K0.1
Fe2As
2
100% Ba0.8
K0.2
Fe2As
2
91% Ba0.7
K0.3
Fe2As
2
9% FeAs
Figure 1. X-ray powder patterns of (Ba1−xKx)Fe2As2 (x = 0.1, 0.2, 0.3) withRietveld profile fits and difference lines.
from 0.73% (x = 0) to 0.70% (x = 0.1) to 0.49% (x = 0.2). Thus with increasing potassiumdoping levels, the structural transition of BaFe2As2 is shifted towards lower temperatures andalso less pronounced. It is no longer present at x = 0.3 (see figure 2).
3.2. dc resistivity
The temperature dependence of the dc resistivity of (Ba1−xKx)Fe2As2 is shown in figure 3. Atthe lowest doping concentration (x = 0.1), the typical SDW anomaly is still visible, but shiftedtowards lower temperatures and less pronounced than in undoped BaFe2As2 [6]. We observe adrop of the resistance below 3 K, associated with a superconducting transition, even though zero
New Journal of Physics 11 (2009) 025014 (http://www.njp.org/)

6
Table 1. Crystal structure data of Ba1−xKxFe2As2 at different temperatures.
x = 0.1 x = 0.2 x = 0.3
Temp. (K) 300 10 300 10 300Space group I 4/mmm Fmmm I 4/mmm Fmmm I 4/mmma (pm) 395.37(1) 560.07(1) 393.95(1) 557.34(1) 392.57(1)b (pm) = a 556.20(1) = a 554.64(1) = ac (pm) 1310.60(1) 1301.35(1) 1318.90(3) 1309.26(3) 1327.02(3)V (nm3) 0.204 87(1) 0.405 38(1) 0.204 69(1) 0.404 72(1) 0.204 51(1)Z 2 4 2 4 2Data points 17 401 17 401 17 401 17 401 17 501Reflections 46 70 46 70 46d range 1.012–6.553 1.006–6.507 1.009–6.595 1.005–6.546 1.007–6.635RP , wRP 0.0153, 0.0211 0.0154, 0.0210 0.0158, 0.0217 0.0172, 0.0229 0.0146, 0.0192RBragg, χ2 0.0121, 1.319 0.0132, 1.308 0.0123, 1.190 0.0117, 1.222 0.0076, 1.212
K, Ba 2a (0,0,0) 2a (0,0,0) 2a (0,0,0) 2a (0,0,0) 2a (0,0,0)Uiso = 119(4) Uiso = 45(4) Uiso = 173(7) Uiso = 117(8) Uiso = 181(6)
Fe 4d ( 12 , 0, 1
4 ) 8 f ( 14 , 1
4 , 14 ) 4d ( 1
2 , 0, 14 ) 8 f ( 1
4 , 14 , 1
4 ) 4d ( 12 , 0, 1
4 )Uiso = 114(4) Uiso = 43(4) Uiso = 156(7) Uiso = 102(8) Uiso = 58(5)
As 4e (0, 0, z) 8i (0, 0, z) 4e (0, 0, z) 8i (0, 0, z) 4e (0, 0, z)z = 0.3547(1) z = 0.3538(1) z = 0.3545(1) z = 0.3537(1) z = 0.3545(1)Uiso = 147(4) Uiso = 57(4) Uiso = 129(7) Uiso = 72(8) Uiso = 79(5)
K : Ba ratio 14(1) : 86(1) 13(1) : 87(1) 20(1) : 80(1) 20(1) : 80(1) 24(1) : 76(1)Lengths (pm):
Ba–As 338.3(1) × 8 337.0(1) × 4 338.3(1) × 8 337.0(1) × 4 337.7(1) × 8338.6(1) × 4 338.2(1) × 4
Fe–As 240.6(1) × 4 239.1(1) × 4 240.4(1) × 4 238.9(1) × 4 240.8(1) × 4Fe–Fe 279.6(1) × 4 278.1(1) × 2 278.6(1) × 4 277.3(1) × 2 277.6(1) × 4
280.0(1) × 2 278.7(1) × 2Angles (deg):
As–Fe–As 110.5(1) × 2 111.2(1) × 2 110.1(1) × 2 110.7(1) × 2 109.2(1) × 2109.0(1) × 4 108.9(1) × 2 109.2(1) × 4 109.0(1)×2 109.6(1) × 4
108.3(1) × 2 108.6(1) × 2
resistance could not be reached at 1.8 K. The curvature of the resistivity of (Ba0.8K0.2)Fe2As2 isstill reminiscent of an SDW anomaly, but smeared over a larger temperature range between≈120 and 70 K. The superconducting transition at 24 K is rather broad (≈4 K), but zeroresistance is clearly observed at 23 K. At the higher doping level x = 0.3, the resistivity showsno indications of the SDW anomaly and superconductivity emerges at Tc = 33 K.
3.3. Magnetic susceptibility
Field-cooled (FC) and zero-field cooled (ZFC) cycles of the static magnetic volumesusceptibility are shown as a function of temperature in a magnetic field of 5 Oe in figure 4.Estimating the superconducting volume fractions for x = 0.2 and 0.4 from the ZFC valueat 1.8 K as 0.93 and 0.94, respectively, bulk SC is evidently present. The FC values at
New Journal of Physics 11 (2009) 025014 (http://www.njp.org/)

7
003052002051001050
355
455
555
655
755
855
955
065
165
265aB(
1−xK
xeF)
2sA
2
Latti
ce p
aram
eter
(pm
)
)K( erutarepmeT
x 0 = x 1.0 = x 2.0 = x 3.0 =
Figure 2. Lattice parameters of (Ba1−xKx)Fe2As2 (x = 0, 0.1, 0.2, 0.3). Thetetragonal parameters are multiplied by
√2 for comparison.
003052002051001050
0.0
5.0
0.1
aB(x–1K
XeF)
2sA
2
x 1.0 = x 2.0 = x 3.0 =
R (
mΩ
cm
)
)K( erutarepmeT
Figure 3. Temperature dependence of the dc resistivity of (Ba1−xKx)Fe2As2
(x = 0.1, 0.2, 0.3).
1.8 K amount to 1 and 64%, respectively. The corresponding temperatures, where 10% ofthe maximum shielding is reached, are Tc = 23.6 and 37.5 K for these two doping levels. Forthe sample with x = 0.1 bulk SC cannot be established, but the sample becomes diamagneticbelow 5 K in the ZFC cycle as shown in figure 4(a). The constant positive contribution to thesusceptibility may be due to ferromagnetic impurities. Therefore, we measured the complexac-volume susceptibility χac = χ ′ + iχ ′′ for x = 0.1 with Hac = 0.5 Oe and f = 33 Hz (see insetof figure 4(a)) and found that the sample exhibits a diamagnetic signal in χ ′ already below11 K. Assuming that this diamagnetic signal is due to the onset of SC in the sample, this onsetis strongly influenced by very weak external fields and points to a strong competition of SC andmagnetism.
New Journal of Physics 11 (2009) 025014 (http://www.njp.org/)

8
0 10 20 30 40–1.0
–0.5
0.0
–1.0
–0.5
0.0
–0.01
0.00
0.01
0 10 200
–0.05
0.00
TC=37.5 K
(c)ZFC
T (K)
x=0.4
FC
TC=23.6 K
(b)ZFC
FC
x=0.2
Vol
ume
susc
eptib
ility
4πχ
ZFCFC
x=0.1(a)
5 K
11 K
χ’’
HAC
= 0.5 Oe
fAC
= 33 Hz
4πχ ’
,4πχ
’’
χ’
Figure 4. Static volume susceptibility 4πχ = 4π M/H for x = 0.1, 0.2 and 0.4in a magnetic field of 5 Oe for FC and ZFC cycles. Inset: real and imaginary partsof the ac volume susceptibility 4πχac measured at Hac = 0.5 Oe and f = 33 Hz.
3.4. Specific heat
In figure 5 we show the temperature dependence of the specific heat for the optimally dopedsample with x = 0.4. In the inset C p/T is plotted as a function of temperature for zero magneticfield and a field of 9 T. Both curves are on top of each other above and below the superconductingtransition. Tc in zero field is 37.3 K by the entropy conserving construction shown in the inset offigure 5. The change of the specific heat at the transition is estimated as 1C |T c = 0.1 J mol K−1,which is in good agreement with other reported values [19]–[21]. Tc is shifted by only 1 K ina field of 9 T reflecting the large upper critical fields, which were estimated as 70 T or evenhigher [20], [22]–[24].
The specific heat for the underdoped samples with x = 0.1 and 0.2 is plotted as a functionof temperature in figure 6. For x = 0.1 one can clearly see a broad peak with a maximum atTo = 132 K, which is in agreement with the structural and magnetic transitions.
The low-temperature C/T data for the sample with x = 0.1 reveal the onset of a phasetransition at Tons = 4.4 K (inset of figure 6), which is completely suppressed in a magnetic fieldof 9 T. This temperature is in agreement with the appearance of diamagnetism as indicated infigure 4(a) and the appearance of a resistivity drop and therefore can be ascribed to the onset
New Journal of Physics 11 (2009) 025014 (http://www.njp.org/)

9
0 50 100 150 200 250 3000
20
40
60
80
100
120
TC=37.3 K
Ba0.6
K0.4
Fe2As
2
Cp (
J m
ol–1
K–1
)
T (K)
34 36 38 40 42
0.65
0.70
0.75
TC=37.3 K
0 T 9 T
C p/T
(J
mol
K–2
)
Figure 5. Specific heat of Ba0.6K0.4Fe2As2. Inset: comparison of C/T versustemperature in magnetic fields of 0 and 9 T. The lines are to guide the eyes.
0 50 100 1500
40
80
120 Ba1–x
KxFe
2As
2
x=0.1 in 0 T x=0.1 in 9 T x=0.2
T =132 K
Cp (
J m
ol–1
K–1
)
T (K)
0 5 10
50
60
70
Tons
= 4.4 K
Cp/T
(m
J m
ol–1
K–2
)
O
Figure 6. Comparison of C versus T for x = 0.1 and 0.2. Inset: comparison ofC/T versus T in magnetic fields of 0 and 9 T for x = 0.1 to reveal the onset ofthe superconducting transition and its suppression in a magnetic field of 9 T. Thesolid lines are to guide the eyes.
of SC. Hence, a superconducting and an AF transition are observable for x = 0.1, suggesting astrong competition of magnetic fluctuations and SC. However, one must keep in mind that bulkSC could not be established from susceptibility measurements and zero resistivity is not reachedat 1.8 K.
Astonishingly, we could not detect any clearly visible anomaly for the sample with x = 0.2,where bulk SC is evident from figure 4(a) below Tc = 23.6 K and the structural transitionoccurs at To = 105 K. In figure 7 we compare C/T versus T for these two concentrations andindicate the known transition temperatures for both compounds. While at around To = 105 K,
New Journal of Physics 11 (2009) 025014 (http://www.njp.org/)

10
0 50 100 150 2000.0
0.5
1.0
TC=23.6 K
5 K
TO=105 K
TO=132 K Ba
1–xK
xFe
2As
2
Cp/T
(J
mol
–1K
–2)
T (K)
0 500
50
x=0.1 in 0 T x=0.1 in 9 T x=0.2 x=0.4
Cp/T
(m
J m
ol–1
K–2
) T 2 (K2)
Figure 7. Comparison of C/T versus T for x = 0.1 and 0.2. The dashed line isa guide for the eye. Inset: Comparison of C/T versus T 2 for x = 0.1 (0 and 9 T)and x = 0.2, 0.4 at lowest temperatures. The solid and dashed lines are linear fitsdescribed in the text.
an extremely broadened transition region between about 80 and 140 K may be visualized byguiding the eye with a linear extrapolation of the high-temperature behavior, a correspondinganomaly at the superconducting transition is not detectable in our data. The low-temperaturedata for all three concentrations x = 0.1 (in 0 and 9 T) and x = 0.2, 0.4 are plotted as C/Tversus T 2. We fitted the data for x = 0.1 at 9 T and for x = 0.2, 0.4 in zero magnetic fieldwith linear behavior and extracted Sommerfeld coefficients of γ = 47, 5.6, 2.8 mJ mol K−2 andDebye temperatures 2D = 418, 238, 260 K, respectively (solid lines in the inset of figure 7).The values for γ and 2D for x = 0.2 and 0.4 are very close to each other and significantlylower than the values for x = 0.1. This reflects the superconducting low-temperature statefor x = 0.2 and 0.4, which is fully suppressed for x = 0.1 in a magnetic field of 9 T. Notethat the value γ = 47 mJ mol K−2 and 2D = 418 K may contain a magnetic-field-dependentcontribution, because a linear fit (dashed line in the inset of figure 7) of the data above 5 Kin zero field yield somewhat lower values of γ = 39 mJ mol K−2 and 2D = 283 K.
3.5. 57Fe-Mößbauer spectroscopy
57Fe-Mößbauer spectroscopy is an excellent local probe for the determination of magneticordering in iron compounds. In comparison with other experimental methods, Mößbauerspectroscopy studies of the new superconductors are rather rare. So far LaFePO [25],LaFeAsO [26]–[29], SrFeAsF [30], BaFe2As2 [6], SrFe2As2 [31] and EuFe2As2 [32] have beeninvestigated. Since the formation of binary iron phosphide or arsenide impurities can seriouslyaffect the property measurements, 57Fe-Mößbauer spectroscopy can also be a useful analyticaltool to detect iron impurity phases. The influence of Fe2As, FeAs and FeAs2 on the SDWtransitions and the superconducting properties has been studied systematically [33]. First wediscuss the spectra of BaFe2As2 and KFe2As2. In our earlier report on the SDW anomalyof BaFe2As2, 57Fe-Mößbauer spectra had only been recorded at 298, 77 and 4.2 K [6]. We
New Journal of Physics 11 (2009) 025014 (http://www.njp.org/)
11
2%2%
2%1%
n/%
oissimsnart
evital eR
Velocity/mm s–1
1%1%
1%1%
–2 –1 0 1 2 –2 –1 0 1 2 –2 –1 0 1 2
2%2%
1%2%
4.2 K
77 K
95 K
110 K
138 K
140 K
155 K
298 K
130 K
132 K
134 K
136 K
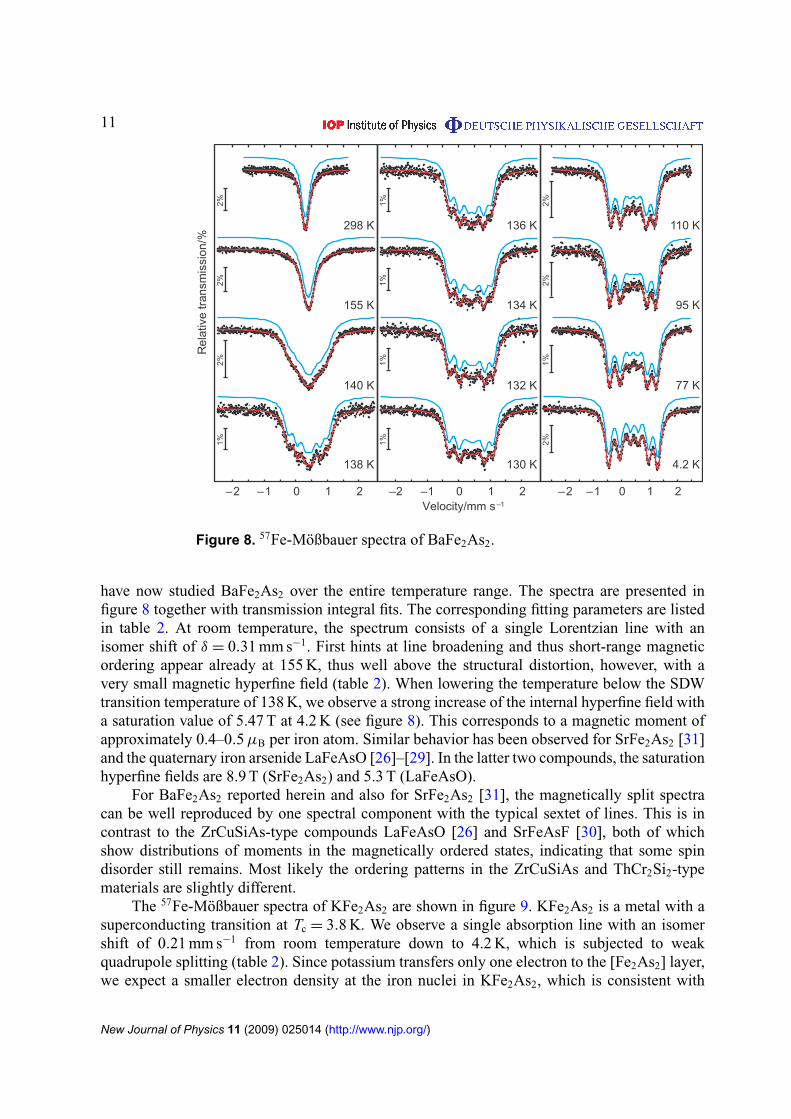
Figure 8. 57Fe-Mößbauer spectra of BaFe2As2.
have now studied BaFe2As2 over the entire temperature range. The spectra are presented infigure 8 together with transmission integral fits. The corresponding fitting parameters are listedin table 2. At room temperature, the spectrum consists of a single Lorentzian line with anisomer shift of δ = 0.31 mm s−1. First hints at line broadening and thus short-range magneticordering appear already at 155 K, thus well above the structural distortion, however, with avery small magnetic hyperfine field (table 2). When lowering the temperature below the SDWtransition temperature of 138 K, we observe a strong increase of the internal hyperfine field witha saturation value of 5.47 T at 4.2 K (see figure 8). This corresponds to a magnetic moment ofapproximately 0.4–0.5 µB per iron atom. Similar behavior has been observed for SrFe2As2 [31]and the quaternary iron arsenide LaFeAsO [26]–[29]. In the latter two compounds, the saturationhyperfine fields are 8.9 T (SrFe2As2) and 5.3 T (LaFeAsO).
For BaFe2As2 reported herein and also for SrFe2As2 [31], the magnetically split spectracan be well reproduced by one spectral component with the typical sextet of lines. This is incontrast to the ZrCuSiAs-type compounds LaFeAsO [26] and SrFeAsF [30], both of whichshow distributions of moments in the magnetically ordered states, indicating that some spindisorder still remains. Most likely the ordering patterns in the ZrCuSiAs and ThCr2Si2-typematerials are slightly different.
The 57Fe-Mößbauer spectra of KFe2As2 are shown in figure 9. KFe2As2 is a metal with asuperconducting transition at Tc = 3.8 K. We observe a single absorption line with an isomershift of 0.21 mm s−1 from room temperature down to 4.2 K, which is subjected to weakquadrupole splitting (table 2). Since potassium transfers only one electron to the [Fe2As2] layer,we expect a smaller electron density at the iron nuclei in KFe2As2, which is consistent with
New Journal of Physics 11 (2009) 025014 (http://www.njp.org/)

12
Table 2. Fitting parameters of the 57Fe-Mößbauer spectroscopic measurementsof BaFe2As2, Ba0.9K0.1Fe2As2, Ba0.8K0.2Fe2As2 and KFe2As2 at differenttemperatures.
BaFe2As2
T δ1 1EQ1 01 Bhf
(K) (mm s−1) (mm s−1) (mm s−1) (mm s−1)
298 0.31(1) 0.00(1) 0.32(1) –155 0.40(1) −0.06(22) 0.46(1) 0.37(58)145 0.41(1) −0.02(1) 0.30 1.79(9)140 0.40(1) −0.02(1) 0.39(4) 3.80(7)138 0.40(1) −0.02(1) 0.33(3) 3.93(4)136 0.40(1) −0.03(1) 0.32(2) 4.12(3)134 0.40(1) −0.02(1) 0.40(4) 4.16(3)132 0.41(1) −0.03(1) 0.38(3) 4.31(3)130 0.41(1) −0.02(1) 0.46(6) 4.37(2)125 0.41(1) −0.03(1) 0.48(6) 4.62(2)110 0.42(1) −0.02(1) 0.47(7) 5.16(1)77 0.43(1) −0.03(1) 0.33(2) 5.23(1)4.2 0.44(1) −0.04(1) 0.25(1) 5.47(1)
(Ba0.9K0.1)Fe2As2
T δ1 1EQ1 01 Bhf δ2 1EQ2 02 A1/A2(K) (mm s−1) (mm s−1) (mm s−1) (mm s−1) (T) (mm s−1) (mm s−1) (mm s−1)
298 0.30(1) −0.06(1) 0.28(1)160 0.40(1) −0.04(2) 0.32(1)148 0.38(1) −0.06(2) 0.32 3.32(8) 0.40(1) – 0.30 28 : 72146 0.41(1) −0.02(1) 0.32 3.46(3) 0.39(1) – 0.30 34 : 66144 0.39(1) −0.02(1) 0.32(1) 3.52(5) 0.39(1) – 0.30 46 : 54142 0.40(1) −0.03(1) 0.33(1) 3.64(2) 0.40(1) – 0.30 66 : 34141 0.39(1) −0.01(1) 0.30(1) 3.61(2) 0.39(1) – 0.30 71 : 29138 0.39(1) −0.03(1) 0.39(1) 3.78(2) 0.38(1) – 0.30 91 : 9136 0.40(1) −0.02(1) 0.37(1) 3.91(3) 0.38(1) – 0.30 96 : 4124 0.40(1) −0.03(1) 0.29(1) 4.58(1)120 0.40(1) −0.03(1) 0.28(1) 4.65(1)118 0.41(1) −0.03(1) 0.29(1) 4.72(1)116 0.41(1) −0.03(1) 0.28(1) 4.77(1)114 0.41(1) −0.03(1) 0.28(1) 4.79(1)112 0.41(1) −0.02(1) 0.28(1) 4.81(1)110 0.41(1) −0.02(1) 0.27(1) 4.86(1)77 0.42(1) −0.03(1) 0.27(1) 5.22(1)50 0.44(1) −0.03(1) 0.31(1) 5.46(2)30 0.45(1) −0.04(1) 0.36(1) 5.55(2)4.2 0.44(1) −0.04(1) 0.36(1) 5.57(2)
New Journal of Physics 11 (2009) 025014 (http://www.njp.org/)

13
(Ba0.8K0.2)Fe2As2
T δ1 1EQ1 01 Bhf δ2 1EQ2 02 A1/A2(K) (mm s−1) (mm s−1) (mm s−1) (mm s−1) (T) (mm s−1) (mm s−1) (mm s−1)
298 0.30(1) −0.09(1) 0.28(1)130 0.39(1) 0.00(1) 0.34(1)110 0.42(1) −0.02(1) 0.26(2) 3.54(7) 0.39(1) – 0.33 37 : 63108 0.40(1) −0.03(1) 0.28(2) 3.54(6) 0.41(1) – 0.33 45 : 55106 0.40(1) −0.03(1) 0.29(2) 3.61(6) 0.41(1) – 0.33 52 : 48104 0.40(1) −0.02(1) 0.30(2) 3.46(5) 0.40(1) – 0.33 61 : 39102 0.40(1) −0.02(1) 0.30(2) 3.46(4) 0.40(1) – 0.33 72 : 28100 0.39(1) −0.02(1) 0.29(1) 3.57(3) 0.40(1) – 0.33 79 : 2198 0.40(1) −0.02(1) 0.29(1) 3.61(1) 0.39(1) – 0.33 90 : 1096 0.40(1) −0.02(1) 0.28(1) 3.65(2) 0.37(1) – 0.33 96 : 494 0.40(1) −0.02(1) 0.27(3) 3.72(4)77 0.41(1) −0.02(1) 0.29(3) 4.25(2)50 0.43(1) −0.03(1) 0.33(4) 4.85(1)30 0.43(1) −0.04(1) 0.30 5.07(3)4.2 0.43(1) −0.04(1) 0.31(3) 5.07(2)
KFe2As2
T δ1 1EQ1 01
(K) (mm s−1) (mm s−1) (mm s−1)
298 0.21(1) −0.03(11) 0.39(1)77 0.33(1) −0.08(1) 0.334.2 0.34(1) −0.09(4) 0.40(2)
Numbers in parentheses are the statistical errors in the last digit. Values without standard deviations were keptfixed during the fitting procedure. (δ), isomer shift; (0), experimental line width; (1EQ), quadrupole splittingparameter; (Bhf), magnetic hyperfine field. A1/A2 is the ratio of the signals.
lower isomer shift compared to BaFe2As2 [6] and SrFe2As2 [31]. From this it is evident that thepotassium doping affects the electronic situation of the iron atoms.
The potassium-doped samples (Ba1−xKx)Fe2As2 with x = 0.1 and 0.2 show strikinglydifferent temperature dependences of the 57Fe-Mößbauer spectra, shown in figures 10 and 11.In the temperature ranges 148–136 K (x = 0.1) and 110–96 K (x = 0.2), the spectra showsuperpositions of one magnetically split and one unsplit component. The non-magneticcomponents rapidly diminish within small temperature ranges (≈10 K). Below 136 and 96 K,respectively, the spectra of (Ba0.9K0.1)Fe2As2 and (Ba0.8K0.2)Fe2As2 can be well reproducedby one single magnetically split signal. These magnetic transition temperatures are veryclose to the structural transition temperatures extracted from the x-ray data. Similar to pureBaFe2As2, the magnetic hyperfine fields increase with decreasing temperature. BaFe2As2 and(Ba0.9K0.1)Fe2As2 show almost similar hyperfine fields of ≈5.5 T at 4.2 K (table 2), while adecrease of Bhf by 10% is observed for (Ba0.8K0.2)Fe2As2.
New Journal of Physics 11 (2009) 025014 (http://www.njp.org/)

14
–2 –1 0 1 2
Velocity/mm s–1
4%4%
4%
%/noissi
msnartevitale
R
298 K
77 K
4.2 K
Figure 9. 57Fe-Mößbauer spectra of KFe2As2.
Table 3. Fitting parameters of the 57Fe-Mößbauer spectroscopic measurementsof (Ba0.8K0.2)Fe2As2 and (Ba0.7K0.3)Fe2As2 at 4.2 K.
T δ1 1EQ1 01
(K) (mm s−1) (mm s−1) (mm s−1)
(Ba0.7K0.3)Fe2As2 4.2 0.41(1) −0.02* 0.47(1)(Ba0.6K0.4)Fe2As2 4.2 0.39(1) −0.10(1) 0.35(1)
These findings suggest that the spectra of the underdoped compounds (x = 0.1 and 0.2)are caused by temperature-dependent superpositions of paramagnetic and antiferromagneticallyordered domains. This reflects a chemical inhomogeneity of the Ba/K distribution, wherethe unsplit components represent domains with higher potassium content and lower Néeltemperatures and vice versa. This is in agreement with the smaller isomer shifts of the unsplitsignals, which indicate higher doping. On cooling, more domains get magnetically ordered untilthe paramagnetic fractions are completely consumed. Thus we see no distinct phase separation,but a continuous (narrow) distribution of the potassium concentration. Since no paramagneticcomponent exists below ≈136 and ≈96 K, respectively, we observe homogenous co-existenceof AF magnetic ordering with superconductivity in (Ba1−xKx)Fe2As2 at x = 0.1 and 0.2.
New Journal of Physics 11 (2009) 025014 (http://www.njp.org/)

15
142 K
141 K
138 K
136 K
124 K2%
2%2%
1%2%
120 K
110 K
77 K
30 K
4.2 K
Velocity/mm s–1
2%2%
2%2%
2%
–2 –1 0 1 2–2 –1 0 1 2–2 –1 0 1 2
4%4%
4%4%
%4
298 K
160 K
148 K
146 K
144 K
%/noissi
msnartevitale
R
Figure 10. 57Fe-Mößbauer spectra of (Ba0.9K0.1)Fe2As2.
A further increase of doping again radically changes the 57Fe-Mößbauer spectra. Figure 12shows the spectra of (Ba0.7K0.3)Fe2As2 (Tc = 33 K) and (Ba0.6K0.4)Fe2As2 (Tc = 38 K) recordedat 4.2 K together with transmission integral fits. The fitting parameters are listed in table 3. Inboth cases we observe only unsplit absorption lines, which can be fitted by one componentwithout any magnetic hyperfine field. The line width is slightly increased in comparison withundoped BaFe2As2, hinting at a small inhomogeneity of the Ba/K concentrations. Thus, incontrast to the completely magnetically ordered phase detected at x = 0.2, we find the phasesat x = 0.3 and 0.4 to be completely non-magnetic at low temperatures. This is in line withthe absence of lattice distortions, since both compounds keep the tetragonal structure at lowtemperatures (see figure 2 and [13]).
4. Conclusion
In summary, we have studied the doping dependences of the physical properties of(Ba1−xKx)Fe2As2 in the underdoped region. The SDW anomaly connected with a structuralphase transition is continuously suppressed by increasing doping concentrations and nolonger observed in (Ba0.7K0.3)Fe2As2. Specific heat measurements reveal a smearing of the
New Journal of Physics 11 (2009) 025014 (http://www.njp.org/)

16
4%4%
2%2%
2%298 K
130 K
110 K
108 K
106 K
Velocity/mm s–1
2%2%
2%2%
2%
104 K
102 K
100 K
98 K
96 K
–2 –1 0 1 2 –2 –1 0 1 2 –2 –1 0 1 2
2%1%
1%2%
2%
94 K
77 K
50 K
30 K
4.2 K
%/noissi
msnartevitale
R
Figure 11. 57Fe-Mößbauer spectra of (Ba0.8K0.2)Fe2As2.
phase transitions over larger temperature ranges in the underdoped samples, but no SDWanomaly in the optimally doped compounds. This is in agreement with the structural data.Bulk SC was detected in all samples except (Ba0.9K0.1)Fe2As2. 57Fe-Mößbauer spectra of theunderdoped compounds (Ba0.9K0.1)Fe2As2 and (Ba0.8K0.2)Fe2As2 show temperature-dependentsuperpositions of paramagnetic and antiferromagnetically ordered domains, which reflectchemical inhomogeneities of the Ba/K distributions resulting in different Néel temperaturesof the domains. At lower temperatures, more domains get magnetically ordered until theparamagnetic fractions are completely consumed. Thus we see no distinct phase separation,but a continuous distribution of the potassium concentration. No paramagnetic component isobserved in (Ba0.8K0.2)Fe2As2 below Tc (24 K), suggestive of the co-existence of SC and AFordering. Only at higher doping levels (x = 0.3) are the magnetic and structural phase transitionscompletely suppressed and SC reaches the highest Tc.
Our results contradict recent reports on mesoscopic phase separations in AFordered and non-magnetic SC regions in single crystals of almost optimally doped(Ba1−xKx)Fe2As2 [15]–[17]. In the polycrystalline material studied here, the structuraldistortion and AF ordering are definitely absent already at x = 0.3. The origin of magneticallyordered fractions detected in almost optimally doped single crystals of (Ba0.6K0.4)Fe2As2 withhigh Tc may either be attributed to a strongly inhomogeneous potassium distribution caused by
New Journal of Physics 11 (2009) 025014 (http://www.njp.org/)

17
Figure 12. 57Fe-Mößbauer spectra of (Ba0.7K0.3)Fe2As2 and (Ba0.6K0.4)Fe2As2
at 4.2 K.
uncontrolled single crystal growth or by magnetic impurity phases such as FeAs with a Néeltemperature of 77 K [34].
Acknowledgments
It is a pleasure to thank E-W Scheidt and C Kant for fruitful discussions and A Pimenovafor technical support. We acknowledge support by the BMBF via contract number VDI/EKM13N6917 and by the DFG via SFB 484 (Augsburg) and project Jo257/5-1 (München).
References
[1] Kamihara Y, Watanabe T, Hirano M and Hosono H 2008 J. Am. Chem. Soc. 130 3296–7[2] Rotter M, Tegel M and Johrendt D 2008 Phys. Rev. Lett. 101 107006[3] Ren Z et al 2008 Chin. Phys. Lett. 25 2215[4] Johrendt D and Pöttgen R 2008 Angew. Chem., Int. Edn Engl. 47 4782[5] de la Cruz C et al 2008 Nature 453 899[6] Rotter M, Tegel M, Johrendt D, Schellenberg I, Hermes W and Pöttgen R 2008 Phys. Rev. B 78 020503[7] Luetkens H et al 2008 arXiv:0806.3533[8] Huang Q, Qiu Y, Bao W, Lynn J, Green M, Chen Y, Wu T, Wu G and Chen X 2008 Phys. Rev. B 78 054529[9] Zhao J et al 2008 Nat. Mater. 7 953
New Journal of Physics 11 (2009) 025014 (http://www.njp.org/)

18
[10] Drew A J et al 2008 arXiv:0807.4876[11] Margadonna S, Takabayashi Y, McDonald M T, Brunelli M, Wu G, Liu R, Chen X H and Prassides K 2009
Phys. Rev. B 79 014503[12] Keimer B et al 1992 Phys. Rev. B 46 14034[13] Rotter M, Pangerl M, Tegel M and Johrendt D 2008 Angew. Chem., Int. Edn Engl. 47 7949[14] Chen H et al 2009 Europhys. Lett. 85 17006[15] Aczel A A et al 2008 arXiv:0807.1044[16] Goko T et al 2008 arXiv:0808.1425[17] Park J T et al 2008 arXiv:0811.2224[18] Cheary R W, Coelho A A and Cline J P 2004 J. Res. Natl Inst. Stand. Technol. 109 1[19] Ni N et al 2008 Phys. Rev. B 78 014507[20] Welp U, Xie R, Koshelev A E, Kwok W K, Luo H Q, Wang Z S, Mu G and Wen H H 2008 arXiv:0810.1944[21] Mu G, Luo H, Wang Z, Ren Z, Shan L, Ren C and Wen H-H 2008 arXiv:0812.1188[22] Wang Z S, Luo H-Q, Ren C and Wen H-H 2008 Phys. Rev. B 78 140501[23] Yuan H Q, Singleton J, Balakirev F F, Baily S A, Chen G F, Luo J L and Wang N L X 2009 Nature 457 565[24] Altarawneh M, Collar K, Mielke C H, Ni N, Bud’ko S L and Canfield P C 2008 Phys. Rev. B 78 220505[25] Tegel M, Schellenberg I, Pöttgen R and Johrendt D 2008 Z. Naturforsch. B 63 1057[26] Kitao S, Kobayashi Y, Higashitanguchi S, Saito M, Kamihara Y, Hirano M, Mitsiu T, Hosono H and Seto M
J. Phys. Soc. Japan[27] Klauss H H et al 2008 Phys. Rev. Lett. 101 077005[28] Nowik I, Felner I, Awana V P S, Vajpayee A and Kishan H 2008 J. Phys.: Condens. Matter 20 292201[29] McGuire M A et al 2008 Phys. Rev. B 78 094517[30] Tegel M, Johansson S, Weiss V, Schellenberg I, Hermes W, Pöttgen R and Johrendt D 2008 Europhys. Lett.
84 67007[31] Tegel M, Rotter M, Weiss V, Schappacher F M, Pöttgen R and Johrendt D 2008 J. Phys.: Condens. Matter 20
452201[32] Raffius H, Mörsen E, Mosel B D, Müller-Warmuth W, Jeitschko W, Terbüchte L and Vomhof T 1993 J. Phys.
Chem. Solids 54 135[33] Nowik I and Felner I 2008 J. Supercond. Nov. Magn. 21 297[34] Selte K, Kjekshus A and Andresen A F 1972 Acta Chem. Scand. 26 3101
New Journal of Physics 11 (2009) 025014 (http://www.njp.org/)