loxahatchee river watershed restoration project pdt meeting
TRANSCRIPT

Lower East Coast Subregional (LECsR)
North Palm Beach Groundwater ModelStatus Report
South Florida Water Management DistrictDecember 14, 2016

Outline
Overview
Model Updates
Calibration
Recent Activity
What’s Next

Significant Model Changes
Incorporated additional hydrogeologic information obtained from the Mecca property and the L8-FEB/C-51 reservoir sites
Updated control structure operations and weir elevations in Martin County and portions of Palm Beach County
Improved simulation of coastal wellfields
Revised active model domain and wetland assumptions
Updated evapotranspiration, runoff and rainfall distribution

Revised Active Model Domain
Revised Active Model

Additional Model Updates
Updated calibration period
Previous LECsR model calibrated from 1986-2005
Revised calibration is 2006-2014
Calibration period now includes the operations of SFWMD’s G-160 and G-161 Structures
Calibration now incorporates a number of additional wetland, WRAP and groundwater monitoring sites
Add data received for 10 additional wetland observation well sites in the Flowway 3
Included revisions suggested by the Review Team

Additional Model Updates
Seepage losses from the M-Canal accounted for west of the WPB Water Catchment Area
Converted irrigation demands from permitted to climatic driven as calculated from AFSIRS
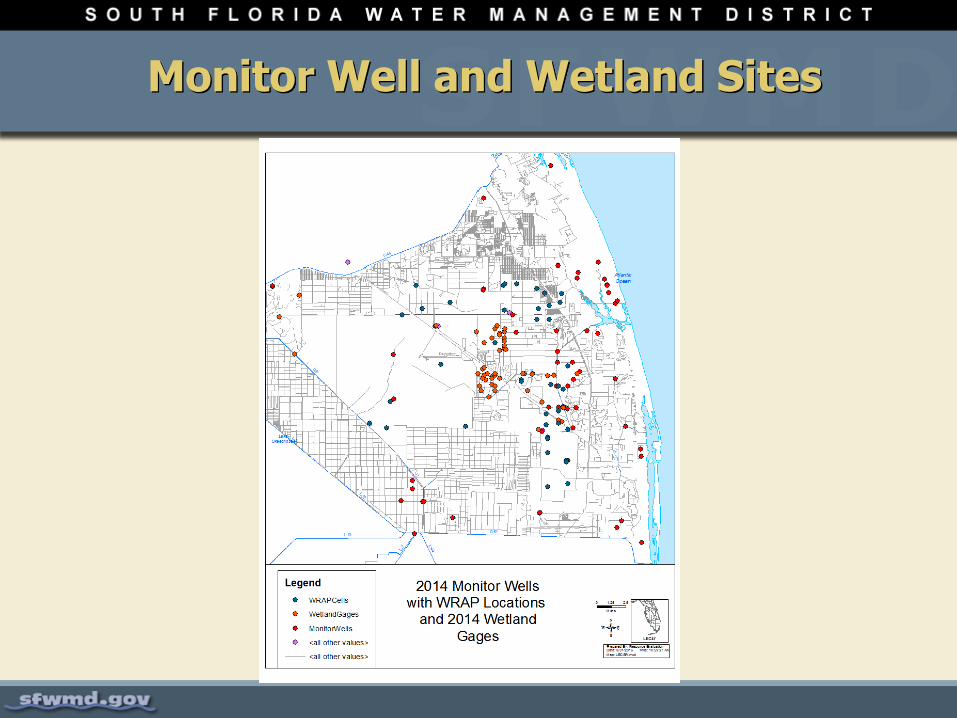
Monitor Well and Wetland Sites

Flow Calibration Statistics

Flow Statistics
Discharge locations:
6 structures within C-18 Watershed
3 structures within Tributary Watersheds
Flows out of L-8 (ITID) Watershed G-160
G-161
LOX
Slough
S-46
C-18W
Lainhart
SIRWCD
NPBCID
Tributaries
to River
River

Flow Statistics
Calibration criteria:
Global statistics for each structure (SFWMD 2006; ASCE, 1993)
Nash-Sutcliffe (NS) > 0.4; indicates accuracy
R2 > 0.4; explains variance
Deviation of volume (DV) < 15%; quantifies volume difference
Qualitative techniques
Daily flow hydrographs
Duration curves
Double mass curves
Water budgets
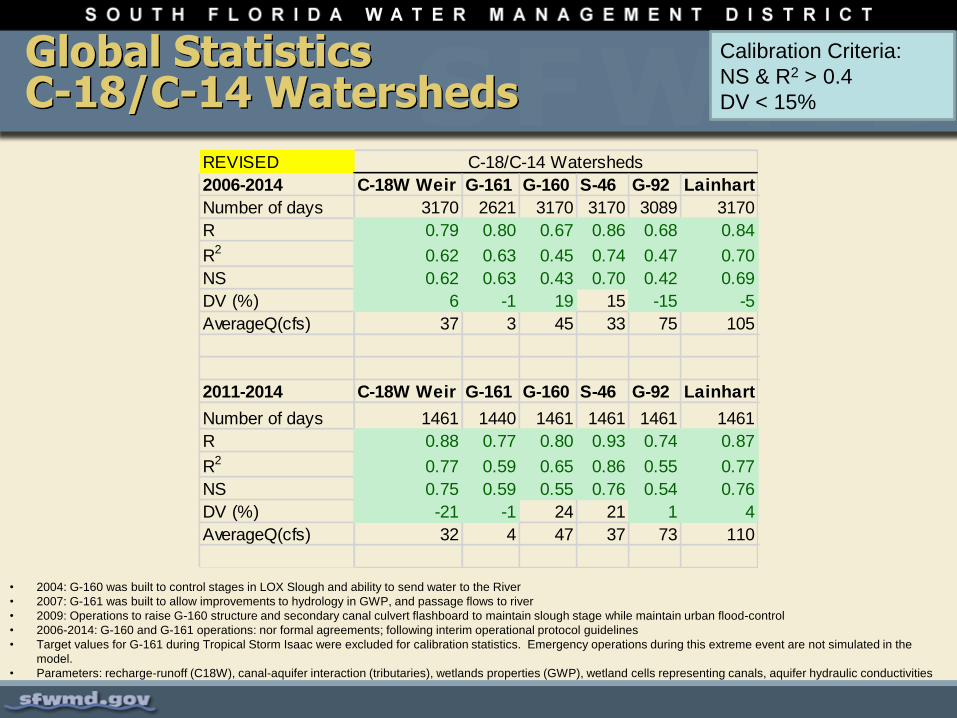
Global StatisticsC-18/C-14 Watersheds
• 2004: G-160 was built to control stages in LOX Slough and ability to send water to the River
• 2007: G-161 was built to allow improvements to hydrology in GWP, and passage flows to river
• 2009: Operations to raise G-160 structure and secondary canal culvert flashboard to maintain slough stage while maintain urban flood-control
• 2006-2014: G-160 and G-161 operations: nor formal agreements; following interim operational protocol guidelines
• Target values for G-161 during Tropical Storm Isaac were excluded for calibration statistics. Emergency operations during this extreme event are not simulated in the
model.
• Parameters: recharge-runoff (C18W), canal-aquifer interaction (tributaries), wetlands properties (GWP), wetland cells representing canals, aquifer hydraulic conductivities
Calibration Criteria:
NS & R2 > 0.4
DV < 15%
REVISED
2006-2014 C-18W Weir G-161 G-160 S-46 G-92 Lainhart
Number of days 3170 2621 3170 3170 3089 3170
R 0.79 0.80 0.67 0.86 0.68 0.84
R2 0.62 0.63 0.45 0.74 0.47 0.70
NS 0.62 0.63 0.43 0.70 0.42 0.69
DV (%) 6 -1 19 15 -15 -5
AverageQ(cfs) 37 3 45 33 75 105
2011-2014 C-18W Weir G-161 G-160 S-46 G-92 Lainhart
Number of days 1461 1440 1461 1461 1461 1461
R 0.88 0.77 0.80 0.93 0.74 0.87
R2 0.77 0.59 0.65 0.86 0.55 0.77
NS 0.75 0.59 0.55 0.76 0.54 0.76
DV (%) -21 -1 24 21 1 4
AverageQ(cfs) 32 4 47 37 73 110
C-18/C-14 Watersheds
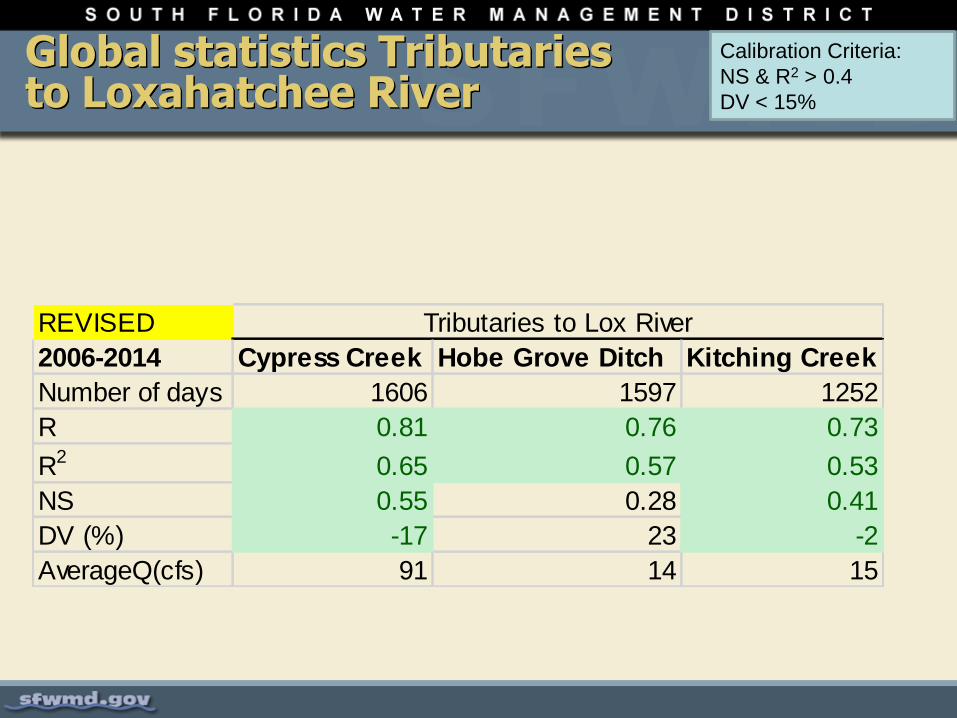
Global statistics Tributaries to Loxahatchee River
Calibration Criteria:
NS & R2 > 0.4
DV < 15%
REVISED
2006-2014 Cypress Creek Hobe Grove Ditch Kitching Creek
Number of days 1606 1597 1252
R 0.81 0.76 0.73
R2 0.65 0.57 0.53
NS 0.55 0.28 0.41
DV (%) -17 23 -2
AverageQ(cfs) 91 14 15
Tributaries to Lox River

Groundwater and Wetland Calibration

Groundwater and Wetland Water Level Calibration
Number of wells between plus/minus 1 foot increased from 92 in September to 114 presently
Number of wells greater than or less than 2 feet decreased from 5 to 1
Between plus or minus 1 - 2 feet dropped from 26 to 17

Overall Water Level Statistics
Mean Absolute Error feet Mean Absolute Error feet
Monitor Wells Wetland Gages
Jun-16 2.1 1.24
Sep-16 0.94 1.02
Oct-16 0.75 0.89

Recent Activity
Assumptions complete
Two 2070 Base Cases required
Separate Future Without Base run to support Alternative 10
Continuing to refine Performance Measure Graphics to present results

Next Steps
Deliver calibration materials
Re-run 2014 and 2070 Base Cases
Incorporate features for each of the 5 alternatives into model
Begin running alternatives in January
Complete modeling in March
Questions?