low frequency dielectric dispersion and microwave permittivities...
TRANSCRIPT
Indian Journal of Radi o & Space Physics Vo l. 34, October 2005, pp. 34 1-348
Low frequency dielectric dispersion and microwave permittivities of Indian granites
R J Sengwa* & A Soni
Microwave Research Laboratory, Department of Physics. J N V Uni vers ity , Jodhpur 342 005, Rajasthan. India
* E-mail : rj sengwa @red iffmail.co m
Recei l'ed 29 April 2004: rel'ised () Jllll e 2005: (Iccepled 4 Jllly 2005
The complex dielectric permitti vity E*(W) = f'- je" of 20 Indian granite samples from various localities in India were studi ed in the low freq uency ra nge 0. 10- 100 kH z and also at microwave frequency, i.e. 10.1 GHz at room temperature. All the studi ed dry samples showed the dielectric dispersion in the low frequency range. These are characteri zed by principal
relaxati on time with Co le-Cole dielectr ic dispersion model. T he va lues of sta tic dielectri c constant Eu ' high frequency limiting dielectri c constant E~ , distri butiun parameter (J., and relaxation time T of these samples were determined from their Co le-Co le plots. The frequency dependent ac conducti vi ty of these granite snmples were also determined and discussed. T he real part of dielectri c constant E'o f dry granite sampl es at I D. I GHz was found to be in the range 4.5-8.3. C lear convincing correlati on was observed between the microwave frequency E' values wi th the samples bu lk densi ty. The p lo t ~ of E' values versus bu lk density of the stud ied granite samples were represented by t .. , I s'raight lines of different slopes. The density reduced microwave permi tti vity va lues E'Jr of granite samples were found ,, ' be: in the range 1.8 1- 1.99. For all the studied granite samples die lectric loss E" was found to be less than O.S at microwaw In.:quency. Microwave permittiviti es of porous samples w ith water saturation were also measured and these va lues were cumpared w ith the permitti vity va lues computed from the dielectri c mi x ing equation. complex refrac ti ve index model and the self-similar model using the microwave permitti vit ies of dry sampl es and water.
Keywords: Dielectri c di spersion, Indian granite, Granite, Microwave permitti vity . Permittivit y PACS No.: 9 1.60.Pn
1 Introduction In dielectric spec troscopy, geo logical mate ri als
have been the subject of frequency dependent dielectric measurements over w ide freq uency ranges due to the ir s ignificant app licat io ns in the ea rt h and planetary sc iences and tech nol ogy development. 1-(,.
The s tudy of freq uency dependen t va lues of di e lectri c constant of dry and water saturated geo logica! materials he lp to understand the behav iour of induced polari zarion 7
, in planning ground penetrating radar 8- 10 I" . surveys , app Icatl o ns to mIcrowave re mo te
sensing l1.l
2, thei r use in time domain re fl ectometry
mcasurcments 13·14
, advancement In dielec tri c modeling of these material s and esti mation of individual contri buti on and inte rac tio n contribution of the sa mple constituents to the microwave diel ectri c constant l5. In rocks and sediments, rea l and imag inary parts of di electric constant can be related to the ir chemical co mposition, density, poros ity, wate r saturation , inhomogene iry, polycrysta llinity , and al so to rock litho logy and co mpo nent geometries and frequency o f the alternating field. In case of geologi c materi als, it tS diff icult to confirm the exact
contribution of each phys ical and petrological parameter of the sample on its measured di electric constant. But comparative di e lectri c study of identi cal class samples he lp in predi cting the major contri bulion of the sample ' s physical and petrologi cal parameters on the ir dielectric value~ .
Earl ier studies 16-18 confirmed that rocks and
mine ral s show the di e lectric di spersion in low f . S t- I 7- 101 6-18 requency regIon. 0 ar severa attempts . were made to ex plo re the die lectri c behaviou r o r d ry and water saturated sandstone samples. It IS because of th' wide variation in g rain-s izes and their d istri bution, and the capacity of suffic ient amount of water absorption in the po res of sandsto ne ~amples . Further, most of the dielectri c modeling of geological material s were tested usi ng the meas ured permittivity values of sandstones. The dielectric studies of vari o u~
d '1 ' . 10 19 - 2~ L ' san stones are Stl j In progress ' ". Iterature survey confirms that fe~ attempts were made to determine the diel ectri c behavi our of gran ite samples in low freq uenc region and also at microwave freq uencies 12.16.23.2-1. Further it seems that so far no
attempts werc made to reveal the comparati ve
342 INDIAN 1 RADIO & SPACE PHYS. OCTOBER 2005
di e lectric behavio ur o f the popular varieties of Indian granites.
In the present paper an attempt has been made to study di e lectri c di spersion of 20 dry g ranite samples or Indian ori g in in the frequency range 0 .1 0-100 kHz and a lso at 10. 1 GHz. These studied granite sampl es wi th the ir locati on and density are recorded in Table I . Thi s low frequency di e lectric study was carri ed out to understand the induced po lari zatio n behaviour o f these hard rocks . Similar to sandstones, the rrequency dependent comparati ve di e lec tri c values of granites can he lp in formulatin g adequate di e lectri c models of geological mate ri a ls. The microwave die lectri c study of these g ranite samples were ca rri ed out mainly to expl ore the dependence o f the ir die lectric constant o n the sampl e's bulk density. Further the effect o n microwave die lectri c constant due to water saturation was al so de te rmined for the porous granite samples.
2 Experimental details Thin sections o f granite sample approximate ly 1.4
mm thick and area 180.6 mm" were prepared for lo w frequency dielectric measurements . Silver plated brass plates were used fo r the fabri cation o f paralle l pl ate capacitor with thin sections as dielectric in spec ially des igned three-terminal sample holder. Values of die lectric constant in the frequency range 0.10- 100 kHz, were determined with an automati c Keithley LCZ meter (model 3330), by measuring
capacitance and di ss ipation factor o f the parall e l plate capacitor simultaneousl y, with sample as the di e lectric.
For mi crowave dielectric measurements X-band waveguide dimensions (0.9/1 x 0.4/1) sections of two
diffe rent thickness (== 1.4 cm and 0.8 cm) of each granite sa mple were prepared . The measure ments of
£' and £" at 10. 1 GHz were made using a shortc ircuited slotted wave-g uide tec hnique described e lsewhere25
.27
. The sample length variati on method was used fo r the measurement of the shi ft in min imum and VSWR with and without sampl e using shorted sa mple ho lder. Each prepared sectio n of the g ranite samples were full y dried for die lectri c measure ment of dry sampl es . Fo r the mi crowave d ie lectri c study of water-saturated samples, the same samples were saturated with de io ni zed water. The surface water mo lecules of wate r- saturated samples were removed using ti ssue paper before measurements . All measure ments were made at room
temperature (== 27°C) .
3 Results and discussion
3.1 Low frequency dielectl'ic dispersion Dielectric di spersion or the real part of the
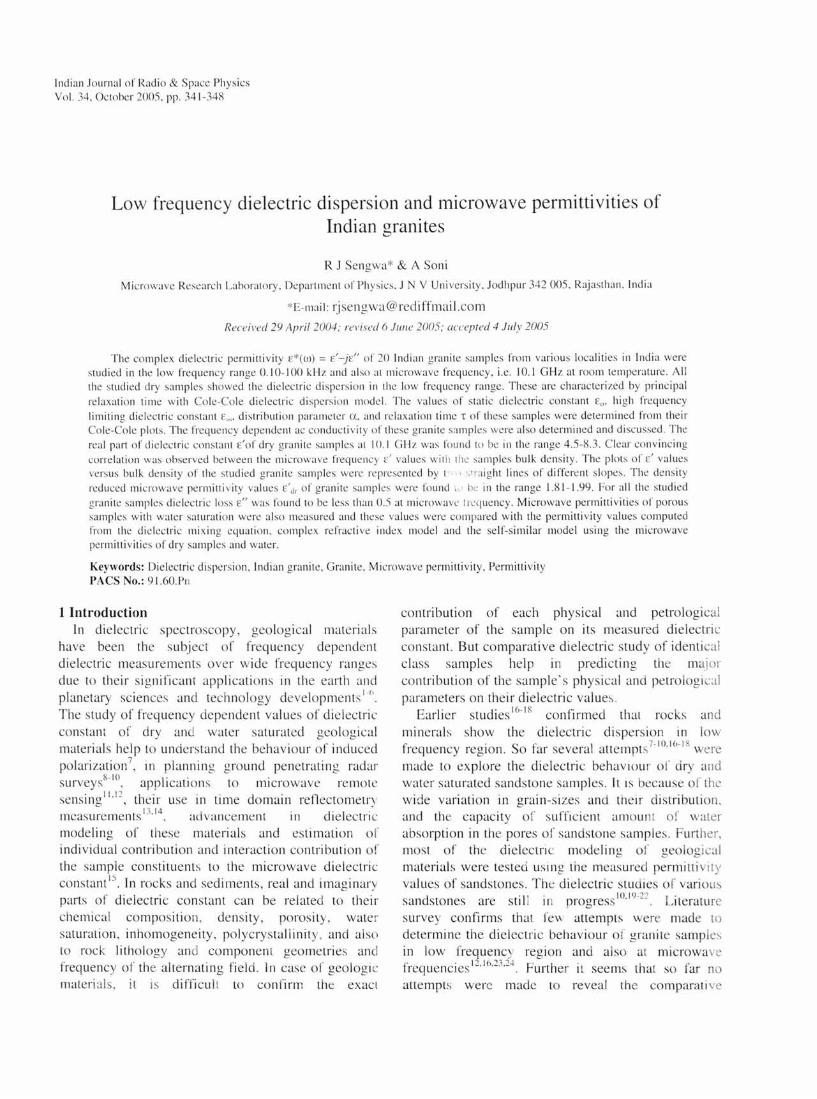
dielectric constant £' of 20 dry granite samples s tudi ed in the frequency range 0.10-100 kHz is depicted in
Fi g . I. It is found that the £' values decrease with increase 111 frequency , which is a common
Table I- Values of En. E~. L'.E, a ancl T of various clry granite samples obtain from cole-cole plots
Samples Location d En E~ L'.E a " No. (g/cc) (ms)
Lawari -Boruncla (Raj .) 2.59 73 .5 10.0 63.5 0.55 1.34 2 Chokari-Pipar (Raj .) 2.59 72.5 10.3 62.2 0.55 5.73 3 Panna (MP) 2.58 64.0 9.6 54.4 0.59 4.94 4 Baharampur (Ori ssa) 2.58 51.5 9.3 42.2 0.49 4.86 5 Baharampur (Ori ssa) 2.77 156.0 9.5 146.5 0.41 0.71 6 Lakha- Barmcr (Raj. ) 2.54 122.0 6.5 115.5 0.68 1.32 7 Sawai Madhopur (Raj. ) 2.58 120.0 8.0 11 2.0 0.54 2.42 8 Abu Road (Raj .) 2.83 97.5 11.0 86.5 0.69 3.76 9 Mokal sar (Raj .) 2.68 73 .0 9.0 64.0 0.68 1.70 10 Sil verline-l a lore (Raj .) 2.60 74.5 8.5 66.0 0.51 3.89 II Shi vganj (Raj. ) 2.56 72.0 9.5 62.5 0.57 6. 10 12 Khejarala (Raj.) 2.59 89.0 7.5 8 1.5 0.6 1 11 .99 13 Sindri -lalore (Raj .) 2.49 51.5 9.3 42.2 0.59 9.24 14 Chima Pink Jalore (Raj. ) 2.52 26.0 8.5 17.5 0.66 1.29 15 South Red (KT) 2.60 27.4 8.2 19.2 0.62 561 16 Khaill um (AP) 3.05 95.5 16.5 79.0 0.54 4.28 17 aclol (Raj .) 2.59 92.5 9.0 83.5 OA7 2.80 18 Raniwara (Raj.) 2.62 91.0 10.5 80.5 0.60 )).48
19 Warngal (AP) 3.08 59.4 I J.b 47.S 0.58 2.4 1 ?O Lalitpur-lhansi (MP) 2.55 52.2 9.0 43.2 0.64 7.22
SENGWA & SONI: DI ELECTRIC PROPERTIES OF INDIAN GRANITES 343
40
30
4
20
10
90
70 6
50 8
30 10
10
W
n 30
12
20 13
14 15
10
16 17
40
18
19 30
20
20
lO l I I I
2-0 3- 0 4-0 5-0
log f, Hz
Fig. I-Variali on of E'val ues with logIfor dry granite samples
I - - f I - I - I 7 1 7" 2X-10 C ·taractensll cs 0 geo og lca maten a s- ---- . _ I II
geological mat erial s the low freq uency dispersion is bel ieved to be due to polari zat ion assoc iated with charge build-ur at grain boundari e~ or g rai l! imperfectior. 16 Further, the contri bution 0 grain si zc~ and the ir distribution geometri e~ IS al 0 importan t
whicll control s the freq uency dependence c' values i 10 - Irequency region. Figure J show~ thai mall ) samples have ident' cal dielectn c dis e rsion. The'
different c' v~t1ues of some gran it e samples at sa e
0-7
0 -6
2 4
O-s 10 5
0-4
0 -) e 6
0 -2
10 0 -1
C en .-
o-s 12 1. 17
~" 0 -4 11
1B 20
v-3 15
0 -2 14
a-I
0·0 L-..L-___ L-__ ---1 ___ -:----'
5
log f, Hz
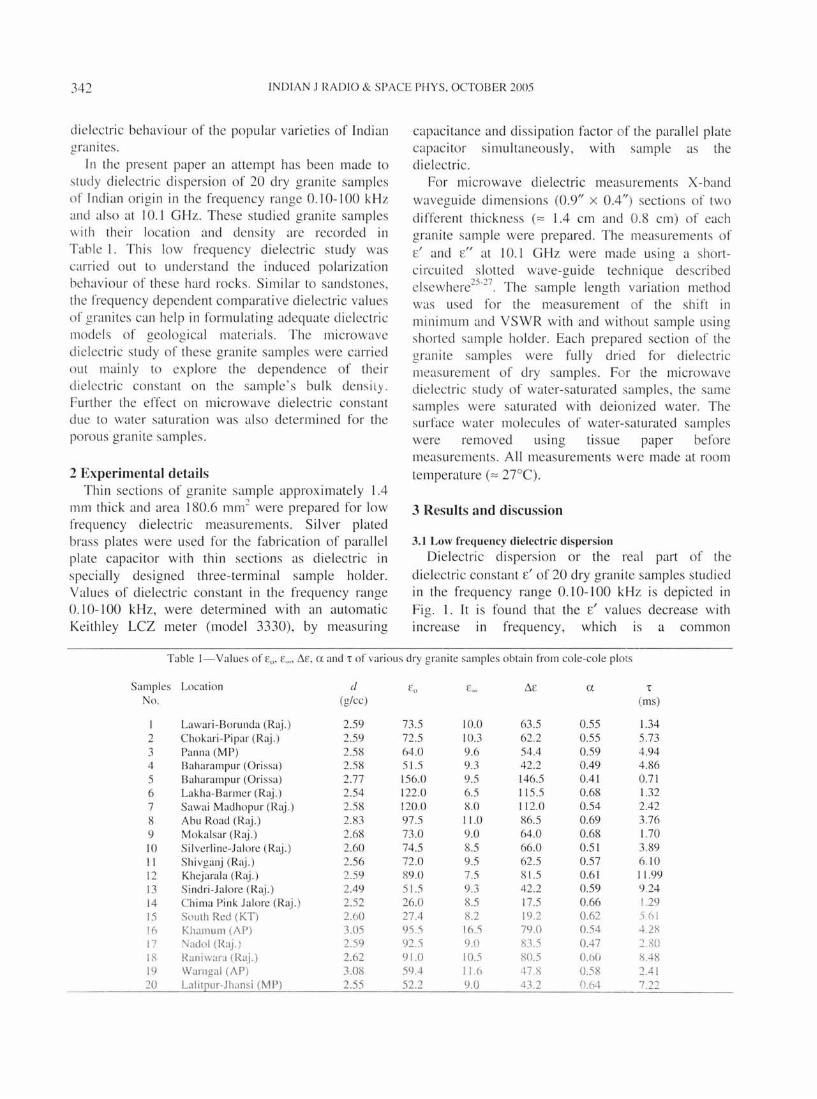
Fig_ 2-Tan 0 versus logI plots of dry grani te samples
freq uency suggest the variat io n in the polarization associated with charge build up at g rain boundaries or g ram imperfection s. which ma be due to the variation in the heterogeneous che mi cal co mposition an grain geometri es of the samples. Earl ier worke rs I2
- J(, also reported the low fre uency dielectri . dispersion of few granite samples _ <.l!I1l- man l and Strangwa/ 6 s tud ied the di electric d ispersion studies of sol id and powdered granite in th freq uency range f rom 50 Hz 10 2 MHz wil h te mperature variation and revealed low freq uency dispersion o r solid granite sampl e to be much g realer than thal or correspondi ng powder sam pie_
igure 2 shows til e vanallon " ilL s tangent (tan 8 = E"/E') values or dry grani te samples wi th log I T he Ian 8 va ri ation with fre uency Illay have bas ical ly one of the three trends: a continuous decrease iI', tan 8; a minilllum (at lower frequencies)

344 INDIAN J RADIO & SPACE PI-IYS, OCTOBER 2005
followed by a maximum (at higher frequencies); or other " intermediate" behaviour. The tan 8 versus log! plot shows that the studied granite samples follow different types of trends. The observed tan 8 va lues of dry granite samples were found to be less than 1 in the frequency range O. I 0-1 00 kH z. Tan 8 plots of few samples also show the loss peak frequency in the range 0 .10-100 kHz, but for other samples it seems that the loss peak frequency is below 100 Hz.
30 7
20
10
0
20 8
10
0
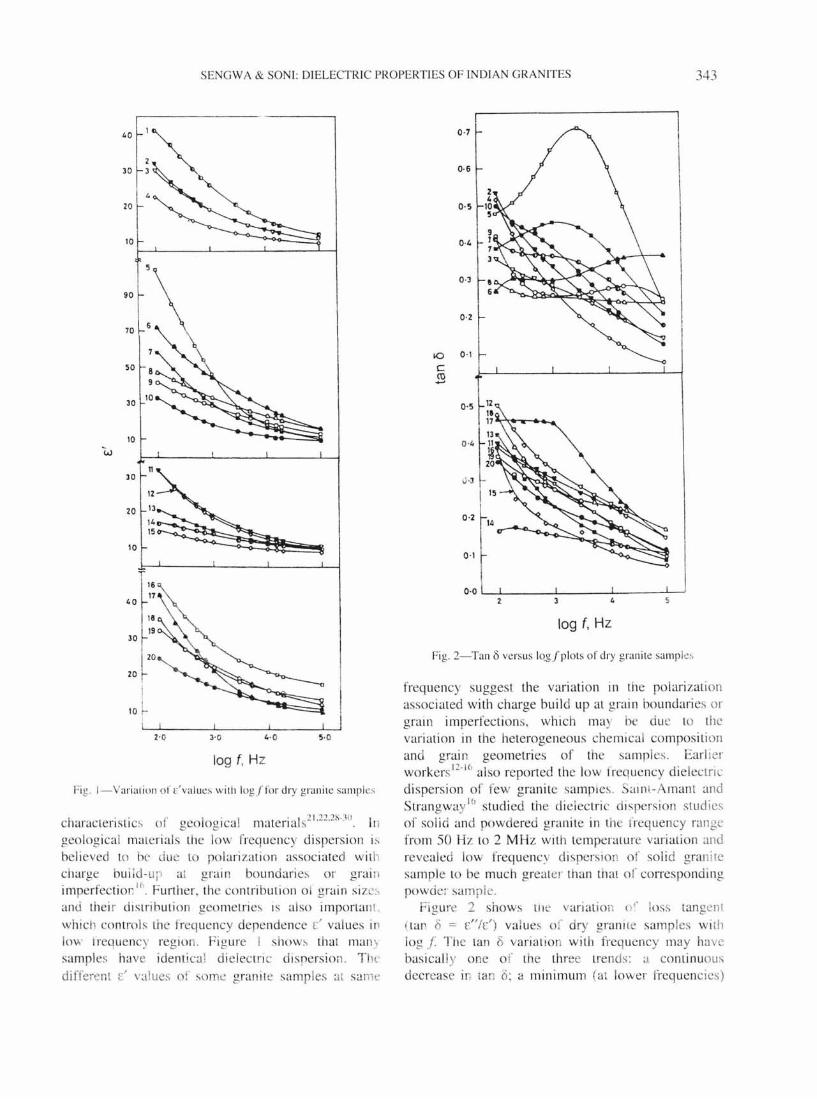
To evaluate the various dielectric parameters, the complex plane plots (Elf versus E') of these dry granite samples were plotted in Fig. 3. It is found that the granite samples faithfully obey the Co le-Cole type dielectric di spersion31
, given by
15.----------------------------~
o~----~ '1
~ 10
5
0 ~~--~--~~--~--~~--~60~~7~O
~:l I0~20 30 1,0 5 0 12 .
o ~~~--~----__1 ~90 11 0
IOf 5 /----~ O~~~~---LI---~~----L---~~--~I ,r 20 30 1,0 50 60
: t . X'"".~ 0 0 - ______
1-- Ie 22
13
14
l, 15
0~-+~----ILl,----~I8----~2~2--~~~~~~
201 0 '~ " ~~---'I :-O----: ~:}~ 20} 10' 30
0
SO 70 90
I~I'~~ io~ 30 50 70 90
16
17
110
110
12 19
o 8
. .. ( I )
20 9 l,
10 o 0
0 10 70 90 50
20 12
20 10
10
0 10 30 50 so
E'
Fig. 3-Cole-Cole plots of dry granite samples

SENGWA & SON !: DIELECTRIC PROPERTIES OF INDIAN GRAN ITES 345
where Cn is the low frequency limiting dielectric
constant, c= the high frequency limiting dielectric
constant, w the angu lar frequency, 1" the principal relaxation time of the dipole rotation in the system
and a the distribution parameter. Earlier several in vestigators' 6. ,s.2 1.22.30-32 confirmed the Cole-Cole
dielectric dispersion of dry geological materials in
low frequency range. The evalu ated va lues of co, C=, T
and a of granite samp les from their Cole-Cole plots are recorded in Table I .
The value of Co and c= were obtained by extrapolation of the Cole-Cole plots corresponding to low frequency region and hi gh freq uency region on
the real axis , respectively . The relaxati on time 1" is evaluated31 from the relation
... (2)
Here /.l and v are the distance :; from the
experimental points of Cole-Cole diagram to c= and Co
respectively on the permittivity ax is. From Eq. (2), we can write
log(vlu) = (1- a) 10g{J) + (1- a) log T . . . (3)
A plot of log (vlu) agai nst log w g ives a straight
line whose slope is (l-a) and intercept is (I-a ) log T,
from which a and 1" can be evaluated. It is fo und that
there is wide variation in the observed Co values of the dry granite samples. The dielectric relaxation strength
l'.c = Co - c= of gran ite samples was a lso determined and recorded in Table 1. All these sampk s have large
val ues of a. The finding of the non-zero ex confirms a distribution of relaxation, which is cons is tent with heterogeneous structure of gran ite s,lmp ks . The
evaluated values of T were found to be in the range
0.7-12 ms. The significant variation in tlte observed T
va lues confirms that different radius partic les contributed in the dipole rotation in diffe rent gran ite
samples . Further, the anomalous variation in T values of granite samples also suggests that these samples have different values of diffusion coefficient of their counterions in the vacancies or defects .
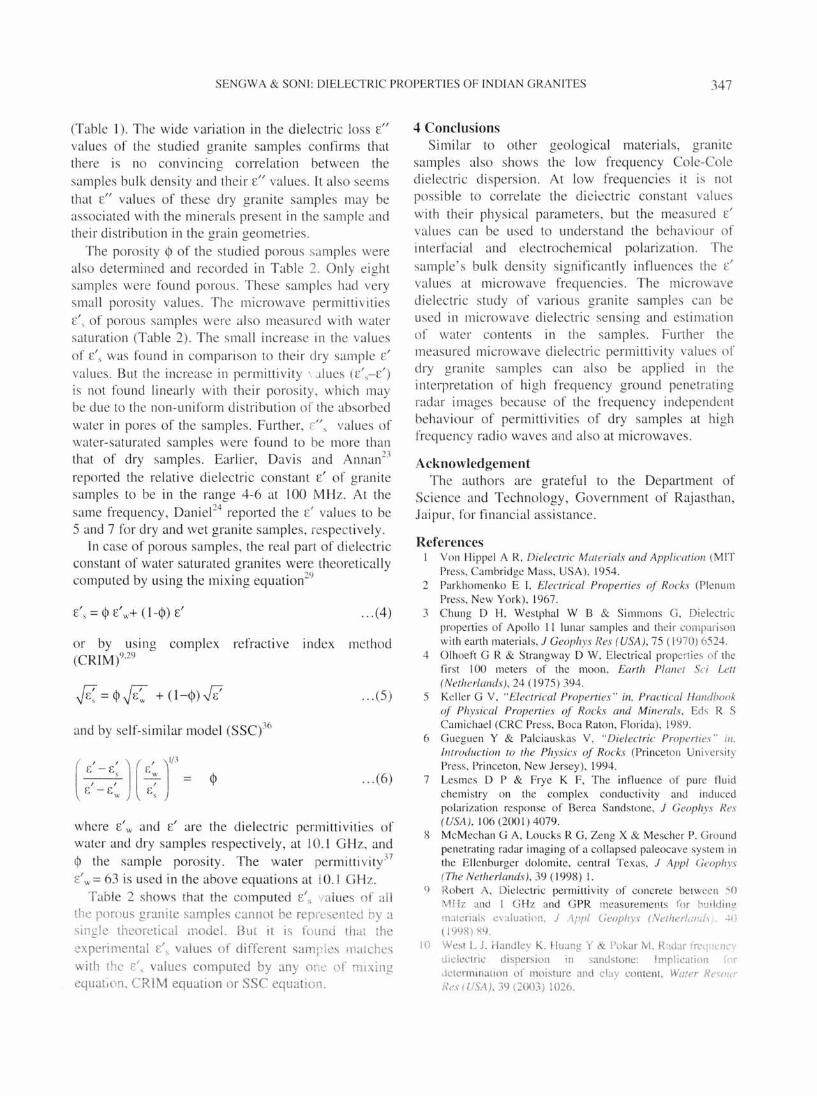
The evaluated freque ncy dependence of the real
part of ac conducti vity (0' = W Co c") of dry granite samples is shown in Fig. 4. T he linear beh aviour is ohserved etween iog 0' versus logf vaiues in the frequency range of 0.10-100 k z. he va lues of ac conductivity of all the stud ied samples i, ere,he.- -Altl! the . ncrease in frequency in the range fl. t (; x i r'; S/cm to 330.32 x 10 I) S/cm. Co mpal'ltlvciy ~mall
E u --Cf)
t)
0> 0
- 6
- 7
- 8
'- 9
-10
-10
- ·7
- 8
- 9
-10
-7
-8
-9
"
9 1 2 to to
6
~ 7 3
-10 t--'------L----.L---_-'_----l
- 7
-8
_ 9 17 16
Jl
;09 f rlz
Fig. 4--Lug () ve rsus log f iols ot dry granilC \a lllJ) I,'~

346 INDIAN] RADIO & SPACE PHYS. OCTOBER 2005
Table 2-Values of rea l pan of di electri c constant E' and loss EN of various dry and water-saturated granite samples at 10.1 GHz
Samples d Dry sample % No. (g/cc) f' Ell' E'dr <P
13 2.49 4.60 0.228 1.85 0.81 14 2.52 4.85 0.243 1.87 6 2.54 4.90 0.249 1.87 0.47 I l 2.56 4.87 0.079 1.86 0.70 4 2.58 4.87 0. 262 1.85 3 2.58 4.92 0.184 1.85 7 2.58 4.95 0.2 15 1.86 12 2.59 4.92 0.258 1.85 I 2.59 5.03 0. 185 1.87 2 2.59 5.02 0.357 1.86 15 2.60 5.03 0.245 1.86 10 2.60 5.16 0.129 1.88 0.20 9 2.68 5.37 0.3 11 1.87 0.40 5 2.77 5.61 0.522 1.86 8 2.83 6.04 0.404 1.89
20 2.55 4.53 0.233 1.8 1 0.21 17 2.59 4.65 0.089 1.81 0.62 18 2.62 5.00 0.121 1.85 0.37 16 3.05 8.08 0.235 1.98 19 3.08 8.27 0.310 1.99
anomalous vanatlOn in conductivity value of these samples were observed at fixed frequency. Figure 4 shows that some samples also have equal conductivity values .
3.2 Microwave dielectric permittivities
Earlier33.35 it confirmed that the vanatlon in £'
values of dry rocks and mineral s at microwave frequencies is mainly due to the variation in sample bulk density and also due to the change in sample
chemical composition. Further, the £' values of dry geological material s remain almost frequency independent in the microwave freq uency reg ion , and hence in the present paper the dielectric permittivities of granite samples were measured at single microwave frequency, i.e. 10.1 GHz at room temperature.
In Table 2, the studied gran ite samples were arranged in ascending order of their bul k den sity. The density variation of these samples is in the range 2.49-
3.08 g/cc. The £' val ues of thes dr' granites were fo und in the range 4.5 -8.3 at 10. 1 GHz. T he c:' values were plotted against sample ' s bulk density in Fig. 5. From Fig. 5 it is clear that £' values o f granite samples studied, increases with the increase in sample bulk densi ty. A straight line having slope 4 repre~ents the variati on of c:' with bulk density of . am pies I-IS. whereas samples 16-20 are denoted by another straight line having slope 8. To see the effect or
Water-saturated samples t's
c's £" , £'s -E' Mixing CRJM sse eq uati on Model Model
4.99 0337 0.39 5.07 4.80 4.80
5.05 0.285 0.15 5.1 7 5.U2 5.02 5. 14 0.17 1 0.27 5.28 5.05 5.05
5.29 0.243 0.1 3 5.28 5.2 1 5.21 5.60 0.481 0.23 5.60 5.48 5.47
5.03 0.336 0.50 4.65 4.58 4.58 4.72 0.372 0.07 5.01 4.1\1 4.80 5.54 0.556 0.54 5.21 5.09 5.09
9·0 r, -------------------,
I
" r 19
16
7-0~ w I
" I 5·0 r 4·0 1 ..... __ -'--_--I.' __ --,I'--_.....J....I __ -"--_--L,~
2·5 2· 6 z.7 2·8 2' 9 J·o
BULK DENSITY, glee
Pig. 5-Plots of E' versus bul k density for various granite samples
heterogeneous composItion of samples on thei r (" values, the densi ty reduced permittivities E' dr = (E,) I/"
of these samples were determined . These values are
recorded in Table 2 . The £'d' val ues 0 dry granite amples were fo und to be in the range 1.81 - 1.99. The
observe variation in density reduced permittiv ity
lE'",) values of the g ran ites con fi rm that the heterogeneous composition of the samples also contri buted to their microwave permitt ivity values.
TabJe 2 shows that the , I values of all these dry granite samples at microwave: frequency are smaller
I: an t Ie c:~ v:liue determined from Cok-CoJe plots
SENGWA & SONI: DIELECTRI C PROPERTI ES OF INDIA N GRANITES 347
(Table I). The wide variation in the dielectri c loss £" va lues of the studied granite samples confirms that there is no convincing cOlTelation between the sampl es bulk density and their £" values. It al so seems that £" values of these dry granite samples may be associated with the minerals present in the sample and their di stribu tion in the gra in geometries .
The porosity <1> of the studied porous samples were also determined and recorded in Table 2. On ly eight sa mples were found porous. These samples had very small porosity va lues . The microwave permitti vities £'s of porous samples were also measured with water saturati on (Tab le 2). The small increase in the va lues of £' , was found in compari son to thei r dry sample £'
values. But the increase in permittivity ' J lues (£' ,-£') is not found linearly with their porosity, which may be due to the non-uniform distribution of the absorbed water in pores of the samples . Further, [ " s va lues of water-saturated samples were found to be more than that of dry samples. Earlier, Dav is and Annan:!3 reported the relative dielectric constant £' of granite samples to be in the range 4-6 at 100 MHz. At the same frequency , Daniel:!4 reported the £' values to be 5 and 7 for dry and wet granite samples, respectively.
I n case of porous samples, the real part of dielectric constant of water saturated granites were theoretically computed by using the mixing equation29
.. . (4)
or by using complex refractive index method (CRIM)9.29
R = <1>F: + O-<1»R . .. (5)
and by self-similar model (SSC)36
('-' )(')" I:: 1:: , I:: w <1> '" (6) --- --" , I:: -I:: I:: w s
where £' w and £' are the dielectric permlttl VI ties of water and dry samples respectively, at 10. 1 GHz, and <1> the sample porosity. The water permittivity-17 £' w = 63 is used in the above equations at J 0. 1 G Hz.
Table 2 shows that the computed £'s vaiues of al l the porous granite samples cannot be represented by a single theoretical model. But it is found that the experimental £', values of different samples matches with the £', values computed by anyone of mixing equation, CRIM equation or SSC equation.
4 Conclusions Simi lar to other geological material s, granite
samples also shows the low frequency Cole-Cole dielectric di spersion . At low frequencies it is not possib le to correlate the dielectric constant val ues with their phys ical parameters, but the measured £'
va lues can be used to understand the behaviour of interfacial and electrochemical polari zation. The sample' s bulk density signi fi cantly influences the £'
va lues at microwave frequencies. The microwave dielectric study of various grani te samples can be used in microwave dielectric sensi ng and estimation of water con tents in the samples. Further the measured microwave dielectric permitti vity values of dry granite samples can also be applied in the interpretation of hi gh frequency ground penetrati ng radar images because of the frequency independent behaviour of permittiviti es of dry samples at high frequency radio waves and also at microwaves.
Acknowledgement The authors are grateful to the Department of
Science and Technology , Government of Rajasthan , Jaipur, for financial ass istance.
References Von Hippel A R, Dielectric Materials and AppliclIlion (MIT Press, Ca mbridge Mass, USA), 1954.
2 Parkhomenko E I, Electrical Properties of Rocks (Plenum Press, New York). 1967 .
3 Chung D H, Westphal W B & Simmons G. Dielectric properties of Apo llo II lu nar samples and their comparison with earth material s, J C eophys Res (USA), 75 (1 970) 6524. Olhoeft G R & Strangway D W. Electrical propert ies o f' the first 100 meters of the moon. Earth Planet Sci Lell (Netherlands), 24 ( 1975) 394.
4
5
6
7
Kell er G V, " Electrical Properties" in, Practical Halldbook of Physical Properties of Rocks and Min erals , Eds R S Cami chael (CRC Press, Boca Raton, Florida). 1989. Gueguen Y & Palciauskas V. "Dielectric Properties" in. Introd1lction 10 the Physics of Rocks (Princeton University Press. Princeton, New Jersey), 1994. Lesmes D P & Frye K F, The influence of pure fluid chemi stry on the complex conductiv ity and induced po lari zation response of Berea Sandstone, J Ceophys Res (USA ), 106 (2001) 4079.
8 McM echan G A, Loucks R G, Zeng X & Mescher P. Ground penetrating radar imaging of a collapsed paleocave system in the Ellenburger dolomite. central Texas. J App/ Geophys (The Netherlands), 39 ( 1998) I.
9 Robert A, ie lec tric permiltivity of concrete between '0 Milz and I G Hz and G PR measurements for b li ldin g materials cvaluation, J App/ Geophy.l' (N('fherllln£il 4('\ l199R) IN.
10 West L J. Handley K. Huang Y & Pokar M, Radar frellllcnt:1' dielec triC dispersion in sandstone: Implication lur Jcte rminatlon of moisture and cby content, Water Rl'l'Our Res (USA) , 39 (2003) 1026.
348 INDIAN J RADIO & SPACE PHYS. OCTOB ER 2005
I I U laby F T, Moore R K & Fung A K. Microwave Relllote Sell .\'illg, AClive alld Passive, Vol III-Frolll Theory Iii
Appli(' ({(iolls (Dedham, Massachu setts), ! 986, 12 Cerve lle B & Jin-Kai X, "Diele('l ric Properrie.\' (~j' Milleml.\'
alld Rocks: Applicar io/lS 10 Microwave RelllOle Sell .\'illg "; in . At/I'all ced Milleralogv Vol. I . Eds A S Marfunin (SpringerVerlag. Berlin ), 1994.
13 Capacc ioli S, Lucchesi M. Casa lilli R, Rolla P A & Bona N. Effect of water inclusions on charge transport and Polari za ti on in porous media. I EEE 1'rrl/ls Dielecl r Elecl 111 .\'111 ( USA), 8 (200 I ) 454.
14 Ponlzovsky A A . Chudinova S M & Pachepsky Y A. Performance of TDR Ca librati on Illodels as al'fec ted by so il tex ture, J Hydrol Hes (Nelherlallds). 2 18 ( 1999) 35.
15 Sharif S. Chemica l and Mineral composition o f dust and its effect on the dielectri c constant , IEEE Trail.\' Geosci Rel/Wle Seils (USA ), 33 ( 1995) 35:\.
16 Sain t-A illant M & Strangway D W. Dielec tri c properti es of dry geo log ic material s. Geophy.\' ic.\' (USA). 35 ( 1970) 624.
17 Kni ght R J & Nur A. The dielectric constant of sandstones. 60 KH z t04 MHz. Geophv.lics (USA), 52 ( 1987) 644.
18 Dias C A, Developments in a model to describG lowfrequency electri c polari zation of rocks, Geophvsic.\' (USA), 65 (2000) 437.
19 Capaccioli S. Lucchesi M, Casa lini R, Roll P A & Bona N. !nlluence of the wettabili ty on the electri ca l response of the Illi croporous systems. J P/;y.\' D: Appl Phv.\' (UK ). 33 (2000) 1036.
20 Martinez A & Byrnes A P. M odeling dielectric-constant va lues of geolog ic Illateri als: An aid to ground-penetrating radar data co llecti on and illlerpretation, Cllrrelll Research ill Earlh Sciellce.\': Ka/lSas Geolog ical SlIrvev BIII/elill (USA) . 247 (2001)
2 1 Sengwa R J. Soni A & Ram B. Dielectric behaviour of shale and ca lcareous sandstone of Jodhpur region. Illdiall J Radio & Space Phys. 33 (2004) 329.
22 Sengwa R J & Soni A. Microll'a ve dieleclric sllIdy oj'drv (f lld Imler sai l/rarer! salllpies oj' va riol/.\' g rade lilllesllill e.\' alld s(/lIds{()lI e.\' '' ill, Topi('s ill EleCll'OlIIagllelic W(/I 'es Devices. EJTeCls alld Applicario/lS. Ed J Behari (A namayu. Ncw Delhi). 2005.
23 Davis J L & Annan A P. Ground-pcnetrating radar for high reso lution Illapping of soi l and rock stratigraphy . Geophys Prospecr (USA), 37 ( 1989) 53 1.
24 Daniels D J , SlIIjclce-pellelralillg radar~ in I EEE Radar, SOli (/ 1', Navigalioll alld A viollic.\' , Seri es 6. Eds E D R Sharman and P Bradse ll (Short Run Press, Exeter. U K). 1996.
25 Westphal W B, " Dielectric lIIeaSlirill~ lec/llliqlles" ill, Dielecrric Malerials (Ind Applicari(Jlls. Ed A R Von Hippel (Wiley . New York ), 1954.
26 Sucher M & Fox J, Handbook of Micro\l'(/\ 'e M eaSlirelll elllS, Vo l II (Polytechn ic Press of the Polytechnic Institute of Brooklyn. USA). 1963, 503.
27 Nel son S O. A system for measuring dielectric properti es at freq uencies from 8.2 to 12.4 GHz, Trans ASAE (USA), 15 (1972 ) 1094.
28 Lock ner D A & ByGrl ee J D. Complex resIstivity of confined rock, J Gl!Ophys Res (USA). 90 (1 985) 7837 .
29 Kni ghl R & Endres A . A new concept in modeling the dielec tri c response of sandstones: Defining a welled rock and bulk water systeill. Geophysics ( USA) , 55 ( 1990) 586.
30 Abdel-Aa l M M . A hmed M A & A tya L, Temperature and Frequency dependence of dielec tric constant and conducti vity o f natural Egyptian monazi te. J Phys Soc Jpll (Japan) , 65 ( 1996) 3351.
3 1 Co le K S & Co le R H, Dispersion and absorpti on in dielectrics I. Alternat ing current charucteristi cs. J Chelll Phy.\' (USA) . 9 ( 194 1) 341.
32 Taherian M R. Kenyon W E & Sa flnya K A. M easurement of dielec tric response of water-saturated rocks. Geophysic.1 (USA). 55 ( 1990) 1530.
33 Nel son S O. Lindroth D P & Blake R L. Dielectri c properti es of se lected minerals at I to 22 GHz, Geophysics (USA ). 54 ( 1989) 1344.
34 Ulaby F T, Bengal T H. Dobson M C, East J R. Garvin J B & Evans D L , Microwave dielectric properti es of dry rocks. I EEE Trans Geosci Rel/lOle Seils (USA). 28 ( 1990) 325.
35 Sengwa R J & Soni A . Microwave X-band dielectri c properti es of selec ted l imestone samples, Proc Nar Calif MicrolVaves Anlennas & Propa!;alioll, Jaipllr . (200 I ) 349.
36 Sen P N, Scala C & Cohen M H, A self-s imilar model for sedimentary rocks w ith application to the dielectri c constant of fused glass beads. Geuphysics (USA) . 46 ( 19H I ) 781.
37 Sengwa R J & Kaur K. DiGlectric dispersion studies of poly (v inyl al cohol) in aqueous so lutions. POIVIII 1111 (UK). 49 (2000) 13 14.